Embed Size (px)
Citation preview
Corporate Divestitures: Spin-Offs vs. Sell-Offs
Alexandros P. Prezas†
and
Karen Simonyan‡
Current version: December 2012
† Professor of Finance, Sawyer Business School, Suffolk University, 8 Ashburton Place, Boston, MA 02108. E-mail: [email protected]. Phone: (617) 573-8319. Fax: (617) 305-1755. ‡ Associate Professor of Finance, Sawyer Business School, Suffolk University, 8 Ashburton Place, Boston, MA 02108. E-mail: [email protected]. Phone: (617) 973-5385. Fax: (617) 305-1755.
Corporate Divestitures: Spin-Offs vs. Sell-Offs
Abstract
This paper investigates the determinants of the choice between two forms of corporate divestituresspin-offs versus sell-offs. We hypothesize that the choice is driven by the characteristics of divesting firms (their pre-divestiture market valuation relative to intrinsic value and marginal tax rates), the characteristics of assets being divested (their performance under parent firm’s management relative to their full potential), and by the prevailing market conditions at the time of divestiture (such as the degree of investor optimism or pessimism). Our hypotheses generate testable predictions regarding the announcement effects of divestitures and the post-divestiture operating and stock return performance of divesting firms. Our empirical findings using a sample of 322 spin-offs and 3,280 sell-offs from 1980 to 2006 are as follows. First, firms with lower market valuations relative to their intrinsic value and higher marginal tax rates are more likely to spin off their assets. Second, assets which underperform relative to their full potential are more likely to be sold off. Third, spin-offs are more likely during periods of investor optimism. Fourth, spin-offs are associated with more positive announcement effects than sell-offs. Finally, firms which sell off their assets exhibit a greater improvement in their post-divesture long-term operating and stock return performance compared to those that spin off their assets. Keywords: Corporate Divestitures, Spin-Offs, Asset Sell-Offs, Corporate Restructuring
1
Corporate Divestitures: Spin-Offs vs. Sell-Offs
1. Introduction
When a firm decides to divest an asset, it may totally relinquish its ownership or retain a partial
ownership. In the former case, a firm may choose to divest an asset either through a spin-off or a sell-off.
Although the existing literature provides significant insights regarding the reasons why firms choose spin-
offs or sell-offs, numerous questions remain regarding the factors driving the choice between spin-offs
and sell-offs and on possible differences between these two forms of divestitures.1 Does pre-divestiture
market valuation of divesting firms affect their choice between spin-offs and sell-offs? Do firms divesting
through spin-offs realize greater improvements in their post-divestiture performance compared to those
divesting through sell-offs? Do market conditions at the time of divestiture affect a firm’s choice of
divestiture form? Why the announcement effects of spin-offs are in general larger than those of sell-offs?
We study the above questions which were not addressed in prior literature by implementing a
comprehensive study of the effects of divesting firm characteristics, the characteristics of assets being
divested, and the market conditions at the time of divestiture on the choice between spin-offs and sell-
offs. We develop several testable hypotheses which allow us for the first time in the literature to
empirically examine the effect of divesting firms’ pre-divestiture under- or overvaluation on their choice
between spin-offs and sell-offs and to study the differences between post-divestiture long-term operating
and stock return performance of such firms.2 Our testable hypotheses also allow us to empirically
examine how investor sentiment at the time of divestiture affects the decision by a firm to spin off or to 1 Prior literature has demonstrated that firms sell off their assets to increase focus (John and Ofek, 1995 and Dittmar and Shivdasani, 2003), to obtain cheap financing (Lang, Poulsen, and Stulz, 1995), or because they are a poor fit (Hite, Owers, and Rogers, 1987), and have low productivity (Maksimovic and Phillips, 2001). Prior literature has also demonstrated that firms spin off their assets to relax regulatory and tax constraints and increase managerial efficiency (Schipper and Smith, 1983), to allow parent firm and spun-off unit to specialize in areas they have a comparative advantage as well as to facilitate future mergers (Hite and Owers, 1983 and Cusatis, Miles, and Woolridge, 1993), to cater to different clienteles who may wish to invest either in spun-off unit or in parent firm (Vijh, 1994), to mitigate information asymmetry (Krishnaswami and Subramaniam, 1999 and Gilson, Healy, Noe, and Palepu, 2001), to increase focus (Daley, Mehrotra, and Sivakumar, 1997 and Desai and Jain, 1999), to improve the allocation of capital (Gertner, Powers, and Scharfstein, 2002), or to transfer wealth from bondholders to shareholders (Parrino, 1997 and Maxwell and Rao, 2003). 2 Several papers mentioned above investigate the post-divestiture performance of firms which either spin off or sell off assets. However, to the best of our knowledge, there are no studies directly comparing the post-divestiture performance of such firms.
2
sell off its assets and to identify the factors behind the differences in the announcement effects of spin-
offs and sell-offs.
Although suitable for direct comparison in the sense that both spin-offs and sell-offs allow a firm
to fully release ownership and control of its assets, these two forms of corporate divestitures are quite
different from each other. In a spin-off a certain asset (a unit, division, or subsidiary) of a firm is split off
from the parent firm into a separate publicly traded company. Shares of this new independent firm are
distributed to the existing shareholders of the parent firm on a pro rata basis.3 Usually, a spin-off has no
tax consequences for the divesting firm which treats the newly created shares as a stock dividend to its
existing shareholders. On the other hand, in a sell-off a certain asset of the divesting firm is sold off for
cash or securities to another firm or entity. Sale proceeds are taxable to the parent firm which may use
them for other corporate purposes or distribute to its shareholders.
The existing literature has identified several factors affecting the choice between spin-offs and
sell-offs. Khan and Mehta (1996) show that the likelihood of spin-offs (relative to sell-offs) increases with
the operating risk of the assets being divested. In Maydew, Schipper, and Vincent (1999) the likelihood of
sell-offs decreases as the incremental net tax cost of choosing a sell-off instead of a spin-off increases.4
Nixon, Roenfeldt, and Sicherman (2000) find that firms which have smaller boards of directors and
separate offices for CEOs and those that are not financially distressed are more likely to divest larger
units through spin-offs. Powers (2001) shows that firms in need of cash are likely to sell off badly-
performing divisions, while firms which do not need cash are likely to spin off average-performing
divisions. Chen and Guo (2005) find that firms with low revenue growth and low book-to-market ratios
are more likely to spin-off larger units during periods of low investor sentiment, while firms with high
capital expenditures, high book-to-market ratios, and lower dividend yields are more likely to sell off
3 This is substantially different from a carve-out where the parent firm retains the majority of the shares in the new company and sells the rest in a public offering. 4 For sell-offs the net tax cost is defined as the difference between the direct tax cost (or benefit) incurred from a sell-off minus the estimated premium that the sold-off asset receives over its pre-sale value. For spin-offs the net tax cost is defined as the difference between the tax cost (benefit) the parent firm avoids (gives up) by choosing a non-taxable spin-off instead of a taxable sell-off minis the premium the spun-off asset would have commanded if it was sold off instead.
3
smaller units. Finally, Bergh, Johnson, and Dewitt (2008) demonstrate that less diversified firms are more
likely to spin off assets in their primary and related business lines, while more diversified firms are more
likely to sell off assets in secondary and unrelated business lines.
This paper makes several contributions to the existing literature on divesting firm’s choice
between spin-offs and sell-offs. First, we consider the effect of a firm’s pre-divestiture under- or
overvaluation relative to its intrinsic value on its decision to spin off or sell off its assets; this effect has
not been studied before in the literature.5 Specifically, we hypothesize that overvalued firms will be more
likely to sell-off their assets to lock in higher market valuations, while undervalued firms will be more
likely to spin-off their assets. We design several proxies that capture divesting firms’ equity under- or
overvaluation by comparing their intrinsic value estimates to their pre-divestiture market values. Our
empirical findings indicate that firms which are undervalued (overvalued) relative to their intrinsic value
are more likely to spin off (sell off) their assets and that the pre-divestiture market valuation (relative to
intrinsic value) of firms which sell off assets is significantly greater than that of firms which spin off
assets.
Another contribution of this paper to the literature is our analysis of the differences in the post-
divestiture operating and stock return performance of firms which use either spin-offs or sell-offs to
divest their assets. Existing literature has studied the post-divestiture performance of firms which either
spin off or sell off their assets, but not both.6 We hypothesize that firms are more likely to sell off assets
which underperform relative to their full potential and to spin off assets with better performance closer to
their full potential. This is because the after-tax proceeds from the sell-off of underperforming assets are 5 Krishnaswami and Subramaniam (1999) conjecture that spin-offs reduce the degree of information asymmetry faced by divesting firms and, therefore, firms which are undervalued due to information asymmetry are expected to experience positive announcement effects when they divest through spin-offs. Their empirical results provide support for this conjecture. However, since they do not explicitly measure undervaluation, they do not establish its direct link with a divesting firm’s decision to spin off its assets. In this paper, we consider the effect of not only undervaluation but also the effect of overvaluation on the firm’s choice of divestiture type, and directly measure the degree of pre-divesture under- or overvaluation (relative to intrinsic value) and use it to infer the firm’s divestiture choice. 6 Woo, Willard, and Daellenbach (1992) and Daley, Mehrotra, and Sivakumar (1997) find firms divesting through spin-offs realize improved operating performance. John and Ofek (1995) find improved performance for firms divesting through focus-increasing sell-offs. Cusatis, Miles, and Woolridge (1993) find firms divesting through spin-offs experience positive post-divestiture long-term excess stock returns.
4
likely to be higher (assuming that the competition among potential asset buyers will allow the parent firm
to sell off its assets at the highest value reflecting their full potential) than the value commanded by the
same underperforming assets in the market if spun off (which is likely to be the same as their low pre-
divestiture value). On the other hand, the assets which perform relatively better are likely to command a
higher value in the market if spun off (which is likely to be the same as their relatively higher pre-
divestiture value) compared to the after-tax proceeds these assets would generate if sold off. Thus, the
firms which sell off their underperforming assets are likely to realize greater improvements in their post-
divestiture long-term operating performance compared to the firms which spin off their better performing
assets. As long-term operating and stock return performance generally move in tandem, firms which
divest through sell-offs are likely to realize greater improvements in their post-divestiture long-term stock
return performance as well compared to the firms which divest through spin-offs. Our empirical results
provide support for these hypotheses and indicate that the firms which divest their assets through a sell-
off realize significantly larger improvements in their long-term post-divestiture operating and stock return
performance compared to the firms which divest their assets through a spin-off.
We also study the announcement effects of spin-offs and sell-offs, which we expect to be
influenced by the two effects discussed above.7 First, we hypothesize that if spin-offs signal divesting
firms’ undervaluation and sell-offs signal divesting firms’ overvaluation, all else the same, the
announcement effects of spin-offs will be positive and those of sell-offs will be negative. Second, if firms
divesting through sell-offs are expected to realize a greater value from the sale of their assets compared to
their pre-divestiture value, the announcement effects of sell-offs will be positive; on the other hand, if the
assets divested through spin-offs are expected to command the same value after divestiture as before
7 Prior literature has found positive announcement period returns for both spin-offs and sell-offs. See, e.g., Alexander, Benson, and Kampmeyer (1984), Jain (1985), Hite, Owers, and Rogers (1987), and Lang, Poulsen, and Stulz (1995) for the announcement effects of sell-offs, and Hite and Owers (1983), Miles and Rosenfeld (1983), Schipper and Smith (1983), Vijh (1994), and Krishnaswami and Subramanian (1999) for the announcement effects of spin-offs. However, the only paper which directly compares the announcement effects of spin-offs and sell-offs is Rosenfeld (1984), who uses a small sample of spin-offs and sell-offs to show that the announcement effects of spin-offs are significantly larger than those of sell-offs. Rosenfeld (1984), however, does not provide an explanation for the documented differences in the announcement effects between the two divestiture forms.
5
divestiture, the announcement effects of spin-offs will be close to zero. These two conjectures, if
combined together, predict that the announcements effects of spin-offs will be positive, while the
announcement effects of sell-offs will be either positive or negative depending on which of the above two
effects dominates.
We find that the announcement effects of both spin-offs and sell-offs are significantly positive
and those of spin-offs are significantly larger than those of sell-offs. These findings are in line with
Rosenfeld (1984) and point to their robustness over time while using a larger sample.8 Unlike Rosenfeld
(1984) however, this paper provides an intuitive explanation for the documented differences in the
announcements effects of spin-offs and sell-offs. Specifically, the higher positive announcement effects
that spin-offs enjoy over sell-offs appear to be driven by the undervaluation of spin-off parent firms and
the overvaluation of sell-off parents firms. Also, the positive announcement effects of sell-offs alone seem
to suggest that the value realized from the sale of underperforming assets outweighs the loss realized from
the signaling of divesting firm’s overvaluation to the market.
Since the tax treatment of sell-offs is quite different from that of spin-offs, we also examine the
effect that divesting firms’ marginal tax rates have on their choice between spin-offs and sell-offs. Unlike
spin-offs which are predominantly non-taxable transactions, sell-offs can potentially generate sizable tax
obligations (if the proceeds from asset sales are greater than their tax basis). Therefore, firms with higher
marginal tax rates will be more likely to divest their assets through a spin-off to avoid the potential tax
consequences of a sell-off. Our empirical findings indicate that firms with higher marginal tax rates are
more likely to spin off their assets and firms with lower marginal tax rates are more likely to sell off their
assets.
Finally, we also investigate the effect of investor sentiment on the choice between spin-offs and
sell-offs. Our inquiry is prompted by a similarity between spin-offs and IPOs in the sense that a new firm
is created in both cases which starts trading publicly for the first time. Similar to the effect that investor
8 There is only a two year overlap between Rosenfeld’s (1984) sample of 35 spin-offs and 62 sell-offs in 1963-1981 and our sample of 322 spin-offs and 3,280 sell-offs in 1980-2006.
6
sentiment has on “hot” and “cold” IPO market waves (Lowry, 2003 and Helwege and Liang, 2004) we
hypothesize that investors in the market are more likely to value the shares of new firms higher when they
are relatively optimistic, which creates an incentive for divesting firms to spin off their assets during
periods of investor optimism. We create a monthly index of investor sentiment after Baker and Wurgler
(2006) which captures intra-year variations in sentiment and find that spin-offs are more likely during
periods when this index is relatively high (investors are optimistic) and sell-offs are more likely during
periods when this index is relatively low (investors are pessimistic).
Our analysis in this paper shows that the choice between spin-offs and sell-offs is driven by
several factors such as the characteristics of divesting firms (pre-divestiture market valuation and
marginal tax rates), the characteristics of assets being divested (how well they perform), and by the
prevailing market conditions at the time of divestiture (proxied by investor sentiment). The results of our
multivariate logit regressions indicate that all these factors have a significant impact on the choice
between spin-offs and sell-offs even after controlling for other important variables such the extent of
information asymmetry and the degree of financial constraints faced by divesting firms, and the size of
divesting firms and divested units.
The rest of this paper is organized as follows. Section 2 discusses our theoretical arguments and
develops testable hypotheses. Section 3 describes data. Section 4 presents our research methodology and
the results of our empirical tests. Section 5 concludes.
2. Hypotheses
As indicated in the previous section, a large body of the existing literature explains the reasons
for which firms engage in divestitures. The objective of this paper is to explain the choice between the
two major forms of divestitures, spin-offs and sell-offs, taking the firm’s decision to divest as given. We
hypothesize that the choice between spin-offs and sell-offs will be driven by the characteristics of
divesting firms (such as their pre-divestiture valuation in the market relative to their intrinsic value and
their marginal tax rates), by the characteristics of the assets being divested (such as their current
7
performance relative to their full potential), and by the prevailing market conditions at the time when the
decision to divest is made (such as the degree of investor optimism or pessimism).
First we consider how divesting firm’s valuation in the market relative to its intrinsic value
affects its choice between spin-offs and sell-offs. Consider a firm which possesses information superior to
outsiders about its future earnings and cash flows (and therefore about the intrinsic value of its equity).
Let’s assume no taxes and that the firm’s (including the assets it considers divesting) productivity is at its
full potential. If the firm is undervalued in the market (and assuming the market, on average, extends this
undervaluation to the assets it tries to divest) it will have an incentive to divest its assets through a spin-
off. This is because selling the assets at their current market value will generate proceeds which will be
less than the intrinsic value of such assets. However, if such undervalued assets are spun off, their market
value will be expected to increase over time as the favorable information about the firm (and its divested
assets) is eventually revealed to the market. On the other hand, if the firm is overvalued in the market
(and assuming the market, on average, extends this overvaluation to the assets it tries to divest) it will
have an incentive to divest its assets through a sell-off since the proceeds from the sell-off will be larger
than the intrinsic value of such assets. Alternatively, if such overvalued assets are spun off, their market
value will be expected to decrease in the near future as the unfavorable information about the firm (and its
divested assets) is revealed to the market over time. Further, the decision of the firm to divest its assets
through a spin-off or a sell-off will be perceived by the market as a signal of the firm’s under- or
overvaluation relative to its intrinsic value, respectively, and therefore the announcements of spin-offs
will be associated with positive announcement effects and the announcements of sell-offs will be
associated with negative announcement effects. The above discussion generates the following two
hypotheses:
H1. Firms which are undervalued (overvalued) in the market relative to their intrinsic value will
be more likely to divest their assets through a spin-off (sell-off).
H2. Firms which divest their assets through a spin-off (sell-off) will be more likely to realize
positive (negative) announcement effects in the equity market.

8
A divesting firm’s marginal tax rate may also affect its choice between spin-offs and sell-offs. A
spin-off is usually structured as a tax-free transaction for the parent firm which treats it as a stock
dividend and realizes no taxable gain or loss.9 The transaction is tax-deferred for the parent firm’s
shareholders and the spun-off unit carries the book value reported in the financial statements prior to the
divestiture. Cleary, tax-free spin-offs result in considerable tax savings for parent firms and the higher
their marginal tax rate the greater the incentive to spin off rather than to sell off. On the other hand, sell-
offs as a rule are taxable transactions where parent firms usually receive cash and/or securities for the
divested asset. Depending on whether the divested asset is a part of the parent firm (such as a division) or
a separate legal entity (such as a subsidiary), the parent firm either sells the assets of the division directly
or sells the stock of the subsidiary. In both cases, the parent firm realizes a taxable gain if the proceeds
from the sale are greater than the tax basis of the division or the subsidiary’s stock. The higher the
marginal tax rate of the parent firm, the greater the tax liability generated by the transaction, and thus the
slighter the incentive to sell.10 Although sell-offs potentially generate substantial tax liability, firms may
still choose to divest their assets through a sell-off for several reasons such as larger proceeds compared
to spin-off value, financial reporting benefits, and improved liquidity for the parent firm (see, e.g.,
Maydew, Schipper, and Vincent, 1999). The above discussion leads to our next hypothesis:
H3. Firms with higher marginal tax rates will be more likely to divest their assets through a spin-
off rather than a sell-off.
9 To avoid taxable consequences, a spin-off must be structured to satisfy the conditions specified in section 355 of the IRS code. Namely, parent firm must own at least 80% of the asset prior to its divestiture and must distribute at least 80% of the interest in the divested asset to its shareholders. Further, the transaction must have a substantial business purpose, it may not be used as a vehicle to avoid taxation, shareholders of the parent firm must continue holding a significant interest both in the parent firm and the spun-off unit after the divestiture, and immediately after the spin-off both the parent firm and the spun-off unit must continue actively conducting the business in which they were engaged for at least five years prior to the divestiture. If these conditions are not met, the parent firm can be liable for the taxes on the taxable gains generated by the divestiture. 10 Of course, if the proceeds from the sale are less than the tax basis, the parent firm will realize a taxable loss and will be entitled to a tax refund. While taxable gains are fully taxable, the tax code imposes certain restrictions on the recognition of taxable losses; for example, capital losses are tax-deductible only to the extent of capital gains. If such capital gains are not available, capital losses realized by the parent firm on the sale of its subsidiary’s stock may not result in tax benefits.
9
Next we consider how the characteristics of the assets being divested, namely their performance
level, may affect the choice between spin-offs and sell-offs. Consider a firm which in addition to its core
business owns two subsidiaries A and B, which are not directly related to its core business. Assume that
the firm and its subsidiaries are correctly valued by the market at their intrinsic value. Both subsidiaries
have a maximum potential value of V, however due to various reasons (for example, the lack of parent
firm management’s expertise running these units) the firm is unable to realize this full value. In other
words, under parent firm’s management these two units generate less earnings per dollar of assets
employed compared to what these assets are capable of generating under optimal management. Further,
let’s assume that subsidiary A has better performance (generates more earnings per dollar of assets
employed) than subsidiary B. Therefore, if retained by the firm, subsidiary A will have a value of VA ≤ V
and, ceteris paribus, subsidiary B will have a value of VB < VA ≤ V. The firm considers divesting both
subsidiaries and has to decide on the form of the divestitureeither a sell-off or a spin-off.
The sale of either unit is expected to redeploy them in the hands of new owners who will extract
the full value V from such subsidiaries. The competition among potential buyers ensures that the
subsidiaries are acquired by the buyers who are in the position to realize their full potential and who will
outbid other competitors by offering the highest price V for these subsidiaries.11 The firm will realize an
after-tax value of V(1 – T) from the sale of either subsidiary.12 Alternatively, spinning off either
subsidiary does not change their ownership; existing owners of the parent firm still own these
subsidiaries. Since the management of spun-off units does not usually change, both subsidiaries are
expected to maintain their pre-divestiture values of VA and VB, respectively, following their spin-off.
It then follows that there are three scenarios regarding the ordering of the possible post-
divestiture values of the two subsidiaries. In the first scenario, VB < VA < V(1 – T) ≤ V. Since the after-tax 11 Hite, Owers, and Rogers (1987), Sicherman and Pettway (1992), and John and Ofek (1995) show that the average abnormal returns to equity over the two-day [-1 to 0] window around the announcements of asset sell-offs are between 0.40 to 0.83% for asset buyers and between 0.92 to 1.66% for asset sellers. This suggests that most of the benefits of asset sell-offs are captured by the sellers and the buyers pay a price for such assets close to their full potential value. 12 For simplicity, we assume here that the tax basis of both subsidiaries is zero. Our conclusions will be the same as above if we assume the tax basis is non-zero.
10
value from the sale of either subsidiary exceeds their respective values after the spin-off, the firm
optimally chooses to sell both A and B. In the second scenario, V(1 – T) < VB < VA ≤ V. Now the spin-off
values of both subsidiaries exceed their after-tax sale value and the firm selects to spin off both A and B.
In the final scenario, VB < V(1 – T) < VA ≤ V. In this case the parent firm is inclined to sell off the
relatively underperforming subsidiary B and to spin off the relatively better-performing subsidiary A
because the sell-off value V(1 – T) is greater than the spin-off value VB of subsidiary B but it is less than
the spin-off value VA of subsidiary A.
The discussion above has two connotations. The first implication is that a firm is more likely to
sell off its relatively underperforming assets and spin off its relatively better-performing assets. If this is
the case, the operating performance of the divesting firm is expected to improve significantly relative to
its pre-divestiture performance since the firm rids itself of a relatively underperforming asset. In other
words, following the sell-off the remaining assets of the firm will, on average, generate greater earnings
per dollar of assets employed. On the other hand, a spin-off is expected to result in a less notable (if any at
all) improvement in the post-divestiture operating performance of the parent firm relative to its pre-
divestiture performance since the firm divests a relatively better-performing asset. This generates our next
hypothesis:
H4. Firms which divest their assets through a sell-off are likely to realize greater improvement in
their post-divesture operating performance compared to firms which spin off their assets.
The second implication is that when selling a subsidiary parent firm shareholders will realize a
premium equal to the difference between the after-tax sell-off proceeds and the pre-divestiture value of
that subsidiary. On the other hand, when spinning off a subsidiary parent firm shareholders realize no
additional value since the post- and pre-divestiture values of the subsidiary are expected to be the same.
This suggests that, in general, sell-offs will be associated with positive announcement effects reflecting
the premium that parent firm shareholders expect to realize from the sell-off, while spin-offs will be
associated with no announcement effects. This leads to our fifth hypothesis:
11
H5. Firms which divest their assets through a sell-off are more likely to realize positive
announcement effects while firms which divest their assets through a spin-off are more likely to realize no
announcement effects.
Note that H5 considers an announcement effect which is complementary to that in H2.
Hypothesis H5 predicts positive announcement effects for firms which sell off their assets, whereas
hypothesis H2 predicts negative announcement effects for such firms. On the other hand, hypothesis H5
predicts no announcement effects for firms which spin off their assets, while hypothesis H2 predicts
positive announcement effects for such firms.13 If both hypotheses H2 and H5 are jointly correct, the
announcement effects of spin-offs will be expected to be unequivocally positive, whereas the
announcement effects of sell-offs will be either positive or negative, depending on the relative magnitude
of the overvaluation effect versus the effect of divesting underperforming assets.
Since long-term stock returns generally move hand-in-hand with operating performance, the
above analysis also implies that firms which divest their assets through a sell-off will, on average,
experience a greater improvement in their post-divestiture stock return performance compared to those
which divest their assets through a spin-off. This is our sixth hypothesis:
H6. Firms which divest their assets through a sell-off are likely to realize greater improvement in
their post-divesture stock return performance compared to firms which spin off their assets.
Finally, we consider how market conditions at the time of divestiture affect the choice between
spin-offs and sell-offs. Spin-offs are similar to IPOs in the sense that a new independent firm is
established which starts trading publicly for the first time. It is well documented in the literature that firms
go public in waves labeled as “hot” and “cold” IPO markets (see, e.g., Ibbotson and Jaffe, 1975 and
Ritter, 1984). Lowry (2003) and Helwege and Liang (2004) argue that investor sentiment is one of the
drivers of such “hot” and “cold” IPO markets. When investors are optimistic (either irrationally or based
13 The announcement effects of spin-offs and sell-offs may be affected by a variety of other factors. If parent firms expect to obtain additional benefits, such as increased focus, reduced information asymmetry, etc., from such divestitures, then the announcement effects of both forms of divestitures will be augmented by the expected magnitude of such benefits.
12
on rational expectations of the market potential) they may be willing to pay for new issues more than they
are worth. This creates an incentive for divesting firms to spin off their assets during periods of investor
optimism since it can potentially increase the wealth of parent firm shareholders who own the new shares
resulting from the spin-off. If, instead, divesting firms decide to sell off their assets during a period of
investor optimism, they will be less likely to receive a higher price from potential buyers since such
buyers, being larger entities, will be in a better position to correctly value these assets (given the resources
and the expertise they possess to conduct proper valuation). On the other hand, during periods of investor
pessimism, retail investors in the market may pay less for the shares than they are worth and the firm will
be better off selling its assets to buyers who can value them more correctly, instead of spinning them off.
This leads to our final hypothesis:
H7. Firms are more likely to spin off (sell off) their assets during periods of investor optimism
(pessimism).
There are other characteristics of divesting firms and their divested assets that may drive the
choice between spin-offs and sell-offs. One of them is the degree of financial constraints faced by
divesting firms. A firm is financially constrained when it is unable to finance its investments due to the
lack of internally generated cash or inability to raise debt or equity in the financial market. One of the
differences between spin-offs and sell-offs is that sell-offs generate an inflow of cash (or securities that
can be converted to cash) for parent firms, whereas spin-offs do not. A firm which is more financially
constrained will have an incentive to divest its assets through a sell-off and use the cash proceeds to
relieve such constraints. For example, Lang, Poulsen, and Stulz (1995) provide evidence that asset sell-
offs are used to relax parent firms’ capital constrains, while Powers (2001) finds that parent firms with
high leverage are more likely to divest through sell-offs than through spin-offs. Another firm
characteristic that may potentially affect the choice between spin-offs and sell-offs is the degree of
asymmetric information faced by divesting firms in the financial market. If a firm wishes to reduce the
extent of information asymmetry it faces in the market it may choose to divest its assets through a spin-
off. This is because spin-offs are subject to disclosure requirements and parent firms are required to file
13
with regulating bodies, which releases a great deal of new information about the firm to the market. On
the other hand, sell-offs are usually not subject to disclosure requirements and many of them are
structured as private transactions with undisclosed terms. Krishnaswami and Subramaniam (1999)
suggest that the likelihood of engaging in spin-offs is higher for firms with higher levels of information
asymmetry. Finally, the size of divested assets may affect the choice between spin-offs and sell-offs.
Nixon, Roenfeldt, and Sicherman (2000) and Chen and Guo (2005), among others, provide evidence that
divesting firms are more likely to spin-off larger units. Since, these additional characteristics may be
important for the choice between spin-offs and sell-offs we control for them in our empirical analysis.
3. Data and Sample Selection
The list of sell-offs comes from the SDC/Platinum Mergers & Acquisitions database. A sell-off is
defined as a transaction where one firm acquires 100% of certain assets of another firm. Our sample
includes sell-offs, identified as “Acquisition of assets” or “Acquisition of certain assets” in the database,
completed in 1980-2006. After elimination of asset swaps, joint ventures, LBOs, block (privately
negotiated) purchases, privatizations, reverse takeovers, stake purchases, transactions where asset sellers
were either bankrupt, being liquidated, recapitalized, or restructured, and transactions where asset sellers
were not present on CRSP or Compustat, we were left with our final sample of 3,280 sell-offs.
The list of spin-offs comes from the SDC/Platinum Global New Issues database. The sample
period is 1980-2006 as well. After eliminating spin-offs for which we cannot find announcement dates
from Factiva and Bloomberg databases, we are left with 600 spin-offs. Further, we exclude from our
sample observations where parent firms are not public companies and therefore are not present either on
CRSP or Compustat. This leaves us with our final sample of 322 spin-offs. The numbers of spin-offs and
sell-offs in each year of the sample period are presented in Table 1.14
14 SDC Mergers & Acquisitions database reports only a few sell-off transactions in the early 1980s because the data coverage for those years is incomplete. As a robustness test, we conducted our empirical analysis excluding years 1980-1982 from our sample and our results were similar to those reported here.
14
Information on stock prices and returns necessary to analyze announcement effects and stock
return performance is obtained from CRSP, while the accounting information necessary to study firms’
operating performance and to calculate various financial ratios is obtained from Compustat. Asymmetric
information data is obtained from IBES.
4. Empirical Tests and Results
4.1. Summary Statistics and Univariate Tests
We present the summary statistics of divesting firm characteristics and report the results of
univariate tests of differences in their means and medians between firms divesting through spin-offs and
sell-offs in Table 2.
The mean (median) Marginal Tax Rate of firms divesting through spin-offs is 35% (35%), which
is significantly greater than the mean (median) Marginal Tax Rate of firms divesting through sell-offs of
33% (34%). Marginal Tax Rate is the non-parametric marginal tax rate developed in Blouin, Core, and
Guay (2010) and reported in Compustat. The significantly higher marginal tax rates of firms divesting
through spin-offs compared to those divesting through sell-offs provide support for our hypothesis H3.
Since we do not have any information about sold-off units and therefore cannot observe their pre-
divestiture productivity or performance, we construct the variable Relatedness to proxy for such
productivity. This variable takes values between 0 and 4, equal to the number of digit matches between
the SIC codes of the parent firm and its divested unit; a higher value of Relatedness indicates that the
parent firm and its unit are closer related. We conjecture that units with higher Relatedness values are
more productive since their parent firms’ management is expected to have more expertise managing them.
The mean (median) Relatedness of firms divesting through spin-offs is 2.05 (2) and the mean (median)
Relatedness of firms divesting through sell-offs is 1.40 (1); the differences in means and medians are
statistically significant at the 1% level. This indicates that divesting firms tend to spin off assets which are
more related to their own business (and perhaps are more productive) and sell off assets which are less
related to their business (and perhaps are less productive).
15
Next, we construct a monthly series of Investor Sentiment Index following Baker and Wurgler
(2006). The greater the value of the index the more optimistic investors are and vice versa. Since one of
the definitions of investor sentiment that Baker and Wurgler (2006) use in their work is “… optimism or
pessimism about stocks in general,” this index is a good proxy for the degree of outside investors’
optimism or pessimism regarding future economic activity, the stock market in general, and the future
stock return performance of firms.15 Their index is constructed using several proxies suggested in the
literature to measure investor sentiment; it is a composite index based on the first principal component of
those proxies. The underlying proxies of investor sentiment are closed-end fund discount, NYSE share
turnover, number of IPOs and their average first-day returns, equity share in new issues, and dividend
premium. We measure these sentiment proxies monthly over the sample period. We follow Baker and
Wurgler (2006) closely in constructing our Investor Sentiment Index which is a monthly series as opposed
to the annual series they construct.16 We have verified that our monthly series closely follows and has
properties similar to the annual series of Baker and Wurgler (2006) and has the advantage of capturing
intra-year variations in investor sentiment (which is not possible with an annual series).
In Table 2, the mean and median Investor Sentiment Index for spin-offs are significantly higher
than those for sell-offs indicating that spin-offs are conducted during periods when investors are relatively
optimistic, whereas sell-offs are implemented during periods when investors are relatively pessimistic.
This finding provides support for our hypothesis H7.17
Further, Table 2 demonstrates that firms divesting through spin-offs are significantly smaller in
size (both in terms of the book value of assets, Ln(Assets), and the market value of equity, Ln(MVE)) 15 Baker and Wurgler (2006) construct an annual series of the investor sentiment index and use it to test how subsequent stock returns vary with beginning-of-period sentiment. They show that when beginning-of-period investor sentiment is low (investors are pessimistic), subsequent returns are relatively high for small, young, high volatility, unprofitable, non-dividend-paying, extreme growth, and distressed stocks. On the other hand, when sentiment is high (investors are optimistic), these categories of stock earn relatively low subsequent returns. 16 The details of the construction of the above index and data sources are available to interested readers from the authors upon request. 17 Chen and Guo (2005), using the annual series of Baker and Wurgler’s (2006) investor sentiment index, find that spin-offs are more likely when investors are more pessimistic. Our finding here is opposite to that of Chen and Guo (2005) perhaps due to the fact that we use the monthly series of the same index instead of the annual series. Since the degree of investor sentiment can vary considerably within a given year, our monthly series captures such intra-year variations whereas the annual series does not.
16
compared to firms divesting through sell-offs. The differences in the mean and median size between the
two groups are significant at the 1% level. There is also an indication that spun-off units are somewhat
bigger than sold-off units. We measure the size of spun-off units, Ln(Unit Size), by the natural logarithm
of the number of shares outstanding multiplied by the closing share price on the first day of trading, and
we measure the size of sold-off units by the transaction value reported in SDC.18 Although both the mean
and median sizes of spun-off units are larger than those of sold-off units, the differences in the means and
medians between the two groups are not statistically significant.
The next three variables reported in Table 2 measure the degree of financial constraints faced by
divesting firms. First, firms divesting through spin-offs have significantly larger cash holdings than firms
divesting through sell-offs as measured by the ratio of cash and equivalents over assets. The mean
(median) Cash/Assets of firms divesting through spin-offs is 0.12 (0.05) compared to the 0.09 (0.04)
mean (median) Cash/Assets of firms divesting through sell-offs; the differences in the means and medians
of the two groups are significantly positive suggesting that firms divesting through spin-offs are less
financially constrained.
We also construct an index of financial constraints suggested by Kaplan and Zingales (1997)
using the modified methodology described in Lamont, Polk, and Saa-Requejo (2001). According to this
modified methodology KZ Index = -1.002(Cash Flow/K) + 0.283Q + 3.139(Debt/Total Capital) –
39.368(Dividends/K) – 1.315(Cash/K), where Cash Flow is income before extraordinary items
(Compustat item 18) plus depreciation (item 14); K is net property, plant, and equipment (item 8); Q is
the ratio of the book value of assets (item 6) plus CRSP December Market Value of Equity minus the
book value of common equity (item 60) minus deferred taxes (item 74) over the book value of assets;
Debt is the sum of long-term debt (item 9) and debt in current liabilities (item 34); Total Capital is the
sum of long-term debt, debt in current liabilities, and stockholders’ equity (item 216); Dividends is the
sum of common and preferred dividends (items 21 and 19, respectively); and Cash is cash and short-term
18 We are able to obtain transaction values from SDC for only 1,965 sold-off units in our sample. Transaction values of the remaining sold-off units in our sample were not disclosed and therefore are not available in SDC.
17
investments (item 1). Firms with higher values of KZ Index are more financially constrained. Table 2
shows that the mean KZ Index of firms divesting through spin-offs is significantly smaller than that of
firms divesting through sell-offs indicating that firms divesting through spin-offs are less financially
constrained; the difference is medians is positive but not statistically significant.
Firms divesting through spin-offs also appear to invest less as measured by the ratio of capital
expenditures and R&D expenses over assets. The median (CapEx + R&D)/Assets of firms divesting
through spin-offs is 0.069 which is significantly less than the median (CapEx + R&D)/Assets of firms
divesting through sell-offs of 0.076 at the 10% level. Since capital expenditures and R&D expenses use
firms’ financial resources, the lower investment levels of firms divesting through spin-offs further
indicate that such firms are less financially constrained.
Table 2 also shows that firms divesting through spin-offs face a significantly greater extent of
information asymmetry in the financial market compared to firms divesting through sell-offs. We use
three proxies of information asymmetry measured at the end of the fiscal year prior to divestiture
announcement: Number of Analysts following the firm; StDev of Forecasts, the standard deviation of
analyst forecasts; and Dispersion, the standard deviation of analyst forecasts normalized by the stock
price. Firms divesting through spin-offs are followed by significantly fewer financial analysts and are
associated with significantly greater StDev of Forecasts and Dispersion. The mean (median) Number of
Analysts following firms divesting through spin-offs is 8.44 (5), while it is 10.92 (9) for firms divesting
through sell-offs. The mean (median) StDev of Forecasts for firms divesting through spin-offs is 0.139
(0.060), while it is 0.094 (0.040) for firms divesting through sell-offs. The mean (median) Dispersion for
firms divesting through spin-offs is 0.009 (0.003), and it is 0.007 (0.002) for firms divesting through sell-
offs.
Finally, Table 2 shows that the operating performance of the two groups of firms in the fiscal year
prior to divestiture announcement is roughly the same; the differences in the mean and median return on
assets, ROA, are not statistically significant. Firms divesting through spin-offs have significantly higher
leverage, captured by Long-Term Debt/Assets, than firms divesting through sell-offs.
18
In sum, the results in Table 2 suggest that, compared to firms divesting through sell-offs, firms
which divest through spin-offs are smaller and less financially constrained, are subject to more
information asymmetry and higher marginal tax rates, and tend to divest more related units in periods of
investor optimism.
4.2. Pre-Divestiture Equity Valuation of Spin-Off and Sell-Off Parent Firms
In this section we study the extent of divesting firms’ equity under- or overvaluation relative to
intrinsic value, i.e., the value conditional on the private information of firm insiders. Hypothesis H1
predicts that firms announcing spin-offs are more likely to be undervalued relative to their intrinsic value
and firms announcing sell-offs are more likely to be overvalued relative to their intrinsic value.
To estimate the degree of under- or overvaluation, we make use of two methodologies. Our first
methodology is based on matched firm multiples. It uses the realized values of divesting firms’ sales,
operating income before depreciation (OIBD), earnings, and book value of equity in the fiscal year
subsequent to divestiture. If at the time of divestiture announcement firm insiders (managers) have private
information about their firm’s future cash flows, and have rational expectations (so that there is no
systematic bias in their prediction of the firm’s future cash flow stream), then the aforementioned realized
values will yield an unbiased estimate of the insiders’ valuation of the firm conditional on their private
information at the time of divestiture announcement.19
To obtain intrinsic values of divesting firms’ equity, we multiply the realized values of divesting
firms’ sales (Compustat item 12), OIBD (item 13), earnings (item 18), or book value of equity (item 60)
in the fiscal year after divestiture announcement by the price-to-sales, price-to-OIBD, price-to-earnings,
or price-to-book value ratios, respectively, of matched firms calculated using sales, OIBD, earnings, and
book value of equity of these matched firms at the end of the fiscal year prior to divestiture announcement
and their share price on the day prior to divestiture announcement. The realized values of sales, OIBD,
19 Note that our assumption is not that firm insiders can perfectly forecast the future earnings of their firm, but rather that they can make better forecasts than outsiders, and that their forecasts will not be systematically biased upwards or downwards.
19
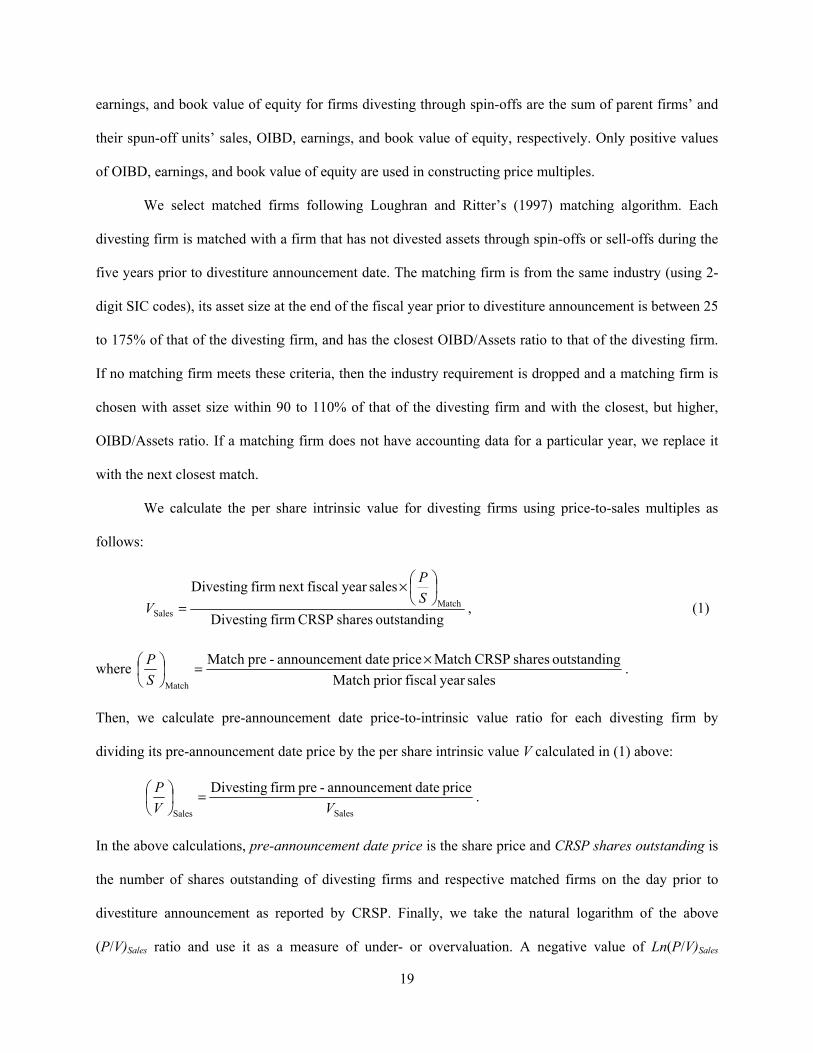
earnings, and book value of equity for firms divesting through spin-offs are the sum of parent firms’ and
their spun-off units’ sales, OIBD, earnings, and book value of equity, respectively. Only positive values
of OIBD, earnings, and book value of equity are used in constructing price multiples.
We select matched firms following Loughran and Ritter’s (1997) matching algorithm. Each
divesting firm is matched with a firm that has not divested assets through spin-offs or sell-offs during the
five years prior to divestiture announcement date. The matching firm is from the same industry (using 2-
digit SIC codes), its asset size at the end of the fiscal year prior to divestiture announcement is between 25
to 175% of that of the divesting firm, and has the closest OIBD/Assets ratio to that of the divesting firm.
If no matching firm meets these criteria, then the industry requirement is dropped and a matching firm is
chosen with asset size within 90 to 110% of that of the divesting firm and with the closest, but higher,
OIBD/Assets ratio. If a matching firm does not have accounting data for a particular year, we replace it
with the next closest match.
We calculate the per share intrinsic value for divesting firms using price-to-sales multiples as
follows:
goutstandin shares CRSP firm Divesting
salesyear fiscalnext firm DivestingMatch
Sales
×
=SP
V , (1)
where salesyear fiscalprior Match
goutstandin shares CRSPMatch price datent announceme-preMatch
Match
×=
SP .
Then, we calculate pre-announcement date price-to-intrinsic value ratio for each divesting firm by
dividing its pre-announcement date price by the per share intrinsic value V calculated in (1) above:
SalesSales
price datent announceme-pre firm DivestingVV
P =
.
In the above calculations, pre-announcement date price is the share price and CRSP shares outstanding is
the number of shares outstanding of divesting firms and respective matched firms on the day prior to
divestiture announcement as reported by CRSP. Finally, we take the natural logarithm of the above
(P/V)Sales ratio and use it as a measure of under- or overvaluation. A negative value of Ln(P/V)Sales
20
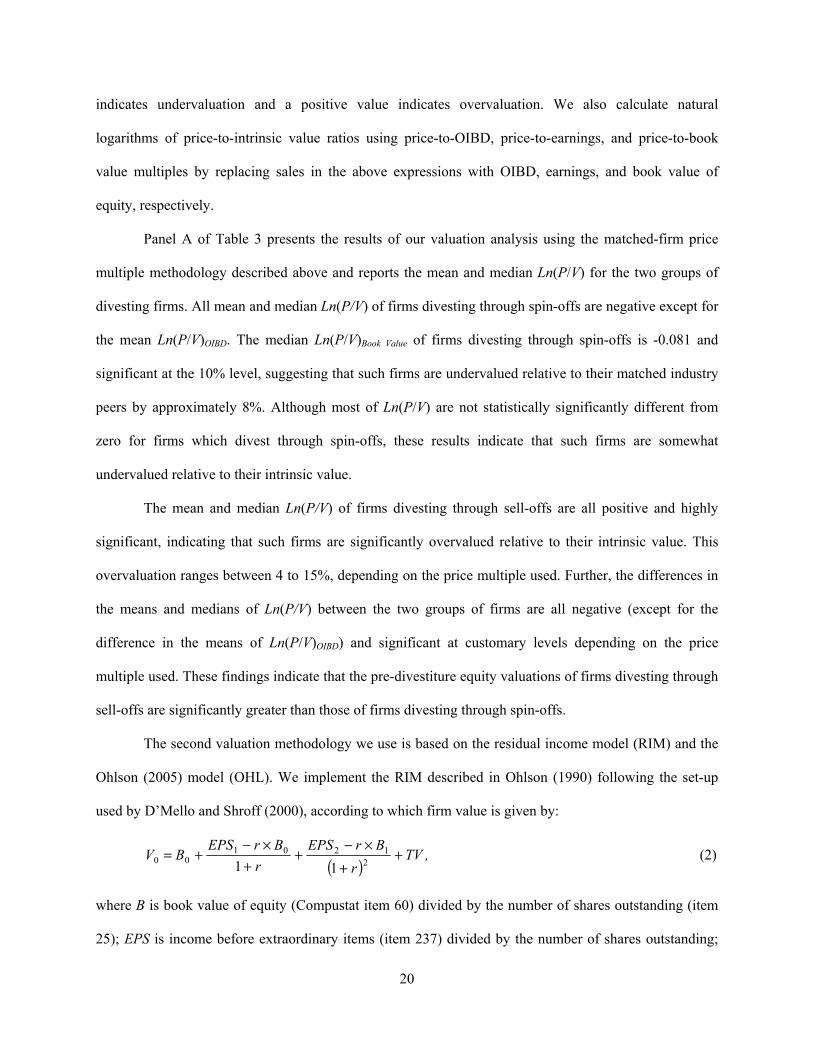
indicates undervaluation and a positive value indicates overvaluation. We also calculate natural
logarithms of price-to-intrinsic value ratios using price-to-OIBD, price-to-earnings, and price-to-book
value multiples by replacing sales in the above expressions with OIBD, earnings, and book value of
equity, respectively.
Panel A of Table 3 presents the results of our valuation analysis using the matched-firm price
multiple methodology described above and reports the mean and median Ln(P/V) for the two groups of
divesting firms. All mean and median Ln(P/V) of firms divesting through spin-offs are negative except for
the mean Ln(P/V)OIBD. The median Ln(P/V)Book Value of firms divesting through spin-offs is -0.081 and
significant at the 10% level, suggesting that such firms are undervalued relative to their matched industry
peers by approximately 8%. Although most of Ln(P/V) are not statistically significantly different from
zero for firms which divest through spin-offs, these results indicate that such firms are somewhat
undervalued relative to their intrinsic value.
The mean and median Ln(P/V) of firms divesting through sell-offs are all positive and highly
significant, indicating that such firms are significantly overvalued relative to their intrinsic value. This
overvaluation ranges between 4 to 15%, depending on the price multiple used. Further, the differences in
the means and medians of Ln(P/V) between the two groups of firms are all negative (except for the
difference in the means of Ln(P/V)OIBD) and significant at customary levels depending on the price
multiple used. These findings indicate that the pre-divestiture equity valuations of firms divesting through
sell-offs are significantly greater than those of firms divesting through spin-offs.
The second valuation methodology we use is based on the residual income model (RIM) and the
Ohlson (2005) model (OHL). We implement the RIM described in Ohlson (1990) following the set-up
used by D’Mello and Shroff (2000), according to which firm value is given by:
( ),TV
rBrEPS
rBrEPS
BV ++
×−+
+×−
+= 21201
0011
(2)
where B is book value of equity (Compustat item 60) divided by the number of shares outstanding (item
25); EPS is income before extraordinary items (item 237) divided by the number of shares outstanding;
21
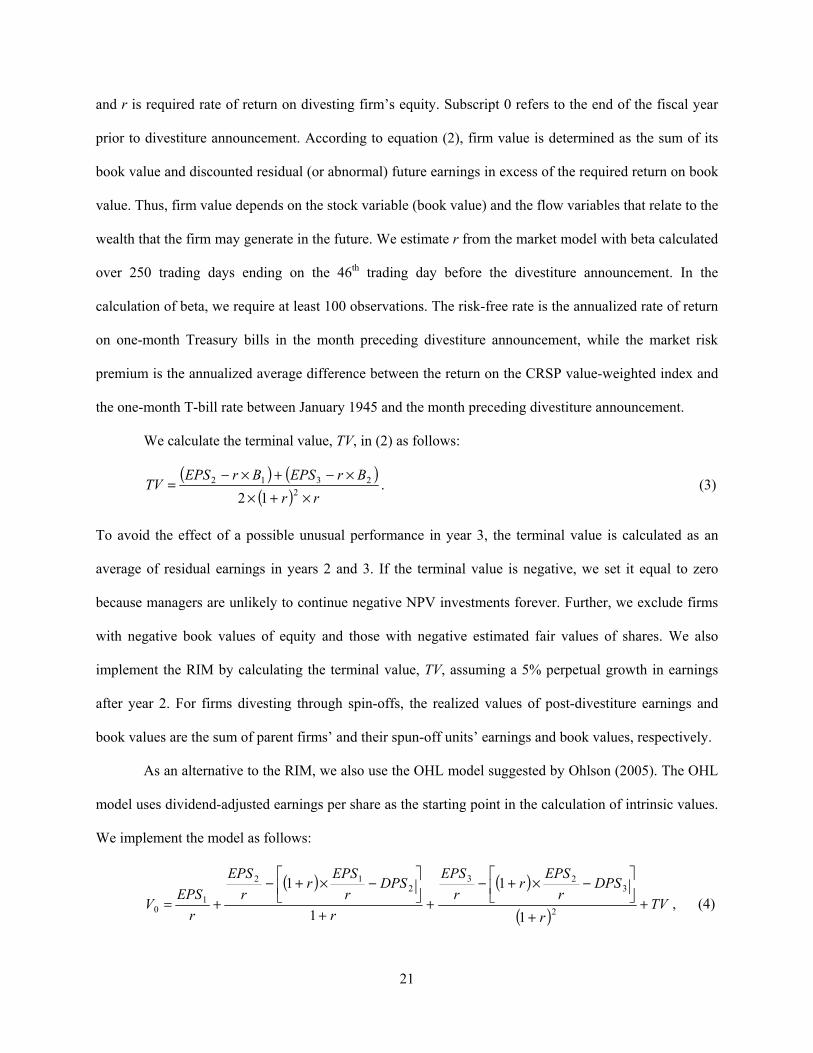
and r is required rate of return on divesting firm’s equity. Subscript 0 refers to the end of the fiscal year
prior to divestiture announcement. According to equation (2), firm value is determined as the sum of its
book value and discounted residual (or abnormal) future earnings in excess of the required return on book
value. Thus, firm value depends on the stock variable (book value) and the flow variables that relate to the
wealth that the firm may generate in the future. We estimate r from the market model with beta calculated
over 250 trading days ending on the 46th trading day before the divestiture announcement. In the
calculation of beta, we require at least 100 observations. The risk-free rate is the annualized rate of return
on one-month Treasury bills in the month preceding divestiture announcement, while the market risk
premium is the annualized average difference between the return on the CRSP value-weighted index and
the one-month T-bill rate between January 1945 and the month preceding divestiture announcement.
We calculate the terminal value, TV, in (2) as follows:
( ) ( )( ) rr
BrEPSBrEPSTV
×+××−+×−
= 22312
12. (3)
To avoid the effect of a possible unusual performance in year 3, the terminal value is calculated as an
average of residual earnings in years 2 and 3. If the terminal value is negative, we set it equal to zero
because managers are unlikely to continue negative NPV investments forever. Further, we exclude firms
with negative book values of equity and those with negative estimated fair values of shares. We also
implement the RIM by calculating the terminal value, TV, assuming a 5% perpetual growth in earnings
after year 2. For firms divesting through spin-offs, the realized values of post-divestiture earnings and
book values are the sum of parent firms’ and their spun-off units’ earnings and book values, respectively.
As an alternative to the RIM, we also use the OHL model suggested by Ohlson (2005). The OHL
model uses dividend-adjusted earnings per share as the starting point in the calculation of intrinsic values.
We implement the model as follows:
( ) ( )
( )TV
r
DPSr
EPSr
rEPS
r
DPSr
EPSr
rEPS
rEPS
V ++
−×+−+
+
−×+−+= 2
323
212
10
1
1
1
1, (4)
22
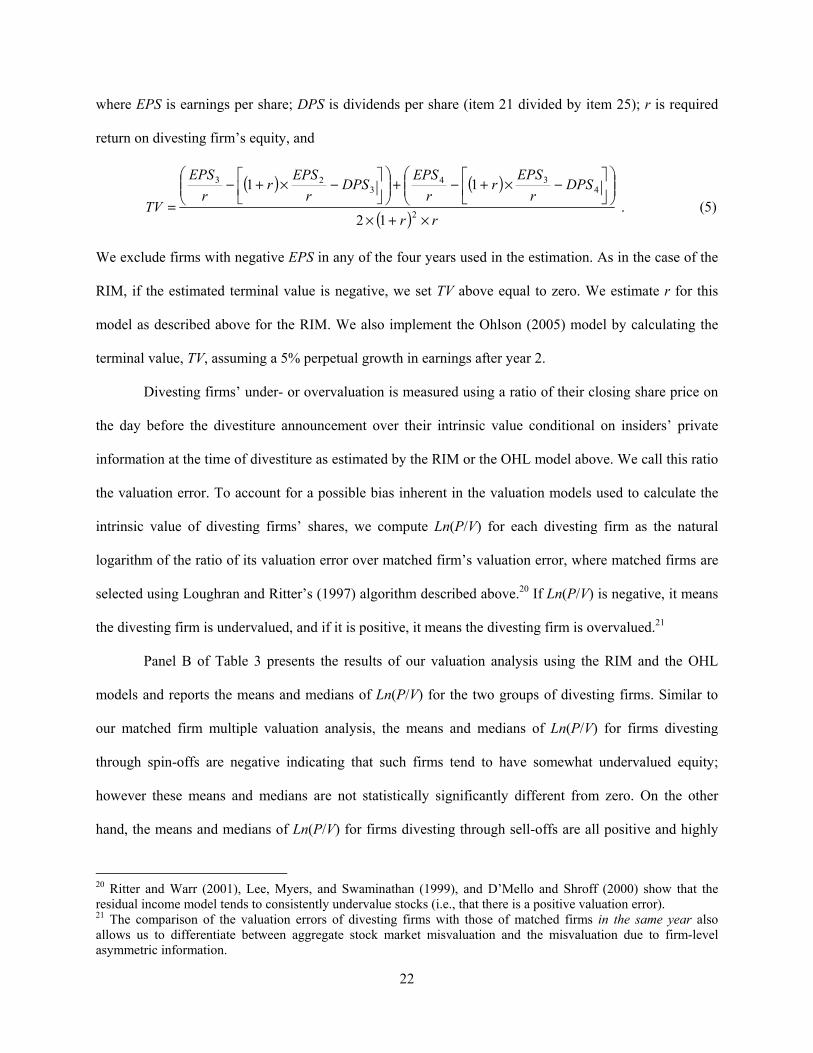
where EPS is earnings per share; DPS is dividends per share (item 21 divided by item 25); r is required
return on divesting firm’s equity, and
( ) ( )
( ) .
12
11
2
434
323
rr
DPSr
EPSr
rEPS
DPSr
EPSr
rEPS
TV×+×
−×+−+
−×+−= (5)
We exclude firms with negative EPS in any of the four years used in the estimation. As in the case of the
RIM, if the estimated terminal value is negative, we set TV above equal to zero. We estimate r for this
model as described above for the RIM. We also implement the Ohlson (2005) model by calculating the
terminal value, TV, assuming a 5% perpetual growth in earnings after year 2.
Divesting firms’ under- or overvaluation is measured using a ratio of their closing share price on
the day before the divestiture announcement over their intrinsic value conditional on insiders’ private
information at the time of divestiture as estimated by the RIM or the OHL model above. We call this ratio
the valuation error. To account for a possible bias inherent in the valuation models used to calculate the
intrinsic value of divesting firms’ shares, we compute Ln(P/V) for each divesting firm as the natural
logarithm of the ratio of its valuation error over matched firm’s valuation error, where matched firms are
selected using Loughran and Ritter’s (1997) algorithm described above.20 If Ln(P/V) is negative, it means
the divesting firm is undervalued, and if it is positive, it means the divesting firm is overvalued.21
Panel B of Table 3 presents the results of our valuation analysis using the RIM and the OHL
models and reports the means and medians of Ln(P/V) for the two groups of divesting firms. Similar to
our matched firm multiple valuation analysis, the means and medians of Ln(P/V) for firms divesting
through spin-offs are negative indicating that such firms tend to have somewhat undervalued equity;
however these means and medians are not statistically significantly different from zero. On the other
hand, the means and medians of Ln(P/V) for firms divesting through sell-offs are all positive and highly
20 Ritter and Warr (2001), Lee, Myers, and Swaminathan (1999), and D’Mello and Shroff (2000) show that the residual income model tends to consistently undervalue stocks (i.e., that there is a positive valuation error). 21 The comparison of the valuation errors of divesting firms with those of matched firms in the same year also allows us to differentiate between aggregate stock market misvaluation and the misvaluation due to firm-level asymmetric information.
23
significant, indicating that such firms are significantly overvalued relative to their intrinsic value. Such
overvaluation ranges between 10 to 16%. Finally, the differences in means and medians of Ln(P/V)
between the two groups of firms are all negative and significant at customary levels, except for the
difference in means of Ln(P/V) using the OHL model with 0% growth.
Overall, the findings in Table 3 indicate that the pre-divestiture equity valuations of firms
divesting through sell-offs are significantly greater than those of firms divesting through spin-offs.
Further, the findings suggest that firms divesting through spin-offs are somewhat undervalued, while
firms divesting through sell-offs are significantly overvalued relative to their intrinsic value, and provide
support for our hypothesis H1.
4.3. The Announcement Effects of Spin-Offs and Sell-Offs
In this section we study the effect of spin-off and sell-off announcements on divesting firms’
equity and test hypotheses H2 and H5. Hypothesis H2 predicts that the announcement effects of spin-offs
will be positive and those of sell-offs will be negative; and hypothesis H5 predicts that spin-offs will be
associated with no announcement effects while sell-offs will be associated with positive announcement
effects. The announcement dates of sell-offs are obtained from the SDC/Mergers and Acquisitions
database, whereas those of spin-offs are obtained by searching Factiva and Bloomberg databases.
The announcement effect for each divesting firm is computed as the cumulative abnormal return
(CAR) for a particular event window around the announcement date. Daily abnormal returns are
computed using the market model (with value- and equal-weighted CRSP indices). Market model
parameters are estimated over 255 trading days ending 46 trading days before the announcement date
with at least 100 daily returns in the estimation period. Announcement effects are calculated for six
different event windows for each market index ranging from three days before to three days after the
announcement date.
The announcement effects of spin-offs and sell-offs are presented in Table 4. The results show
that both groups of firms realize significantly positive announcement effects. The mean (median)
24
announcement effects of spin-offs range between 2.88 (0.98) to 4.48% (2.33%) and the mean (median)
announcement effects of sell-offs range between 1.03 (0.21) to 1.58% (0.46%) depending on the event
window. All means and medians are significantly different from zero at the 1% level for both groups of
divesting firms. Further, the findings in Table 4 also demonstrate that spin-offs have significantly larger
announcement effects compared to sell-offs. The differences in the mean (median) announcement effects
of spin-offs and sell-offs range between 1.86 (0.58) to 2.93% (1.88%) and are statistically significantly
different from zero at the 1% level.
These findings are not consistent with either of our hypotheses H2 or H5 if considered separately.
Combined, however, these two hypotheses predict positive announcement effects for spin-offs, and either
positive or negative announcement effects for sell-offs, depending on the relative magnitudes of the
overvaluation effect versus the effect of divesting underperforming assets. If we interpret the positive
announcement effects of sell-offs in Table 4 as an indication that the positive effect of divesting
underperforming assets dominates the negative effect of overvaluation, then, combined with the positive
announcement effects of spin-offs, our findings provide support for the joint hypotheses H2 and H5.
4.4. Post-Divesture Operating Performance of Firms Divesting through Spin-Offs and Sell-Offs
In this section we study the post-divestiture operating performance of the two groups of divesting
firms. According to Hypothesis H4, firms selling off assets are expected to realize greater improvements
in their post-divestiture operating performance compared to firms spinning off assets.
We use four measures of operating performance: OIBD/Assets, ROA, OIBD/Sales, and Profit
Margin, where OIBD is operating income before depreciation plus interest income (Compustat items 13
and 15), Assets are the book value of total assets (item 6), ROA is net income (item 172) over Assets,
Sales are total sales (item 12), and Profit Margin is net income over Sales. We adjust these measures for
the performance of industry-, size-, and performance-matched firms by subtracting the contemporaneous
performance measures of matched firms from those of the divesting firms in our sample. We select
matched firms following Loughran and Ritter’s (1997) algorithm described in section 4.2.
25
Panel A of Table 5 reports the levels of matched-firm-adjusted operating performance of both
groups of firms in the fiscal year prior to divestiture (year -1), the fiscal year of divestiture (year 0), and
the three fiscal years after divestiture (years 1 through 3). The post-divesture matched-firm-adjusted
operating performance ratios of firms divesting through spin-offs are in general significantly negative
indicating that such firms lag behind their industry peers in the post-divesture years. On the other hand,
the post-divesture matched-firm-adjusted operating performance ratios of firms divesting through sell-offs
are mostly in line with those of their industry peers; most post-divesture matched-firm-adjusted
OIBD/Assets and Profit Margin ratios of such firms are not significantly different from zero, whereas
most ROA ratios are significantly positive and most OIBD/Sales ratios are significantly negative. Finally,
Panel A of Table 5 shows that firms divesting through spin-offs have significantly lower post-divesture
matched-firm-adjusted operating performance ratios compared to firms divesting through sell-offs; the
differences in medians are significantly negative for all performance measures in years 2 and 3, and they
are significantly negative in year 1 for OIBD/Assets and OIBD/Sales.
Panel B of Table 5 reports the changes in post-divesture matched-firm-adjusted operating
performance ratios from year -1 to years 0, 1, 2, and 3. Firms divesting through spin-offs realize
significant improvements in their ROA and Profit Margin in years 0 and 1 relative to year -1;22 however,
they realize significant deterioration in their OIBD/Assets and OIBD/Sales in all post-divestiture years
relative to year -1. Firms divesting through spin-offs also realize significant deterioration in their ROA
and Profit Margin in year 2 relative to year -1. On the other hand, firms divesting through sell-offs realize
improvements in all performance measures in all post-divesture years. The changes in post-divesture
matched-firm-adjusted ROA, OIBD/Sales, and Profit Margin of these firms are significantly positive in all
post-divesture years relative to year -1, while the change in OIBD/Assets is significantly positive in year 3
relative to year -1. Further, Panel B of Table 5 shows that the changes in post-divesture matched-firm-
22 Using a sample of spin-offs in 1975-1991, Daley, Mehrotra, and Sivakumar (1997) also find that firms divesting through spin-offs realize improvement in their ROA from year 0 to year 1 after the spin-off. Similarly, using a sample of spin-offs in 1986-1988, John and Ofek (1995) find that firms divesting through spin-offs realize an increase in their ROA from year 0 to three years after the spin-off.
26
adjusted operating performance ratios of firms divesting through spin-offs are significantly smaller
compared to those of firms divesting through sell-offs. The differences in medians are significantly
negative for all performance measures in years 2 and 3 relative to year -1, and they are significantly
negative in year 1 relative to year -1 for OIBD/Assets and OIBD/Sales.
Our findings in Table 5 indicate that firms divesting through sell-offs realize unequivocally
significant improvements in their post-divesture operating performance, whereas the post-divesture
operating performance of firms divesting through spin-offs either improves or deteriorates depending on
the performance measure used. Further, our findings indicate that the changes in post-divesture operating
performance of firms divesting through sell-offs are significantly larger than those of firms divesting
through spin-offs according to all performance measures. All these findings provide support for our
hypothesis H4.
4.5. Post-Divesture Stock Return Performance of Firms Divesting through Spin-Offs and Sell-Offs
In this section we study the post-divesture stock return performance of firms divesting through
spin-offs and sell-offs. Hypothesis H6 predicts that firms divesting through sell-offs will realize a greater
improvement in their post-divestiture stock return performance than firms divesting through spin-offs.
We study divesting firms’ stock return performance relative to three benchmarks: the value- and
equal-weighted CRSP indices, and the S&P 500 index. We calculate average holding period returns for
divesting firms and the corresponding benchmarks for year -1 before divestiture (months -12 to -1), year 1
after divestiture (months 1 to 12), year 2 after divestiture (months 13 to 24), and year 3 after divestiture
(months 25 to 36). Month 0 is the month when transaction becomes effective for sell-offs and the issue
month for spin-offs. We calculate holding period returns for each divesting firm and the corresponding
benchmark as %100]1)1([1
×−+∏ =iT
t itR , where Rit is the return on the stock of divesting firm i or the
corresponding benchmark in the t-th month of an event window and Ti is the number of months in that
event window. Ti is equal to 12 if a divesting firm survives for all twelve months in a one-year event
27
window. For firms that are delisted before the end of a twelve-month window, holding period returns are
calculated until the delisting month, and the corresponding benchmarks’ returns are calculated over the
same truncated period. Finally, we calculate abnormal (benchmark-adjusted) holding period return for
each divesting firm by subtracting the holding period return of the corresponding benchmarks from that of
the divesting firm.
In Panel A of Table 6 we report the median pre- and post-divestiture abnormal holding period
returns for the two groups of divesting firms. In the pre-divestiture year and depending on the benchmark
used, firms divesting through spin-offs realize significantly positive abnormal holding period returns
ranging between 6.06 to 9.59%, whereas firms divesting through sell-offs realize significantly negative
abnormal holding period returns ranging between -5.26 to -7.54%. In the post-divestiture years, both
groups of firms realize significantly negative abnormal holding period returns, except for firms divesting
through sell-offs using the S&P 500 index as a benchmark.23 However, depending on the benchmark used
and the post-divestiture year, the abnormal holding period returns of firms divesting through spin-offs are
significantly more negative than those of firms divesting through sell-offs; the differences in median
abnormal holding period returns between the two groups of firms range between -1.56 to -8.10% and are
highly significant.
In Panel B of Table 6 we report the changes in median abnormal holding period returns from year
-1 to post-divestiture years 1, 2, and 3 for the two groups of divesting firms. Depending on the benchmark
used and the post-divestiture year, the changes in abnormal holding period returns of firms divesting
through spin-offs range between -10.99 to -23.55% and are significant at the 1% level. The changes in
abnormal holding period returns of firms divesting through sell-offs are significantly positive ranging
between 1.08 and 3.60%. Finally, the changes in post-divestiture abnormal holding period returns of firms
divesting through sell-offs are significantly greater than those of firms divesting through spin-offs; the
differences in median changes in abnormal holding period returns are all negative, ranging from -13.60 to
23 Cusatis, Miles, and Woolridge (1993) show that in 1965-1988 firms divesting through spin-offs realize positive matched-firm-adjusted holding period returns in the three-year period after the spin-off.
28
-24.63%, and highly significant. These findings indicate that firms divesting through sell-offs realize
significant improvement in their post-divestiture stock return performance, whereas firms divesting
through spin-offs realize significant deterioration.
We also study stock return performance using the calendar time portfolio approach with the Fama
and French (1993) three-factor model augmented by Carhart’s (1997) momentum factor.24 This multi-
factor model serves as a benchmark for expected returns (see, e.g., Ritter and Welch, 2002), with the
estimate of its intercept measuring monthly abnormal returns; a negative intercept indicates
underperformance and a positive one indicates overperformance. Specifically, to estimate whether
divesting firms realize an improvement in their post-divestiture stock return performance relative to their
pre-divestiture performance, we run the following regression separately for firms divesting through spin-
offs and for firms divesting through sell-offs:
(Rpt – Rft) = α + γ After + β1(Rmt – Rft) + β2(Rmt – Rft) After + s1 SMBt
+ s2 SMBt After + h1 HMLt + h2 HMLt After + u1 UMDt + u2 UMDt After + εt, (6)
where the dependent variable for each calendar month t of the estimation period is calculated as the
average return on a portfolio of either spin-off or sell-off parent firms whose spin-off issue date or sell-off
effective date falls within the past 36 months or within the next 12 months (36 months after divestiture
and 12 months before divestiture) minus the risk-free rate;25 Rmt is the return on the CRSP value-weighted
index in month t; Rft is the 1-month T-bill yield in month t; SMBt is the return on a portfolio of small
stocks minus the return on a portfolio of large stocks in month t; HMLt is the return on a portfolio of high
book-to-market stocks minus the return on a portfolio of low book-to-market stocks in month t; and
UMDt is the return on a portfolio of high prior return stocks minus the return on a portfolio of low prior
24 Jagadeesh and Titman (1993) and Carhart (1997), among others, have shown that momentum in stock returns is an important factor in explaining stock return performance. 25 In this analysis we compare the abnormal monthly returns realized by divesting firms in the three-year post-divestiture period to those realized in the one-year pre-divestiture period. For robustness, we also compare the abnormal monthly returns realized by divesting firms in the one- and two-year periods after divestiture to those realized in the one-year period prior to divestiture. Unreported results of these alternative tests are similar to those reported here; namely, firms divesting through spin-offs realize significant deterioration in their post-divestiture performance whereas firms divesting through sell-offs realize significant improvement.
29
return stocks in month t. In equation (6), we test the differences in the pre- and post-divestiture stock
return performance by using a dummy variable After equal to one for the post-divestiture period (months
1 to 36 after divestiture), and zero for the pre-divestiture period (months -12 to -1 before divestiture), and
interacting it with the Fama and French (1993) and Carhart (1997) risk factors. Thus the estimate of α in
equation (6) represents the monthly abnormal returns in the pre-divestiture period and the estimate of γ
represents the difference between the monthly abnormal returns in the post-divestiture period over those
in the pre-divestiture period. The estimate of γ is expected to be positive if divesting firms realize
improvements in their post-divestiture stock return performance relative to the pre-divestiture period.
Panel A of Table 7 presents the results of our estimation of equation (6) for firms divesting
through spin-offs using ordinary least squares (OLS) and weighted least squares (WLS) regressions.26 The
coefficient estimates of α are positive in both specifications and significant at the 1% level indicating that
firms divesting through spin-offs realize positive abnormal monthly returns between 1.3 to 1.6% in the
one-year pre-divestiture period. The coefficient estimates of After dummy (γ) are negative and highly
significant, which suggests that the stock return performance of firms divesting through spin-offs
deteriorates after divestiture as their abnormal monthly returns in the three-year post-divestiture period
are significantly smaller by 1.1 to 1.8% than those in the pre-divestiture period.
Panel B of Table 7 presents the results of our estimation of equation (6) for firms divesting
through sell-offs. The coefficient estimates of α are negative but not statistically significant. The
coefficient estimates of γ are positive and significant at the 5 and 10% levels, which implies that firms
divesting through sell-offs realize significant improvement in their post-divestiture stock return
performance as their abnormal monthly returns in the three-year post-divestiture period are significantly
larger by 0.3 to 0.4% than those in the pre-divestiture period. Consistent with our holding period return
analysis in Table 6, our calendar time portfolio analysis in Table 7 also indicates that firms divesting
through sell-offs tend to realize significant improvement in their post-divestiture stock return
26 For WLS regressions the weights are determined by the number of divesting firms in the monthly portfolio.
30
performance, whereas the performance of firms divesting through spin-offs deteriorates. These findings
provide support for our hypothesis H6.
4.6. The Choice between Spin-Offs and Sell-offs
In this section we study the choice between spin-offs and sell-offs in a multivariate setting. We
run a set of logit regressions with the dependent variable equal to one if the divestiture is a spin-off and
zero if it is a sell-off. The independent variables which relate to our hypotheses along with expected signs
of their coefficients in parentheses are: the equity valuation variables Ln(P/V)Sales or Ln(P/V)Book Value (-),
Marginal Tax Rate (+), Relatedness (+), and Investor Sentiment Index (+). Further, we control for
divesting firm’s size by using Ln(Assets) or Ln(MVE), divested unit’s size Ln(Unit Size), divesting firm’s
operating performance in the previous fiscal year measured by ROA, divesting firm’s financial constraints
measured by Cash/Assets, KZ Index, or (CapEx + R&D)/Assets, and the extent of asymmetric information
faced by divesting firm measured by Ln(Number of Analysts), StDev of Analyst Forecasts, or Dispersion.
The results of various specifications of our logit regressions are presented in Table 8.
The coefficient estimates of Ln(P/V)Sales and Ln(P/V)Book Value are all negative and significant in
seven out of ten specifications at the 5 or 10% levels. This suggests that the firms which have higher
equity valuation relative to their intrinsic value (relatively overvalued firms) are more likely to divest
their assets through a sell-off, while those with lower equity valuation relative to their intrinsic value
(relatively undervalued firms) are more likely to divest their assets through a spin-off. This provides
support for hypothesis H1. Further, the coefficient estimates of Marginal Tax Rate are all positive and
highly significant at the 1% level. This indicates that firms with higher marginal tax rates are more likely
to divest their assets through a spin-off rather than a sell-off and supports our hypothesis H3. Also, the
coefficient estimates of Investor Sentiment Index are positives in all specifications and highly significant
at the 1% level. This implies that firms are more likely to divest their assets through spin-offs during
periods of relatively high investor sentiment and through sell-offs during periods of relatively low
investor sentiment, providing support for our hypothesis H7. Finally, the coefficient estimates of
31
Relatedness are all positive and significant at the 1% level as well, implying that firms whose business is
more related to that of their units are more likely to divest such units through spin-offs rather than sell-
offs. Assuming that the units which are less related to their parent firm’s business have lower productivity
(underperforming units), the positive coefficient estimates of Relatedness indicate that underperforming
units are more likely to be sold off and better-performing units are more likely to be spun off.
Our logit regressions also show that larger firms (measured by the size of their assets or the
market value of their equity) are more likely to sell off their assets. Also, units which are relatively larger
in size are more likely to be spun off. In addition, firms with better operating performance (ROA) in the
pre-divestiture year are more likely to sell off their assets; however, this finding is not significant in most
of the specifications. Further, firms which are more financially constrained (i.e., firms which have less
cash relative to their assets, higher values of KZ Index, or invest more in capital expenditures and R&D)
are more likely to sell off their assets, indicating perhaps that cash generated through a sell-off may be
used to relieve such financial constraints. The coefficient estimates of Cash/Assets are all positive and
highly significant at the 1 or 5% levels, whereas those of KZ Index are mostly negative and significant at
the 10% level in three specifications only. The coefficient estimates of (CapEx + R&D)/Assets are all
negative but not statistically significant. Finally, firms which face more information asymmetry in the
financial market are more likely to divest their assets through a spin-off rather than a sell-off. Namely,
firms which are followed by fewer analysts and those which have higher standard deviation of analyst
forecasts or greater dispersion in such forecasts are more likely to divest their assets through a spin-off.27
The coefficient estimates of Ln(Number of Analysts) are negative and significant at the 1% level, and
those of StDev of Analyst Forecasts and Dispersion are positive and significant at the 5 and 10% levels.28
27 We exclude Ln(Assets) and Ln(MVE) from regression specifications where Ln(Number of Analysts) is used as an independent variable because these two firm size variables are highly correlated with Ln(Number of Analysts). The correlation coefficient between Ln(Number of Analysts) and Ln(Assets) [Ln(MVE)] is 0.73 [0.76]. 28 These findings complement those by Krishnaswami and Subramaniam (1999) who show that firms divesting through spin-offs face a greater extent of information asymmetry relative to peer non-divesting firms. Our findings demonstrate that the firms which divest their assets through spin-offs face more asymmetric information also relative to the firms which divest their assets through sell-offs.
32
In summary, our multivariate logit analysis provides further support for several of our hypotheses
and confirms the results of our univariate tests. It shows that firms which have lower equity valuations
relative to their intrinsic value or higher marginal tax rates, divest more related units, and are less
financially constrained or subject to more information asymmetry are more likely to divest their assets
through a spin-off rather than a sell-off.
5. Conclusion
This paper studies the determinants of the choice between two forms of corporate
divestituresspin-offs versus sell-offs. We develop empirical predictions by hypothesizing that this
choice is driven by the characteristics of divesting firms (such as their valuation in the market relative to
their intrinsic value and their marginal tax rate), by the characteristics of the assets being divested (their
current performance under parent firm’s management relative to their full potential), and by the prevailing
market conditions at the time of divestiture (such as the degree of investor optimism or pessimism).
Consistent with our hypotheses, we find the following. First, firms which spin off their assets
have significantly lower pre-divestiture valuations (relative to their intrinsic value) than firms which sell
off their assets. Second, firms which divest their assets through sell-offs realize significantly larger
improvements in their long-term post-divestiture operating performance compared to firms which divest
their assets through spin-offs. Third, firms which divest their assets through sell-offs realize significantly
larger improvements in their long-term post-divestiture stock return performance compared to firms
which divest their assets through spin-offs. Fourth, the announcement effects of both spin-offs and sell-
offs are significantly positive and those of spin-offs are significantly larger than those of sell-offs. Fifth,
firms are more likely to spin off their assets during periods of investor optimism and sell off their assets
during periods of investor pessimism. Finally, firms with higher marginal tax rates are more likely to spin
off their assets and firms with lower marginal tax rates are more likely to sell off their assets.
33
References
Alexander, G.J., Benson, P.G., Kampmeyer, J.M., 1984. Investigating the Valuation Effects of Announcements of Voluntary Corporate Sell-Offs. Journal of Finance 39 (2), 503–517. Baker, M., Wurgler, J., 2006. Investor Sentiment and the Cross-Section of Stock Returns. Journal of Finance 61 (4), 1645–1680. Bergh, D.D., Johnson, R.A., Dewitt, R.-L., 2008. Restructuring through Spin-Off or Sell-Off: Transforming Information Asymmetries into Financial Gain. Strategic Management Journal 29 (2), 133–148. Blouin, J., Core, J.E., Guay, W., 2010. Have the Tax Benefits of Debt Been Overestimated? Journal of Financial Economics 98 (2), 195–213. Carhart, M., 1997. On Persistence in Mutual Fund Performance. Journal of Finance 52 (1), 57–82. Chen, H.-L., Guo, R.-J., 2005. On Corporate Divestitures. Review of Quantitative Finance and Accounting 24 (4), 399–421. Cusatis, P.J., Miles, J.A., Woolridge, R., 1993. Restructuring through Spin-Offs: The Stock Market Evidence. Journal of Financial Economics 33 (3), 293–311. Daley, L., Mehrotra, V., Sivakumar, R., 1997. Corporate Focus and Value Creation: Evidence from Spin-Offs. Journal of Financial Economics 45 (2), 257–281. Desai, H., Jain, P.C., 1999. Firm Performance and Focus: Long-Run Stock Market Performance Following Spin-Offs. Journal of Financial Economics 54 (1), 75–101. Dittmar, A., Shivdasani, A., 2003. Divestitures and Divisional Investment Policies. Journal of Finance 58 (6), 2711–2743. D’Mello, R., Shroff, P., 2000. Equity Undervaluation and Decisions Related to Repurchase Tender Offers: An Empirical Investigation. Journal of Finance 55 (5), 2399 – 2424. Fama, E., French, K., 1993. Common Risk Factors in the Returns on Stocks and Bonds. Journal of Financial Economics 33 (1), 3–56. Gertner, R., Powers, E., Scharfstein, D., 2002. Learning about Internal Capital Markets from Corporate Spin-Offs. Journal of Finance 57 (6), 2479–2506. Gilson, S.C., Healy, P.M., Noe, C.F., Palepu, K.G., 2001. Analyst Specialization and Conglomerate Stock Breakups. Journal of Accounting Research 39 (3), 565–582. Helwege, J., Liang, N., 2004. Initial Public Offerings in Hot and Cold Markets. Journal of Financial and Quantitative Analysis 39 (3), 541–569. Hite, G.L., Owers, J.E., 1983. Security Price Reactions around Corporate Spin-Off Announcements. Journal of Financial Economics 12 (4), 409–436.
34
Hite, G.L., Owers, J.E., Rogers, R.C., 1987. The Market for Interim Asset Sales: Partial Sell-Offs and Total Liquidations. Journal of Financial Economics 18 (2), 229–252. Ibbotson, R.G., Jaffe, J.F., 1975. “Hot Issue” Markets. Journal of Finance 30 (4), 1027–1042. Jagadeesh, N., Titman, S., 1993. Returns to Buying Winners and Selling Losers: Implications for Stock Market Efficiency. Journal of Finance 48 (1), 65–91. Jain, P.C., 1985. The Effect of Voluntary Sell-Off Announcements on Shareholder Wealth. Journal of Finance 40 (1), 209–224. John, K., Ofek, E., 1995. Asset Sales and Increase in Focus. Journal of Financial Economics 37 (1), 105–126. Kaplan, S.N., Zingales, L., 1997. Do Investment-Cash Flow Sensitivities Provide Useful Measures of Financing Constraints? Quarterly Journal of Economics 112 (1), 169–215. Khan, A.Q., Mehta, D.R., 1996. Voluntary Divestiture and the Choice between Sell-Offs and Spin-Offs. Financial Review 31 (4), 885–912. Krishnaswami, S., Subramaniam, V., 1999. Information Asymmetry, Valuation, and the Corporate Spin-Off Decision. Journal of Financial Economics 53 (1), 73–112. Lamont, O., Polk, C., Saa-Requerjo, J., 2001. Financial Constraints and Stock Returns. Review of Financial Studies 14 (2), 529–554. Lang, L., Poulsen, A., Stulz, R., 1995. Asset Sales, Firm Performance, and the Agency Costs of Managerial Discretion. Journal of Financial Economics 37 (1), 3–37. Lee, C.M.C., Myers, J., Swaminathan, B., 1999. What is the Intrinsic Value of the Dow? Journal of Finance 54 (5), 1693–1741. Loughran, T., Ritter, J., 1997. The Operating Performance of Firms Conducting Seasoned Equity Offerings. Journal of Finance 52 (5), 1823–1850. Lowry, M., 2003. Why Does IPO Volume Fluctuate So Much? Journal of Financial Economics 67 (1), 3–40. Maksimovic, V., Phillips, G., 2001. The Market for Corporate Assets: Who Engages in Mergers and Asset Sales and Are There Efficiency Gains? Journal of Finance 56 (6), 2019–2065. Maxwell, W.F., Rao, R.P., 2003. Do Spin-Offs Expropriate Wealth from Bondholders? Journal of Finance 58 (5), 2087–2108. Maydew, E.L., Schipper, K., Vincent, L., 1999. The Impact of Taxes on the Choice of Divestiture Method. Journal of Accounting and Economics 28 (2), 117–150. Miles, J.A., Rosenfeld, J.D., 1983. The Effect of Voluntary Spin-Off Announcements on Shareholder Wealth. Journal of Finance 38 (5), 1597–1606.

35
Nixon, T.D., Roenfeldt, R.L., Sicherman, N.W., 2000. The Choice between Spin-Offs and Sell-Offs. Review of Quantitative Finance and Accounting 14 (3), 277–288. Ohlson, J., 1990. A Synthesis of Security Valuation Theory and the Role of Dividends, Cash Flows, and Earnings. Contemporary Accounting Research 6 (2), 648 – 676. Ohlson, J., 2005. On Accounting-Based Valuation Formulae. Review of Accounting Studies 10 (2-3), 323–347. Powers, E.A., 2001. Spin-Offs, Sell-Offs, and Equity Carve-Outs: An Analysis of Divestiture Method Choice. Working Paper, University of South Carolina. Parrino, R., 1997. Spin-Offs and Wealth Transfers: The Marriott Case. Journal of Financial Economics 43 (2), 241–274. Ritter, J., 1984. The Hot Issue Market of 1980. Journal of Business 57 (2), 215–240. Ritter, J., Warr, R., 2001. The Decline of Inflation and the Bull Market of 1982-1999. Journal of Financial and Quantitative Analysis 37 (1), 29 – 61. Ritter, J., Welch, I., 2002. A Review of IPO Activity, Pricing, and Allocations. Journal of Finance 57 (4), 1795–1828. Rosenfeld, J.D., 1984. Additional Evidence on the Relations between Divestiture Announcements and Shareholder Wealth. Journal of Finance 39 (5), 1437–1448. Schipper, K., Smith, A., 1983. Effects of Recontracting on Shareholder Wealth: The Case of Voluntary Spin-Offs. Journal of Financial Economics 12 (4), 437–467. Sicherman, N.W., Pettway, R.H., 1992. Wealth Effects for Buyers and Sellers of the Same Divested Assets. Financial Management 21 (4), 119 –128. Vijh, A.M., 1994. The Spin-Off and Merger Ex-Date Effects. Journal of Finance 49 (2), 581–609. Woo, C.Y., Willard, G.E., Daellenbach, U.S., 1992. Spin-Off Performance: A Case of Overstated Expectations? Strategic Management Journal 13 (6), 433–447.
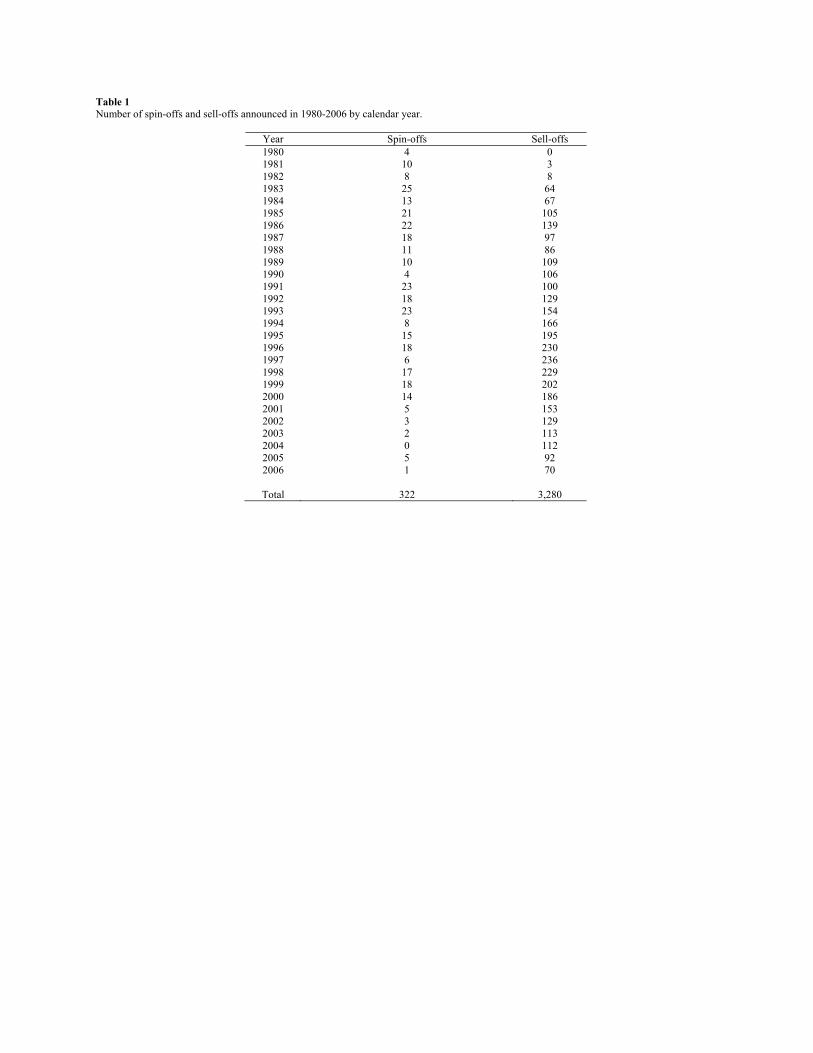
Table 1 Number of spin-offs and sell-offs announced in 1980-2006 by calendar year.
Year Spin-offs Sell-offs 1980 4 0 1981 10 3 1982 8 8 1983 25 64 1984 13 67 1985 21 105 1986 22 139 1987 18 97 1988 11 86 1989 10 109 1990 4 106 1991 23 100 1992 18 129 1993 23 154 1994 8 166 1995 15 195 1996 18 230 1997 6 236 1998 17 229 1999 18 202 2000 14 186 2001 5 153 2002 3 129 2003 2 113 2004 0 112 2005 5 92 2006 1 70
Total 322 3,280
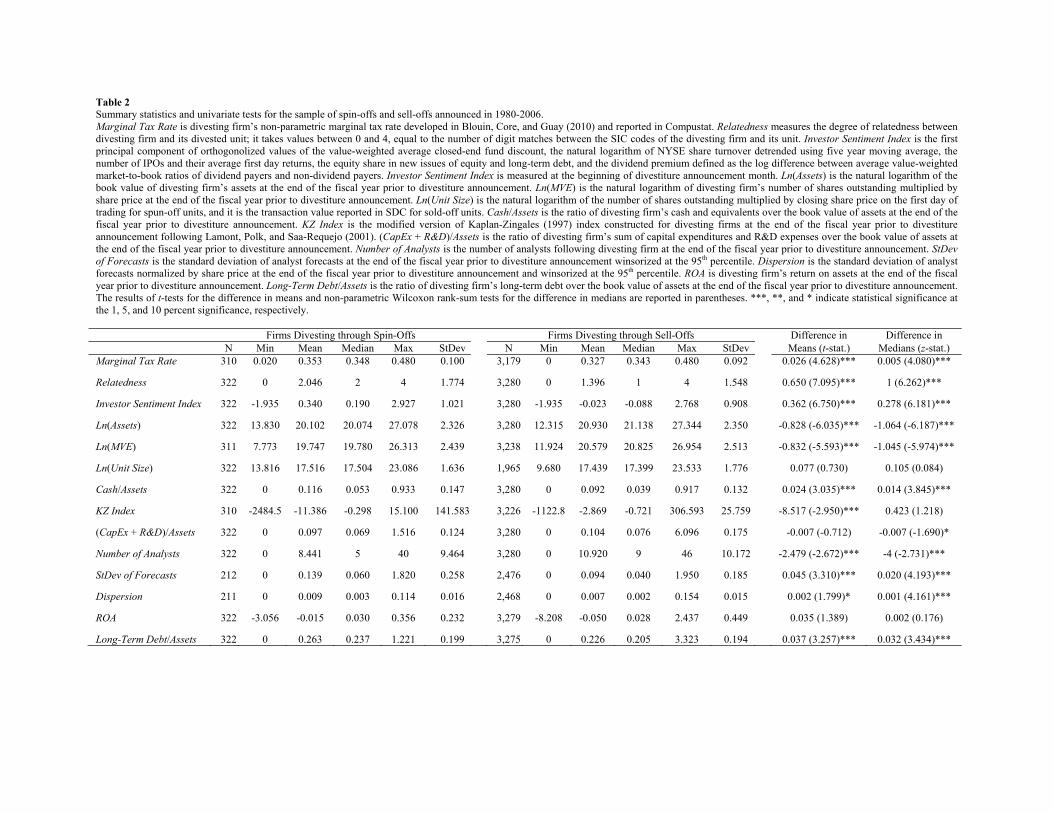
Table 2 Summary statistics and univariate tests for the sample of spin-offs and sell-offs announced in 1980-2006. Marginal Tax Rate is divesting firm’s non-parametric marginal tax rate developed in Blouin, Core, and Guay (2010) and reported in Compustat. Relatedness measures the degree of relatedness between divesting firm and its divested unit; it takes values between 0 and 4, equal to the number of digit matches between the SIC codes of the divesting firm and its unit. Investor Sentiment Index is the first principal component of orthogonolized values of the value-weighted average closed-end fund discount, the natural logarithm of NYSE share turnover detrended using five year moving average, the number of IPOs and their average first day returns, the equity share in new issues of equity and long-term debt, and the dividend premium defined as the log difference between average value-weighted market-to-book ratios of dividend payers and non-dividend payers. Investor Sentiment Index is measured at the beginning of divestiture announcement month. Ln(Assets) is the natural logarithm of the book value of divesting firm’s assets at the end of the fiscal year prior to divestiture announcement. Ln(MVE) is the natural logarithm of divesting firm’s number of shares outstanding multiplied by share price at the end of the fiscal year prior to divestiture announcement. Ln(Unit Size) is the natural logarithm of the number of shares outstanding multiplied by closing share price on the first day of trading for spun-off units, and it is the transaction value reported in SDC for sold-off units. Cash/Assets is the ratio of divesting firm’s cash and equivalents over the book value of assets at the end of the fiscal year prior to divestiture announcement. KZ Index is the modified version of Kaplan-Zingales (1997) index constructed for divesting firms at the end of the fiscal year prior to divestiture announcement following Lamont, Polk, and Saa-Requejo (2001). (CapEx + R&D)/Assets is the ratio of divesting firm’s sum of capital expenditures and R&D expenses over the book value of assets at the end of the fiscal year prior to divestiture announcement. Number of Analysts is the number of analysts following divesting firm at the end of the fiscal year prior to divestiture announcement. StDev of Forecasts is the standard deviation of analyst forecasts at the end of the fiscal year prior to divestiture announcement winsorized at the 95th percentile. Dispersion is the standard deviation of analyst forecasts normalized by share price at the end of the fiscal year prior to divestiture announcement and winsorized at the 95th percentile. ROA is divesting firm’s return on assets at the end of the fiscal year prior to divestiture announcement. Long-Term Debt/Assets is the ratio of divesting firm’s long-term debt over the book value of assets at the end of the fiscal year prior to divestiture announcement. The results of t-tests for the difference in means and non-parametric Wilcoxon rank-sum tests for the difference in medians are reported in parentheses. ***, **, and * indicate statistical significance at the 1, 5, and 10 percent significance, respectively.
Firms Divesting through Spin-Offs Firms Divesting through Sell-Offs Difference in Difference in N Min Mean Median Max StDev N Min Mean Median Max StDev Means (t-stat.) Medians (z-stat.)
Marginal Tax Rate
310 0.020 0.353 0.348 0.480 0.100 3,179 0 0.327 0.343 0.480 0.092
0.026 (4.628)*** 0.005 (4.080)***
Relatedness
322 0 2.046 2 4 1.774 3,280 0 1.396 1 4 1.548
0.650 (7.095)*** 1 (6.262)***
Investor Sentiment Index
322 -1.935 0.340 0.190 2.927 1.021 3,280 -1.935 -0.023 -0.088 2.768 0.908
0.362 (6.750)*** 0.278 (6.181)***
Ln(Assets)
322 13.830 20.102 20.074 27.078 2.326 3,280 12.315 20.930 21.138 27.344 2.350
-0.828 (-6.035)*** -1.064 (-6.187)***
Ln(MVE)
311 7.773 19.747 19.780 26.313 2.439 3,238 11.924 20.579 20.825 26.954 2.513
-0.832 (-5.593)*** -1.045 (-5.974)***
Ln(Unit Size)
322 13.816 17.516 17.504 23.086 1.636 1,965 9.680 17.439 17.399 23.533 1.776
0.077 (0.730) 0.105 (0.084)
Cash/Assets
322 0 0.116 0.053 0.933 0.147 3,280 0 0.092 0.039 0.917 0.132
0.024 (3.035)*** 0.014 (3.845)***
KZ Index
310 -2484.5 -11.386 -0.298 15.100 141.583 3,226 -1122.8 -2.869 -0.721 306.593 25.759
-8.517 (-2.950)*** 0.423 (1.218)
(CapEx + R&D)/Assets
322 0 0.097 0.069 1.516 0.124 3,280 0 0.104 0.076 6.096 0.175
-0.007 (-0.712) -0.007 (-1.690)*
Number of Analysts
322 0 8.441 5 40 9.464 3,280 0 10.920 9 46 10.172
-2.479 (-2.672)*** -4 (-2.731)***
StDev of Forecasts
212 0 0.139 0.060 1.820 0.258 2,476 0 0.094 0.040 1.950 0.185
0.045 (3.310)*** 0.020 (4.193)***
Dispersion
211 0 0.009 0.003 0.114 0.016 2,468 0 0.007 0.002 0.154 0.015
0.002 (1.799)* 0.001 (4.161)***
ROA
322 -3.056 -0.015 0.030 0.356 0.232 3,279 -8.208 -0.050 0.028 2.437 0.449
0.035 (1.389) 0.002 (0.176)
Long-Term Debt/Assets 322 0 0.263 0.237 1.221 0.199 3,275 0 0.226 0.205 3.323 0.194 0.037 (3.257)*** 0.032 (3.434)***
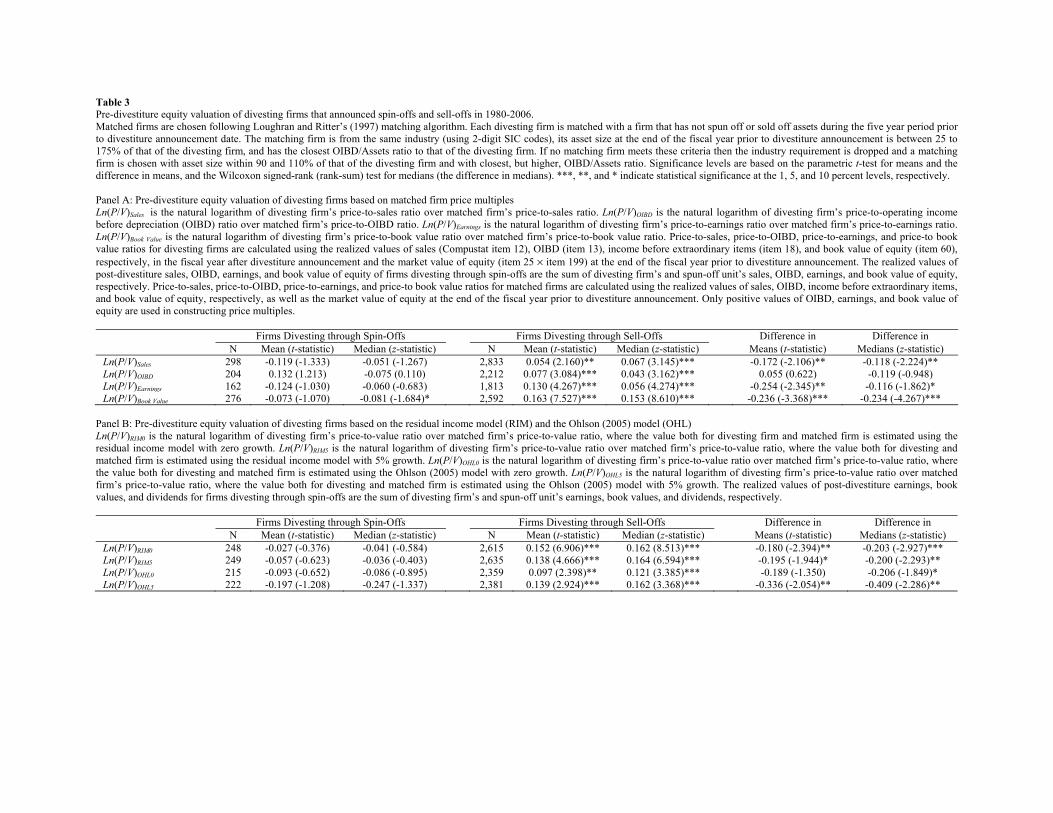
Table 3 Pre-divestiture equity valuation of divesting firms that announced spin-offs and sell-offs in 1980-2006. Matched firms are chosen following Loughran and Ritter’s (1997) matching algorithm. Each divesting firm is matched with a firm that has not spun off or sold off assets during the five year period prior to divestiture announcement date. The matching firm is from the same industry (using 2-digit SIC codes), its asset size at the end of the fiscal year prior to divestiture announcement is between 25 to 175% of that of the divesting firm, and has the closest OIBD/Assets ratio to that of the divesting firm. If no matching firm meets these criteria then the industry requirement is dropped and a matching firm is chosen with asset size within 90 and 110% of that of the divesting firm and with closest, but higher, OIBD/Assets ratio. Significance levels are based on the parametric t-test for means and the difference in means, and the Wilcoxon signed-rank (rank-sum) test for medians (the difference in medians). ***, **, and * indicate statistical significance at the 1, 5, and 10 percent levels, respectively. Panel A: Pre-divestiture equity valuation of divesting firms based on matched firm price multiples Ln(P/V)Sales is the natural logarithm of divesting firm’s price-to-sales ratio over matched firm’s price-to-sales ratio. Ln(P/V)OIBD is the natural logarithm of divesting firm’s price-to-operating income before depreciation (OIBD) ratio over matched firm’s price-to-OIBD ratio. Ln(P/V)Earnings is the natural logarithm of divesting firm’s price-to-earnings ratio over matched firm’s price-to-earnings ratio. Ln(P/V)Book Value is the natural logarithm of divesting firm’s price-to-book value ratio over matched firm’s price-to-book value ratio. Price-to-sales, price-to-OIBD, price-to-earnings, and price-to book value ratios for divesting firms are calculated using the realized values of sales (Compustat item 12), OIBD (item 13), income before extraordinary items (item 18), and book value of equity (item 60), respectively, in the fiscal year after divestiture announcement and the market value of equity (item 25 × item 199) at the end of the fiscal year prior to divestiture announcement. The realized values of post-divestiture sales, OIBD, earnings, and book value of equity of firms divesting through spin-offs are the sum of divesting firm’s and spun-off unit’s sales, OIBD, earnings, and book value of equity, respectively. Price-to-sales, price-to-OIBD, price-to-earnings, and price-to book value ratios for matched firms are calculated using the realized values of sales, OIBD, income before extraordinary items, and book value of equity, respectively, as well as the market value of equity at the end of the fiscal year prior to divestiture announcement. Only positive values of OIBD, earnings, and book value of equity are used in constructing price multiples.
Firms Divesting through Spin-Offs Firms Divesting through Sell-Offs Difference in Difference in N Mean (t-statistic) Median (z-statistic) N Mean (t-statistic) Median (z-statistic) Means (t-statistic) Medians (z-statistic) Ln(P/V)Sales 298 -0.119 (-1.333) -0.051 (-1.267) 2,833 0.054 (2.160)** 0.067 (3.145)*** -0.172 (-2.106)** -0.118 (-2.224)** Ln(P/V)OIBD 204 0.132 (1.213) -0.075 (0.110) 2,212 0.077 (3.084)*** 0.043 (3.162)*** 0.055 (0.622) -0.119 (-0.948) Ln(P/V)Earnings 162 -0.124 (-1.030) -0.060 (-0.683) 1,813 0.130 (4.267)*** 0.056 (4.274)*** -0.254 (-2.345)** -0.116 (-1.862)* Ln(P/V)Book Value 276 -0.073 (-1.070) -0.081 (-1.684)* 2,592 0.163 (7.527)*** 0.153 (8.610)*** -0.236 (-3.368)*** -0.234 (-4.267)***
Panel B: Pre-divestiture equity valuation of divesting firms based on the residual income model (RIM) and the Ohlson (2005) model (OHL) Ln(P/V)RIM0 is the natural logarithm of divesting firm’s price-to-value ratio over matched firm’s price-to-value ratio, where the value both for divesting firm and matched firm is estimated using the residual income model with zero growth. Ln(P/V)RIM5 is the natural logarithm of divesting firm’s price-to-value ratio over matched firm’s price-to-value ratio, where the value both for divesting and matched firm is estimated using the residual income model with 5% growth. Ln(P/V)OHL0 is the natural logarithm of divesting firm’s price-to-value ratio over matched firm’s price-to-value ratio, where the value both for divesting and matched firm is estimated using the Ohlson (2005) model with zero growth. Ln(P/V)OHL5 is the natural logarithm of divesting firm’s price-to-value ratio over matched firm’s price-to-value ratio, where the value both for divesting and matched firm is estimated using the Ohlson (2005) model with 5% growth. The realized values of post-divestiture earnings, book values, and dividends for firms divesting through spin-offs are the sum of divesting firm’s and spun-off unit’s earnings, book values, and dividends, respectively.
Firms Divesting through Spin-Offs Firms Divesting through Sell-Offs Difference in Difference in N Mean (t-statistic) Median (z-statistic) N Mean (t-statistic) Median (z-statistic) Means (t-statistic) Medians (z-statistic) Ln(P/V)RIM0 248 -0.027 (-0.376) -0.041 (-0.584) 2,615 0.152 (6.906)*** 0.162 (8.513)*** -0.180 (-2.394)** -0.203 (-2.927)*** Ln(P/V)RIM5 249 -0.057 (-0.623) -0.036 (-0.403) 2,635 0.138 (4.666)*** 0.164 (6.594)*** -0.195 (-1.944)* -0.200 (-2.293)** Ln(P/V)OHL0 215 -0.093 (-0.652) -0.086 (-0.895) 2,359 0.097 (2.398)** 0.121 (3.385)*** -0.189 (-1.350) -0.206 (-1.849)* Ln(P/V)OHL5 222 -0.197 (-1.208) -0.247 (-1.337) 2,381 0.139 (2.924)*** 0.162 (3.368)*** -0.336 (-2.054)** -0.409 (-2.286)**
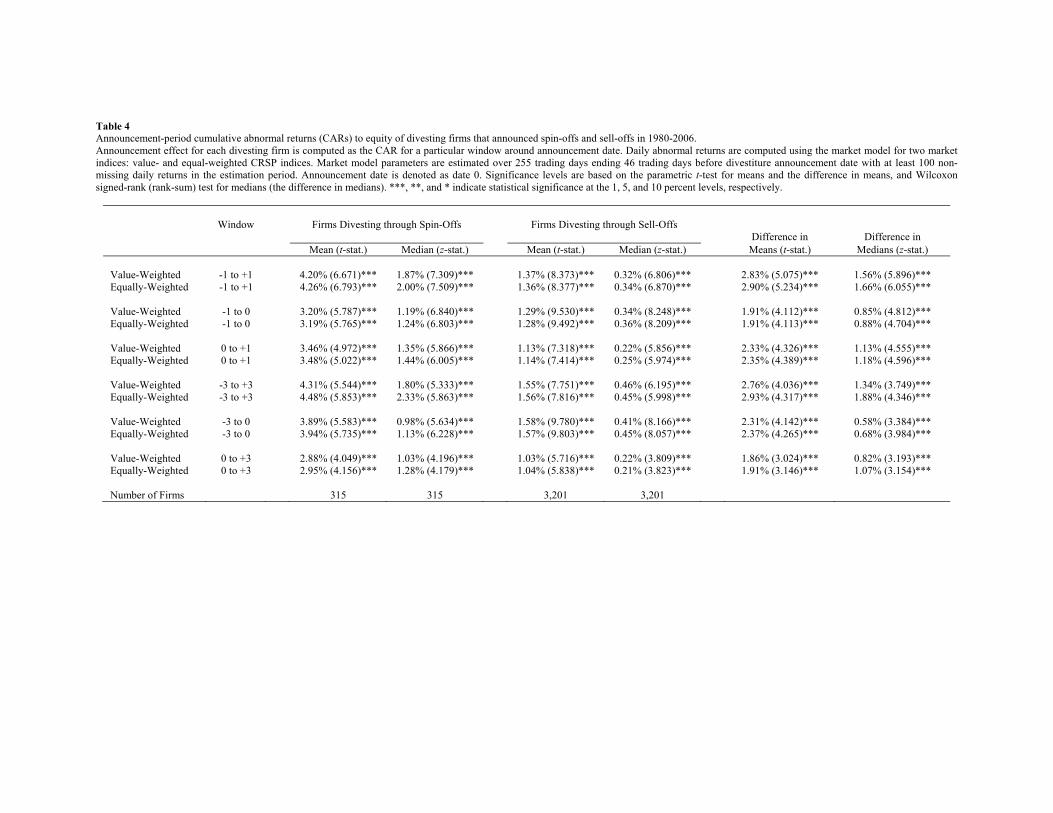
Table 4 Announcement-period cumulative abnormal returns (CARs) to equity of divesting firms that announced spin-offs and sell-offs in 1980-2006. Announcement effect for each divesting firm is computed as the CAR for a particular window around announcement date. Daily abnormal returns are computed using the market model for two market indices: value- and equal-weighted CRSP indices. Market model parameters are estimated over 255 trading days ending 46 trading days before divestiture announcement date with at least 100 non-missing daily returns in the estimation period. Announcement date is denoted as date 0. Significance levels are based on the parametric t-test for means and the difference in means, and Wilcoxon signed-rank (rank-sum) test for medians (the difference in medians). ***, **, and * indicate statistical significance at the 1, 5, and 10 percent levels, respectively.
Window
Firms Divesting through Spin-Offs
Firms Divesting through Sell-Offs
Difference in
Difference in Mean (t-stat.) Median (z-stat.) Mean (t-stat.) Median (z-stat.) Means (t-stat.) Medians (z-stat.) Value-Weighted
-1 to +1
4.20% (6.671)*** 1.87% (7.309)*** 1.37% (8.373)*** 0.32% (6.806)***
2.83% (5.075)*** 1.56% (5.896)***
Equally-Weighted -1 to +1 4.26% (6.793)*** 2.00% (7.509)*** 1.36% (8.377)*** 0.34% (6.870)*** 2.90% (5.234)*** 1.66% (6.055)*** Value-Weighted -1 to 0 3.20% (5.787)*** 1.19% (6.840)*** 1.29% (9.530)*** 0.34% (8.248)*** 1.91% (4.112)*** 0.85% (4.812)*** Equally-Weighted -1 to 0 3.19% (5.765)*** 1.24% (6.803)*** 1.28% (9.492)*** 0.36% (8.209)*** 1.91% (4.113)*** 0.88% (4.704)*** Value-Weighted 0 to +1 3.46% (4.972)*** 1.35% (5.866)*** 1.13% (7.318)*** 0.22% (5.856)*** 2.33% (4.326)*** 1.13% (4.555)*** Equally-Weighted 0 to +1 3.48% (5.022)*** 1.44% (6.005)*** 1.14% (7.414)*** 0.25% (5.974)*** 2.35% (4.389)*** 1.18% (4.596)*** Value-Weighted -3 to +3 4.31% (5.544)*** 1.80% (5.333)*** 1.55% (7.751)*** 0.46% (6.195)*** 2.76% (4.036)*** 1.34% (3.749)*** Equally-Weighted -3 to +3 4.48% (5.853)*** 2.33% (5.863)*** 1.56% (7.816)*** 0.45% (5.998)*** 2.93% (4.317)*** 1.88% (4.346)*** Value-Weighted -3 to 0 3.89% (5.583)*** 0.98% (5.634)*** 1.58% (9.780)*** 0.41% (8.166)*** 2.31% (4.142)*** 0.58% (3.384)*** Equally-Weighted -3 to 0 3.94% (5.735)*** 1.13% (6.228)*** 1.57% (9.803)*** 0.45% (8.057)*** 2.37% (4.265)*** 0.68% (3.984)*** Value-Weighted 0 to +3 2.88% (4.049)*** 1.03% (4.196)*** 1.03% (5.716)*** 0.22% (3.809)*** 1.86% (3.024)*** 0.82% (3.193)*** Equally-Weighted 0 to +3 2.95% (4.156)*** 1.28% (4.179)*** 1.04% (5.838)*** 0.21% (3.823)*** 1.91% (3.146)*** 1.07% (3.154)*** Number of Firms 315 315 3,201 3,201
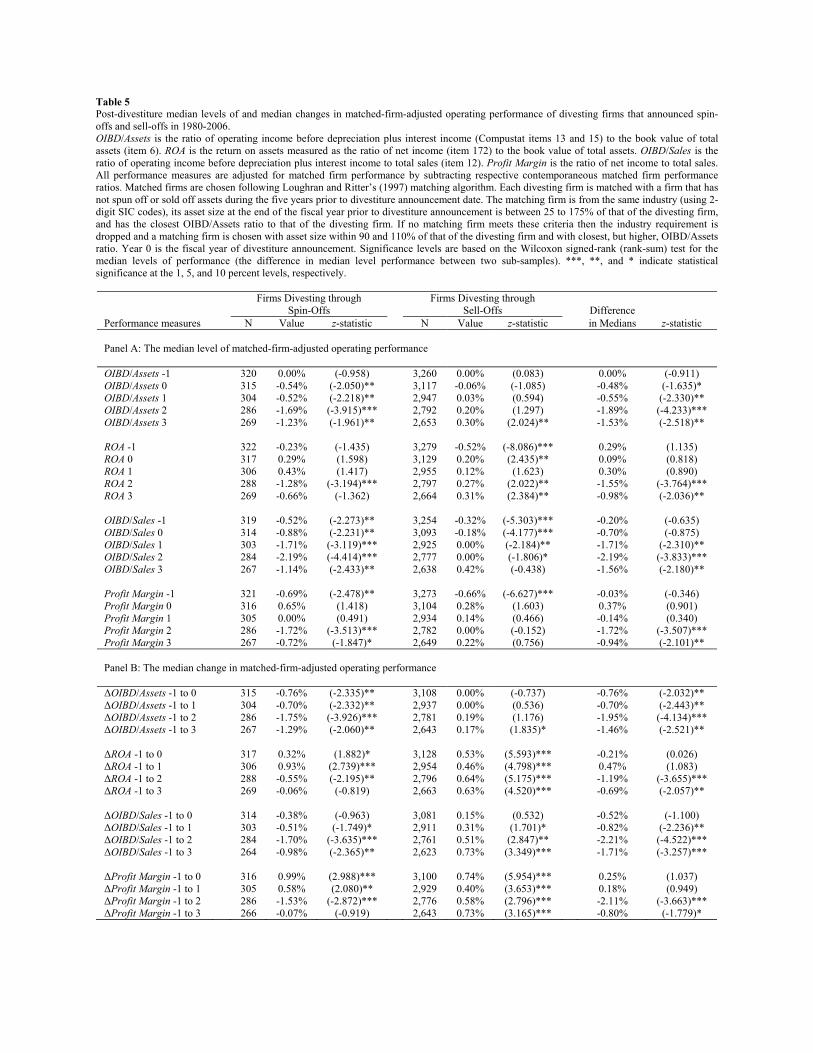
Table 5 Post-divestiture median levels of and median changes in matched-firm-adjusted operating performance of divesting firms that announced spin-offs and sell-offs in 1980-2006. OIBD/Assets is the ratio of operating income before depreciation plus interest income (Compustat items 13 and 15) to the book value of total assets (item 6). ROA is the return on assets measured as the ratio of net income (item 172) to the book value of total assets. OIBD/Sales is the ratio of operating income before depreciation plus interest income to total sales (item 12). Profit Margin is the ratio of net income to total sales. All performance measures are adjusted for matched firm performance by subtracting respective contemporaneous matched firm performance ratios. Matched firms are chosen following Loughran and Ritter’s (1997) matching algorithm. Each divesting firm is matched with a firm that has not spun off or sold off assets during the five years prior to divestiture announcement date. The matching firm is from the same industry (using 2-digit SIC codes), its asset size at the end of the fiscal year prior to divestiture announcement is between 25 to 175% of that of the divesting firm, and has the closest OIBD/Assets ratio to that of the divesting firm. If no matching firm meets these criteria then the industry requirement is dropped and a matching firm is chosen with asset size within 90 and 110% of that of the divesting firm and with closest, but higher, OIBD/Assets ratio. Year 0 is the fiscal year of divestiture announcement. Significance levels are based on the Wilcoxon signed-rank (rank-sum) test for the median levels of performance (the difference in median level performance between two sub-samples). ***, **, and * indicate statistical significance at the 1, 5, and 10 percent levels, respectively.
Firms Divesting through Spin-Offs
Firms Divesting through Sell-Offs
Difference
Performance measures N Value z-statistic N Value z-statistic in Medians z-statistic Panel A: The median level of matched-firm-adjusted operating performance OIBD/Assets -1 320 0.00% (-0.958) 3,260 0.00% (0.083) 0.00% (-0.911) OIBD/Assets 0 315 -0.54% (-2.050)** 3,117 -0.06% (-1.085) -0.48% (-1.635)* OIBD/Assets 1 304 -0.52% (-2.218)** 2,947 0.03% (0.594) -0.55% (-2.330)** OIBD/Assets 2 286 -1.69% (-3.915)*** 2,792 0.20% (1.297) -1.89% (-4.233)*** OIBD/Assets 3 269 -1.23% (-1.961)** 2,653 0.30% (2.024)** -1.53% (-2.518)** ROA -1 322 -0.23% (-1.435) 3,279 -0.52% (-8.086)*** 0.29% (1.135) ROA 0 317 0.29% (1.598) 3,129 0.20% (2.435)** 0.09% (0.818) ROA 1 306 0.43% (1.417) 2,955 0.12% (1.623) 0.30% (0.890) ROA 2 288 -1.28% (-3.194)*** 2,797 0.27% (2.022)** -1.55% (-3.764)*** ROA 3 269 -0.66% (-1.362) 2,664 0.31% (2.384)** -0.98% (-2.036)** OIBD/Sales -1 319 -0.52% (-2.273)** 3,254 -0.32% (-5.303)*** -0.20% (-0.635) OIBD/Sales 0 314 -0.88% (-2.231)** 3,093 -0.18% (-4.177)*** -0.70% (-0.875) OIBD/Sales 1 303 -1.71% (-3.119)*** 2,925 0.00% (-2.184)** -1.71% (-2.310)** OIBD/Sales 2 284 -2.19% (-4.414)*** 2,777 0.00% (-1.806)* -2.19% (-3.833)*** OIBD/Sales 3 267 -1.14% (-2.433)** 2,638 0.42% (-0.438) -1.56% (-2.180)** Profit Margin -1 321 -0.69% (-2.478)** 3,273 -0.66% (-6.627)*** -0.03% (-0.346) Profit Margin 0 316 0.65% (1.418) 3,104 0.28% (1.603) 0.37% (0.901) Profit Margin 1 305 0.00% (0.491) 2,934 0.14% (0.466) -0.14% (0.340) Profit Margin 2 286 -1.72% (-3.513)*** 2,782 0.00% (-0.152) -1.72% (-3.507)*** Profit Margin 3 267 -0.72% (-1.847)* 2,649 0.22% (0.756) -0.94% (-2.101)** Panel B: The median change in matched-firm-adjusted operating performance
∆OIBD/Assets -1 to 0 315 -0.76% (-2.335)** 3,108 0.00% (-0.737) -0.76% (-2.032)** ∆OIBD/Assets -1 to 1 304 -0.70% (-2.332)** 2,937 0.00% (0.536) -0.70% (-2.443)** ∆OIBD/Assets -1 to 2 286 -1.75% (-3.926)*** 2,781 0.19% (1.176) -1.95% (-4.134)*** ∆OIBD/Assets -1 to 3 267 -1.29% (-2.060)** 2,643 0.17% (1.835)* -1.46% (-2.521)** ∆ROA -1 to 0 317 0.32% (1.882)* 3,128 0.53% (5.593)*** -0.21% (0.026) ∆ROA -1 to 1 306 0.93% (2.739)*** 2,954 0.46% (4.798)*** 0.47% (1.083) ∆ROA -1 to 2 288 -0.55% (-2.195)** 2,796 0.64% (5.175)*** -1.19% (-3.655)*** ∆ROA -1 to 3 269 -0.06% (-0.819) 2,663 0.63% (4.520)*** -0.69% (-2.057)** ∆OIBD/Sales -1 to 0 314 -0.38% (-0.963) 3,081 0.15% (0.532) -0.52% (-1.100) ∆OIBD/Sales -1 to 1 303 -0.51% (-1.749)* 2,911 0.31% (1.701)* -0.82% (-2.236)** ∆OIBD/Sales -1 to 2 284 -1.70% (-3.635)*** 2,761 0.51% (2.847)** -2.21% (-4.522)*** ∆OIBD/Sales -1 to 3 264 -0.98% (-2.365)** 2,623 0.73% (3.349)*** -1.71% (-3.257)*** ∆Profit Margin -1 to 0 316 0.99% (2.988)*** 3,100 0.74% (5.954)*** 0.25% (1.037) ∆Profit Margin -1 to 1 305 0.58% (2.080)** 2,929 0.40% (3.653)*** 0.18% (0.949) ∆Profit Margin -1 to 2 286 -1.53% (-2.872)*** 2,776 0.58% (2.796)*** -2.11% (-3.663)*** ∆Profit Margin -1 to 3 266 -0.07% (-0.919) 2,643 0.73% (3.165)*** -0.80% (-1.779)*
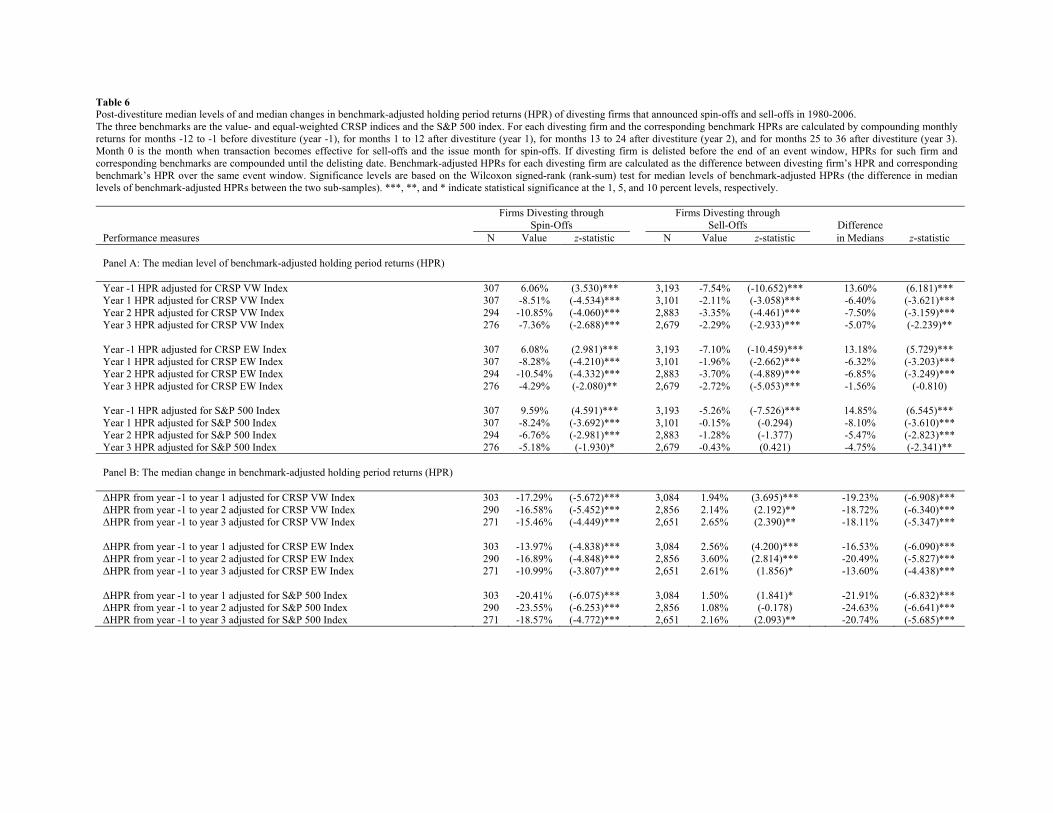
Table 6 Post-divestiture median levels of and median changes in benchmark-adjusted holding period returns (HPR) of divesting firms that announced spin-offs and sell-offs in 1980-2006. The three benchmarks are the value- and equal-weighted CRSP indices and the S&P 500 index. For each divesting firm and the corresponding benchmark HPRs are calculated by compounding monthly returns for months -12 to -1 before divestiture (year -1), for months 1 to 12 after divestiture (year 1), for months 13 to 24 after divestiture (year 2), and for months 25 to 36 after divestiture (year 3). Month 0 is the month when transaction becomes effective for sell-offs and the issue month for spin-offs. If divesting firm is delisted before the end of an event window, HPRs for such firm and corresponding benchmarks are compounded until the delisting date. Benchmark-adjusted HPRs for each divesting firm are calculated as the difference between divesting firm’s HPR and corresponding benchmark’s HPR over the same event window. Significance levels are based on the Wilcoxon signed-rank (rank-sum) test for median levels of benchmark-adjusted HPRs (the difference in median levels of benchmark-adjusted HPRs between the two sub-samples). ***, **, and * indicate statistical significance at the 1, 5, and 10 percent levels, respectively.
Firms Divesting through Spin-Offs
Firms Divesting through Sell-Offs
Difference
Performance measures N Value z-statistic N Value z-statistic in Medians z-statistic Panel A: The median level of benchmark-adjusted holding period returns (HPR) Year -1 HPR adjusted for CRSP VW Index 307 6.06% (3.530)*** 3,193 -7.54% (-10.652)*** 13.60% (6.181)*** Year 1 HPR adjusted for CRSP VW Index 307 -8.51% (-4.534)*** 3,101 -2.11% (-3.058)*** -6.40% (-3.621)*** Year 2 HPR adjusted for CRSP VW Index 294 -10.85% (-4.060)*** 2,883 -3.35% (-4.461)*** -7.50% (-3.159)*** Year 3 HPR adjusted for CRSP VW Index 276 -7.36% (-2.688)*** 2,679 -2.29% (-2.933)*** -5.07% (-2.239)** Year -1 HPR adjusted for CRSP EW Index 307 6.08% (2.981)*** 3,193 -7.10% (-10.459)*** 13.18% (5.729)*** Year 1 HPR adjusted for CRSP EW Index 307 -8.28% (-4.210)*** 3,101 -1.96% (-2.662)*** -6.32% (-3.203)*** Year 2 HPR adjusted for CRSP EW Index 294 -10.54% (-4.332)*** 2,883 -3.70% (-4.889)*** -6.85% (-3.249)*** Year 3 HPR adjusted for CRSP EW Index 276 -4.29% (-2.080)** 2,679 -2.72% (-5.053)*** -1.56% (-0.810) Year -1 HPR adjusted for S&P 500 Index 307 9.59% (4.591)*** 3,193 -5.26% (-7.526)*** 14.85% (6.545)*** Year 1 HPR adjusted for S&P 500 Index 307 -8.24% (-3.692)*** 3,101 -0.15% (-0.294) -8.10% (-3.610)*** Year 2 HPR adjusted for S&P 500 Index 294 -6.76% (-2.981)*** 2,883 -1.28% (-1.377) -5.47% (-2.823)*** Year 3 HPR adjusted for S&P 500 Index 276 -5.18% (-1.930)* 2,679 -0.43% (0.421) -4.75% (-2.341)** Panel B: The median change in benchmark-adjusted holding period returns (HPR)
∆HPR from year -1 to year 1 adjusted for CRSP VW Index 303 -17.29% (-5.672)*** 3,084 1.94% (3.695)*** -19.23% (-6.908)*** ∆HPR from year -1 to year 2 adjusted for CRSP VW Index 290 -16.58% (-5.452)*** 2,856 2.14% (2.192)** -18.72% (-6.340)*** ∆HPR from year -1 to year 3 adjusted for CRSP VW Index 271 -15.46% (-4.449)*** 2,651 2.65% (2.390)** -18.11% (-5.347)*** ∆HPR from year -1 to year 1 adjusted for CRSP EW Index 303 -13.97% (-4.838)*** 3,084 2.56% (4.200)*** -16.53% (-6.090)*** ∆HPR from year -1 to year 2 adjusted for CRSP EW Index 290 -16.89% (-4.848)*** 2,856 3.60% (2.814)*** -20.49% (-5.827)*** ∆HPR from year -1 to year 3 adjusted for CRSP EW Index 271 -10.99% (-3.807)*** 2,651 2.61% (1.856)* -13.60% (-4.438)*** ∆HPR from year -1 to year 1 adjusted for S&P 500 Index 303 -20.41% (-6.075)*** 3,084 1.50% (1.841)* -21.91% (-6.832)*** ∆HPR from year -1 to year 2 adjusted for S&P 500 Index 290 -23.55% (-6.253)*** 2,856 1.08% (-0.178) -24.63% (-6.641)*** ∆HPR from year -1 to year 3 adjusted for S&P 500 Index 271 -18.57% (-4.772)*** 2,651 2.16% (2.093)** -20.74% (-5.685)***
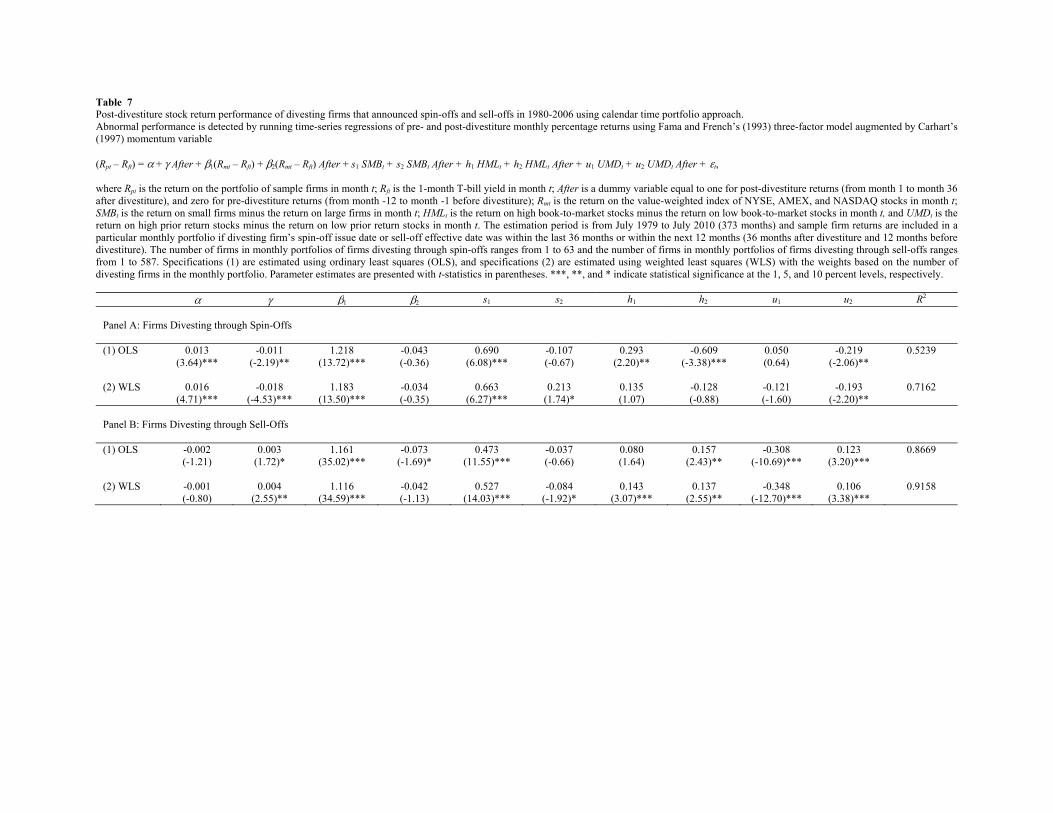
Table 7 Post-divestiture stock return performance of divesting firms that announced spin-offs and sell-offs in 1980-2006 using calendar time portfolio approach. Abnormal performance is detected by running time-series regressions of pre- and post-divestiture monthly percentage returns using Fama and French’s (1993) three-factor model augmented by Carhart’s (1997) momentum variable (Rpt – Rft) = α + γ After + β1(Rmt – Rft) + β2(Rmt – Rft) After + s1 SMBt + s2 SMBt After + h1 HMLt + h2 HMLt After + u1 UMDt + u2 UMDt After + εt,
where Rpt is the return on the portfolio of sample firms in month t; Rft is the 1-month T-bill yield in month t; After is a dummy variable equal to one for post-divestiture returns (from month 1 to month 36 after divestiture), and zero for pre-divestiture returns (from month -12 to month -1 before divestiture); Rmt is the return on the value-weighted index of NYSE, AMEX, and NASDAQ stocks in month t; SMBt is the return on small firms minus the return on large firms in month t; HMLt is the return on high book-to-market stocks minus the return on low book-to-market stocks in month t, and UMDt is the return on high prior return stocks minus the return on low prior return stocks in month t. The estimation period is from July 1979 to July 2010 (373 months) and sample firm returns are included in a particular monthly portfolio if divesting firm’s spin-off issue date or sell-off effective date was within the last 36 months or within the next 12 months (36 months after divestiture and 12 months before divestiture). The number of firms in monthly portfolios of firms divesting through spin-offs ranges from 1 to 63 and the number of firms in monthly portfolios of firms divesting through sell-offs ranges from 1 to 587. Specifications (1) are estimated using ordinary least squares (OLS), and specifications (2) are estimated using weighted least squares (WLS) with the weights based on the number of divesting firms in the monthly portfolio. Parameter estimates are presented with t-statistics in parentheses. ***, **, and * indicate statistical significance at the 1, 5, and 10 percent levels, respectively.
α γ β1 β2 s1 s2 h1 h2 u1 u2 R2
Panel A: Firms Divesting through Spin-Offs
(1) OLS 0.013 -0.011 1.218 -0.043 0.690 -0.107 0.293 -0.609 0.050 -0.219 0.5239 (3.64)*** (-2.19)** (13.72)*** (-0.36) (6.08)*** (-0.67) (2.20)** (-3.38)*** (0.64) (-2.06)** (2) WLS 0.016 -0.018 1.183 -0.034 0.663 0.213 0.135 -0.128 -0.121 -0.193 0.7162 (4.71)*** (-4.53)*** (13.50)*** (-0.35) (6.27)*** (1.74)* (1.07) (-0.88) (-1.60) (-2.20)** Panel B: Firms Divesting through Sell-Offs
(1) OLS -0.002 0.003 1.161 -0.073 0.473 -0.037 0.080 0.157 -0.308 0.123 0.8669 (-1.21) (1.72)* (35.02)*** (-1.69)* (11.55)*** (-0.66) (1.64) (2.43)** (-10.69)*** (3.20)*** (2) WLS -0.001 0.004 1.116 -0.042 0.527 -0.084 0.143 0.137 -0.348 0.106 0.9158 (-0.80) (2.55)** (34.59)*** (-1.13) (14.03)*** (-1.92)* (3.07)*** (2.55)** (-12.70)*** (3.38)***
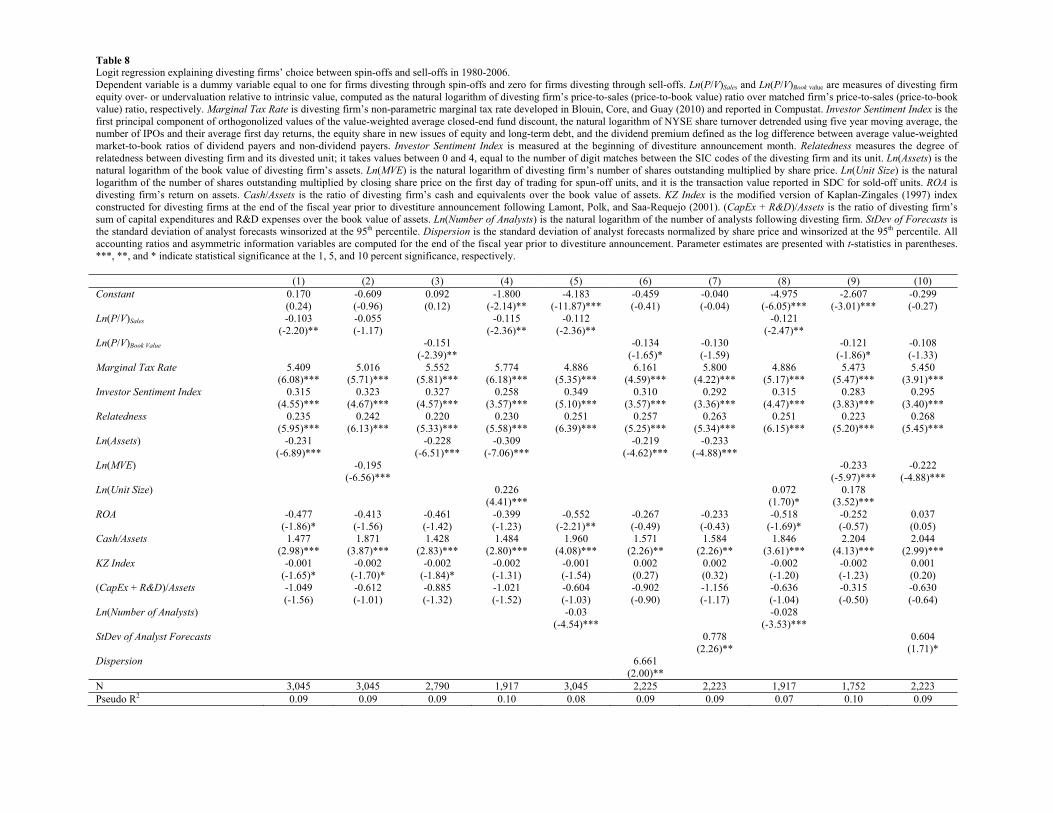
Table 8 Logit regression explaining divesting firms’ choice between spin-offs and sell-offs in 1980-2006. Dependent variable is a dummy variable equal to one for firms divesting through spin-offs and zero for firms divesting through sell-offs. Ln(P/V)Sales and Ln(P/V)Book value are measures of divesting firm equity over- or undervaluation relative to intrinsic value, computed as the natural logarithm of divesting firm’s price-to-sales (price-to-book value) ratio over matched firm’s price-to-sales (price-to-book value) ratio, respectively. Marginal Tax Rate is divesting firm’s non-parametric marginal tax rate developed in Blouin, Core, and Guay (2010) and reported in Compustat. Investor Sentiment Index is the first principal component of orthogonolized values of the value-weighted average closed-end fund discount, the natural logarithm of NYSE share turnover detrended using five year moving average, the number of IPOs and their average first day returns, the equity share in new issues of equity and long-term debt, and the dividend premium defined as the log difference between average value-weighted market-to-book ratios of dividend payers and non-dividend payers. Investor Sentiment Index is measured at the beginning of divestiture announcement month. Relatedness measures the degree of relatedness between divesting firm and its divested unit; it takes values between 0 and 4, equal to the number of digit matches between the SIC codes of the divesting firm and its unit. Ln(Assets) is the natural logarithm of the book value of divesting firm’s assets. Ln(MVE) is the natural logarithm of divesting firm’s number of shares outstanding multiplied by share price. Ln(Unit Size) is the natural logarithm of the number of shares outstanding multiplied by closing share price on the first day of trading for spun-off units, and it is the transaction value reported in SDC for sold-off units. ROA is divesting firm’s return on assets. Cash/Assets is the ratio of divesting firm’s cash and equivalents over the book value of assets. KZ Index is the modified version of Kaplan-Zingales (1997) index constructed for divesting firms at the end of the fiscal year prior to divestiture announcement following Lamont, Polk, and Saa-Requejo (2001). (CapEx + R&D)/Assets is the ratio of divesting firm’s sum of capital expenditures and R&D expenses over the book value of assets. Ln(Number of Analysts) is the natural logarithm of the number of analysts following divesting firm. StDev of Forecasts is the standard deviation of analyst forecasts winsorized at the 95th percentile. Dispersion is the standard deviation of analyst forecasts normalized by share price and winsorized at the 95th percentile. All accounting ratios and asymmetric information variables are computed for the end of the fiscal year prior to divestiture announcement. Parameter estimates are presented with t-statistics in parentheses. ***, **, and * indicate statistical significance at the 1, 5, and 10 percent significance, respectively. (1) (2) (3) (4) (5) (6) (7) (8) (9) (10) Constant 0.170 -0.609 0.092 -1.800 -4.183 -0.459 -0.040 -4.975 -2.607 -0.299 (0.24) (-0.96) (0.12) (-2.14)** (-11.87)*** (-0.41) (-0.04) (-6.05)*** (-3.01)*** (-0.27) Ln(P/V)Sales -0.103 -0.055 -0.115 -0.112 -0.121 (-2.20)** (-1.17) (-2.36)** (-2.36)** (-2.47)** Ln(P/V)Book Value -0.151 -0.134 -0.130 -0.121 -0.108 (-2.39)** (-1.65)* (-1.59) (-1.86)* (-1.33) Marginal Tax Rate 5.409 5.016 5.552 5.774 4.886 6.161 5.800 4.886 5.473 5.450 (6.08)*** (5.71)*** (5.81)*** (6.18)*** (5.35)*** (4.59)*** (4.22)*** (5.17)*** (5.47)*** (3.91)*** Investor Sentiment Index 0.315 0.323 0.327 0.258 0.349 0.310 0.292 0.315 0.283 0.295 (4.55)*** (4.67)*** (4.57)*** (3.57)*** (5.10)*** (3.57)*** (3.36)*** (4.47)*** (3.83)*** (3.40)*** Relatedness 0.235 0.242 0.220 0.230 0.251 0.257 0.263 0.251 0.223 0.268 (5.95)*** (6.13)*** (5.33)*** (5.58)*** (6.39)*** (5.25)*** (5.34)*** (6.15)*** (5.20)*** (5.45)*** Ln(Assets) -0.231 -0.228 -0.309 -0.219 -0.233 (-6.89)*** (-6.51)*** (-7.06)*** (-4.62)*** (-4.88)*** Ln(MVE) -0.195 -0.233 -0.222 (-6.56)*** (-5.97)*** (-4.88)*** Ln(Unit Size) 0.226 0.072 0.178 (4.41)*** (1.70)* (3.52)*** ROA -0.477 -0.413 -0.461 -0.399 -0.552 -0.267 -0.233 -0.518 -0.252 0.037 (-1.86)* (-1.56) (-1.42) (-1.23) (-2.21)** (-0.49) (-0.43) (-1.69)* (-0.57) (0.05) Cash/Assets 1.477 1.871 1.428 1.484 1.960 1.571 1.584 1.846 2.204 2.044 (2.98)*** (3.87)*** (2.83)*** (2.80)*** (4.08)*** (2.26)** (2.26)** (3.61)*** (4.13)*** (2.99)*** KZ Index -0.001 -0.002 -0.002 -0.002 -0.001 0.002 0.002 -0.002 -0.002 0.001 (-1.65)* (-1.70)* (-1.84)* (-1.31) (-1.54) (0.27) (0.32) (-1.20) (-1.23) (0.20) (CapEx + R&D)/Assets -1.049 -0.612 -0.885 -1.021 -0.604 -0.902 -1.156 -0.636 -0.315 -0.630 (-1.56) (-1.01) (-1.32) (-1.52) (-1.03) (-0.90) (-1.17) (-1.04) (-0.50) (-0.64) Ln(Number of Analysts) -0.03 -0.028 (-4.54)*** (-3.53)*** StDev of Analyst Forecasts 0.778 0.604 (2.26)** (1.71)* Dispersion 6.661 (2.00)** N 3,045 3,045 2,790 1,917 3,045 2,225 2,223 1,917 1,752 2,223 Pseudo R2 0.09 0.09 0.09 0.10 0.08 0.09 0.09 0.07 0.10 0.09