Embed Size (px)
Citation preview

Spatial Analysis as a Tool for
Landfill Monitoring
Prepared for:
Kasey Kathan, Vermont Solid Waste Management Program
Breck Bowden, ENSC 202 Professor
Project Consultants:
Sam Watson | [email protected]
Chris McCloud |
Thomas Nieuwenhuis | [email protected]
Thomas Hibert | [email protected]

Executive Summary We are one of three groups assessing the risk posed by closed landfills on the Vermont
Landscape to human and environmental health. We’ve developed a model using Geographic
Information Systems which will assess the distance of landfills to potential stressors and
receptors, and prioritize highest risk sites to lowest risk sites for the Kasey Kathan of the
Vermont Agency of Natural Resources. Two other groups are analyzing bi-annual water quality
data from the past 20 years, as well as social impacts and future planning for these landfill
sites. Our efforts will be synthesized into a three part risk assessment tool which will help direct
future management of these sites for the Agency of Natural Resources.
Our spatial analysis will consider the proximity of each landfill to both potential
receptors and other potential stressors. The map is based off a Digital Elevation Model (DEM)
for Vermont and landfill coordinates, and all layers were acquired from the Vermont Center for
Geographic Information website (VCGI). Since group two is calculating risk based on measured
pollutant concentrations, we are assessing what receptors those pollutants threaten, namely
surface waters using vermont lakes and streams inputs. We are also looking at land cover data in
up-gradient drainage basins from each landfill, highlighting impervious surface area as potential
sources of heavy metal and solvent pollutants. Finally, using a Geologic Soils of Vermont layer,
we highlight whether soils upgradient from each landfill are hydric or non-hydric. This serves as
an indicator of well drained leachate plumes or stagnation of leachate plumes.
Introduction Before the era of environmental regulations pertaining to waste management, hundreds of
small landfills operated throughout Vermont. Most municipalities had sites to dispose of solid
wastes ranging from food scraps and paper to chemicals and old cars. In 1987 Vermont passed
Act 78, a solid waste management initiative to reduce and manage the amount of waste affecting
the environment (VT ANR). Act 78 mandated the closing of all operating landfills within
Vermont, approximately 359, based on federal regulations. Of these, 59 sites were large enough
sites to attract the attention of the Vermont Agency of Natural Resources. Together with
municipalities and environmental consultants, bi-annual data on water quality has been collected
for most of these sites. The data is inconsistent across all 59 sites because different consulting
firms were hired by municipalities and the ANR to assess each landfill. Some landfills having
little to no data while others have complete schematics of topography, groundwater elevations
and flow, such as reports from Stone Environmental Group.
Our most important parameter in assessing the impacts of these landfills has been water
quality measurement, using Vermont’s Natural Resources Board water quality standards as a
baseline. We chose water quality because of water’s unique properties to transport and activate
pollutants, and it’s immediate ecological uptake around landfill sites. According to the data
Kasey Kathan provided us, most of these landfills are unlined municipal solid waste disposal
sites, containing heavy metals and solvents dating back to the early 1900’s. As water penetrates
the landfill and then exits in leachate plumes, redox reactions and dissolution of municipal solid
waste occurs within the landfill, contaminating the groundwater flowing out of the landfills
(Lyngkilde et.al). Some potential receptors of these contaminants include surface, residential
and communal wells, and agricultural fields. The VT ANR currently manages and maintains 59
landfills across the state, and believes that many of them are in suitable condition for re-
purposing, and do not require future monitoring of water quality. Proving that these landfills
pose little to no threat to environmental and human health is a challenging task for the agency. It

is in the best interest of both the state and local municipalities to assess the risk these landfills
pose completely and openly. It is our task to develop a risk assessment model, focusing of
spatial distribution of potential stressors and receptors, to rank which landfills require continued
attention, and in which discontinued monitoring programs would be appropriate.
Background It is well know that landfills can be a stressor on the environment; their magnitudes of
stress can vary depending their contents and how well the landfill is sealed. Subsurface migration
of groundwater through the landfill can collect heavy metals and toxins. This is one of the most
prominent ways a landfill can inflict stress upon a natural community. Receptors of polluted
water include aquatic organisms and vegetation, as well as terrestrial vegetation whose taproots
access the water and organisms that uses the polluted water for drinking. (EPA)
The groundwater quality of most of landfills that VT ANR manages have been monitored
since they were closed approximately 20 years ago.(Kathan) One problem is that many landfills
lack monitoring wells upgradient from the landfill, which makes it impossible to know if the
groundwater is already polluted before passing through the landfill. In this case it would be
beneficial to identify areas upgradient that could potentially be stressors, such as large areas of
impervious surfaces, agricultural operations, factories or other point sources. Landfills can also
inflict stress by emitting gases like methane into the atmosphere, contributing to global climate
change and can also be a nuisance for nearby residents and businesses. Pollutants in the soil can
affect microorganisms and insects living in the soil, and there is potential for them to move
through trophic levels to human consumption. (EPA)
Methods For the statewide spatial model, we are using ArcGIS (Geographic Information System)
from the Rubenstein Geospatial Lab to analyze and manipulate several datasets. As noted above,
we used six input data layers (Table 1 below) to create a model that would produce land cover
and soil data, as well as data pertaining to surface water proximity for each landfill.
Table 1: Input Data Layers
Data Layer Source Data Type
Digital Elevation Model USGS Raster (30 meter)
Geologic Soils VCGI Vector Polygon
Lakes VCGI Vector Polygon
Land Cover USGC NLCD Raster (30 meter)
Streams USGS NHD Vector Line
Vermont Towns VCGI Vector Polygon
Before the model can run, the input data layers needed to be prepared and formatted. The
land cover data from USGS came in four separate rasters, all of which covered sections of
Vermont, as well as parts of Quebec, New Hampshire, Massachusetts, and New York. The first
step in preparing this data was projecting each of the rasters into the NAD 83 Vermont State

Plane Coordinate System in ArcMap. Once the images were projected, they were mosaiced
together in ERDAS Imagine using the Nadir seamline method. This mosaiced raster (which now
completely encompassed the state of Vermont and regions of surrounding states) was clipped to
the Vermont state boundaries using the extract by mask tool in ArcMap. The same process was
performed on the Digital Elevation Model.
Once the raster datasets were formatted correctly, the Geologic Soils data was prepared.
This data came in 14 different shapefiles, (one for each Vermont country). Within the attribute
tables of these shapefiles were two fields that pertained to the analysis: “Hydric” and
“Hydrogroup”. The first step in preparing the soil data was dissolving the Hydric and
Hydrogroup fields in each of the 14 shapefiles to consolidate their records into multipart
polygons. After the shapefiles were dissolved, they were merged together to form one shapefile
containing geologic soil data for the whole State of Vermont. Within the attribute table we added
a field titled “SoilCode” and populated it as shown below. Creating the SoilCode field that
references both Hydric and Hydrogroup data makes the analysis process less complex. The
breakdowns and descriptions for the soil data can be seen below in Table 2. With the data
prepared, we created a model that produces a point layer of each landfill site, polygon data of
each landfill’s watershed, land cover and soil quality data for each watershed, and distance to
closest surface water feature.
Table 2. SoilCode legend
Hydric Hydrogroup SoilCode Suitability for Landfill Siting
N A 1 Acceptable
N B 2 Good
N C 3 Acceptable
N D 4 Poor
N Not rated 5 Acceptable
U D 6 Very Poor
U Not rated 7 Poor
W Water 8 Unacceptable
Y B 9 Acceptable
Y C 10 Poor
Y D 11 Unacceptable
Y Not rated 12 Poor
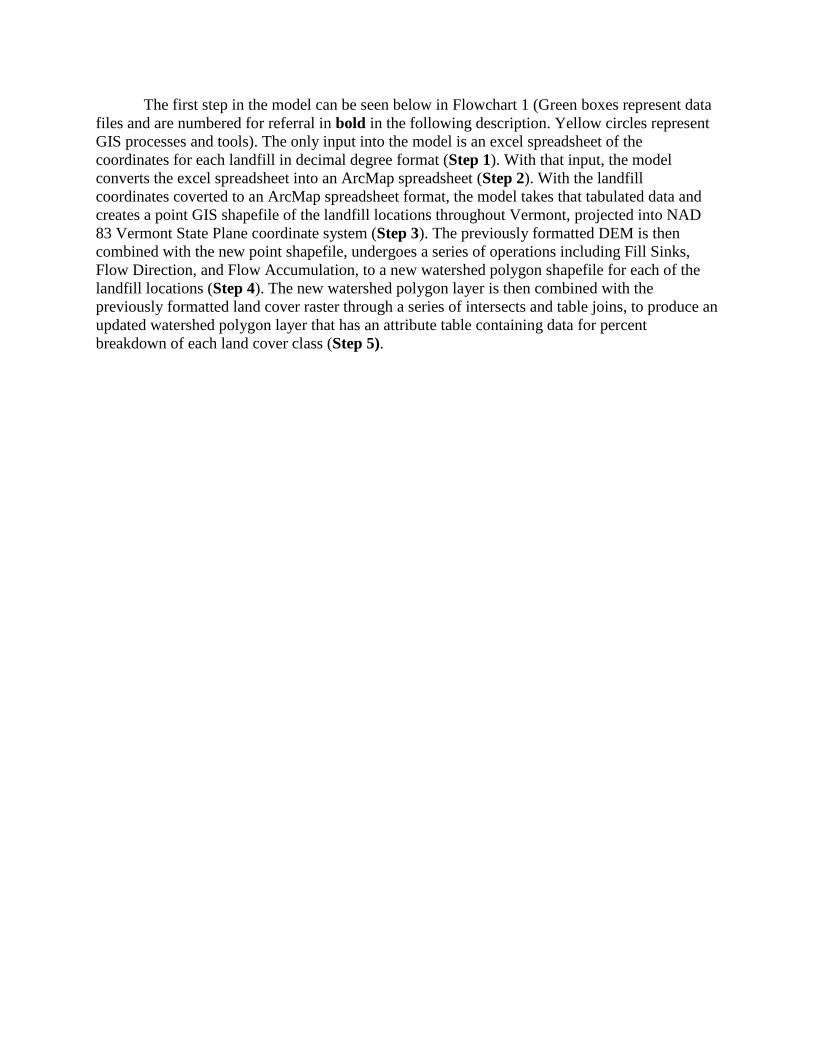
The first step in the model can be seen below in Flowchart 1 (Green boxes represent data
files and are numbered for referral in bold in the following description. Yellow circles represent
GIS processes and tools). The only input into the model is an excel spreadsheet of the
coordinates for each landfill in decimal degree format (Step 1). With that input, the model
converts the excel spreadsheet into an ArcMap spreadsheet (Step 2). With the landfill
coordinates coverted to an ArcMap spreadsheet format, the model takes that tabulated data and
creates a point GIS shapefile of the landfill locations throughout Vermont, projected into NAD
83 Vermont State Plane coordinate system (Step 3). The previously formatted DEM is then
combined with the new point shapefile, undergoes a series of operations including Fill Sinks,
Flow Direction, and Flow Accumulation, to a new watershed polygon shapefile for each of the
landfill locations (Step 4). The new watershed polygon layer is then combined with the
previously formatted land cover raster through a series of intersects and table joins, to produce an
updated watershed polygon layer that has an attribute table containing data for percent
breakdown of each land cover class (Step 5).

Flowchart 1

The second base of the model, shown below in Flowchart 2, produces soil data for each
landfill location. The first process buffers each landfill location to create .25 mile circle polygons
around each site (Step 6). Similar to Step 5 above, these buffer polygons are then combined with
the previously formatted soil data from VCGI to undergo a series of intersects and table joins to
produce and updated buffer polygon feature class with an attribute table containing data for
percent breakdown of each soil class as described in Table 2 above.
Flowchart 2
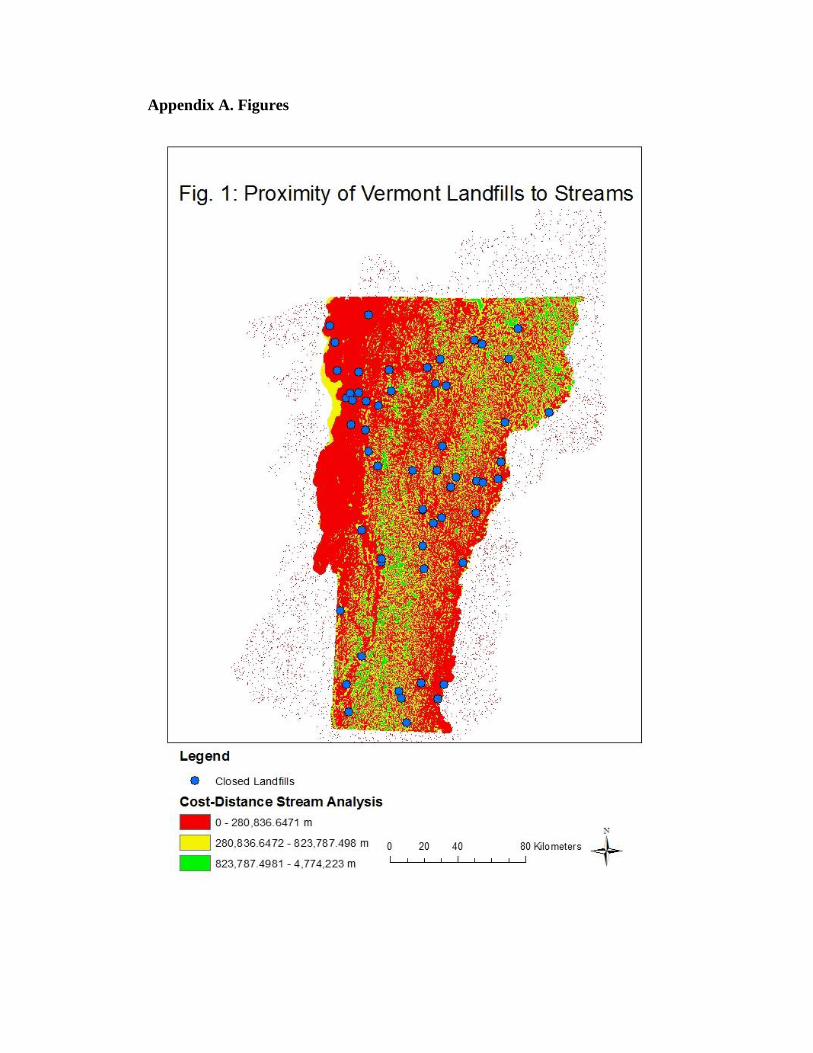
In order to analyze the distance from each landfill to surrounding streams and lakes, a
cost-distance analysis of the distance to streams and lakes for each landfill was
performed. USGS flowline and waterbody layers from the National Hydrographic Database for
Vermont were downloaded from the VCGI website. A decision was made to focus primarily on
streams and rivers, rather than all flowlines present in the flowlines dataset. Consequently, the
stream/river portion of the data layer was exported as its own layer. Next, a cost-distance
analysis was run on each of the stream/river and waterbody data layers. The classification
system for both analyses results were then set up in the same manner. The Natural Breaks
method with 3 classes was applied, with the classes were colored red for those areas closest to
the body of water in question, depending on the layer. Areas farther away from the body of
water were colored yellow, and those farthest away were colored green. Each cost-benefit layer
was then displayed on a map with the landfill points in order to display the location of each
landfill relative to surrounding bodies of water. A map of the whole state as well as large scale
versions centered on each landfill were produced in this manner.
Findings and Discussion What stood out immediately was the general location of Vermont’s landfills. Most are
placed high on the landscape, with relatively low area draining into them. For several sites the

landfill is the highest elevation within its geographic drainage basin. The implications of this are
that pollutants measured below landfills at a topographic high points are almost guaranteed to be
sourced from the landfill.
Besides roadside ditches and seasonal streams, surface waters are an expression of
groundwater tables and flow. Sample maps of the cost-distance analysis on streams (Fig. 1),
water bodies (Fig. 2), the Cambridge landfill stream analysis (Fig. 3) and the Cambridge landfill
water body analysis (Fig. 4) can be seen on the following pages.
One flaw we should note in our spatial study was the lack of critical receptor
mapping. Critical receptors are any ecological system which absorbs, transports, uptakes or
otherwise concentrates pollutants. These receptors are difficult to map because leachate plumes
move with groundwater gradients and not always topographic gradients. While surface waters
were included in the analysis, down-gradient surface waters and wells were not included in our
spatial component of the calculator. The main reason for this was lack of time to compile data
and develop an accurate analysis, as well as a perceived lack of data. We were unsure where to
find reliable well coordinates from each test site, as well as coordinates for municipal wells of
concern. We now know that all wells must be registered with the state when they are dug, so if
the ANR or another group wanted to continue the study the data is available somewhere within
state government.
Appendix A. Figures


Appendix B. Tables
Table 1. Landcover class by percentage of each landfill's watershed
Landfill Name
Watershed
Area
(meters2)
%
Water
%
Developed
Open
Space
%
Developed
Low
Intensity
%
Developed
Medium
Intensity
%
Developed
High
Intensity
% Barren
Land
(Rock/
Clay/
Sand)
%
Forest
% Early
Successional
%
Farmland
%
Wetlands
Bristol Waste
Management,
Inc. 30698 0.00 15.63 0.00 0.00 0.00 0.00 84.38 0.00 0.00 0.00
Lincoln 7015 0.00 0.00 0.00 0.00 0.00 0.00 0.00 44.44 55.56 0.00
Starksboro 40232 0.00 0.00 0.00 0.00 0.00 0.00 9.09 2.27 88.64 0.00
Shaftsbury 37569 0.00 4.65 0.00 0.00 0.00 0.00 2.33 0.00 93.02 0.00
Pownal 7284 0.00 0.00 0.00 0.00 0.00 0.00 0.00 0.00 100.00 0.00 Sunderland
Waste
Management Inc. 12948 0.00 0.00 0.00 0.00 0.00 0.00 0.00 0.00 100.00 0.00
Barnet 34161 0.00 5.41 5.41 0.00 0.00 0.00 86.49 0.00 2.70 0.00
Burlington -
Manhattan 36741 0.00 4.65 11.63 32.56 20.93 0.00 0.00 27.91 2.33 0.00
Charlotte 82831052 1.56 3.00 1.13 0.42 0.05 0.05 49.27 2.82 38.48 3.20
Rathe III ( C) 4819 0.00 0.00 66.67 16.67 0.00 0.00 0.00 0.00 16.67 0.00
Rathe IV 13447 0.00 0.00 0.00 0.00 0.00 0.00 18.75 12.50 37.50 31.25
Essex 19662 0.00 0.00 0.00 0.00 0.00 0.00 13.04 0.00 86.96 0.00
Hinesburg 18222 0.00 0.00 0.00 0.00 0.00 0.00 0.00 0.00 100.00 0.00
Jericho 7521 0.00 0.00 0.00 0.00 0.00 0.00 11.11 11.11 77.78 0.00
Milton 41092 0.00 0.00 0.00 0.00 0.00 0.00 91.49 0.00 8.51 0.00
Underhill 15730 0.00 0.00 0.00 0.00 0.00 0.00 42.11 15.79 42.11 0.00
CSWD Williston 13010 0.00 0.00 0.00 0.00 0.00 0.00 25.00 0.00 56.25 18.75
Highgate 486685 0.00 2.04 0.00 0.00 0.00 0.00 88.52 0.56 7.22 1.67
Simpson
Paper Mill 39500 0.00 28.26 6.52 0.00 0.00 0.00 4.35 0.00 43.48 17.39
Isle La Motte 417630 0.00 45.79 17.93 20.95 8.42 0.00 6.91 0.00 0.00 0.00

Landfill Name
Watershed
Area
(meters2)
%
Water
%
Develope
d Open
Space
%
Develope
d Low
Intensity
%
Develope
d
Medium
Intensity
%
Develope
d High
Intensity
%
Barren
Land
(Rock/Cl
ay/ Sand)
%
Forest
% Early
Succession
al
%
Farmland
%
Wetland
s
South
Burlington
Landfill 16156 0.00 0.00 0.00 0.00 0.00 0.00 0.00 11.76 88.24 0.00
North Hero 4088 0.00 0.00 0.00 0.00 0.00 0.00
100.0
0 0.00 0.00 0.00
South Hero 5535 0.00 0.00 0.00 0.00 0.00 0.00 0.00 100.00 0.00 0.00
Cambridge 153369 0.00 0.00 0.00 0.00 0.00 0.00 98.22 1.78 0.00 0.00
Eden 820862 0.00 5.93 10.43 3.07 0.00 0.00 37.98 8.89 33.37 0.33
Johnson 38522 0.00 0.00 0.00 0.00 0.00 0.00 29.55 0.00 70.45 0.00 Lamoille
Landfill and Salvage 48448 0.00 5.56 0.00 0.00 0.00 0.00 66.67 0.00 27.78 0.00
Wolcott 4435973 0.00 3.37 0.00 0.00 0.00 0.00 88.22 2.05 6.05 0.30
Chelsea 8237 0.00 0.00 0.00 0.00 0.00 0.00 0.00 0.00 100.00 0.00
Hayward 404435 0.00 9.31 1.33 0.00 0.00 0.00 86.92 1.33 1.11 0.00
Newbury 18578 0.00 0.00 0.00 0.00 0.00 0.00 0.00 57.14 0.00 42.86
Randolph 17778 0.00 0.00 0.00 0.00 0.00 65.00 0.00 35.00 0.00 0.00
Vermont
Castings Inc. 33861 0.00 0.00 0.00 0.00 0.00 0.00 2.63 0.00 97.37 0.00
Upper Valley 6480 0.00 0.00 0.00 0.00 0.00 0.00 87.50 0.00 12.50 0.00
Tunbridge 17546 0.00 0.00 15.00 0.00 0.00 0.00 70.00 15.00 0.00 0.00
Washington 16293 0.00 0.00 0.00 0.00 0.00 38.89 0.00 22.22 38.89 0.00
CPM Paper
Sludge 101165 0.00 0.00 0.00 0.00 0.00 0.00 61.95 1.77 36.28 0.00
Williamstown 885156 0.00 4.49 0.00 0.00 0.00 0.00 74.82 0.00 20.69 0.00
Barton 41247 0.00 2.17 8.70 34.78 0.00 0.00 21.74 23.91 8.70 0.00
Irasburg 35369 0.00 0.00 0.00 0.00 0.00 0.00 82.05 17.95 0.00 0.00
Morgan 88386 0.00 0.00 0.00 0.00 0.00 0.00 94.85 5.15 0.00 0.00
Westmore 77590 0.00 0.00 0.00 0.00 0.00 0.00 0.00 8.05 91.95 0.00

Landfill Name
Watershed
Area
(meters2)
%
Water
%
Develope
d Open
Space
%
Develope
d Low
Intensity
%
Develope
d
Medium
Intensity
%
Develope
d High
Intensity
%
Barren
Land
(Rock/Cl
ay/ Sand)
%
Forest
% Early
Succession
al
%
Farmland
%
Wetland
s
Brandon 831778 2.17 2.06 4.33 3.36 1.41 1.08 45.40 8.02 17.33 14.84
Pawlet 8556 0.00 50.00 0.00 0.00 0.00 0.00 0.00 0.00 50.00 0.00
Rutland City 6906 0.00 0.00 0.00 0.00 0.00 0.00 0.00 0.00 100.00 0.00
Rutland
Town 241157 0.00 1.49 0.00 0.00 0.00 0.00 77.61 0.00 20.90 0.00
CV Landfill 30262510 0.16 2.46 0.95 0.17 0.00 0.04 92.00 2.18 0.99 1.05
Gross
Landfill 43783 0.00 0.00 37.50 35.42 0.00 27.08 0.00 0.00 0.00 0.00
WSWMD
Landfill 1600548 0.00 5.06 1.57 0.00 0.00 0.28 87.63 2.36 2.70 0.39
Dover 24267869 0.13 3.78 0.40 0.06 0.03 0.00 87.10 0.22 5.31 2.96
Halifax 3803823 0.00 3.01 0.09 0.00 0.00 0.00 89.89 0.17 5.45 1.40
Newfane 11122 46.15 7.69 0.00 23.08 0.00 0.00 0.00 0.00 23.08 0.00
Putney Paper 171343 0.00 3.14 1.05 0.00 0.00 0.00 78.01 0.00 17.80 0.00
Wilmington 8432 0.00 0.00 0.00 0.00 0.00 0.00
100.0
0 0.00 0.00 0.00
Barnard 11850 0.00 0.00 0.00 7.14 0.00 0.00 14.29 0.00 78.57 0.00
Bethel/
Royalton 289548 0.00 0.00 0.00 0.00 0.00 0.00 97.82 0.00 0.62 1.56
Bridgewater 13235 0.00 0.00 0.00 0.00 0.00 0.00 0.00 0.00 100.00 0.00

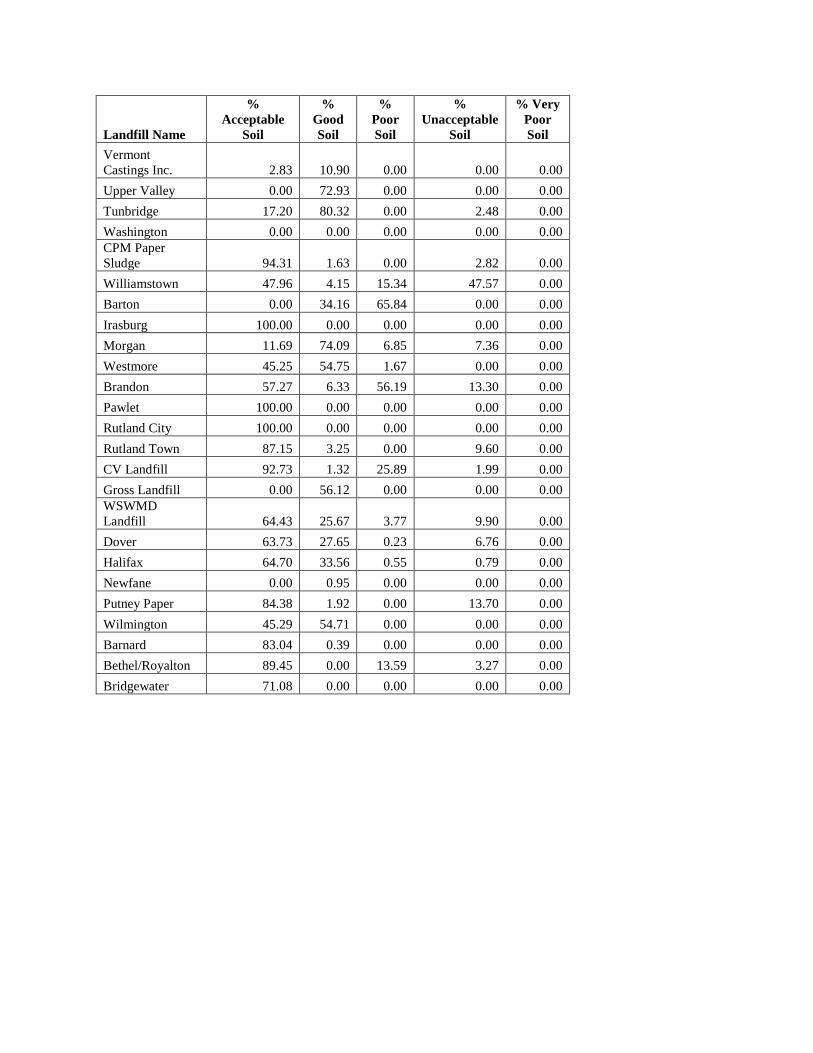
Table 2. Percentage of each soil suitability class
Landfill Name
%
Acceptable
Soil
%
Good
Soil
%
Poor
Soil
%
Unacceptable
Soil
% Very
Poor
Soil
Bristol Waste
Management, Inc. 28.87 29.34 1.94 39.84 0.00
Lincoln 43.72 3.96 0.00 52.32 0.00
Starksboro 2.40 0.00 2.40 0.00 0.00
Shaftsbury 14.37 85.63 0.00 0.00 0.00
Pownal 0.00 100.00 0.00 0.00 0.00
Sunderland
Waste
Management Inc. 87.01 12.99 0.00 0.00 0.00
Barnet 88.63 0.00 11.37 0.00 0.00
Burlington -
Manhattan 0.00 0.00 10.20 0.00 0.00
Charlotte 63.65 3.07 50.83 21.49 0.22
Rathe III ( C) 13.92 0.00 15.99 0.00 0.00
Rathe IV 0.00 18.88 9.68 0.00 0.00
Essex 49.52 0.00 9.15 0.00 0.00
Hinesburg 0.17 0.00 0.17 0.00 0.00
Jericho 0.00 0.00 0.00 0.00 0.00
Milton 72.02 0.00 0.00 0.86 0.00
Underhill 0.00 10.96 0.00 0.00 0.00
CSWD Williston 0.00 0.00 1.26 0.00 0.00
Highgate 27.53 0.00 0.00 72.47 0.00
Simpson Paper Mill 31.03 0.00 0.00 11.75 0.00
Isle La Motte 0.00 21.50 20.04 0.00 0.00
South Burlington
Landfill 84.93 15.07 84.93 0.00 0.00
North Hero 100.00 0.00 100.00 0.00 0.00
South Hero 0.00 0.00 0.00 0.00 0.00
Cambridge 0.00 0.00 0.00 0.00 0.00
Eden 0.00 24.75 9.15 3.33 0.00
Johnson 0.00 44.44 0.00 0.00 0.00
Lamoille Landfill
and Salvage 0.00 0.00 0.00 15.82 0.00
Wolcott 54.36 26.23 0.00 8.41 0.00
Chelsea 0.00 0.00 16.60 0.00 0.00
Hayward 13.20 79.03 0.00 7.76 0.00
Newbury 0.00 17.05 0.00 0.00 0.00
Randolph 0.00 5.62 0.00 0.00 0.00
Landfill Name
%
Acceptable
Soil
%
Good
Soil
%
Poor
Soil
%
Unacceptable
Soil
% Very
Poor
Soil
Vermont
Castings Inc. 2.83 10.90 0.00 0.00 0.00
Upper Valley 0.00 72.93 0.00 0.00 0.00
Tunbridge 17.20 80.32 0.00 2.48 0.00
Washington 0.00 0.00 0.00 0.00 0.00
CPM Paper
Sludge 94.31 1.63 0.00 2.82 0.00
Williamstown 47.96 4.15 15.34 47.57 0.00
Barton 0.00 34.16 65.84 0.00 0.00
Irasburg 100.00 0.00 0.00 0.00 0.00
Morgan 11.69 74.09 6.85 7.36 0.00
Westmore 45.25 54.75 1.67 0.00 0.00
Brandon 57.27 6.33 56.19 13.30 0.00
Pawlet 100.00 0.00 0.00 0.00 0.00
Rutland City 100.00 0.00 0.00 0.00 0.00
Rutland Town 87.15 3.25 0.00 9.60 0.00
CV Landfill 92.73 1.32 25.89 1.99 0.00
Gross Landfill 0.00 56.12 0.00 0.00 0.00
WSWMD
Landfill 64.43 25.67 3.77 9.90 0.00
Dover 63.73 27.65 0.23 6.76 0.00
Halifax 64.70 33.56 0.55 0.79 0.00
Newfane 0.00 0.95 0.00 0.00 0.00
Putney Paper 84.38 1.92 0.00 13.70 0.00
Wilmington 45.29 54.71 0.00 0.00 0.00
Barnard 83.04 0.39 0.00 0.00 0.00
Bethel/Royalton 89.45 0.00 13.59 3.27 0.00
Bridgewater 71.08 0.00 0.00 0.00 0.00

Acknowledgements
We would like thank our professor Breck Bowden and our T.A. Joan White. As well as our
project sponsor Kasey Kathan and the Vermont Agency of Natural Resources. We would also
like to thank Jarlath O’Neil-Dunne for ArcGIS advice.
Literature Citation 1. VT Agency of Natural Resources. “Solid Waste Management Plan”
http://www.anr.state.vt.us/dec/wastediv/solid/pubs/VTSWMgmtPlan.pdf
2. Central Vermont Solid Waste Management District. “About Us”.
http://www.cvswmd.org/about-us.html
3. Chang, Ni-Bin, G. Parvathinathan, and Jeff B. Breeden. "Combining GIS with Fuzzy
Multicriteria Decision-making for Landfill Siting in a Fast-growing Urban Region."
Journal of Environmental Management 87 (2008): 139-53. Science Direct. Elsevier B.V.,
23 Mar. 2007. Web. 17 Feb. 2014.
<http://www.sciencedirect.com.ezproxy.uvm.edu/science/article/pii/S0301479707000230
#>.
4. EPA. "Municipal Solid Waste." Environmental Protection Agency. 28 Feb. 2014.
Web. 27 Apr. 2014.
5. Kathan, Kasey. "Project Consultation Meeting." Personal interview. 21 Jan. 2014.
6. Gorsevski, Pece V., Katerina R. Donevska, Cvetko D. Mitrovski, and Joseph P. Frizado.
"Integrating Multi-criteria Evaluation Techniques with Geographic Information Systems
for Landfill Site Selection: A Case Study Using Ordered Weighted Average." Waste
Management 32.2 (2012): 287-96. Science Direct. Elsevier B.V., 24 Oct. 2011. Web. 17
Feb. 2014.
<http://www.sciencedirect.com.ezproxy.uvm.edu/science/article/pii/S0956053X1100429
6#>.
7. Jensen, John R., Michael E. Hodgson, Maria Garcia-Quijano, Jungho Im, and Jason A. Tullis.
"A Remote Sensing and GIS-assisted Spatial Decision Support System for Hazardous
Waste Site Monitoring." Photogrammetric Engineering & Remote Sensing 75.2 (2009):
169-77. American Society for Photogrammetry and Remote Sensing, Feb. 2009. Web. 17
Feb. 2014.
8. Sumathi, V.R., Usha Natesan, and Chinmoy Sarkar. "GIS-based Approach for Optimizing
Siting of Municipal Solid Waste Landfill." Waste Management 28 (2008): 2146-160.
Science Direct. Elsevier B.V., 3 Dec. 2007. Web. 17 Feb. 2014. <http://ac.els-

cdn.com/S0956053X07003297/1-s2.0-S0956053X07003297-main.pdf?_tid=42ad8f5a-
98ad-11e3-adbd-
00000aacb35e&acdnat=1392735746_eedb16d479c179437a93a8f2b5935565>.
9. Zaranyika, Mark F., L. Mtetwa, S. Zvomuya, G. Gongoraand, and A.S. Mathuthu. "The Effect
of Industrial Effluent and Leachate from Landfills on the Levels of Selected Trace Heavy
Metals in the Waters of Upper and Middle Mukuvisi River in Harare, Zimbabwe."
Bulletin of the Chemical Society of Ethiopia 7.1 (1993): 1-10. African Journals Online. 8
Dec. 1992. Web. 17 Feb. 2014.
<http://www.ajol.info/index.php/bcse/article/view/78407/68767>.
10. John Lyngkilde and Thomas H. Christensen. Journal of Contaminant Hydrology. “Redox
zones of a landfill leachate pollution plume”. December 2nd 1991.
http://www.sciencedirect.com/science/article/pii/0169772292900113
11. Vermont Center for Geographic Information. Data Warehouse February 2014-April 2014.
http://vcgi.vermont.gov/warehouse/search_tools