Embed Size (px)
Citation preview
SPARTON CORP (SPA)
10-Q Quarterly report pursuant to sections 13 or 15(d)
Filed on 11/06/2012Filed Period 09/30/2012
Table of Contents
UNITED STATES
SECURITIES AND EXCHANGE COMMISSIONWASHINGTON, D.C. 20549
FORM 10-Q
x QUARTERLY REPORT PURSUANT TO SECTION 13 OR 15(d) OF THE SECURITIES EXCHANGE ACT OF 1934
For the quarterly period ended September 30, 2012
Or ¨ TRANSITION REPORT PURSUANT TO SECTION 13 OR 15(d) OF THE SECURITIES EXCHANGE ACT OF 1934
For the transition period from to
Commission File Number 1-1000
Sparton Corporation(Exact name of registrant as specified in its charter)
Ohio 38-1054690(State or other jurisdiction of
incorporation or organization)
(I.R.S. EmployerIdentification No.)
425 N. Martingale Road, Suite 2050,Schaumburg, Illinois 60173-2213
(Address of principal executive offices) (Zip code)
(847) 762-5800(Registrant's telephone number, including zip code)
Indicate by check mark whether the registrant (1) has filed all reports required to be filed by Section 13 or 15(d) of the Securities Exchange Act of 1934
during the preceding 12 months (or for such shorter period that the registrant was required to file such reports), and (2) has been subject to such filingrequirements for the past 90 days. Yes x No ¨
Indicate by check mark whether the registrant has submitted electronically and posted on its corporate website, if any, every Interactive Data Filerequired to be submitted and posted pursuant to Rule 405 of Regulation S-T (§232.405 of this chapter) during the preceding 12 months (or such shorter periodthat the registrant was required to submit and post such files). Yes x No ¨
Indicate by check mark whether the registrant is a large accelerated filer, an accelerated filer, a non-accelerated filer, or a smaller reporting company.See the definitions of "large accelerated filer," "accelerated filer" and "smaller reporting company" in Rule 12b-2 of the Exchange Act. (Check one): Large accelerated filer ¨ Accelerated filer xNon-accelerated filer ¨ (Do not check if a smaller reporting company) Smaller reporting company ¨
Indicate by check mark whether the registrant is a shell company (as defined in Rule 12b-2 of the Exchange Act). Yes ¨ No x
As of October 31, 2012, there were 10,233,270 shares of common stock, $1.25 par value per share, outstanding.
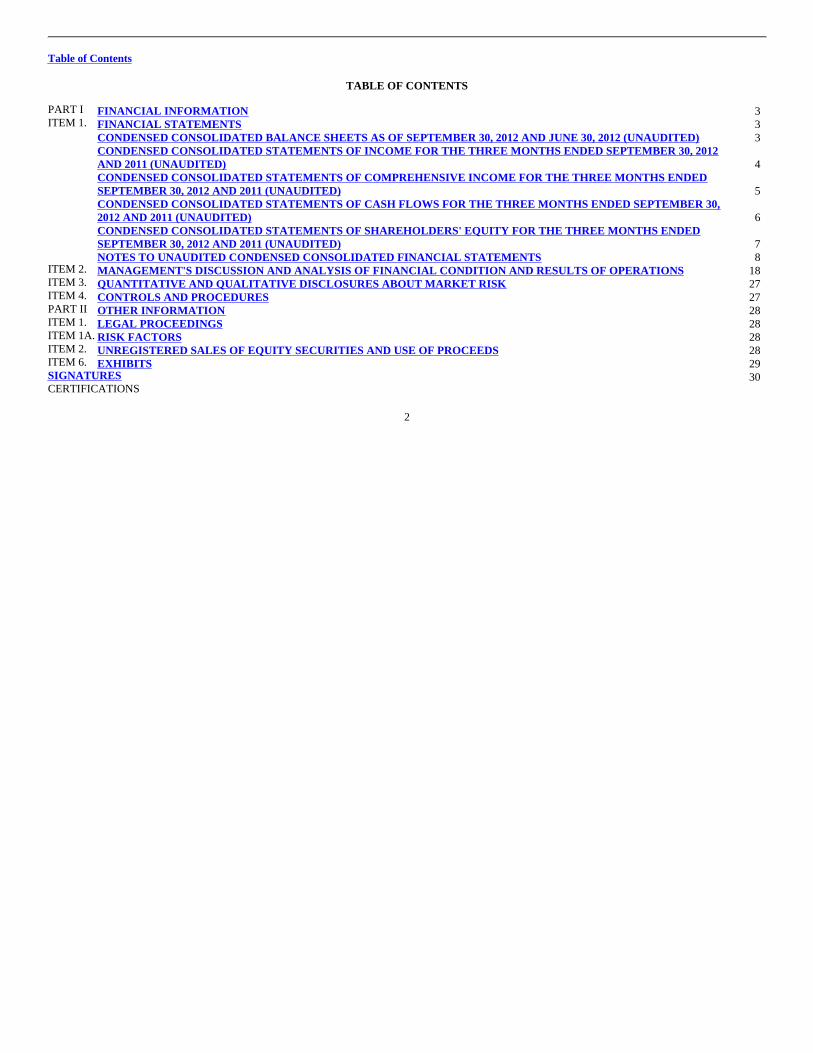
Table of Contents
TABLE OF CONTENTS PART I FINANCIAL INFORMATION 3 ITEM 1. FINANCIAL STATEMENTS 3
CONDENSED CONSOLIDATED BALANCE SHEETS AS OF SEPTEMBER 30, 2012 AND JUNE 30, 2012 (UNAUDITED) 3
CONDENSED CONSOLIDATED STATEMENTS OF INCOME FOR THE THREE MONTHS ENDED SEPTEMBER 30, 2012AND 2011 (UNAUDITED) 4
CONDENSED CONSOLIDATED STATEMENTS OF COMPREHENSIVE INCOME FOR THE THREE MONTHS ENDEDSEPTEMBER 30, 2012 AND 2011 (UNAUDITED) 5
CONDENSED CONSOLIDATED STATEMENTS OF CASH FLOWS FOR THE THREE MONTHS ENDED SEPTEMBER 30,2012 AND 2011 (UNAUDITED) 6
CONDENSED CONSOLIDATED STATEMENTS OF SHAREHOLDERS' EQUITY FOR THE THREE MONTHS ENDEDSEPTEMBER 30, 2012 AND 2011 (UNAUDITED) 7
NOTES TO UNAUDITED CONDENSED CONSOLIDATED FINANCIAL STATEMENTS 8 ITEM 2. MANAGEMENT'S DISCUSSION AND ANALYSIS OF FINANCIAL CONDITION AND RESULTS OF OPERATIONS 18 ITEM 3. QUANTITATIVE AND QUALITATIVE DISCLOSURES ABOUT MARKET RISK 27 ITEM 4. CONTROLS AND PROCEDURES 27 PART II OTHER INFORMATION 28 ITEM 1. LEGAL PROCEEDINGS 28 ITEM 1A. RISK FACTORS 28 ITEM 2. UNREGISTERED SALES OF EQUITY SECURITIES AND USE OF PROCEEDS 28 ITEM 6. EXHIBITS 29 SIGNATURES 30 CERTIFICATIONS
2
Table of Contents
PART I. FINANCIAL INFORMATION
Item 1. Financial Statements.
SPARTON CORPORATION AND SUBSIDIARIESCONDENSED CONSOLIDATED BALANCE SHEETS
(UNAUDITED)(Dollars in thousands, except per share amounts)
September 30,2012
June 30,2012 (a)
Assets Current Assets: Cash and cash equivalents $ 43,096 $ 46,950 Accounts receivable, net of allowance for doubtful accounts of $105 and $146, respectively 25,772 29,618 Inventories and cost of contracts in progress, net 38,467 35,102 Deferred income taxes 2,020 2,020 Prepaid expenses and other current assets 2,042 2,054
Total current assets 111,397 115,744 Property, plant and equipment, net 14,939 14,260 Goodwill 7,472 7,472 Other intangible assets, net 1,517 1,618 Deferred income taxes — non-current 5,067 5,136 Other non-current assets 295 325
Total assets $ 140,687 $144,555
Liabilities and Shareholders' Equity Current Liabilities: Current portion of long-term debt $ 131 $ 131 Accounts payable 16,034 17,152 Accrued salaries and wages 4,727 5,855 Accrued health benefits 1,236 1,210 Current portion of pension liability 158 323 Advance billings on customer contracts 23,338 25,836 Other accrued expenses 5,864 5,890
Total current liabilities 51,488 56,397 Pension liability — non-current portion 1,055 990 Long-term debt — non-current portion 1,506 1,538 Environmental remediation — non-current portion 3,060 3,142
Total liabilities 57,109 62,067 Commitments and contingencies Shareholders' Equity: Preferred stock, no par value; 200,000 shares authorized, none issued — — Common stock, $1.25 par value; 15,000,000 shares authorized, 10,233,270 and 10,105,759 shares issued and outstanding,
respectively 12,792 12,632 Capital in excess of par value 19,534 19,579 Retained earnings 52,948 51,995 Accumulated other comprehensive loss (1,696) (1,718)
Total shareholders' equity 83,578 82,488
Total liabilities and shareholders' equity $ 140,687 $144,555
(a) Derived from the Company's audited financial statements as of June 30, 2012.
See Notes to unaudited condensed consolidated financial statements.
3
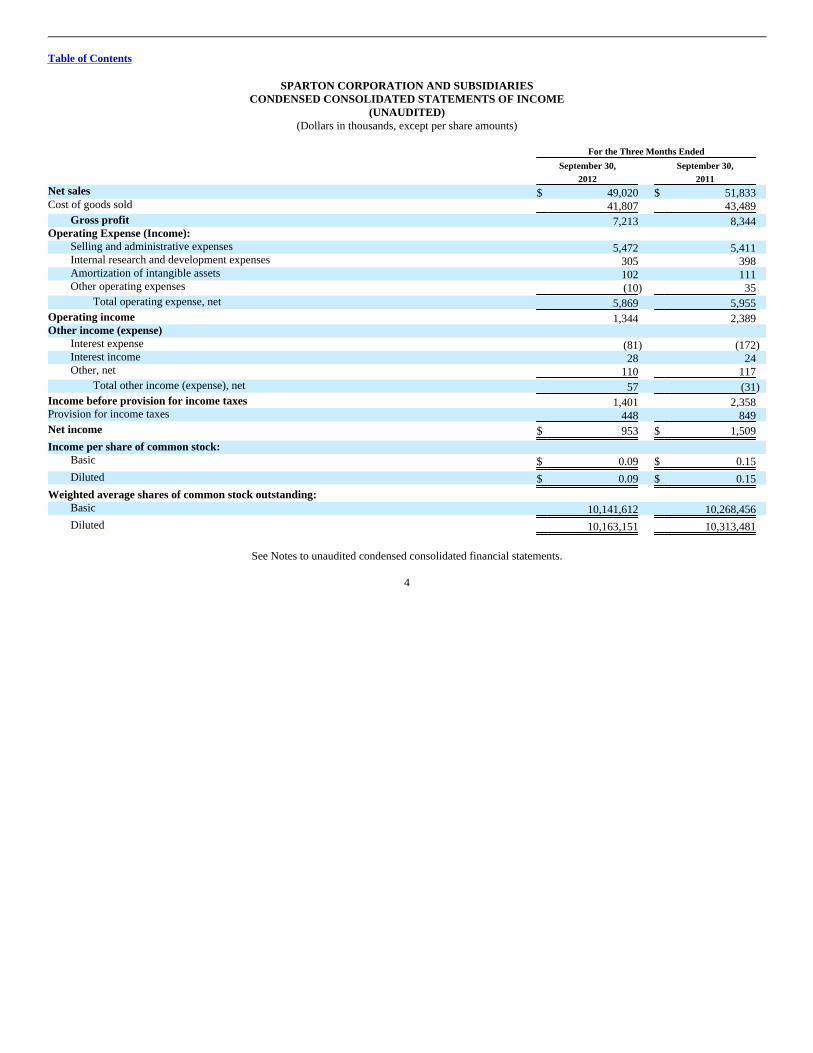
Table of Contents
SPARTON CORPORATION AND SUBSIDIARIESCONDENSED CONSOLIDATED STATEMENTS OF INCOME
(UNAUDITED)(Dollars in thousands, except per share amounts)
For the Three Months Ended
September 30,2012
September 30,2011
Net sales $ 49,020 $ 51,833 Cost of goods sold 41,807 43,489
Gross profit 7,213 8,344 Operating Expense (Income):
Selling and administrative expenses 5,472 5,411 Internal research and development expenses 305 398 Amortization of intangible assets 102 111 Other operating expenses (10) 35
Total operating expense, net 5,869 5,955
Operating income 1,344 2,389 Other income (expense)
Interest expense (81) (172)Interest income 28 24 Other, net 110 117
Total other income (expense), net 57 (31)
Income before provision for income taxes 1,401 2,358 Provision for income taxes 448 849
Net income $ 953 $ 1,509
Income per share of common stock: Basic $ 0.09 $ 0.15
Diluted $ 0.09 $ 0.15
Weighted average shares of common stock outstanding: Basic 10,141,612 10,268,456
Diluted 10,163,151 10,313,481
See Notes to unaudited condensed consolidated financial statements.
4

Table of Contents
SPARTON CORPORATION AND SUBSIDIARIESCONDENSED CONSOLIDATED STATEMENTS OF COMPREHENSIVE INCOME
(UNAUDITED)(Dollars in thousands)
For the Three Months Ended
September 30,2012
September 30,2011
Net income $ 953 $ 1,509 Other comprehensive income — Change in unrecognized pension costs, net of tax 22 85
Comprehensive income $ 975 $ 1,594
5
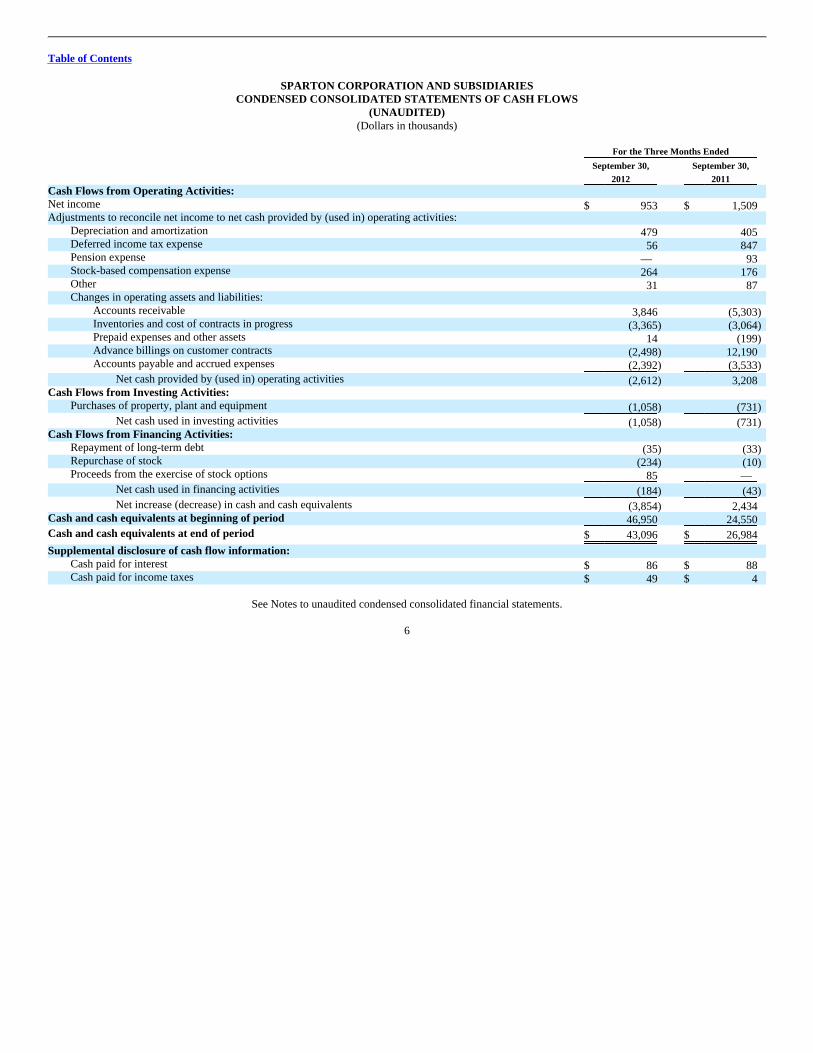
Table of Contents
SPARTON CORPORATION AND SUBSIDIARIESCONDENSED CONSOLIDATED STATEMENTS OF CASH FLOWS
(UNAUDITED)(Dollars in thousands)
For the Three Months Ended
September 30,2012
September 30,2011
Cash Flows from Operating Activities: Net income $ 953 $ 1,509 Adjustments to reconcile net income to net cash provided by (used in) operating activities:
Depreciation and amortization 479 405 Deferred income tax expense 56 847 Pension expense — 93 Stock-based compensation expense 264 176 Other 31 87 Changes in operating assets and liabilities:
Accounts receivable 3,846 (5,303)Inventories and cost of contracts in progress (3,365) (3,064)Prepaid expenses and other assets 14 (199)Advance billings on customer contracts (2,498) 12,190 Accounts payable and accrued expenses (2,392) (3,533)
Net cash provided by (used in) operating activities (2,612) 3,208 Cash Flows from Investing Activities:
Purchases of property, plant and equipment (1,058) (731)
Net cash used in investing activities (1,058) (731)Cash Flows from Financing Activities:
Repayment of long-term debt (35) (33)Repurchase of stock (234) (10) Proceeds from the exercise of stock options 85 —
Net cash used in financing activities (184) (43)
Net increase (decrease) in cash and cash equivalents (3,854) 2,434 Cash and cash equivalents at beginning of period 46,950 24,550
Cash and cash equivalents at end of period $ 43,096 $ 26,984
Supplemental disclosure of cash flow information: Cash paid for interest $ 86 $ 88 Cash paid for income taxes $ 49 $ 4
See Notes to unaudited condensed consolidated financial statements.
6
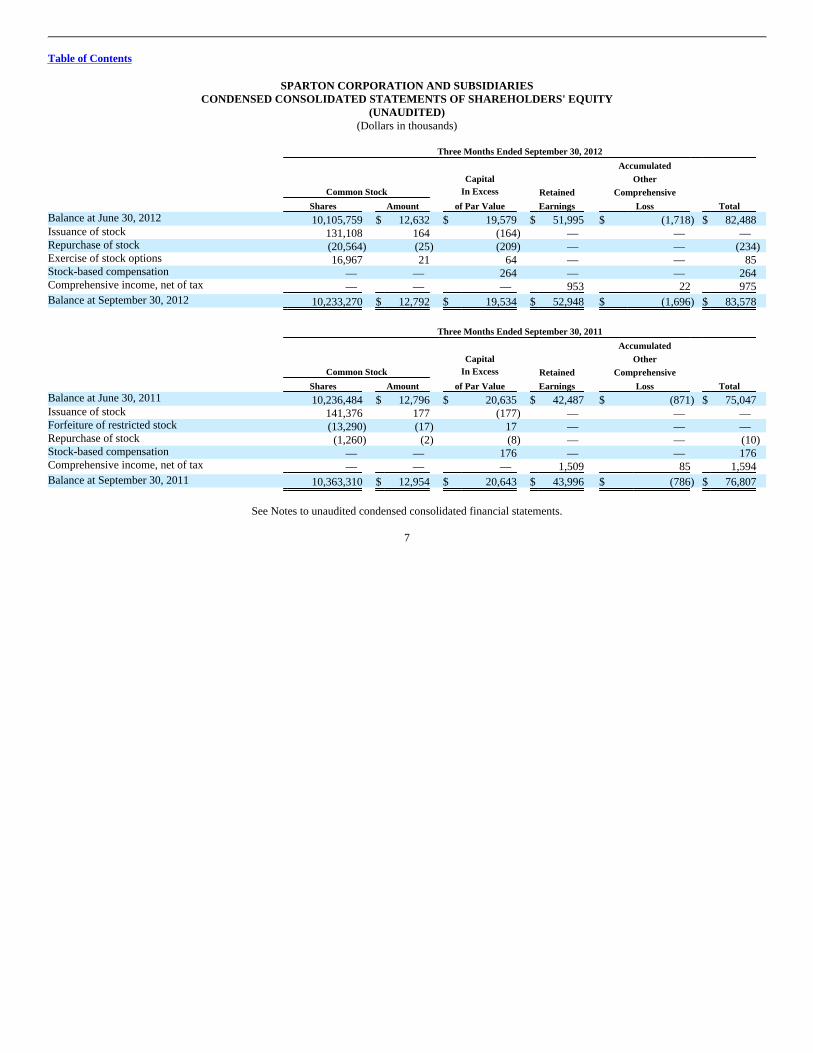
Table of Contents
SPARTON CORPORATION AND SUBSIDIARIESCONDENSED CONSOLIDATED STATEMENTS OF SHAREHOLDERS' EQUITY
(UNAUDITED)(Dollars in thousands)
Three Months Ended September 30, 2012
Common Stock
CapitalIn Excess Retained
AccumulatedOther
Comprehensive
Shares Amount of Par Value Earnings Loss Total Balance at June 30, 2012 10,105,759 $ 12,632 $ 19,579 $ 51,995 $ (1,718) $ 82,488 Issuance of stock 131,108 164 (164) — — — Repurchase of stock (20,564) (25) (209) — — (234) Exercise of stock options 16,967 21 64 — — 85 Stock-based compensation — — 264 — — 264 Comprehensive income, net of tax — — — 953 22 975
Balance at September 30, 2012 10,233,270 $ 12,792 $ 19,534 $ 52,948 $ (1,696) $ 83,578
Three Months Ended September 30, 2011
Common Stock
CapitalIn Excess Retained
AccumulatedOther
Comprehensive
Shares Amount of Par Value Earnings Loss Total Balance at June 30, 2011 10,236,484 $ 12,796 $ 20,635 $ 42,487 $ (871) $ 75,047 Issuance of stock 141,376 177 (177) — — — Forfeiture of restricted stock (13,290) (17) 17 — — — Repurchase of stock (1,260) (2) (8) — — (10) Stock-based compensation — — 176 — — 176 Comprehensive income, net of tax — — — 1,509 85 1,594
Balance at September 30, 2011 10,363,310 $ 12,954 $ 20,643 $ 43,996 $ (786) $ 76,807
See Notes to unaudited condensed consolidated financial statements.
7
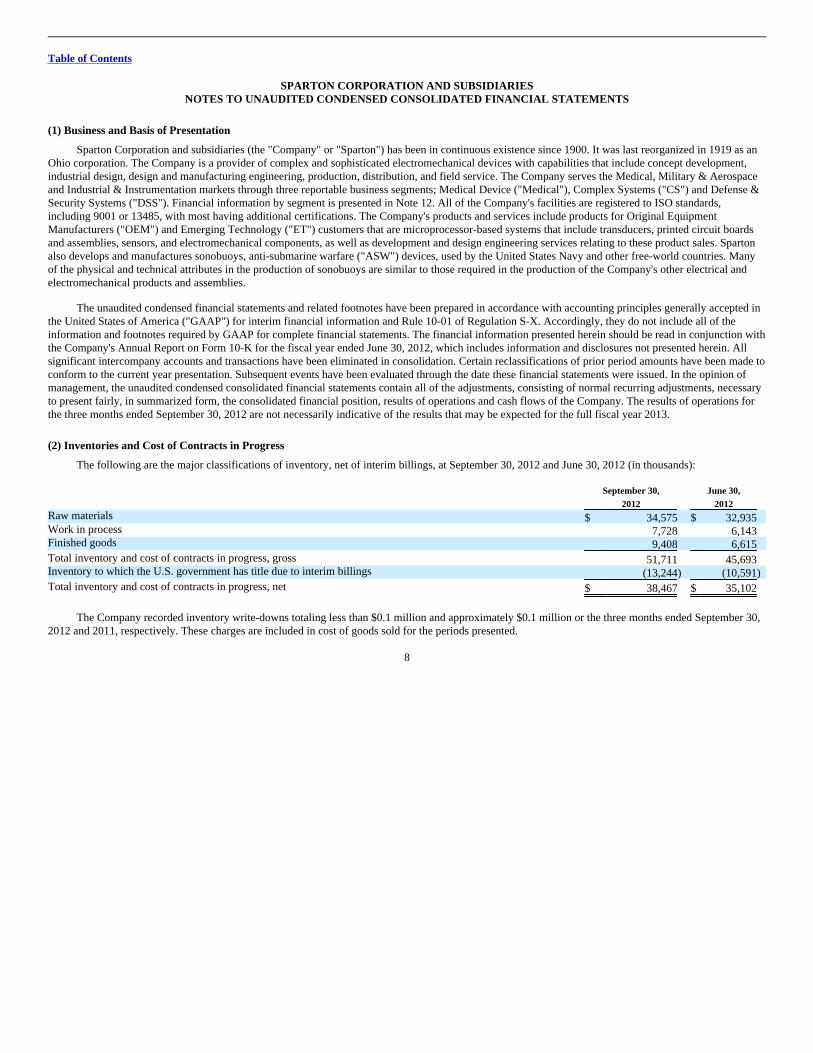
Table of Contents
SPARTON CORPORATION AND SUBSIDIARIESNOTES TO UNAUDITED CONDENSED CONSOLIDATED FINANCIAL STATEMENTS
(1) Business and Basis of Presentation
Sparton Corporation and subsidiaries (the "Company" or "Sparton") has been in continuous existence since 1900. It was last reorganized in 1919 as anOhio corporation. The Company is a provider of complex and sophisticated electromechanical devices with capabilities that include concept development,industrial design, design and manufacturing engineering, production, distribution, and field service. The Company serves the Medical, Military & Aerospaceand Industrial & Instrumentation markets through three reportable business segments; Medical Device ("Medical"), Complex Systems ("CS") and Defense &Security Systems ("DSS"). Financial information by segment is presented in Note 12. All of the Company's facilities are registered to ISO standards,including 9001 or 13485, with most having additional certifications. The Company's products and services include products for Original EquipmentManufacturers ("OEM") and Emerging Technology ("ET") customers that are microprocessor-based systems that include transducers, printed circuit boardsand assemblies, sensors, and electromechanical components, as well as development and design engineering services relating to these product sales. Spartonalso develops and manufactures sonobuoys, anti-submarine warfare ("ASW") devices, used by the United States Navy and other free-world countries. Manyof the physical and technical attributes in the production of sonobuoys are similar to those required in the production of the Company's other electrical andelectromechanical products and assemblies.
The unaudited condensed financial statements and related footnotes have been prepared in accordance with accounting principles generally accepted inthe United States of America ("GAAP") for interim financial information and Rule 10-01 of Regulation S-X. Accordingly, they do not include all of theinformation and footnotes required by GAAP for complete financial statements. The financial information presented herein should be read in conjunction withthe Company's Annual Report on Form 10-K for the fiscal year ended June 30, 2012, which includes information and disclosures not presented herein. Allsignificant intercompany accounts and transactions have been eliminated in consolidation. Certain reclassifications of prior period amounts have been made toconform to the current year presentation. Subsequent events have been evaluated through the date these financial statements were issued. In the opinion ofmanagement, the unaudited condensed consolidated financial statements contain all of the adjustments, consisting of normal recurring adjustments, necessaryto present fairly, in summarized form, the consolidated financial position, results of operations and cash flows of the Company. The results of operations forthe three months ended September 30, 2012 are not necessarily indicative of the results that may be expected for the full fiscal year 2013.
(2) Inventories and Cost of Contracts in Progress
The following are the major classifications of inventory, net of interim billings, at September 30, 2012 and June 30, 2012 (in thousands):
September 30,2012
June 30,2012
Raw materials $ 34,575 $ 32,935 Work in process 7,728 6,143 Finished goods 9,408 6,615
Total inventory and cost of contracts in progress, gross 51,711 45,693 Inventory to which the U.S. government has title due to interim billings (13,244) (10,591)
Total inventory and cost of contracts in progress, net $ 38,467 $ 35,102
The Company recorded inventory write-downs totaling less than $0.1 million and approximately $0.1 million or the three months ended September 30,2012 and 2011, respectively. These charges are included in cost of goods sold for the periods presented.
8
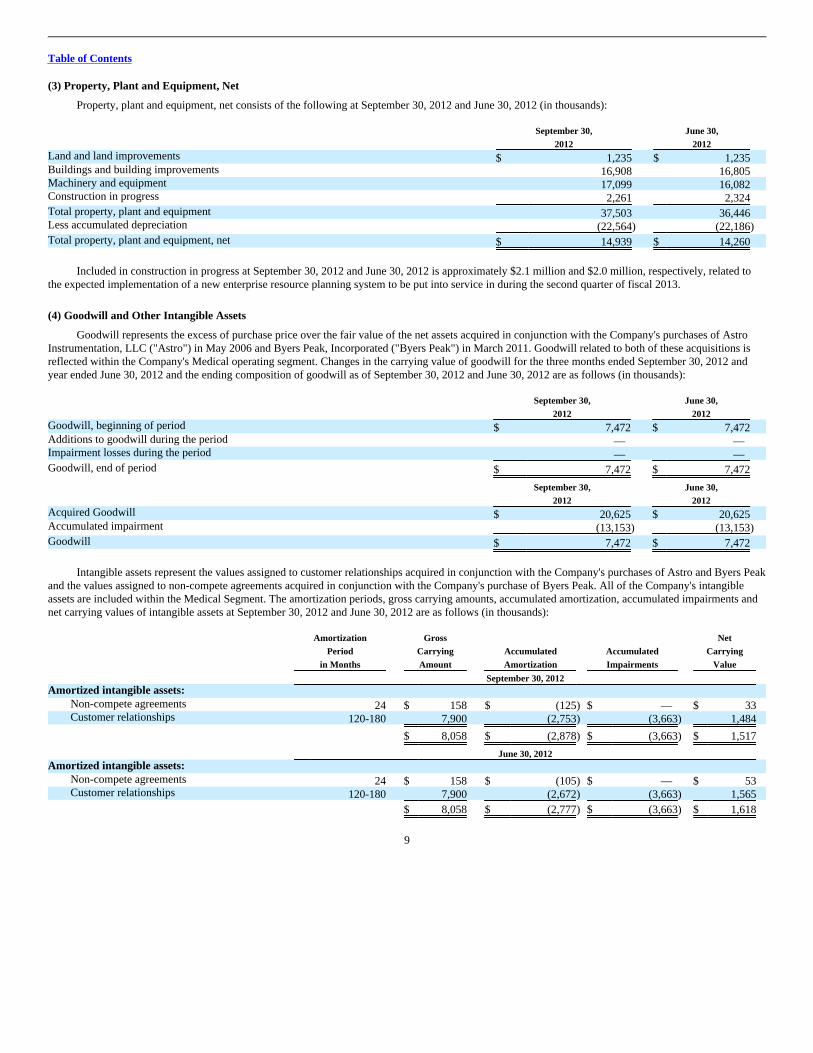
Table of Contents
(3) Property, Plant and Equipment, Net
Property, plant and equipment, net consists of the following at September 30, 2012 and June 30, 2012 (in thousands):
September 30,2012
June 30,2012
Land and land improvements $ 1,235 $ 1,235 Buildings and building improvements 16,908 16,805 Machinery and equipment 17,099 16,082 Construction in progress 2,261 2,324
Total property, plant and equipment 37,503 36,446 Less accumulated depreciation (22,564) (22,186)
Total property, plant and equipment, net $ 14,939 $ 14,260
Included in construction in progress at September 30, 2012 and June 30, 2012 is approximately $2.1 million and $2.0 million, respectively, related tothe expected implementation of a new enterprise resource planning system to be put into service in during the second quarter of fiscal 2013.
(4) Goodwill and Other Intangible Assets
Goodwill represents the excess of purchase price over the fair value of the net assets acquired in conjunction with the Company's purchases of AstroInstrumentation, LLC ("Astro") in May 2006 and Byers Peak, Incorporated ("Byers Peak") in March 2011. Goodwill related to both of these acquisitions isreflected within the Company's Medical operating segment. Changes in the carrying value of goodwill for the three months ended September 30, 2012 andyear ended June 30, 2012 and the ending composition of goodwill as of September 30, 2012 and June 30, 2012 are as follows (in thousands):
September 30,2012
June 30,2012
Goodwill, beginning of period $ 7,472 $ 7,472 Additions to goodwill during the period — — Impairment losses during the period — —
Goodwill, end of period $ 7,472 $ 7,472
September 30,2012
June 30,2012
Acquired Goodwill $ 20,625 $ 20,625 Accumulated impairment (13,153) (13,153)
Goodwill $ 7,472 $ 7,472
Intangible assets represent the values assigned to customer relationships acquired in conjunction with the Company's purchases of Astro and Byers Peakand the values assigned to non-compete agreements acquired in conjunction with the Company's purchase of Byers Peak. All of the Company's intangibleassets are included within the Medical Segment. The amortization periods, gross carrying amounts, accumulated amortization, accumulated impairments andnet carrying values of intangible assets at September 30, 2012 and June 30, 2012 are as follows (in thousands):
AmortizationPeriod
in Months
GrossCarryingAmount
AccumulatedAmortization
AccumulatedImpairments
NetCarrying
Value
September 30, 2012 Amortized intangible assets:
Non-compete agreements 24 $ 158 $ (125) $ — $ 33 Customer relationships 120-180 7,900 (2,753) (3,663) 1,484
$ 8,058 $ (2,878) $ (3,663) $ 1,517
June 30, 2012 Amortized intangible assets:
Non-compete agreements 24 $ 158 $ (105) $ — $ 53 Customer relationships 120-180 7,900 (2,672) (3,663) 1,565
$ 8,058 $ (2,777) $ (3,663) $ 1,618
9
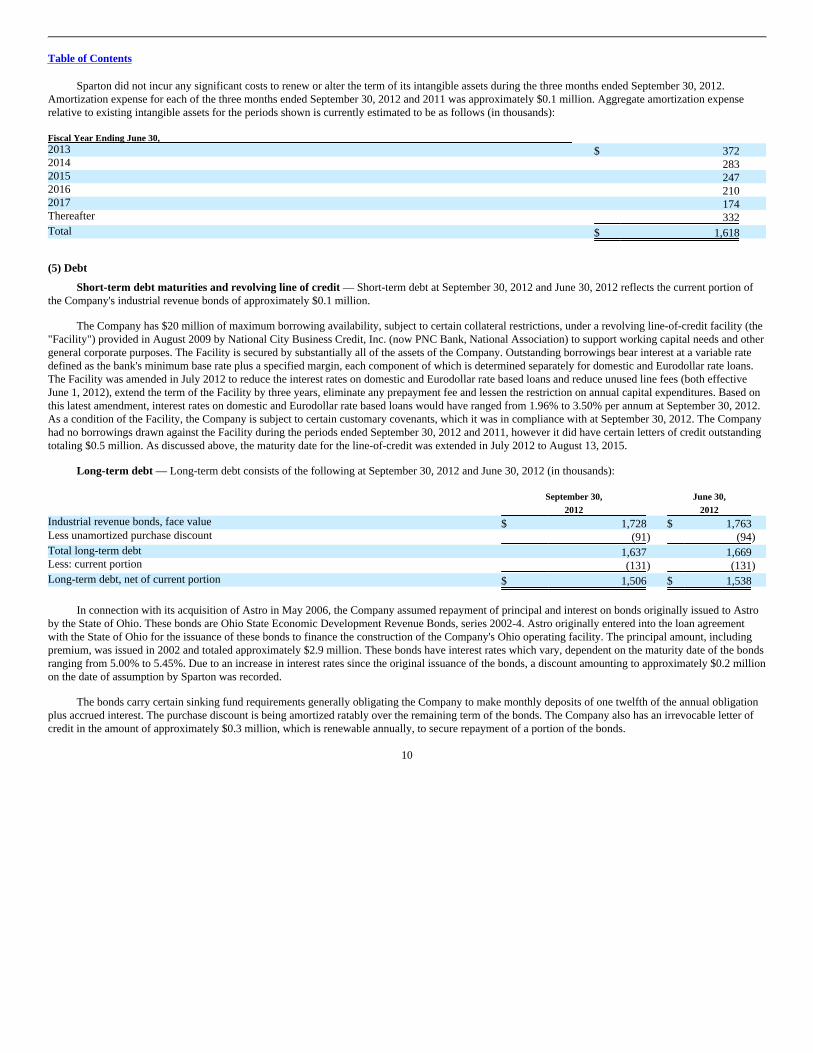
Table of Contents
Sparton did not incur any significant costs to renew or alter the term of its intangible assets during the three months ended September 30, 2012.Amortization expense for each of the three months ended September 30, 2012 and 2011 was approximately $0.1 million. Aggregate amortization expenserelative to existing intangible assets for the periods shown is currently estimated to be as follows (in thousands): Fiscal Year Ending June 30, 2013 $ 372 2014 283 2015 247 2016 210 2017 174 Thereafter 332
Total $ 1,618
(5) Debt
Short-term debt maturities and revolving line of credit — Short-term debt at September 30, 2012 and June 30, 2012 reflects the current portion ofthe Company's industrial revenue bonds of approximately $0.1 million.
The Company has $20 million of maximum borrowing availability, subject to certain collateral restrictions, under a revolving line-of-credit facility (the"Facility") provided in August 2009 by National City Business Credit, Inc. (now PNC Bank, National Association) to support working capital needs and othergeneral corporate purposes. The Facility is secured by substantially all of the assets of the Company. Outstanding borrowings bear interest at a variable ratedefined as the bank's minimum base rate plus a specified margin, each component of which is determined separately for domestic and Eurodollar rate loans.The Facility was amended in July 2012 to reduce the interest rates on domestic and Eurodollar rate based loans and reduce unused line fees (both effectiveJune 1, 2012), extend the term of the Facility by three years, eliminate any prepayment fee and lessen the restriction on annual capital expenditures. Based onthis latest amendment, interest rates on domestic and Eurodollar rate based loans would have ranged from 1.96% to 3.50% per annum at September 30, 2012.As a condition of the Facility, the Company is subject to certain customary covenants, which it was in compliance with at September 30, 2012. The Companyhad no borrowings drawn against the Facility during the periods ended September 30, 2012 and 2011, however it did have certain letters of credit outstandingtotaling $0.5 million. As discussed above, the maturity date for the line-of-credit was extended in July 2012 to August 13, 2015.
Long-term debt — Long-term debt consists of the following at September 30, 2012 and June 30, 2012 (in thousands):
September 30,2012
June 30,2012
Industrial revenue bonds, face value $ 1,728 $ 1,763 Less unamortized purchase discount (91) (94)
Total long-term debt 1,637 1,669 Less: current portion (131) (131)
Long-term debt, net of current portion $ 1,506 $ 1,538
In connection with its acquisition of Astro in May 2006, the Company assumed repayment of principal and interest on bonds originally issued to Astroby the State of Ohio. These bonds are Ohio State Economic Development Revenue Bonds, series 2002-4. Astro originally entered into the loan agreementwith the State of Ohio for the issuance of these bonds to finance the construction of the Company's Ohio operating facility. The principal amount, includingpremium, was issued in 2002 and totaled approximately $2.9 million. These bonds have interest rates which vary, dependent on the maturity date of the bondsranging from 5.00% to 5.45%. Due to an increase in interest rates since the original issuance of the bonds, a discount amounting to approximately $0.2 millionon the date of assumption by Sparton was recorded.
The bonds carry certain sinking fund requirements generally obligating the Company to make monthly deposits of one twelfth of the annual obligationplus accrued interest. The purchase discount is being amortized ratably over the remaining term of the bonds. The Company also has an irrevocable letter ofcredit in the amount of approximately $0.3 million, which is renewable annually, to secure repayment of a portion of the bonds.
10
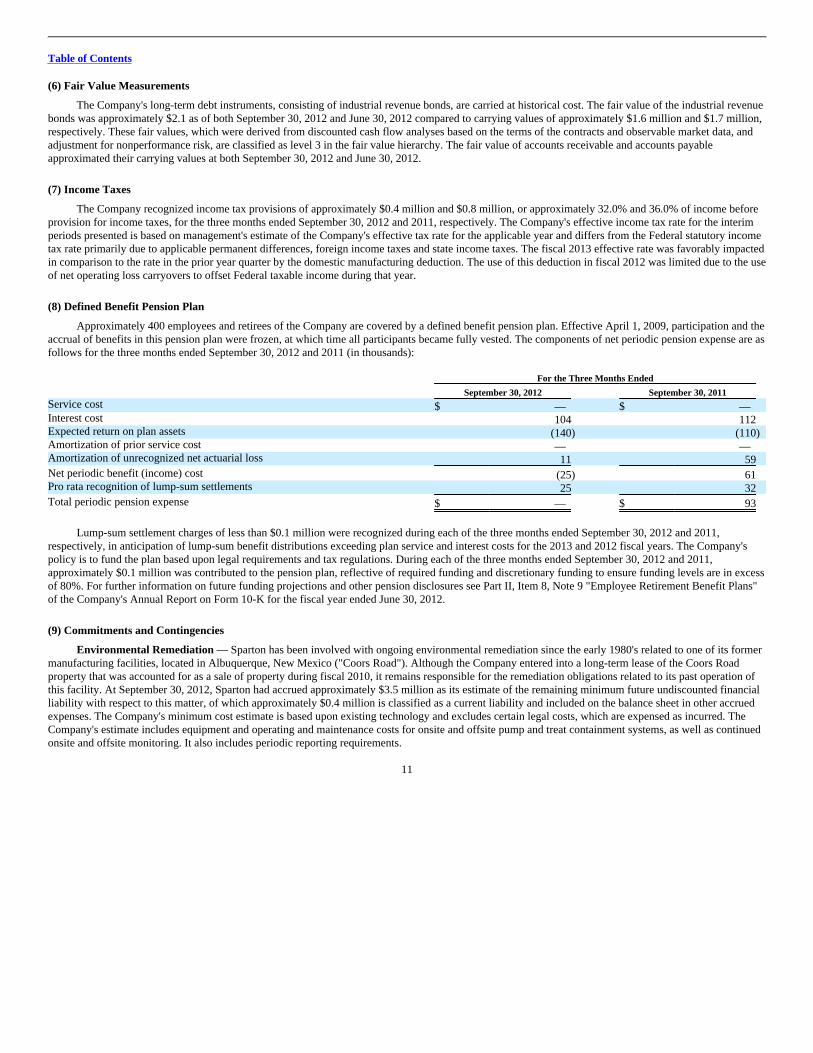
Table of Contents
(6) Fair Value Measurements
The Company's long-term debt instruments, consisting of industrial revenue bonds, are carried at historical cost. The fair value of the industrial revenuebonds was approximately $2.1 as of both September 30, 2012 and June 30, 2012 compared to carrying values of approximately $1.6 million and $1.7 million,respectively. These fair values, which were derived from discounted cash flow analyses based on the terms of the contracts and observable market data, andadjustment for nonperformance risk, are classified as level 3 in the fair value hierarchy. The fair value of accounts receivable and accounts payableapproximated their carrying values at both September 30, 2012 and June 30, 2012.
(7) Income Taxes
The Company recognized income tax provisions of approximately $0.4 million and $0.8 million, or approximately 32.0% and 36.0% of income beforeprovision for income taxes, for the three months ended September 30, 2012 and 2011, respectively. The Company's effective income tax rate for the interimperiods presented is based on management's estimate of the Company's effective tax rate for the applicable year and differs from the Federal statutory incometax rate primarily due to applicable permanent differences, foreign income taxes and state income taxes. The fiscal 2013 effective rate was favorably impactedin comparison to the rate in the prior year quarter by the domestic manufacturing deduction. The use of this deduction in fiscal 2012 was limited due to the useof net operating loss carryovers to offset Federal taxable income during that year.
(8) Defined Benefit Pension Plan
Approximately 400 employees and retirees of the Company are covered by a defined benefit pension plan. Effective April 1, 2009, participation and theaccrual of benefits in this pension plan were frozen, at which time all participants became fully vested. The components of net periodic pension expense are asfollows for the three months ended September 30, 2012 and 2011 (in thousands): For the Three Months Ended
September 30, 2012 September 30, 2011 Service cost $ — $ — Interest cost 104 112 Expected return on plan assets (140) (110)Amortization of prior service cost — — Amortization of unrecognized net actuarial loss 11 59
Net periodic benefit (income) cost (25) 61 Pro rata recognition of lump-sum settlements 25 32
Total periodic pension expense $ — $ 93
Lump-sum settlement charges of less than $0.1 million were recognized during each of the three months ended September 30, 2012 and 2011,respectively, in anticipation of lump-sum benefit distributions exceeding plan service and interest costs for the 2013 and 2012 fiscal years. The Company'spolicy is to fund the plan based upon legal requirements and tax regulations. During each of the three months ended September 30, 2012 and 2011,approximately $0.1 million was contributed to the pension plan, reflective of required funding and discretionary funding to ensure funding levels are in excessof 80%. For further information on future funding projections and other pension disclosures see Part II, Item 8, Note 9 "Employee Retirement Benefit Plans"of the Company's Annual Report on Form 10-K for the fiscal year ended June 30, 2012.
(9) Commitments and Contingencies
Environmental Remediation — Sparton has been involved with ongoing environmental remediation since the early 1980's related to one of its formermanufacturing facilities, located in Albuquerque, New Mexico ("Coors Road"). Although the Company entered into a long-term lease of the Coors Roadproperty that was accounted for as a sale of property during fiscal 2010, it remains responsible for the remediation obligations related to its past operation ofthis facility. At September 30, 2012, Sparton had accrued approximately $3.5 million as its estimate of the remaining minimum future undiscounted financialliability with respect to this matter, of which approximately $0.4 million is classified as a current liability and included on the balance sheet in other accruedexpenses. The Company's minimum cost estimate is based upon existing technology and excludes certain legal costs, which are expensed as incurred. TheCompany's estimate includes equipment and operating and maintenance costs for onsite and offsite pump and treat containment systems, as well as continuedonsite and offsite monitoring. It also includes periodic reporting requirements.
11
Table of Contents
In fiscal 2003, Sparton reached an agreement with the United States Department of Energy ("DOE") and others to recover certain remediation costs.Under the settlement terms, Sparton received cash and obtained some degree of risk protection as the DOE agreed to reimburse Sparton for 37.5% of certainfuture environmental expenses in excess of $8.4 million incurred from the date of settlement, if any, of which approximately $4.3 million has been expendedas of September 30, 2012 toward the $8.4 million threshold. Uncertainties associated with environmental remediation contingencies are pervasive and oftenresult in wide ranges of reasonably possible outcomes. Estimates developed in the early stages of remediation can vary significantly. Normally a finiteestimate of cost does not become fixed and determinable at a specific point in time. Rather, the costs associated with environmental remediation becomeestimable over a continuum of events and activities that help to frame and define a liability. Factors which cause uncertainties for the Company include, butare not limited to, the effectiveness of the current work plans in achieving targeted results and proposals of regulatory agencies for desired methods andoutcomes. It is possible that cash flows and results of operations could be materially affected by the impact of changes associated with the ultimate resolutionof this contingency. At September 30, 2012, the Company estimates that it is reasonably possible, but not probable, that future environmental remediationcosts associated with the Company's past operations at the Coors Road property, in excess of amounts already recorded and net of DOE reimbursement, couldbe up to $2.4 million before income taxes over the next eighteen years.
The Company and its subsidiaries are also involved in certain existing compliance issues with the EPA and various state agencies, including beingnamed as a potentially responsible party at several sites. Potentially responsible parties ("PRP"s) can be held jointly and severally liable for the clean-up costsat any specific site. The Company's past experience, however, has indicated that when it has contributed relatively small amounts of materials or waste to aspecific site relative to other PRPs, its ultimate share of any clean-up costs has been minor. Based upon available information, the Company believes it hascontributed only small amounts to those sites in which it is currently viewed as a PRP.
U.S. Government Audits — Federal government agencies, including the Defense Contract Audit Agency ("DCAA") and the Defense ContractManagement Agency ("DCMA"), routinely audit and investigate government contracts and government contractors' administrative processes and systems.These agencies review the Company's performance on contracts, pricing practices, cost structure and compliance with applicable laws, regulations andstandards. They also review the adequacy of the Company's internal control systems and policies, including the Company's purchasing, accounting,estimating, compensation and management information processes and systems.
The Company responded in November 2011 to DCAA review comments received in the first quarter of fiscal 2012 regarding corrective actions toimprove the reliability for accumulating costs under government contracts. As a result, DCMA has determined our cost accounting system is currentlyadequate and the Company remains eligible to receive cost reimbursable contracts from the U.S. Government. While the Company's corrective actions remainopen for further review, the Company remains confident formal resolution of DCAA cost accounting practices findings will not have a material adverseimpact on the Company's financial results.
Other — In addition to the foregoing, from time to time, the Company is involved in various legal proceedings relating to claims arising in the ordinarycourse of business. The Company is not currently a party to any other such legal proceedings, the adverse outcome to which, individually or in the aggregate,is expected to have a material adverse effect on our business, financial condition or results of operations.
(10) Stock-Based Compensation
The Company has two long-term incentive plans. The Sparton Corporation Stock Incentive Plan, as amended and restated (the "2001 Plan") wasapproved by the Company's shareholders on October 24, 2001. The Sparton Corporation 2010 Long-Term Incentive Plan (the "2010 Plan") was approved bythe Company's shareholders on October 28, 2009.
12
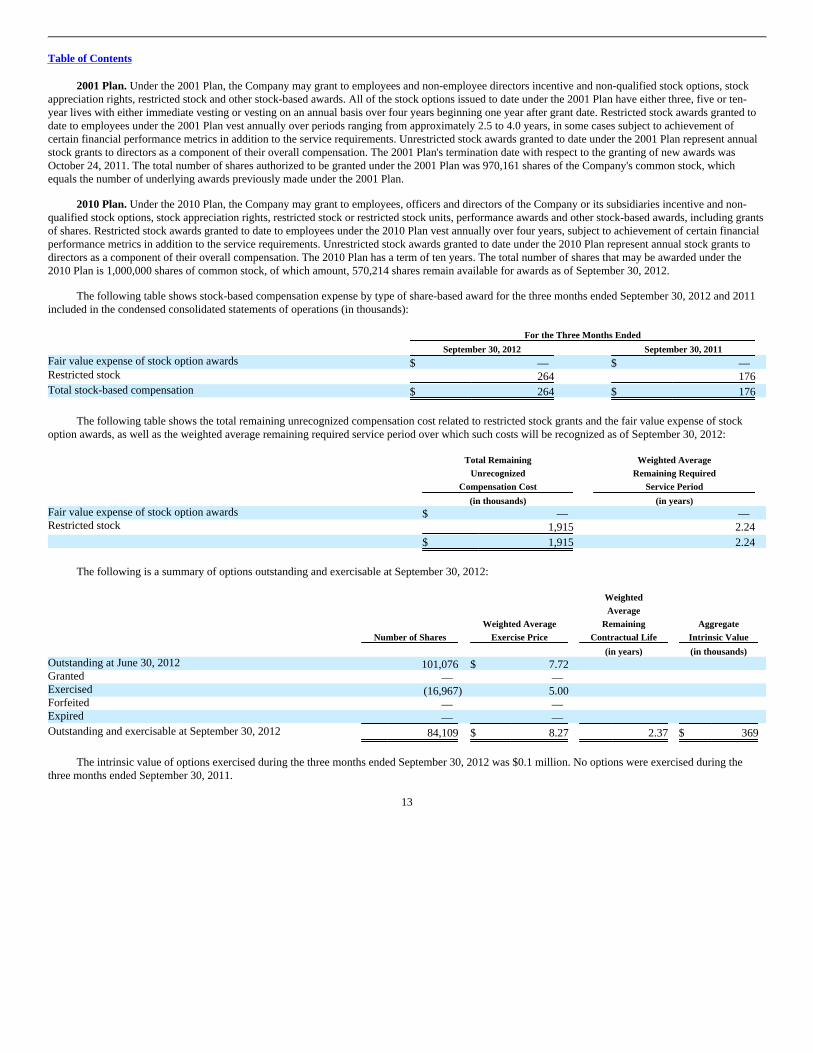
Table of Contents
2001 Plan. Under the 2001 Plan, the Company may grant to employees and non-employee directors incentive and non-qualified stock options, stockappreciation rights, restricted stock and other stock-based awards. All of the stock options issued to date under the 2001 Plan have either three, five or ten-year lives with either immediate vesting or vesting on an annual basis over four years beginning one year after grant date. Restricted stock awards granted todate to employees under the 2001 Plan vest annually over periods ranging from approximately 2.5 to 4.0 years, in some cases subject to achievement ofcertain financial performance metrics in addition to the service requirements. Unrestricted stock awards granted to date under the 2001 Plan represent annualstock grants to directors as a component of their overall compensation. The 2001 Plan's termination date with respect to the granting of new awards wasOctober 24, 2011. The total number of shares authorized to be granted under the 2001 Plan was 970,161 shares of the Company's common stock, whichequals the number of underlying awards previously made under the 2001 Plan.
2010 Plan. Under the 2010 Plan, the Company may grant to employees, officers and directors of the Company or its subsidiaries incentive and non-qualified stock options, stock appreciation rights, restricted stock or restricted stock units, performance awards and other stock-based awards, including grantsof shares. Restricted stock awards granted to date to employees under the 2010 Plan vest annually over four years, subject to achievement of certain financialperformance metrics in addition to the service requirements. Unrestricted stock awards granted to date under the 2010 Plan represent annual stock grants todirectors as a component of their overall compensation. The 2010 Plan has a term of ten years. The total number of shares that may be awarded under the2010 Plan is 1,000,000 shares of common stock, of which amount, 570,214 shares remain available for awards as of September 30, 2012.
The following table shows stock-based compensation expense by type of share-based award for the three months ended September 30, 2012 and 2011included in the condensed consolidated statements of operations (in thousands): For the Three Months Ended
September 30, 2012 September 30, 2011 Fair value expense of stock option awards $ — $ — Restricted stock 264 176
Total stock-based compensation $ 264 $ 176
The following table shows the total remaining unrecognized compensation cost related to restricted stock grants and the fair value expense of stockoption awards, as well as the weighted average remaining required service period over which such costs will be recognized as of September 30, 2012:
Total RemainingUnrecognized
Compensation Cost
Weighted AverageRemaining Required
Service Period
(in thousands) (in years) Fair value expense of stock option awards $ — — Restricted stock 1,915 2.24
$ 1,915 2.24
The following is a summary of options outstanding and exercisable at September 30, 2012:
Number of Shares
Weighted AverageExercise Price
WeightedAverage
RemainingContractual Life
AggregateIntrinsic Value
(in years) (in thousands) Outstanding at June 30, 2012 101,076 $ 7.72 Granted — — Exercised (16,967) 5.00 Forfeited — — Expired — —
Outstanding and exercisable at September 30, 2012 84,109 $ 8.27 2.37 $ 369
The intrinsic value of options exercised during the three months ended September 30, 2012 was $0.1 million. No options were exercised during thethree months ended September 30, 2011.
13
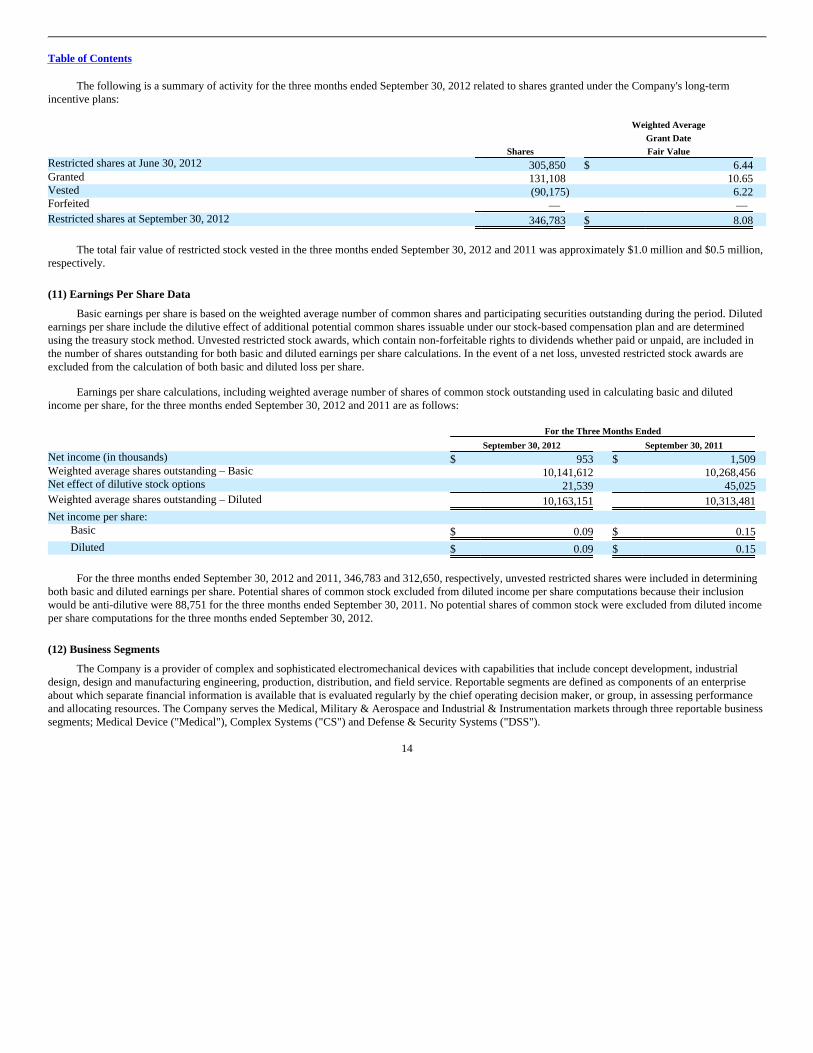
Table of Contents
The following is a summary of activity for the three months ended September 30, 2012 related to shares granted under the Company's long-termincentive plans:
Shares
Weighted AverageGrant DateFair Value
Restricted shares at June 30, 2012 305,850 $ 6.44 Granted 131,108 10.65 Vested (90,175) 6.22 Forfeited — —
Restricted shares at September 30, 2012 346,783 $ 8.08
The total fair value of restricted stock vested in the three months ended September 30, 2012 and 2011 was approximately $1.0 million and $0.5 million,respectively.
(11) Earnings Per Share Data
Basic earnings per share is based on the weighted average number of common shares and participating securities outstanding during the period. Dilutedearnings per share include the dilutive effect of additional potential common shares issuable under our stock-based compensation plan and are determinedusing the treasury stock method. Unvested restricted stock awards, which contain non-forfeitable rights to dividends whether paid or unpaid, are included inthe number of shares outstanding for both basic and diluted earnings per share calculations. In the event of a net loss, unvested restricted stock awards areexcluded from the calculation of both basic and diluted loss per share.
Earnings per share calculations, including weighted average number of shares of common stock outstanding used in calculating basic and dilutedincome per share, for the three months ended September 30, 2012 and 2011 are as follows: For the Three Months Ended
September 30, 2012 September 30, 2011 Net income (in thousands) $ 953 $ 1,509 Weighted average shares outstanding – Basic 10,141,612 10,268,456 Net effect of dilutive stock options 21,539 45,025
Weighted average shares outstanding – Diluted 10,163,151 10,313,481
Net income per share: Basic $ 0.09 $ 0.15
Diluted $ 0.09 $ 0.15
For the three months ended September 30, 2012 and 2011, 346,783 and 312,650, respectively, unvested restricted shares were included in determiningboth basic and diluted earnings per share. Potential shares of common stock excluded from diluted income per share computations because their inclusionwould be anti-dilutive were 88,751 for the three months ended September 30, 2011. No potential shares of common stock were excluded from diluted incomeper share computations for the three months ended September 30, 2012.
(12) Business Segments
The Company is a provider of complex and sophisticated electromechanical devices with capabilities that include concept development, industrialdesign, design and manufacturing engineering, production, distribution, and field service. Reportable segments are defined as components of an enterpriseabout which separate financial information is available that is evaluated regularly by the chief operating decision maker, or group, in assessing performanceand allocating resources. The Company serves the Medical, Military & Aerospace and Industrial & Instrumentation markets through three reportable businesssegments; Medical Device ("Medical"), Complex Systems ("CS") and Defense & Security Systems ("DSS").
14
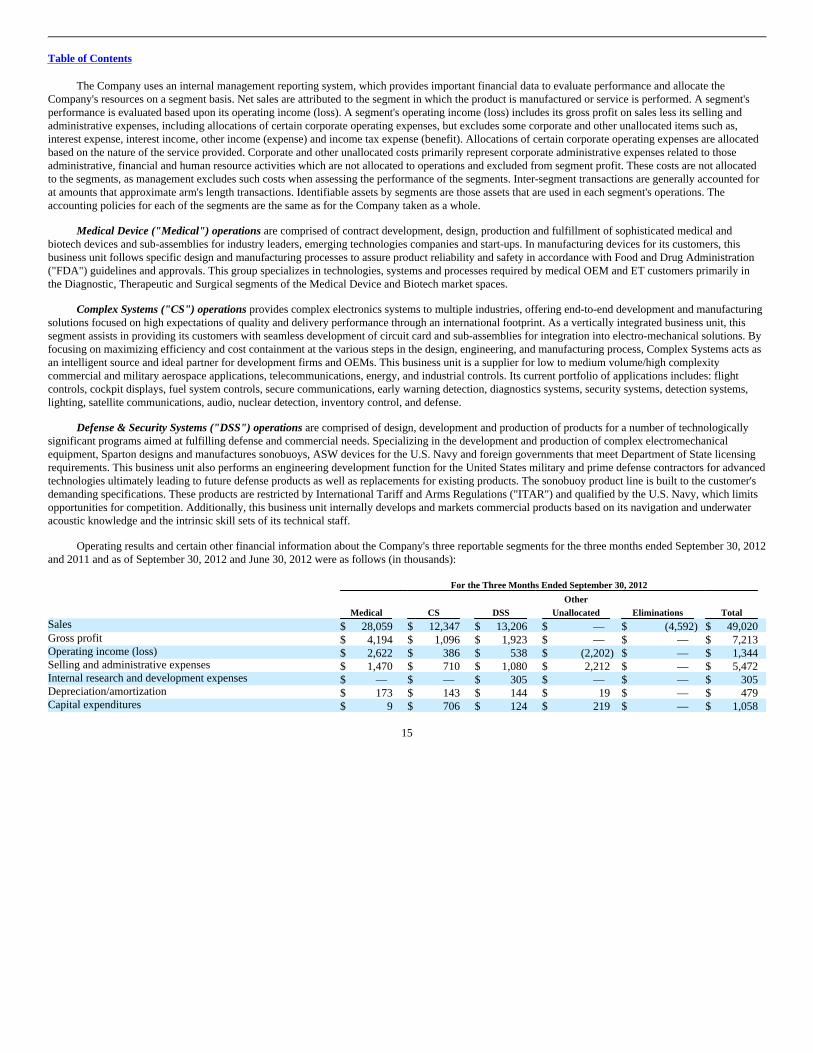
Table of Contents
The Company uses an internal management reporting system, which provides important financial data to evaluate performance and allocate theCompany's resources on a segment basis. Net sales are attributed to the segment in which the product is manufactured or service is performed. A segment'sperformance is evaluated based upon its operating income (loss). A segment's operating income (loss) includes its gross profit on sales less its selling andadministrative expenses, including allocations of certain corporate operating expenses, but excludes some corporate and other unallocated items such as,interest expense, interest income, other income (expense) and income tax expense (benefit). Allocations of certain corporate operating expenses are allocatedbased on the nature of the service provided. Corporate and other unallocated costs primarily represent corporate administrative expenses related to thoseadministrative, financial and human resource activities which are not allocated to operations and excluded from segment profit. These costs are not allocatedto the segments, as management excludes such costs when assessing the performance of the segments. Inter-segment transactions are generally accounted forat amounts that approximate arm's length transactions. Identifiable assets by segments are those assets that are used in each segment's operations. Theaccounting policies for each of the segments are the same as for the Company taken as a whole.
Medical Device ("Medical") operations are comprised of contract development, design, production and fulfillment of sophisticated medical andbiotech devices and sub-assemblies for industry leaders, emerging technologies companies and start-ups. In manufacturing devices for its customers, thisbusiness unit follows specific design and manufacturing processes to assure product reliability and safety in accordance with Food and Drug Administration("FDA") guidelines and approvals. This group specializes in technologies, systems and processes required by medical OEM and ET customers primarily inthe Diagnostic, Therapeutic and Surgical segments of the Medical Device and Biotech market spaces.
Complex Systems ("CS") operations provides complex electronics systems to multiple industries, offering end-to-end development and manufacturingsolutions focused on high expectations of quality and delivery performance through an international footprint. As a vertically integrated business unit, thissegment assists in providing its customers with seamless development of circuit card and sub-assemblies for integration into electro-mechanical solutions. Byfocusing on maximizing efficiency and cost containment at the various steps in the design, engineering, and manufacturing process, Complex Systems acts asan intelligent source and ideal partner for development firms and OEMs. This business unit is a supplier for low to medium volume/high complexitycommercial and military aerospace applications, telecommunications, energy, and industrial controls. Its current portfolio of applications includes: flightcontrols, cockpit displays, fuel system controls, secure communications, early warning detection, diagnostics systems, security systems, detection systems,lighting, satellite communications, audio, nuclear detection, inventory control, and defense.
Defense & Security Systems ("DSS") operations are comprised of design, development and production of products for a number of technologicallysignificant programs aimed at fulfilling defense and commercial needs. Specializing in the development and production of complex electromechanicalequipment, Sparton designs and manufactures sonobuoys, ASW devices for the U.S. Navy and foreign governments that meet Department of State licensingrequirements. This business unit also performs an engineering development function for the United States military and prime defense contractors for advancedtechnologies ultimately leading to future defense products as well as replacements for existing products. The sonobuoy product line is built to the customer'sdemanding specifications. These products are restricted by International Tariff and Arms Regulations ("ITAR") and qualified by the U.S. Navy, which limitsopportunities for competition. Additionally, this business unit internally develops and markets commercial products based on its navigation and underwateracoustic knowledge and the intrinsic skill sets of its technical staff.
Operating results and certain other financial information about the Company's three reportable segments for the three months ended September 30, 2012and 2011 and as of September 30, 2012 and June 30, 2012 were as follows (in thousands): For the Three Months Ended September 30, 2012
Medical CS DSS
OtherUnallocated Eliminations Total
Sales $ 28,059 $ 12,347 $ 13,206 $ — $ (4,592) $ 49,020 Gross profit $ 4,194 $ 1,096 $ 1,923 $ — $ — $ 7,213 Operating income (loss) $ 2,622 $ 386 $ 538 $ (2,202) $ — $ 1,344 Selling and administrative expenses $ 1,470 $ 710 $ 1,080 $ 2,212 $ — $ 5,472 Internal research and development expenses $ — $ — $ 305 $ — $ — $ 305 Depreciation/amortization $ 173 $ 143 $ 144 $ 19 $ — $ 479 Capital expenditures $ 9 $ 706 $ 124 $ 219 $ — $ 1,058
15
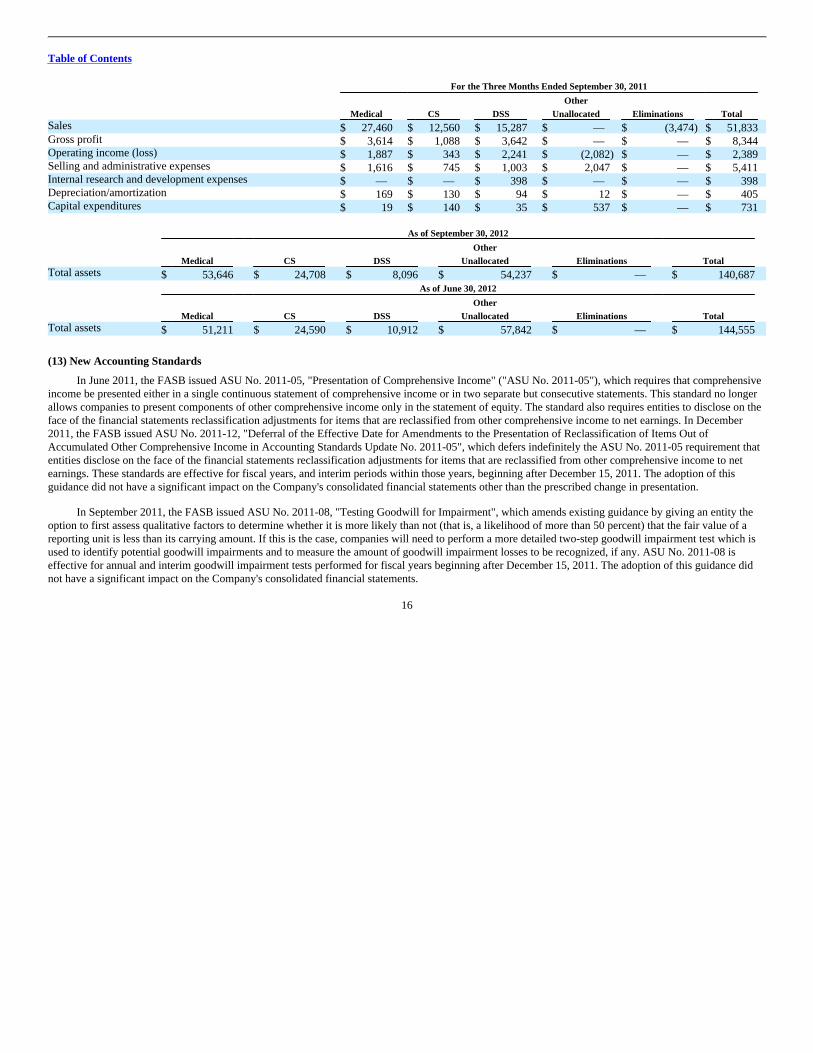
Table of Contents
For the Three Months Ended September 30, 2011
Medical CS DSS
OtherUnallocated Eliminations Total
Sales $ 27,460 $ 12,560 $ 15,287 $ — $ (3,474) $ 51,833 Gross profit $ 3,614 $ 1,088 $ 3,642 $ — $ — $ 8,344 Operating income (loss) $ 1,887 $ 343 $ 2,241 $ (2,082) $ — $ 2,389 Selling and administrative expenses $ 1,616 $ 745 $ 1,003 $ 2,047 $ — $ 5,411 Internal research and development expenses $ — $ — $ 398 $ — $ — $ 398 Depreciation/amortization $ 169 $ 130 $ 94 $ 12 $ — $ 405 Capital expenditures $ 19 $ 140 $ 35 $ 537 $ — $ 731 As of September 30, 2012
Medical CS DSS
OtherUnallocated Eliminations Total
Total assets $ 53,646 $ 24,708 $ 8,096 $ 54,237 $ — $ 140,687 As of June 30, 2012
Medical CS DSS
OtherUnallocated Eliminations Total
Total assets $ 51,211 $ 24,590 $ 10,912 $ 57,842 $ — $ 144,555
(13) New Accounting Standards
In June 2011, the FASB issued ASU No. 2011-05, "Presentation of Comprehensive Income" ("ASU No. 2011-05"), which requires that comprehensiveincome be presented either in a single continuous statement of comprehensive income or in two separate but consecutive statements. This standard no longerallows companies to present components of other comprehensive income only in the statement of equity. The standard also requires entities to disclose on theface of the financial statements reclassification adjustments for items that are reclassified from other comprehensive income to net earnings. In December2011, the FASB issued ASU No. 2011-12, "Deferral of the Effective Date for Amendments to the Presentation of Reclassification of Items Out ofAccumulated Other Comprehensive Income in Accounting Standards Update No. 2011-05", which defers indefinitely the ASU No. 2011-05 requirement thatentities disclose on the face of the financial statements reclassification adjustments for items that are reclassified from other comprehensive income to netearnings. These standards are effective for fiscal years, and interim periods within those years, beginning after December 15, 2011. The adoption of thisguidance did not have a significant impact on the Company's consolidated financial statements other than the prescribed change in presentation.
In September 2011, the FASB issued ASU No. 2011-08, "Testing Goodwill for Impairment", which amends existing guidance by giving an entity theoption to first assess qualitative factors to determine whether it is more likely than not (that is, a likelihood of more than 50 percent) that the fair value of areporting unit is less than its carrying amount. If this is the case, companies will need to perform a more detailed two-step goodwill impairment test which isused to identify potential goodwill impairments and to measure the amount of goodwill impairment losses to be recognized, if any. ASU No. 2011-08 iseffective for annual and interim goodwill impairment tests performed for fiscal years beginning after December 15, 2011. The adoption of this guidance didnot have a significant impact on the Company's consolidated financial statements.
16
Table of Contents
(14) Subsequent Event
On November 2, 2012, Sparton's wholly owned subsidiary, Sparton Onyx, LLC ("Sparton Onyx") entered into a Unit Purchase Agreement ("PurchaseAgreement") with Everett Smith Group, Ltd. ("ESG"), the owner of all outstanding limited liability company interests of Onyx EMS, LLC ("Onyx") wherebySparton Onyx agreed to purchase all of the outstanding limited liability company interests of Onyx for a cash purchase price of $43,250,000, subject to networking capital adjustments. The acquisition is expected to be funded through Sparton's existing cash balances and borrowings under a new bank facilitycurrently in process. The Purchase Agreement provides for a holdback equal to 10% of the purchase price for payment of the indemnification obligations andcertain purchase price adjustments. The acquisition is anticipated to close within 30 days from the signing of the Purchase Agreement and closing is subject tostandard covenants and conditions.
Onyx, with sites in both Watertown, South Dakota and Minneapolis, Minnesota, primarily manufactures medical devices for OEM and emergingtechnology companies, including products for cardiovascular diagnostics, hearing assistance, patient temperature and warming, point-of-care diagnostics, andsurgical equipment used in intraosseous medicine. The company also has a presence in the industrial market providing products such as precisionmeasurement instruments for monitoring air quality and pollution, commercial fire and smoke alarm systems, sensing tools, test fixtures, and complex LEDassemblies.
17
Table of Contents
Item 2. Management's Discussion and Analysis of Financial Condition and Results of Operations.
The following is management's discussion and analysis of certain significant events affecting Sparton Corporation's (the "Company" or " Sparton")results of operations and financial condition during the periods included in the accompanying financial statements. Additional information regarding theCompany can be accessed via Sparton's website at www.sparton.com. Information provided at the website includes, among other items, the Annual Report onForm 10-K, Quarterly Reports on Form 10-Q, Quarterly Earnings Releases, News Releases, and the Code of Business Conduct and Ethics, as well as variouscorporate charters and documents.
The Private Securities Litigation Reform Act of 1995 reflects Congress' determination that the disclosure of forward-looking information is desirablefor investors and encourages such disclosure by providing a safe harbor for forward-looking statements by corporate management. This report on Form 10-Qcontains forward-looking statements within the scope of the Securities Act of 1933 and the Securities Exchange Act of 1934. The words "expects,""anticipates," "believes," "intends," "plans," "will," "shall," and similar expressions, and the negatives of such expressions, are intended to identify forward-looking statements. In addition, any statements which refer to expectations, projections or other characterizations of future events or circumstances areforward-looking statements. The Company undertakes no obligation to publicly disclose any revisions to these forward-looking statements to reflect events orcircumstances occurring subsequent to filing this Form 10-Q with the Securities and Exchange Commission ("SEC"). These forward-looking statements aresubject to risks and uncertainties, including, without limitation, those discussed below. Accordingly, Sparton's future results may differ materially fromhistorical results or from those discussed or implied by these forward-looking statements. The Company notes that a variety of factors could cause the actualresults and experience to differ materially from anticipated results or other expectations expressed in the Company's forward-looking statements.
Business Overview
General
Sparton is a provider of complex and sophisticated electromechanical devices with capabilities that include concept development, industrial design,design and manufacturing engineering, production, distribution, and field service. The Company serves the Medical, Military & Aerospace and Industrial &Instrumentation markets through three reportable business segments; Medical Device ("Medical"), Complex Systems ("CS") and Defense & Security Systems("DSS").
All of the Company's facilities are registered to ISO standards, including 9001 or 13485, with most having additional certifications. The Company'sproducts and services include products for Original Equipment Manufacturers ("OEM") and Emerging Technology ("ET") customers that are microprocessor-based systems that include transducers, printed circuit boards and assemblies, sensors, and electromechanical components, as well as development and designengineering services relating to these product sales. Sparton also develops and manufactures sonobuoys, anti-submarine warfare ("ASW") devices used by theUnited States Navy and other free-world countries. Many of the physical and technical attributes in the production of sonobuoys are similar to those requiredin the production of the Company's other electrical and electromechanical products and assemblies.
The Company uses an internal management reporting system, which provides important financial data to evaluate performance and allocate theCompany's resources on a market segment basis. Net sales for segments are attributed to the segment in which the product is manufactured or service isperformed. A segment's performance is evaluated based upon its operating income (loss). A segment's operating income (loss) includes its gross profit onsales less its selling and administrative expenses, but excludes some corporate and other unallocated items such as, interest expense, interest income, otherincome (expense) and income tax expense (benefit). Allocations of certain corporate operating expenses are allocated based on the nature of the serviceprovided. Corporate and other unallocated costs primarily represent corporate administrative expenses related to those administrative, financial and humanresource activities which are not allocated to operations and excluded from segment profit. These costs are not allocated to the segments, as managementexcludes such costs when assessing the performance of the segments. Inter-segment transactions are generally accounted for at amounts that approximatearm's length transactions. The accounting policies for each of the segments are the same as for the Company taken as a whole.
18
Table of Contents
Medical Segment
Medical operations are comprised of contract development, design, production and fulfillment of sophisticated medical and biotech devices and sub-assemblies for industry leaders, emerging technologies companies and start-ups. In manufacturing devices for its customers, this business unit follows specificdesign and manufacturing processes to assure product reliability and safety in accordance with Food and Drug Administration ("FDA") guidelines andapprovals. This group specializes in technologies, systems and processes required by medical OEM and ET customers primarily in the Diagnostic,Therapeutic and Surgical segments of the Medical Device and Biotech market spaces.
Complex Systems Segment
Complex Systems operations provides complex electronics systems to multiple industries, offering end-to-end development and manufacturingsolutions focused on high expectations of quality and delivery performance through an international footprint. As a vertically integrated business unit, thissegment assists in providing its customers with seamless development of circuit card and sub-assemblies for integration into electro-mechanical solutions. Byfocusing on maximizing efficiency and cost containment at the various steps in the design, engineering, and manufacturing process, Complex Systems acts asan intelligent source and ideal partner for development firms and OEMs. This business unit is a supplier for low to medium volume/high complexitycommercial and military aerospace applications, telecommunications, energy, and industrial controls. Its current portfolio of applications includes: flightcontrols, cockpit displays, fuel system controls, secure communications, early warning detection, diagnostics systems, security systems, detection systems,lighting, satellite communications, audio, nuclear detection, inventory control, and defense.
DSS Segment
DSS operations are comprised of design, development and production of products for a number of technologically significant programs aimed atfulfilling defense and commercial needs. Specializing in the development and production of complex electromechanical equipment, Sparton designs andmanufactures sonobuoys, ASW devices for the U.S. Navy and foreign governments that meet Department of State licensing requirements. This business unitalso performs an engineering development function for the United States military and prime defense contractors for advanced technologies ultimately leadingto future defense products as well as replacements for existing products. The sonobuoy product line is built to the customer's demanding specifications. Theseproducts are restricted by International Tariff and Arms Regulations ("ITAR") and qualified by the U.S. Navy, which limits opportunities for competition.Additionally, this business unit internally develops and markets commercial products based on its navigation and underwater acoustic knowledge and theintrinsic skill sets of its technical staff.
Risks and Uncertainties
Sparton, as a high-mix, low to medium volume supplier, provides rapid product turnaround for customers. High-mix describes customers needingmultiple product types with generally low to medium volume manufacturing runs. As a contract manufacturer with customers in a variety of markets, theCompany has substantially less visibility of end user demand and, therefore, forecasting sales can be problematic. Customers may cancel their orders, changeproduction quantities and/or reschedule production for a number of reasons. Depressed economic conditions may result in customers delaying delivery ofproduct, or the placement of purchase orders for lower volumes than previously anticipated. Unplanned cancellations, reductions, or delays by customers maynegatively impact the Company's results of operations. As many of the Company's costs and operating expenses are relatively fixed within given ranges ofproduction, a reduction in customer demand can disproportionately affect the Company's gross margins and operating income. The majority of the Company'ssales have historically come from a limited number of customers. Significant reductions in sales to, or a loss of, one of these customers could materiallyimpact our operating results if the Company were not able to replace those sales with new business.
19
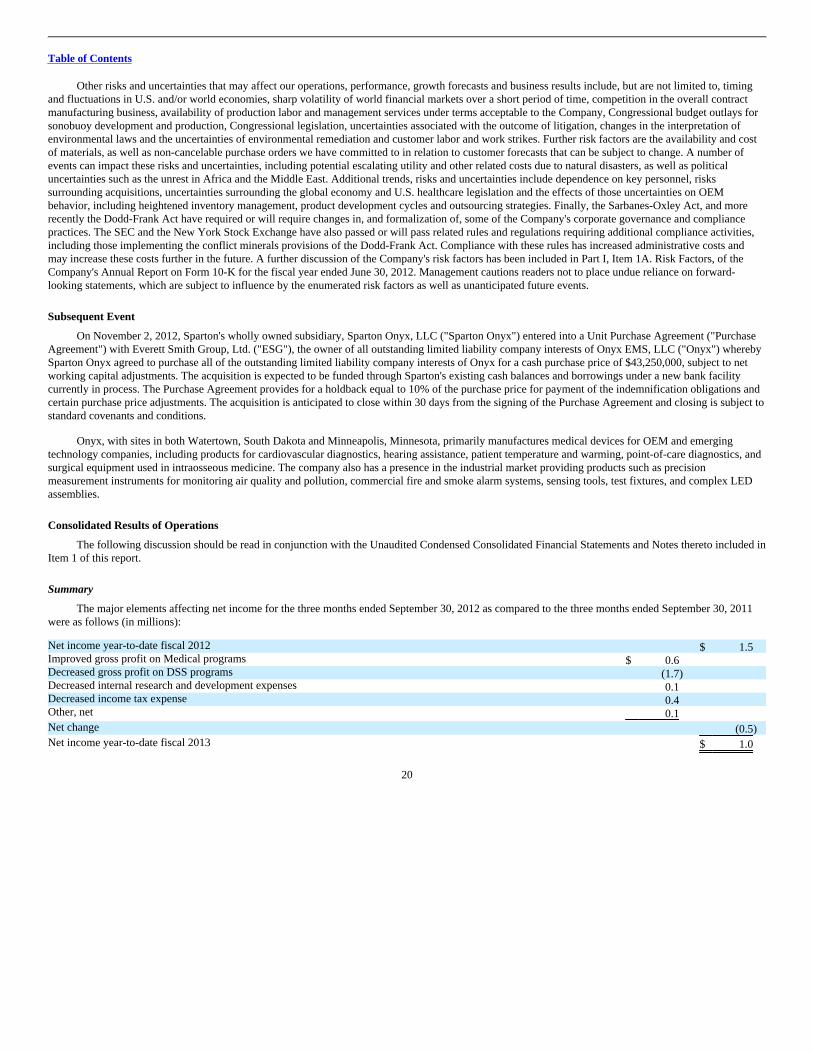
Table of Contents
Other risks and uncertainties that may affect our operations, performance, growth forecasts and business results include, but are not limited to, timingand fluctuations in U.S. and/or world economies, sharp volatility of world financial markets over a short period of time, competition in the overall contractmanufacturing business, availability of production labor and management services under terms acceptable to the Company, Congressional budget outlays forsonobuoy development and production, Congressional legislation, uncertainties associated with the outcome of litigation, changes in the interpretation ofenvironmental laws and the uncertainties of environmental remediation and customer labor and work strikes. Further risk factors are the availability and costof materials, as well as non-cancelable purchase orders we have committed to in relation to customer forecasts that can be subject to change. A number ofevents can impact these risks and uncertainties, including potential escalating utility and other related costs due to natural disasters, as well as politicaluncertainties such as the unrest in Africa and the Middle East. Additional trends, risks and uncertainties include dependence on key personnel, riskssurrounding acquisitions, uncertainties surrounding the global economy and U.S. healthcare legislation and the effects of those uncertainties on OEMbehavior, including heightened inventory management, product development cycles and outsourcing strategies. Finally, the Sarbanes-Oxley Act, and morerecently the Dodd-Frank Act have required or will require changes in, and formalization of, some of the Company's corporate governance and compliancepractices. The SEC and the New York Stock Exchange have also passed or will pass related rules and regulations requiring additional compliance activities,including those implementing the conflict minerals provisions of the Dodd-Frank Act. Compliance with these rules has increased administrative costs andmay increase these costs further in the future. A further discussion of the Company's risk factors has been included in Part I, Item 1A. Risk Factors, of theCompany's Annual Report on Form 10-K for the fiscal year ended June 30, 2012. Management cautions readers not to place undue reliance on forward-looking statements, which are subject to influence by the enumerated risk factors as well as unanticipated future events.
Subsequent Event
On November 2, 2012, Sparton's wholly owned subsidiary, Sparton Onyx, LLC ("Sparton Onyx") entered into a Unit Purchase Agreement ("PurchaseAgreement") with Everett Smith Group, Ltd. ("ESG"), the owner of all outstanding limited liability company interests of Onyx EMS, LLC ("Onyx") wherebySparton Onyx agreed to purchase all of the outstanding limited liability company interests of Onyx for a cash purchase price of $43,250,000, subject to networking capital adjustments. The acquisition is expected to be funded through Sparton's existing cash balances and borrowings under a new bank facilitycurrently in process. The Purchase Agreement provides for a holdback equal to 10% of the purchase price for payment of the indemnification obligations andcertain purchase price adjustments. The acquisition is anticipated to close within 30 days from the signing of the Purchase Agreement and closing is subject tostandard covenants and conditions.
Onyx, with sites in both Watertown, South Dakota and Minneapolis, Minnesota, primarily manufactures medical devices for OEM and emergingtechnology companies, including products for cardiovascular diagnostics, hearing assistance, patient temperature and warming, point-of-care diagnostics, andsurgical equipment used in intraosseous medicine. The company also has a presence in the industrial market providing products such as precisionmeasurement instruments for monitoring air quality and pollution, commercial fire and smoke alarm systems, sensing tools, test fixtures, and complex LEDassemblies.
Consolidated Results of Operations
The following discussion should be read in conjunction with the Unaudited Condensed Consolidated Financial Statements and Notes thereto included inItem 1 of this report.
Summary
The major elements affecting net income for the three months ended September 30, 2012 as compared to the three months ended September 30, 2011were as follows (in millions): Net income year-to-date fiscal 2012 $ 1.5 Improved gross profit on Medical programs $ 0.6 Decreased gross profit on DSS programs (1.7) Decreased internal research and development expenses 0.1 Decreased income tax expense 0.4 Other, net 0.1
Net change (0.5)
Net income year-to-date fiscal 2013 $ 1.0
20
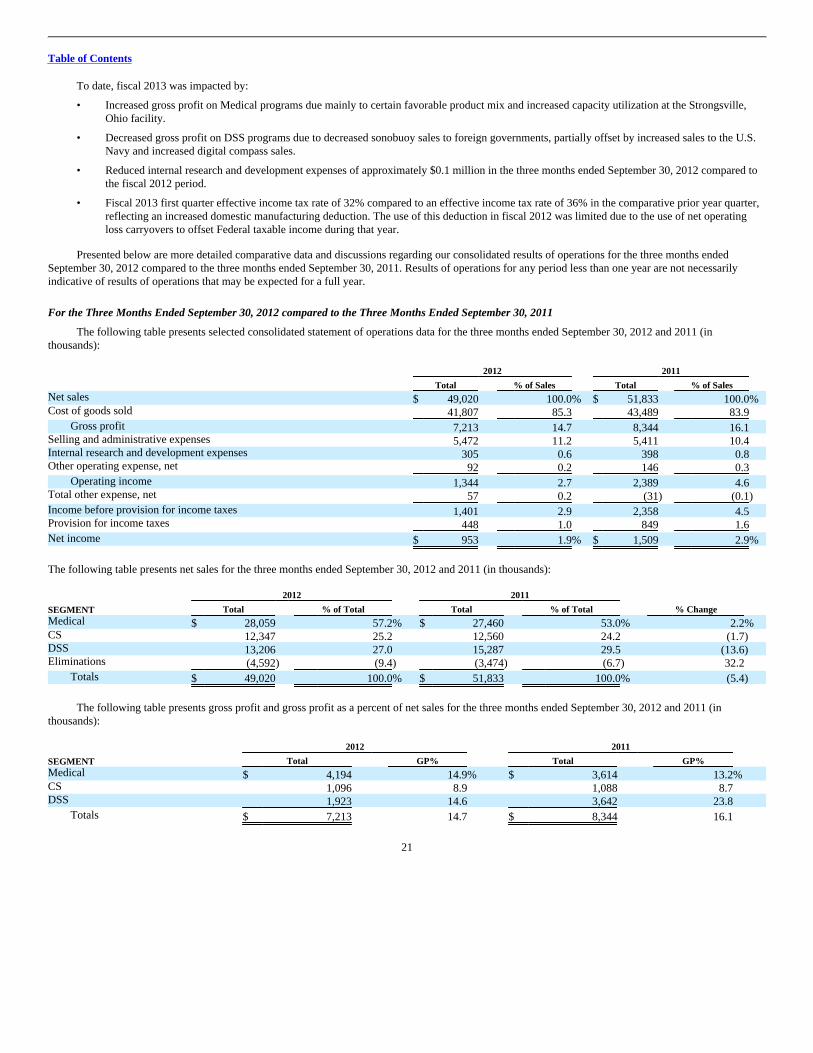
Table of Contents
To date, fiscal 2013 was impacted by:
• Increased gross profit on Medical programs due mainly to certain favorable product mix and increased capacity utilization at the Strongsville,Ohio facility.
• Decreased gross profit on DSS programs due to decreased sonobuoy sales to foreign governments, partially offset by increased sales to the U.S.Navy and increased digital compass sales.
• Reduced internal research and development expenses of approximately $0.1 million in the three months ended September 30, 2012 compared tothe fiscal 2012 period.
• Fiscal 2013 first quarter effective income tax rate of 32% compared to an effective income tax rate of 36% in the comparative prior year quarter,reflecting an increased domestic manufacturing deduction. The use of this deduction in fiscal 2012 was limited due to the use of net operatingloss carryovers to offset Federal taxable income during that year.
Presented below are more detailed comparative data and discussions regarding our consolidated results of operations for the three months endedSeptember 30, 2012 compared to the three months ended September 30, 2011. Results of operations for any period less than one year are not necessarilyindicative of results of operations that may be expected for a full year.
For the Three Months Ended September 30, 2012 compared to the Three Months Ended September 30, 2011
The following table presents selected consolidated statement of operations data for the three months ended September 30, 2012 and 2011 (inthousands): 2012 2011
Total % of Sales Total % of Sales Net sales $ 49,020 100.0% $ 51,833 100.0%Cost of goods sold 41,807 85.3 43,489 83.9
Gross profit 7,213 14.7 8,344 16.1 Selling and administrative expenses 5,472 11.2 5,411 10.4 Internal research and development expenses 305 0.6 398 0.8 Other operating expense, net 92 0.2 146 0.3
Operating income 1,344 2.7 2,389 4.6 Total other expense, net 57 0.2 (31) (0.1)
Income before provision for income taxes 1,401 2.9 2,358 4.5 Provision for income taxes 448 1.0 849 1.6
Net income $ 953 1.9% $ 1,509 2.9%
The following table presents net sales for the three months ended September 30, 2012 and 2011 (in thousands): 2012 2011
SEGMENT Total % of Total Total % of Total % Change Medical $ 28,059 57.2% $ 27,460 53.0% 2.2%CS 12,347 25.2 12,560 24.2 (1.7) DSS 13,206 27.0 15,287 29.5 (13.6)Eliminations (4,592) (9.4) (3,474) (6.7) 32.2
Totals $ 49,020 100.0% $ 51,833 100.0% (5.4)
The following table presents gross profit and gross profit as a percent of net sales for the three months ended September 30, 2012 and 2011 (inthousands): 2012 2011
SEGMENT Total GP% Total GP% Medical $ 4,194 14.9% $ 3,614 13.2%CS 1,096 8.9 1,088 8.7 DSS 1,923 14.6 3,642 23.8
Totals $ 7,213 14.7 $ 8,344 16.1
21
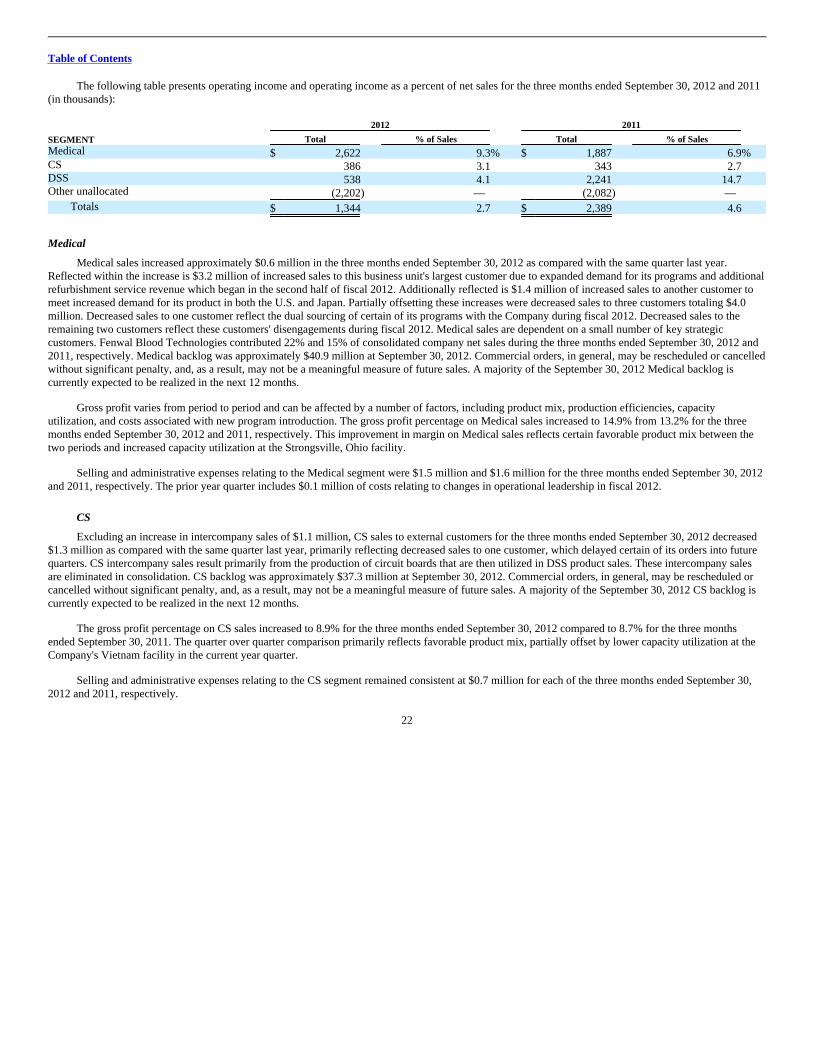
Table of Contents
The following table presents operating income and operating income as a percent of net sales for the three months ended September 30, 2012 and 2011(in thousands): 2012 2011
SEGMENT Total % of Sales Total % of Sales Medical $ 2,622 9.3% $ 1,887 6.9%CS 386 3.1 343 2.7 DSS 538 4.1 2,241 14.7 Other unallocated (2,202) — (2,082) —
Totals $ 1,344 2.7 $ 2,389 4.6
Medical
Medical sales increased approximately $0.6 million in the three months ended September 30, 2012 as compared with the same quarter last year.Reflected within the increase is $3.2 million of increased sales to this business unit's largest customer due to expanded demand for its programs and additionalrefurbishment service revenue which began in the second half of fiscal 2012. Additionally reflected is $1.4 million of increased sales to another customer tomeet increased demand for its product in both the U.S. and Japan. Partially offsetting these increases were decreased sales to three customers totaling $4.0million. Decreased sales to one customer reflect the dual sourcing of certain of its programs with the Company during fiscal 2012. Decreased sales to theremaining two customers reflect these customers' disengagements during fiscal 2012. Medical sales are dependent on a small number of key strategiccustomers. Fenwal Blood Technologies contributed 22% and 15% of consolidated company net sales during the three months ended September 30, 2012 and2011, respectively. Medical backlog was approximately $40.9 million at September 30, 2012. Commercial orders, in general, may be rescheduled or cancelledwithout significant penalty, and, as a result, may not be a meaningful measure of future sales. A majority of the September 30, 2012 Medical backlog iscurrently expected to be realized in the next 12 months.
Gross profit varies from period to period and can be affected by a number of factors, including product mix, production efficiencies, capacityutilization, and costs associated with new program introduction. The gross profit percentage on Medical sales increased to 14.9% from 13.2% for the threemonths ended September 30, 2012 and 2011, respectively. This improvement in margin on Medical sales reflects certain favorable product mix between thetwo periods and increased capacity utilization at the Strongsville, Ohio facility.
Selling and administrative expenses relating to the Medical segment were $1.5 million and $1.6 million for the three months ended September 30, 2012and 2011, respectively. The prior year quarter includes $0.1 million of costs relating to changes in operational leadership in fiscal 2012.
CS
Excluding an increase in intercompany sales of $1.1 million, CS sales to external customers for the three months ended September 30, 2012 decreased$1.3 million as compared with the same quarter last year, primarily reflecting decreased sales to one customer, which delayed certain of its orders into futurequarters. CS intercompany sales result primarily from the production of circuit boards that are then utilized in DSS product sales. These intercompany salesare eliminated in consolidation. CS backlog was approximately $37.3 million at September 30, 2012. Commercial orders, in general, may be rescheduled orcancelled without significant penalty, and, as a result, may not be a meaningful measure of future sales. A majority of the September 30, 2012 CS backlog iscurrently expected to be realized in the next 12 months.
The gross profit percentage on CS sales increased to 8.9% for the three months ended September 30, 2012 compared to 8.7% for the three monthsended September 30, 2011. The quarter over quarter comparison primarily reflects favorable product mix, partially offset by lower capacity utilization at theCompany's Vietnam facility in the current year quarter.
Selling and administrative expenses relating to the CS segment remained consistent at $0.7 million for each of the three months ended September 30,2012 and 2011, respectively.
22
Table of Contents
DSS
DSS sales decreased approximately $2.1 million in the three months ended September 30, 2012 as compared with the same quarter last year, reflectingthe anticipated decreased sonobuoy sales to foreign governments, partially offset by increased U.S. Navy sonobuoy production and engineering sales andincreased digital compass sales in the current year quarter. The Company had two sonobuoy lots fail at the Navy test range in the final weeks of September2012. While these lot failures unfavorably impacted current year first quarter revenues by approximately $3.5 million, it is anticipated that these lots will passin the Company's fiscal 2013 second quarter with revenues recognized at that time. Total sales to the U.S. Navy in the three months ended September 30,2012 and 2011 was approximately $12.2 million and $5.9 million, or 25% and 11%, respectively, of consolidated Company net sales for those periods.Sonobuoy sales to foreign governments were $0.1 million and $9.3 million in the three months ended September 30, 2012 and 2011, respectively. DSSbacklog was approximately $77.9 million at September 30, 2012. A majority of the September 30, 2012 DSS backlog is currently expected to be realizedwithin the next 12 to 16 months.
The gross profit percentage on DSS sales decreased to 14.6% for the three months ended September 30, 2012 compared to 23.8% for the three monthsended September 30, 2011. Gross profit percentage was unfavorable affected in the current year quarter by a significant decrease in foreign sonobuoy sales,partially offset by the positive impact from increased digital compass sales as compared to the prior year quarter.
Selling and administrative expenses relating to the DSS segment were $1.1 million and $1.0 million for the three months ended September 30, 2012 and2011, respectively, primarily reflecting increased business development efforts in the current fiscal quarter.
Internal research and development expenses reflect costs incurred for the internal development of technologies for use in navigation and oil and gasexploration. These costs include salaries and related expenses, contract labor and consulting costs, materials and the cost of certain research and developmentspecific equipment. The Company incurred $0.3 million and $0.4 million of internally funded research and development expenses in the three months endedSeptember 30, 2012 and 2011, respectively.
Other Unallocated
Total corporate selling and administrative expenses were $4.1 million and $3.8 million for the three months ended September 30, 2012 and 2011,respectively, primarily reflecting increased expenses related to professional services, travel and information technology. Of these costs, $1.8 million wasallocated to segment operations in each of these periods. Allocations of corporate selling and administrative expenses are based on the nature of the serviceprovided and can fluctuate from period to period.
Interest expense consists of interest and fees on our outstanding debt and revolving credit facility, including amortization of financing costs. Interestexpense was $0.1 million and $0.2 million for the three months ended September 30, 2012 and 2011, respectively. Fiscal 2013 was favorably impacted by theJuly 2012 completion of amortization of financing fees paid relating to the Company's revolving credit facility and the July 2012 reduction of unused line feesunder the credit facility. See Note 5, Debt, of the "Notes to Unaudited Condensed Consolidated Financial Statements" in this Quarterly Report on Form 10-Qfor a further discussion of debt.
The Company is responsible for income taxes within each jurisdiction in which it operates. The Company recorded income tax expense ofapproximately $0.4 million, or an effective rate of 32.0%, for the three months ended September 30, 2012 compared to an income tax expense ofapproximately $0.8 million, or an effective rate of 36.0%, for the three months ended September 30, 2011. The fiscal 2013 effective rate was favorablyimpacted in comparison to the rate in the prior year quarter by the domestic manufacturing deduction. The use of this deduction in fiscal 2012 was limited dueto the use of net operating loss carryovers to offset Federal taxable income during that year. See Note 7, Income Taxes, of the "Notes to Unaudited CondensedConsolidated Financial Statements" in this Quarterly Report on Form 10-Q for a further discussion of income taxes.
Due to the factors described above, the Company reported net income of $1.0 million ($0.09 per share, basic and diluted) for the three months endedSeptember 30, 2012, compared to net income of $1.5 million ($0.15 per share, basic and diluted) for the corresponding period last year.
23
Table of Contents
Liquidity and Capital Resources
Certain of the Company's DSS contracts allow for billings to occur when certain milestones under the applicable program are reached, independent ofthe amount shipped by Sparton as of such date. These advance billings reduce the amount of cash that would otherwise be required during the performance ofthese contracts. As of September 30, 2012 and June 30, 2012, $23.3 million and $25.8 million, respectively, of billings in excess of costs were received. TheCompany's revolving line-of-credit facility was extended in July 2012 to August 13, 2015. The Company currently expects to meet its liquidity needs througha combination of sources including, but not limited to, operations, existing cash balances, its revolving line-of-credit, anticipated continuation of advancebillings on certain DSS contracts and improvement in inventory management. With the above sources providing the expected cash flows, the Companycurrently believes that it will have sufficient liquidity for its anticipated needs over the next 12 months, but no assurances regarding liquidity can be made.
Operating activities used $2.6 million and provided $3.2 million of net cash flows in three months ended September 30, 2012 and 2011, respectively.Excluding changes in working capital, operating activities provided $1.8 million and $3.1 million in the first quarter of fiscal 2013 and 2012, respectively,reflecting the Company's relative operating performance during those periods. Working capital used $4.4 million and provided $0.1 million of net cash flowsin the three months ended September 30, 2012 and 2011, respectively. First quarter fiscal 2013 working capital related cash flows primarily reflect increasedinventory, reduced accounts payable and accrued expenses and funding of production related to U.S. Navy contracts during the year in excess of advancebillings received, partially offset by decreased accounts receivable. First quarter fiscal 2012 working capital related cash flows primarily reflect the collectionof advance billings related to U.S. Navy contracts during the quarter in excess of the funding of production under those contracts, partially offset by increasedaccounts receivable, increased inventory and reduced accounts payable and accrued expenses.
Cash flows used in investing activities in three months ended September 30, 2012 and 2011 totaled $1.1 million and $0.7 million, respectively,reflecting capital expenditures in those periods.
Cash flows used in financing activities in the three months ended September 30, 2012 and 2011 totaled $0.2 million and less than $0.1 million,respectively. The three months ended September 30, 2012 reflect the use of cash of $0.2 million to satisfy income tax withholding requirements in relation tothe vesting of executives' restricted stock in exchange for the surrender of a portion of the vesting shares. Each of the three months ended September 30, 2012and 2011 also reflect repayments on the Company's outstanding industrial revenue bonds with the state of Ohio of less than $0.1 million. Additionally, theCompany received $0.1 million from the exercise of stock options during the first three months of fiscal 2013.
As of September 30, 2012, the Company's bank line-of-credit facility totaled $20.0 million, subject to certain collateral restrictions, with no borrowingsagainst the available funds. The Company did have certain letters of credit outstanding against this facility totaling $0.5 million at September 30, 2012. Thisbank debt is subject to certain customary covenants which the Company was in compliance with at September 30, 2012. In July 2012, this line-of-credit wasamended and extended to August 13, 2015. The Company also has approximately $1.6 million of industrial revenue bonds outstanding at September 30, 2012.See Note 5, Debt, of the "Notes to Unaudited Condensed Consolidated Financial Statements" in this Quarterly Report on Form 10-Q for a further discussionof the Company's debt.
On November 2, 2012, Sparton's wholly owned subsidiary, Sparton Onyx, LLC ("Sparton Onyx") entered into a Unit Purchase Agreement ("PurchaseAgreement") with Everett Smith Group, Ltd. ("ESG"), the owner of all outstanding limited liability company interests of Onyx EMS, LLC ("Onyx") wherebySparton Onyx agreed to purchase all of the outstanding limited liability company interests of Onyx for a cash purchase price of $43,250,000, subject to networking capital adjustments. The acquisition is expected to be funded through Sparton's existing cash balances and borrowings under a new bank facilitycurrently in process. The Purchase Agreement provides for a holdback equal to 10% of the purchase price for payment of the indemnification obligations andcertain purchase price adjustments. The acquisition is anticipated to close within 30 days from the signing of the Purchase Agreement and closing is subject tostandard covenants and conditions.
24
Table of Contents
Commitments and Contingencies
Environmental Remediation
Sparton has been involved with ongoing environmental remediation since the early 1980's related to one of its former manufacturing facilities, locatedin Albuquerque, New Mexico ("Coors Road"). Although the Company entered into a long-term lease of the Coors Road property that was accounted for as asale of property during fiscal 2010, it remains responsible for the remediation obligations related to its past operation of this facility. At September 30, 2012,Sparton had accrued approximately $3.5 million as its estimate of the remaining minimum future undiscounted financial liability with respect to this matter, ofwhich approximately $0.4 million is classified as a current liability and included on the balance sheet in other accrued expenses. The Company's minimumcost estimate is based upon existing technology and excludes certain legal costs, which are expensed as incurred. The Company's estimate includes equipmentand operating and maintenance costs for onsite and offsite pump and treat containment systems, as well as continued onsite and offsite monitoring. It alsoincludes periodic reporting requirements.
In fiscal 2003, Sparton reached an agreement with the United States Department of Energy ("DOE") and others to recover certain remediation costs.Under the settlement terms, Sparton received cash and obtained some degree of risk protection as the DOE agreed to reimburse Sparton for 37.5% of certainfuture environmental expenses in excess of $8.4 million incurred from the date of settlement, if any, of which approximately $4.3 million has been expendedas of September 30, 2012 toward the $8.4 million threshold. Uncertainties associated with environmental remediation contingencies are pervasive and oftenresult in wide ranges of reasonably possible outcomes. Estimates developed in the early stages of remediation can vary significantly. Normally a finiteestimate of cost does not become fixed and determinable at a specific point in time. Rather, the costs associated with environmental remediation becomeestimable over a continuum of events and activities that help to frame and define a liability. Factors which cause uncertainties for the Company include, butare not limited to, the effectiveness of the current work plans in achieving targeted results and proposals of regulatory agencies for desired methods andoutcomes. It is possible that cash flows and results of operations could be materially affected by the impact of changes associated with the ultimate resolutionof this contingency. At September 30, 2012, the Company estimates that it is reasonably possible, but not probable, that future environmental remediationcosts associated with the Company's past operations at the Coors Road property, in excess of amounts already recorded and net of DOE reimbursement, couldbe up to $2.4 million before income taxes over the next eighteen years.
The Company and its subsidiaries are also involved in certain existing compliance issues with the EPA and various state agencies, including beingnamed as a potentially responsible party at several sites. Potentially responsible parties ("PRP"s) can be held jointly and severally liable for the clean-up costsat any specific site. The Company's past experience, however, has indicated that when it has contributed relatively small amounts of materials or waste to aspecific site relative to other PRPs, its ultimate share of any clean-up costs has been minor. Based upon available information, the Company believes it hascontributed only small amounts to those sites in which it is currently viewed as a PRP.
U.S. Government Audits
Federal government agencies, including the Defense Contract Audit Agency ("DCAA") and the Defense Contract Management Agency ("DCMA"),routinely audit and investigate government contracts and government contractors' administrative processes and systems. These agencies review the Company'sperformance on contracts, pricing practices, cost structure and compliance with applicable laws, regulations and standards. They also review the adequacy ofthe Company's internal control systems and policies, including the Company's purchasing, accounting, estimating, compensation and management informationprocesses and systems.
The Company responded in November 2011 to DCAA review comments received in the first quarter of fiscal 2012 regarding corrective actions toimprove the reliability for accumulating costs under government contracts. As a result, DCMA has determined our cost accounting system is currentlyadequate and the Company remains eligible to receive cost reimbursable contracts from the U.S. Government. While the Company's corrective actions remainopen for further review, the Company remains confident formal resolution of DCAA cost accounting practices findings will not have a material adverseimpact on the Company's financial results.
25
Table of Contents
Other
In addition to the foregoing, from time to time, the Company is involved in various legal proceedings relating to claims arising in the ordinary course ofbusiness. The Company is not currently a party to any other such legal proceedings, the adverse outcome to which, individually or in the aggregate, isexpected to have a material adverse effect on our business, financial condition or results of operations.
Contractual Obligations and Off-Balance Sheet Arrangements
Information regarding the Company's long-term debt obligations, environmental liability payments, operating lease payments, and other commitmentsis provided in Part II, Item 7, "Management's Discussion and Analysis of Financial Condition and Results of Operations," of the Company's Annual Report onForm 10-K for the fiscal year ended June 30, 2012. As of June 30, 2012, there were $27.3 million of non-cancelable purchase orders outstanding and aliability related to advance billings on customer contracts of $25.8 million. As of September 30, 2012, the non-cancelable purchase orders outstanding hasincreased to $36.1 million and the liability related to advanced billings has decreased to $23.3 million. Other than as noted above, there have been no materialchanges in the nature or amount of the Company's contractual obligations since June 30, 2012.
Critical Accounting Policies
Our financial statements are prepared in conformity with GAAP and require us to select appropriate accounting policies. The assumptions andjudgments we use in applying our accounting policies have a significant impact on our reported amounts of assets, liabilities, revenue and expenses. While webelieve that the assumptions and judgments used in our estimates are reasonable, actual results may differ from these estimates under different assumptions orconditions.
We have identified the most critical accounting policies upon which our financial status depends. The critical policies were determined by consideringaccounting policies that involve the most complex or subjective decisions or assessments. We also have other policies considered key accounting policies;however, these policies do not meet the definition of critical accounting policies because they do not generally require us to make estimates or judgments thatare complex or subjective. Our critical accounting policies include the following:
• Environmental contingencies
• Government contract cost estimates
• Commercial inventory valuation
• Allowance for probable losses on receivables
• Pension obligations
• Business combinations
• Valuation of property, plant and equipment
• Goodwill and intangible assets
• Income taxes
• Stock-based compensation
There have been no significant changes to our critical accounting policies that are described in Part II, Item 7, "Management's Discussion and Analysisof Financial Condition and Results of Operations" section of our Annual Report on Form 10-K for the year ended June 30, 2012.
New Accounting Pronouncements
See Note 13, New Accounting Standards, of the "Notes to Unaudited Condensed Consolidated Financial Statements" in this Quarterly Report on Form10-Q for a discussion of new accounting pronouncements.
26
Table of Contents
Item 3. Quantitative and Qualitative Disclosures About Market Risk.
The Company manufactures its products in the United States and Vietnam. Sales are to the U.S. as well as foreign markets. The Company is potentiallysubject to foreign currency exchange rate risk relating to intercompany activity and balances and to receipts from customers and payments to suppliers inforeign currencies. Also, adjustments related to the translation of the Company's Vietnamese financial statements into U.S. dollars are included in currentearnings. As a result, the Company's financial results could be affected by factors such as changes in foreign currency exchange rates or economic conditionsin the domestic and foreign markets in which the Company operates. However, minimal third party receivables and payables are denominated in foreigncurrency and the related market risk exposure is considered to be immaterial.
The Company's revolving credit line, if drawn upon, is subject to future interest rate fluctuations which could potentially have a negative impact on cashflows of the Company. The Company is not party to any currency exchange or interest rate protection agreements as of September 30, 2012.
Item 4. Controls and Procedures.
Each of our Chief Executive Officer and Chief Financial Officer has evaluated the effectiveness of our disclosure controls and procedures (as such termis defined in Rules 13a-15(e) and 15d-15(e) under the Securities and Exchange Act of 1934) as of the end of the period covered by this quarterly report. Basedon such evaluation, such officers have concluded that, as of the end of the period covered by this quarterly report, our disclosure controls and procedures areeffective.
There have been no changes in our internal controls over financial reporting (as such term is defined in Rules 13a-15(f) and 15d-15(f) under theExchange Act) during the quarter ended September 30, 2012 that have materially affected, or are reasonably likely to materially affect, our internal controlsover financial reporting.
27
Table of Contents
PART II. OTHER INFORMATION
Item 1. Legal Proceedings.
See "Management's Discussion and Analysis of Financial Condition and Results of Operations — Commitments and Contingencies" of this report.
In addition to the above, from time to time, we are involved in various legal proceedings relating to claims arising in the ordinary course of business.We are not currently a party to any such legal proceedings, the outcome of which, individually or in the aggregate, is expected to have a material adverseeffect on our business, financial condition or results of operations.
Item 1A. Risk Factors.
You should carefully consider the risks and uncertainties described in Part I, Item 1A. Risk Factors in our Annual Report on Form 10-K for the yearended June 30, 2012 and the other information in our subsequent filings with the SEC, including this Quarterly Report on Form 10-Q. Our business, financialcondition, results of operations and stock price could be materially adversely affected by any of these risks. The risks described in our Annual Report on Form10-K are not the only ones we face. Additional risks and uncertainties that are currently unknown to us or that we currently consider to be immaterial mayalso impair our business or adversely affect our financial condition, results of operations and stock price.
Item 2. Unregistered Sales of Equity Securities and Use of Proceeds.
The following table provides information about shares of common stock the Company acquired during the three months ended September 30, 2012:
Issuer Purchases of Equity Securities
Total number of sharespurchased
Average price paidper share
Total number of sharespurchased as part of publicly
announced plans orprograms
Maximum number (orapproximate dollar value) of
shares that may yet be purchasedunder the plans or programs
July 1, 2012 to July 31, 2012 — — — — August 1, 2012 to August 31, 2012 — — — $ — September 1, 2012 to September 30, 2012 (a) 20,564 $ 11.38 — $ —
Total 20,564 $ 11.38 — $ —
(a) Represents shares withheld to satisfy certain tax withholding obligations in connection with vesting of restricted stock as permitted by the Sparton
Corporation 2010 Long-Term Stock Option Incentive Plan.
28
Table of Contents
Item 6. Exhibits. ExhibitNumber Description
3.1
Second Amended Articles of Incorporation of the Registrant, incorporated herein by reference from the Registrant's Proxy Statement on FormDEF 14A filed with the SEC on September 21, 2010.
3.2
Amended and Restated Code of Regulations of the Registrant, incorporated herein by reference from the Registrant's Proxy Statement onForm DEF 14A filed with the SEC on September 21, 2010.
3.3
Amendment to Amended and Restated Code of Regulations of the Registrant, incorporated herein by reference from exhibit 99.1 to theRegistrant's Current Report on Form 8-K filed with the SEC on September 26, 2012.
31.1* Chief Executive Officer certification under Section 302 of the Sarbanes-Oxley Act of 2002.31.2* Chief Financial Officer certification under Section 302 of the Sarbanes-Oxley Act of 2002.32.1*
Chief Executive Officer and Chief Financial Officer certification pursuant to 18 U.S.C. Section 1350, as adopted pursuant to Section 906 ofthe Sarbanes-Oxley Act of 2002.
101.INS** XBRL Instance Document101.SCH** XBRL Taxonomy Extension Schema Document101.CAL** XBRL Taxonomy Calculation Linkbase Document101.DEF** XBRL Taxonomy Extension Definition Linkbase Document101.LAB** XBRL Taxonomy Extension Label Linkbase Document101.PRE** XBRL Taxonomy Extension Presentation Linkbase Document * Filed herewith.** XBRL (Extensible Business Reporting Language) information is deemed not filed or part of a registration statement or prospectus for purposes of
sections 11 or 12 of the Securities Act of 1933, is deemed not filed for purposes of Section 18 of the Securities Exchange Act of 1934, and otherwise isnot subject to liability under these sections.
29
Table of Contents
SIGNATURES
Pursuant to the requirements of the Securities Exchange Act of 1934, the registrant has duly caused this report to be signed on its behalf by theundersigned thereunto duly authorized.
Sparton CorporationDate: November 6, 2012 By: /s/ CARY B. WOOD
Cary B. Wood President and Chief Executive Officer (Principal Executive Officer)
Date: November 6, 2012 By: /s/ GREGORY A. SLOME Gregory A. Slome Senior Vice President and Chief Financial Officer (Principal Financial Officer)
30
Exhibit 31.1
CERTIFICATION UNDER SECTION 302 OF THE SARBANES-OXLEY ACT OF 2002
I, Cary B. Wood, certify that:
1. I have reviewed this Quarterly Report on Form 10-Q of Sparton Corporation;
2. Based on my knowledge, this report does not contain any untrue statement of a material fact or omit to state a material fact necessary to make thestatements made, in light of the circumstances under which such statements were made, not misleading with respect to the period covered by this report;
3. Based on my knowledge, the financial statements, and other financial information included in this report, fairly present in all material respects thefinancial condition, results of operations and cash flows of the registrant as of, and for, the periods presented in this report;
4. The registrant's other certifying officer and I are responsible for establishing and maintaining disclosure controls and procedures (as defined inExchange Act Rules 13a-15(e) and 15d-15(e)) and internal control over financial reporting (as defined in Exchange Act Rules 13a-15(f) and 15d-15(f))for the registrant and have:
(a) Designed such disclosure controls and procedures, or caused such disclosure controls and procedures to be designed under oursupervision, to ensure that material information relating to the registrant, including its consolidated subsidiaries, is made known to us byothers within those entities, particularly during the period in which this report is being prepared;
(b) Designed such internal control over financial reporting to be designed under our supervision, to provide reasonable assurance regardingthe reliability of financial reporting and the preparation of financial statements for external purposes in accordance with generallyaccepted accounting principles;
(c) Evaluated the effectiveness of the registrant's disclosure controls and procedures and presented in this report our conclusions about theeffectiveness of the disclosure controls and procedures, as of the end of the period covered by this report based on such evaluation; and
(d) Disclosed in this report any change in the registrant's internal control over financial reporting that occurred during the registrant's mostrecent fiscal quarter (the registrant's fourth fiscal quarter in the case of an annual report) that has materially affected, or is reasonablylikely to materially affect, the registrant's internal control over financial reporting; and
5. The registrant's other certifying officer and I have disclosed, based on our most recent evaluation of internal control over financial reporting, to theregistrant's auditors and the audit committee of the registrant's board of directors (or persons performing the equivalent functions):
(a) All significant deficiencies and material weaknesses in the design or operation of internal control over financial reporting which arereasonably likely to adversely affect the registrant's ability to record, process, summarize and report financial information; and
(b) Any fraud, whether or not material, that involves management or other employees who have a significant role in the registrant's internalcontrol over financial reporting.
Date: November 6, 2012 /s/ CARY B. WOODCary B. Wood, President and Chief Executive Officer
Exhibit 31.2
CERTIFICATION UNDER SECTION 302 OF THE SARBANES-OXLEY ACT OF 2002
I, Gregory A. Slome, certify that:
1. I have reviewed this Quarterly Report on Form 10-Q of Sparton Corporation;
2. Based on my knowledge, this report does not contain any untrue statement of a material fact or omit to state a material fact necessary to make thestatements made, in light of the circumstances under which such statements were made, not misleading with respect to the period covered by this report;
3. Based on my knowledge, the financial statements, and other financial information included in this report, fairly present in all material respects thefinancial condition, results of operations and cash flows of the registrant as of, and for, the periods presented in this report;
4. The registrant's other certifying officer and I are responsible for establishing and maintaining disclosure controls and procedures (as defined inExchange Act Rules 13a-15(e) and 15d-15(e)) and internal control over financial reporting (as defined in Exchange Act Rules 13a-15(f) and 15d-15(f))for the registrant and have:
(a) Designed such disclosure controls and procedures, or caused such disclosure controls and procedures to be designed under oursupervision, to ensure that material information relating to the registrant, including its consolidated subsidiaries, is made known to us byothers within those entities, particularly during the period in which this report is being prepared;
(b) Designed such internal control over financial reporting to be designed under our supervision, to provide reasonable assurance regardingthe reliability of financial reporting and the preparation of financial statements for external purposes in accordance with generallyaccepted accounting principles;
(c) Evaluated the effectiveness of the registrant's disclosure controls and procedures and presented in this report our conclusions about theeffectiveness of the disclosure controls and procedures, as of the end of the period covered by this report based on such evaluation; and
(d) Disclosed in this report any change in the registrant's internal control over financial reporting that occurred during the registrant's mostrecent fiscal quarter (the registrant's fourth fiscal quarter in the case of an annual report) that has materially affected, or is reasonablylikely to materially affect, the registrant's internal control over financial reporting; and
5. The registrant's other certifying officer and I have disclosed, based on our most recent evaluation of internal control over financial reporting, to theregistrant's auditors and the audit committee of the registrant's board of directors (or persons performing the equivalent functions):
(a) All significant deficiencies and material weaknesses in the design or operation of internal control over financial reporting which arereasonably likely to adversely affect the registrant's ability to record, process, summarize and report financial information; and
(b) Any fraud, whether or not material, that involves management or other employees who have a significant role in the registrant's internalcontrol over financial reporting.
Date: November 6, 2012 /s/ GREGORY A. SLOMEGregory A. Slome, Senior Vice President andChief Financial Officer
Exhibit 32.1
CERTIFICATION PURSUANT TO18 U.S.C. SECTION 1350,
AS ADOPTED PURSUANT TOSECTION 906 OF THE SARBANES-OXLEY ACT OF 2002
In connection with the Quarterly Report of Sparton Corporation (the "Company") on Form 10-Q for the period ended September 30, 2012, as filed with theSecurities and Exchange Commission on the date hereof (the "Periodic Report"), we, Cary B. Wood, President and Chief Executive Officer of the Company,and Gregory A. Slome, Senior Vice President and Chief Financial Officer of the Company, certify, pursuant to 18 U.S.C. § 1350, as adopted pursuant to § 906of the Sarbanes-Oxley Act of 2002, that:
1. The Periodic Report fully complies with the requirements of section 13(a) or 15(d) of the Securities Exchange Act of 1934; and
2. The information contained in the Periodic Report fairly presents, in all material respects, the financial condition and results of operations of theCompany.
Date: November 6, 2012 /s/ CARY B. WOOD
Cary B. Wood, President and Chief Executive OfficerDate: November 6, 2012 /s/ GREGORY A. SLOME
Gregory A. Slome, Senior Vice President and ChiefFinancial Officer