Embed Size (px)
Citation preview

Hindawi Publishing CorporationJournal of Biomedicine and BiotechnologyVolume 2011, Article ID 875309, 8 pagesdoi:10.1155/2011/875309
Research Article
Sparse Logistic Regression for Diagnosis ofLiver Fibrosis in Rat by Using SCAD-Penalized Likelihood
Fang-Rong Yan,1, 2 Jin-Guan Lin,1 and Yu Liu3
1 Department of Mathematics, Southeast University, Nanjing 210096, China2 Department of Mathematics, China Pharmaceutical University, Nanjing 210009, China3 State Key Laboratory of Natural Medicines, China Pharmaceutical University, Nanjing 210009, China
Correspondence should be addressed to Jin-Guan Lin, [email protected] and Yu Liu, liuyu [email protected]
Received 28 November 2010; Revised 3 February 2011; Accepted 24 March 2011
Academic Editor: Sanford I. Bernstein
Copyright © 2011 Fang-Rong Yan et al. This is an open access article distributed under the Creative Commons Attribution License,which permits unrestricted use, distribution, and reproduction in any medium, provided the original work is properly cited.
The objective of the present study is to find out the quantitative relationship between progression of liver fibrosis and the levelsof certain serum markers using mathematic model. We provide the sparse logistic regression by using smoothly clipped absolutedeviation (SCAD) penalized function to diagnose the liver fibrosis in rats. Not only does it give a sparse solution with high accuracy,it also provides the users with the precise probabilities of classification with the class information. In the simulative case and theexperiment case, the proposed method is comparable to the stepwise linear discriminant analysis (SLDA) and the sparse logisticregression with least absolute shrinkage and selection operator (LASSO) penalty, by using receiver operating characteristic (ROC)with bayesian bootstrap estimating area under the curve (AUC) diagnostic sensitivity for selected variable. Results show that thenew approach provides a good correlation between the serum marker levels and the liver fibrosis induced by thioacetamide (TAA)in rats. Meanwhile, this approach might also be used in predicting the development of liver cirrhosis.
1. Introduction
Chronic hepatitis, characterized by hepatic fibrosis, is recog-nized as a health problem with a worldwide prevalence, andit may gradually progress toward cirrhosis and hepatocellularcarcinoma which may induce death. Successful and earlytreatment of chronic hepatitis can prevent development ofcirrhosis and hepatocellular carcinoma. There are two majorsymptoms of chronic hepatitis: necroinflammatory activityand fibrosis. Liver fibrosis is the best sign for predicting thedevelopment of liver cirrhosis [1]. Since there is no corre-lation between aminotransferase activities and fibrosis, ami-notransferase activities cannot be used for the diagnosis offibrosis. Considering that liver fibrosis is reversible in theearly stage, accurate and early diagnosis of liver fibrosis isrequired for better prognosis of chronic hepatitis.
Liver biopsy has to date been the gold standard for thegrading of hepatic inflammation and the staging of hep-atic fibrosis and has been used as the reference standardmethod in evaluations of plasma markers of liver diseases[2]. However, it is an expensive, invasive procedure with
a considerable risk of complications (particularly bleeding)and a small chance (<1 : 1000) of death [3]. And liver biopsysample is only 1 : 50000th of the mass of the liver andtherefore causing the risk of false negative. Even with sampleof adequate sized biopsies, cirrhosis may still be missed in15–30% of liver biopsies [4]. Due to the limitations of biopsyincluding the small but significant mortality rates, samplingerror, inter- and intraobserver variation in pathology report-ing, and provision of a static picture of liver architecture ina dynamic disease process, it is still necessary to look foralternative approaches. Moreover, to evaluate drug efficacy,it is essential to establish appropriate animal models ofliver fibrosis. Since establishing an animal model is time-consuming, usually lasting 8 to 12 weeks, histopathologicexamination may lead to the consumption of animals, andthe testing small proportion cannot reflect the condition ofwhole population. All these would increase the cost anddecrease the efficiency and reliability of the research. In orderto build appropriate animal models for liver fibrosis, alsoit is necessary to develop a reliable and accurate method todiagnose liver fibrosis quickly.

2 Journal of Biomedicine and Biotechnology
The search of a noninvasive method to assess liver fibrosishas encouraged the development of various approaches.Transient elastography for the noninvasive measurement ofliver stiffness was developed [5–7]. Currently, it is notablethat monitoring serum markers of liver fibrosis could offeran attractive alternative to liver biopsy, as it allows dynamiccalibration of fibrosis efficaciously. Liver fibrosis is charac-terized by an overall increase of the extracellular matrix,mainly produced by hepatic stellate cells (HSCs) [8, 9],which undergo a phenotypic switch induced within theinflammation process by numerous cells and cytokines. Anumber of potential serum markers of fibrosis and cirrhosishave been used in the diagnosis of a variety of chronic liverdiseases.
Therefore, monitoring a variety of plasma markers, espe-cially collagen-related biomarkers such as aminoterminalpeptide of procollagen III (PIIINP), is a novel approach forliver fibrosis diagnosis. In general, there are many plasmamarkers identified but some of them still have not been deter-mined yet. So constructing a sparse classification for the pro-gression of liver fibrosis based on detected plasma markershas attracted much attention. A novel method is linear dis-criminant analysis with stepwise variable selection. Guyonet al. [10] proposed a recursive feature elimination techniquewith support vector machine to analyze gene expressiondata. Rocke and Nguyen [11] raised dimension reduction ofmicroarray-based classification. Li et al. [12] introduced twobayesian approaches with technique of automatic relevancedetermination for the same problem. Debashis and Arul [13]suggested that linear discriminant function by optimal scor-ing with LASSO was an alternative approach. Sparse Fisher’slinear discriminant analysis, suggested by Qiao et al. [14],was also an excellent method.
The aim of this study, therefore, is to develop classi-fication rules based on the consideration of measures ofdiagnostic accuracy. In particular, we are interested in findingliver fibrosis that can discriminate between two populations.Our solution was to combine the problems of variableselection and classification. We suggested an approach forclassification using the smoothly clipped absolute deviationpenalty �SCAD) [15] approach with logistic regression[16]. We compared it with the stepwise linear discriminantanalysis (SLDA) and sparse logistic regression (SLR) withleast absolute shrinkage and selection operator (LASSO-)pe-nalized function [17, 18]. At last, we analyzed the sen-sitivity of these methods using the receiver operating charac-teristic (ROC). Considering the small sample size, we fit theROC curve and compute the area under the curve (AUC)using Bayesian bootstrap [19, 20].
2. Materials and Method
2.1. Animals. Twenty-eight Sprague-Dawley (SD) rats wereprovided from SLAC Laboratory Animal Co.ltd (Shanghai,China, SCXK: 2007-0005). The rats were maintained underspecific-pathogen-free conditions, with a constant tempera-ture ranging between 25 and 27◦C, and a constant humidityranging between 45 and 50% at animal laboratory of China
Pharmaceutical University. Animal care was in accordancewith the guidelines of the animal laboratory of China Phar-maceutical University.
2.2. Induction Of Liver Fibrosis. The modeling method is inaccord with Imanishi et al. [21] and Kuriyama et al. [22].The rats were randomly divided into 4 subgroups: (I) modelgroup (8 weeks, n = 8), (II) model group (12 weeks, n = 8),(III) normal control group (8 weeks� n = 6), and (IV)normal control group (12 weeks, n = 6). All rats wereobserved at 8th week and 12th week after TAA treatment.Rats in the model subgroup were injected intraperitoneally(i.p) with TAA 3 consecutive days per week and lasted for8 weeks at a dose of 6% TAA 200 mg/kg as an initial dose.The doses after the first time were modified according toweekly weight and AST changes in response to TAA duringthe induction. Rats in normal control groups were treatedwith saline. After the final administration in the 8th and 12thweeks, blood samples were collected and serum was sepa-rated by centrifugation at 4◦C and kept at −20◦C for furtheranalysis. Then all rats were sacrificed under anesthesia. Thelivers were washed with cold saline, and a part of the righthepatic lobular was removed and stored in liquid nitrogen forcontent detection of hydroxyproline. The remaining part ofthe right hepatic lobular was made into slices for pathologicaldiagnosis. Several serum markers and liver function indicesstudied in clinical research were measured at the 8th and12th weeks, respectively. There are many serum markersreported as the liver function indices. After consideration, weultimately chose hyaluronan (HA), serum laminin (LN),collagen Type I (Col I), IV collagen (IVC), procollagen III(PC-III), aspartate aminotransferase (AST), albumin (Alb),hydroxyproline (Hyp), total protein (TP), and total bilirubin(T.Bil) [7, 23] in this study. The liver tissue slices wereobserved and diagnosed by HE, Masson-trichrome staining,and transmission electron microscope. Then the relationshipbetween the serum index and the occurrence of liver fibrosiswas analyzed by statistics model.
2.3. Statistics Model and Solution
2.3.1. Statistics Model. Let {(x1, y1), (x2, y2), . . . , (xn, yn)} beinput-output pairs of a given data set� where xi in Rp isvariable levels of plasma markers and yi in {0, 1} is the typeof liver fibrosis occurs or not identified in liver biopsy. Here,n is the number of liver biopsy and p is the number of plasmamarkers. For binary logistic regression, we can write it as
πi(x) = pr(yi = 1 | xi
) =exp{g(xTi β
)}
1 + exp{g(xTi β
)} , (1)
where g(xTi β) = xTi β, i = 1, 2, . . . ,n. Then, the log-likelihood function of this binary logistic regression is
l(β) =
∑[yi logπi +
(1− yi
)log(1− πi)
]. (2)
Journal of Biomedicine and Biotechnology 3
Further, the SCAD-penalized maximum likelihood functionis
l(β)
+ np∑
j=1
pλj(∣∣∣βj
∣∣∣)
, (3)
where
p′λj (θ) = λ{I (θ ≤ λ) +
(aλ− θ)+
(a− 1)λI (θ > λ)
}(4)
for some a > 2 and θ > 0.In general, pλj may be different coefficients. Here, we
make λ = λj . In other words, the same penalty function isapplied to each component of β [24]. Generally, λ can beselected by GCV. Another alternative penalized function isthe least absolute shrinkage and selection operator [17].They suggested the penalized function could be selected withpλj = λj|βj|. The algorithm can be carried with least angleregression [25]. Making λ = λj , the penalized maximumlikelihood with LASSO is
n−1l(β)
+ λp∑
j=1
∣∣∣βj
∣∣∣. (5)
Once the regression coefficient β is estimated, the classifier isconstructed as follows. Let c(i | j) be the cost of classifyingan observation to the i class when the true class is j. Then,a new tissue sample with plasma markers x is classified intoclass c(x), where c(x) becomes
c(x) = arg min∑
c(i | j)pr
(y = j | x). (6)
In practice, c(i | j) are equal which is most frequent. Sominimum c(x) is equal to arg max j pr(y = j|x).
2.3.2. Solution. In this study, we principally discuss theSCAD penalized. It can be locally approximated by a quad-ratic function as follows:
[pλ(∣∣∣βj
∣∣∣)]′ = p′λ
(∣∣∣βj
∣∣∣)(
βj
)≈
p′λ(∣∣∣βj0
∣∣∣)
∣∣∣βj0
∣∣∣
βj(1). (7)
In other words,
pλ(∣∣∣βj
∣∣∣)≈ pλ
(∣∣∣βj0
∣∣∣)
+12p′λ(∣∣∣βj0
∣∣∣)(
β2j − β2
j0
). (8)
Then, the penalized log-likelihood can be locally approxi-mated by
l(β0)
+∇l(β0)T(
β− β0)
+12
(β− β0
)T∇2l(β0)(β− β0
)
+12nβT
∑
λ
(β0)β,
(9)
where
∇l(β0) = ∂l
(β0)
∂β, ∇2l
(β0) = ∂2l
(β0)
∂β∂βT,
∑
λ
(β0) = diag
⎧⎨
⎩p′λ∣∣β10
∣∣
∣∣β10
∣∣ , . . . ,
p′λ∣∣∣βp0
∣∣∣
∣∣∣βp0
∣∣∣
⎫⎬
⎭.
(10)
We then estimate β as follows:
β1 = β0 −⎧⎨
⎩∇2l(β0)
+ n∑
λ
(β0)⎫⎬
⎭
−1⎧⎨
⎩∇l(β0)
+ n∑
λ
(β0)⎫⎬
⎭,
(11)
where
∇l(β0) = ∂l
(β0)
∂β= X′
(Y −
∏),
∇2l(β0) = ∂2l
(β0)
∂β∂βT= X′VX,
(12)
Y = (y1, y2, . . . , yn)′,∏ = (π1,π2, . . . ,πn), V = diag(πi · (1−
πi)), and X is an index matrix. Given the good initial valueβ0, the penalized maximum likelihood can be as efficient asthe fully iterative procedure.
2.3.3. Simulation Studies. In this subsection, we numericallycompare the proposed approach of variable selection andclassification methods with SLDA and LASSO methods.
We simulate 1000 datasets when n = 20, 40, 60, 100respectively, from the model Y ∼ Bernoulli{π(xTβ)}, whereπ(u) = exp(u)/(1 + exp(u)) and β = (3, 1.5, 0, 0, 2, 0, 0, 0).The previous six components of x come from a standardnormal distribution. The correlation between xi and xj isρ|i− j| with ρ = 0.5. The last two components of x areindependently and identically distributed as a Bernoullidistribution with probability of success 0.5. All covariatesare standardized. This model was used in Tibshirani et al.[17]. The classification standard is based on the probabilityarg max pr(y = j|x).
Define
MedTrue = median{
1− Υ|YPredict − YOracle|n
},
MeanTrue = mean{
1− Υ|YPredict − YOracle|n
}.
(13)
The true classification ratio is computed via 1000 MonteCarlo simulations. The summary of simulation results isdepicted in Table 1.
Table 1 shows that the true classification ratio associateswith the sample size n. With the increase of the sample size n,the true classification ratio tends to one. Another importantkey point: three methods are all working well for large samplesize n.
3. Result
3.1. Histopathology of Liver Fibrosis. Typical liver fibrosis wasinduced after 8 weeks of TAA treatment, with the hepatofi-brosis pathological characteristics of fibroblast extendingaround from central venous or portal area, forming the ob-vious fiber separator without the formation of false lobules.From the light microscope, it could be seen that pathologicalslice of normal animals had clear lobule, there was no edemaor denatured fat in liver cells, and Sinus hepaticus had

4 Journal of Biomedicine and Biotechnology
Table 1: True classification ratio simulations results.
nSLDA SLR-LASSO SLR-SCAD
MedTrue MeanTrue MedTrue MeanTrue MedTrue MeanTrue
20 0.95 0.9335 0.9 0.8559 0.9 0.8974
40 0.95 0.9558 0.925 0.9285 0.925 0.9254
60 0.9667 0.9657 0.9667 0.9546 0.95 0.9488
100 0.98 0.9728 0.98 0.9729 0.98 0.9687
SLDA: stepwise linear discriminant analysis.SLR-LASSO: sparse logistics regression-least absolute shrinkage and selection operator.SLR-SCAD: sparse logistics regression-smoothly clipped absolute deviation penalty.
×100
(a)
×100
(b)
×100
(c)
×100
(d)
×100
(e)
×100
(f)
Figure 1: Progression of TAA-induced liver fibrosis in SD rats was assessed by HE and Masson-Trichrome staining at different time pointsof treatment. (a–c) HE staining, (a) Nomal, (b) 8 w Model, and (c) 12 w Model, (d–f) Masson-trichrome staining, (d) Nomal, (e) 8 w Mode,and (f) 12 w Mode.
Table 2: The level of AST in liver tissue during induction (x ± s).
Group Week AST (IU/L)
Normal8 w 37.33± 6.94
12 w 36.27± 6.21
Model8 w 67.37± 8.83∗∗
12 w 40.8± 7.26∗∗
P < .05, compared to the normal group.
no expansion and congestion (Figures 1(a) and 1(d)). Thepathological slice of model animals had obvious fibroplasiasextending from the central venous or portal area to sur-rounding area, which formed the clear fibrous septa. Theliver cells had mild steatosis with lipid droplet and vacuoles
accompanied by mild bile duct hyperplasia (Figures 1(b),1(c), 1(e), and 1(f)).
3.2. Serum Markers Analysis. According to Table 3, there wasa major difference between the normal group and controlgroup in several serum markers and liver function indicessuch as HA�LN, IVC, and I Collogen. During the 1st–4th weeks, AST activity reached the peak and there is nosignificant difference (P > .05) in the 5th to 8th weeks(Table 2). In Figure 2, it is shown that after peak value ASTactivity gradually decreased and returned to normal duringthe 12th week. As a matter of fact the level of AST in humangoes up obviously during acute hepatitis, and it correlatewith the severity of the disease. Then the activity of ASTdecreases during the course of liver fibrosis [26]. AST activity

Journal of Biomedicine and Biotechnology 5
Table 3: The content of determined parameters in the serum during TAA induction (x ± s).
Group(A/T) ( AST) (Hyp) (IVC) ( LN ) (PC-III)
(%) (IU/L) (ng/mL) (ng/mL) (ng/mL) (ng/mL)
Normal 46.53± 12.13 36.80± 6.94 137.14± 12.98 18.14± 3.08 10.28± 7.49 7.44± 4.38
Model 40.45± 11.40 54.09± 13.26 193.96± 14.29∗∗ 21.60± 4.07∗∗ 17.78± 6.68∗∗ 10.88± 3.25∗∗
Group(Col I) (HA) (T.Bil) (A/G) (Alb) (TP)
(ng/mL) (ng/mL) (ng/mL) (%) (mg/mL) (mg/mL)
Normal 31.48± 5.27 5.26± 5.49 5.55± 1.19 83.99± 14.45 37.27± 11.56 79.62± 8.64
Model 48.10± 14.68∗∗ 16.86± 8.6∗∗ 4.91± 1.75 73.52± 11.92 32.09± 9.62 79.28± 7.69∗∗
P < .05, compared to the normal group.
Table 4: List of covariates for plasma markers.
Covariates Plasma markers
YDiagnosis the degree liver fibrosis by using thepathological diagnosis
x1 Albumin ratio of total protein (A/T)
x2 Aspartate aminotransferase (AST)
x3 Hydroxyproline (Hyp)
x4 IV collagen (IVC)
x5 Serum laminin (LN )
x6 III collagen (PC-III)
x7 I collagen (Col I)
x8 Hyaluronan (HA)
x9 Total Bilirubin (T.Bil)
x10 Albumin ratio of the globulin (A/G)
x11 Albumin (Alb)
x12 Total protein (TP)
Table 5: List of variable selection results.
SLDA SLR-LASSO SLR-SCAD
Hydroxyproline Hydroxyproline Hydroxyproline
I collagen LN LN
Hyaluronan IV —
— Hyaluronan —
Table 6: List of classification true rates.
SLDA SLR-LASSO SLR-SCAD
Classification true rates (%) 96.15 92.31 96.15
of control group was significantly higher than the normalgroup and decreased slightly in the 12th week without TAAfor four weeks which agrees with the literature [27]. At lasttypical liver fibrosis was induced after 8 weeks of TAA.
3.3. Application. We applied the proposed sparse logisticregression with SCAD, LASSO, and SLDA to the classificationof liver fibrosis. The dataset consisted of 26 observations. Thebinary response variable Y is 1 for those rats who have liverfibrosis and 0 otherwise. All the twelve covariates are consid-ered. All covariates’ meanings were listed in Table 4.
0
10
20
30
40
50
60
70
80
90
100
1 2 3 4 5 6 7 8 9
(week)
(IU
/L)
The change of AST
Figure 2: The change of AST during induction.
Carrying out the procedure, including the SLDA, SLR-SCAD, SLR-LASSO, then the outcome about the selectedvariable and the classification true rates were obtained, re-spectively, according to Tables 5 and 6.
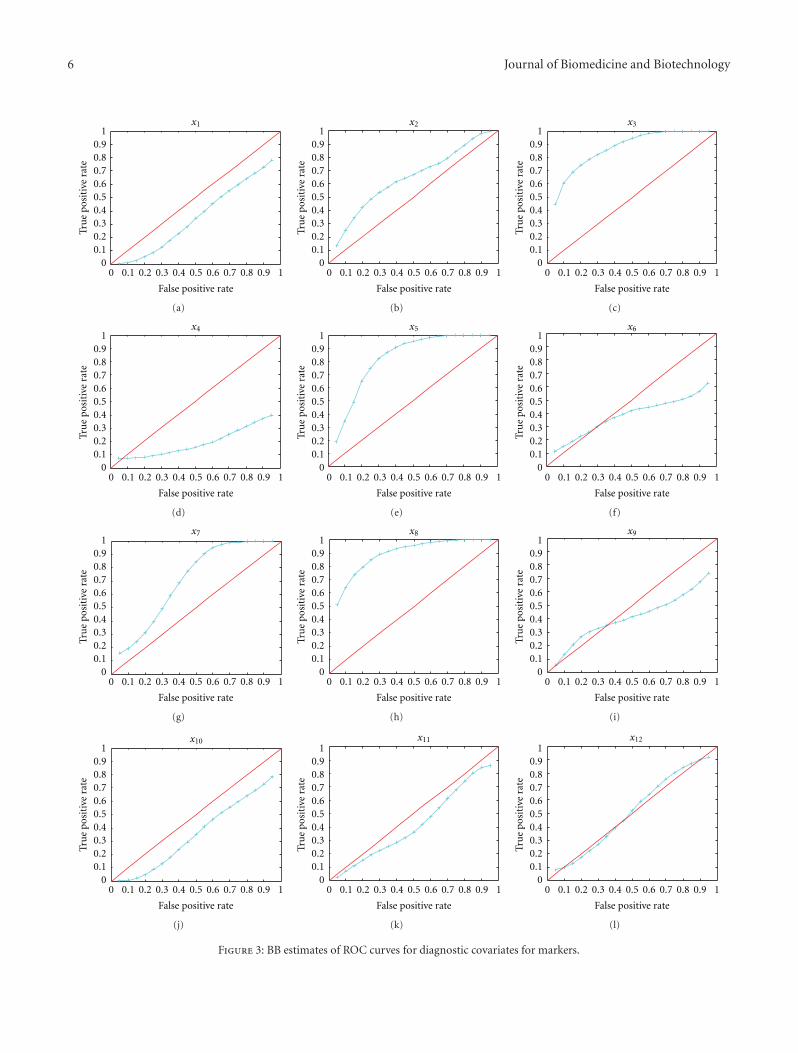
3.4. Test Significance. The receiver operating characteristic(ROC) curve is an excellent method to test the significance ofselected variables. The ROC curve is a plot of the true positivefraction (TPF) as a function the false positive fraction (FPF),or sensitivity versus one minus specificity, and is obtainedby varying the threshold criterion distinguishing betweena positive and negative diagnosis. For example, the diagnosticvariables X ∼ F are for the population without liver fibrosisand Y ∼ G are for those with liver fibrosis, where F andG are the distribution functions. Some features such as theinvariance property and interpretation of the area underthe curve (AUC) as pr(Y > X) make the ROC analysisextremely popular in diagnostics research. Generally, theselected variables are sensitive for the classification if theAUC > 0.7. However, estimation of AUC for the ROC curveis very difficult, especially for the small sample size. Here,we use the Bayesian bootstrap (BB) estimation of AUC,proposed by Kuriyama et al. [22], to test the variables inSLDA, LASSO, and SCAD. The AUC calculation results areshown in Table 7, displaying the sensitivity for classificationvariable Y . Figure 3 described these covariates’ ROC curves.
6 Journal of Biomedicine and Biotechnology
00.10.20.30.40.50.60.70.80.9
1
0 0.1 0.2 0.3 0.4 0.5 0.6 0.7 0.8 0.9 1
False positive rate
Tru
epo
siti
vera
te
x1
(a)
00.10.20.30.40.50.60.70.80.9
1
0 0.1 0.2 0.3 0.4 0.5 0.6 0.7 0.8 0.9 1
False positive rateTr
ue
posi
tive
rate
x2
(b)
00.10.20.30.40.50.60.70.80.9
1
0 0.1 0.2 0.3 0.4 0.5 0.6 0.7 0.8 0.9 1
False positive rate
Tru
epo
siti
vera
te
x3
(c)
00.10.20.30.40.50.60.70.80.9
1
0 0.1 0.2 0.3 0.4 0.5 0.6 0.7 0.8 0.9 1
False positive rate
Tru
epo
siti
vera
te
x4
(d)
00.10.20.30.40.50.60.70.80.9
1
0 0.1 0.2 0.3 0.4 0.5 0.6 0.7 0.8 0.9 1
False positive rate
Tru
epo
siti
vera
te
x5
(e)
00.10.20.30.40.50.60.70.80.9
1
0 0.1 0.2 0.3 0.4 0.5 0.6 0.7 0.8 0.9 1
False positive rate
Tru
epo
siti
vera
te
x6
(f)
00.10.20.30.40.50.60.70.80.9
1
0 0.1 0.2 0.3 0.4 0.5 0.6 0.7 0.8 0.9 1
False positive rate
Tru
epo
siti
vera
te
x7
(g)
00.10.20.30.40.50.60.70.80.9
1
0 0.1 0.2 0.3 0.4 0.5 0.6 0.7 0.8 0.9 1
False positive rate
Tru
epo
siti
vera
te
x8
(h)
00.10.20.30.40.50.60.70.80.9
1
0 0.1 0.2 0.3 0.4 0.5 0.6 0.7 0.8 0.9 1
False positive rate
Tru
epo
siti
vera
tex9
(i)
00.10.20.30.40.50.60.70.80.9
1
0 0.1 0.2 0.3 0.4 0.5 0.6 0.7 0.8 0.9 1
False positive rate
Tru
epo
siti
vera
te
x10
(j)
00.10.20.30.40.50.60.70.80.9
1
0 0.1 0.2 0.3 0.4 0.5 0.6 0.7 0.8 0.9 1
False positive rate
Tru
epo
siti
vera
te
x11
(k)
00.10.20.30.40.50.60.70.80.9
1
0 0.1 0.2 0.3 0.4 0.5 0.6 0.7 0.8 0.9 1
False positive rate
Tru
epo
siti
vera
te
x12
(l)
Figure 3: BB estimates of ROC curves for diagnostic covariates for markers.
Journal of Biomedicine and Biotechnology 7
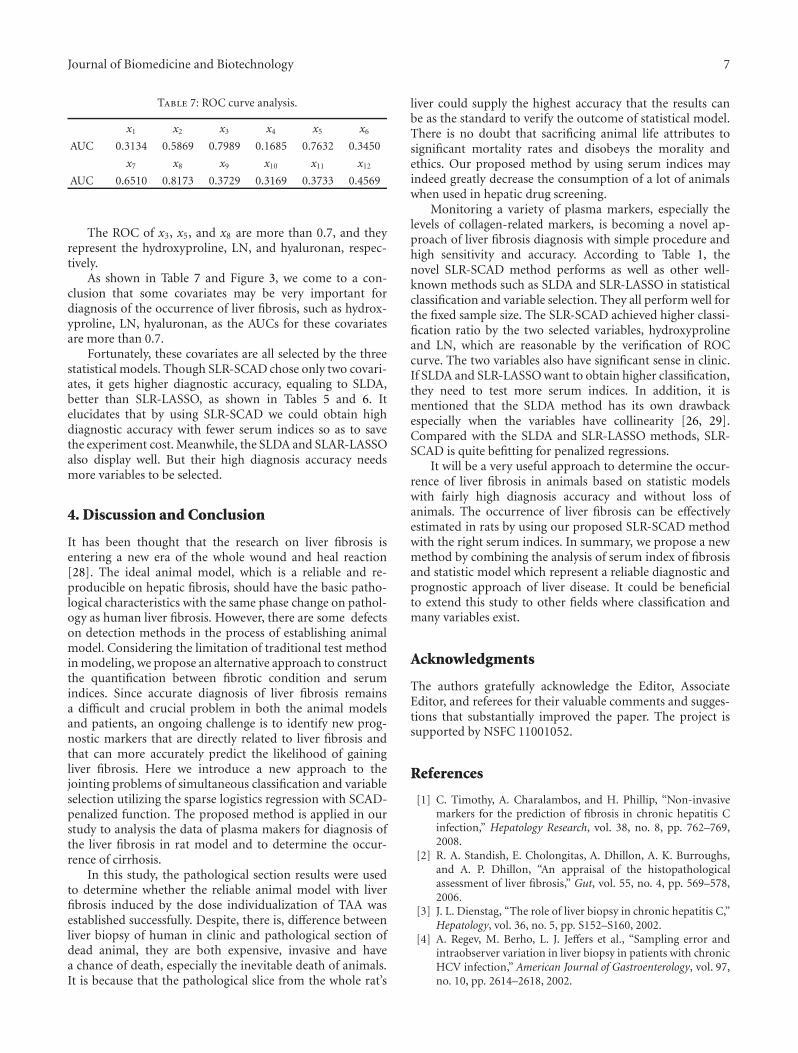
Table 7: ROC curve analysis.
x1 x2 x3 x4 x5 x6
AUC 0.3134 0.5869 0.7989 0.1685 0.7632 0.3450
x7 x8 x9 x10 x11 x12
AUC 0.6510 0.8173 0.3729 0.3169 0.3733 0.4569
The ROC of x3, x5, and x8 are more than 0.7, and theyrepresent the hydroxyproline, LN, and hyaluronan, respec-tively.
As shown in Table 7 and Figure 3, we come to a con-clusion that some covariates may be very important fordiagnosis of the occurrence of liver fibrosis, such as hydrox-yproline, LN, hyaluronan, as the AUCs for these covariatesare more than 0.7.
Fortunately, these covariates are all selected by the threestatistical models. Though SLR-SCAD chose only two covari-ates, it gets higher diagnostic accuracy, equaling to SLDA,better than SLR-LASSO, as shown in Tables 5 and 6. Itelucidates that by using SLR-SCAD we could obtain highdiagnostic accuracy with fewer serum indices so as to savethe experiment cost. Meanwhile, the SLDA and SLAR-LASSOalso display well. But their high diagnosis accuracy needsmore variables to be selected.
4. Discussion and Conclusion
It has been thought that the research on liver fibrosis isentering a new era of the whole wound and heal reaction[28]. The ideal animal model, which is a reliable and re-producible on hepatic fibrosis, should have the basic patho-logical characteristics with the same phase change on pathol-ogy as human liver fibrosis. However, there are some defectson detection methods in the process of establishing animalmodel. Considering the limitation of traditional test methodin modeling, we propose an alternative approach to constructthe quantification between fibrotic condition and serumindices. Since accurate diagnosis of liver fibrosis remainsa difficult and crucial problem in both the animal modelsand patients, an ongoing challenge is to identify new prog-nostic markers that are directly related to liver fibrosis andthat can more accurately predict the likelihood of gainingliver fibrosis. Here we introduce a new approach to thejointing problems of simultaneous classification and variableselection utilizing the sparse logistics regression with SCAD-penalized function. The proposed method is applied in ourstudy to analysis the data of plasma makers for diagnosis ofthe liver fibrosis in rat model and to determine the occur-rence of cirrhosis.
In this study, the pathological section results were usedto determine whether the reliable animal model with liverfibrosis induced by the dose individualization of TAA wasestablished successfully. Despite, there is, difference betweenliver biopsy of human in clinic and pathological section ofdead animal, they are both expensive, invasive and havea chance of death, especially the inevitable death of animals.It is because that the pathological slice from the whole rat’s
liver could supply the highest accuracy that the results canbe as the standard to verify the outcome of statistical model.There is no doubt that sacrificing animal life attributes tosignificant mortality rates and disobeys the morality andethics. Our proposed method by using serum indices mayindeed greatly decrease the consumption of a lot of animalswhen used in hepatic drug screening.
Monitoring a variety of plasma markers, especially thelevels of collagen-related markers, is becoming a novel ap-proach of liver fibrosis diagnosis with simple procedure andhigh sensitivity and accuracy. According to Table 1, thenovel SLR-SCAD method performs as well as other well-known methods such as SLDA and SLR-LASSO in statisticalclassification and variable selection. They all perform well forthe fixed sample size. The SLR-SCAD achieved higher classi-fication ratio by the two selected variables, hydroxyprolineand LN, which are reasonable by the verification of ROCcurve. The two variables also have significant sense in clinic.If SLDA and SLR-LASSO want to obtain higher classification,they need to test more serum indices. In addition, it ismentioned that the SLDA method has its own drawbackespecially when the variables have collinearity [26, 29].Compared with the SLDA and SLR-LASSO methods, SLR-SCAD is quite befitting for penalized regressions.
It will be a very useful approach to determine the occur-rence of liver fibrosis in animals based on statistic modelswith fairly high diagnosis accuracy and without loss ofanimals. The occurrence of liver fibrosis can be effectivelyestimated in rats by using our proposed SLR-SCAD methodwith the right serum indices. In summary, we propose a newmethod by combining the analysis of serum index of fibrosisand statistic model which represent a reliable diagnostic andprognostic approach of liver disease. It could be beneficialto extend this study to other fields where classification andmany variables exist.
Acknowledgments
The authors gratefully acknowledge the Editor, AssociateEditor, and referees for their valuable comments and sugges-tions that substantially improved the paper. The project issupported by NSFC 11001052.
References
[1] C. Timothy, A. Charalambos, and H. Phillip, “Non-invasivemarkers for the prediction of fibrosis in chronic hepatitis Cinfection,” Hepatology Research, vol. 38, no. 8, pp. 762–769,2008.
[2] R. A. Standish, E. Cholongitas, A. Dhillon, A. K. Burroughs,and A. P. Dhillon, “An appraisal of the histopathologicalassessment of liver fibrosis,” Gut, vol. 55, no. 4, pp. 569–578,2006.
[3] J. L. Dienstag, “The role of liver biopsy in chronic hepatitis C,”Hepatology, vol. 36, no. 5, pp. S152–S160, 2002.
[4] A. Regev, M. Berho, L. J. Jeffers et al., “Sampling error andintraobserver variation in liver biopsy in patients with chronicHCV infection,” American Journal of Gastroenterology, vol. 97,no. 10, pp. 2614–2618, 2002.
8 Journal of Biomedicine and Biotechnology
[5] Y. Kentaro, K. Naoto, and H. Senju, “Transient elastography:applications and limitations,” Hepatology Research, vol. 38, no.11, pp. 1063–1068, 2008.
[6] S. C. Gordon, I. Jacobson, C. Hezode et al., “Evaluation ofa panel of non-invasive serum markers to differentiate mildfrom moderate-to-advanced liver fibrosis in chronic hepatitisC patients,” Journal of Hepatology, vol. 41, no. 6, pp. 935–942,2004.
[7] E. Giannini and R. Testa, “Noninvasive diagnosis of fibrosis:the truth is rarely pure and never simple,” Hepatology, vol. 38,no. 5, pp. 1312–1313, 2003.
[8] S. Naveau, B. Raynard, V. Ratziu et al., “Biomarkers for theprediction of liver fibrosis in patients with chronic alcoholicliver disease,” Clinical Gastroenterology and Hepatology, vol. 3,no. 2, pp. 167–174, 2005.
[9] E. Rossi, L. Adams, A. Prins et al., “Validation of the FibroTestbiochemical markers score in assessing liver fibrosis in hepati-tis C patients,” Clinical Chemistry, vol. 49, no. 3, pp. 450–454,2003.
[10] I. Guyon, J. Weston, S. Barnhill, and V. Vapnik, “Gene selectionfor cancer classification using support vector machines,”Machine Learning, vol. 46, no. 1–3, pp. 389–422, 2002.
[11] D. M. Rocke and D. V. Nguyen, “On partial least squaresdimension reduction for microarray-based classification:a simulation study,” Computational Statistics and Data Anal-ysis, vol. 46, no. 3, pp. 407–425, 2004.
[12] Y. Li, C. Campbell, and M. Tipping, “Bayesian automatic rel-evance determination algorithms for classifying gene expres-sion data,” Bioinformatics, vol. 18, no. 10, pp. 1332–1339, 2002.
[13] G. Debashis and M. C. Arul, “Classification and selectionof biomarkers in genomic data using LASSO,” Journal ofBiomedicine and Biotechnology, vol. 2005, no. 2, pp. 147–154,2005.
[14] Z. Qiao, L. Zhou, and J. Z. Huang, “Sparse linear discriminantanalysis with applications to high dimensional low sample sizedata,” IAENG International Journal of Applied Mathematics,vol. 39, no. 1, pp. 1–13, 2009.
[15] J. Fan and R. Li, “Variable selection via nonconcave penalizedlikelihood and its oracle properties,” Journal of the AmericanStatistical Association, vol. 96, no. 456, pp. 1348–1360, 2001.
[16] Y. Kim, S. Kwon, and S. Heun Song, “Multiclass sparse logisticregression for classification of multiple cancer types using geneexpression data,” Computational Statistics and Data Analysis,vol. 51, no. 3, pp. 1643–1655, 2006.
[17] R. J. Tibshirani, “Regression coefficient and autoregressiveorder shrinkage and selection via the LASSO,” Journal of theRoyal Statistical Society B, vol. 58, no. 1, pp. 267–288, 1996.
[18] R. Tibshirani, “The LASSO method for variable selection inthe cox model,” Statistics in Medicine, vol. 16, no. 4, pp. 385–395, 1997.
[19] D. B. Rubin, “The bayesian bootstrap,” The Annals of Statistic,vol. 9, no. 1, pp. 130–134, 1981.
[20] J. Gu, S. Ghosal, and A. Roy, “Bayesian bootstrap estimationof ROC curve,” Statistics in Medicine, vol. 27, no. 26, pp. 5407–5420, 2008.
[21] Y. Imanishi, N. Maeda, K. Otogawa et al., “Herb medicineInchin-ko-to (TJ-135) regulates PDGF-BB-dependent signal-ing pathways of hepatic stellate cells in primary culture andattenuates development of liver fibrosis induced by thioac-etamide administration in rats,” Journal of Hepatology, vol. 41,no. 2, pp. 242–250, 2004.
[22] S. Kuriyama, M. Yamazaki, A. Mitoro et al., “Hepatocellularcarcinoma in an orthotopic mouse model metastasizes intra-hepatically in cirrhotic but not in normal liver,” InternationalJournal of Cancer, vol. 80, no. 3, pp. 471–476, 1999.
[23] P. Bedossa, D. Dargere, and V. Paradis, “Sampling variabilityof liver fibrosis in chronic hepatitis C,” Hepatology, vol. 38, no.6, pp. 1449–1457, 2003.
[24] J. Fan and H. Peng, “Nonconcave penalized likelihood witha diverging number of parameters,” Annals of Statistics, vol. 32,no. 3, pp. 928–961, 2003.
[25] B. Efron, T. Hastie, I. Johnstone et al., “Least angle regression,”Annals of Statistics, vol. 32, no. 2, pp. 407–499, 2004.
[26] P. L. Flom and D. L. Cassell, “Stopping stepwise: why stepwiseand similar selection methods are bad, and what use,” inProceedings of the 20th Conference for the NorthEast SAS�Users Group (NESUG ’07), 2007.
[27] F. H. Anderson, L. Zeng, N. R. Rock, and E. M. Yoshida, “Anassessment of the clinical utility of serum ALT and AST inchronic hepatitis C,” Hepatology Research, vol. 18, no. 1, pp.63–71, 2000.
[28] S. L. Friedman, D. C. Rockey, and D. M. Bissell, “Hepatic fibro-sis 2006: report of the third AASLD single topic conference,”Hepatology, vol. 45, no. 1, pp. 242–249, 2007.
[29] F. E. Harrell, Regression Modeling Strategies: With Applicationsto Linear Mode to Logistic Regression, and Survival Analysis,Springe, New York, NY, USA, 2001.