Embed Size (px)
Citation preview
. . . . . .. . .
Summer School Alpbach 2002 – Space Weather: Physics, Impacts and Prediction Team 2 Workshop
Space Tourist On-board Protection Summary Report of the Summer School Alpbach 2002 Team 2 Workshop

Summer School Alpbach 2002 – Space Weather: Physics, Impacts and Prediction Team 2 workshop
ii
STOP mission Scope The aim of this study is to establish a service for providing space weather predictions for the space tourism companies. In order to accomplish this we will identify the requirements of the potential users, establish the required data, and evaluate how to obtain, distribute, and cost both data and end products.
Team Steiner, René Principal Investigator
PREDICTION CENTRE OPERATIVE MISSION CENTRE
Jensen, Jesper Munk Spokesperson Allegrini, Frédéric Spokesperson Aran, Angels Radiation Hazards/Models Bechara, John Launch & Orbit Bodiselitsch, Bernd Industry Outlook Birnbacher, Ulla Telecommunication Culot, Frederic User Requirements Halain, Jean-Philippe S/C Design, Output Team Jaritz, Gerald Industry Outlook Puhakka, Pekka Radiation Environment Leitner, Martin Industry Outlook Röhrbein, Dennis Satellite Design Mierla, Marilena Solar Eruption Vaith, Hans Payload Palmroth, Minna Modeling Pulkkinen, Antti User Requirements,
Models DATA CENTRE
Reay, Sarah Radiation Hazards Stampe, Mia Spokesperson Shevyrev, Nikolay Models Bogdanova, Yulia Mission Data
Grosser, Jan External Data, Output Team Tavares de Figueiredo, Sonia Sofia
Models, Editor Haaland, Stein Mission Data
Turkmani, Rim Output Team, Economics Laivola, Jarno Mission Data Osmundsen, Ellen External Data Saetre, Camilla Infrastructure

Summer School Alpbach 2002 – Space Weather: Physics, Impacts and Prediction Team 2 workshop
iii
Table of content STOP MISSION II Scope ii Team ii TABLE OF CONTENT III WHY GO INTO SPACE? 1 MARKET FORECASTING 1 Market studies 2 PREDICTION CENTRE 2 Review of Radiation Environment 2 Risk Assessment 2 User requirements 3 Prediction Models 3 Physical parameters to be measured 4 DATA CENTRE 5 Infrastructure for STOP 5 Strategy for collecting data 6 SERVICE CENTRE 7 Commercial Services 7 Free Services 7 Procedure 7 SPACE SEGMENT 7 Overview 7 STOP-1 structure 8 STOP-1 launch and orbit 8 AOCS 8 Radiation environment 9 Telecommunication 9 STOP-1 payload 10 Interfaces to the Spacecraft 11 STOP-1 Mass Budget 11 COST ANALYSIS 11 Phase I 11 Phase II 12 REFERENCES 13

Summer School Alpbach 2002 – Space Weather: Physics, Impacts and Prediction Team 2 workshop
1
Why Go Into Space? “For many people, the idea of venturing into space is a closely held dream. The thrill of being selected to strap into a space vehicle and roar towards the heavens, of freely floating in three-dimensional space and looking down at the earth below is at once sublime and euphoric. It is hard to put words to the feelings of this group of dreamers; they are at once passionate and committed, perhaps beyond what surveys can capture [1].”
“The strong consensus view of the Workshop was that is a very real potential for a large profitable commercially-driven general public space travel and tourism business to begin to develop beginning a very few years from now” [2].
Space Tourism is no longer just a dream! The first genuine commercial space tourist entered the International Space Station in 2001. Space Tourism has been a subject of discussion right from the start of the space era.
The first detailed concept of passenger transport by rocket airplanes was developed and published by W. Dornberger in 1955. In this description the passenger would reach an altitude of about 100km and thus become space travelers. A Single-stage-to-orbit vehicle (SSTO) was suggested in 1985 for commercial use. The idea was to transport the first tourist to orbit, but the concept did not find much support at that time due to the high risk involved. In 1994 a NASA study concluded that the technology is in sight to develop a SSTO and launched a multi-year technology program of nearly $1 billion.
Figure 1: Space Tourism
This work proved that the expectations were too optimistic and the program was cancelled. More recently, the Japanese Rocket Society proposed a single-stage space vehicle for serving space tourists. This will offer trips into space circling the earth twice or for a full day. It intends to carry 50 passengers per trip.
Market forecasting The first space tourist Dennis Tito paid $20 million for a visit to the International Space Station. Although this should not be regarded as the birth of commercial space tourism it highlights now eager some individual are for space tourism (ST).
Many surveys have been carried out to estimate people’s readiness for ST. Most showed that ST is likely to be an emerging sector in Tourism. For example a survey in the US published in a NASA report [6] showed that 34% of 1500 families said that they are keen to go into space. On average they were willing to pay $10,800 for the experience. Hence the ST market has tens of millions of potential customers who would like to take the trip to space if they can afford it.
On the other hand detailed studies of the financial market and the cost efficiency of ST were performed in Germany [3, 4, and 5], the Unites States [6] and Japan [7]. The most pessimistic study estimated that Space transportation can bring a 29% return on investment in the public sector and 18% in the private sector. The average ticket price was estimated to be $100,000 of which $58,000 would cover the costs [5]. A study by rocketfinance.com [3] showed that a typical ST venture must return 17.6% otherwise it would not be a good investment. The results of various market surveys is summarised below.

Summer School Alpbach 2002 – Space Weather: Physics, Impacts and Prediction Team 2 workshop
2
Market studies o JSR study (1993) [7]
o 1 million space tourists per year in Japan. o Annual turnover of $14 billion for a ticket price of $14,000
o DASA study (1995) [4] o 450,000 space tourists per year in Europe. o Annual turnover of $20 billion for ticket prices under $50,000
o NASA study (1997) [6] o $10-20 billion per year in US.
o TU Berlin study (97/98) [3] o 100,000 space tourists per year globally. o Annual turnover of $9 billion for ticket prices of under $100,000
Even in the most detailed of these studies, not one accounted for the cost of monitoring the space weather hazards. Detailed studies investigating passengers’ health and wellbeing included the details of hygienic artificial gravity toileting and building sport centre in space hotels but nothing reflected the awareness of the exposure to radiation.
The space weather hazard is one that cannot be ignored and could have serious implications for the passengers, crew and ultimately the space tourism company. A fledgling space tourism company could go out of business if it does not correctly asses the risk involved in such excursions and its legal implications. Equally insurance companies will need to be aware of such risks.
After contacting some of ST companies we were surprised that some confessed they had not considered this issue. One said it was ready to pay a couple of hundreds of Euros per person for a space weather service tailored for Space Tourists. We believe this to be a gross under-estimation of the value of this service and estimate that after educating companies in the potential risks we would be willing to pay up to 0.5% of the ticket price to insure crew and passenger safety.
Prediction centre Review of Radiation Environment The radiation environment comes from three sources: Galactic Cosmic Rays (GCR), the Earth’s Radiation Belts and Solar Particle Events (SPE). All three can expose extraterrestrial tourists to a variety of potentially harmful radiation.
The GCR flux varies by a factor of 2.5 during the solar cycle [10]. This is well documented and exposure can be predicted. The Radiation Belts are also generally predictable and at the orbits discussed only the South Atlantic Anomaly (SAA) is significant. SPE’s however are not at all predictable. These tend to originate from solar flares although only a few flares will produce a SPE. Flare prediction and hence SPE prediction is impossible at present.
The Earth’s atmosphere and geomagnetic field can provide shielding from these effects but depending on orbital altitude, inclination and duration exposure can become significant.
Risk Assessment To highlight the potential risk to space tourists an estimated dose was required. For this we used the radiation model within SPENVIS to calculate dose. We assumed a launch from Baikonour with inclination of 53° during 2002 (the declining phase of the solar maximum).
Flight Inclination Dose at 2mm Al Dose at 10mm Al SPE 20 3,3 53°
No SPE 4.2 0.03 Table 1: Estimated dose in RAD for 53° orbit at 400km

Summer School Alpbach 2002 – Space Weather: Physics, Impacts and Prediction Team 2 workshop
3
To compare, the current public radiation limit is <1 REM/year [4]. So even within a well shielded vehicle tourists would be exposed to a significant amount of radiation. It is also worth noting that atmospheric shielding above 100km is marginal so the level of exposure to SPE’s would be comparable to those in an orbital flight.
Obviously the case presented is only one scenario. At a high inclinations radiation is experienced at the poles and through the SAA. Lower inclination flights would reduce this hazard. Furthermore, the model used assumes a simplistic view of geomagnetic shielding. Above L5 it assumes no shielding and below absolute shielding [5]. To provide an accurate dose estimate we would have to improve on this model. Currently there is a model that can more accurately account for the penetration of protons through the radiation belts; this however has not been used in our calculations presented above. A similar case has been run this model and its results suggest an even greater dose exposure. It is obvious that in the event of a SPE we would advise our customers not to launch.
User requirements 1. Forecast
• Fluences of protons and electrons at the spacecraft orbit that can penetrate the shielding. • Warning about the possible erupting regions at the surface of the Sun. • Estimation for the reliability of forecasts.
2. Nowcast • Onset of magnetic storm or L1 event (e.g. prolonged southward IMF) • Alert of SEP event when observed. • Fluences of SEP events at interplanetary medium (e.g. L1). • Fluences of protons and electrons at the spacecraft orbit. • Fluences of Galactic Cosmic Rays at ground-based neutron monitor locations.
3. Post-event analysis • We will provide high energy particle (protons, electrons, neutrons) measurement devices,
installed outside spacecraft and dosimeters worn by the crew. o Radiation history of flights (total fluence of each flight). o Personal fluence history /log of each crew member.
• Continuous checking and improvement of prediction models and information provided to the client.
4. Consultancy • Information about prediction models used for forecasting. • Information on health issues (e.g. the effect of certain amount of total equivalent doses). • Information about shielding needed for given radiation environment. • General information about space weather.
Prediction Models Prediction of Solar Flares
Solar flares are large explosions on the Sun that release a huge amount of radiation across the electromagnetic spectrum, from radio waves to x-rays and gamma-rays. They can cause problems for both aircraft and humans, and hence there is much interest in predicting when they are likely to occur.
We will use BBSO Flare Prediction System [13]. This is a statistical model which gives an estimate of a flaring probability for the following 24-hours, assuming that the number of flares per unit time is governed by Poisson distribution [14]. Data needed in this method are magnetograms or H-alpha images.
These flare probabilities were calculated using NOAA Space Environment Centre data since November 1988 to June 1996.The percentage probabilities are based on the number of flares produced by regions classified using McIntosh classification scheme during cycle 22. The flare probability for the next 24 hours is estimated using formula P = 1-e-mean, where ‘mean’ is the mean X-class flare rate.

Summer School Alpbach 2002 – Space Weather: Physics, Impacts and Prediction Team 2 workshop
4
Forecast of Solar Energetic Particles events in the planetary medium – SEPIS engineering model
To forecast the flux and fluence of gradual SEP events the Solar Energetic Particles in Interplanetary
Space engineering model (SEPIS) will be used [15]. At present, this model is based on a 212 MHD shock
propagation model [16] combined with a particle transportation model [17]. This engineering model provides proton flux and cumulative fluence profiles for 0.5 MeV to 2.0 MeV, for spacecraft located at 1 AU (and 0.4 AU for a subset of cases).
It also calculates the transit time and velocity of the shock as well as the total fluence of the event (from the ignition of the solar parent activity up to the arrival of the shock of the spacecraft). In the following years, it is planned to improve this model by expanding the database to more scenarios and energies using a 3D MHD model for the shock propagation and an improved particle transportation code. Downstream fluences will also be calculated.
SPENVIS – A tool kit for modeling radiation environment The current state-of-the-art tool kit for predicting the radiation environment in the near-Earth space is called SPENVIS. SPENVIS has been developed to calculate the particle fluxes, fluences, and doses from radiation belts, solar particle events, and galactic cosmic rays at an arbitrary satellite orbit. The electron and proton differential fluxes from radiation belts are calculated using AE8 [18] and AP8 [19] models in a magnetic field model, which does not yet depend on the level of geomagnetic activity.
However, the largest hazard to crew members and the passengers comes from the solar particle events, which are treated statistically in the SPENVIS tool kit. The cosmic ray flux depends on the solar cycle phase which is approximated by a sine wave. SPENVIS gives a 95% reliable worst case scenario prediction of the radiation environment. However in the future, the tool kit will be improved to provide a more optimistic prediction of the Earth's radiation environment.
Physical parameters to be measured MEASUREMENT PURPOSE LOCATION TIME
RESOLUTION TEMPLATE
INSTRUMENT
Solar wind - IMFBr
Modeling L1 ≤ 15 min ACE MAG
SW – density bulk vel. Modeling L1 ≤ 1 hr as the one on ACE
UV - images Localizing flare; Coronal holes tracking
L1 ≤ 20 min EIT
Coronograph CME detection and propagation L1 ≤ 20 min LASCO C1 - C3 Proton flux
(50 keV – 200 MeV) Nowcasting;
Forecast evaluation L1 ~ minutes ERNE, CELIAS
(SOHO) EPAM, SIS (ACE)
X-ray flux Flare magnitude L1 / GEO 1 min as the one on GOES
Neutron monitor Galactic cosmic ray flux Ground ~ hrs SONTEL (Gornergrat)
Magnetogram Sun surface
Flare prediction; Sunspot number L1 /ground ~ hrs MDI / BIG BEAR
Radio flux Estimating CME arrival time Ground ~ hrs Culgoora Solar Observatory
High energetic particles flux
Evaluate model performance; nowcasting passengers radiation
environment
At the tourists s/c
as good as possible
ERNE
Kp, Dst indices Nowcasting magnetic substorms Ground ~ 10 min -
Table 2: Physical parameters to be measured

Summer School Alpbach 2002 – Space Weather: Physics, Impacts and Prediction Team 2 workshop
5
The diagram of Figure 2 illustrates the measurements and modes that will be used by STOP.
Figure 2: Prediction Models
Data centre Infrastructure for STOP Communication
• With our own spacecraft: Operation Centre and three ground stations (GND). • Internal data network within the STOP-centre. • Communication with users: Service Centre (SC) including web site. • Ground based data and data from other satellites: depends on agreement with the different
organisations. To ensure security, this will be done on a scientific network, not on the internet.
Dataflow • Satellite:
The flow of data is illustrated in Figure 3. Data from our own spacecraft are received via 3 dedicated GNDs. Decoding (e.g. separating housekeeping from science data, correct for packet loss etc.) takes place in the Packet Processing System (PPS). Science data are sent to the Online Data Centre (ODC) where calibration and conversion into physical parameters (B-field, plasma moments, ephemeris parameters etc.) are done. The output of this process is immediately (near-real time) available for the Prediction Centre (PC) as input for their models. Summary data with lower resolution (and not necessarily

Summer School Alpbach 2002 – Space Weather: Physics, Impacts and Prediction Team 2 workshop
6
real time) is also put on a web server. For statistical and modelling purposes, all designs output data are also archived. This archive is also available for the prediction centre.
• Within STOP-centre:
Calculated physical parameters will be sent, together with parameters from the other sources, to the PC. The final prediction from the PC will be delivered to the customer via the SC. The parameters and the final predictions will be stored in a database.
• Users: Interact with the SC.
Space Segment (SS)
Data Centre (DC)
Service Centre (SC)
Prediction Centre (PC)
Other data(sat. + gr.b.)
Consultants(medico etc.)
USERS
Telemetry
Final prediction, forecast/nowcastConsultationOutput of consultation
Figure 3: STOP infrastructure diagram
Strategy for collecting data Dynamic Data Access Strategy (DDAS) is our plan to secure the continuous data flow in the timescale of years or even decades. STOP organization will monitor the latest and up-coming space programs and our current needs and focus closely in the missions in our fields of interest.
Thus we can build back-up plans with adequate overlapping between different data sources. Reliability, possibilities to integrate the data to our needs and the direct distribution from server-to-server will be the most important criteria while doing the evaluation. Contacts to the co-operating organisations will be done case-by-case. Thus we can ensure that the needs of both sides will be fulfilled to maximum extent.
In order to get the real-time data coverage of essential parameters we can provide i.e. the scientific data of STOP-1, some hardware facilities like servers and network resources and fund the maintenance work done in co-operating organizations. STOP will focus strictly on the space weather services and leave the fundamental science to academia.
We will use the available data from the spacecraft and ground based instruments mentioned in Table 2 until we launch our own satellite in 2007.
There are several problems with these sources. One is that the lifetime of spacecraft-missions is limited. Also most of the satellites are designed for scientific purpose and therefore do not monitor continuously. Another important problem is that there are few reliable backup sources in case of instrument failure and closedown of missions. Cooperation with institutes and launching our own satellite will minimize these problems.

Summer School Alpbach 2002 – Space Weather: Physics, Impacts and Prediction Team 2 workshop
7
Service Centre The Service Centre (SC) is the link between the service provider and the clients, which includes paying users (PUs) such as space tourist companies (STCs) as well as non-paying users (NPUs) who can access data and get some services for free.
Commercial Services Alerts and warnings, flight specific forecast for STCs, nowcast, hardware and post-event analysis, consultancy
Free Services Public Users
NPUs may access selected data via the daily updated STOP web site. General knowledge about space weather will also be provided together with links to additional information.
Scientific Research On a non-real time basis all data are free to use for scientists (registration required).
Procedure SC receives orders that contain information on the orbits (space and time) of specific flights from PUs and pass the orders to the Prediction Centre (PC). PC makes flight specific forecasts and passes these to SC which provides the information to the client. Nowcasts are sent in real time directly to PU. Afterwards those data are uploaded to the website and made accessible for scientific use via registration key. The public part of the website will then be updated with selected data.
Space Segment Overview The space weather predictions use data from different sources, e.g. satellites and ground stations. The most important parameters that are needed for predictions are listed in the five first lines of Table 2. All of these are measured by instruments on board SOHO and ACE. As can be seen in Figure 4, they will end in 2007 and 2006 respectively. From that date, there will be no other spacecraft around L1. The interplanetary magnetic field, the solar wind density, and the high energy proton flux will not longer be available from that location. Conversely, the UV and coronagraph images will still be available from the STEREO mission (operating in 2006).
Figure 4: Timeline for the STOP missions in the frame of the operating and future missions.

Summer School Alpbach 2002 – Space Weather: Physics, Impacts and Prediction Team 2 workshop
8
On the basis of these facts, it has been decided to design a mission which will ensure the required data will be available in the future. This mission will consist of two spacecraft, with different timelines. The first spacecraft, STOP-1, will be spin-stabilized (5 rpm), orbiting around L1. The payload consists of three instruments: a magnetometer, a solar wind particle detector, and a high energy proton telescope. This suite of instruments, together with the imagers on STEREO, will cover the most important needs for space weather forecasting. The operating phase will start in 2007 at the latest to have continuity in the measurements. We propose an operation phase of 5 years, extendable to 8 years. This will give time to design the STOP-2 mission. The STOP-1 mission lifetime is constrained by the radiation environment to be expected at L1, but care has been taken to ensure sufficient overlap with the STOP-2 mission timeline.
The important aspects of the mission are discussed below for the first spacecraft STOP-1. A further study needs to be performed for the second spacecraft after the start of the present service. It would consist of a suite of particle instruments similar to STOP-1 with improved characteristics and imaging instruments.
In the following sections, selected sub-systems have been studied in some detail. The design of STOP-1 re-uses systems for existing missions to keep the cost as low as possible.
STOP-1 structure The spacecraft is a cylindrical structure with 1.3 meter height (including antenna) and 0.8 metre diameter, not including the booms. The upper platform will support the payload, and the lower platform the Control Electronic Box (CEB), the propellant and the antenna. The solar arrays are mounted around the cylinder as shown in Figure 5. Design is partially based on [22, 23 and 24].
STOP-1 launch and orbit The orbit selection for STOP-1 requires being in the solar wind, upstream of the Earth, and having uninterrupted ground contact. Both requirements can be met on the orbit near Earth-Sun liberation (or Lagrange) point L1. The STOP-1 launch is thus similar to the SOHO or ACE.
The choice of launcher is influenced by the mass and size of the STOP-1 spacecraft. Soyouz, Atlas launcher or Delta II launchers have a sufficient performance (1600 kg) with respect to the launch mass and size of STOP-1. Soyouz launcher is chosen for its reliability and low cost.
The launch will proceed in 2007 from Baikonour, depending on the selected launcher. A transfer orbit will place the satellite in its final halo orbit around L1, this target orbit being at 1.5 million km away from the Earth.
Figure 5: STOP spacecraft and L1-5 points
AOCS The Attitude and Orbit Control (AOCS) has been designed to provide the STOP-1 spacecraft with the means to measure the spacecraft attitude and spin rate, to perform orbit maneuvers, to point and maneuver its spin axis, to control the spin rate and to dump nutation motions. The AOCS is composed of two functional areas, classically regarded as separated subsystems: Attitude Determination and Control Subsystem (ADCS) equipment providing the means for attitude determination and Reaction Control System (RCS) providing the orbit maneuver and attitude control capability.

Summer School Alpbach 2002 – Space Weather: Physics, Impacts and Prediction Team 2 workshop
9
The ADCS equipment provides spacecraft attitude and spin data which is reconstituted on the ground to determine the primary spacecraft attitude parameters, such as inertial attitude, spin rate, and spin phase. The accuracy requirements for these data, which are particularly important for payload data processing, are comfortably met by the implemented solution.
The ADCS Hardware is composed of - redundant Star Mappers (SM) - internal Slit Sun Sensor (or X-Beam) - two dynamics monitoring accelerometers - two passive Nutation dumpers - 2*4*10 Newton Thrusters for attitude and spin control
The Reaction Control Subsystem (RCS) is configured as two redundant branches, each of which is capable of performing a complete mission profile.
Pointing Requirements We choose this subsystem configuration, because of its reliability and its simplicity. The present subsystem design meets the following pointing requirements.
- Pointing Accuracy (APE): 0.5 deg. - Pointing Stability (RPE): 0.2 deg. - Pointing Knowledge (AMA): 0.25 deg. - Spin Rate Accuracy: 10%
Radiation environment Three different types of particle radiation are considered to have an effect on the spacecraft during the mission: geomagnetically trapped particles, protons of solar origin and galactic cosmic rays. Trapped particles expose the spacecraft only while in transit inside the Earth’s magnetosphere but fluxes are neglible when compared to solar protons. On the other hand, there is not any affordable way to shield the spacecraft against high energy cosmic rays or impulsive proton bursts. Thus, the solar proton dose defines the desired amount of shielding for instrumentation.
Cumulative dose during the mission will be predicted with an interplanetary proton fluence model [20]. Within the nominal mission duration, the STOP-1 will spend 5 years in total at L1 during the solar maximum. Rough estimation based on the model predicts fluxes of 3.5*1010 particles/(cm2 sr) for protons having an energy greater than 10 MeV. In the energy regime greater than 30 MeV the flux is roughly a third of the previous one.
By using the model of the radiation transport through the walls of the space craft [21], the final radiation dose in the electronics can be calculated. Preliminary estimation for shielding thickness for electronics is 4 mm of aluminum equivalent. This is based on knowledge from past and on-going missions. Total dose of 5 kRads in silicon is estimated to be received during the mission. Impulsive particle events will be taken into account by using radiation hard components in crucial systems including the photo-electronics and their degradation.
Telecommunication Opposed to scientific missions, uplink and downlink capabilities for telemetry, tracking and control have to be working on a continuous time basis in order to offer real-time data for real-time predictions.
Therefore a network of ground stations will have to be used in order to have a 24 hours connection to the satellite orbiting around L1 point. At least 3 ground stations will have to be identified with locations distributed around the globe. The use of several ground stations will probably contribute to the overall cost immensely. But as more spacecraft are likely to be operated in future, more ground stations will be available and eventually lead to decreasing cost. Therefore further work will have to address the selection of the ground stations, considering mainly the availability. Regarding the design on the telecommunications payload onboard STOP-1 a fully redundant transponder is proposed in order minimize the risk of failure over the proposed lifetime.

Summer School Alpbach 2002 – Space Weather: Physics, Impacts and Prediction Team 2 workshop
10
In order to keep the satellite small and simple, data processing will be performed on ground at the data centre, hence the measured raw data will be transmitted over the communications link.
Uplink Downlink Telecommands: 2- 4 kbit/s - housekeeping data: 1 kbit/s
- measured data from instruments 10 kbit/s
Table 3: Data rates
The telecommunication links will be established in X-band. The antenna subsystem will consist of 4 low-gain antennas. As the ground stations have not been selected, the link budget can only be evaluated for several design concepts and can be traded off against each other. If for example the X-band transponder of the STORMS-mission can be used (30 W HPA) in combination with the Kourou 15 m ground station, the path loss of 233 dB can be easily overcome with an high gain antenna (0,9 m parabolic dish). If large ground stations are available this option might not be necessary, eventually using higher power amplification.
STOP-1 payload STOP-1 will contain a small payload to carry out the essential measurements which are required to make the needed space weather predictions. This payload will consist of the instruments listed below.
• Magnetometer • High Energy Proton Telescope • Solar Wind Proton Detector
In order to minimize the costs involved in implementing the Space Segment of STOP-1 and to guarantee a high degree of quality of the measured data we plan to reuse existing instrument designs from recent scientific space missions as far as possible. The building and environmental testing of the actual sensors and associated data processing units, as well as the required redesign of subsystems (e.g. the electrical interfaces to the spacecraft) will be subcontracted to scientific institutes and industry as appropriate.
Instrument Mass [ g ]
Power [ W ]
Scientific Data [ bits / sec ]
Housekeeping Data
[ bits / sec ] Fluxgate Magnetometer
DPU Sensors (2)
~550 2 x 380
~3.5
800
64
Solar Wind Proton Detector
DPU HIA sensor
~2200 2450
~2.5 2.8
5600 128
Proton Telescope DPU Telescope
~1800 ~4500
~2.2 ~2.8
500 64
Table 4: Payload Mass, Power and Telemetry Rate estimates
Fluxgate Magnetometer (FGM) We plan to reuse the existing CLUSTER Fluxgate Magnetometer FGM. As on CLUSTER there will be two sensors, a primary and a secondary (backup) sensor. In order to reduce disturbances resulting from remnant magnetic fields on the spacecraft the sensors will be mounted on two deployable booms on opposite sides of the spacecraft.
Proton Telescope (PTS) For measuring the flux and energy distribution of high energy protons we will use a modified design of the Proton-Electron Telescope (PET) previously flown on the SAMPEX mission. The modifications to be made concern the geometric factor of the instrument which needs to be reduced in order to avoid saturation of the solid state detectors during energetic events, and the number of solid detectors, as we do not need to measure electrons.
Summer School Alpbach 2002 – Space Weather: Physics, Impacts and Prediction Team 2 workshop
11
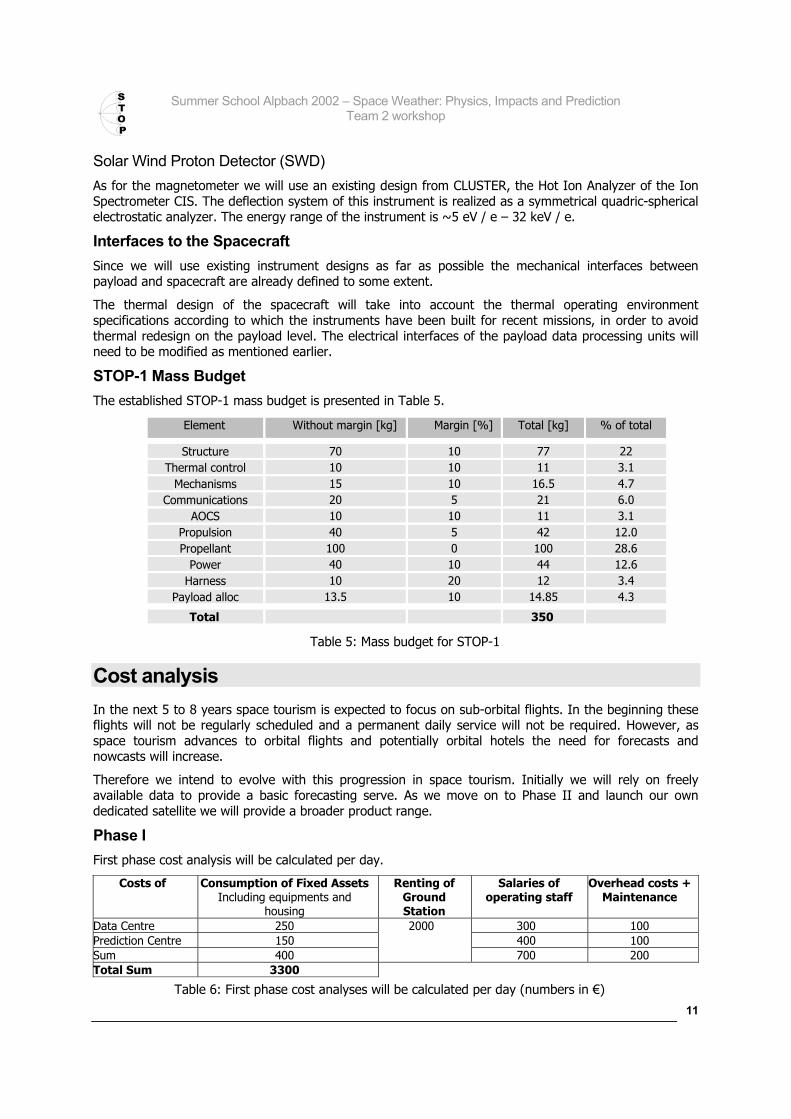
Solar Wind Proton Detector (SWD) As for the magnetometer we will use an existing design from CLUSTER, the Hot Ion Analyzer of the Ion Spectrometer CIS. The deflection system of this instrument is realized as a symmetrical quadric-spherical electrostatic analyzer. The energy range of the instrument is ~5 eV / e – 32 keV / e.
Interfaces to the Spacecraft Since we will use existing instrument designs as far as possible the mechanical interfaces between payload and spacecraft are already defined to some extent.
The thermal design of the spacecraft will take into account the thermal operating environment specifications according to which the instruments have been built for recent missions, in order to avoid thermal redesign on the payload level. The electrical interfaces of the payload data processing units will need to be modified as mentioned earlier.
STOP-1 Mass Budget The established STOP-1 mass budget is presented in Table 5.
Element Without margin [kg] Margin [%] Total [kg] % of total
Structure 70 10 77 22 Thermal control 10 10 11 3.1
Mechanisms 15 10 16.5 4.7 Communications 20 5 21 6.0
AOCS 10 10 11 3.1 Propulsion 40 5 42 12.0 Propellant 100 0 100 28.6
Power 40 10 44 12.6 Harness 10 20 12 3.4
Payload alloc 13.5 10 14.85 4.3
Total 350
Table 5: Mass budget for STOP-1
Cost analysis In the next 5 to 8 years space tourism is expected to focus on sub-orbital flights. In the beginning these flights will not be regularly scheduled and a permanent daily service will not be required. However, as space tourism advances to orbital flights and potentially orbital hotels the need for forecasts and nowcasts will increase.
Therefore we intend to evolve with this progression in space tourism. Initially we will rely on freely available data to provide a basic forecasting serve. As we move on to Phase II and launch our own dedicated satellite we will provide a broader product range.
Phase I First phase cost analysis will be calculated per day.
Costs of Consumption of Fixed Assets Including equipments and
housing
Renting of Ground Station
Salaries of operating staff
Overhead costs + Maintenance
Data Centre 250 300 100 Prediction Centre 150 400 100 Sum 400
2000
700 200 Total Sum 3300
Table 6: First phase cost analyses will be calculated per day (numbers in €)

Summer School Alpbach 2002 – Space Weather: Physics, Impacts and Prediction Team 2 workshop
12
Phase II Phase II will begin when we have our own space mission and ground stations. We calculate the cost of Phase II assuming 10% annual consumption of these fixed assets and calculate the annual costs.
Space Mission 50 Launching 15
Ground station 10 Sum 75
Table 7: Establishment costs (numbers in Million €)
Costs of Consumption of Fixed Assets
Including equipments and
housing
Renting of Ground Station
Maintenance Salaries of operating staff
Overhead costs
Health consulting
Data Centre 0.6 1.2 Prediction Centre 0.9 1.8 Sum
8.5 0.6 0.2
1.5 3
0.1
Total Sum 13.9
Table 8: Costs detail (numbers in Million €)
Forecasting 14 Consultancy for ST companies and Insurance companies
3
Consultancy for individuals 0.5 Total sum 17.5
Table 9: STOP incomes (numbers in Million €)
Based on the Space Tourism market forecasting studies, the annual turnover of the business in Japan, Europe and the United States combined will be $43 Billion.
If we estimate that at least 0.5% of this goes towards the costs of a space weather prediction service this service could receive $215 million. This illustrates that there is a market and a need for STOP.

Summer School Alpbach 2002 – Space Weather: Physics, Impacts and Prediction Team 2 workshop
13
References [1] Space Tourism, From Dream To Reality, International Space University, 2002
[2] General Public Space Travel and Tourism – Volume 1 Executive Summary, NASA, 1998
[3] The cost of capital for space tourism ventures, Eilingsfeld, F, rocketfinance.com, Berlin, Germany
[4] DASA business plan for X-33/RLV (1995)
[5] Modeling Space Tourism, Heinz-Hermann, Technical University Berlin. (2002)
[6] GENERAL PUBLIC SPACE TRAVEL AND TOURISM, Summary of a Space Act Agreement Study, including a workshop held at Georgetown University, Washington, DC, February , 1997
[7] THE JRS SPACE TOURISM STUDY PROGRAM, Patrick Collins * and Kohki Isozaki
[8] Space Tourism, From Dream To Reality, International Space University, 2002
[9] General Public Space Travel and Tourism – Volume 1 Executive Summary, NASA, 1998
[10] http://ftp.seds.org/pub/info/mars/RadHuman.doc
[11] Éamonn Daly – Effects on Technology, Alpbach 2002
[12] http://www.spenvis.oma.be/
[13] http://www.bbso.njit.edu/arm/latest/forecast.html
[14] Wheatland, M. S., 2001, Solar Physics, 203, 87
[15] A. Aran, B. Sanahuja, D. Lario, V. Domingo, proc. Space Weather Workshop: Looking towards an European Space Weather Programme, 16-19 Dec, 2001. Available on web :http:// www.estec.esa.nl/wmwww/wma/spweather/workshops/SPW_W3/PROCEEDINGS_W3
[16] Wu, S. T., M. Dryer, and S. M. Han, Solar Phys., 84, 395, 1983
[17] D. Lario, B. Sanahuja, A.M. Heras, ApJ, 509, 415, 1998
[18] Vette, J.I., The NASA/National Space Science Data Centre Trapped Radiation Environment Model Program (TREMP) (1964-1991), NSSDC/WDC-A-R&S 91-29, NASA/GSFC, Nov. 1991 [12]
[19] Vette, J.I., The AE-8 Trapped Electron Model Environment, NSSDC/WDC-A-R&S 91-24, Nov 1991
[20] Feynman J., Spitale G., Wang J., Interplanetary Proton Fluence Model: JPL 1991, Journal of Geophysical Research, vol. 98, no. A8, Pages 13,281-13,294, august 1, 1993.
[21] Adams J. H. Jr., The variability of Single Event Upset Rates in the Natural Environment, IEEE Trans. Nucl. Sci., 30, 4475-4480, 1983.
[22] ESA CDF-11(A) Study Report. “SPACE WEATHER: Three elements monitoring the solar-terrestrial environment as part of a service”, December 2001.
[23] ESA Assessment Report, “STORM: A Three-Spacecraft Constellation for Earth-Magnetic Storms and Inner Magnetospheric Studies”, July 2000.
[24] ESA CDF-02(A) Study Report, “Pre-Assessment Study Report. Solar Orbiter”, October 1999.