Embed Size (px)
Citation preview
1
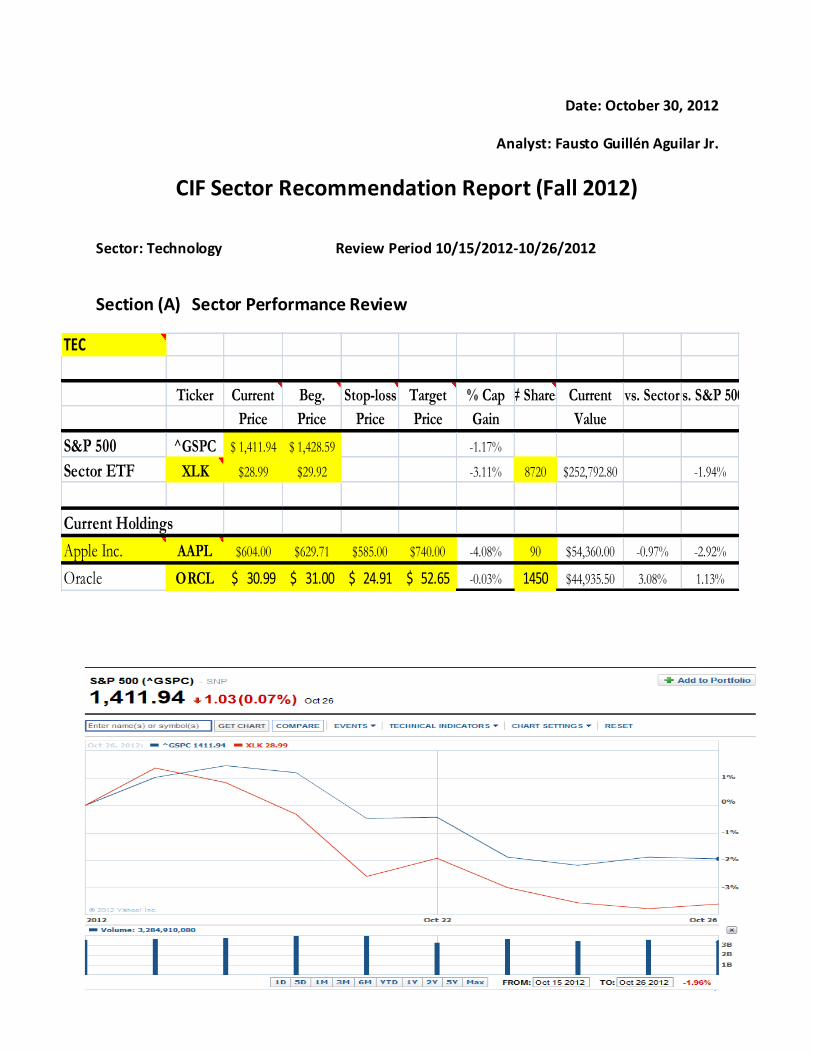
TEC
Ticker Current Beg. Stop-loss Target % Cap # Shares Current vs. Sectorvs. S&P 500
Price Price Price Price Gain Value
S&P 500 ^GSPC 1,411.94$ 1,428.59$ -1.17%
Sector ETF XLK $28.99 $29.92 -3.11% 8720 $252,792.80 -1.94%
Current Holdings
Apple Inc. AAPL $604.00 $629.71 $585.00 $740.00 -4.08% 90 $54,360.00 -0.97% -2.92%
Oracle ORCL 30.99$ 31.00$ 24.91$ 52.65$ -0.03% 1450 $44,935.50 3.08% 1.13%
Date: October 30, 2012
Analyst: Fausto Guillén Aguilar Jr.
CIF Sector Recommendation Report (Fall 2012)
Sector: Technology Review Period 10/15/2012-10/26/2012
Section (A) Sector Performance Review
2
As you can see in the above two-week period graph, both the S&P 500 and Technology Sector
have underperformed due to their volatility. The technology sector started out doing better
than the S&P 500 by peaking at about 1.2%, but then falls to a low of -3.5%. The S&P 500 also
dropped to as low as -2%, slightly doing better than the technology sector.
Headline news: Hurricane Sandy disrupts Northeast U.S. telecom networks. The hurricane
interrupted coverage for cellphones, internet services, and television. Some major companies
that were affected were AT&T, Verizon Wireless, Time Warner Cable, and T-Mobile (Reuters).
The biggest surprise during this period has been Cymer Inc. It started at $46.64 and shot up to
$78.96 in two weeks (Bloomberg). Google was the worst mover by dropping its stock price from
over $750 down to $675 (Yahoo).
Apple Inc close price was $604.00. The price has been decreasing slowly and the new iPad sales
turned out to be less than expected. The recent report was not too impressive. Since this is a
cyclical market, performance may drop at times. However, with the holidays being just around
the corner I expect Apple’s stock price to raise.
Microsoft’s new Windows 8 software and Surface tablet did not help the stock much. During
the two-week period, the stock price dropped -4.41% (yahoo). Again, shopping season is just
beginning and I am expecting Microsoft’s stock price to go up.
The short-term outlook of the technology sector does not look too impressive, especially when
the majority of the earning reports for major companies were disappointed. However, sales
should go up due to Christmas, and the technology sector will improve.
Section (B) Sector Holding Updates
Company #1: Apple (AAPL)
Date Recommended: 10/18/2012
Date Re-evaluated: 11/1/2012
Company Update
In the last two weeks, Apple has not done great, but has maintained. The recent earning results
did not impress analysts. Earnings were lower than expected. Additionally, the release of the
new mini iPad was not as successful as expected. Just recently, Apple’s software products chief
3
and Apple’s retail chief have decided to leave the company, only time will tell if this will affect
Apple. Furthermore, analysts continue to recommend buying and/or holding the Apple stock.
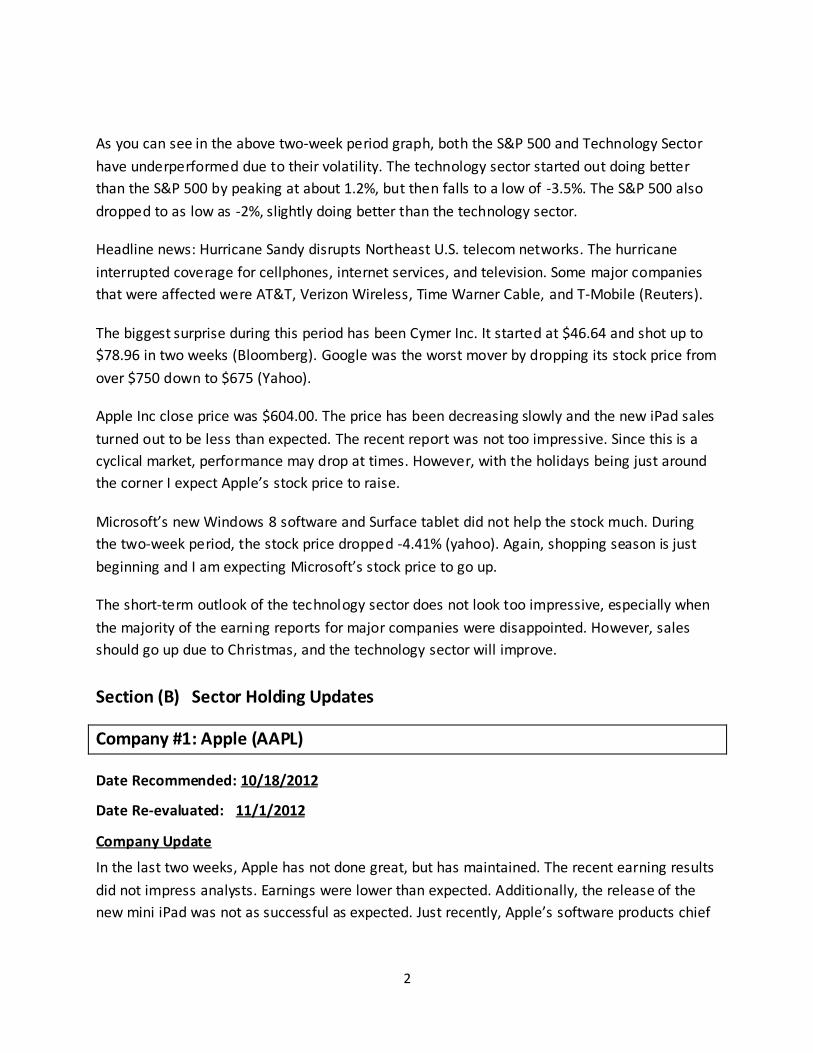
Relative Performance
In the last two weeks, the S&P 500 underperformed along with Apple. This is because of various
reasons. However, it is expected for the market to improve in the coming months. With this
said, we should see Apple outperform the market.
Price Charts
3 MONTH CHART
1 YEAR CHART
4
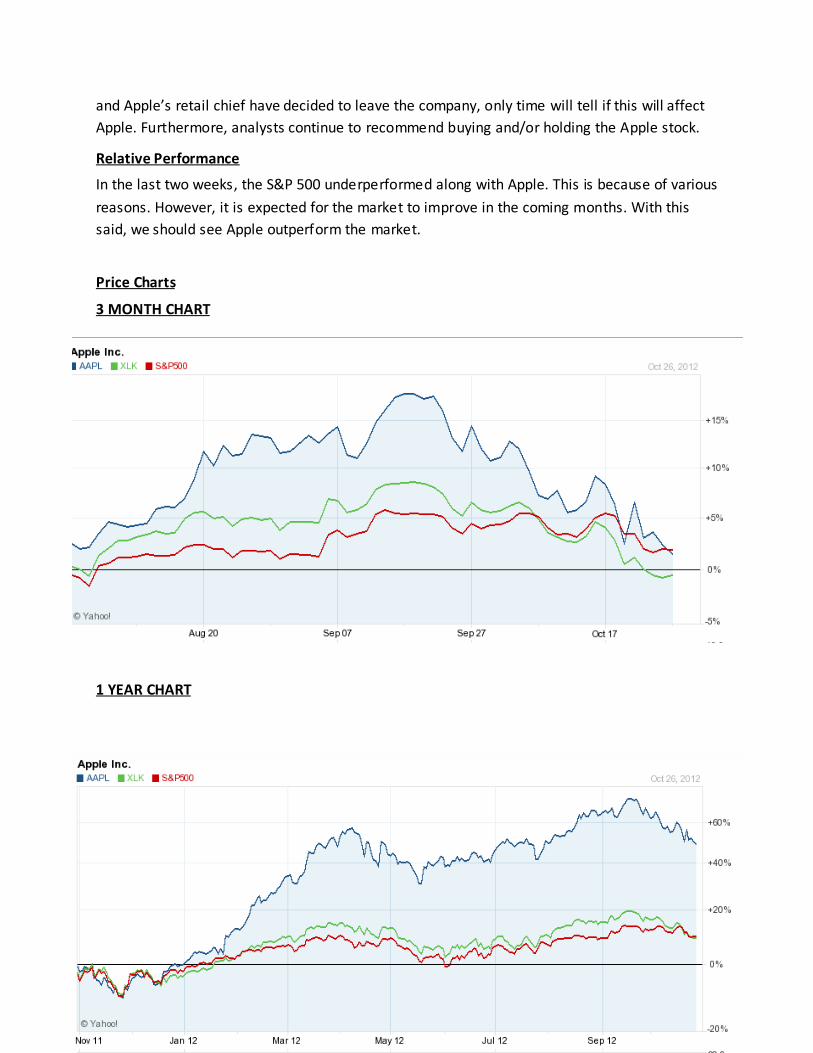
Valuations Analysis
Original Analysis
Ratio Analysis Company Industry Sector
P/E (TTM) 15.07 12.31 19.74
P/S (TTM) 4.04 1.07 3.57
P/B (MRQ) 5.38 2.20 3.72
P/CF (TTM) 13.98 10.92 13.31
Re-evaluation Analysis
Ratio Analysis Company Industry Sector
P/E (TTM) 13.68 11.94 21.74
P/S (TTM) 3.62 .99 9.21
P/B (MRQ) 4.80 2.08 3.50
P/CF (TTM) 12.58 10.33 11.99
The main difference from the original analysis to the re-evaluation analysis is that all the ratios
dropped for Apple, the industry, and the sector. Additionally, the stock is less expensive and the
changes are consistent across the four valuation metrics.
Historical Surprises
Original Analysis
Estimates vs Actual Estimate Actual Difference Surprise %
SALES (in millions)
Quarter Ending Jun-12 37,215.90 35,023.00 2,192.88 5.89
Quarter Ending Mar-12 36,808.00 39,186.00 2,377.95 6.46
Quarter Ending Dec-11 39,062.50 46,333.00 7,270.46 18.61
Quarter Ending Sep-11 29,685.50 28,270.00 1,415.55 4.77
Quarter Ending Jun-11 24,960.80 28,571.00 3,610.20 14.46
5
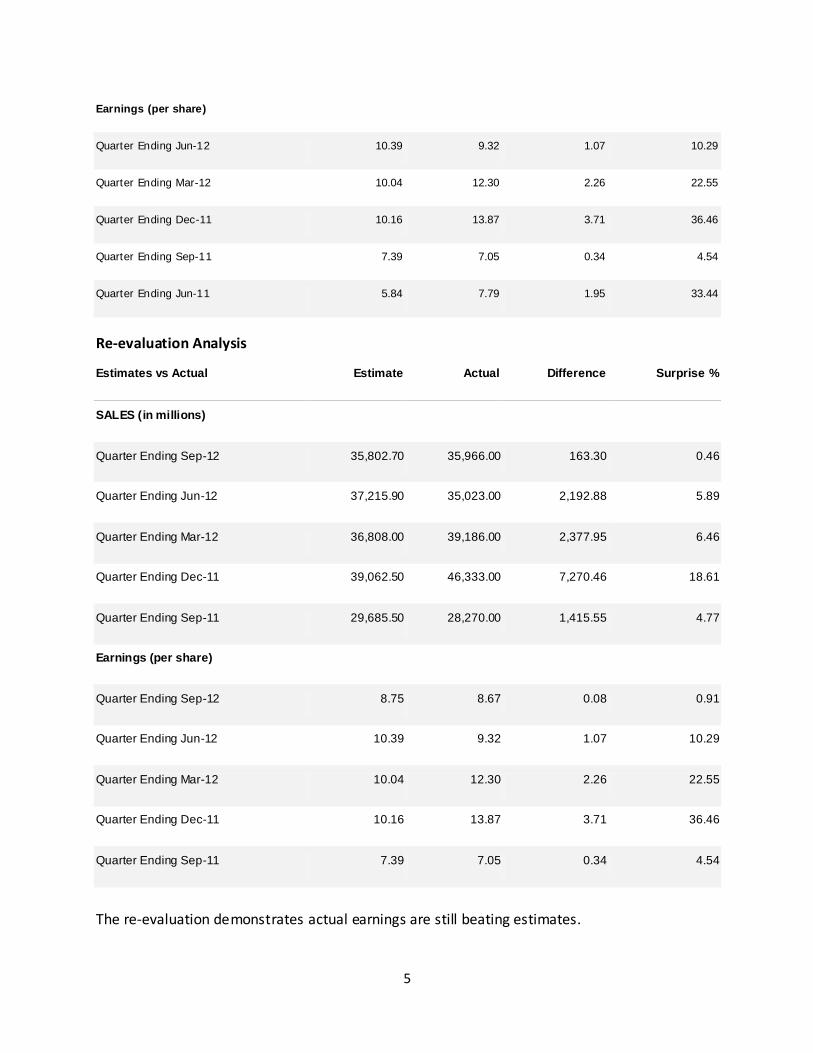
Earnings (per share)
Quarter Ending Jun-12 10.39 9.32 1.07 10.29
Quarter Ending Mar-12 10.04 12.30 2.26 22.55
Quarter Ending Dec-11 10.16 13.87 3.71 36.46
Quarter Ending Sep-11 7.39 7.05 0.34 4.54
Quarter Ending Jun-11 5.84 7.79 1.95 33.44
Re-evaluation Analysis
Estimates vs Actual Estimate Actual Difference Surprise %
SALES (in millions)
Quarter Ending Sep-12 35,802.70 35,966.00 163.30 0.46
Quarter Ending Jun-12 37,215.90 35,023.00 2,192.88 5.89
Quarter Ending Mar-12 36,808.00 39,186.00 2,377.95 6.46
Quarter Ending Dec-11 39,062.50 46,333.00 7,270.46 18.61
Quarter Ending Sep-11 29,685.50 28,270.00 1,415.55 4.77
Earnings (per share)
Quarter Ending Sep-12 8.75 8.67 0.08 0.91
Quarter Ending Jun-12 10.39 9.32 1.07 10.29
Quarter Ending Mar-12 10.04 12.30 2.26 22.55
Quarter Ending Dec-11 10.16 13.87 3.71 36.46
Quarter Ending Sep-11 7.39 7.05 0.34 4.54
The re-evaluation demonstrates actual earnings are still beating estimates.
6
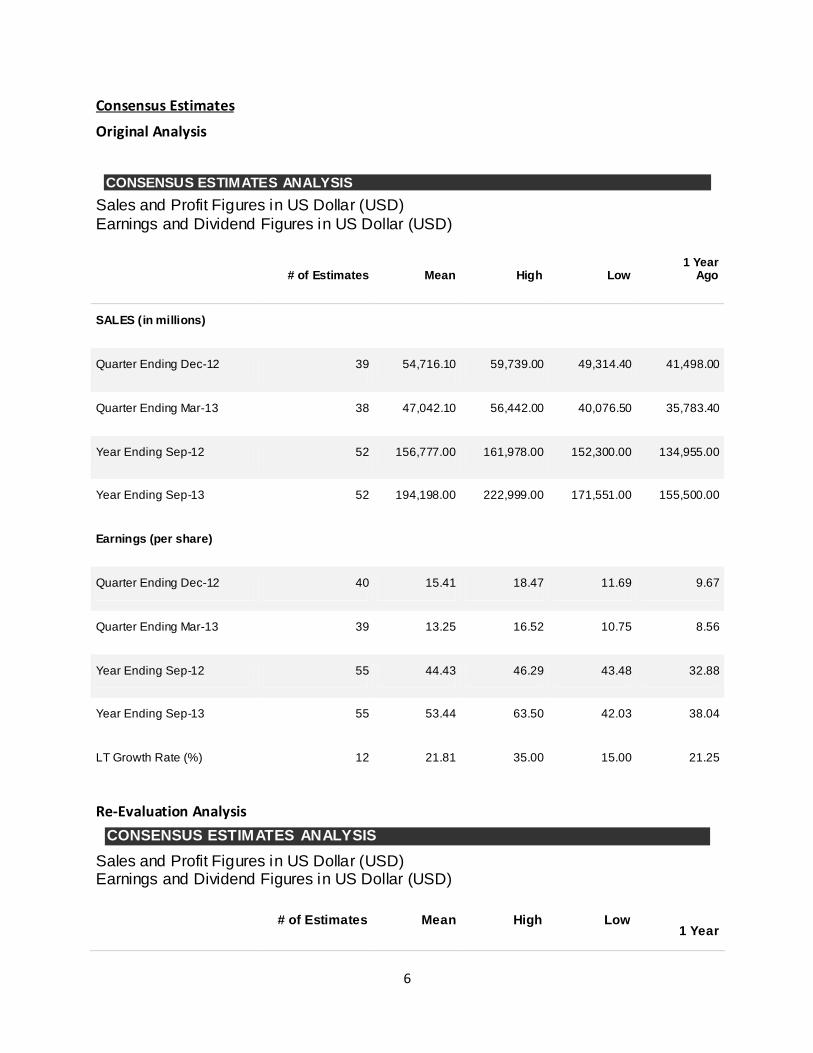
Consensus Estimates
Original Analysis
CONSENSUS ESTIMATES ANALYSIS
Sales and Profit Figures in US Dollar (USD)
Earnings and Dividend Figures in US Dollar (USD)
# of Estimates Mean High Low 1 Year
Ago
SALES (in millions)
Quarter Ending Dec-12 39 54,716.10 59,739.00 49,314.40 41,498.00
Quarter Ending Mar-13 38 47,042.10 56,442.00 40,076.50 35,783.40
Year Ending Sep-12 52 156,777.00 161,978.00 152,300.00 134,955.00
Year Ending Sep-13 52 194,198.00 222,999.00 171,551.00 155,500.00
Earnings (per share)
Quarter Ending Dec-12 40 15.41 18.47 11.69 9.67
Quarter Ending Mar-13 39 13.25 16.52 10.75 8.56
Year Ending Sep-12 55 44.43 46.29 43.48 32.88
Year Ending Sep-13 55 53.44 63.50 42.03 38.04
LT Growth Rate (%) 12 21.81 35.00 15.00 21.25
Re-Evaluation Analysis
CONSENSUS ESTIMATES ANALYSIS
Sales and Profit Figures in US Dollar (USD) Earnings and Dividend Figures in US Dollar (USD)
# of Estimates Mean High Low 1 Year
7
Ago
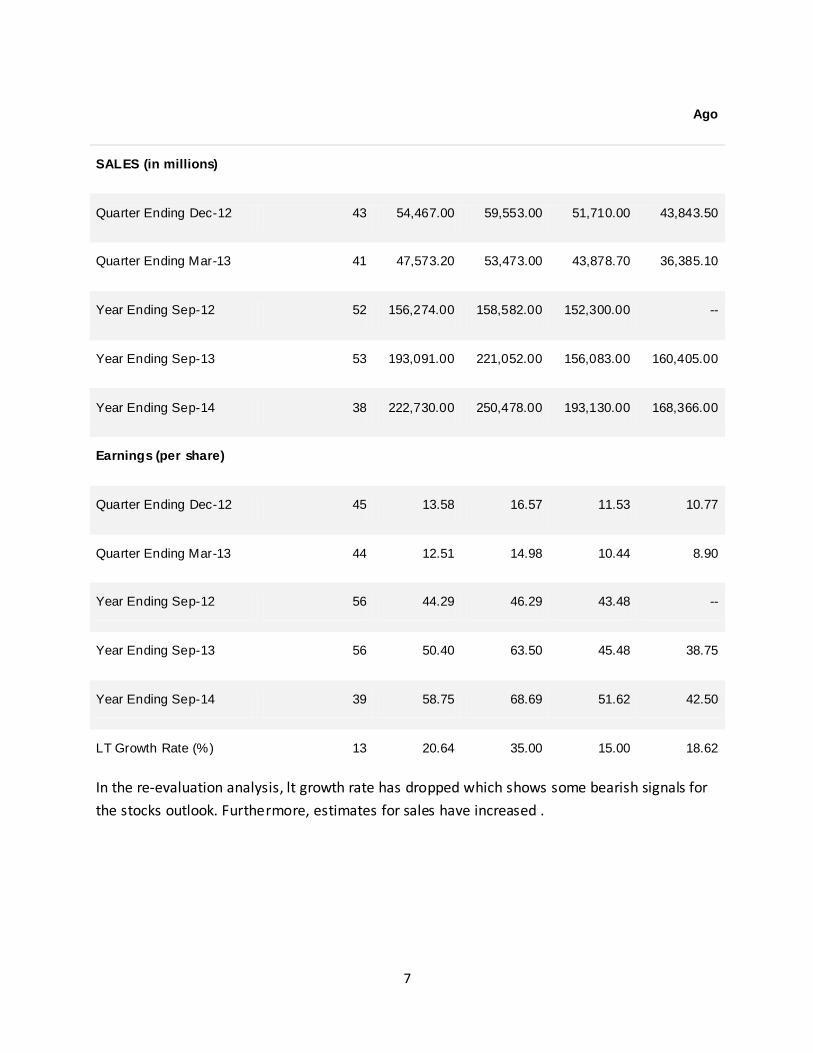
SALES (in millions)
Quarter Ending Dec-12 43 54,467.00 59,553.00 51,710.00 43,843.50
Quarter Ending Mar-13 41 47,573.20 53,473.00 43,878.70 36,385.10
Year Ending Sep-12 52 156,274.00 158,582.00 152,300.00 --
Year Ending Sep-13 53 193,091.00 221,052.00 156,083.00 160,405.00
Year Ending Sep-14 38 222,730.00 250,478.00 193,130.00 168,366.00
Earnings (per share)
Quarter Ending Dec-12 45 13.58 16.57 11.53 10.77
Quarter Ending Mar-13 44 12.51 14.98 10.44 8.90
Year Ending Sep-12 56 44.29 46.29 43.48 --
Year Ending Sep-13 56 50.40 63.50 45.48 38.75
Year Ending Sep-14 39 58.75 68.69 51.62 42.50
LT Growth Rate (%) 13 20.64 35.00 15.00 18.62
In the re-evaluation analysis, lt growth rate has dropped which shows some bearish signals for
the stocks outlook. Furthermore, estimates for sales have increased .
8
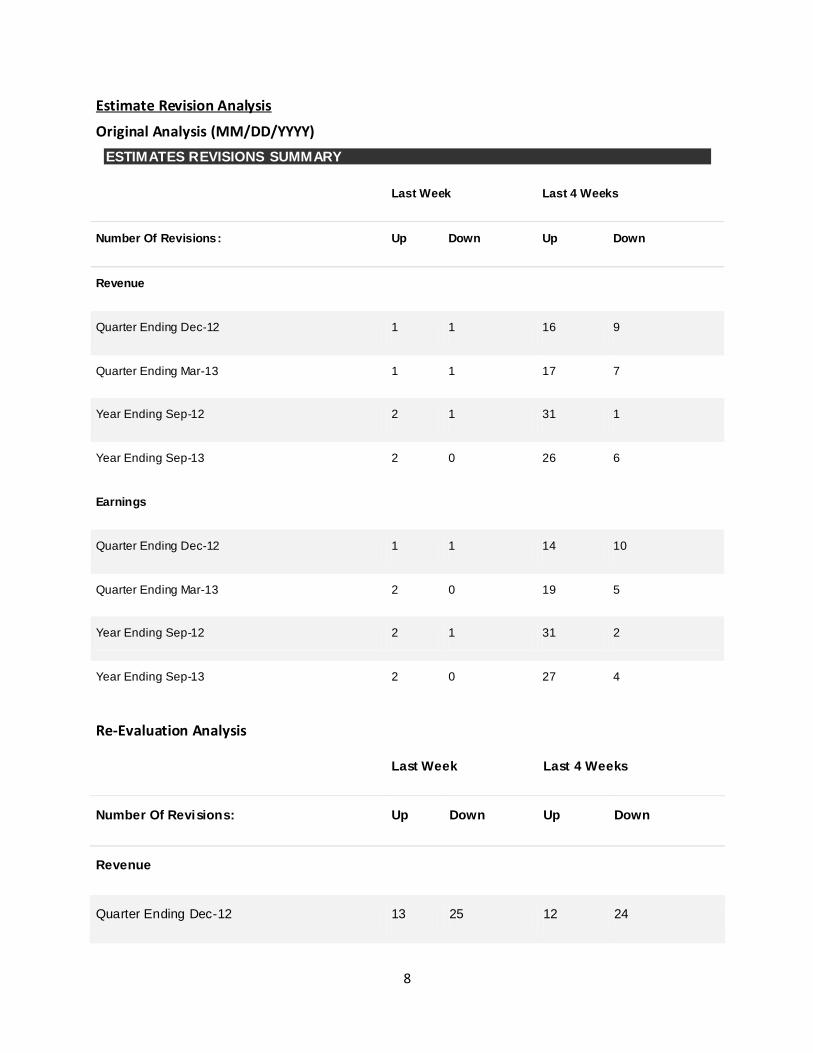
Estimate Revision Analysis
Original Analysis (MM/DD/YYYY)
ESTIMATES REVISIONS SUMMARY
Last Week Last 4 Weeks
Number Of Revisions: Up Down Up Down
Revenue
Quarter Ending Dec-12 1 1 16 9
Quarter Ending Mar-13 1 1 17 7
Year Ending Sep-12 2 1 31 1
Year Ending Sep-13 2 0 26 6
Earnings
Quarter Ending Dec-12 1 1 14 10
Quarter Ending Mar-13 2 0 19 5
Year Ending Sep-12 2 1 31 2
Year Ending Sep-13 2 0 27 4
Re-Evaluation Analysis
Last Week Last 4 Weeks
Number Of Revisions: Up Down Up Down
Revenue
Quarter Ending Dec-12 13 25 12 24
9
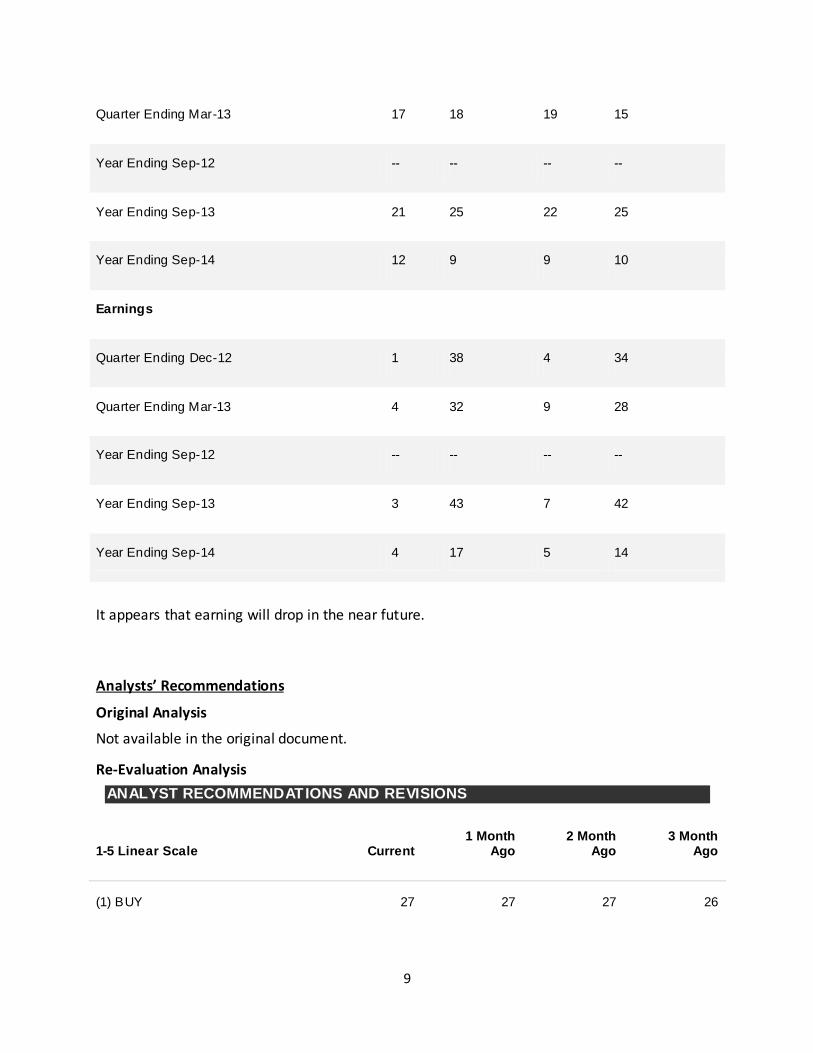
Quarter Ending Mar-13 17 18 19 15
Year Ending Sep-12 -- -- -- --
Year Ending Sep-13 21 25 22 25
Year Ending Sep-14 12 9 9 10
Earnings
Quarter Ending Dec-12 1 38 4 34
Quarter Ending Mar-13 4 32 9 28
Year Ending Sep-12 -- -- -- --
Year Ending Sep-13 3 43 7 42
Year Ending Sep-14 4 17 5 14
It appears that earning will drop in the near future.
Analysts’ Recommendations
Original Analysis
Not available in the original document.
Re-Evaluation Analysis
ANALYST RECOMMENDATIONS AND REVISIONS
1-5 Linear Scale Current 1 Month
Ago 2 Month
Ago 3 Month
Ago
(1) BUY 27 27 27 26

10
(2) OUTPERFORM 23 22 21 21
(3) HOLD 4 4 5 5
(4) UNDERPERFORM 1 1 1 1
(5) SELL 1 1 1 1
No Opinion 0 0 0 0
Mean Rating 1.68 1.67 1.69 1.70
The original analysis is not available. However, all recommendations are very bullis h and Apple
is expected to outperform the market.
Company #2: Oracle (ORCL)
Date Recommended: 10/18/2012
Date Re-evaluated: 11/1/2012
Company Update
In the last two weeks, Oracle has decided that it does need acquisitions in order to compete in
cloud service. Additionally, Apple has decided to drop Oracle’s Java due to security risks in the
Mac laptop.
Relative Performance
Price Charts
3 Month Chart
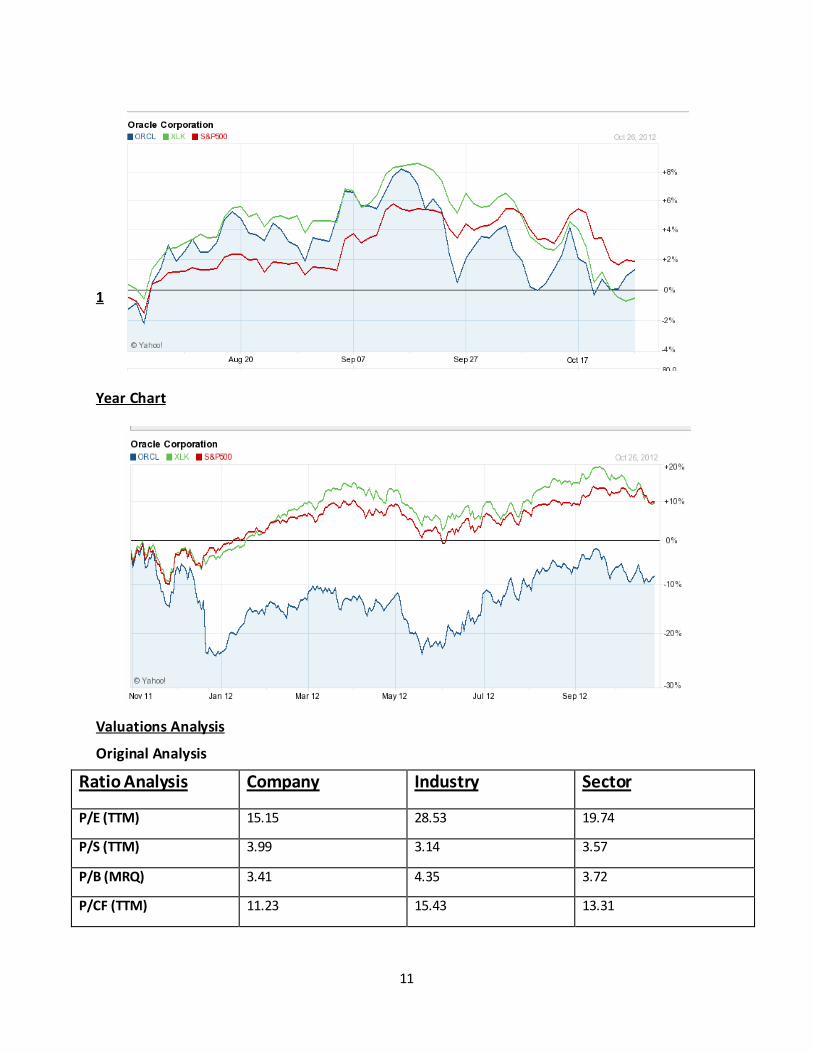
11
1
Year Chart
Valuations Analysis
Original Analysis
Ratio Analysis Company Industry Sector
P/E (TTM) 15.15 28.53 19.74
P/S (TTM) 3.99 3.14 3.57
P/B (MRQ) 3.41 4.35 3.72
P/CF (TTM) 11.23 15.43 13.31
12
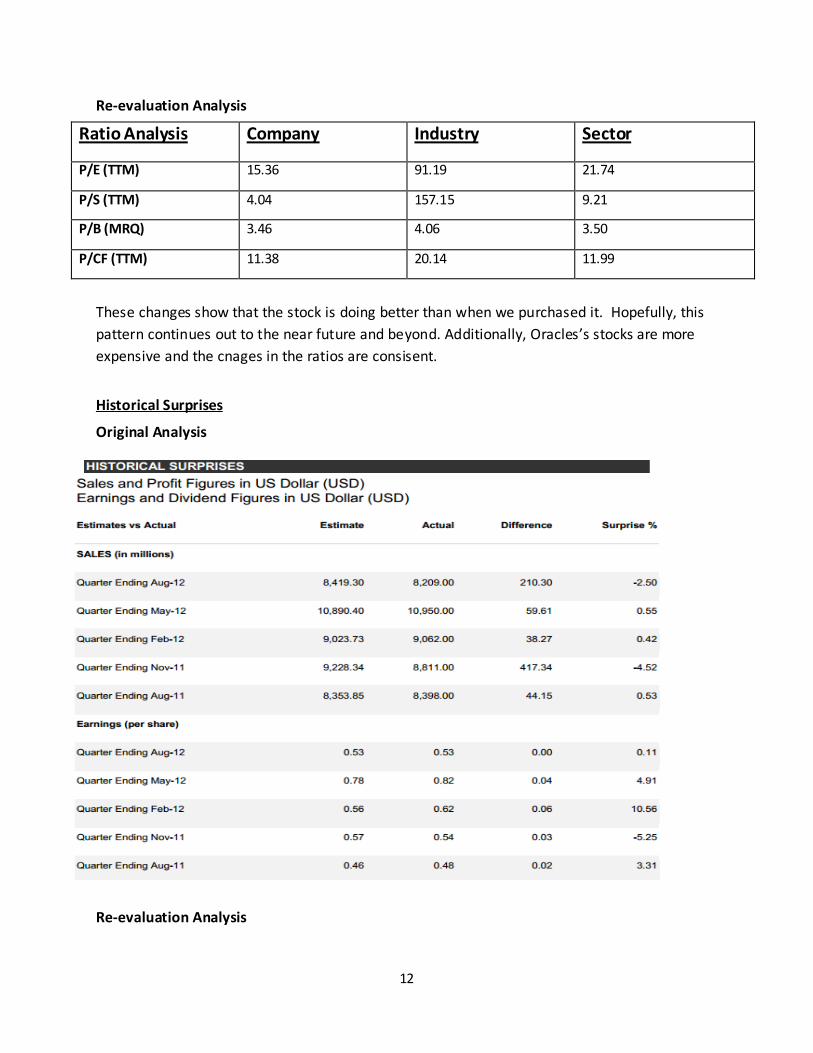
Re-evaluation Analysis
Ratio Analysis Company Industry Sector
P/E (TTM) 15.36 91.19 21.74
P/S (TTM) 4.04 157.15 9.21
P/B (MRQ) 3.46 4.06 3.50
P/CF (TTM) 11.38 20.14 11.99
These changes show that the stock is doing better than when we purchased it. Hopefully, this
pattern continues out to the near future and beyond. Additionally, Oracles’s stocks are more
expensive and the cnages in the ratios are consisent.
Historical Surprises
Original Analysis
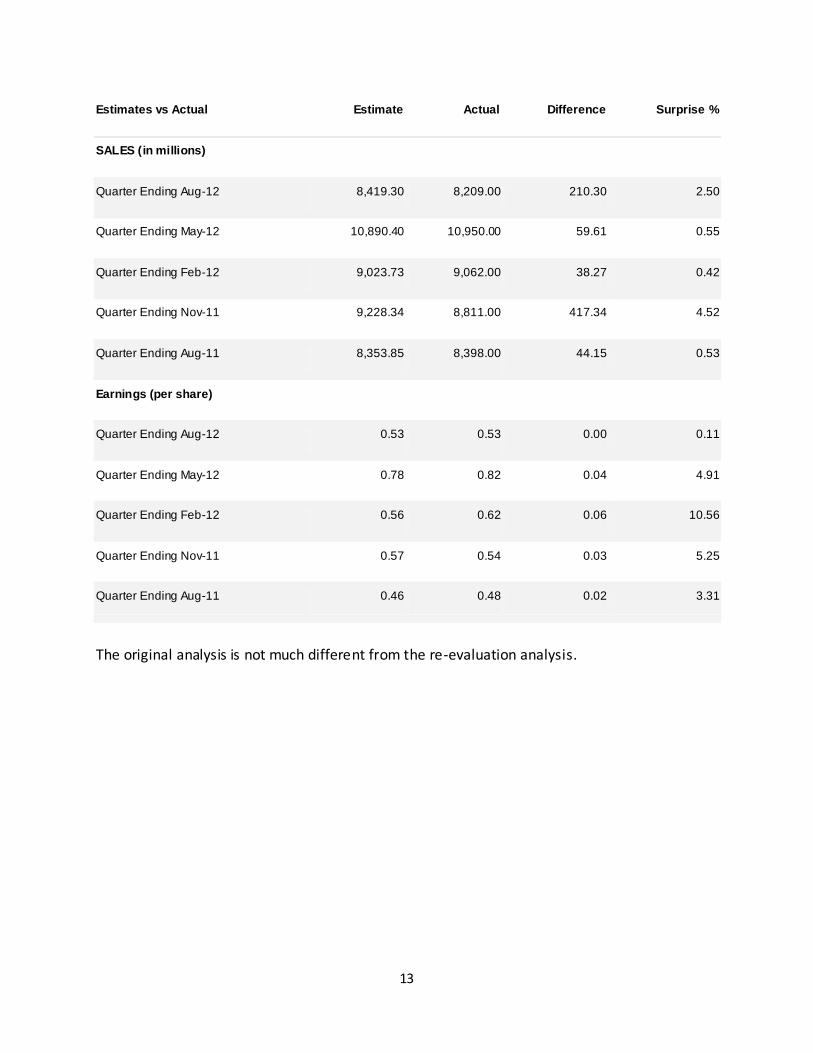
Re-evaluation Analysis
13
Estimates vs Actual Estimate Actual Difference Surprise %
SALES (in millions)
Quarter Ending Aug-12 8,419.30 8,209.00 210.30 2.50
Quarter Ending May-12 10,890.40 10,950.00 59.61 0.55
Quarter Ending Feb-12 9,023.73 9,062.00 38.27 0.42
Quarter Ending Nov-11 9,228.34 8,811.00 417.34 4.52
Quarter Ending Aug-11 8,353.85 8,398.00 44.15 0.53
Earnings (per share)
Quarter Ending Aug-12 0.53 0.53 0.00 0.11
Quarter Ending May-12 0.78 0.82 0.04 4.91
Quarter Ending Feb-12 0.56 0.62 0.06 10.56
Quarter Ending Nov-11 0.57 0.54 0.03 5.25
Quarter Ending Aug-11 0.46 0.48 0.02 3.31
The original analysis is not much different from the re-evaluation analysis.
14
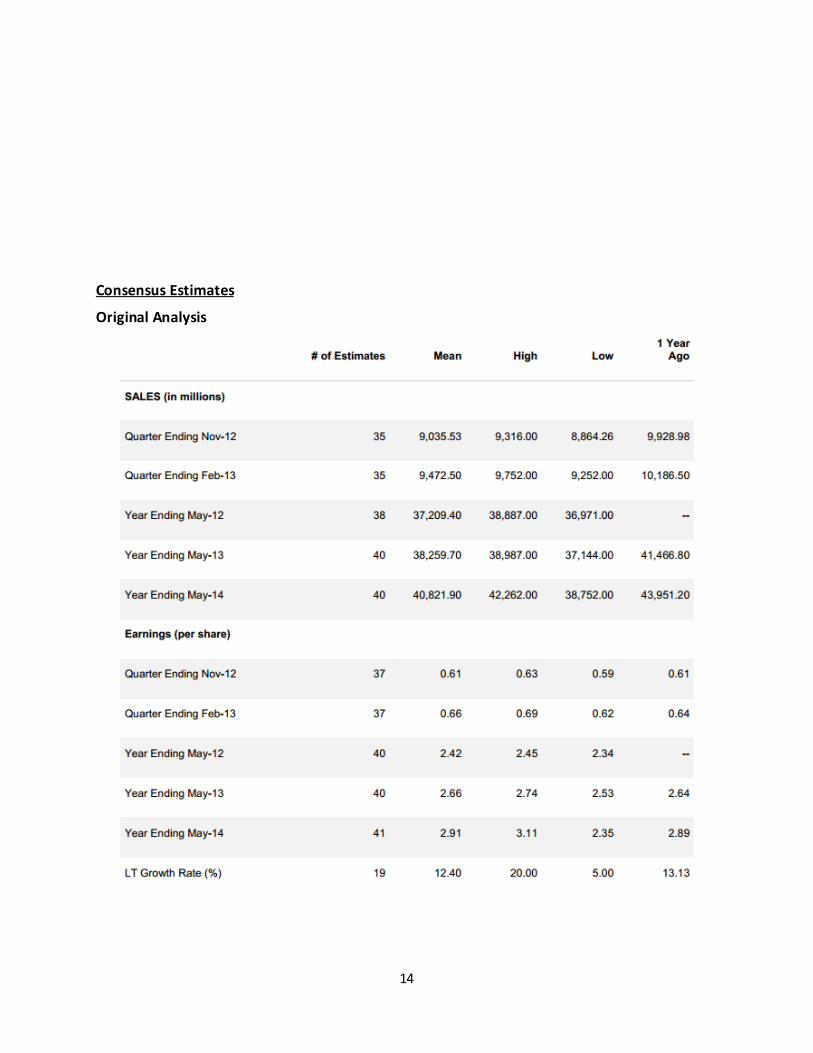
Consensus Estimates
Original Analysis
15
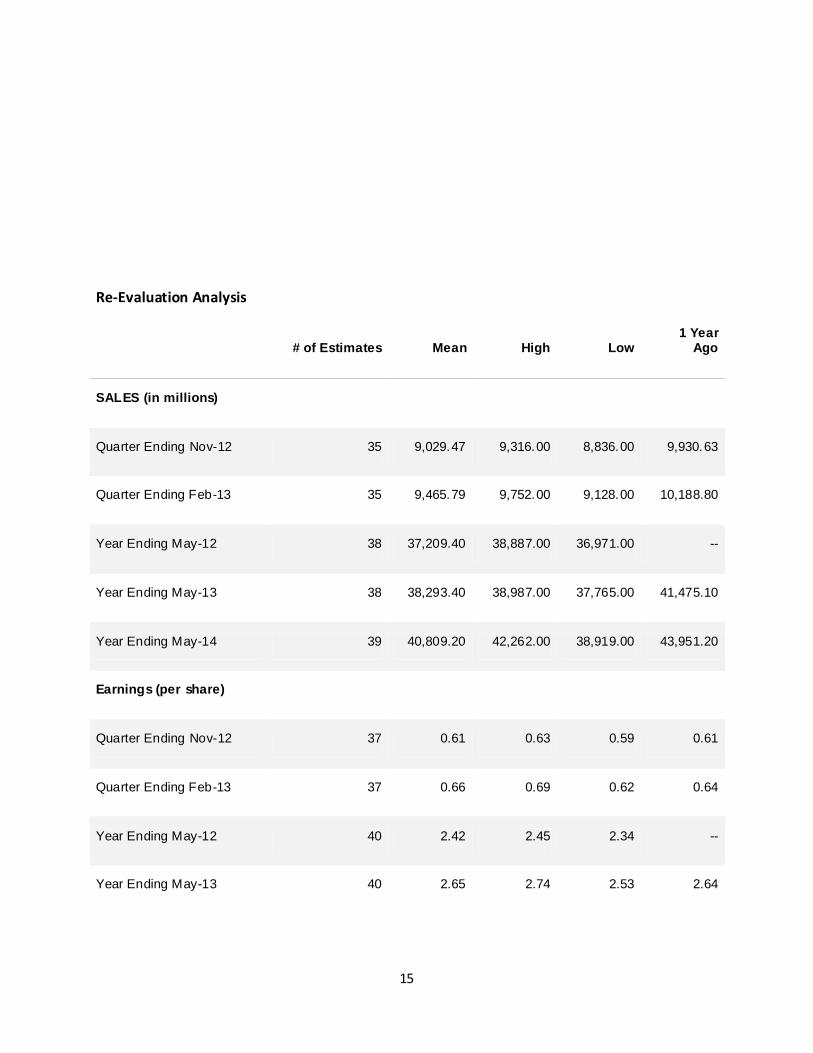
Re-Evaluation Analysis
# of Estimates Mean High Low 1 Year
Ago
SALES (in millions)
Quarter Ending Nov-12 35 9,029.47 9,316.00 8,836.00 9,930.63
Quarter Ending Feb-13 35 9,465.79 9,752.00 9,128.00 10,188.80
Year Ending May-12 38 37,209.40 38,887.00 36,971.00 --
Year Ending May-13 38 38,293.40 38,987.00 37,765.00 41,475.10
Year Ending May-14 39 40,809.20 42,262.00 38,919.00 43,951.20
Earnings (per share)
Quarter Ending Nov-12 37 0.61 0.63 0.59 0.61
Quarter Ending Feb-13 37 0.66 0.69 0.62 0.64
Year Ending May-12 40 2.42 2.45 2.34 --
Year Ending May-13 40 2.65 2.74 2.53 2.64
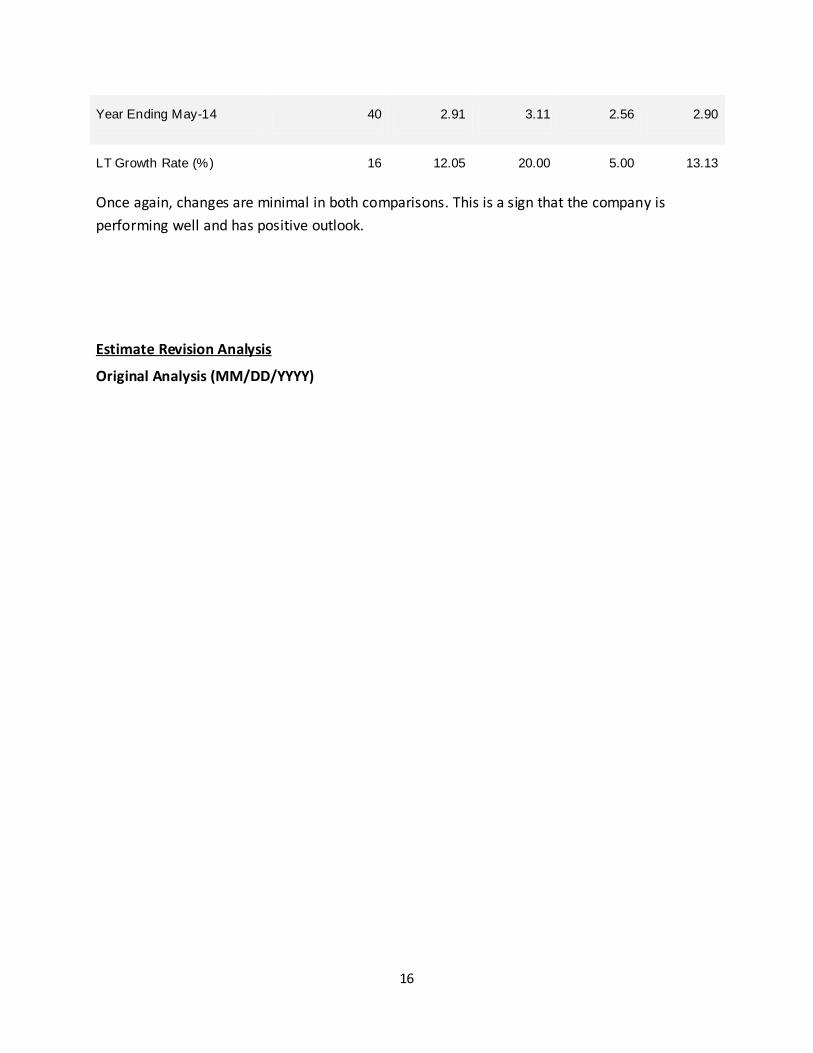
16
Year Ending May-14 40 2.91 3.11 2.56 2.90
LT Growth Rate (%) 16 12.05 20.00 5.00 13.13
Once again, changes are minimal in both comparisons. This is a sign that the company is
performing well and has positive outlook.
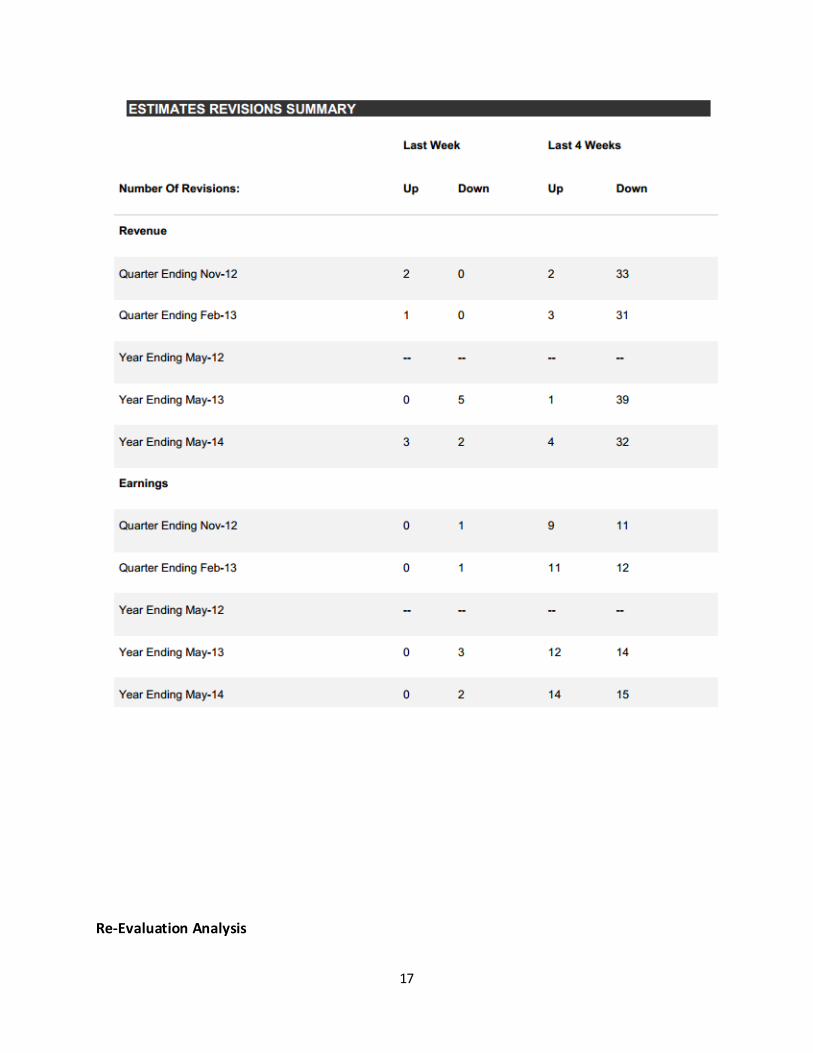
Estimate Revision Analysis
Original Analysis (MM/DD/YYYY)
17
Re-Evaluation Analysis
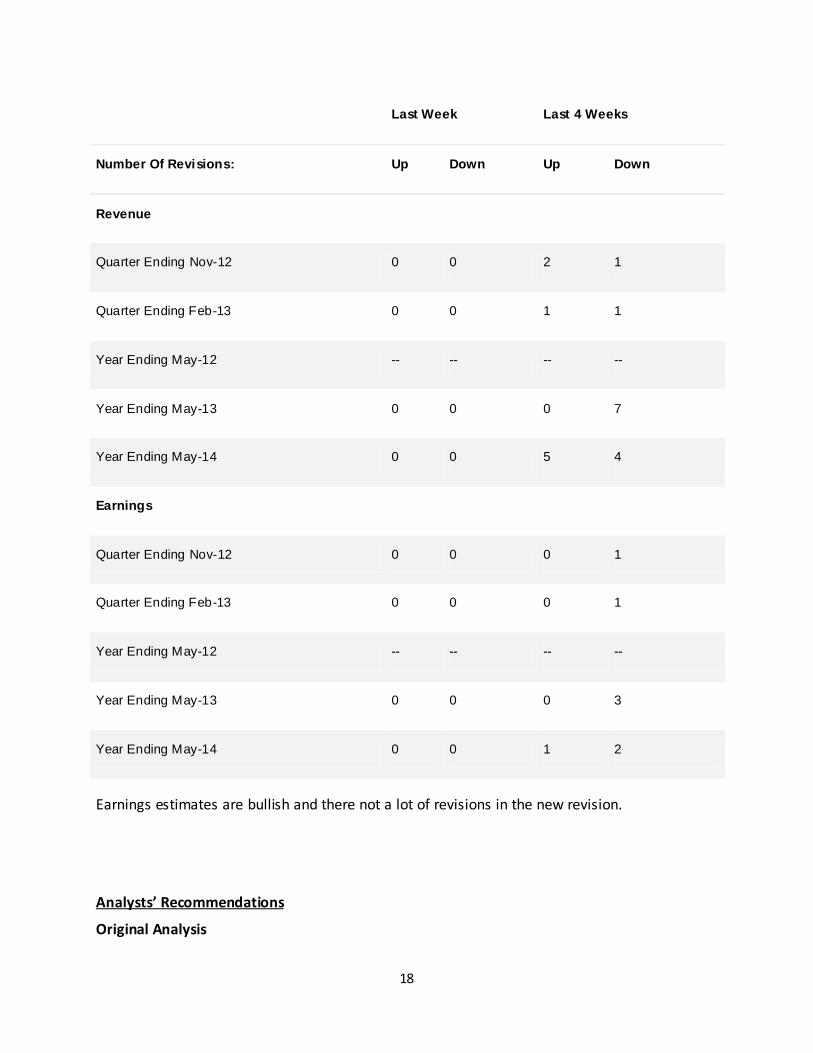
18
Last Week Last 4 Weeks
Number Of Revisions: Up Down Up Down
Revenue
Quarter Ending Nov-12 0 0 2 1
Quarter Ending Feb-13 0 0 1 1
Year Ending May-12 -- -- -- --
Year Ending May-13 0 0 0 7
Year Ending May-14 0 0 5 4
Earnings
Quarter Ending Nov-12 0 0 0 1
Quarter Ending Feb-13 0 0 0 1
Year Ending May-12 -- -- -- --
Year Ending May-13 0 0 0 3
Year Ending May-14 0 0 1 2
Earnings estimates are bullish and there not a lot of revisions in the new revision.
Analysts’ Recommendations
Original Analysis
19
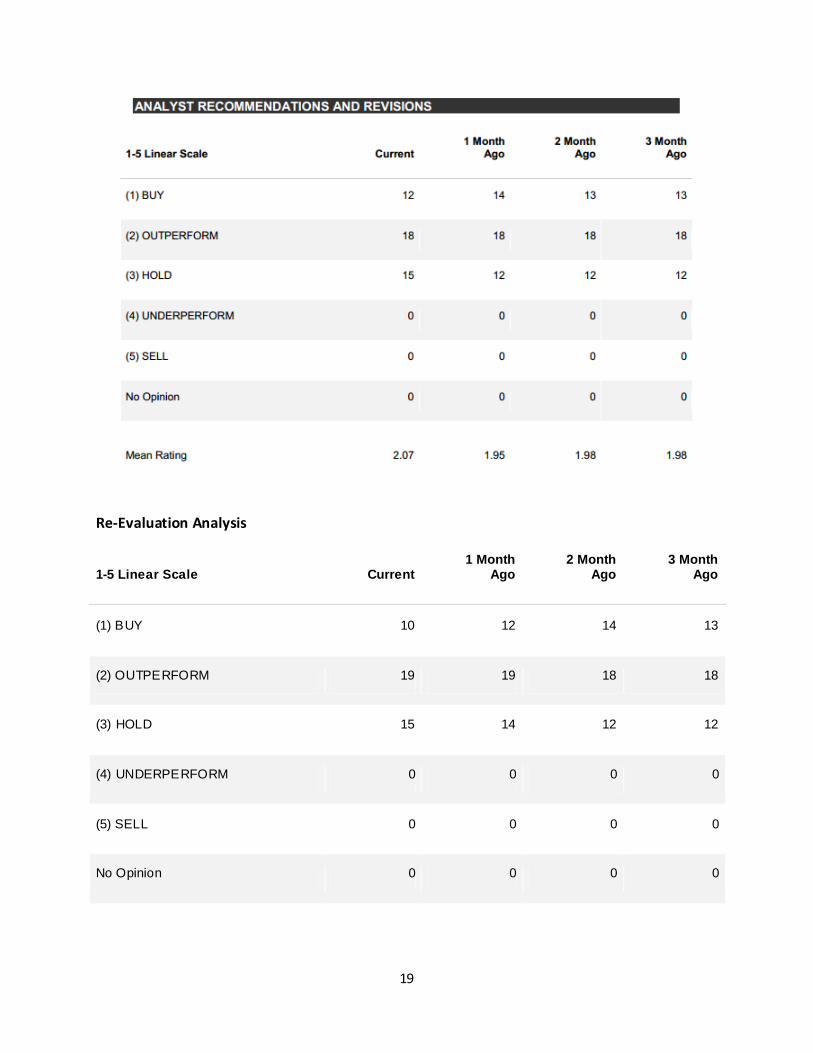
Re-Evaluation Analysis
1-5 Linear Scale Current 1 Month
Ago 2 Month
Ago 3 Month
Ago
(1) BUY 10 12 14 13
(2) OUTPERFORM 19 19 18 18
(3) HOLD 15 14 12 12
(4) UNDERPERFORM 0 0 0 0
(5) SELL 0 0 0 0
No Opinion 0 0 0 0
20
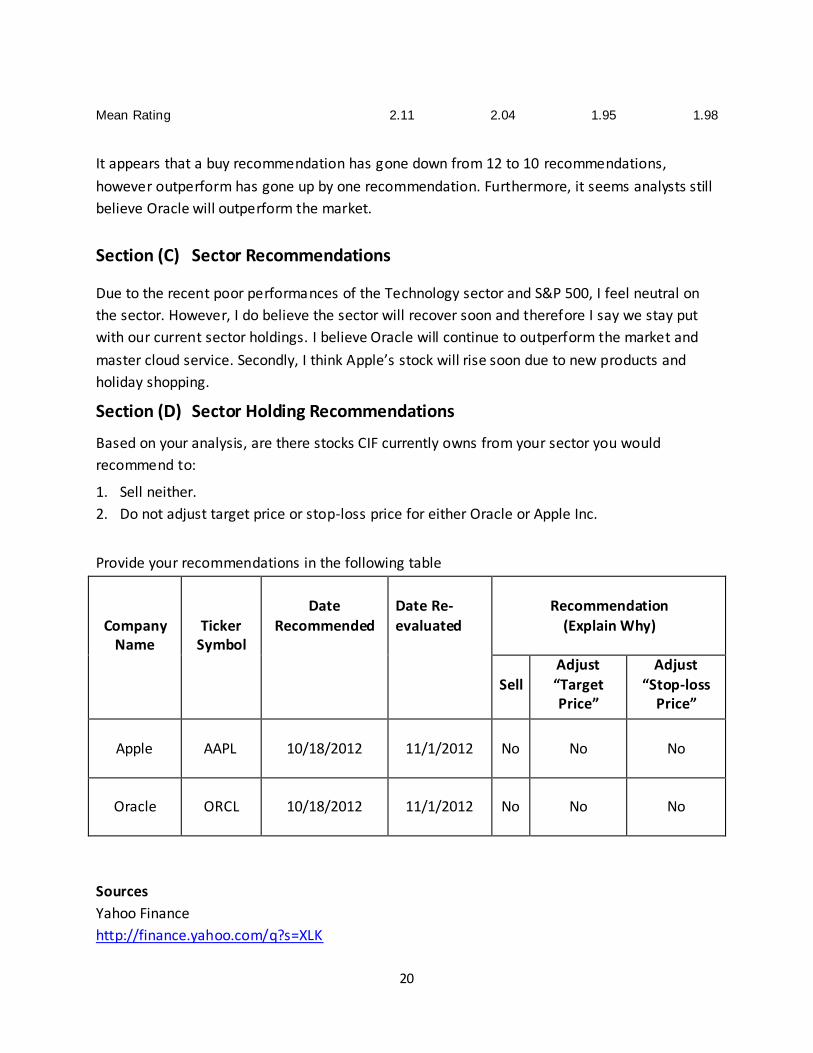
Mean Rating 2.11 2.04 1.95 1.98
It appears that a buy recommendation has gone down from 12 to 10 recommendations,
however outperform has gone up by one recommendation. Furthermore, it seems analysts still
believe Oracle will outperform the market.
Section (C) Sector Recommendations
Due to the recent poor performances of the Technology sector and S&P 500, I feel neutral on
the sector. However, I do believe the sector will recover soon and therefore I say we stay put
with our current sector holdings. I believe Oracle will continue to outperform the market and
master cloud service. Secondly, I think Apple’s stock will rise soon due to new products and
holiday shopping.
Section (D) Sector Holding Recommendations
Based on your analysis, are there stocks CIF currently owns from your sector you would
recommend to:
1. Sell neither.
2. Do not adjust target price or stop-loss price for either Oracle or Apple Inc.
Provide your recommendations in the following table
Company Name
Ticker Symbol
Date
Recommended
Date Re-
evaluated
Recommendation
(Explain Why)
Sell
Adjust
“Target Price”
Adjust
“Stop-loss Price”
Apple AAPL 10/18/2012 11/1/2012 No No No
Oracle ORCL 10/18/2012 11/1/2012 No No No
Sources
Yahoo Finance
http://finance.yahoo.com/q?s=XLK
21
Routers
http://www.reuters.com/news/technology
CIF Website
http://www.business.wsu.edu/academics/finance/cougfund/Pages/CIF-
Reports.aspx?Paged=TRUE&p_SortBehavior=0&p_Sector=Health%20Care&p_Data_x002d_Type
=Stock%20Report&p_ID=63&PageFirstRow=31&&View={A1B97961-C66D-43C7-932F-
8FF3B54FD099}
Bloomberg Businessweek
http://investing.businessweek.com/research/stocks/snapshot/snapshot.asp?ticker=CYMI


![Al-Qaeda inIslamicMaghreb ... · Al-Qaeda in the Islamic Maghreb (AQIM) is an Islamic militant organization evolved from the Algerian and Combat (GSPC). [1] The GSPC, an offshoot](https://img.pdfslide.us/doc/110x75/5fd32ffded665b728e76db0f/al-qaeda-inislamicmaghreb-al-qaeda-in-the-islamic-maghreb-aqim-is-an-islamic.jpg)