Embed Size (px)
Citation preview
SOY MORATORIUM
SOY MORATORIUM
SOYBEAN PLANTING IN THE AMAZON BIOME
FOURTH YEAR OF MAPPING AND MONITORING
SOYBEAN PLANTING IN THE AMAZON BIOME
FOURTH YEAR OF MAPPING AND MONITORING
20112011
EXECUTIVE SUMMARY
The Soy Moratorium for the Amazon Biome was renewed for the fourth time in July 2010, reaffirming the commitment made by ABIOVE’s and ANEC’s industry and exporting members not to acquire soybeans from areas in the Amazon Biome that were deforested as from July 2006.
For this fourth monitoring program, the GTS (Soy Task Force), made up of ABIOVE and ANEC member companies, the Ministry of the Environment, the Bank of Brasil and civil society organizations (International Conservation, Greenpeace, IPAM, TNC and WWF-Brasil), continued its partnership with INPE (National Space Research Institute) for application of a methodology that uses satellite images and was especially developed to detect the presence of agricultural crops in deforested areas. With the objective of generating reliable information on the actual participation of soybeans in the Amazon Biome’s deforestation process, the data bases at FUNAI (National Native Indians Foundation), IBAMA (Brazilian Environmental & Renewable Natural Resources Institute), IBGE (Brazilian Geographic & Statistical Institute), IMAZON (Institute of the Amazon People & Environment) and INPE were used.
Geoambiente Sensoriamento Remoto Ltda., a company specialized in remote sensing, digital cartography and geographical information systems, was hired to identify, characterize and measure land use and occupation in areas pre-selected by INPE. Based on its experience in thematic mapping projects, a specific air-survey methodology was created to identify and quantify agricultural crops, especially soybean crops. Field visits were made and legal documentation researched to identify the rural properties in order to consolidate the information.
Interpretation of the satellite images, and their validation through aerial photographs, made it possible to identify the presence of soybeans on 11,698 hectares (45 sq.miles) that were deforested after July 2006. In the same period, a total of 4.19 million hectares (16,178 sq.miles) were deforested in the whole Amazon Biome, of which 2.97 million hectares (11,467 sq.miles) – or 71% – are located in the three soybean-producing states. Of this latter amount, 370,000 hectares (1,429 sq.miles) are located in the municipalities that grow soybeans.
The soybean acreage located in deforested areas of the Amazon Biome during the Moratorium corresponds to 0.28% of the total deforestation, 0.39% of the deforestation in the three soybean-producing states and 3.1% of the deforestation in the municipalities that grow soybeans. Brazil’s total soybean acreage is 24.1 million hectares (93,051 sq.miles), of which 1.94 million hectares (7,490 sq.miles) are in the Amazon Biome. Soybeans planted on deforested land during the Moratorium amount to 0.05% of Brazil’s total soybean acreage and to 0.6% of soybean acreage in the Amazon Biome.
This report describes the methodology used and presents the results of the Moratorium’s fourth monitoring. Detailed information on the deforested polygons, including the satellite images, panoramic photographs and field surveys that were part of this work, can be found on the site www.abiove.com.br.
2
3
The Soy Moratorium for the Amazon Biome, which represents 49% of Brazil’s land mass and has a population of 20 million inhabitants, was signed on July 24, 2006 by the industries and exporters that are members of ABIOVE (Brazilian Vegetable Oils Industry Association) and ANEC (National Grain Exporters Association). The Moratorium was renewed for the fourth time on July 8, 2010, continuing the commitment made by the companies not to acquire soybeans from areas of the Amazon Biome deforested after July 2006.
Selection of the polygon sampling was based on information regarding the deforested areas to be monitored, supplied by PRODES (Brazilian Amazon Deforestation Monitoring Program). For the first monitoring program in the 2007/08 crop year, a sampling of 265 deforested polygons was selected, with a total monitored area of 49,809 hectares (192 sq.miles). After flyovers and identification of land use, it was concluded that no soybeans had been planted on these deforested polygons.
The sampling for the second monitoring program, in the 2008/09 crop year, was increased to 630 polygons, with a total monitored area of 157,896 hectares (610 sq.miles). Soybeans were found on 12 of these polygons, corresponding to 1,384 hectares (5 sq.miles) deforested after the declaration of the Moratorium.
A new methodology, developed by INPE, was used for the third monitoring program, covering 2,955 polygons corresponding to an area of 302,149 hectares (1,167 sq.miles). Soybeans were found on 76 of these polygons, a total of 6,295 hectares (24 sq.miles).
For the fourth monitoring program, the methodology was improved, mainly through adjustments related to the period of flyovers and to the acquisition of auxiliary satellite images. This monitoring took into consideration the agricultural calendar, whose main difference is between Pará state and Rondônia and Mato Grosso states. In addition, all the deforested areas within the scope of the Moratorium were monitored, including an evaluation of conservation units, indigenous lands and settlements.
In the 2010/11 crop year, the GTS decided to hire Geoambiente to do the flyovers of the preselected polygons and to make field visits to the rural properties with the possible presence of soybean planting. The data bases of the following institutes were used: FUNAI (National Indians Foundation), IBAMA (Brazilian Institute of the Environment and Natural Renewable Resources), IBGE (Brazilian Institute for Geography and Statistics), IMAZON (Amazon Institute of People and the Environment), INCRA (National Institute of Colonization and Agrarian Reform) and INPE (National Space Research Institute).
I INTRODUCTION
The scope of the work is to identify the occurrence of soybean planting in areas of the Amazon Biome deforested after July 24, 2006, in accordance with the criteria of the Soy Moratorium.
The specific objective of the work is to use satellite images to select areas with the probably presence of soybeans in deforested areas indicated by the PRODES project. Information of land use and occupation was later confirmed through aerial photographs and field surveys.
II SCOPE OF THE WORK
The methodology of the current work consists in defining the current area of concentration of soybean plantings in the Amazon Biome and in pre-selecting the PRODES deforested polygons where the possible presence of annual agricultural crops was identified through satellite images. Flyovers of the preselected polygons were then made to confirm whether or not soybean plantings had occurred. The methodology is detailed below.
III METHODOLOGY
The selection of deforested polygons to be monitored was based on the following criteria:
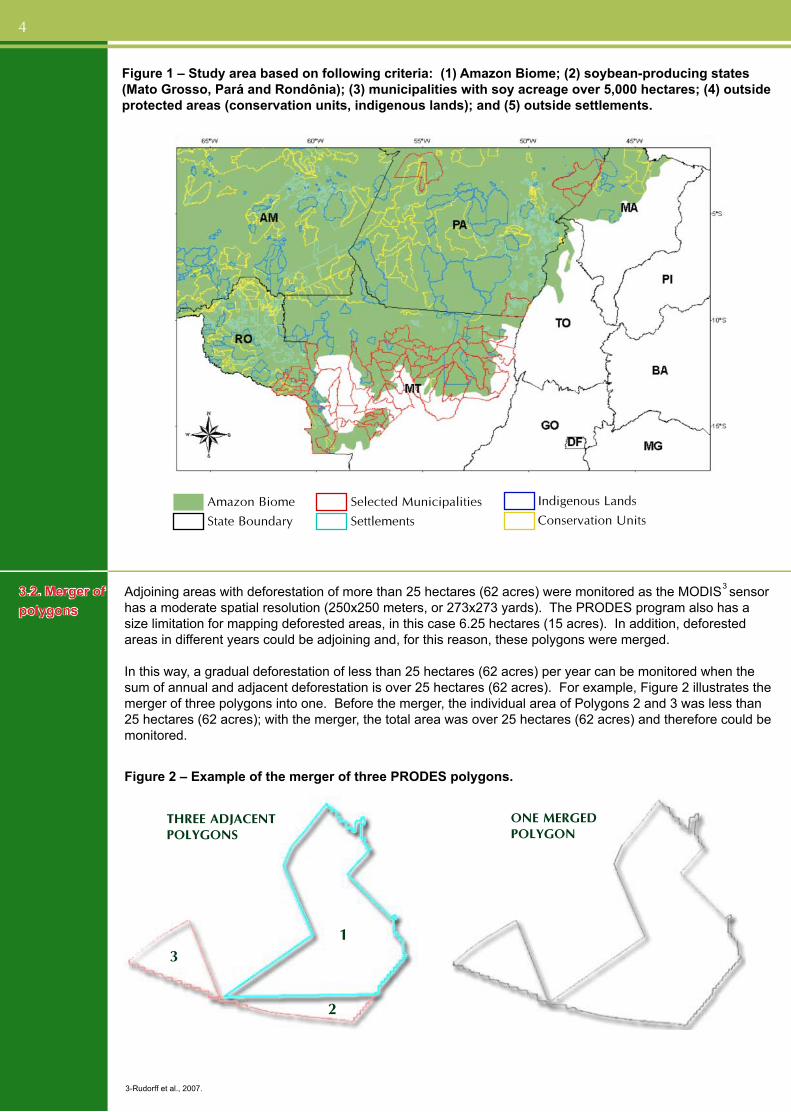
1.Polygons wholly or partially within the Amazon Biome (source: IBGE).2.Polygons located in the states of Mato Grosso, Pará and Rondônia, the main soybean producers in the Amazon Biome (source: IBGE).3.Polygons located in municipalities, whose current crop or that projected for the following year indicates a soybean planted area of more than 5,000 hectares (19 sq.miles) (source: IBGE).4.Merged polygons (see item 3.2) over 25 hectares (62 acres) identified by PRODES in 2007, 2008, 2009 and 2010.5.Polygons outside the protected areas – Conservation Units and Indigenous Reserves (source: IBAMA and FUNAI) or Settlements (source: INCRA).
Figure 1 illustrates the municipalities selected for monitoring in accordance with the criteria established above.
1-Available at www.obt.inpe.br/prodes/ (Shimabukuro et al., 1998).2-The PRODES annual evaluations are based on images acquired between August and July of the following year. PRODES 2007 used some images acquired after the Soy Moratorium was signed (July 24, 2006).
3.1 Definition of the study area
1
2
4
Figure 1 – Study area based on following criteria: (1) Amazon Biome; (2) soybean-producing states (Mato Grosso, Pará and Rondônia); (3) municipalities with soy acreage over 5,000 hectares; (4) outside protected areas (conservation units, indigenous lands); and (5) outside settlements.
Adjoining areas with deforestation of more than 25 hectares (62 acres) were monitored as the MODIS sensor has a moderate spatial resolution (250x250 meters, or 273x273 yards). The PRODES program also has a size limitation for mapping deforested areas, in this case 6.25 hectares (15 acres). In addition, deforested areas in different years could be adjoining and, for this reason, these polygons were merged.
In this way, a gradual deforestation of less than 25 hectares (62 acres) per year can be monitored when the sum of annual and adjacent deforestation is over 25 hectares (62 acres). For example, Figure 2 illustrates the merger of three polygons into one. Before the merger, the individual area of Polygons 2 and 3 was less than 25 hectares (62 acres); with the merger, the total area was over 25 hectares (62 acres) and therefore could be monitored.
3-Rudorff et al., 2007.
Figure 2 – Example of the merger of three PRODES polygons.
Three adjacenT polygons
one merged polygon
3.2. Merger of polygons
1
2
3
Amazon Biome
State Boundary
Selected Municipalities
Settlements
Indigenous Lands
Conservation Units
3
5
4-Justice et al., 1998; Huete et al., 1999; Justice e Townshend, 2002.
The presence of soy in deforested polygons, detected through satellite images, needs to be identified early on, during the initial stages of soy growth, to determine the following steps of flyovers and field visits. Thus, images from the MODIS sensor on board Earth satellite were obtained from the start of the soy planting season up to about 50 days after planting ended. With images from this period, it was possible to pre-select polygons with agricultural crops; however, it was not possible to differentiate soy from other crops.
This year, to improve pre-selection of polygons and adapt the methodology to regional crop characteristics, two selections using MODIS images were made for the states of Mato Grosso and Rondônia. The first analysis was made from images from the start of the soy growth cycle (between October 15, 2010 and December 15, 2010), and the second from images obtained between October 15, 2010 and January 15, 2011. In the case of the state of Pará, due to the soy planting calendar, the MODIS images used for the first selection were taken between December 1, 2010 and January 31, 2011, while the second selection used images obtained between December 1, 2010 and March 10, 2011.
To reduce the number of polygons designated for flyovers, the pre-selected polygons were submitted to visual interpretation using images with better spatial resolution and with no cloud cover. These images were obtained from the Landsat-5 (sensor TM) and Resourcesat-1 (AWIFS and LISS3 sensors) satellites, acquired by INPE at the reception station in Cuiabá, Mato Grosso state. It is important to highlight that the analysis of images with better spatial resolution does not exclude polygons with agricultural crop characteristics; in other words, it does not omit polygons with a possible soy presence but it does exclude those polygons mistakenly classified as having agricultural crops in the original analysis using MODIS images with lesser spatial resolution. It should be noted that, due to the high temporal resolution of the MODIS images, analysis of deforested polygons covered the entire area of study, whereas the analysis of higher spatial resolution images (lower temporal resolution) was made only in areas where images had no clouds. The 2010/11 crop was particularly favorable for acquisition of cloud-free images, making it possible to refine the selection of polygons for the flyover stage.
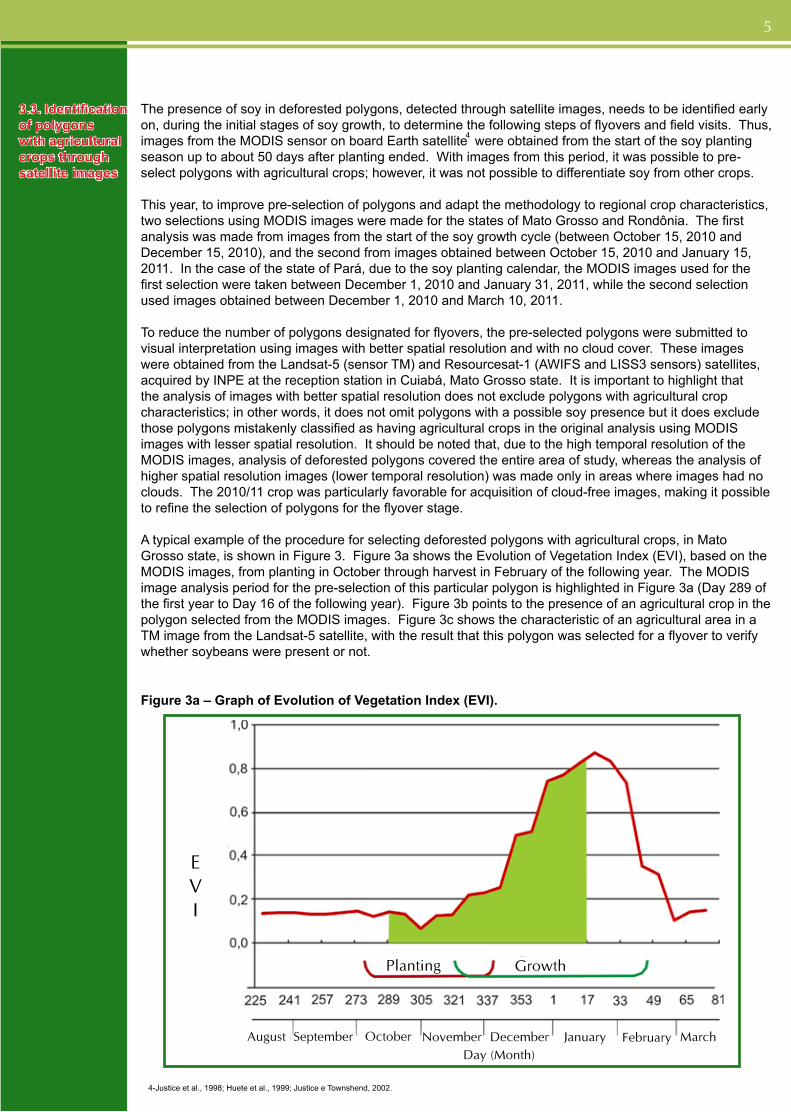
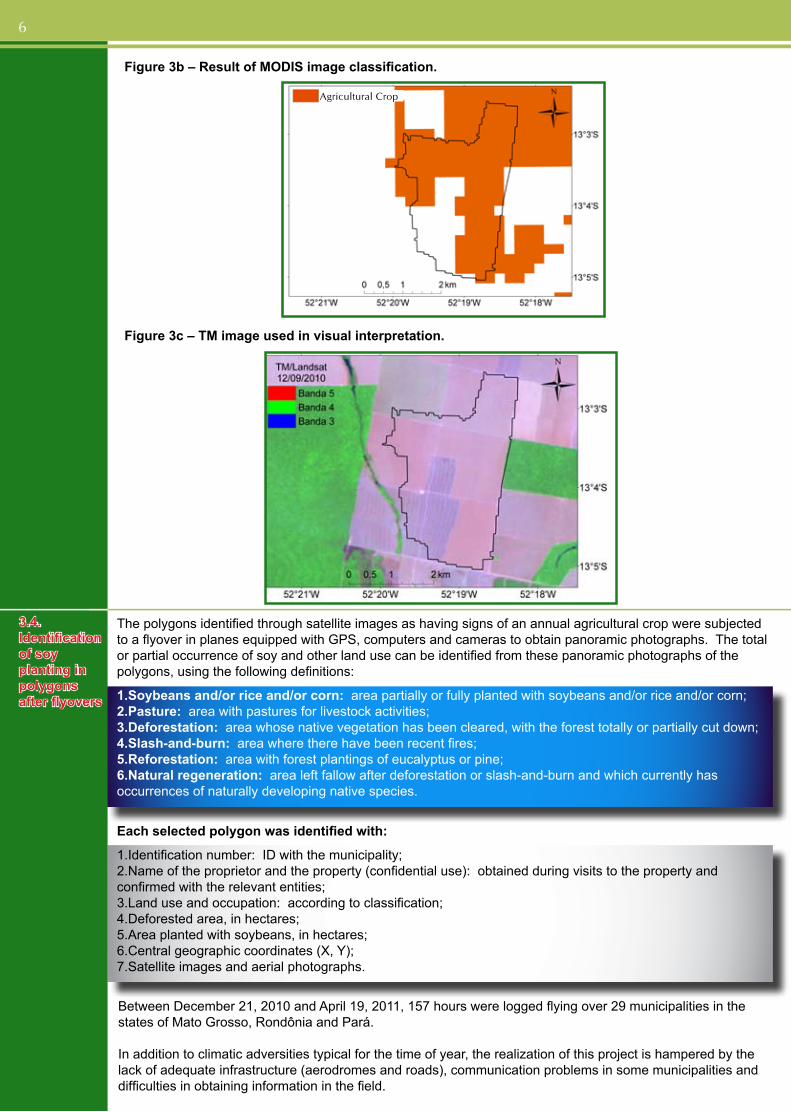
A typical example of the procedure for selecting deforested polygons with agricultural crops, in Mato Grosso state, is shown in Figure 3. Figure 3a shows the Evolution of Vegetation Index (EVI), based on the MODIS images, from planting in October through harvest in February of the following year. The MODIS image analysis period for the pre-selection of this particular polygon is highlighted in Figure 3a (Day 289 of the first year to Day 16 of the following year). Figure 3b points to the presence of an agricultural crop in the polygon selected from the MODIS images. Figure 3c shows the characteristic of an agricultural area in a TM image from the Landsat-5 satellite, with the result that this polygon was selected for a flyover to verify whether soybeans were present or not.
4
3.3. Identification of polygons with agricultural crops through satellite images
Figure 3a – Graph of Evolution of Vegetation Index (EVI).
evI
Planting Growth
August September October November December January February MarchDay (Month)
1
6
Figure 3b – Result of MODIS image classification.
Figure 3c – TM image used in visual interpretation.
3.4. Identification of soy planting in polygons after flyovers
The polygons identified through satellite images as having signs of an annual agricultural crop were subjected to a flyover in planes equipped with GPS, computers and cameras to obtain panoramic photographs. The total or partial occurrence of soy and other land use can be identified from these panoramic photographs of the polygons, using the following definitions:
1.Soybeans and/or rice and/or corn: area partially or fully planted with soybeans and/or rice and/or corn;2.Pasture: area with pastures for livestock activities;3.Deforestation: area whose native vegetation has been cleared, with the forest totally or partially cut down;4.Slash-and-burn: area where there have been recent fires;5.Reforestation: area with forest plantings of eucalyptus or pine;6.Natural regeneration: area left fallow after deforestation or slash-and-burn and which currently has occurrences of naturally developing native species.
Each selected polygon was identified with:
1.Identification number: ID with the municipality;2.Name of the proprietor and the property (confidential use): obtained during visits to the property and confirmed with the relevant entities;3.Land use and occupation: according to classification;4.Deforested area, in hectares;5.Area planted with soybeans, in hectares;6.Central geographic coordinates (X, Y);7.Satellite images and aerial photographs.
Between December 21, 2010 and April 19, 2011, 157 hours were logged flying over 29 municipalities in the states of Mato Grosso, Rondônia and Pará.
In addition to climatic adversities typical for the time of year, the realization of this project is hampered by the lack of adequate infrastructure (aerodromes and roads), communication problems in some municipalities and difficulties in obtaining information in the field.
Agricultural Crop
7
classification
hectares
25
25 - 50
50 - 100
>100
Total
n
12,579
2,020
923
675
16,197
hectares
165,156
69,454
63,467
188,158
486,235
n
8,470
1,765
948
858
12,041
hectares
110,612
61,034
66,142
248,324
486,112
prodes prodes - merged
<_
IV RESULTS
4.1. Selection of PRODES polygons
Based on the methodology defined for selecting the study area to be monitored, 16,197 polygons have been deforested since the start of the Soy Moratorium, corresponding to a total area of 486,235 hectares (1,877 sq.miles) (Table 1). These polygons are distributed among 53 municipalities in the Amazon Biome: 41 in Mato Grosso, 6 in Pará and 6 in Rondônia. With the merger of adjoining deforested polygons in the years 2007, 2008, 2009 and 2010, the number of polygons fell to 12,041, as shown in Table 1.
Table 1 shows that the merger reduced the number of polygons in the classifications with the smaller acreages (≤ 25 hectares or 62 acres, and 25-50 hectares or 62-124 acres) and increased the number with larger acreages (50-100 hectares or 124-247 acres, and >100 hectares or 247 acres). As can be seen, the merger did not significantly impact the total area being studied.
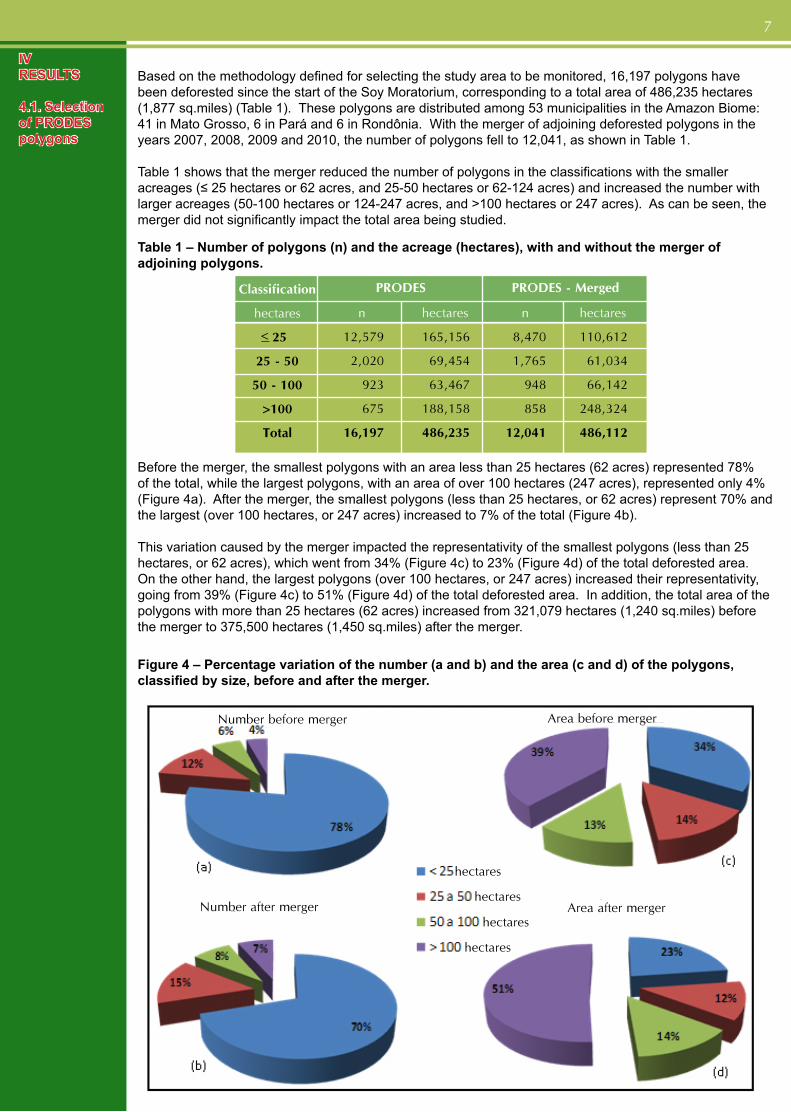
Before the merger, the smallest polygons with an area less than 25 hectares (62 acres) represented 78% of the total, while the largest polygons, with an area of over 100 hectares (247 acres), represented only 4% (Figure 4a). After the merger, the smallest polygons (less than 25 hectares, or 62 acres) represent 70% and the largest (over 100 hectares, or 247 acres) increased to 7% of the total (Figure 4b).
This variation caused by the merger impacted the representativity of the smallest polygons (less than 25 hectares, or 62 acres), which went from 34% (Figure 4c) to 23% (Figure 4d) of the total deforested area. On the other hand, the largest polygons (over 100 hectares, or 247 acres) increased their representativity, going from 39% (Figure 4c) to 51% (Figure 4d) of the total deforested area. In addition, the total area of the polygons with more than 25 hectares (62 acres) increased from 321,079 hectares (1,240 sq.miles) before the merger to 375,500 hectares (1,450 sq.miles) after the merger.
Figure 4 – Percentage variation of the number (a and b) and the area (c and d) of the polygons, classified by size, before and after the merger.
Table 1 – Number of polygons (n) and the acreage (hectares), with and without the merger of adjoining polygons.
Number before merger Area before merger
Area after mergerNumber after merger
hectares
hectares
hectares
hectares
polygons
selected outside settlements
selected close to settlement boundaries
Total
MT
191
23
214
PA
78
-
78
RO
1
-
1
Total
270
23
293
states
8
Table 2 – Number of polygons (n) and acreage (hectares) by classification of monitored area in the states of Mato Grosso, Pará and Rondônia.
classification
hectares
25 - 50
50 - 100
>100
subtotal
n
1,011
575
599
2,185
hectares
35,259
39,996
177,494
252,749
n
644
330
237
1,211
hectares
22,119
22,999
64,504
109,622
mato grosso pará
n
110
43
22
175
hectares
3,656
3,147
6,326
13,129
n
1,765
948
858
3,571
hectares
61,034
66,143
248,324
375,500
rondônia subtotal
Based on the criteria for selecting merged polygons with more than 25 hectares (62 acres), 3,571 polygons were selected, made up of 1,765 polygons in the 25-50 hectares (62-124 acres) classification, 948 polygons in the 50-100 hectares (124-247 acres) classification, and 858 polygons in the over 100 hectares (247 acres) classification. These 3,571 polygons represent an area of 375,500 hectares (1,450 sq.miles), or 77% of all the polygons being studied (Table 2).
Table 2 presents the number of deforested polygons by classification of the area monitored in each of the three states analyzed. The largest number of polygons in the soy-producing municipalities (>5,000 hectares, or 19 sq.miles) of the Amazon Biome are found in Mato Grosso (2,185), or 61% of the total. Based on the same criteria, Pará was responsible for 34% of the polygons (1,211) and Rondônia for 5% (175).
4.2. Selection of polygons with annual agricultural crops via satellite images
From the evaluation of the 3,571 polygons monitored by MODIS sensor images, followed by the visual interpretation of medium-resolution spatial images, 293 polygons (9% of the total analyzed) were selected as showing signs of agricultural crops. Of these, 270 polygons were located outside settlements and 23 were on settlement boundaries, as shown in Table 3. This table also shows that 42 polygons with agricultural crops were identified within settlement boundaries. It should be noted that no deforested polygon with agricultural characteristics was found within Indigenous Lands or Conservation Units.
Table 3 – Number of polygons selected for flyovers, evaluated based on MODIS images and medium-resolution spatial images.
MT- Mato Grosso State; PA- Pará State; RO- Rondônia State.
Of the total deforested polygons in the study area (3,571), 91% (3,236 polygons) showed no signs of the presence of agricultural crops (Table 3).
4.3. Identification of soy plantings through flyovers
Geoambiente was responsible for the flyovers of the 293 selected polygons. Of these, 147 polygons were found to have soybeans, corresponding to an area of 11,698 hectares (45 sq.miles) (Table 4), indicating conversion of the forest to soybeans within the period of the Soy Moratorium. This corresponds to 0.28% of all deforestation in the Amazon Biome, or 0.39% of the deforestation in the three states of the Amazon Biome subjected to this monitoring, or 3.1% of the deforestation in the soy-producing municipalities.
In Mato Grosso state, 105 polygons did not comply with the rules of the Soy Moratorium. These polygons represent an area of 8,385 hectares (32 sq.miles) with soy planting (Table 4), corresponding to 72% of soy crops found in monitoring period, but only 1.2% of the total area deforested in the state of Mato Grosso.
Pará state had 41 polygons, with an area of 3,284 hectares (13 sq.miles), planted with soybeans (Table 4), corresponding to 28% of the soy crops found in this monitoring period, but only 0.17% of the total area deforested in the state of Pará during the Soy Moratorium. In Rondônia state, only one polygon, with 29 hectares (0.1 sq.miles) of soybeans (Table 4), was identified in a total deforested area of 365,600 hectares (1,412 sq.miles) (Table 5).
It is worth mentioning that, of the 293 polygons selected for flyovers, 113 were in the >100 hectares (247 acres) classification, of which 55 were identified as having soybean plantings. Soy acreage in these polygons amounted to 8,346 hectares (32 sq.miles) (Table 4), corresponding to 71% of the total soy acreage on deforested land.
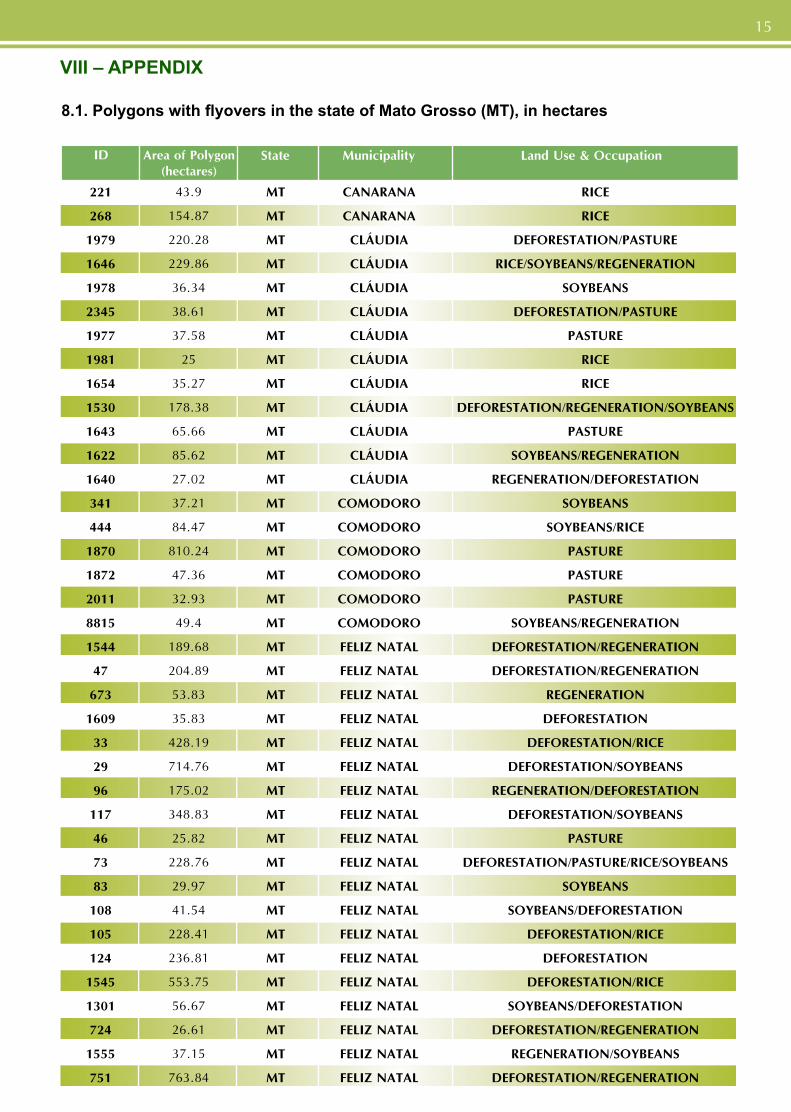
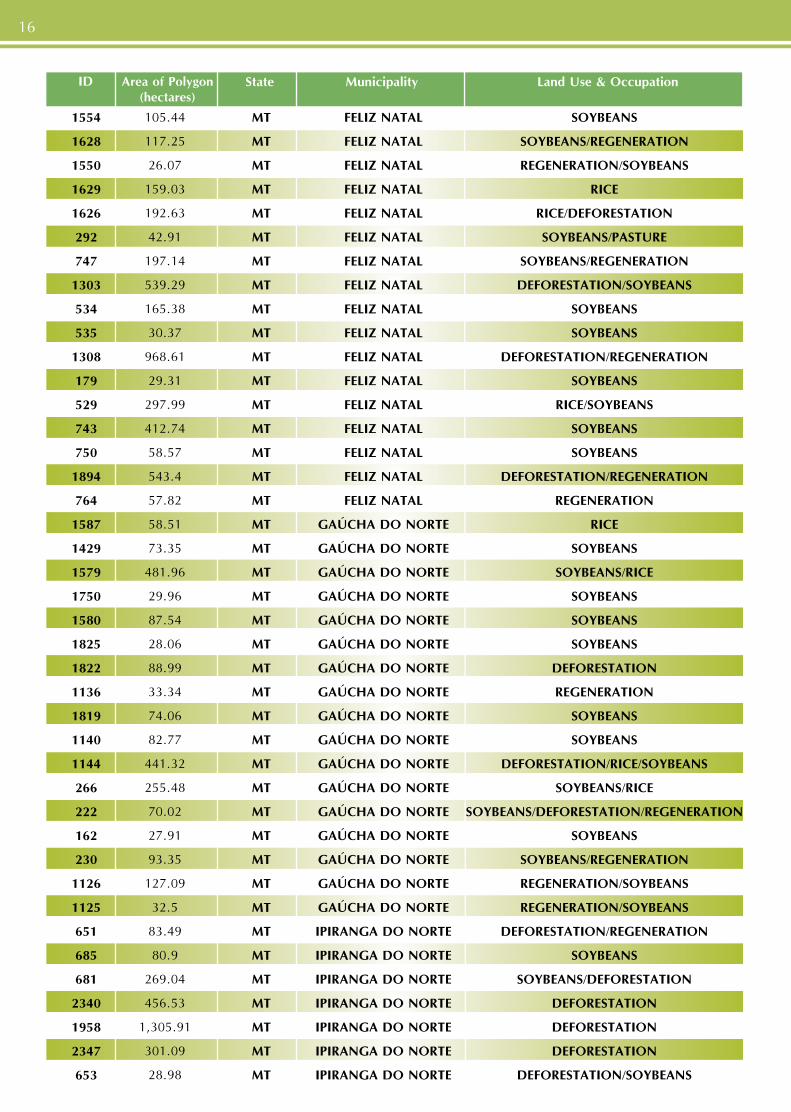
Item VIII – Appendix – has the complete listing of the monitored polygons.
9
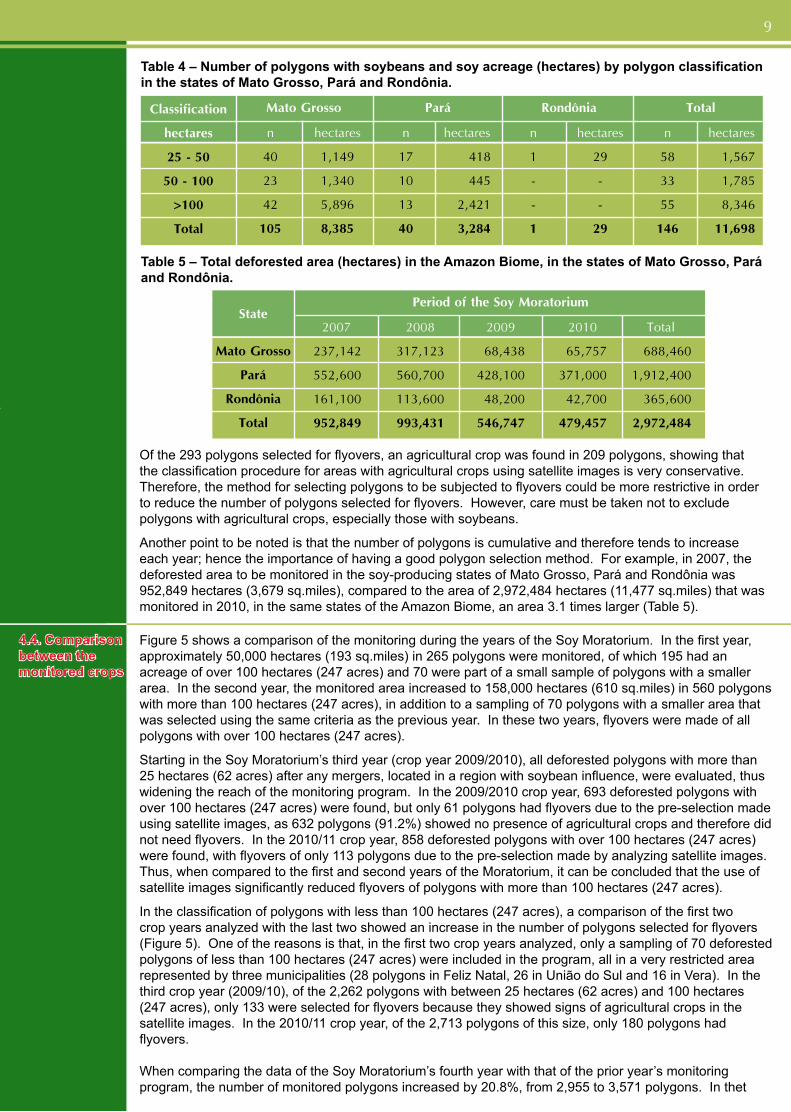
Table 4 – Number of polygons with soybeans and soy acreage (hectares) by polygon classification in the states of Mato Grosso, Pará and Rondônia.
classification
hectares
25 - 50
50 - 100
>100
Total
n
40
23
42
105
hectares
1,149
1,340
5,896
8,385
n
17
10
13
40
hectares
418
445
2,421
3,284
mato grosso pará
n
1
-
-
1
hectares
29
-
-
29
n
58
33
55
146
hectares
1,567
1,785
8,346
11,698
rondônia Total
Table 5 – Total deforested area (hectares) in the Amazon Biome, in the states of Mato Grosso, Pará and Rondônia.
state
mato grosso
pará
rondônia
Total
2007
237,142
552,600
161,100
952,849
2008
317,123
560,700
113,600
993,431
2009
68,438
428,100
48,200
546,747
period of the soy moratorium
2010
65,757
371,000
42,700
479,457
Total
688,460
1,912,400
365,600
2,972,484
Of the 293 polygons selected for flyovers, an agricultural crop was found in 209 polygons, showing that the classification procedure for areas with agricultural crops using satellite images is very conservative. Therefore, the method for selecting polygons to be subjected to flyovers could be more restrictive in order to reduce the number of polygons selected for flyovers. However, care must be taken not to exclude polygons with agricultural crops, especially those with soybeans.
Another point to be noted is that the number of polygons is cumulative and therefore tends to increase each year; hence the importance of having a good polygon selection method. For example, in 2007, the deforested area to be monitored in the soy-producing states of Mato Grosso, Pará and Rondônia was 952,849 hectares (3,679 sq.miles), compared to the area of 2,972,484 hectares (11,477 sq.miles) that was monitored in 2010, in the same states of the Amazon Biome, an area 3.1 times larger (Table 5).
4.4. Comparison between the monitored crops
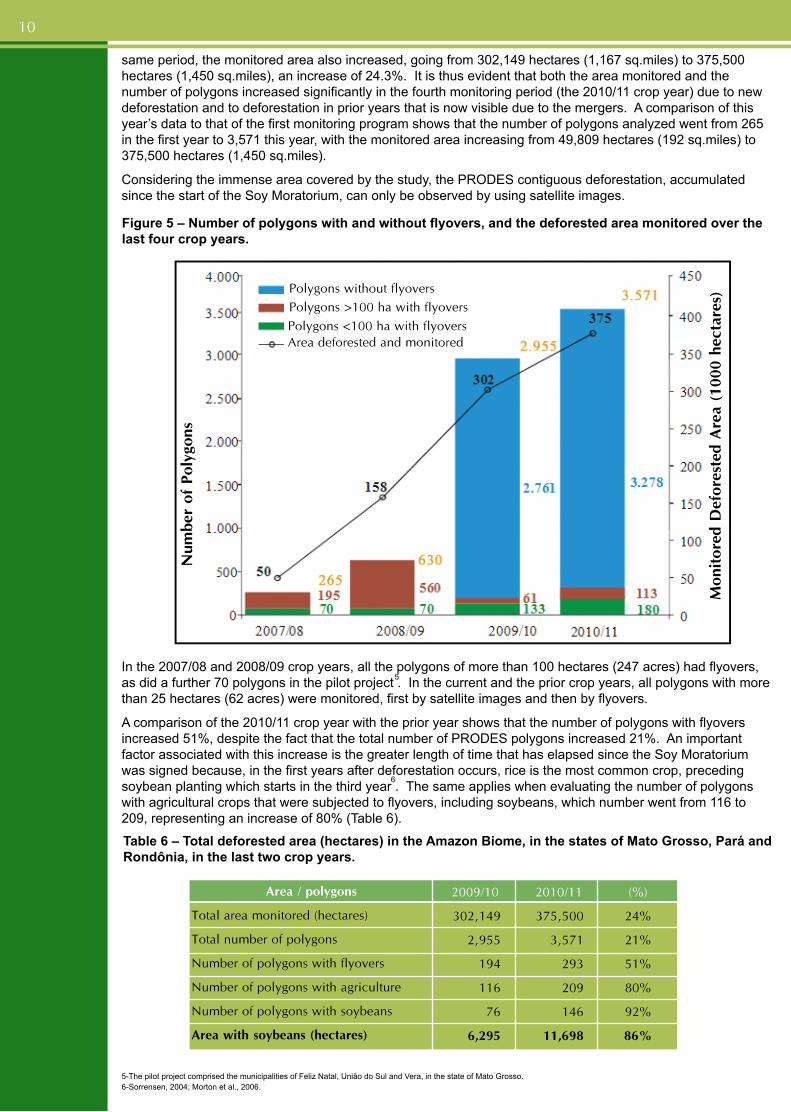
Figure 5 shows a comparison of the monitoring during the years of the Soy Moratorium. In the first year, approximately 50,000 hectares (193 sq.miles) in 265 polygons were monitored, of which 195 had an acreage of over 100 hectares (247 acres) and 70 were part of a small sample of polygons with a smaller area. In the second year, the monitored area increased to 158,000 hectares (610 sq.miles) in 560 polygons with more than 100 hectares (247 acres), in addition to a sampling of 70 polygons with a smaller area that was selected using the same criteria as the previous year. In these two years, flyovers were made of all polygons with over 100 hectares (247 acres).
Starting in the Soy Moratorium’s third year (crop year 2009/2010), all deforested polygons with more than 25 hectares (62 acres) after any mergers, located in a region with soybean influence, were evaluated, thus widening the reach of the monitoring program. In the 2009/2010 crop year, 693 deforested polygons with over 100 hectares (247 acres) were found, but only 61 polygons had flyovers due to the pre-selection made using satellite images, as 632 polygons (91.2%) showed no presence of agricultural crops and therefore did not need flyovers. In the 2010/11 crop year, 858 deforested polygons with over 100 hectares (247 acres) were found, with flyovers of only 113 polygons due to the pre-selection made by analyzing satellite images. Thus, when compared to the first and second years of the Moratorium, it can be concluded that the use of satellite images significantly reduced flyovers of polygons with more than 100 hectares (247 acres).
In the classification of polygons with less than 100 hectares (247 acres), a comparison of the first two crop years analyzed with the last two showed an increase in the number of polygons selected for flyovers (Figure 5). One of the reasons is that, in the first two crop years analyzed, only a sampling of 70 deforested polygons of less than 100 hectares (247 acres) were included in the program, all in a very restricted area represented by three municipalities (28 polygons in Feliz Natal, 26 in União do Sul and 16 in Vera). In the third crop year (2009/10), of the 2,262 polygons with between 25 hectares (62 acres) and 100 hectares (247 acres), only 133 were selected for flyovers because they showed signs of agricultural crops in the satellite images. In the 2010/11 crop year, of the 2,713 polygons of this size, only 180 polygons had flyovers. When comparing the data of the Soy Moratorium’s fourth year with that of the prior year’s monitoring program, the number of monitored polygons increased by 20.8%, from 2,955 to 3,571 polygons. In thet
10
same period, the monitored area also increased, going from 302,149 hectares (1,167 sq.miles) to 375,500 hectares (1,450 sq.miles), an increase of 24.3%. It is thus evident that both the area monitored and the number of polygons increased significantly in the fourth monitoring period (the 2010/11 crop year) due to new deforestation and to deforestation in prior years that is now visible due to the mergers. A comparison of this year’s data to that of the first monitoring program shows that the number of polygons analyzed went from 265 in the first year to 3,571 this year, with the monitored area increasing from 49,809 hectares (192 sq.miles) to 375,500 hectares (1,450 sq.miles).
Considering the immense area covered by the study, the PRODES contiguous deforestation, accumulated since the start of the Soy Moratorium, can only be observed by using satellite images.
Figure 5 – Number of polygons with and without flyovers, and the deforested area monitored over the last four crop years.
In the 2007/08 and 2008/09 crop years, all the polygons of more than 100 hectares (247 acres) had flyovers, as did a further 70 polygons in the pilot project . In the current and the prior crop years, all polygons with more than 25 hectares (62 acres) were monitored, first by satellite images and then by flyovers.
A comparison of the 2010/11 crop year with the prior year shows that the number of polygons with flyovers increased 51%, despite the fact that the total number of PRODES polygons increased 21%. An important factor associated with this increase is the greater length of time that has elapsed since the Soy Moratorium was signed because, in the first years after deforestation occurs, rice is the most common crop, preceding soybean planting which starts in the third year . The same applies when evaluating the number of polygons with agricultural crops that were subjected to flyovers, including soybeans, which number went from 116 to 209, representing an increase of 80% (Table 6).
area / polygons
Total area monitored (hectares)
Total number of polygons
Number of polygons with flyovers
Number of polygons with agriculture
Number of polygons with soybeans
area with soybeans (hectares)
2009/10
302,149
2,955
194
116
76
6,295
2010/11
375,500
3,571
293
209
146
11,698
(%)
24%
21%
51%
80%
92%
86%
5
6
5-The pilot project comprised the municipalities of Feliz Natal, União do Sul and Vera, in the state of Mato Grosso.6-Sorrensen, 2004; Morton et al., 2006.
Table 6 – Total deforested area (hectares) in the Amazon Biome, in the states of Mato Grosso, Pará and Rondônia, in the last two crop years.
num
ber
of p
olyg
ons
Polygons without flyoversPolygons >100 ha with flyoversPolygons <100 ha with flyoversArea deforested and monitored
mon
itor
ed d
efor
este
d are
a (1
000
hect
ares
)
11
4.5. Probable causes for the increase in soybean planting in deforested polygons
A comparison of the number of polygons with soybeans can only be made between the current crop year (2010/11) and the prior crop year (2009/2010) because these two monitoring periods used equivalent methodologies. In the earlier years, only polygons with an area of more than 100 hectares (247 acres), with no mergers, were evaluated, which impedes the comparison.
As regards the prior crop year, there was an increase of approximately 93% in the number of polygons used for soybean crops, going from 76 polygons to 146, while the soybean acreage increased from 6,295 hectares (24 sq.miles) to 11,698 hectares (45 sq.miles), or an increase of about 86%. The causes of this increase can be attributed to the following factors:
a) An increase in the monitored area, from 302,149 hectares (1,167 sq.miles) in 2009/10 to 375,500 hectares (1,450 sq.miles) in 2010/11;b) A favorable market scenario that stimulated soybean planting;c) Longer period between deforestation and planting soybean crops as it is more usual to plant rice for a year or two in recently deforested areas before planting soybeans .
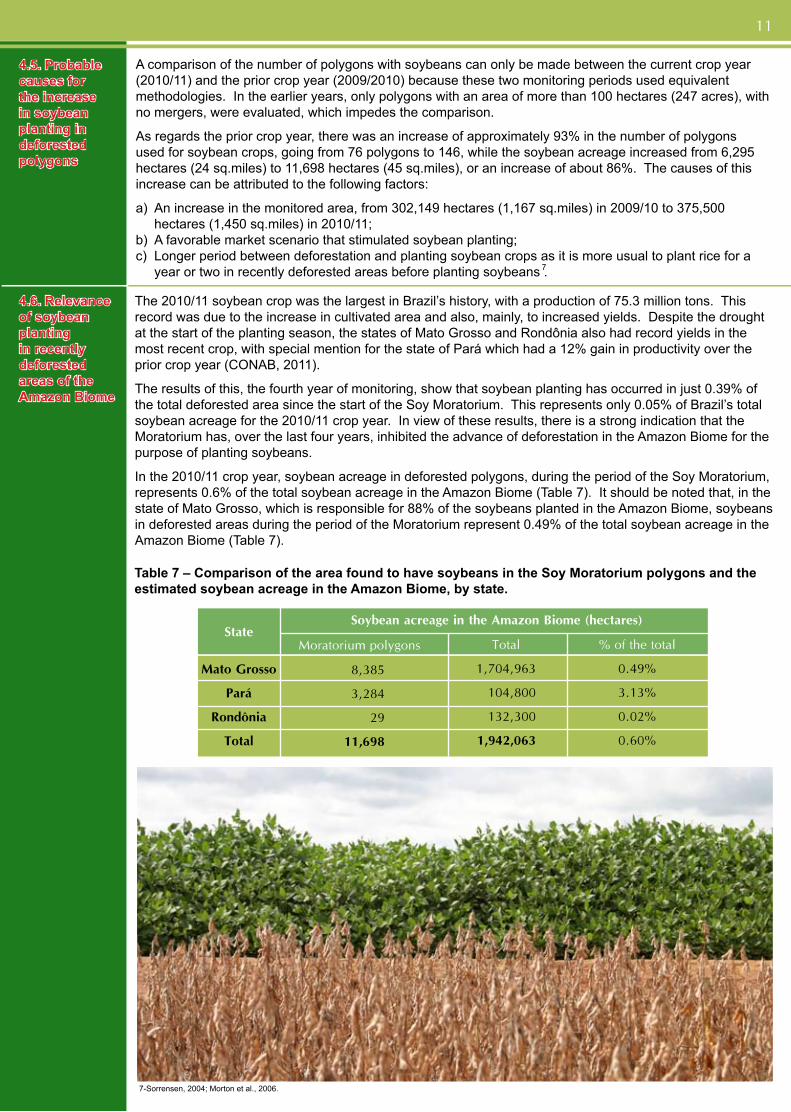
4.6. Relevance of soybean planting in recently deforested areas of the Amazon Biome
The 2010/11 soybean crop was the largest in Brazil’s history, with a production of 75.3 million tons. This record was due to the increase in cultivated area and also, mainly, to increased yields. Despite the drought at the start of the planting season, the states of Mato Grosso and Rondônia also had record yields in the most recent crop, with special mention for the state of Pará which had a 12% gain in productivity over the prior crop year (CONAB, 2011).
The results of this, the fourth year of monitoring, show that soybean planting has occurred in just 0.39% of the total deforested area since the start of the Soy Moratorium. This represents only 0.05% of Brazil’s total soybean acreage for the 2010/11 crop year. In view of these results, there is a strong indication that the Moratorium has, over the last four years, inhibited the advance of deforestation in the Amazon Biome for the purpose of planting soybeans.
In the 2010/11 crop year, soybean acreage in deforested polygons, during the period of the Soy Moratorium, represents 0.6% of the total soybean acreage in the Amazon Biome (Table 7). It should be noted that, in the state of Mato Grosso, which is responsible for 88% of the soybeans planted in the Amazon Biome, soybeans in deforested areas during the period of the Moratorium represent 0.49% of the total soybean acreage in the Amazon Biome (Table 7).
Table 7 – Comparison of the area found to have soybeans in the Soy Moratorium polygons and the estimated soybean acreage in the Amazon Biome, by state.
state
mato grosso
pará
rondônia
Total
Moratorium polygons Total
1,704,963
104,800
132,300
1,942,063
% of the total
0.49%
3.13%
0.02%
0.60%
soybean acreage in the amazon Biome (hectares)
7
7-Sorrensen, 2004; Morton et al., 2006.
8,385
3,284
29
11,698
12
V CONCLUSIONS
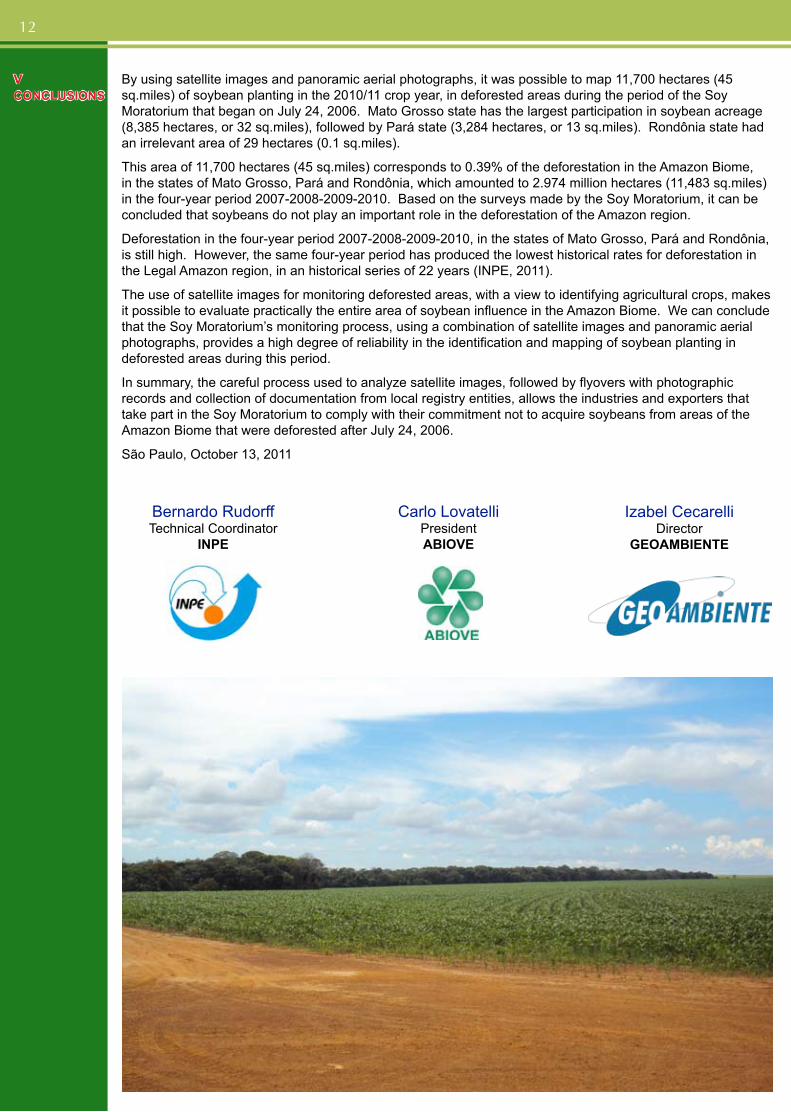
By using satellite images and panoramic aerial photographs, it was possible to map 11,700 hectares (45 sq.miles) of soybean planting in the 2010/11 crop year, in deforested areas during the period of the Soy Moratorium that began on July 24, 2006. Mato Grosso state has the largest participation in soybean acreage (8,385 hectares, or 32 sq.miles), followed by Pará state (3,284 hectares, or 13 sq.miles). Rondônia state had an irrelevant area of 29 hectares (0.1 sq.miles).
This area of 11,700 hectares (45 sq.miles) corresponds to 0.39% of the deforestation in the Amazon Biome, in the states of Mato Grosso, Pará and Rondônia, which amounted to 2.974 million hectares (11,483 sq.miles) in the four-year period 2007-2008-2009-2010. Based on the surveys made by the Soy Moratorium, it can be concluded that soybeans do not play an important role in the deforestation of the Amazon region.
Deforestation in the four-year period 2007-2008-2009-2010, in the states of Mato Grosso, Pará and Rondônia, is still high. However, the same four-year period has produced the lowest historical rates for deforestation in the Legal Amazon region, in an historical series of 22 years (INPE, 2011).
The use of satellite images for monitoring deforested areas, with a view to identifying agricultural crops, makes it possible to evaluate practically the entire area of soybean influence in the Amazon Biome. We can conclude that the Soy Moratorium’s monitoring process, using a combination of satellite images and panoramic aerial photographs, provides a high degree of reliability in the identification and mapping of soybean planting in deforested areas during this period.
In summary, the careful process used to analyze satellite images, followed by flyovers with photographic records and collection of documentation from local registry entities, allows the industries and exporters that take part in the Soy Moratorium to comply with their commitment not to acquire soybeans from areas of the Amazon Biome that were deforested after July 24, 2006.
São Paulo, October 13, 2011
Bernardo Rudorff Technical Coordinator
INPE
Carlo Lovatelli PresidentABIOVE
Izabel Cecarelli Director
GEOAMBIENTE
13
VI BIBLIOGRAPHY
- CONAB - Companhia Nacional de Abastecimento (National Supply Company). Acompanhamento de safra brasileira de grãos – 11º levantamento. Brasilia, 2011. page 41.
- Huete, A., C. Justice e W. Van Leeuwen. MODIS Vegetation Index (MOD 13): Algorithm Theoretical Basis Document (version 3): National Aeronautics and Space Administration. 2006: 129 p. 1999.
- INPE - Instituto Nacional de Pesquisas Espaciais (National Spatial Research Institute). MONITORAMENTO DA FLORESTA AMAZÔNICA BRASILEIRA POR SATÉLITE - Estimativas Anuais de desflorestamento desde 1988 até 2009. Available at http://www.obt.inpe.br/prodes/prodes_1988_2009.htm. Accessed on June 10, 2010. 2010.
- Justice, C. e J. Townshend. Special issue on the moderate resolution imaging spectroradiometer (MODIS): a new generation of land surface monitoring. Remote Sensing of Environment, v.83, n.1-2, p.1-2. 2002.
- Justice, C. O., E. Vermote, J. R. G. Townshend, R. Defries, D. P. Roy, D. K. Hall, V. V. Salomonson, J. L. Privette, G. Riggs, A. Strahler, W. Lucht, R. B. Myneni, Y. Knyazikhin, S. W. Running, R. R. Nemani, W. Zhengming, A. R. Huete, W. Van Leeuwen, R. E. Wolfe, L. Giglio, J. Muller, P. Lewis and M. J. Barnsley. The Moderate Resolution Imaging Spectroradiometer (MODIS): land remote sensing for global change research. Geoscience and Remote Sensing, IEEE Transactions on, v.36, n.4, p.1228-1249. 1998.
- Morton, D. C., R. S. Defries, Y. E. Shimabukuro, L. O. Anderson, E. Arai, F. D. Espirito-Santo, R. Freitas and J. Morisette. Cropland expansion changes deforestation dynamics in the southern Brazilian Amazon. Proceedings of the National Academy of Sciences of the United States of America, v.103, n.39, p.14637-14641. 2006.
- Rudorff, B.F.T.; Shimabukuro, Y.E.; Ceballos, J.C. (Coord.). Sensor MODIS e suas Aplicações Ambientais no Brasil. 1.ed. São José dos Campos: Editora Parêntese, 2007. 425 p.
- Rudorff, B.F.T., Adami, M., Aguiar, D.A., Moreira, M.A., Mello, M.P., Fabiani, L., Amaral, D.F., Pires, B.M. The Soy Moratorium in the Amazon Biome Monitored by Remote Sensing Images. Remote Sensing, v.3, p.185-202, 2011.
- Shimabukuro, Y. E., G. T. Batista, E. M. K. Mello, J. C. Moreira and V. Duarte. Using shade fraction image segmentation to evaluate deforestation in Landsat Thematic Mapper images of the Amazon Region. International Journal of Remote Sensing, v.19, n.3, p.535 - 541. 1998.
- Sorrensen, C. Contributions of fire use study to land use/cover change frameworks: Understanding landscape change in agricultural frontiers. Human Ecology, v.32, n.4, p.395-420. 2004.
VII TECHNICAL TEAM
7.1. INPE - Coordinator: Bernardo Rudorff - Analysts: Marcos Adami, Joel Risso and Flávia Mendes de Souza
7.2. GEOAMBIENTE
- General Coordinator: Izabel Cecarelli- Technical Coordinator: Leandro Fabiani - Staff: Elder Silva Marquez, Flavio Fortes Camargo, Jonathas Schultz and Marcos de Almeida Castro
7.3. ABIOVE - General Coordinator: Fábio Trigueirinho- Technical Coordinator: Bernardo Pires- Staff: Daniel Furlan Amaral and Rodrigo Feix
2955
2956
2982
62.44
345.55
39.93
Id area of polygon(hectares)
pa
pa
pa
state
paragomInas
paragomInas
paragomInas
municipality
soyBeans
soyBeans/corn
clearIng
land Use & occupation
14
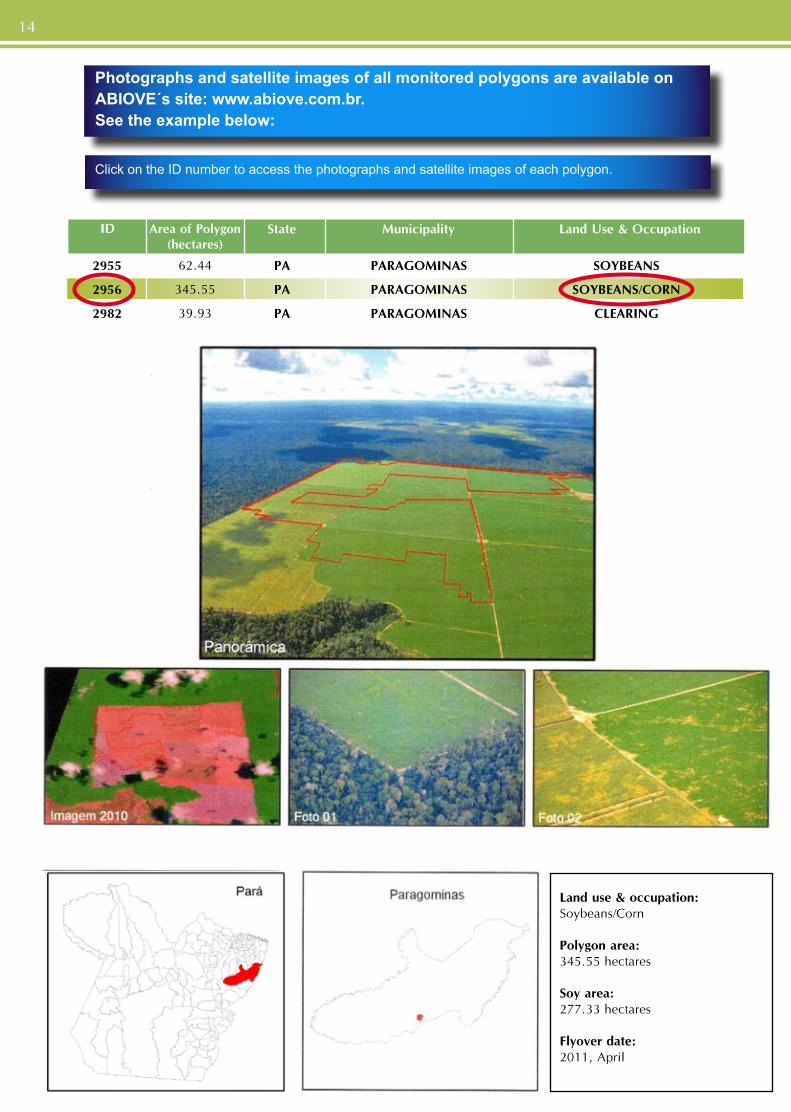
Photographs and satellite images of all monitored polygons are available on ABIOVE´s site: www.abiove.com.br. See the example below:
Click on the ID number to access the photographs and satellite images of each polygon.
land use & occupation: Soybeans/Corn
polygon area: 345.55 hectares
soy area: 277.33 hectares
Flyover date: 2011, April
15
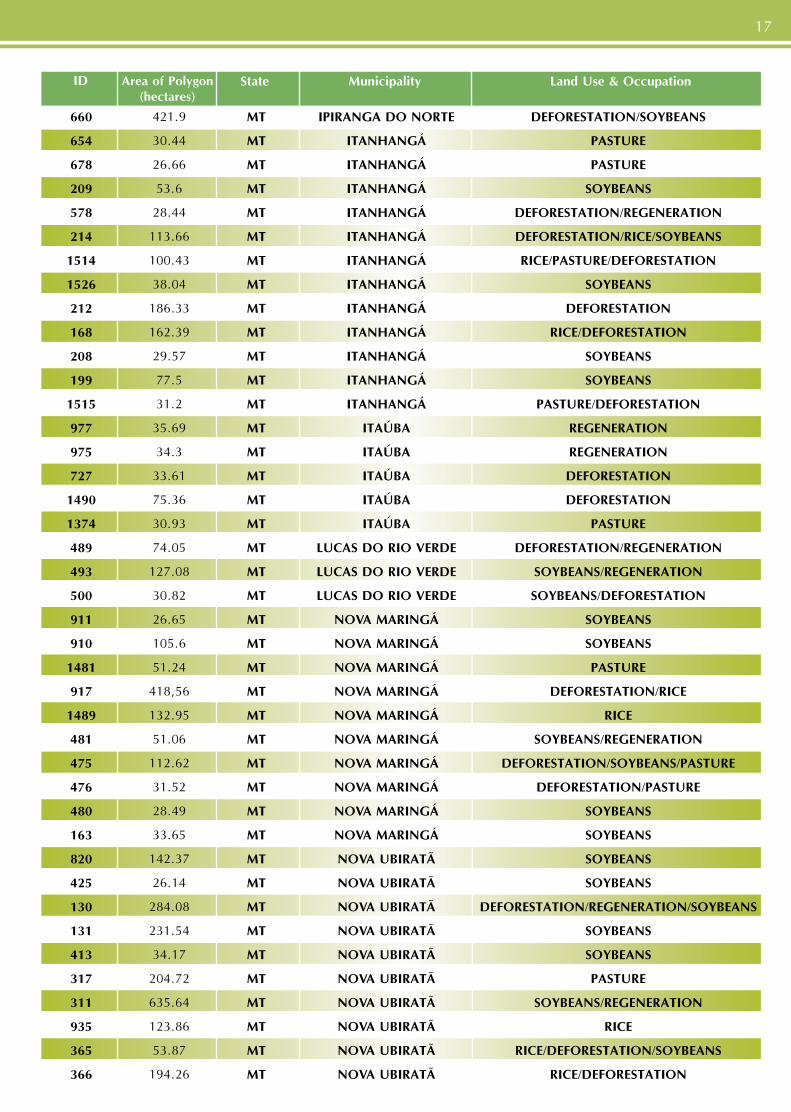
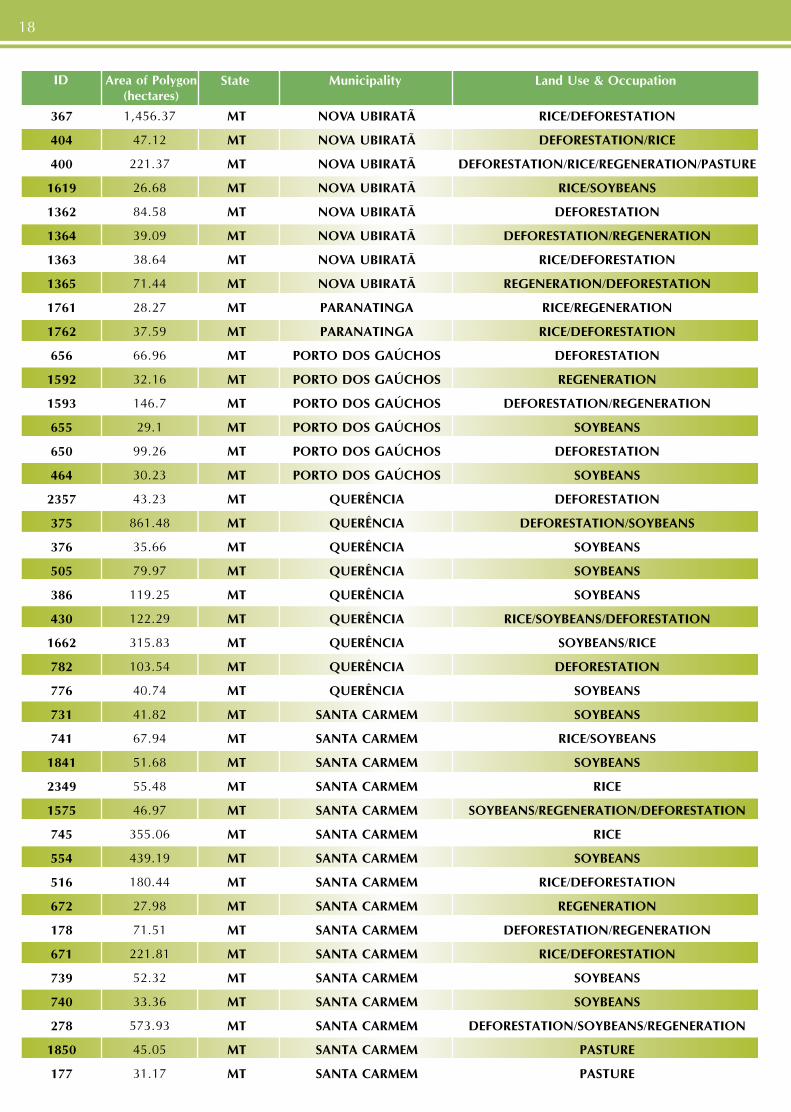
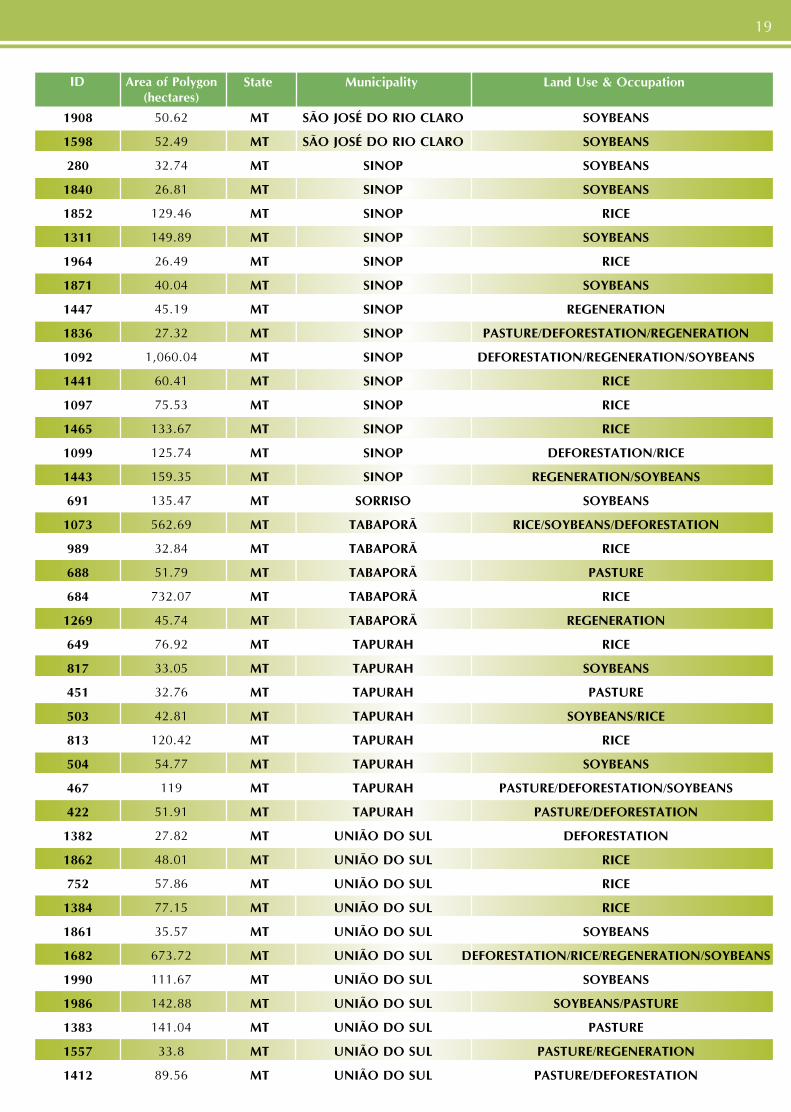
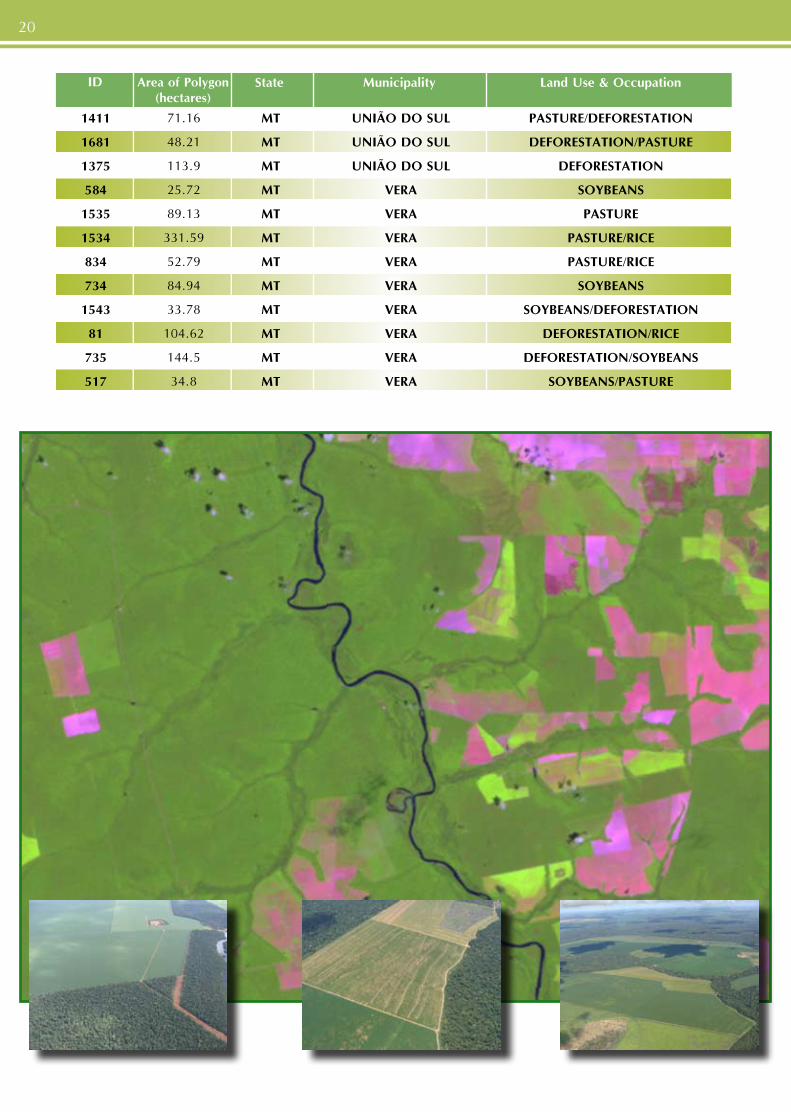
8.1. Polygons with flyovers in the state of Mato Grosso (MT), in hectares
VIII – APPENDIX
221
268
1979
1646
1978
2345
1977
1981
1654
1530
1643
1622
1640
341
444
1870
1872
2011
8815
1544
47
673
1609
33
29
96
117
46
73
83
108
105
124
1545
1301
724
1555
751
43.9
154.87
220.28
229.86
36.34
38.61
37.58
25
35.27
178.38
65.66
85.62
27.02
37.21
84.47
810.24
47.36
32.93
49.4
189.68
204.89
53.83
35.83
428.19
714.76
175.02
348.83
25.82
228.76
29.97
41.54
228.41
236.81
553.75
56.67
26.61
37.15
763.84
Id area of polygon(hectares)
mT
mT
mT
mT
mT
mT
mT
mT
mT
mT
mT
mT
mT
mT
mT
mT
mT
mT
mT
mT
mT
mT
mT
mT
mT
mT
mT
mT
mT
mT
mT
mT
mT
mT
mT
mT
mT
mT
state
canarana
canarana
cláUdIa
cláUdIa
cláUdIa
cláUdIa
cláUdIa
cláUdIa
cláUdIa
cláUdIa
cláUdIa
cláUdIa
cláUdIa
comodoro
comodoro
comodoro
comodoro
comodoro
comodoro
FelIz naTal
FelIz naTal
FelIz naTal
FelIz naTal
FelIz naTal
FelIz naTal
FelIz naTal
FelIz naTal
FelIz naTal
FelIz naTal
FelIz naTal
FelIz naTal
FelIz naTal
FelIz naTal
FelIz naTal
FelIz naTal
FelIz naTal
FelIz naTal
FelIz naTal
municipality
rIce
rIce
deForesTaTIon/pasTUre
rIce/soyBeans/regeneraTIon
soyBeans
deForesTaTIon/pasTUre
pasTUre
rIce
rIce
deForesTaTIon/regeneraTIon/soyBeans
pasTUre
soyBeans/regeneraTIon
regeneraTIon/deForesTaTIon
soyBeans
soyBeans/rIce
pasTUre
pasTUre
pasTUre
soyBeans/regeneraTIon
deForesTaTIon/regeneraTIon
deForesTaTIon/regeneraTIon
regeneraTIon
deForesTaTIon
deForesTaTIon/rIce
deForesTaTIon/soyBeans
regeneraTIon/deForesTaTIon
deForesTaTIon/soyBeans
pasTUre
deForesTaTIon/pasTUre/rIce/soyBeans
soyBeans
soyBeans/deForesTaTIon
deForesTaTIon/rIce
deForesTaTIon
deForesTaTIon/rIce
soyBeans/deForesTaTIon
deForesTaTIon/regeneraTIon
regeneraTIon/soyBeans
deForesTaTIon/regeneraTIon
land Use & occupation
16
Id area of polygon(hectares)
state municipality land Use & occupation
1554
1628
1550
1629
1626
292
747
1303
534
535
1308
179
529
743
750
1894
764
1587
1429
1579
1750
1580
1825
1822
1136
1819
1140
1144
266
222
162
230
1126
1125
651
685
681
2340
1958
2347
653
105.44
117.25
26.07
159.03
192.63
42.91
197.14
539.29
165.38
30.37
968.61
29.31
297.99
412.74
58.57
543.4
57.82
58.51
73.35
481.96
29.96
87.54
28.06
88.99
33.34
74.06
82.77
441.32
255.48
70.02
27.91
93.35
127.09
32.5
83.49
80.9
269.04
456.53
1,305.91
301.09
28.98
mT
mT
mT
mT
mT
mT
mT
mT
mT
mT
mT
mT
mT
mT
mT
mT
mT
mT
mT
mT
mT
mT
mT
mT
mT
mT
mT
mT
mT
mT
mT
mT
mT
mT
mT
mT
mT
mT
mT
mT
mT
FelIz naTal
FelIz naTal
FelIz naTal
FelIz naTal
FelIz naTal
FelIz naTal
FelIz naTal
FelIz naTal
FelIz naTal
FelIz naTal
FelIz naTal
FelIz naTal
FelIz naTal
FelIz naTal
FelIz naTal
FelIz naTal
FelIz naTal
gaúcha do norTe
gaúcha do norTe
gaúcha do norTe
gaúcha do norTe
gaúcha do norTe
gaúcha do norTe
gaúcha do norTe
gaúcha do norTe
gaúcha do norTe
gaúcha do norTe
gaúcha do norTe
gaúcha do norTe
gaúcha do norTe
gaúcha do norTe
gaúcha do norTe
gaúcha do norTe
gaúcha do norTe
IpIranga do norTe
IpIranga do norTe
IpIranga do norTe
IpIranga do norTe
IpIranga do norTe
IpIranga do norTe
IpIranga do norTe
soyBeans
soyBeans/regeneraTIon
regeneraTIon/soyBeans
rIce
rIce/deForesTaTIon
soyBeans/pasTUre
soyBeans/regeneraTIon
deForesTaTIon/soyBeans
soyBeans
soyBeans
deForesTaTIon/regeneraTIon
soyBeans
rIce/soyBeans
soyBeans
soyBeans
deForesTaTIon/regeneraTIon
regeneraTIon
rIce
soyBeans
soyBeans/rIce
soyBeans
soyBeans
soyBeans
deForesTaTIon
regeneraTIon
soyBeans
soyBeans
deForesTaTIon/rIce/soyBeans
soyBeans/rIce
soyBeans/deForesTaTIon/regeneraTIon
soyBeans
soyBeans/regeneraTIon
regeneraTIon/soyBeans
regeneraTIon/soyBeans
deForesTaTIon/regeneraTIon
soyBeans
soyBeans/deForesTaTIon
deForesTaTIon
deForesTaTIon
deForesTaTIon
deForesTaTIon/soyBeans
17
Id area of polygon(hectares)
state municipality land Use & occupation
660
654
678
209
578
214
1514
1526
212
168
208
199
1515
977
975
727
1490
1374
489
493
500
911
910
1481
917
1489
481
475
476
480
163
820
425
130
131
413
317
311
935
365
366
421.9
30.44
26.66
53.6
28.44
113.66
100.43
38.04
186.33
162.39
29.57
77.5
31.2
35.69
34.3
33.61
75.36
30.93
74.05
127.08
30.82
26.65
105.6
51.24
418,56
132.95
51.06
112.62
31.52
28.49
33.65
142.37
26.14
284.08
231.54
34.17
204.72
635.64
123.86
53.87
194.26
mT
mT
mT
mT
mT
mT
mT
mT
mT
mT
mT
mT
mT
mT
mT
mT
mT
mT
mT
mT
mT
mT
mT
mT
mT
mT
mT
mT
mT
mT
mT
mT
mT
mT
mT
mT
mT
mT
mT
mT
mT
IpIranga do norTe
ITanhangá
ITanhangá
ITanhangá
ITanhangá
ITanhangá
ITanhangá
ITanhangá
ITanhangá
ITanhangá
ITanhangá
ITanhangá
ITanhangá
ITaúBa
ITaúBa
ITaúBa
ITaúBa
ITaúBa
lUcas do rIo Verde
lUcas do rIo Verde
lUcas do rIo Verde
noVa marIngá
noVa marIngá
noVa marIngá
noVa marIngá
noVa marIngá
noVa marIngá
noVa marIngá
noVa marIngá
noVa marIngá
noVa marIngá
noVa UBIraTã
noVa UBIraTã
noVa UBIraTã
noVa UBIraTã
noVa UBIraTã
noVa UBIraTã
noVa UBIraTã
noVa UBIraTã
noVa UBIraTã
noVa UBIraTã
deForesTaTIon/soyBeans
pasTUre
pasTUre
soyBeans
deForesTaTIon/regeneraTIon
deForesTaTIon/rIce/soyBeans
rIce/pasTUre/deForesTaTIon
soyBeans
deForesTaTIon
rIce/deForesTaTIon
soyBeans
soyBeans
pasTUre/deForesTaTIon
regeneraTIon
regeneraTIon
deForesTaTIon
deForesTaTIon
pasTUre
deForesTaTIon/regeneraTIon
soyBeans/regeneraTIon
soyBeans/deForesTaTIon
soyBeans
soyBeans
pasTUre
deForesTaTIon/rIce
rIce
soyBeans/regeneraTIon
deForesTaTIon/soyBeans/pasTUre
deForesTaTIon/pasTUre
soyBeans
soyBeans
soyBeans
soyBeans
deForesTaTIon/regeneraTIon/soyBeans
soyBeans
soyBeans
pasTUre
soyBeans/regeneraTIon
rIce
rIce/deForesTaTIon/soyBeans
rIce/deForesTaTIon
18
Id area of polygon(hectares)
state municipality land Use & occupation
367
404
400
1619
1362
1364
1363
1365
1761
1762
656
1592
1593
655
650
464
2357
375
376
505
386
430
1662
782
776
731
741
1841
2349
1575
745
554
516
672
178
671
739
740
278
1850
177
1,456.37
47.12
221.37
26.68
84.58
39.09
38.64
71.44
28.27
37.59
66.96
32.16
146.7
29.1
99.26
30.23
43.23
861.48
35.66
79.97
119.25
122.29
315.83
103.54
40.74
41.82
67.94
51.68
55.48
46.97
355.06
439.19
180.44
27.98
71.51
221.81
52.32
33.36
573.93
45.05
31.17
mT
mT
mT
mT
mT
mT
mT
mT
mT
mT
mT
mT
mT
mT
mT
mT
mT
mT
mT
mT
mT
mT
mT
mT
mT
mT
mT
mT
mT
mT
mT
mT
mT
mT
mT
mT
mT
mT
mT
mT
mT
noVa UBIraTã
noVa UBIraTã
noVa UBIraTã
noVa UBIraTã
noVa UBIraTã
noVa UBIraTã
noVa UBIraTã
noVa UBIraTã
paranaTInga
paranaTInga
porTo dos gaúchos
porTo dos gaúchos
porTo dos gaúchos
porTo dos gaúchos
porTo dos gaúchos
porTo dos gaúchos
QUerêncIa
QUerêncIa
QUerêncIa
QUerêncIa
QUerêncIa
QUerêncIa
QUerêncIa
QUerêncIa
QUerêncIa
sanTa carmem
sanTa carmem
sanTa carmem
sanTa carmem
sanTa carmem
sanTa carmem
sanTa carmem
sanTa carmem
sanTa carmem
sanTa carmem
sanTa carmem
sanTa carmem
sanTa carmem
sanTa carmem
sanTa carmem
sanTa carmem
rIce/deForesTaTIon
deForesTaTIon/rIce
deForesTaTIon/rIce/regeneraTIon/pasTUre
rIce/soyBeans
deForesTaTIon
deForesTaTIon/regeneraTIon
rIce/deForesTaTIon
regeneraTIon/deForesTaTIon
rIce/regeneraTIon
rIce/deForesTaTIon
deForesTaTIon
regeneraTIon
deForesTaTIon/regeneraTIon
soyBeans
deForesTaTIon
soyBeans
deForesTaTIon
deForesTaTIon/soyBeans
soyBeans
soyBeans
soyBeans
rIce/soyBeans/deForesTaTIon
soyBeans/rIce
deForesTaTIon
soyBeans
soyBeans
rIce/soyBeans
soyBeans
rIce
soyBeans/regeneraTIon/deForesTaTIon
rIce
soyBeans
rIce/deForesTaTIon
regeneraTIon
deForesTaTIon/regeneraTIon
rIce/deForesTaTIon
soyBeans
soyBeans
deForesTaTIon/soyBeans/regeneraTIon
pasTUre
pasTUre
19
Id area of polygon(hectares)
state municipality land Use & occupation
1908
1598
280
1840
1852
1311
1964
1871
1447
1836
1092
1441
1097
1465
1099
1443
691
1073
989
688
684
1269
649
817
451
503
813
504
467
422
1382
1862
752
1384
1861
1682
1990
1986
1383
1557
1412
50.62
52.49
32.74
26.81
129.46
149.89
26.49
40.04
45.19
27.32
1,060.04
60.41
75.53
133.67
125.74
159.35
135.47
562.69
32.84
51.79
732.07
45.74
76.92
33.05
32.76
42.81
120.42
54.77
119
51.91
27.82
48.01
57.86
77.15
35.57
673.72
111.67
142.88
141.04
33.8
89.56
mT
mT
mT
mT
mT
mT
mT
mT
mT
mT
mT
mT
mT
mT
mT
mT
mT
mT
mT
mT
mT
mT
mT
mT
mT
mT
mT
mT
mT
mT
mT
mT
mT
mT
mT
mT
mT
mT
mT
mT
mT
são josé do rIo claro
são josé do rIo claro
sInop
sInop
sInop
sInop
sInop
sInop
sInop
sInop
sInop
sInop
sInop
sInop
sInop
sInop
sorrIso
TaBaporã
TaBaporã
TaBaporã
TaBaporã
TaBaporã
TapUrah
TapUrah
TapUrah
TapUrah
TapUrah
TapUrah
TapUrah
TapUrah
UnIão do sUl
UnIão do sUl
UnIão do sUl
UnIão do sUl
UnIão do sUl
UnIão do sUl
UnIão do sUl
UnIão do sUl
UnIão do sUl
UnIão do sUl
UnIão do sUl
soyBeans
soyBeans
soyBeans
soyBeans
rIce
soyBeans
rIce
soyBeans
regeneraTIon
pasTUre/deForesTaTIon/regeneraTIon
deForesTaTIon/regeneraTIon/soyBeans
rIce
rIce
rIce
deForesTaTIon/rIce
regeneraTIon/soyBeans
soyBeans
rIce/soyBeans/deForesTaTIon
rIce
pasTUre
rIce
regeneraTIon
rIce
soyBeans
pasTUre
soyBeans/rIce
rIce
soyBeans
pasTUre/deForesTaTIon/soyBeans
pasTUre/deForesTaTIon
deForesTaTIon
rIce
rIce
rIce
soyBeans
deForesTaTIon/rIce/regeneraTIon/soyBeans
soyBeans
soyBeans/pasTUre
pasTUre
pasTUre/regeneraTIon
pasTUre/deForesTaTIon
20
Id area of polygon(hectares)
state municipality land Use & occupation
1411
1681
1375
584
1535
1534
834
734
1543
81
735
517
71.16
48.21
113.9
25.72
89.13
331.59
52.79
84.94
33.78
104.62
144.5
34.8
mT
mT
mT
mT
mT
mT
mT
mT
mT
mT
mT
mT
UnIão do sUl
UnIão do sUl
UnIão do sUl
Vera
Vera
Vera
Vera
Vera
Vera
Vera
Vera
Vera
pasTUre/deForesTaTIon
deForesTaTIon/pasTUre
deForesTaTIon
soyBeans
pasTUre
pasTUre/rIce
pasTUre/rIce
soyBeans
soyBeans/deForesTaTIon
deForesTaTIon/rIce
deForesTaTIon/soyBeans
soyBeans/pasTUre
21
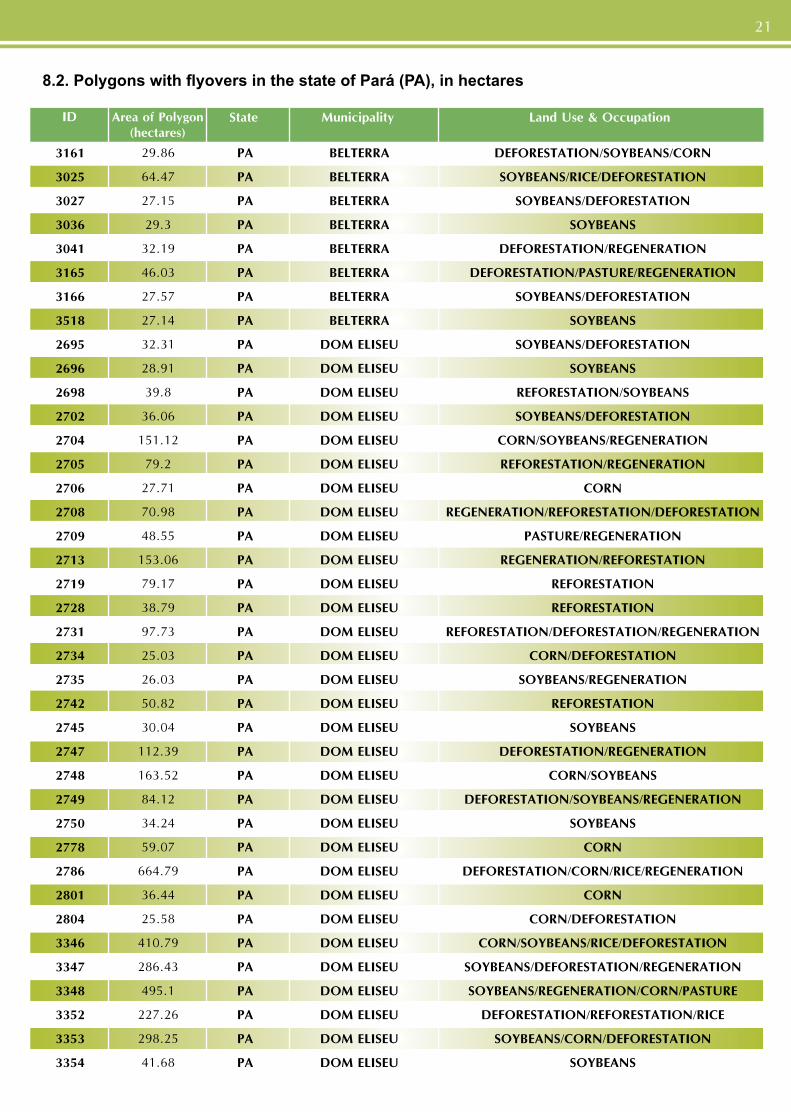
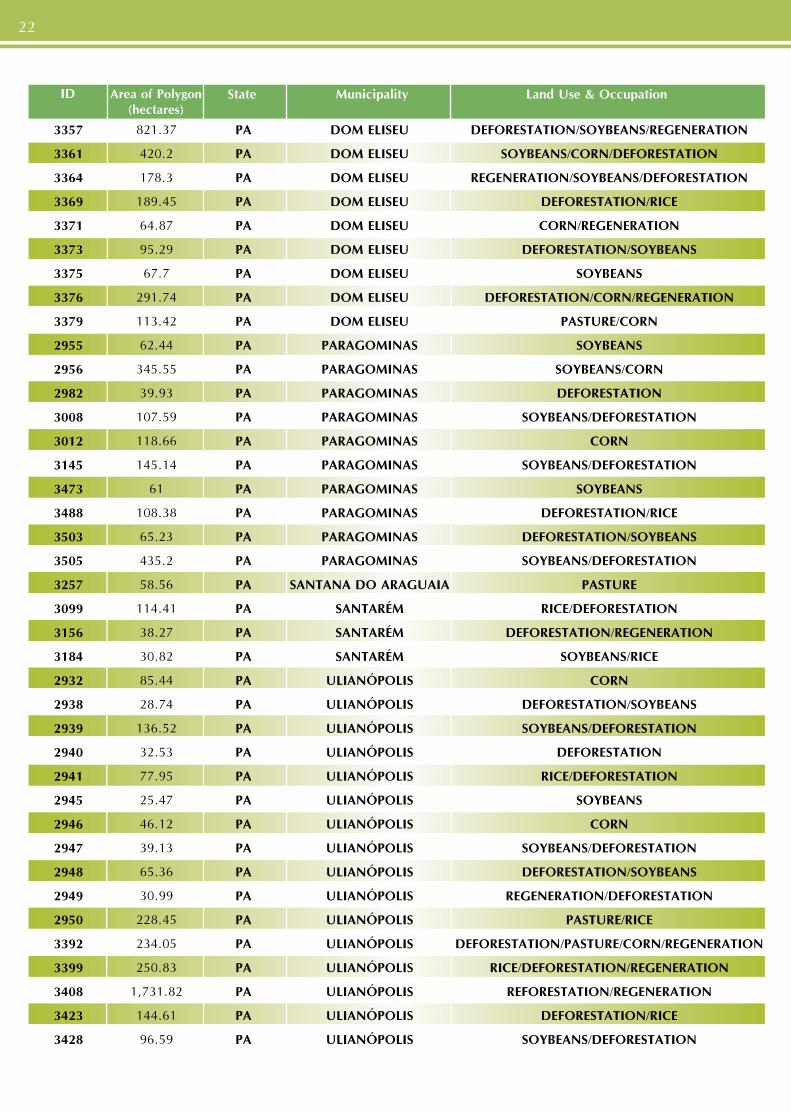
8.2. Polygons with flyovers in the state of Pará (PA), in hectares
Id area of polygon(hectares)
state municipality land Use & occupation
3161
3025
3027
3036
3041
3165
3166
3518
2695
2696
2698
2702
2704
2705
2706
2708
2709
2713
2719
2728
2731
2734
2735
2742
2745
2747
2748
2749
2750
2778
2786
2801
2804
3346
3347
3348
3352
3353
3354
29.86
64.47
27.15
29.3
32.19
46.03
27.57
27.14
32.31
28.91
39.8
36.06
151.12
79.2
27.71
70.98
48.55
153.06
79.17
38.79
97.73
25.03
26.03
50.82
30.04
112.39
163.52
84.12
34.24
59.07
664.79
36.44
25.58
410.79
286.43
495.1
227.26
298.25
41.68
pa
pa
pa
pa
pa
pa
pa
pa
pa
pa
pa
pa
pa
pa
pa
pa
pa
pa
pa
pa
pa
pa
pa
pa
pa
pa
pa
pa
pa
pa
pa
pa
pa
pa
pa
pa
pa
pa
pa
BelTerra
BelTerra
BelTerra
BelTerra
BelTerra
BelTerra
BelTerra
BelTerra
dom elIseU
dom elIseU
dom elIseU
dom elIseU
dom elIseU
dom elIseU
dom elIseU
dom elIseU
dom elIseU
dom elIseU
dom elIseU
dom elIseU
dom elIseU
dom elIseU
dom elIseU
dom elIseU
dom elIseU
dom elIseU
dom elIseU
dom elIseU
dom elIseU
dom elIseU
dom elIseU
dom elIseU
dom elIseU
dom elIseU
dom elIseU
dom elIseU
dom elIseU
dom elIseU
dom elIseU
deForesTaTIon/soyBeans/corn
soyBeans/rIce/deForesTaTIon
soyBeans/deForesTaTIon
soyBeans
deForesTaTIon/regeneraTIon
deForesTaTIon/pasTUre/regeneraTIon
soyBeans/deForesTaTIon
soyBeans
soyBeans/deForesTaTIon
soyBeans
reForesTaTIon/soyBeans
soyBeans/deForesTaTIon
corn/soyBeans/regeneraTIon
reForesTaTIon/regeneraTIon
corn
regeneraTIon/reForesTaTIon/deForesTaTIon
pasTUre/regeneraTIon
regeneraTIon/reForesTaTIon
reForesTaTIon
reForesTaTIon
reForesTaTIon/deForesTaTIon/regeneraTIon
corn/deForesTaTIon
soyBeans/regeneraTIon
reForesTaTIon
soyBeans
deForesTaTIon/regeneraTIon
corn/soyBeans
deForesTaTIon/soyBeans/regeneraTIon
soyBeans
corn
deForesTaTIon/corn/rIce/regeneraTIon
corn
corn/deForesTaTIon
corn/soyBeans/rIce/deForesTaTIon
soyBeans/deForesTaTIon/regeneraTIon
soyBeans/regeneraTIon/corn/pasTUre
deForesTaTIon/reForesTaTIon/rIce
soyBeans/corn/deForesTaTIon
soyBeans
Id area of polygon(hectares)
state municipality land Use & occupation
3357
3361
3364
3369
3371
3373
3375
3376
3379
2955
2956
2982
3008
3012
3145
3473
3488
3503
3505
3257
3099
3156
3184
2932
2938
2939
2940
2941
2945
2946
2947
2948
2949
2950
3392
3399
3408
3423
3428
821.37
420.2
178.3
189.45
64.87
95.29
67.7
291.74
113.42
62.44
345.55
39.93
107.59
118.66
145.14
61
108.38
65.23
435.2
58.56
114.41
38.27
30.82
85.44
28.74
136.52
32.53
77.95
25.47
46.12
39.13
65.36
30.99
228.45
234.05
250.83
1,731.82
144.61
96.59
pa
pa
pa
pa
pa
pa
pa
pa
pa
pa
pa
pa
pa
pa
pa
pa
pa
pa
pa
pa
pa
pa
pa
pa
pa
pa
pa
pa
pa
pa
pa
pa
pa
pa
pa
pa
pa
pa
pa
dom elIseU
dom elIseU
dom elIseU
dom elIseU
dom elIseU
dom elIseU
dom elIseU
dom elIseU
dom elIseU
paragomInas
paragomInas
paragomInas
paragomInas
paragomInas
paragomInas
paragomInas
paragomInas
paragomInas
paragomInas
sanTana do aragUaIa
sanTarém
sanTarém
sanTarém
UlIanópolIs
UlIanópolIs
UlIanópolIs
UlIanópolIs
UlIanópolIs
UlIanópolIs
UlIanópolIs
UlIanópolIs
UlIanópolIs
UlIanópolIs
UlIanópolIs
UlIanópolIs
UlIanópolIs
UlIanópolIs
UlIanópolIs
UlIanópolIs
deForesTaTIon/soyBeans/regeneraTIon
soyBeans/corn/deForesTaTIon
regeneraTIon/soyBeans/deForesTaTIon
deForesTaTIon/rIce
corn/regeneraTIon
deForesTaTIon/soyBeans
soyBeans
deForesTaTIon/corn/regeneraTIon
pasTUre/corn
soyBeans
soyBeans/corn
deForesTaTIon
soyBeans/deForesTaTIon
corn
soyBeans/deForesTaTIon
soyBeans
deForesTaTIon/rIce
deForesTaTIon/soyBeans
soyBeans/deForesTaTIon
pasTUre
rIce/deForesTaTIon
deForesTaTIon/regeneraTIon
soyBeans/rIce
corn
deForesTaTIon/soyBeans
soyBeans/deForesTaTIon
deForesTaTIon
rIce/deForesTaTIon
soyBeans
corn
soyBeans/deForesTaTIon
deForesTaTIon/soyBeans
regeneraTIon/deForesTaTIon
pasTUre/rIce
deForesTaTIon/pasTUre/corn/regeneraTIon
rIce/deForesTaTIon/regeneraTIon
reForesTaTIon/regeneraTIon
deForesTaTIon/rIce
soyBeans/deForesTaTIon
22 23
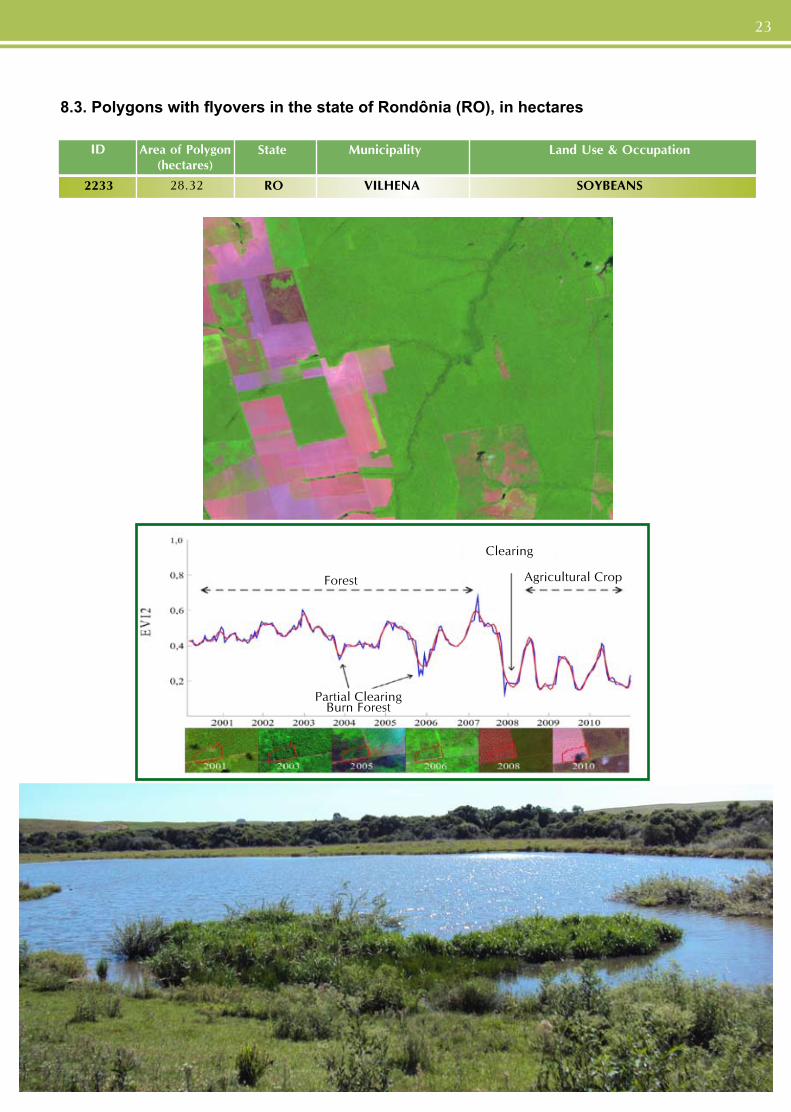
8.3. Polygons with flyovers in the state of Rondônia (RO), in hectares
Id area of polygon(hectares)
state municipality land Use & occupation
2233 28.32 ro VIlhena soyBeans
22 23
Forest
Clearing
Agricultural Crop
Partial ClearingBurn Forest
PR
OD
UC
TIO
N
SPO
NSO
RSH
IP
g
Ts –
so
y T
asK
Fo
rc
e