Embed Size (px)
Citation preview
Southwest Florida
Coastal Storm Surge Study
Storm Surge Analysis Update MeetingSarasota County, Florida
March 7, 2018
2
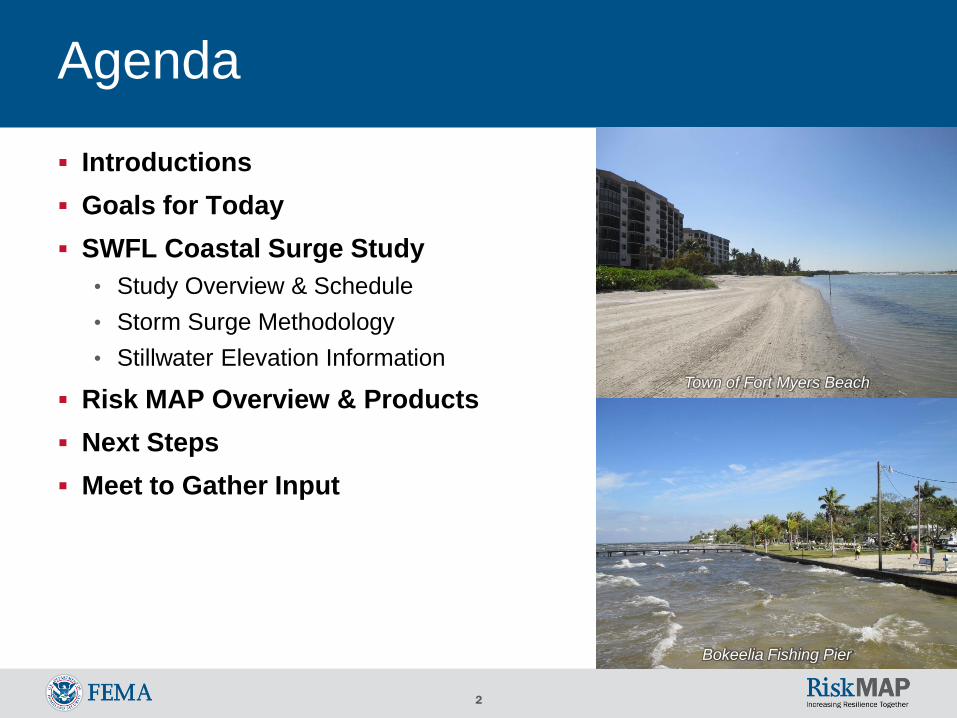
Agenda
Introductions
Goals for Today
SWFL Coastal Surge Study
• Study Overview & Schedule
• Storm Surge Methodology
• Stillwater Elevation Information
Risk MAP Overview & Products
Next Steps
Meet to Gather Input
Hickory Mound Unit Bokeelia Fishing Pier
Town of Fort Myers Beach
3
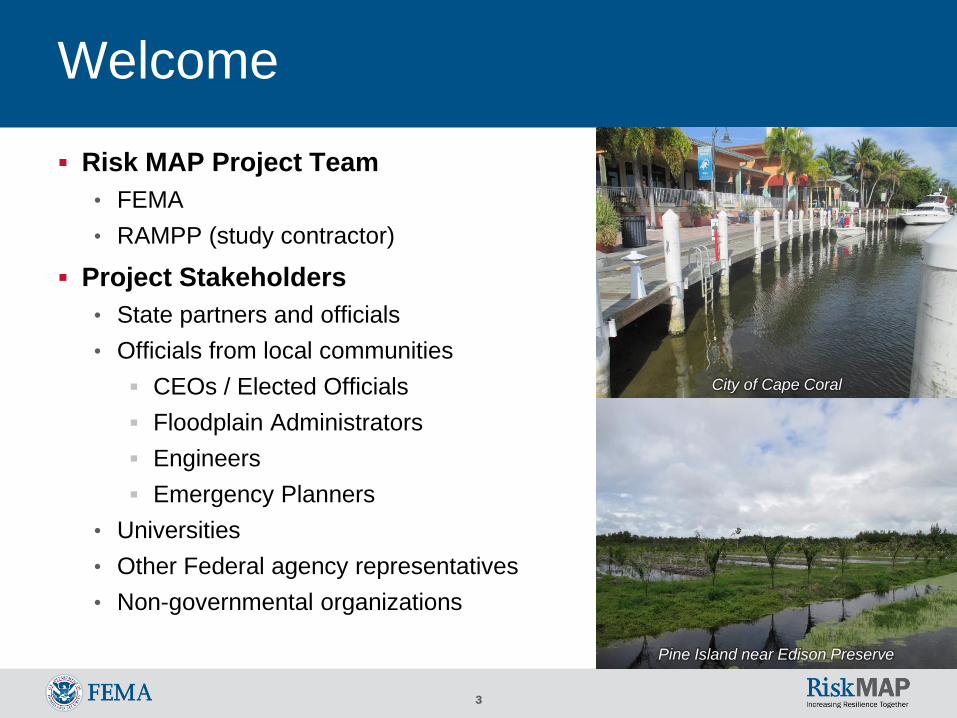
Welcome
Risk MAP Project Team
• FEMA
• RAMPP (study contractor)
Project Stakeholders
• State partners and officials
• Officials from local communities
CEOs / Elected Officials
Floodplain Administrators
Engineers
Emergency Planners
• Universities
• Other Federal agency representatives
• Non-governmental organizations
Pine Island near Edison Preserve
City of Cape Coral

4
Goals for Today
Promote engagement with the communities
Discuss the Southwest Florida Coastal Surge Study and the
status of the study
Discuss the study methodology and results
• Mesh Development
• Storm Climatology
• Validation Storms
• Stillwater Elevations
Gather technical input and feedback from you
5
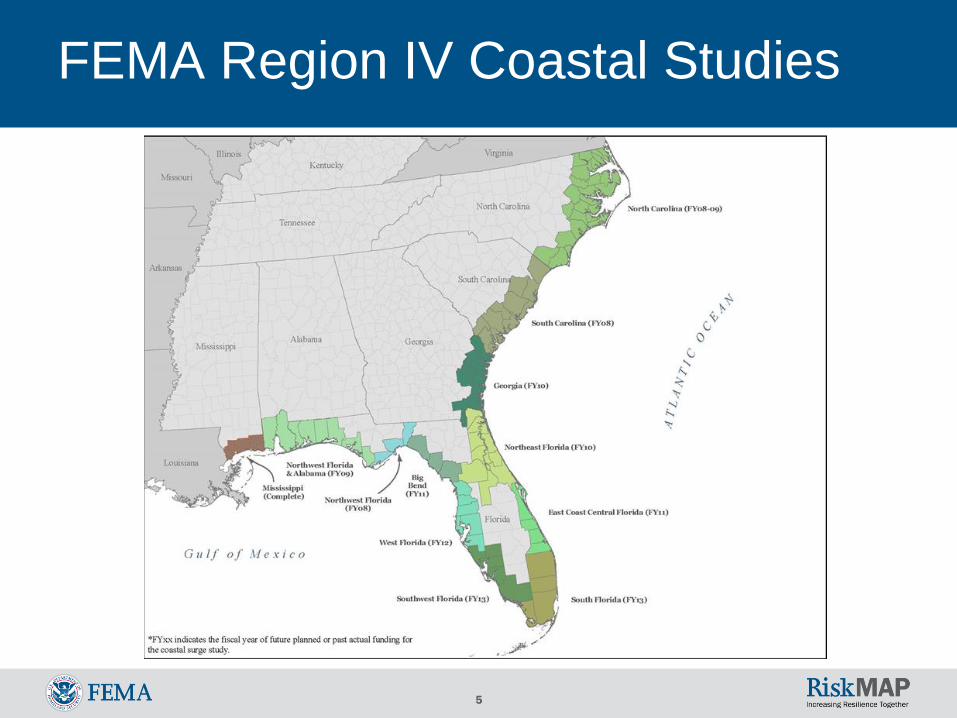
FEMA Region IV Coastal Studies
6
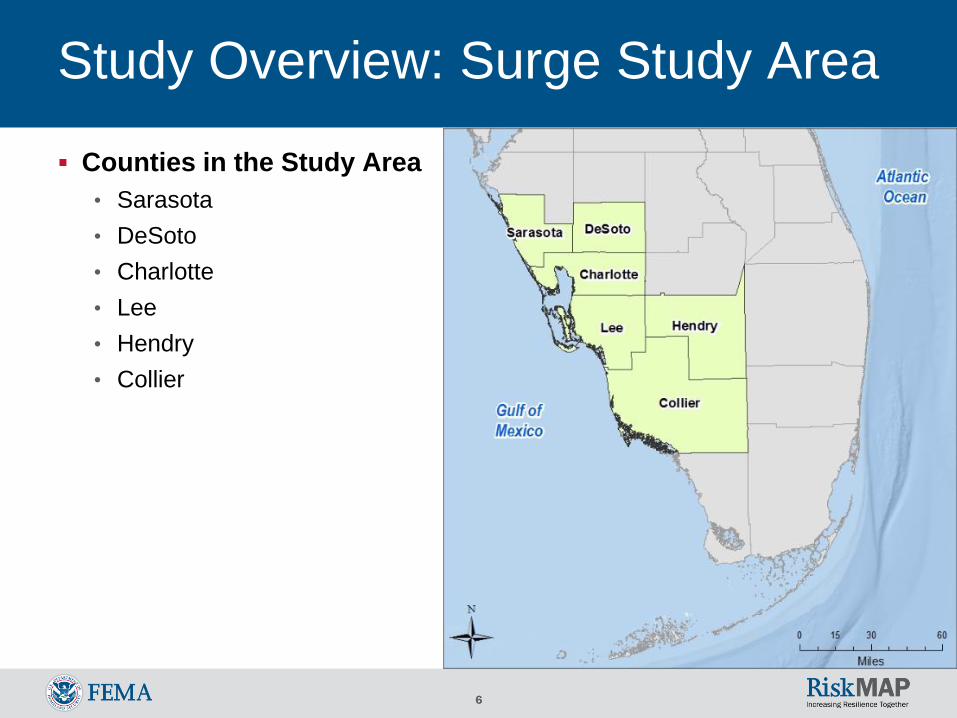
Study Overview: Surge Study Area
Counties in the Study Area
• Sarasota
• DeSoto
• Charlotte
• Lee
• Hendry
• Collier
7
Study Overview: Project Schedule
Completed
• Discovery Kickoff Meeting: February 2014
• Discovery Meeting: March 2014
• Mesh Review Meeting: September 2014
• Storm Surge Analysis Update Meeting: Today
Currently Ongoing
• Overland Wave Modeling (WHAFIS): Spring/Summer 2018
Upcoming
• Flood Risk Review Meeting: Summer 2018
• Preliminary Flood Insurance Rate Maps: 2019

8
Reason for Surge Update
Flood risk changes over time
• Effective surge analysis is based on older hurricane modeling and
topographic data
Sarasota: 1978 (FEMA’s Standard Surge Model)
Charlotte: 1976 (US Dept. of Commerce’s SPLASH model)
Lee: 1984 (FEMA’s Standard Surge Model)
Collier: 2009 (FEMA’s Standard Surge Model)
Study area was selected due to risk and ongoing studies
• Significant flood risk from coastal storms (hurricanes, tropical storms)
• Increase in population and development since Effective coastal FIRMs
were published
• Ongoing riverine watershed flood studies

9
Example of FEMA Standard Surge Model vs ADCIRC
FEMA Standard Surge Model
Cells are 1500 ft x 1500 ft
ADCIRC Mesh
Spacing 90 ft to 300 ft
10
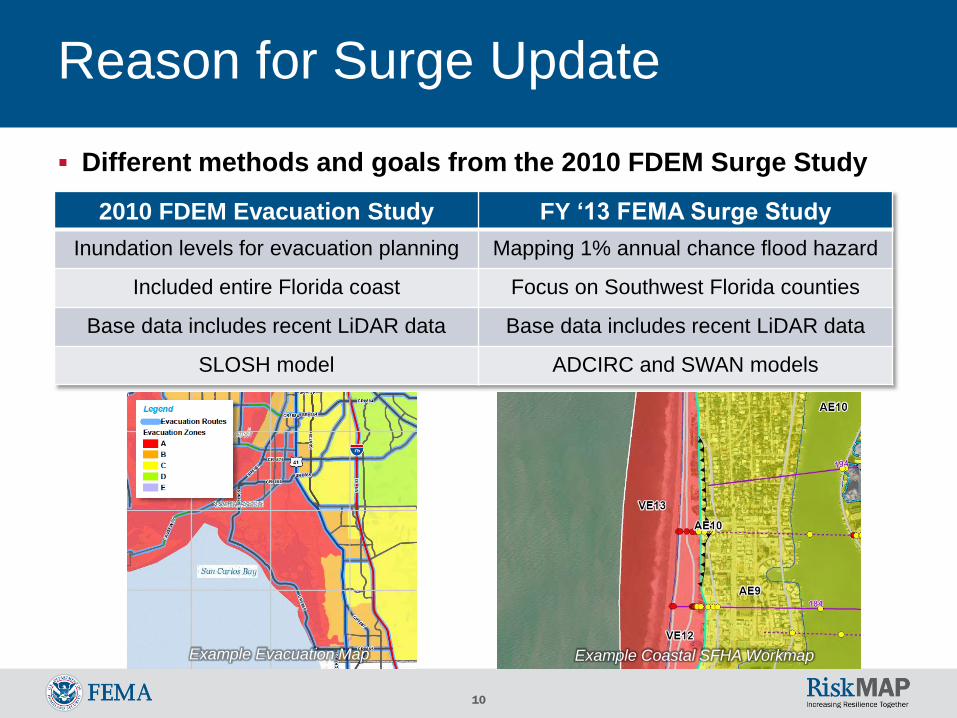
Reason for Surge Update
Different methods and goals from the 2010 FDEM Surge Study
2010 FDEM Evacuation Study FY ‘13 FEMA Surge Study
Inundation levels for evacuation planning Mapping 1% annual chance flood hazard
Included entire Florida coast Focus on Southwest Florida counties
Base data includes recent LiDAR data Base data includes recent LiDAR data
SLOSH model ADCIRC and SWAN models
Example Coastal SFHA WorkmapExample Evacuation Map
11
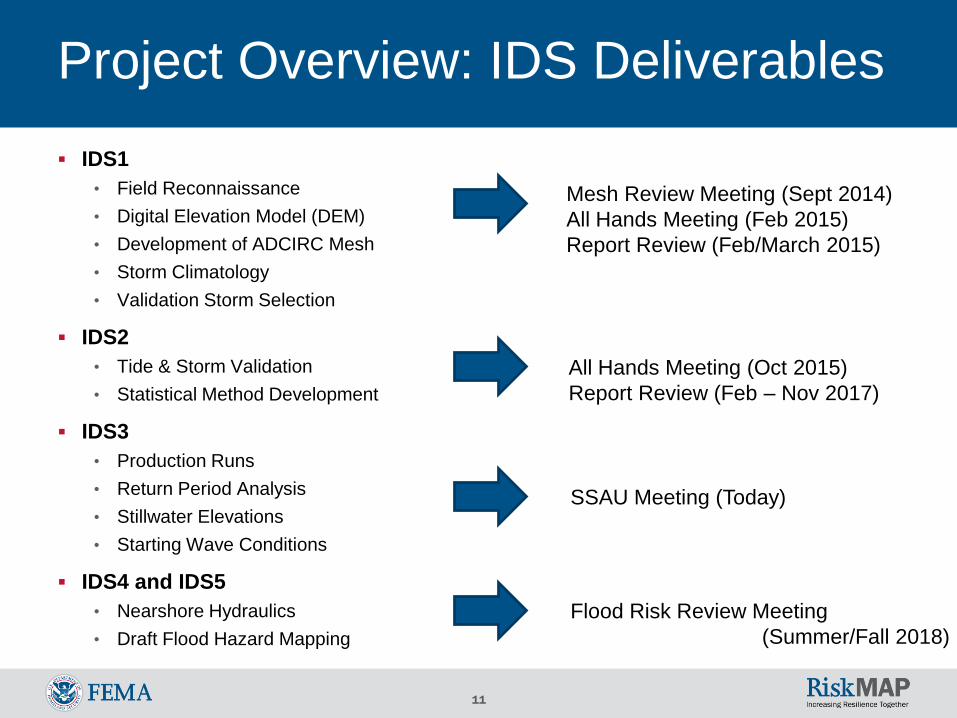
Project Overview: IDS Deliverables
IDS1
• Field Reconnaissance
• Digital Elevation Model (DEM)
• Development of ADCIRC Mesh
• Storm Climatology
• Validation Storm Selection
IDS2
• Tide & Storm Validation
• Statistical Method Development
IDS3
• Production Runs
• Return Period Analysis
• Stillwater Elevations
• Starting Wave Conditions
IDS4 and IDS5
• Nearshore Hydraulics
• Draft Flood Hazard Mapping
Mesh Review Meeting (Sept 2014)
All Hands Meeting (Feb 2015)
Report Review (Feb/March 2015)
All Hands Meeting (Oct 2015)
Report Review (Feb – Nov 2017)
SSAU Meeting (Today)
Flood Risk Review Meeting
(Summer/Fall 2018)

12
Storm Surge Approach (IDS1 – IDS3)
Return Period AnalysisJPM-OS 10%, 4%, 2%, 1%, & 0.2% annual chance
Tide Gage Analysis 50% & 20% annual chance
Still Water Elev.
High-Resolution
Bathy / Topo Mesh
Storm Surge Modeling
Winds
Waves Water Levels
Storm ForcingHurricane Tracks
JPM-OS = Joint Probability
Method- Optimum Sampling
13
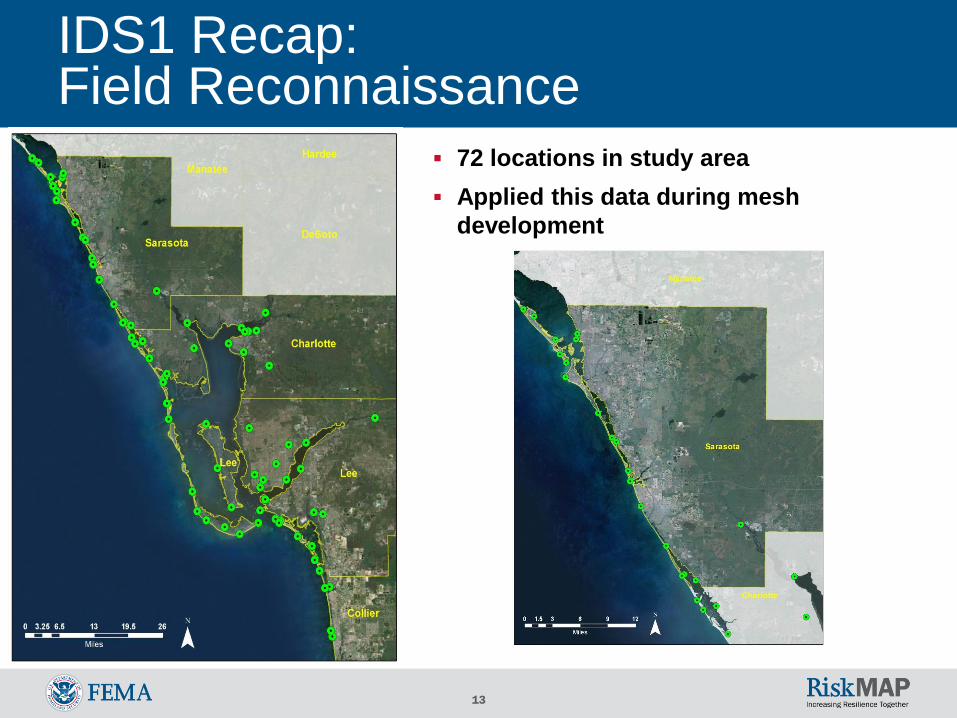
IDS1 Recap: Field Reconnaissance
72 locations in study area
Applied this data during mesh
development

14
IDS1 Recap: Digital Elevation Model
Shoreline
Topographic Data
• LiDAR
• FWC Enhanced Elevation
• National Elevation Dataset
Bathymetric Data
• NOAA GEOphysical Data
Management System
• Electronic Navigational Charts
• USACE Hydro Survey
15
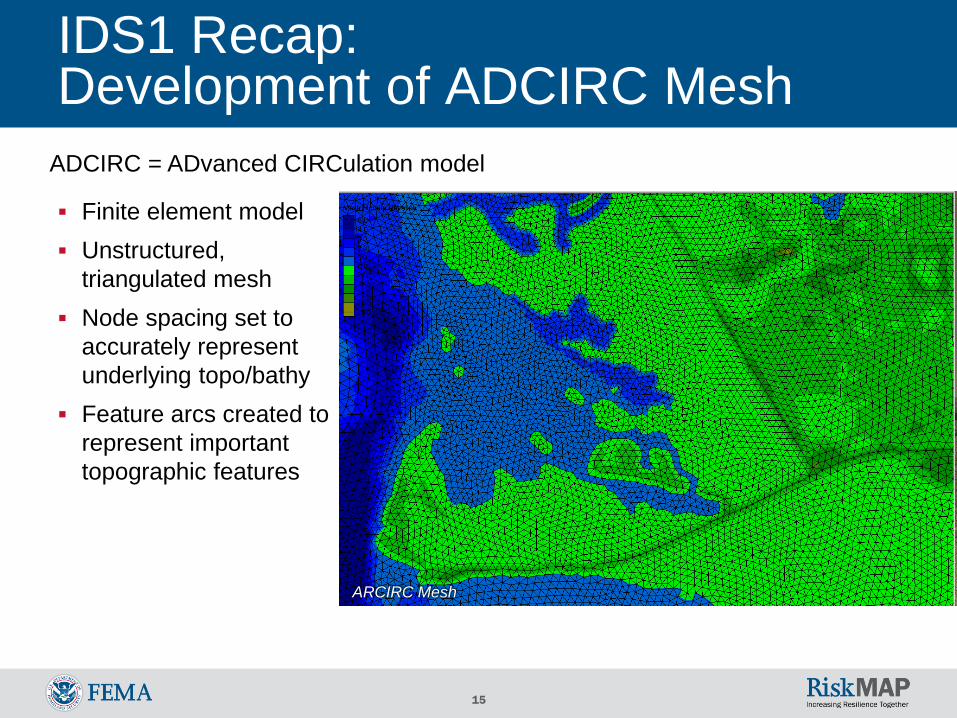
IDS1 Recap: Development of ADCIRC Mesh
Finite element model
Unstructured,
triangulated mesh
Node spacing set to
accurately represent
underlying topo/bathy
Feature arcs created to
represent important
topographic features
ADCIRC = ADvanced CIRCulation model
ARCIRC Mesh
16
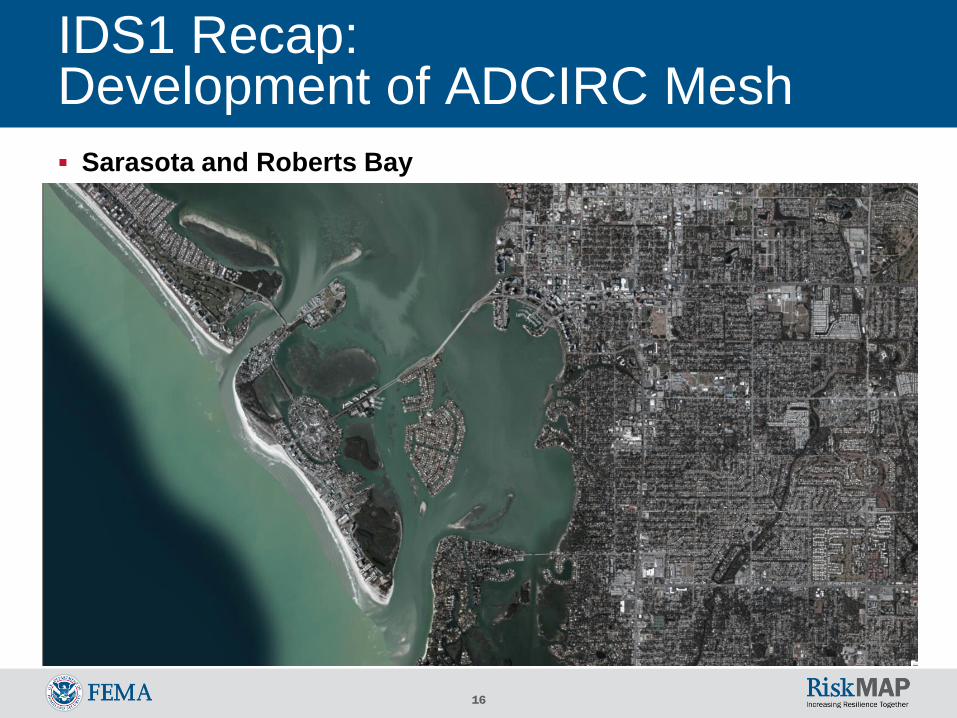
IDS1 Recap: Development of ADCIRC Mesh
Sarasota and Roberts Bay
17
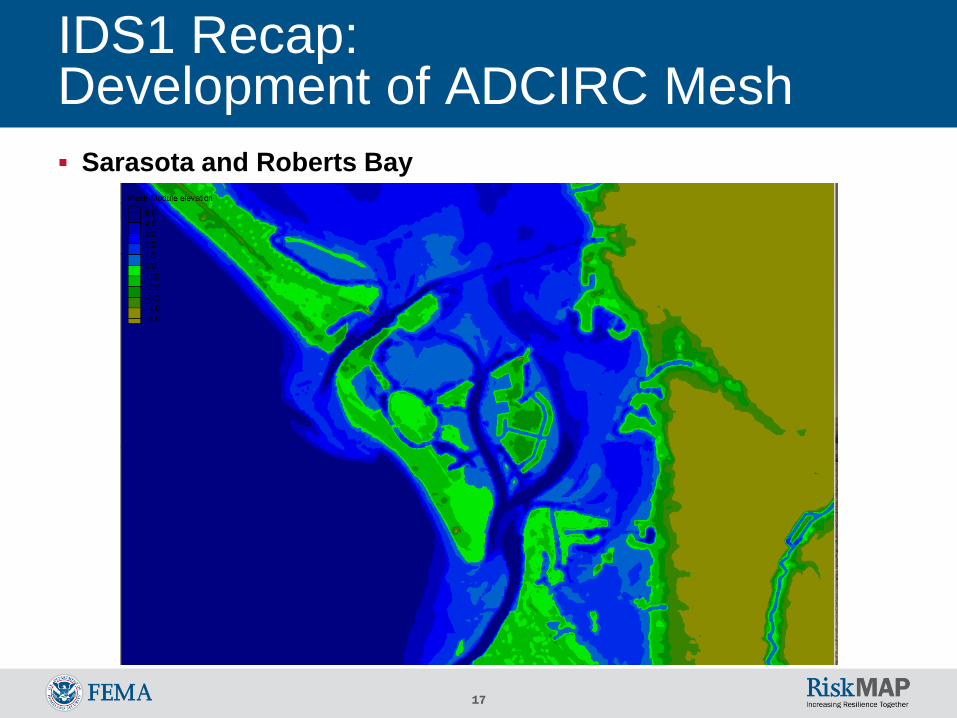
IDS1 Recap: Development of ADCIRC Mesh
Sarasota and Roberts Bay
18
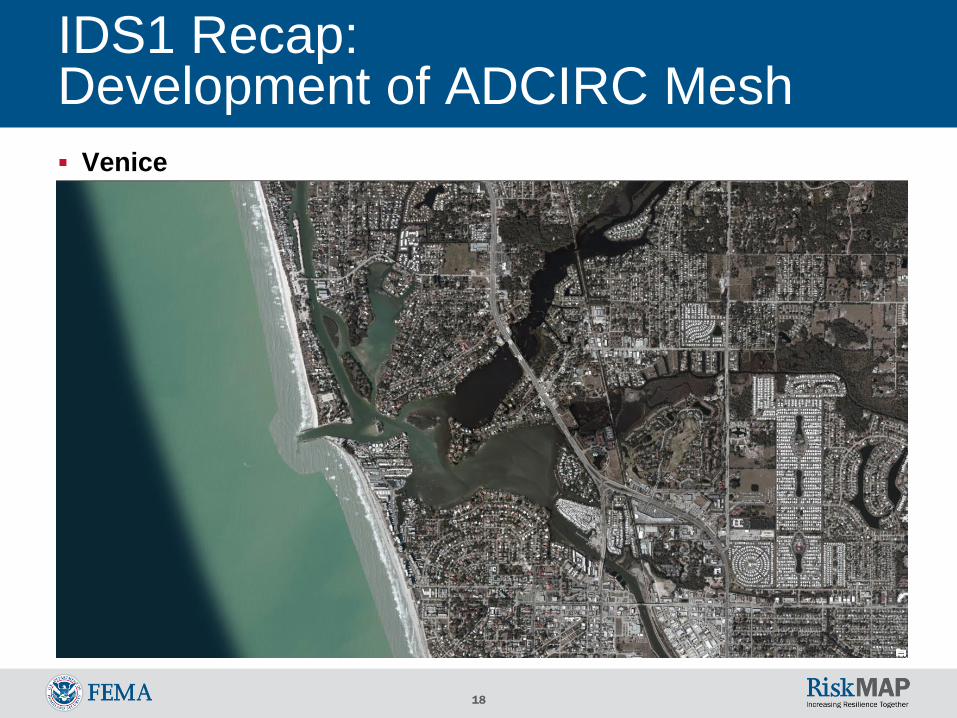
IDS1 Recap: Development of ADCIRC Mesh
Venice

19
IDS1 Recap: Development of ADCIRC Mesh
Venice
20
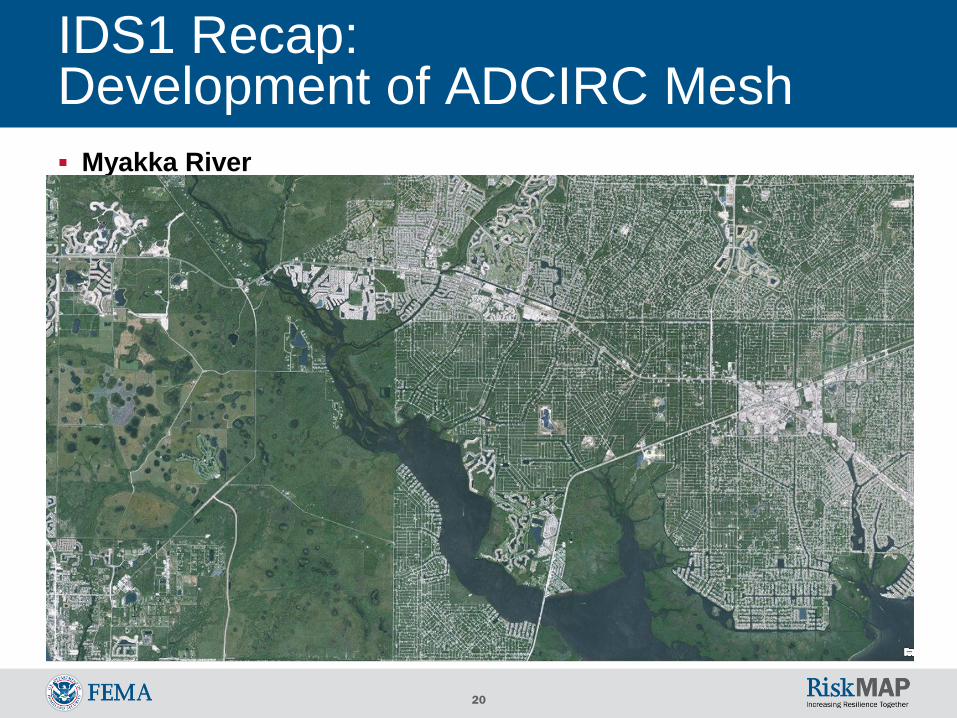
IDS1 Recap: Development of ADCIRC Mesh
Myakka River

21
IDS1 Recap: Development of ADCIRC Mesh
Myakka River

22
IDS1 Recap:Storm Climatology
Reviewed historical
storms
Selected tropical storms to
validate the hurricane /
surge model
Generated hundreds of
synthetic storms
LandFall Storm Population and Tracks
23
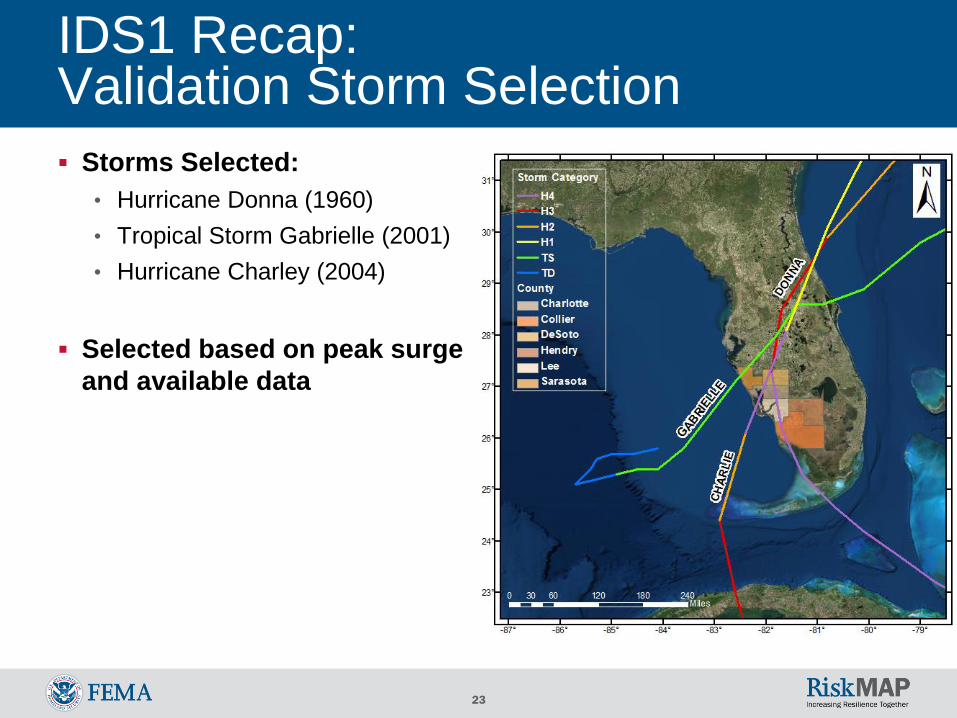
IDS1 Recap:Validation Storm Selection
Storms Selected:
• Hurricane Donna (1960)
• Tropical Storm Gabrielle (2001)
• Hurricane Charley (2004)
Selected based on peak surge
and available data
24
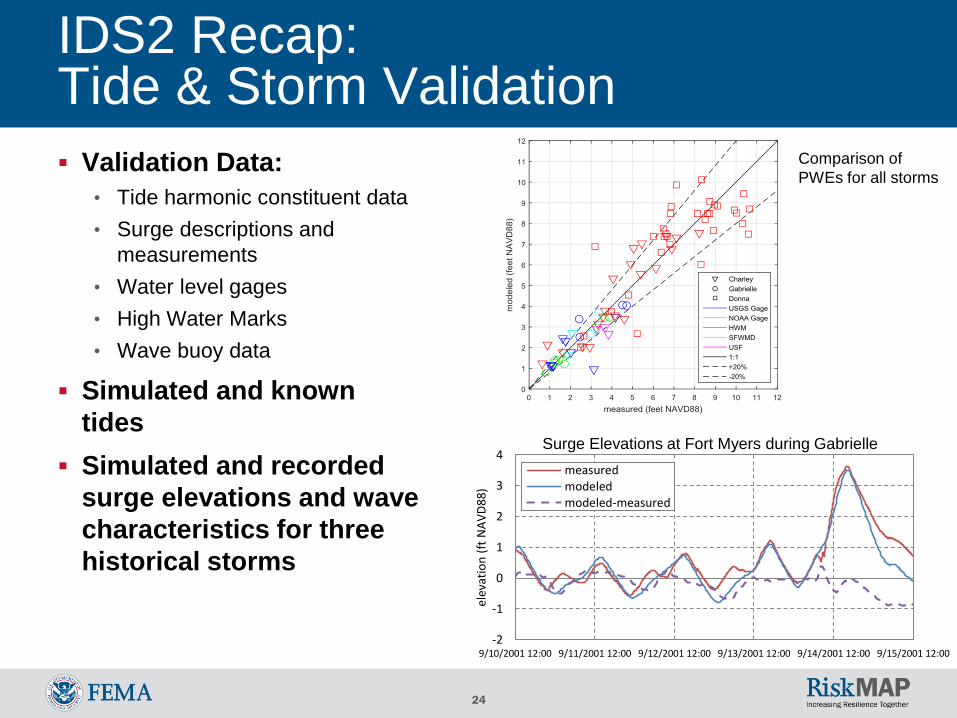
IDS2 Recap:Tide & Storm Validation
Validation Data:
• Tide harmonic constituent data
• Surge descriptions and
measurements
• Water level gages
• High Water Marks
• Wave buoy data
Simulated and known
tides
Simulated and recorded
surge elevations and wave
characteristics for three
historical storms
-2
-1
0
1
2
3
4
9/10/2001 12:00 9/11/2001 12:00 9/12/2001 12:00 9/13/2001 12:00 9/14/2001 12:00 9/15/2001 12:00
elev
atio
n (
ft N
AV
D8
8)
measuredmodeledmodeled-measured
Surge Elevations at Fort Myers during Gabrielle
Comparison of
PWEs for all storms
25
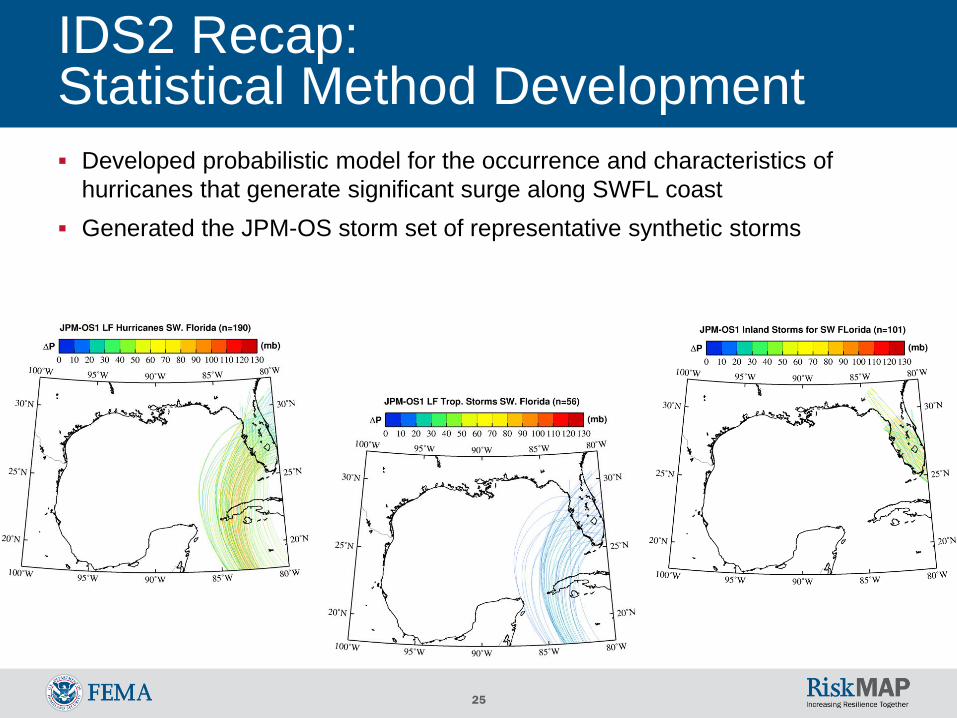
IDS2 Recap:Statistical Method Development
Developed probabilistic model for the occurrence and characteristics of
hurricanes that generate significant surge along SWFL coast
Generated the JPM-OS storm set of representative synthetic storms
26
IDS3: Production Runs
Simulation of synthetic tropical
cyclones using ADCIRC+SWAN
• Total of 395 synthetic storms
(hurricanes and tropical storms)
• Time steps selected based on model
efficiency and stability
ADCIRC time step = 1 second
SWAN time step = 15 minutes
Simulations executed at random
start times to represent the effects
of astronomical tides
Steric effect determined using
NOAA’s seasonal trend data
27
IDS3: Return Period Analysis
Processed results of the production runs to develop:
• Coastal Stillwater Elevations (SWELs) for the 50-, 20-, 10-, 4-, 2-, 1-, and
0.2-percent-annual-exceedance flood levels
• Wave heights and periods for the 1- and 0.2-percent-annual-exceedance
flood levels
Developed surge-frequency curves for tropical cyclones from
the production runs output
• For 10-, 4-, 2-, 1-, and 0.2-percent-annual-exceedance flood levels
Analyzed historical NOAA water level gages
• For 50- and 20-percent-annual-exceedance flood levels
28
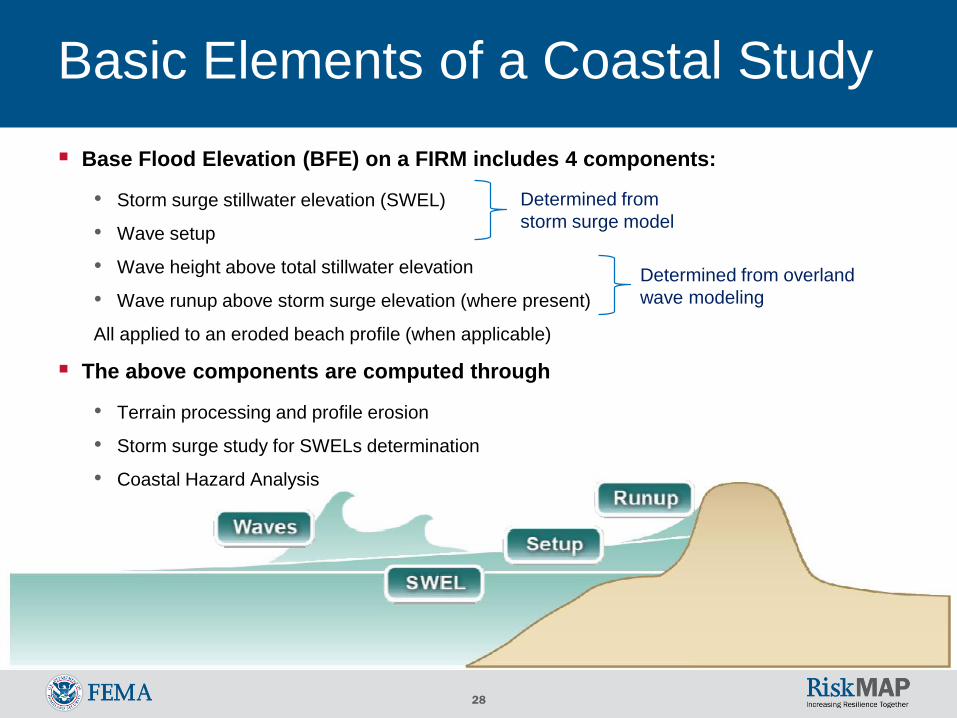
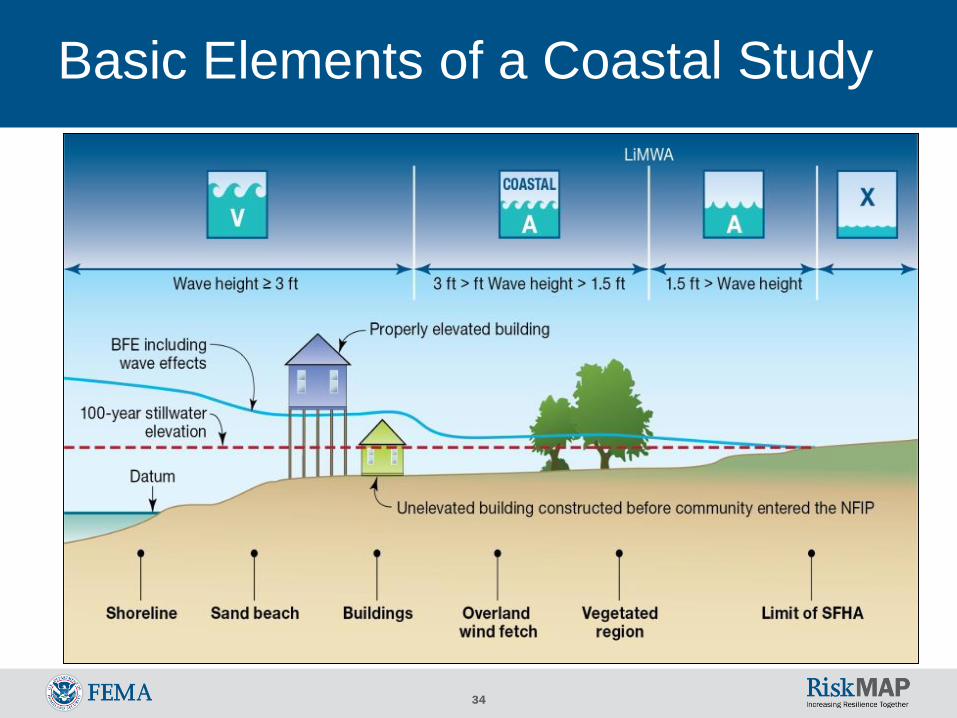
Basic Elements of a Coastal Study
Base Flood Elevation (BFE) on a FIRM includes 4 components:
• Storm surge stillwater elevation (SWEL)
• Wave setup
• Wave height above total stillwater elevation
• Wave runup above storm surge elevation (where present)
All applied to an eroded beach profile (when applicable)
The above components are computed through
• Terrain processing and profile erosion
• Storm surge study for SWELs determination
• Coastal Hazard Analysis
Determined from
storm surge model
Determined from overland
wave modeling

29
IDS3: Return Period Analysis
At the WFL/SWFL boundary: blended flood levels to obtain a
smooth transition

30
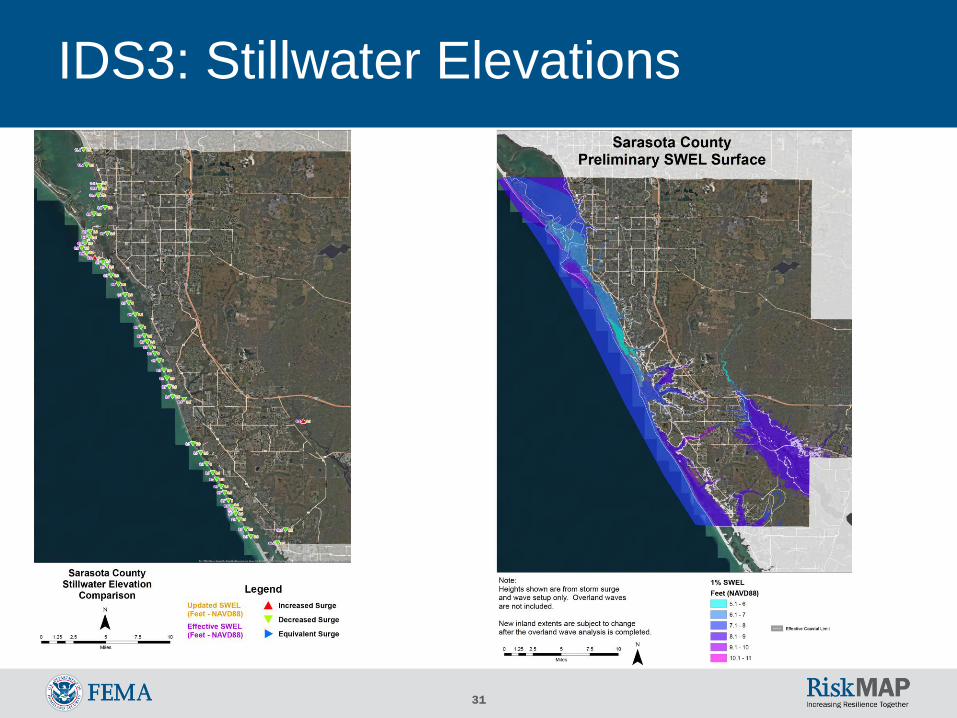
IDS3: Stillwater Elevations
Calculated 1-percent-annual-chance stillwater elevations
(SWELs)
• These are intended to give you an idea of the results we are seeing
Comparison to Effective SWELs
• Does not correlate directly to what the FIRM may show because the
published SWEL does not include wave heights
• Effective SWEL locations are approximate
• Results are variable throughout study area
31
IDS3: Stillwater Elevations

32
IDS3: Starting Wave Conditions
Determined starting wave conditions to be used in the
subsequent overland analysis
Starting Wave Heights for 1-percent SWEL Starting Wave Periods for 1-percent SWEL
33
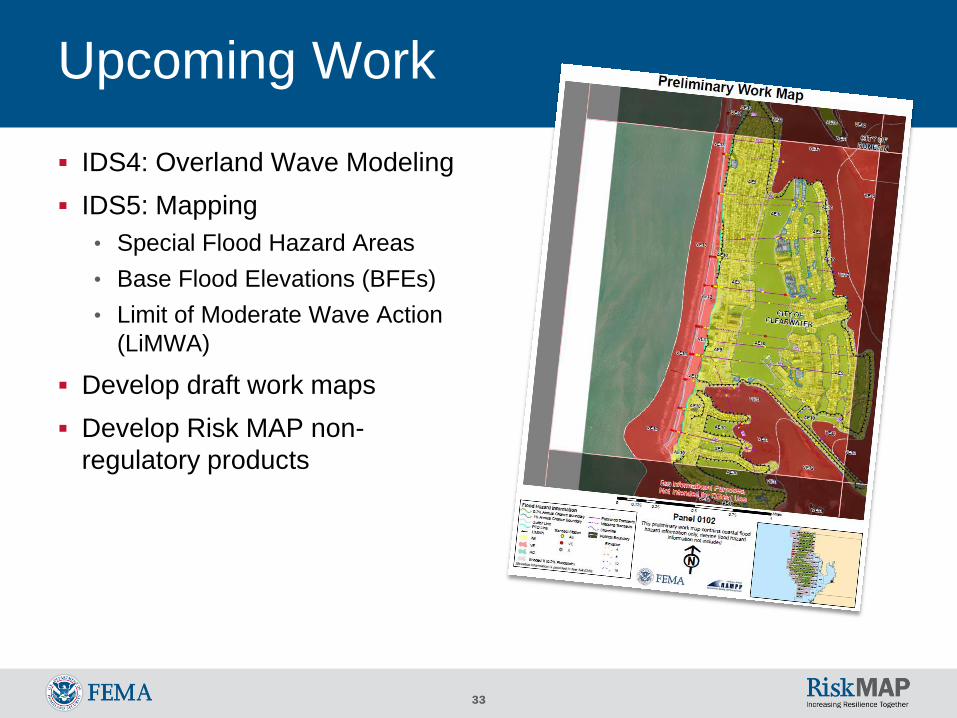
Upcoming Work
IDS4: Overland Wave Modeling
IDS5: Mapping
• Special Flood Hazard Areas
• Base Flood Elevations (BFEs)
• Limit of Moderate Wave Action
(LiMWA)
Develop draft work maps
Develop Risk MAP non-
regulatory products
34
Basic Elements of a Coastal Study
35
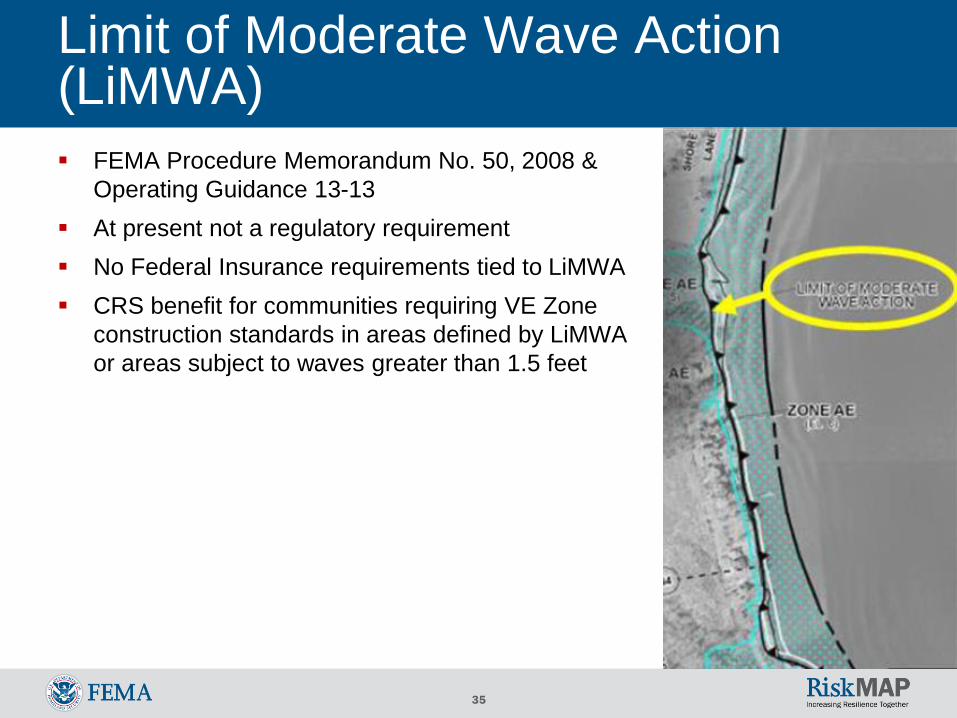
Limit of Moderate Wave Action (LiMWA)
FEMA Procedure Memorandum No. 50, 2008 &
Operating Guidance 13-13
At present not a regulatory requirement
No Federal Insurance requirements tied to LiMWA
CRS benefit for communities requiring VE Zone
construction standards in areas defined by LiMWA
or areas subject to waves greater than 1.5 feet
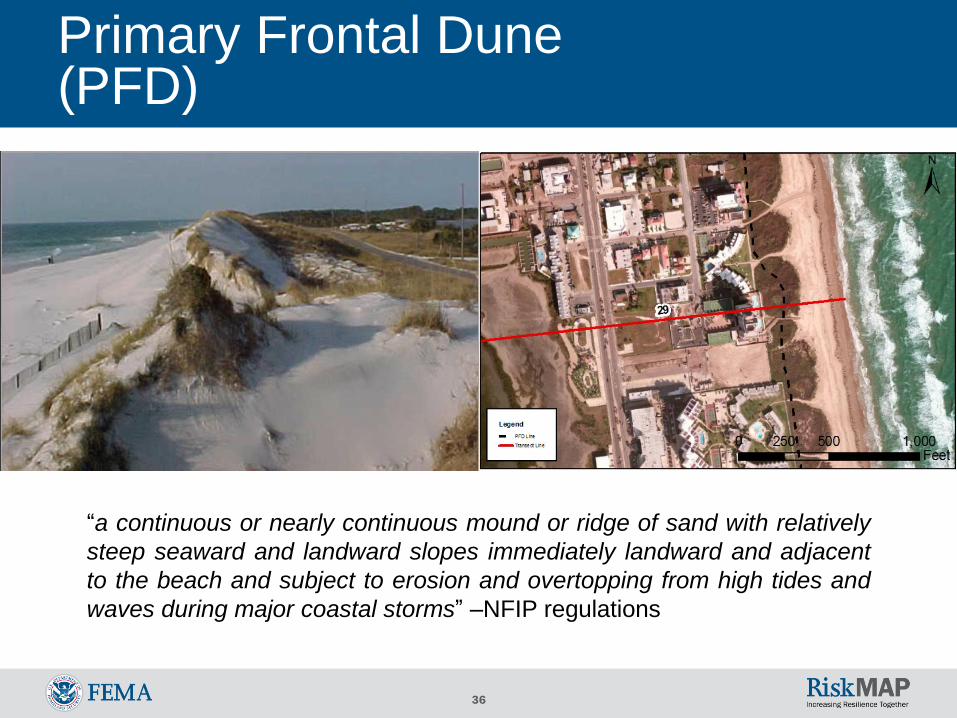
36
“a continuous or nearly continuous mound or ridge of sand with relatively
steep seaward and landward slopes immediately landward and adjacent
to the beach and subject to erosion and overtopping from high tides and
waves during major coastal storms” –NFIP regulations
Primary Frontal Dune(PFD)
37
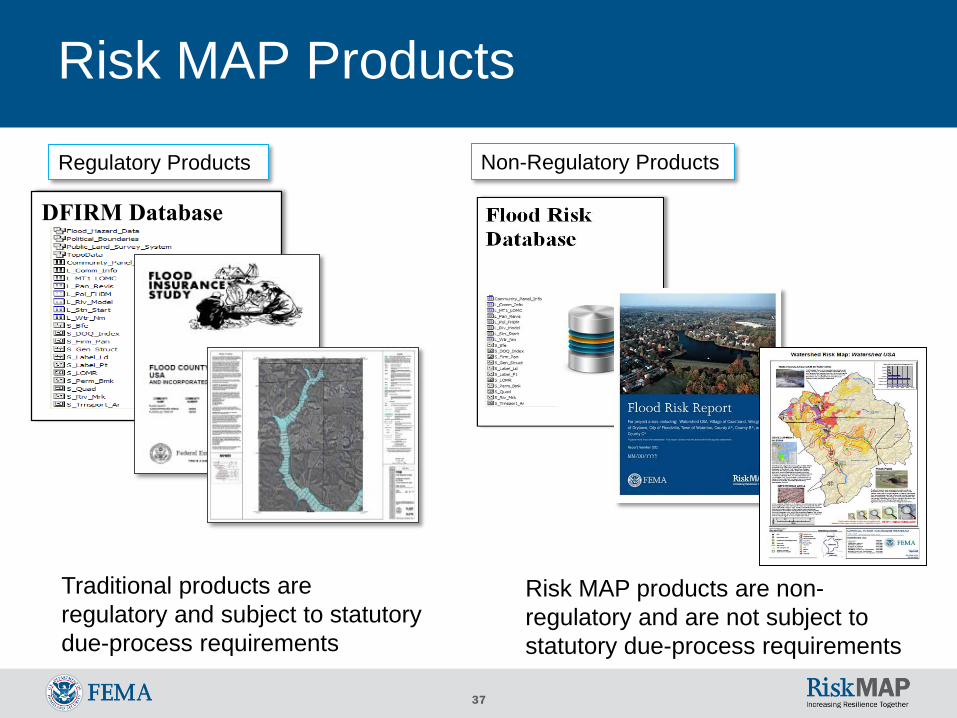
Risk MAP Products
Traditional products are
regulatory and subject to statutory
due-process requirements
Risk MAP products are non-
regulatory and are not subject to
statutory due-process requirements
DFIRM Database
Regulatory Products Non-Regulatory Products
38
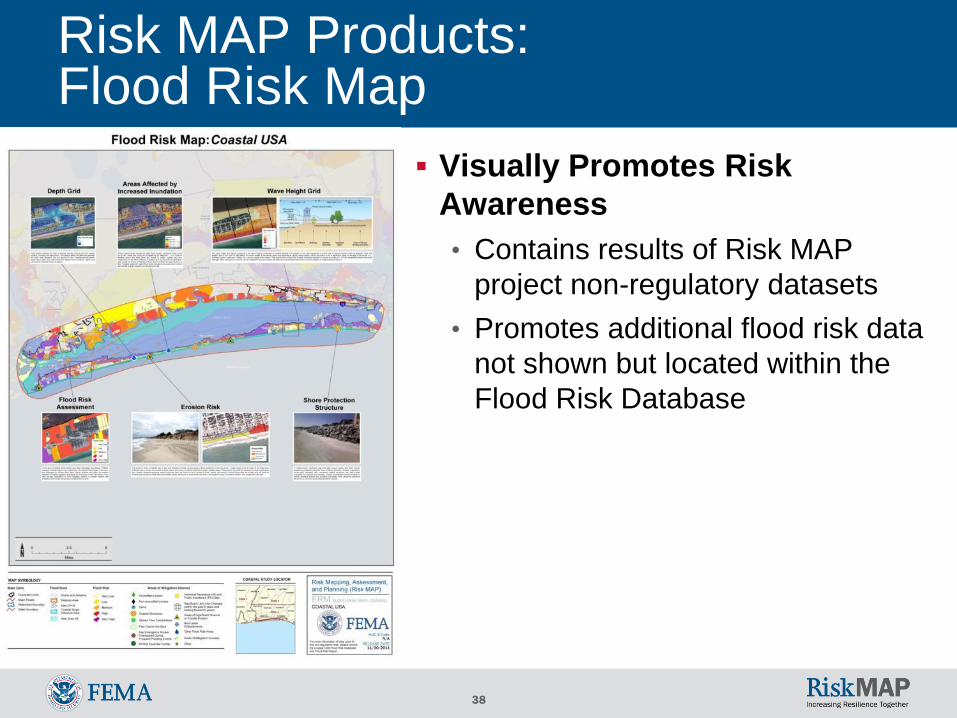
Risk MAP Products: Flood Risk Map
Visually Promotes Risk
Awareness
• Contains results of Risk MAP
project non-regulatory datasets
• Promotes additional flood risk data
not shown but located within the
Flood Risk Database

39
Risk MAP Products:Changes Since Last FIRM
Makes it easy for communities
and homeowners to identify
impacts of new FIRM
Assists in prioritizing mitigation
actions
Helps identify reasons for
changes
40
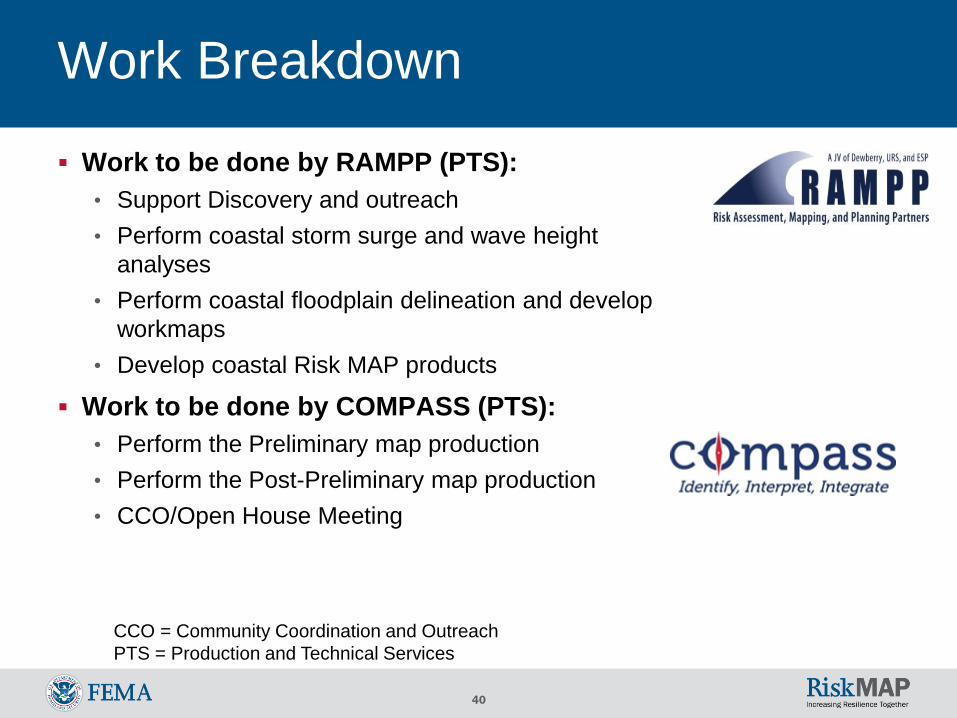
Work Breakdown
Work to be done by RAMPP (PTS):
• Support Discovery and outreach
• Perform coastal storm surge and wave height
analyses
• Perform coastal floodplain delineation and develop
workmaps
• Develop coastal Risk MAP products
Work to be done by COMPASS (PTS):
• Perform the Preliminary map production
• Perform the Post-Preliminary map production
• CCO/Open House Meeting
CCO = Community Coordination and Outreach
PTS = Production and Technical Services
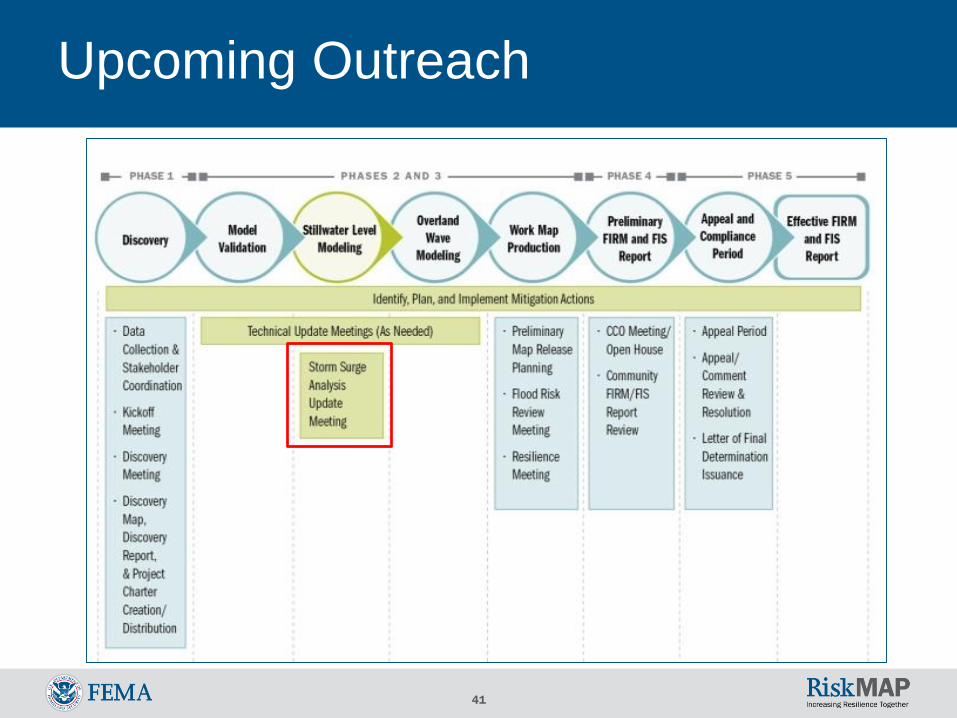
41
Upcoming Outreach
42
Next Steps
Questions & Answers
Pick up RIV Coastal Analysis handout
Based on today’s discussion, we will finalize and email to you:
• Meeting minutes
• Copy of this presentation
• IDS3 report
Please provide your feedback and comments within three weeks
of receiving that email
43
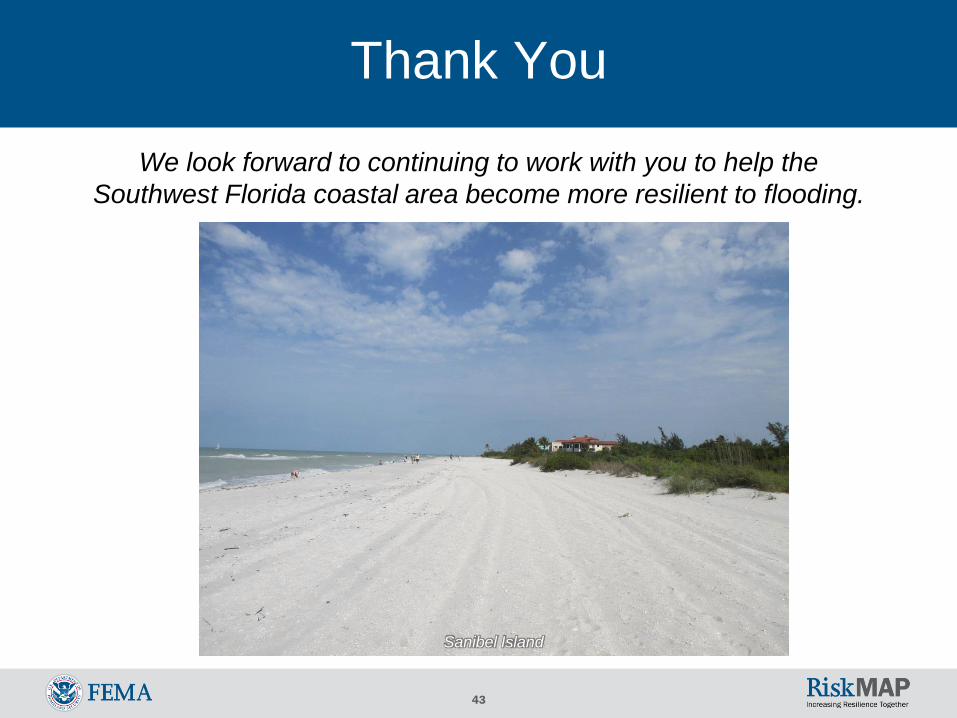
Thank You
We look forward to continuing to work with you to help the
Southwest Florida coastal area become more resilient to flooding.
Sanibel Island
44
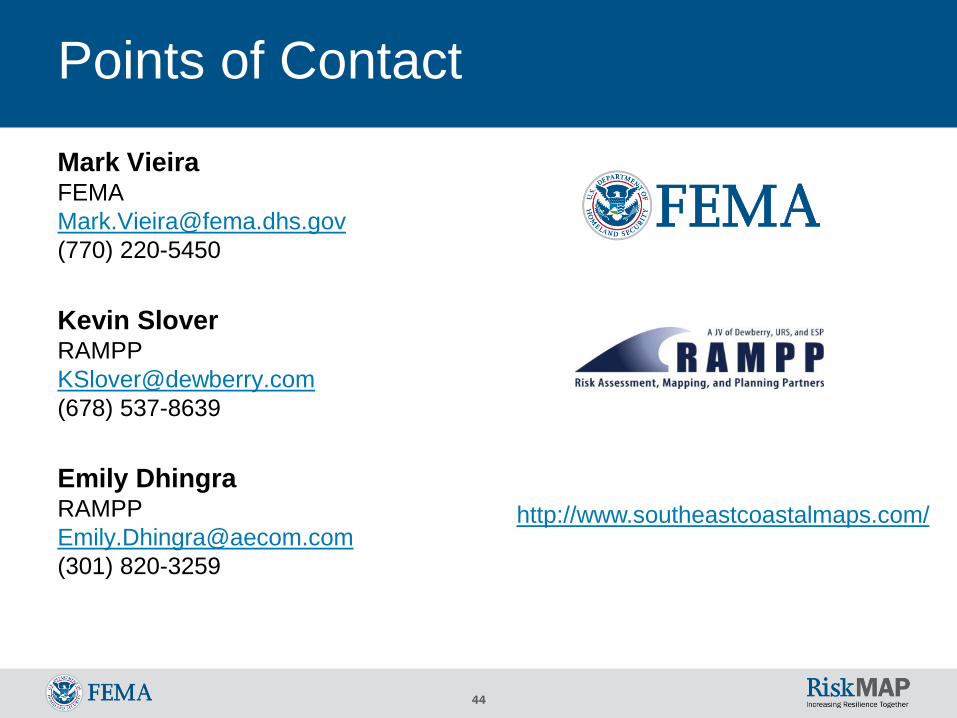
Points of Contact
http://www.southeastcoastalmaps.com/
Mark VieiraFEMA
(770) 220-5450
Kevin SloverRAMPP
(678) 537-8639
Emily DhingraRAMPP
(301) 820-3259


![Hydro-Meteorological Trends in Southwest Coastal ...saciwaters.org/periurban/pdfs/peer-reviewed-papers... · the world [2]. Cyclone, storm surge induced flooding, riverine coastal](https://img.pdfslide.us/doc/110x75/601efb99750b226b2f1dfc9d/hydro-meteorological-trends-in-southwest-coastal-the-world-2-cyclone-storm.jpg)