Embed Size (px)
Citation preview
An Evaluation of Coastal Flooding Risk due to Storm Surge under Future Sea Level Rise
Scenarios in Thua Thien Hue Province, Vietnam
by
Thu Nguyen, PhD
A Thesis
In
Geoscience
Submitted to the Graduate Faculty
of Texas Tech University in
Partial Fulfillment of
the Requirements for
the Degree of
DOCTOR OF PHILOSOPHY
Approved
Dr. Jeffrey Lee
Chair of Committee
Dr. Katharine Hayhoe
Dr. Cao Guofeng
Dr. Kevin Mulligan
Mark Sheridan
Dean of the Graduate School
December 2017

Copyright Page 2017, Thu Nguyen
Texas Tech University, Thu Nguyen, December 2017
ii
ACKNOWLEDGEMENTS
The most important acknowledgement of gratitude I wish to express is to my committee
chair, Dr. Jeff Lee at Department of Geosciences, who has the attitude and the substance of a genius.
Dr. Lee has motivated me for this research and their constant guidance and supports. He granted
me various conveniences without which it would not have been possible to do the work.
I would like to express my profound appreciation to my adviser, Dr. Katharine Hayhoe at
Department of Political Science, who inspired me this research. Dr. Hayhoe has put her immense
knowledge, valuable experiences and wisdom at my disposal.
I would like to thank my committee members, Dr. Cao Guofeng and Dr. Kevin Mulligan,
for their practical advice in my research work and suggested many important addition and
improvement.
Special thanks to my dear friends, especially to Mr. Dien Xuan Nguyen in Vietnam, who
provided me with the most important inputs including data, software and even training. Without
his help and inputs this work would not have been done.
And finally, I would like to say this thesis is dedicated to my husband and children who
have always stood by me and support me unconditionally. Without their love, support and hardship
over years none of this work would have been possible. They have always been there for me and I
am thankful for everything they have helped me achieve.
Thanks for all your encouragement!
Texas Tech University, Thu Nguyen, December 2017
iii
TABLE OF CONTENTS ACKNOWLEDGEMENTS ............................................................................................. ii
ABSTRACT ........................................................................................................................v
LIST OF TABLES ........................................................................................................... vi
LIST OF FIGURES ........................................................................................................ vii
MOTIVATION FOR THE WORK ............................................................................. viii
CHAPTER ONE ............................................................................................................... 1
INTRODUCTION..............................................................................................................1
1. Background .......................................................................................................... 1
2. Climate Change in Vietnam ................................................................................. 3
2.1 Climate change scenarios ...................................................................................... 4
2.2 Sea level rise scenarios .......................................................................................... 7
2.3 Impacts of Climate Change ................................................................................. 10
3. Dissertation Objectives ......................................................................................12
CHAPTER TWO ............................................................................................................ 13
LITERATURE REVIEW ...............................................................................................13
1. Sea Level Rise .................................................................................................... 13
2. Tropical Storm/Storm Surge .............................................................................. 15
3. Land subsidence ................................................................................................. 16
4. Coastal Flooding ................................................................................................ 17
5. Vertical uncertainty in elevation-based SLR assessment ................................... 18
6. Reliability of MIKE 21 FM model in inundation modeling .............................. 20
7. Justification ........................................................................................................ 21
CHAPTER THREE ........................................................................................................ 23
STUDY AREA ..................................................................................................................23
1. Geographical Characteristics.............................................................................. 23
2. Disaster context and their impacts in Thua Thien Hue ...................................... 25
CHAPTER FOUR ........................................................................................................... 29
METHODOLOGY ................................................................................................................... 29
1. Data Sets and Pre-Processing ............................................................................. 30
Texas Tech University, Thu Nguyen, December 2017
iv
1.1 Data sets for MIKE 21 FM modeling .................................................................. 31
1.2 Data source for impact analysis using ArcGIS tools ........................................... 33
2. Approach ............................................................................................................ 34
CHAPTER FIVE ............................................................................................................ 52
RESULTS .................................................................................................................................... 52
1. Simulation of coastal flooding ........................................................................... 52
2. Analysis of Impacts ............................................................................................ 52
CHAPTER SIX ............................................................................................................... 64
CONCLUSIONS ....................................................................................................................... 64
Texas Tech University, Thu Nguyen, December 2017
v
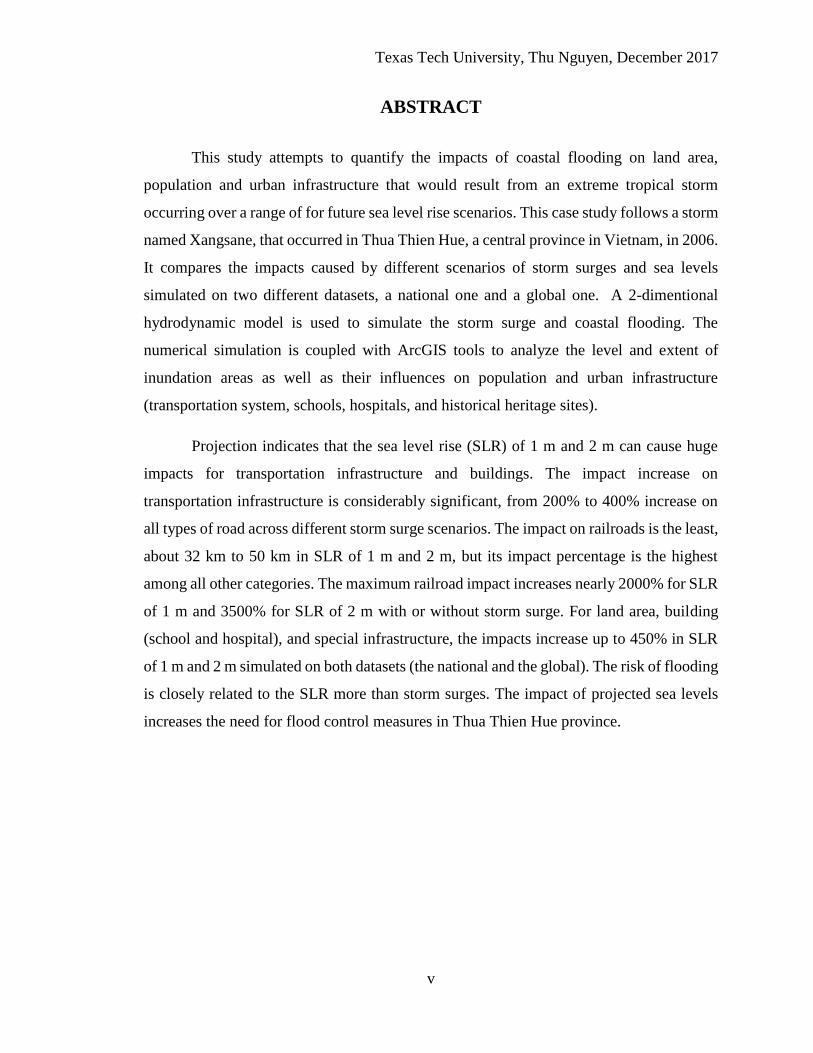
ABSTRACT
This study attempts to quantify the impacts of coastal flooding on land area,
population and urban infrastructure that would result from an extreme tropical storm
occurring over a range of for future sea level rise scenarios. This case study follows a storm
named Xangsane, that occurred in Thua Thien Hue, a central province in Vietnam, in 2006.
It compares the impacts caused by different scenarios of storm surges and sea levels
simulated on two different datasets, a national one and a global one. A 2-dimentional
hydrodynamic model is used to simulate the storm surge and coastal flooding. The
numerical simulation is coupled with ArcGIS tools to analyze the level and extent of
inundation areas as well as their influences on population and urban infrastructure
(transportation system, schools, hospitals, and historical heritage sites).
Projection indicates that the sea level rise (SLR) of 1 m and 2 m can cause huge
impacts for transportation infrastructure and buildings. The impact increase on
transportation infrastructure is considerably significant, from 200% to 400% increase on
all types of road across different storm surge scenarios. The impact on railroads is the least,
about 32 km to 50 km in SLR of 1 m and 2 m, but its impact percentage is the highest
among all other categories. The maximum railroad impact increases nearly 2000% for SLR
of 1 m and 3500% for SLR of 2 m with or without storm surge. For land area, building
(school and hospital), and special infrastructure, the impacts increase up to 450% in SLR
of 1 m and 2 m simulated on both datasets (the national and the global). The risk of flooding
is closely related to the SLR more than storm surges. The impact of projected sea levels
increases the need for flood control measures in Thua Thien Hue province.
Texas Tech University, Thu Nguyen, December 2017
vi
LIST OF TABLES
Table 1: Relative frequency of natural disasters in Vietnam (CCFSC, 2005) ................................ 3
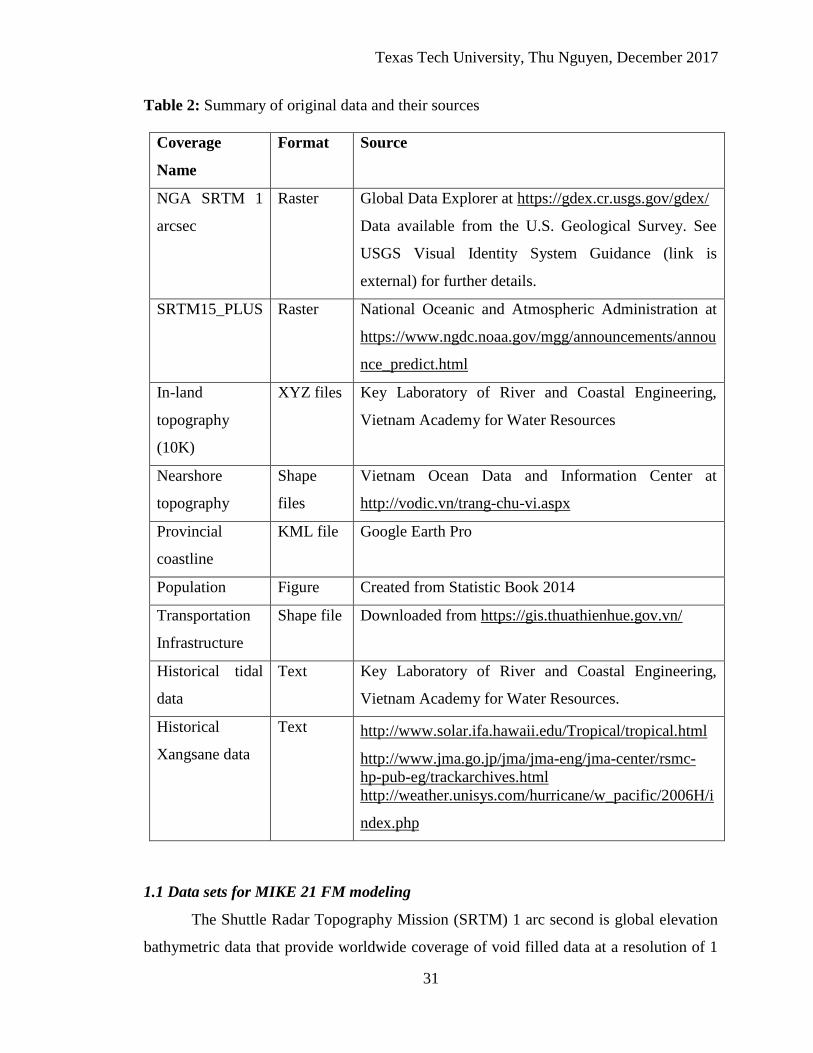
Table 2: Summary of original data and their sources .................................................................... 31
Table 3: Study Scenarios ............................................................................................................... 36
Table 4: Mesh Generation Parameter ............................................................................................ 38
Table 5: Parameters of the MIKE 21 flow model .......................................................................... 40
Table 6: Total inundated area (km2) in different scenarios ........................................................... 53
Table 7: Storm Making Land-falling_National Data 10K ............................................................. 54
Table 8: Storm Moving Along The Coast_National Data 10K...................................................... 55
Table 9: Storm Making Land-falling_Global Data SRTM ............................................................ 57
Table 10: Storm Moving Along the Coast_Global Data SRTM .................................................... 58
Table 11: No Storm Surge_SRTM ................................................................................................ 60
Table 12: No Storm Surge_10K .................................................................................................... 61
Texas Tech University, Thu Nguyen, December 2017
vii
LIST OF FIGURES
Figure 1: Change in Average Temperature (0C) (IMHEN, 2016) ................................................... 5
Figure 2: Changes in Annual Average Rainfall (%) (IMHEN, 2016) ............................................. 7
Figure 3: Sea Level Rise under the Lower Emission Scenario (cm) ............................................... 8
Figure 4: Sea Level Rise in Medium Emission Scenario (cm) ........................................................ 8
Figure 5: Sea Level Rise in High Emission Scenario (cm) .............................................................. 8
Figure 6: The Risk of Flooding with Rising Sea Level of 100cm (IMHEN, 2016) ......................... 9
Figure 7: The Trend of Flood and Storm Occurrence in Vietnam during 1975 to 2013. .............. 10
Figure 8: Mapping and Ranking the Disaster Frequency, Disaster Damages and Killed People in
Vietnam during 1990-2016 ............................................................................................................ 11
Figure 9: Administrative Map of Thua Thien Hue Province……………………………………..23
Figure 10: Statistics of Population and Land Area in Thua Thien Hue Province in 2013 ............. 24
Figure 11: The Historic Flood in Hue in 1999 ............................................................................... 25
Figure 12: Flood-related losses in Thua Thien Hue Province, Vietnam during 1993 – 2012 ....... 26
Figure 13: Flood-related losses in Thua Thien Hue Province, Vietnam during 1993 – 2012 ....... 26
Figure 14: Inundated Heritage Sites in a flood 2011 (Photo credit: laodong.com.vn) .................. 28
Figure 15: Demonstration of different data layer used in coastal flooding model ......................... 33
Figure 16: Different Storm Track Assumptions ............................................................................ 35
Figure 17: Demonstration of Mesh Generation in MIKE 21 FM Window .................................... 39
Figure 18: Observed Tidal Water Level Measured at Son Tra Station in 2006 ............................. 41
Figure 19: Comparison of Observed Water Level and Simulated Water Level ............................ 41
Figure 20: Land-Falling Storm with SLR 1 m Simulation on 10K Dataset ................................... 42
Figure 21: Moving Along Storm with SLR 1 m Simulation on 10K Dataset ................................ 43
Figure 22: Land-Falling Storm with SLR 1 m Simulation on SRTM Dataset ............................... 43
Figure 23: Moving Along Storm with SLR 1 m Simulation on SRTM Dataset ............................ 44
Figure 24: Comparison of No SLR Inundation Scenarios on SRTM and 10K Datasets ............... 45
Figure 25: Comparison of No Storm Surge Inundation Scenarios on SRTM and 10K Datasets .. 45
Figure 26: Comparison of 1 m-SLR Inundation Scenarios on SRTM and 10K Datasets .............. 46
Figure 27: Comparison of No SLR Inundation Scenarios on 10K Dataset ................................... 46
Figure 28: Comparison of Inundation Scenarios with the different SLR scenarios and the same
simulated storm track on 10K Dataset ........................................................................................... 47
Figure 29: Comparison of Inundation Scenarios with the same SLR scenarios and the different
simulated storm track ..................................................................................................................... 48
Figure 30: Population impacted by different Storm Scenarios with 1-m SLR .............................. 49
Figure 31: Impacts caused by different SLR Scenarios 10K Dataset ............................................ 50
Figure 32: Impacts illustrated on different datasets (SRTM and 10K) .......................................... 50
Figure 33: Impacts by land-falling storm _10K dataset ................................................................. 54
Figure 34: Impacts by moving along storm _10K dataset ............................................................. 56
Figure 35: Impacts by land-falling storm _SRTM ......................................................................... 57
Figure 36: Impacts by moving along storm _SRTM ..................................................................... 58
Figure 37: Impact comparison between two datasets 10K and SRTM .......................................... 59
Figure 38: No Storm Surge with Different SLR Scenarios _10K dataset ...................................... 61
Figure 39: No Storm Surge with Different SLR Scenarios _SRTM .............................................. 62
Figure 40: Impact comparison among different storm surge scenarios ......................................... 62
Figure 41: Impact comparison between No Storm Surge and No SLR _10K dataset ................... 63
Texas Tech University, Thu Nguyen, December 2017
viii
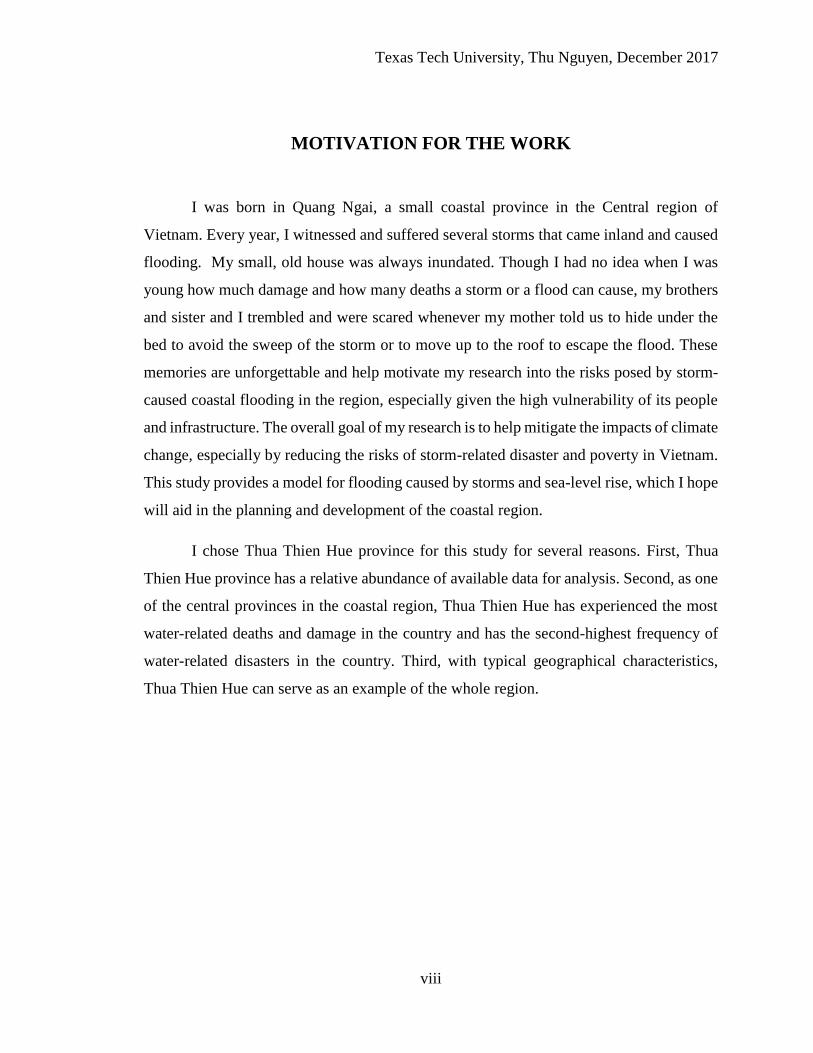
MOTIVATION FOR THE WORK
I was born in Quang Ngai, a small coastal province in the Central region of
Vietnam. Every year, I witnessed and suffered several storms that came inland and caused
flooding. My small, old house was always inundated. Though I had no idea when I was
young how much damage and how many deaths a storm or a flood can cause, my brothers
and sister and I trembled and were scared whenever my mother told us to hide under the
bed to avoid the sweep of the storm or to move up to the roof to escape the flood. These
memories are unforgettable and help motivate my research into the risks posed by storm-
caused coastal flooding in the region, especially given the high vulnerability of its people
and infrastructure. The overall goal of my research is to help mitigate the impacts of climate
change, especially by reducing the risks of storm-related disaster and poverty in Vietnam.
This study provides a model for flooding caused by storms and sea-level rise, which I hope
will aid in the planning and development of the coastal region.
I chose Thua Thien Hue province for this study for several reasons. First, Thua
Thien Hue province has a relative abundance of available data for analysis. Second, as one
of the central provinces in the coastal region, Thua Thien Hue has experienced the most
water-related deaths and damage in the country and has the second-highest frequency of
water-related disasters in the country. Third, with typical geographical characteristics,
Thua Thien Hue can serve as an example of the whole region.
1
CHAPTER ONE
INTRODUCTION
1. Background
Vietnam is a coastal country located in the tropical region of Southeast Asia with a
total population of over 90 million people, of which about 10 million live in the coastal
zone and are potentially subjected to the impacts of a rising sea level. Since the political
and economic reforms launched in 1986, this developing country has made many
remarkable advances: from being one of the poorest countries in the world, it became a
lower middle-income country with per capita income of US$2,100 by the end of 2015
(World Bank, 2016); the poverty rate has decreased from 58 percent in 1993 to 14.5 percent
in 2008; and population growth rate has slowed from 1.16 in 2002 to 1.04 in 2011 (World
Bank, 2010). In addition to improving most welfare indicators, Vietnam has also made
good progress towards achieving the ten original Millennium Development Goal targets
(UN, 2014).
Geographically, Vietnam is divided into three parts: North, Central and South.
Central Vietnam, bridging the North and the South, is a long land strip located by the coast.
The central part is one of three metro regions of Vietnam, where a large proportion of the
population, infrastructure, and economic production including tourism, industry, and
irrigated agriculture are tightly packed along the coast. It holds the long-term economic
future of Vietnam because of many factors. Firstly, it contains many clusters of historical
sightseeing and ancient towns recognized as UNESCO World Heritage Sites in Thua Thien
Hue and Hoi An. Furthermore, Central Vietnam has a coastal range and numerous lovely
beaches allowing cities like Danang, Quy Nhon and Nha Trang to develop a tourist
economy. Secondly, Central Vietnam is well identified by the development of agriculture
and both light and major heavy industrial clusters. While Danang and Nha Trang are very
famous cities for their sandy beaches, Quang Ngai is known for the first major oil refinery
in the country, Dak Lak is a place for major coffee planting and processing and bauxite
mining, and Binh Dinh known for its major wood furniture industrial area. Moreover, auto
parts and IT industries are also discovering Central Vietnam for its potential. Thirdly, it
Texas Tech University, Thu Nguyen, December 2017
2
has the most convenient transportation system in the country. It has airports, railroads, and
ports in the cities where it takes just few minutes to get there. Indeed, Central Vietnam
holds the most promise for new economic growth in Vietnam.
Despite its advances, Vietnam is still highly vulnerable to the adverse effects of
global warming and climate change. Some studies have reported sea level rise in Vietnam.
According to the United Nations Environment Programme (UNEP 1993), sea level in
Vietnam increased 5 cm from mid-1960 to 1990. The General Department of Meteorology
and Hydrology estimated that sea levels were rising with an average speed of 2 mm per
year. The forecasts of the extent of sea level rise in the future are very different, including
the publication of national reports determining sea level rise increase by 1 meter by 2100
(MONRE, 2003; Hoang, 2005). Weather patterns are changing, with increasingly powerful
and more frequent storms along the coast, increased frequency of extreme weather events,
and onset of desertification further inland, while sea level rise is driving the intrusion of
saline water into the Mekong Delta (Hoang, 2005). Both observed and projected future
changes are putting Vietnam’s ability to achieve the rest of the MDG targets under
enormous constraints.
Vietnam has an extensive coastline, two major river deltas, and mountainous areas
on its eastern and northeastern borders. This long narrow country covers 329,241 square
kilometers of mainland and shares its inland border of approximately 3,730 km with China,
Laos, and Cambodia. It also meets the ocean in the east, south and southeast with about 1
million square kilometers of territorial sea and about 3,260 kilometers of coastline. Because
of its geographical position, Vietnam is heavily exposed to the risks of weather variability
and climate change. Vietnam suffers from many kinds of disasters, such as: floods, tropical
depressions and other storms, storm surge, flash floods, hail, drought, landslides, and forest
fires. Among these, storms and floods are the most frequent disasters. The table below
shows the relative frequency of different kinds of natural disasters occurring in Vietnam.
Texas Tech University, Thu Nguyen, December 2017
3
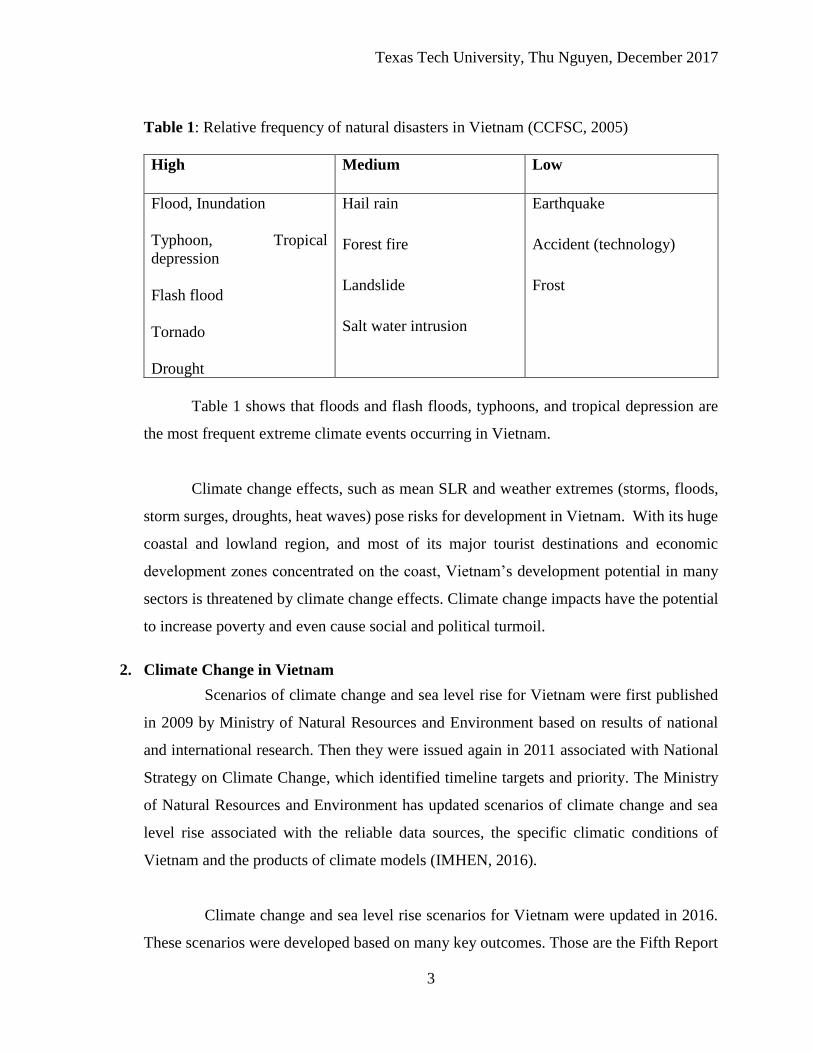
Table 1: Relative frequency of natural disasters in Vietnam (CCFSC, 2005)
High Medium Low
Flood, Inundation
Typhoon, Tropical
depression
Flash flood
Tornado
Drought
Hail rain
Forest fire
Landslide
Salt water intrusion
Earthquake
Accident (technology)
Frost
Table 1 shows that floods and flash floods, typhoons, and tropical depression are
the most frequent extreme climate events occurring in Vietnam.
Climate change effects, such as mean SLR and weather extremes (storms, floods,
storm surges, droughts, heat waves) pose risks for development in Vietnam. With its huge
coastal and lowland region, and most of its major tourist destinations and economic
development zones concentrated on the coast, Vietnam’s development potential in many
sectors is threatened by climate change effects. Climate change impacts have the potential
to increase poverty and even cause social and political turmoil.
2. Climate Change in Vietnam
Scenarios of climate change and sea level rise for Vietnam were first published
in 2009 by Ministry of Natural Resources and Environment based on results of national
and international research. Then they were issued again in 2011 associated with National
Strategy on Climate Change, which identified timeline targets and priority. The Ministry
of Natural Resources and Environment has updated scenarios of climate change and sea
level rise associated with the reliable data sources, the specific climatic conditions of
Vietnam and the products of climate models (IMHEN, 2016).
Climate change and sea level rise scenarios for Vietnam were updated in 2016.
These scenarios were developed based on many key outcomes. Those are the Fifth Report
Texas Tech University, Thu Nguyen, December 2017
4
assessment (AR5) of the Intergovernmental Panel on Climate Change (IPCC), the
meteorological data monitored and sea water levels, the topographic mapping data, high
resolution global and regional models and the atmospheric models. Besides, they also
include the recent trends of change in climate and sea level rise in Vietnam, contributions
from the Scientific Research Institute of Hydrometeorology and Climate Change
(SRIHCC) and from the Advisory Council of the National Committee on Climate Change,
findings from research institutes and universities in Vietnam. SRIHCC Institute has made
significant contributions in the development of scenarios in 2009 and 2011 and responsible
in leading the study and development of climate change scenarios in 2016 (IMHEN, 2016).
In the fifth report, IPCC has developed scenarios based on a new approach of
standard emission scenarios called benchmark emissions scenarios or representative
concentration pathways (RCP). RCP scenarios focus on the concentration of greenhouse
gases, but not the emissions process based on assumptions on social, economic,
technological, demographic development as it did in SRES. In other words, RCP makes
assumptions on the destination, creating more conditions and choices in the process of
development of economy, technology, population (IPCC, 2014). There are four scenarios
RCP, including RCP2.6, RCP4.5, RCP6.0, and RCP8.5.
2.1 Climate change scenarios
Climate change scenarios in Vietnam have been developed for seven specific
climate regions based on their different geographic conditions: North West, North East,
Red River Delta, North Central Regions, South Central Coastal, Central Highlands, and
the South Regions (MONRE, 2012). Climate change scenarios for Vietnam can be
summarized as follows:
a. Temperature: The average air surface temperature (temperature) yearly and
seasonal (winter, spring, summer, autumn) in all regions of Vietnam are on the uptrend
compared to the base period (1986-2005). The increase depends on the RCP scenarios and
climate zones. More particularly, the standard increase in average temperature is from 1.3
to 1.7oC in the mid-21st century and from 1.7 to 2.4oC at the end of the century with RCP4.5
scenarios. With RCP8.5 scenarios, the annual average temperature in the middle of the 21st
Texas Tech University, Thu Nguyen, December 2017
5
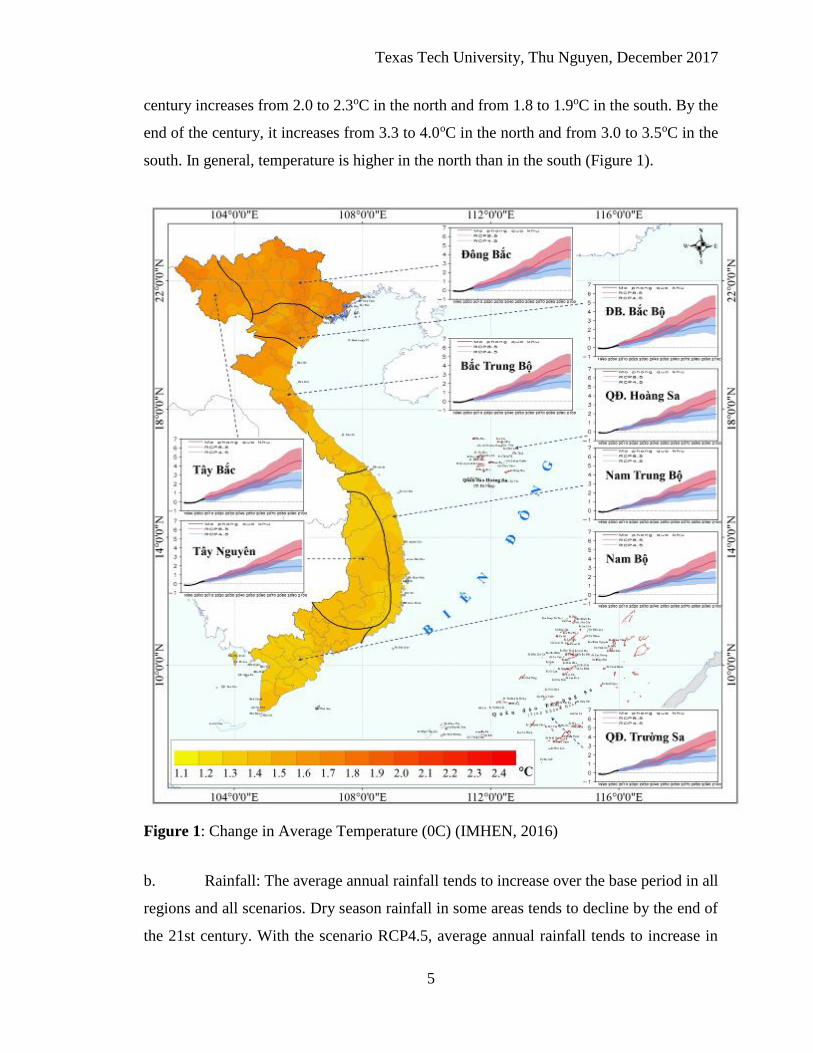
century increases from 2.0 to 2.3oC in the north and from 1.8 to 1.9oC in the south. By the
end of the century, it increases from 3.3 to 4.0oC in the north and from 3.0 to 3.5oC in the
south. In general, temperature is higher in the north than in the south (Figure 1).
Figure 1: Change in Average Temperature (0C) (IMHEN, 2016)
b. Rainfall: The average annual rainfall tends to increase over the base period in all
regions and all scenarios. Dry season rainfall in some areas tends to decline by the end of
the 21st century. With the scenario RCP4.5, average annual rainfall tends to increase in
Texas Tech University, Thu Nguyen, December 2017
6
most regions, commonly from 5 to 15%. Some coastal provinces in North Delta, North
Central, Central region may rise above 20%.
c. Extremes: In the 21st century, extreme temperatures tend to increase over the
period 1986-2005 average in all regions of Vietnam, all the scenarios. With RCP4.5
scenarios, by the end of the 21st century, the average temperature year uptrend from 1.7 to
2.7oC, the highest increases are in Northeast, northern Plains; lowest in the South-Central
region and the South. Meanwhile, the average low temperature in the end of the century it
has increased from 1.8 to 2.2oC
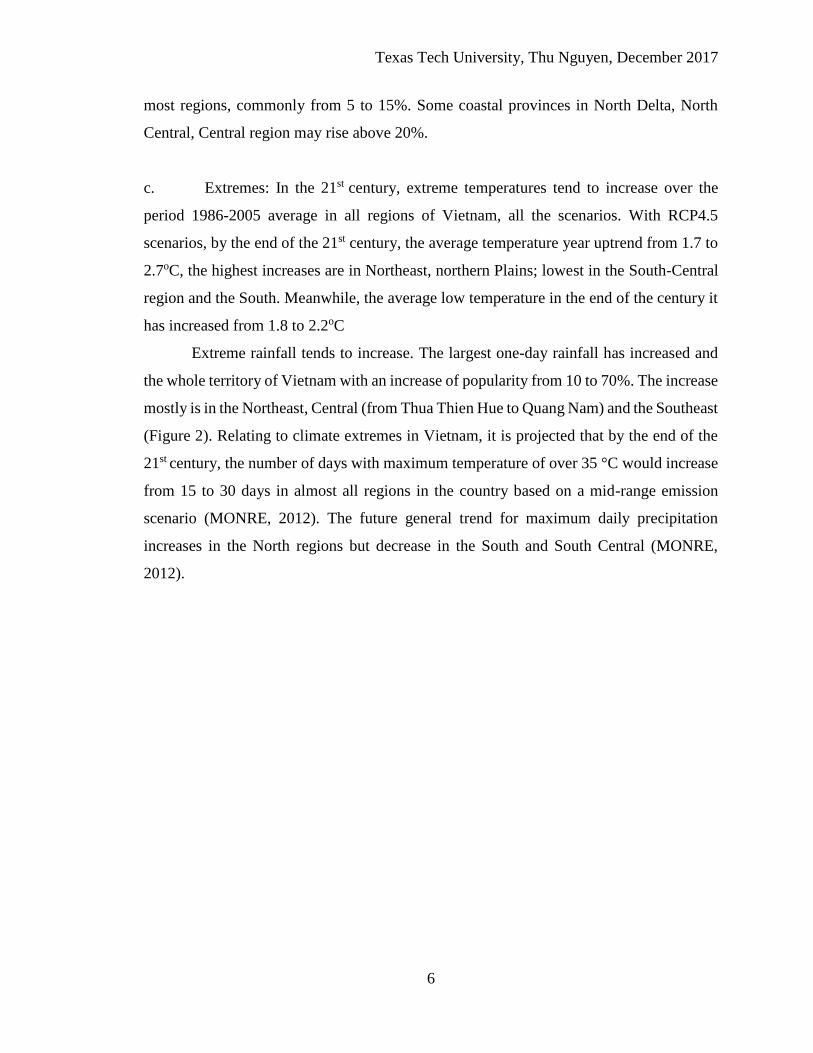
Extreme rainfall tends to increase. The largest one-day rainfall has increased and
the whole territory of Vietnam with an increase of popularity from 10 to 70%. The increase
mostly is in the Northeast, Central (from Thua Thien Hue to Quang Nam) and the Southeast
(Figure 2). Relating to climate extremes in Vietnam, it is projected that by the end of the
21st century, the number of days with maximum temperature of over 35 °C would increase
from 15 to 30 days in almost all regions in the country based on a mid-range emission
scenario (MONRE, 2012). The future general trend for maximum daily precipitation
increases in the North regions but decrease in the South and South Central (MONRE,
2012).
Texas Tech University, Thu Nguyen, December 2017
7
Figure 2: Changes in Annual Average Rainfall (%) (IMHEN, 2016)
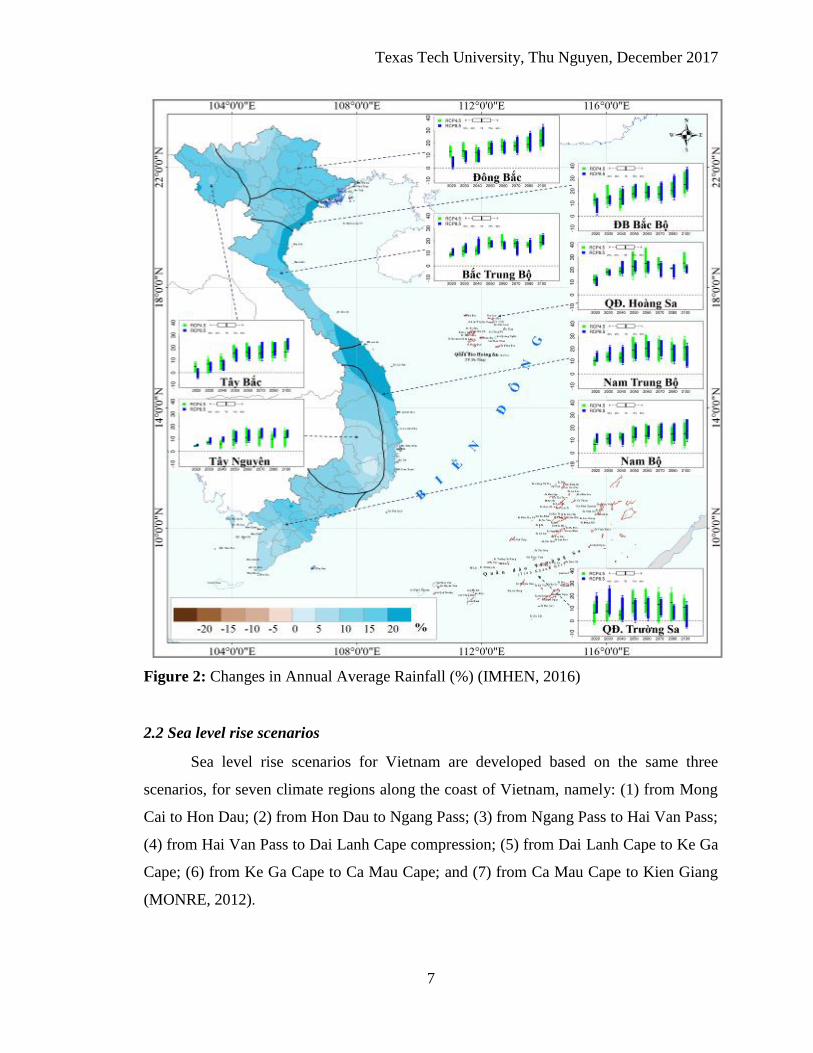
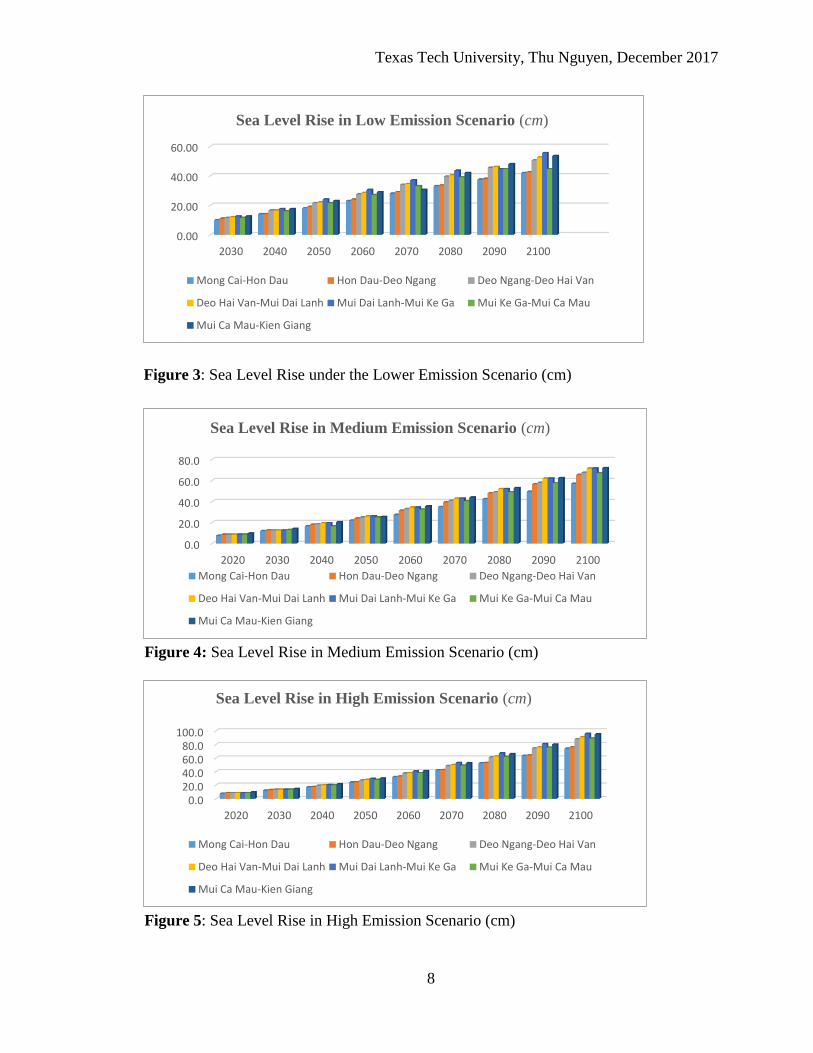
2.2 Sea level rise scenarios
Sea level rise scenarios for Vietnam are developed based on the same three
scenarios, for seven climate regions along the coast of Vietnam, namely: (1) from Mong
Cai to Hon Dau; (2) from Hon Dau to Ngang Pass; (3) from Ngang Pass to Hai Van Pass;
(4) from Hai Van Pass to Dai Lanh Cape compression; (5) from Dai Lanh Cape to Ke Ga
Cape; (6) from Ke Ga Cape to Ca Mau Cape; and (7) from Ca Mau Cape to Kien Giang
(MONRE, 2012).
Texas Tech University, Thu Nguyen, December 2017
8
Figure 3: Sea Level Rise under the Lower Emission Scenario (cm)
Figure 4: Sea Level Rise in Medium Emission Scenario (cm)
Figure 5: Sea Level Rise in High Emission Scenario (cm)
0.00
20.00
40.00
60.00
2030 2040 2050 2060 2070 2080 2090 2100
Sea Level Rise in Low Emission Scenario (cm)
Mong Cai-Hon Dau Hon Dau-Deo Ngang Deo Ngang-Deo Hai Van
Deo Hai Van-Mui Dai Lanh Mui Dai Lanh-Mui Ke Ga Mui Ke Ga-Mui Ca Mau
Mui Ca Mau-Kien Giang
0.0
20.0
40.0
60.0
80.0
2020 2030 2040 2050 2060 2070 2080 2090 2100
Sea Level Rise in Medium Emission Scenario (cm)
Mong Cai-Hon Dau Hon Dau-Deo Ngang Deo Ngang-Deo Hai Van
Deo Hai Van-Mui Dai Lanh Mui Dai Lanh-Mui Ke Ga Mui Ke Ga-Mui Ca Mau
Mui Ca Mau-Kien Giang
0.020.040.060.080.0
100.0
2020 2030 2040 2050 2060 2070 2080 2090 2100
Sea Level Rise in High Emission Scenario (cm)
Mong Cai-Hon Dau Hon Dau-Deo Ngang Deo Ngang-Deo Hai Van
Deo Hai Van-Mui Dai Lanh Mui Dai Lanh-Mui Ke Ga Mui Ke Ga-Mui Ca Mau
Mui Ca Mau-Kien Giang
Texas Tech University, Thu Nguyen, December 2017
9
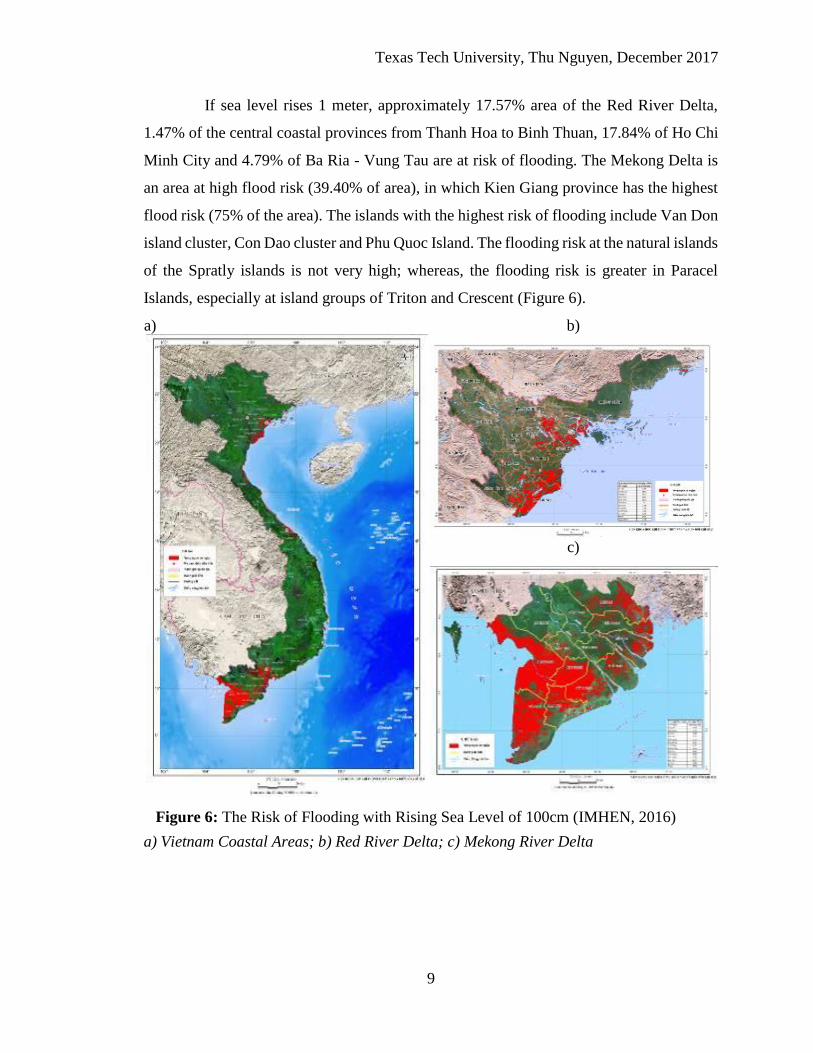
If sea level rises 1 meter, approximately 17.57% area of the Red River Delta,
1.47% of the central coastal provinces from Thanh Hoa to Binh Thuan, 17.84% of Ho Chi
Minh City and 4.79% of Ba Ria - Vung Tau are at risk of flooding. The Mekong Delta is
an area at high flood risk (39.40% of area), in which Kien Giang province has the highest
flood risk (75% of the area). The islands with the highest risk of flooding include Van Don
island cluster, Con Dao cluster and Phu Quoc Island. The flooding risk at the natural islands
of the Spratly islands is not very high; whereas, the flooding risk is greater in Paracel
Islands, especially at island groups of Triton and Crescent (Figure 6).
a)
b)
c)
Figure 6: The Risk of Flooding with Rising Sea Level of 100cm (IMHEN, 2016)
a) Vietnam Coastal Areas; b) Red River Delta; c) Mekong River Delta
Texas Tech University, Thu Nguyen, December 2017
10
2.3 Impacts of Climate Change
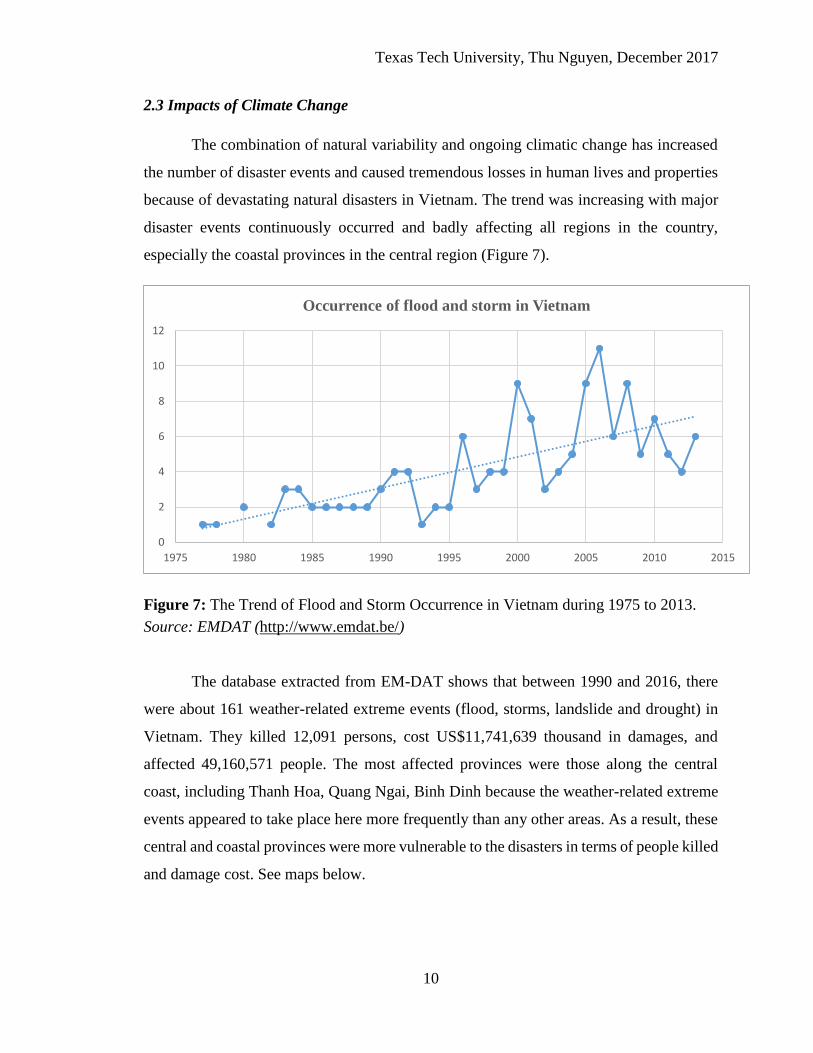
The combination of natural variability and ongoing climatic change has increased
the number of disaster events and caused tremendous losses in human lives and properties
because of devastating natural disasters in Vietnam. The trend was increasing with major
disaster events continuously occurred and badly affecting all regions in the country,
especially the coastal provinces in the central region (Figure 7).
Figure 7: The Trend of Flood and Storm Occurrence in Vietnam during 1975 to 2013.
Source: EMDAT (http://www.emdat.be/)
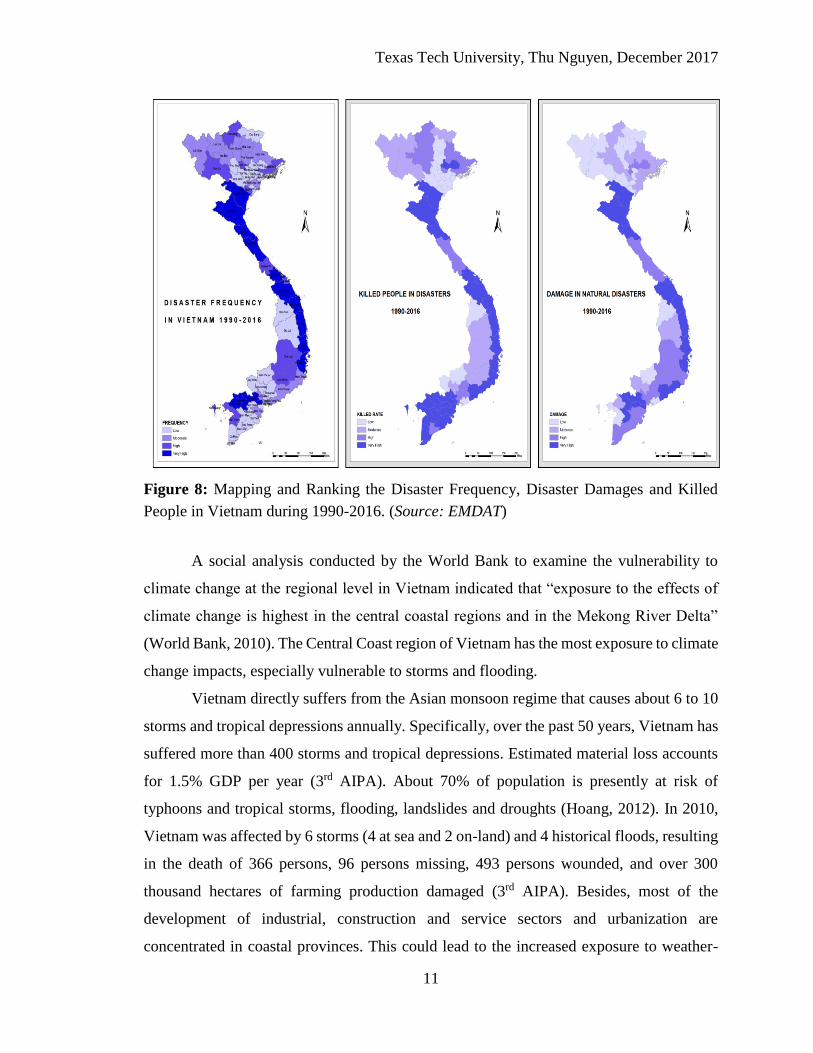
The database extracted from EM-DAT shows that between 1990 and 2016, there
were about 161 weather-related extreme events (flood, storms, landslide and drought) in
Vietnam. They killed 12,091 persons, cost US$11,741,639 thousand in damages, and
affected 49,160,571 people. The most affected provinces were those along the central
coast, including Thanh Hoa, Quang Ngai, Binh Dinh because the weather-related extreme
events appeared to take place here more frequently than any other areas. As a result, these
central and coastal provinces were more vulnerable to the disasters in terms of people killed
and damage cost. See maps below.
0
2
4
6
8
10
12
1975 1980 1985 1990 1995 2000 2005 2010 2015
Occurrence of flood and storm in Vietnam
Texas Tech University, Thu Nguyen, December 2017
11
Figure 8: Mapping and Ranking the Disaster Frequency, Disaster Damages and Killed
People in Vietnam during 1990-2016. (Source: EMDAT)
A social analysis conducted by the World Bank to examine the vulnerability to
climate change at the regional level in Vietnam indicated that “exposure to the effects of
climate change is highest in the central coastal regions and in the Mekong River Delta”
(World Bank, 2010). The Central Coast region of Vietnam has the most exposure to climate
change impacts, especially vulnerable to storms and flooding.
Vietnam directly suffers from the Asian monsoon regime that causes about 6 to 10
storms and tropical depressions annually. Specifically, over the past 50 years, Vietnam has
suffered more than 400 storms and tropical depressions. Estimated material loss accounts
for 1.5% GDP per year (3rd AIPA). About 70% of population is presently at risk of
typhoons and tropical storms, flooding, landslides and droughts (Hoang, 2012). In 2010,
Vietnam was affected by 6 storms (4 at sea and 2 on-land) and 4 historical floods, resulting
in the death of 366 persons, 96 persons missing, 493 persons wounded, and over 300
thousand hectares of farming production damaged (3rd AIPA). Besides, most of the
development of industrial, construction and service sectors and urbanization are
concentrated in coastal provinces. This could lead to the increased exposure to weather-
Texas Tech University, Thu Nguyen, December 2017
12
related risks. Therefore, addressing this increasing complex situation, reduction of disaster
risks and climate change impacts has become one of the most important tasks of Vietnam.
3. Dissertation Objectives
The overall aim of this study is to assess the vulnerability of Thua Thien Hue
province due to coastal flooding from storm surges and projected sea level rise. A series of
scenarios under present and possible future sea level conditions will be considered in this
study to determine the range of potential climate change impacts. To achieve this, the
specific objectives of this study are:
• To develop a clear-cut, applicable and accurate two-dimensional flooding model of
the central coast area in Vietnam. This will be based on the high-resolution process-
based numerical model MIKE 21 FM offered by the Danish Hydraulic Institute
(DHI), including the simulation of tide, wind and spectral wave, and building
parameters for the model.
• To develop a series of inundation scenarios relative to storm surges and sea levels
in the area using numerical model for storm surge simulations and producing
inundation maps through simulating an extreme storm event plus sea level rise.
• To estimate the flooding risks caused by storm surges and sea level rises in the area
using ArcGIS tools through overlaying inundation maps with related inventory
layers.
• To evaluate possible climate change implications in the area by identifying and
analyzing the coastal flooding impacts and possible flood defenses using ArcGIS
tools. To determine the net impact of SLR.
• To contribute to the task of protection and prevention of storm induced coastal
flooding in the SLR condition in the region.
Texas Tech University, Thu Nguyen, December 2017
13
CHAPTER TWO
LITERATURE REVIEW
1. Sea Level Rise
Sea level rise (SLR) has become a serious concern to coastal communities for
several reasons. Higher sea level can bring coastal flooding deeper in-land. The damages
and impacts are much more when the powerful storms and flooding inundate the land. It
can cause erosion, saltwater intrusion, and many other water–related hazards. Moreover,
the coastal lowlands are usually developed areas with dense populations and industrial
sites. Therefore, the potential impacts of SLR are very high.
In the early 21st century, the rate of global sea-level rise was found to be increasing
more sharply than the relatively stable rates of previous years (Church and White, 2011;
Gehrels and Woodworth, 2012; IPCC, 2013). This onset of increased sea-level rise
coincided with increasing global temperature (Kemp et al., 2011). As projected, global sea
level will continue rising in the upcoming centuries, with a mean global increase that could
approach or exceed 1 m by 2100 (IPCC, 2013; Parris et al., 2012). SLR is also expected to
speed up through the 21st century. There are varied projections of global sea level rise. The
Intergovernmental Panel on Climate Change’s (IPCC) Fifth Assessment Report (AR5)
projected a global-average sea level rise of 28 to 61 cm for a scenario of extreme emissions
reductions (RCP 2.6) and 52 to 98 cm for an unmitigated growth of emissions (RCP 8.5)
by 2100. Most experts estimate a higher sea-level rise by 2100 than the IPCC AR5 projects.
For example, most recently, the National Oceanic and Atmospheric Administration
(NOAA) for the U.S. National Climate Assessment projected a mid-range of 0.5 to 1.2 m,
with credible lower and upper limits of 0.2 m and 2.0 m (Parris et al., 2012). Schaeffer et
al. (2012) estimated 2.0 m of global rise from 2000 to 2300 for the low temperature
scenario. The wide range in projected changes in global SLR result from a large uncertainty
that influences projections. The significant uncertainties are identified as including poor
glacier inventory and lack of hypsometric data (Radic et al., 2014), unknown future
greenhouse gas emission rates/uncertain future warming scenarios, incomplete
understanding of ice melt dynamics and possible future changes in ocean circulation
patterns, or the complex processes and feedback mechanisms that cause sea level to rise
Texas Tech University, Thu Nguyen, December 2017
14
(Horton et al., 2014). To deal with this uncertainty most predictions of future sea level rise,
therefore, are given as ranges.
On the other hand, there is a shared agreement that the global sea-level will continue to rise
during the 21st century. Regionally, relative sea level rise at individual areas will vary from
the global average. More specifically, the rise is above the average at low latitudes (in the
Western Pacific and Indian Ocean) and below the average at high latitudes; For instance,
the regional variations are up to 20% higher than the mean along the East Asian coast and
in the Indian Ocean, and up to 30% lower than the mean in mid-latitude Northern America
and Europe (30–500 N) (Perrette et al., 2013). Generally, the densely populated regions
affected by coastal flooding from tropical storms have experienced a rate of SLR close or
greater than the global average (Jonathan et al., 2013).
The different regions may experience varied rise rates and the effects of sea level
rise also vary greatly among countries, even for countries in a same region. The countries
in the region of Southeast Asia would experience the higher end of the projection (Liem,
2008). For Vietnam, the data measured along Vietnam coast shows that sea level rate was
3 mm/year during the period of 1993 and 2008, which is comparable with the global
tendency (Le et al., 2011). Sea level at Hon Dau station increased about 20cm over the past
50 years. There have been some other studies reporting sea level rise in Vietnam.
Historically, UNEP (1993) found the sea levels around Viet Nam rose by 5cm between the
1960s and 1990s and the Hydro-meteorological General Department estimated the
seawater level at an average increased rate of 2 mm per year.
Vietnam is ranked as one of the top five countries the most affected under a 1-meter
SLR. Vietnam's physical geography makes it more vulnerable to sea-level rise than most
countries because of its long coast line (3260 km), threats of coastal hazards such as
typhoons and erosion, and its major population located very close to the two main deltas
of Vietnam, the Red and Mekong Rivers (Narins et al., 2010). Because of geographical
features of deltas in Vietnam and their proximity to high population areas, a 1-meter rise
in the sea level along the coast of Southeast Asia would potentially result in a 5% land loss,
Texas Tech University, Thu Nguyen, December 2017
15
about 11% population displacement, over 10 % of GDP reduced, about 11% of urban areas
and 29% of wetlands affected in Vietnam (Dasgupta, 2007). Also, many other sectors can
be impacted or permanently inundated, including infrastructure (4.3% of national and local
roads permanently inundated), industry (manufacturing in 20 provinces affected),
settlements (2% permanently inundated), forests (8% permanently inundated), water
bodies, and protected areas (36 out of 190 terrestrial protected areas and important national
wetlands affected). The findings show that areas in the Mekong Delta and South-East
Region, where most of the poor concentrated, are the highest vulnerable and affected ones
(Carew-Reid, 2008).
2. Tropical Storm/Storm Surge
At the end of the 21st century, global warming is projected not to lead to an increase
in frequency of tropical cyclones but an increase in stronger storms (Knutson, 2010;
Murakami et al., 2011). The projections for changes in the number of tropical cyclones
range from −6 to −34% globally, with increases in mean tropical cyclone global wind speed
ranging between 2 to 11% (Knutson, 2010). Worldwide, there are annually about 90
tropical cyclones and they are not distributed equally among the various basins (Frank and
Young, 2007). There is a decrease trend for Atlantic hurricanes but an increase trend for
tropical cyclone activity over the Western North Pacific (Landsea et al., 1996). According
to “Unisys Weather”, nearly half of worldwide events are occurring in Western Pacific
Ocean. While about one-fifth of these tropical cyclones make landfall yearly with the
intensity of a hurricane (defined by wind speeds ≥ 33 ms−1), Vietnam gets from two to six
land-falling ones with different categories but huge coastal impacts are caused largely by
this significant subcategory of storms (Weinkle et al., 2012). There is a significant increase
in the frequency for the strongest tropical cyclones (categories 4 and 5) in the western
Pacific over the last three decades noticed (Webster et al., 2005).
However, there is significantly greater uncertainty with respect to how tropical
cyclone activity will differ among regions. Still, not all ocean basins may experience an
increase in tropical cyclone intensity. Uncertainties in model projections of future tropical
cyclone activity are inevitable (Brown et al. 2007; Butler et al. 2012). These uncertainties
arise due to uncertainties in “how the large-scale tropical climate will change and
uncertainties in the implications of these changes for tropical cyclone activity” (Knutson,
Texas Tech University, Thu Nguyen, December 2017
16
2010). Besides, the poor knowledge of the hurricane characteristics (track, wind speed,
forward speed, etc.) and physical parameters and inputs such as bottom friction and
bathymetry are important factors that contribute to the difficulties of an accurate projection
(Thomas, 2015). These uncertainties need to be addressed to increase confidence in
regional and global tropical cyclone projections
The more intense tropical storms are, the more extreme the storm surges they
produce. Severe storm surges are becoming a global hazard, affecting low-lying coastlines
and their communities all over the world. As huge risks, the tropical storm surges cause
coastal inundation which in turns result in a large number of deaths and economic loss for
coastal countries. For instance, the Bhola cyclone surge, which made landfall in
Bangladesh in November of 1970, caused between 300,000 and 500,000 deaths (Murty et
al., 1986). Hurricane Katrina killed at least 1,200 people in Louisiana and Mississippi in
2005 (Blake et al., 2011). Ketsana typhoon resulted in over 400 people in the Philippines,
Vietnam and Cambodia in September 2009 and left about 118.6 million US dollars’ worth
of damages for Philippines and 120 million dollars’ worth for Vietnam (Clark, 2009).
Again, in 2013, the Haiyan Typhoon caused over 6,000 deaths in Philippines (Höllt et al.,
2015).
3. Land subsidence
Enhanced land subsidence together with increased rates of SLR will further
strengthen tropical cyclone flooding. Rapid subsidence is common along populated deltaic
and coastal plain systems, owing to exploitation of groundwater, oil and gas, and reductions
in fluvial sediment supply (Woodruff et al., 2013). Human-induced land subsidence rates
were recorded exceeding an average of 1 cm yr−1 in such megacities as Tokyo, Japan (5 m
of subsidence from 1930 to 1995); Osaka, Japan (2.8 m from 1935 to 1995); Tianjin, China
(3.1 m from 1959 to 2003); Shanghai, China (2.8 m of subsidence between 1921 and 1995);
and Manila, Philippines (>1 m of subsidence among 1991 and 2003) (Nicholls, 1995 &
Rodolfo, 2006). It is estimated that by 2100 half of Shanghai being flooded by extreme
storm-water levels due to additional land subsidence along the Yangtze River delta plus a
4.3 m projected relative rise in sea level (Rodolfo, 2006). These assumptions do not take
any countermeasures to alleviate artificial causes of land subsidence.
Texas Tech University, Thu Nguyen, December 2017
17
In Vietnam, land subsidence is also a significant factor compounded by the threat
of SLR contributing to enhancing tropical storm flooding impacts. Increases in tropical
cyclone flooding impacts are projected at the Red River Delta where SLR rates are
expected to significantly exceed the global average and speedy rates of land subsidence is
occurring (Neumann, 2012).
Major land subsidence in two main deltas of Vietnam, the Red River and Mekong
River ones, is contributing to posing a flood inundation hazard to its coastal communities
and infrastructure. While groundwater exploitation is identified as a major cause of land
subsidence in the Mekong River Delta (Erban et al., 2014); rapid urbanization, including
population growth, the increase of built-up surfaces and the type of building foundation,
increased natural resource demand, and even limited underground pumping withdrawal
capacity, is considered as a severely destructive root to land subsidence in Red River (Dang
et al., 2014).
So far, there have not been many studies of land subsidence in Vietnam, especially
no research of land subsidence rates in the central coastline can be found. It seems hardly
to find any database of land subsidence rates in Vietnam; therefore, this paper will exclude
land subsidence factor in determining coastal flooding impacts in the region. Future papers
are expected to give a light to the issues.
4. Coastal Flooding
Today, coastal flooding due to sea-level rise combined with storm surge and
shoreline subsidence is severely influencing coastal communities. In all the regions they
affect, tropical storms are usually the primary factor that can cause devastating coastal
floods. Once big tropical storms come further in-land, they bring along strong wind, heavy
rainfall, and extreme storm surges, which cause a large-scale coastal inundation. Coastal
population are becoming more prone to extreme flooding from tropical cyclones (Peduzzi
et al., 2012).
Coastal flooding related to land-falling tropical cyclones depends mainly on two
factors: the likelihood of tropical cyclone occurrence and relative sea level (Woodruff et
Texas Tech University, Thu Nguyen, December 2017
18
al., 2013). Therefore, accurate predictions of future flood risk must take two factors
together into consideration. Many studies have suggested that coastal water levels are
comparable to storms with SLRs. Instead of different SLR rates, storm intensity, and time
among studies, the overall agreement is an increase in future flood levels. Besides,
regardless of uncertainty in projections of tropical cyclones, future coastal flooding from
tropical cyclones is expected to increase because of accelerated sea level rise (Woodruff et
al., 2013).
Vietnam is becoming more vulnerable to the impact of changing climate and
frequent disasters, namely flooding, owing to its geographical location and long densely
populated coastline. Every year, Vietnam suffers directly from 6 to 10 storms and tropical
depressions often occurring from June to November (Razafindrabe et al., 2014). Those
frequently strike the central and northern parts of Vietnam with strong wind, heavy rain
and extreme floods during September and October (SRV 2004). Flooding is a normal
occurrence in many regions of Vietnam, and its severity has recently escalated because the
conditions inducing flooding are intensifying, at both the local and global levels. During
1989 to 2010, flood is the most reported event in the historical disaster database with 48%
of the total record of all types of disasters, and accounts for 67% of deaths, the most deaths
of all (Nhu et al., 2011). There is significant evidence showing the importance of damages
and loss in various parts of Vietnam due to flooding. The heaviest casualties recorded in
the country were caused by the 1999 floods, which killed some 750 people (Clark, 2009)
and resulted in a damage worth of more than 3,773 billion VND (approx. US $194 million);
whereas, typhoons Xangsane and Durian both left at least 70 dead in 2006 (Clark, 2009).
Instead, Ketsana 2009 was considered as the worst disaster to hit the central region of
Vietnam. It left 163 people dead and 11 people missing and led to an economic loss
evaluated at US $785 million. More than 17,000 houses were devastated and about 4,000
classrooms scratched. There were 10 provinces affected and some 200,000 hectares of
cropland destroyed (Clark, 2009). As a result, flooding remains one of the major water-
related disaster risks in Vietnam.
5. Vertical uncertainty in elevation-based SLR assessment
Over the last three decades, there have been many studies conducted on the effects
of sea level rise using the elevation data, most often in the form of digital elevation models
Texas Tech University, Thu Nguyen, December 2017
19
(DEMs) (Dasgupta et al., 2009, 2011; Hereher, 2010; Neumann et al., 2010; Lichter et al.,
2011; Nicholls et al., 2011; Zhang et al., 2011; Curtis and Schneider, 2011). However,
elevation data are identified as the main source of uncertainty due to varied measuring
techniques, measuring methods and the different technologies. It is much more uncertain
for elevation-based sea level rise assessment when it is combined with other variable
sources including “water-level data (from long-term tide gages), the mathematically
modeled tidal datum to which water levels are referenced vertically, and sea level trends
or projections” (Gesch, 2013). Despite the fact, insufficient studies have scrutinized the
effects of elevation uncertainty on the sea level rise assessment. Usually, it is easy and
simple to map the water level on a coastal DEM to identify the vulnerability of land and its
consistent resources; however, the reliable findings and the usefulness of the elevation-
based assessment will be suspicious due to the uncertainty of the coastal topography
mapped (Gesch, 2013). Therefore, some recent studies have emphasized the importance in
the qualities of underlying DEMs as well as the understanding and properly applying of
those DEMs in impact assessment of climate change (NOAA, 2010; Gesch, 2009; Gesch
et al., 2009).
There are few ways to deal with the vertical uncertainty on elevation-based sea
level rise vulnerability analysis. For different errors, there are different ways. Particularly,
“the uncertainty in sea level trend or projections can be handled by mapping and analyzing
a range of increased water levels that result from climate model simulations” as was done
in IPCC assessment report (Gesch, 2013). The error associated with water-level data could
be lessened if “the local water level information can be included” (Marbaix and Nicholls,
2007; Poulter and Halpin, 2007 as cited in Gesch, 2013). For detailed sea-level rise
assessment, Leatherman (2001) suggested, “DEMs should be referenced to the mean high
water (MHW) datum to distinguish the areas occasionally inundated by tides (as cited in
Gesch, 2013). Some other studies employ varied high-resolution datasets to compare or
calculate the standard errors for accuracy assessment (Gesch, 2014). Besides, it is well
known that elevation errors are best controlled using a geospatial model named regression-
kriging and sequential Gaussian simulation in ArcGIS. These tools allow the consideration
of spatial correlation in elevation errors, “which has a significant impact on spatial-
interaction analyses, such as inundation modelling” (Leon et al., 2014).
Texas Tech University, Thu Nguyen, December 2017
20
6. Reliability of MIKE 21 FM model in inundation modeling
MIKE 21 FLOW MODEL or Flexible Mesh (FM) by Danish Hydraulic Institute
(DHI) is a 2D hydrodynamic modeling using flexible mesh bathymetry. The application of
MIKE 21 includes such modules as MIKE 21FM HD (Hydrodynamic), MIKE 21 SW
(Spectral Wave), MIKE 21 NSW (Near shore Spectral Wave), MIKE 21 FM Tidal, MIKE
21 Toolbox. The typical application fields of MIKE 21 FM includes assessment of
hydrographical conditions in non-stratified waters, coastal flooding and storm surge, inland
flooding and overflow, forecast and warning systems. The hydrodynamic module of MIKE
21 FM simulates unsteady flow considering bathymetry, sources and external forcing. This
model permits spatial varying resolution, so that the complex tidal channels and local
topographic features that may influence the tidal and wave dynamics can be sufficiently
resolved (DHI, 2016).
The application of MIKE 21 in flooding inundation modeling is popular worldwide.
Specifically, Madsen and Jakobsen (2004) took advantages of a two-dimensional
hydrodynamic model MIKE 21 in replicating the sea-level rise combined with the 1991
Bangladesh storm surge. Kumar et al. (2008) employed the MIKE 21 model to run
simulations of storm surge in the case of the severe cyclone of November 1989 for the
Andaman Islands in the Indian Ocean. Similarly, Kuang et al., (2014) applied MIKE 21
model in mapping impacts of potential future sea-level rise at the Yangtze River Estuary.
Moreover, Wang et al., (2012) suggested the use of MIKE 21 in evaluating the combined
effects of sea level rise, land subsidence, and storm surges on the coastal areas of
Shanghai, China. Additionally, MIKE 21 is also combined with ArcGIS to develop an
integrated methodology for flood prediction in Eskilstuna community, Sweden (Yang
&Rystedt, 2002).
In addition to the reliability of the MIKE 21 model, it is considered as the most
accessible and applicable because it is spreading and training around the world. Presently,
DHI has offices in more than 30 countries, where they are providing training at-site and
online locally in the various native languages (DHI, 2016). In addition, they provide
updated software and technical support. In Vietnam, MIKE 21 FM is widely used in
modeling flooding inundation in the Central Institutions and even by JICA projects.
Texas Tech University, Thu Nguyen, December 2017
21
Because of its popularity and reliability, I use MIKE 21 models to simulate the
combined effect of a disaster chain of sea level rise and storm surge on a coastal area of
Thua Thien Hue province in Central region of Vietnam for this paper.
7. Justification
The study aims to assess the vulnerability of population and infrastructure along
Vietnam’s central coast due to tropical storm flooding in sea-level rise conditions. The
importance of the study is justified by following main reasons:
Vietnam is ranked as one of the top five countries most affected by a 1-meter SLR and its
long coast line makes it more vulnerable to sea-level rise than most countries (Narins et
al., 2010). The relative rates of SLR in Vietnam are expected to significantly exceed the
global average and the enhanced rates of SLR will further intensify tropical cyclones and
coastal flooding and can cause substantial increases in their impacts in the regions they
affect (Woodruff et al., 2013). Central Vietnam with its topography (skinny strip of land
exposed to open ocean) is considered as the most susceptible part to the impacts of sea
level rise, tropical storms, and coastal flooding.
Tropical storm-induced flooding occurrence is normal in many regions of
Vietnam, but those which are extreme, with water levels equivalent to or exceeding historic
flood levels have recently been striking more frequently and are particularly destructive in
the central provinces in Vietnam (Oanh et al., 2011 & SRV 2004). The illustrations are
Xangsane occurring in Ha Tinh and Thua Thien Hue provinces in 2006; and, Ketsana
affecting Da Nang, Quang Ngai, and Binh Dinh provinces in 2009 (EM-DAT database).
Those storms were considered as the worst ones to hit Vietnam and left overwhelming
devastating damage.
There is significant evidence showing the importance of loss and damages in
central Vietnam due to coastal flooding. Among all types of disasters during 1989 to 2010,
according to a preliminary analysis of flood and storm disaster data in Viet Nam, increased
flood severity accounts for the largest share of the total record, followed by hailstorm,
storm, flash flood, and tropical cyclone. These four disasters, together with flood are
Texas Tech University, Thu Nguyen, December 2017
22
responsible for nearly 90% of loss of life in the country (Oanh et al., 2011). However, most
of the loss and damages are concentrated in the central provinces. Again, according the
above analysis and over the same period of time, Quang Ngai province has the highest
number of deaths (924) caused by those disasters and Thua Thien Hue province has the
second highest number of fatalities (572). Whereas, the provinces with the most houses
destroyed and damaged are Quang Binh (331,055 houses), Thanh Hoa (103,646 houses),
and Ha Tinh (96,172 houses) (Oanh et al., 2011).
Central Vietnam is considered the most exposed to the effects of climate change
(World Bank, 2010). Its coastal provinces are becoming more prone to the impact of
changing climate and frequent disasters, mostly storms and floods, due to not only its
physical geography but also its major densely populated and developing location. Central
Vietnam with its one third of the 90 million Vietnamese people serves as “a real strategic
backbone” in land and culture. Central Vietnam is not only famous for beautiful beaches
and ancient towns like Hoi An and Hue, which is recognized by as World Heritage Site by
UNESCO but also well known by linked industrial clusters and very convenient
transportation including airports, ports and railways. These all are attracting investment
and development in the region. Central Vietnam also has heard by its first major oil refinery
in Vietnam, Dung Quat and IT industries. The region is developing much faster than the
other two metro regions of Vietnam and most of the development is happening along its
coastal lowland range. This makes Central Vietnam more vulnerable to enhanced tropical
storm flooding due to the sea level rise because the region might suffer more in term of lost
human lives, property, and economy.
Texas Tech University, Thu Nguyen, December 2017
23
CHAPTER THREE
STUDY AREA
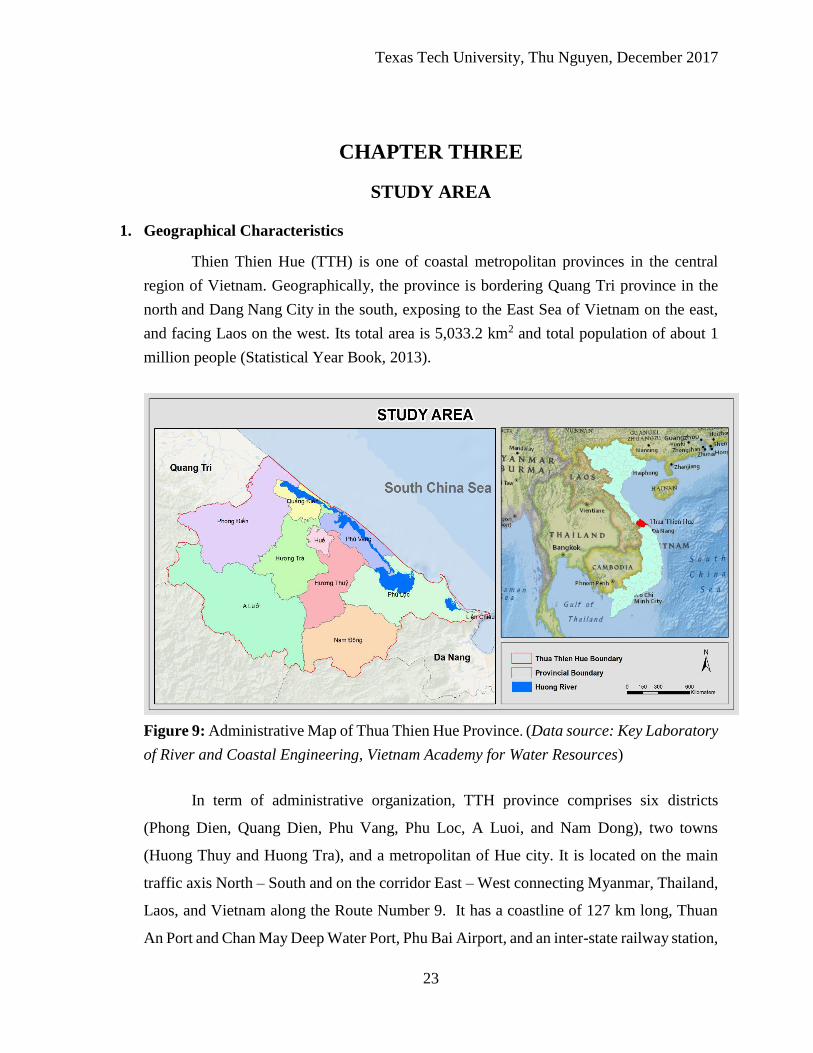
1. Geographical Characteristics
Thien Thien Hue (TTH) is one of coastal metropolitan provinces in the central
region of Vietnam. Geographically, the province is bordering Quang Tri province in the
north and Dang Nang City in the south, exposing to the East Sea of Vietnam on the east,
and facing Laos on the west. Its total area is 5,033.2 km2 and total population of about 1
million people (Statistical Year Book, 2013).
Figure 9: Administrative Map of Thua Thien Hue Province. (Data source: Key Laboratory
of River and Coastal Engineering, Vietnam Academy for Water Resources)
In term of administrative organization, TTH province comprises six districts
(Phong Dien, Quang Dien, Phu Vang, Phu Loc, A Luoi, and Nam Dong), two towns
(Huong Thuy and Huong Tra), and a metropolitan of Hue city. It is located on the main
traffic axis North – South and on the corridor East – West connecting Myanmar, Thailand,
Laos, and Vietnam along the Route Number 9. It has a coastline of 127 km long, Thuan
An Port and Chan May Deep Water Port, Phu Bai Airport, and an inter-state railway station,
Texas Tech University, Thu Nguyen, December 2017
24
all of which are very supportive for the development of industry, commerce, and services
in the central as well as in highland region. Because of its opportune position, TTH is
determined as one of the central key economic and tourist zones in the region (TTHPPC,
2005).
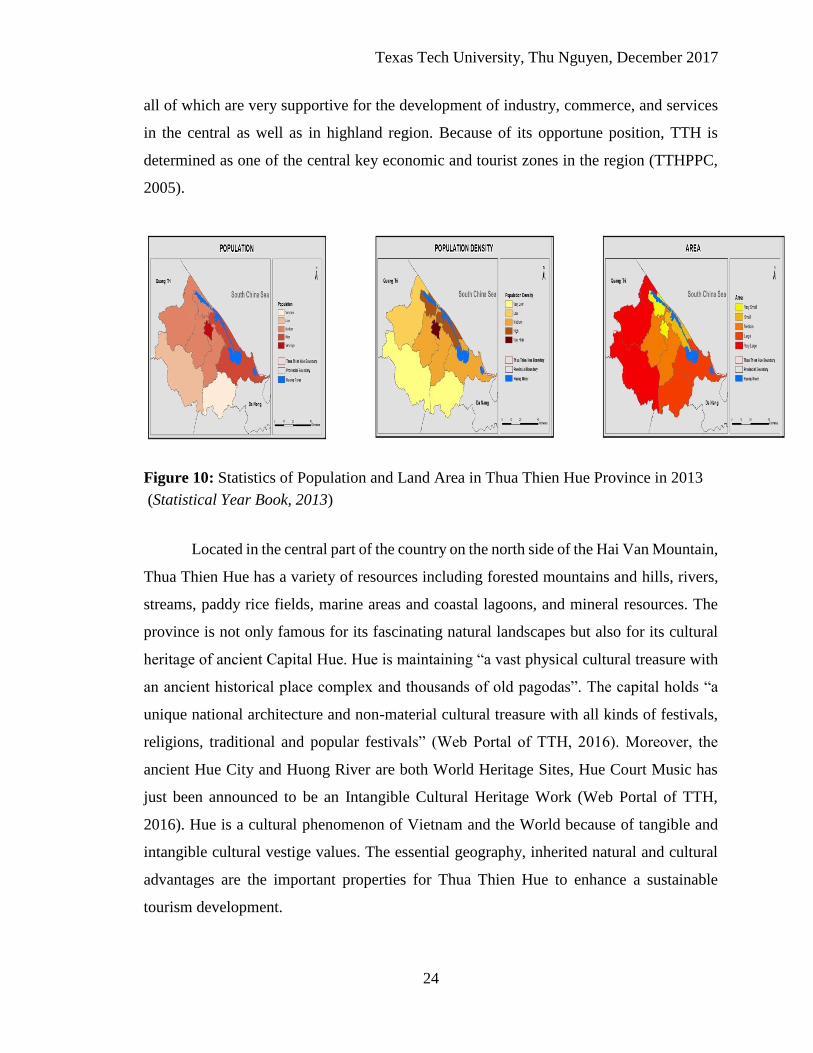
Figure 10: Statistics of Population and Land Area in Thua Thien Hue Province in 2013
(Statistical Year Book, 2013)
Located in the central part of the country on the north side of the Hai Van Mountain,
Thua Thien Hue has a variety of resources including forested mountains and hills, rivers,
streams, paddy rice fields, marine areas and coastal lagoons, and mineral resources. The
province is not only famous for its fascinating natural landscapes but also for its cultural
heritage of ancient Capital Hue. Hue is maintaining “a vast physical cultural treasure with
an ancient historical place complex and thousands of old pagodas”. The capital holds “a
unique national architecture and non-material cultural treasure with all kinds of festivals,
religions, traditional and popular festivals” (Web Portal of TTH, 2016). Moreover, the
ancient Hue City and Huong River are both World Heritage Sites, Hue Court Music has
just been announced to be an Intangible Cultural Heritage Work (Web Portal of TTH,
2016). Hue is a cultural phenomenon of Vietnam and the World because of tangible and
intangible cultural vestige values. The essential geography, inherited natural and cultural
advantages are the important properties for Thua Thien Hue to enhance a sustainable
tourism development.
Texas Tech University, Thu Nguyen, December 2017
25
Thua Thien Hue position is in the monsoon tropical climate and it has distinct dry
and wet seasons, with the annual average temperature of about 25 – 260C. During the dry
season, the lengthy low rainfall causes salinity that badly affects agriculture, lagoon
ecology and aquatic resources and interrupts ecosystems upstream. The wet season follows
the dry one with very intense rainfall, which usually comes with typhoon, and storms and
causes devastating floods. The highest rainfall on record measured in the Huong River
Basin is 731 mm daily, 2.4 mm monthly and 5.9 mm annually (Ngu et al., 2004).
2. Disaster context and their impacts in Thua Thien Hue
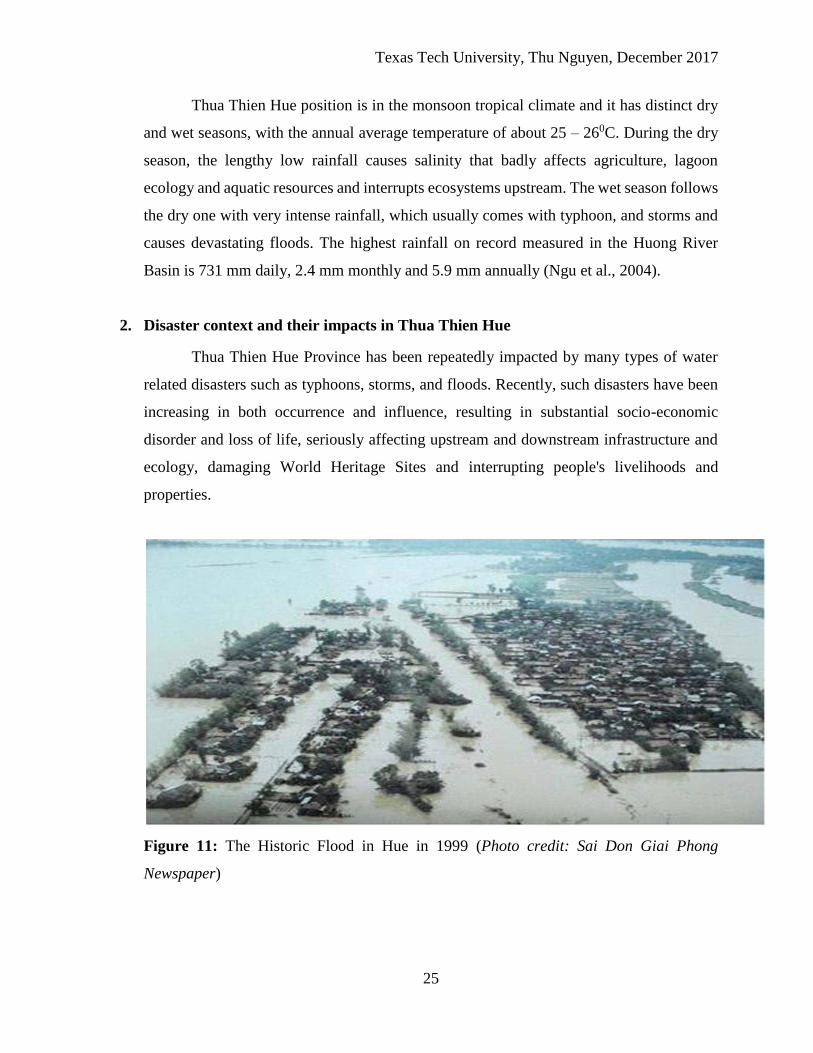
Thua Thien Hue Province has been repeatedly impacted by many types of water
related disasters such as typhoons, storms, and floods. Recently, such disasters have been
increasing in both occurrence and influence, resulting in substantial socio-economic
disorder and loss of life, seriously affecting upstream and downstream infrastructure and
ecology, damaging World Heritage Sites and interrupting people's livelihoods and
properties.
Figure 11: The Historic Flood in Hue in 1999 (Photo credit: Sai Don Giai Phong
Newspaper)
Texas Tech University, Thu Nguyen, December 2017
26
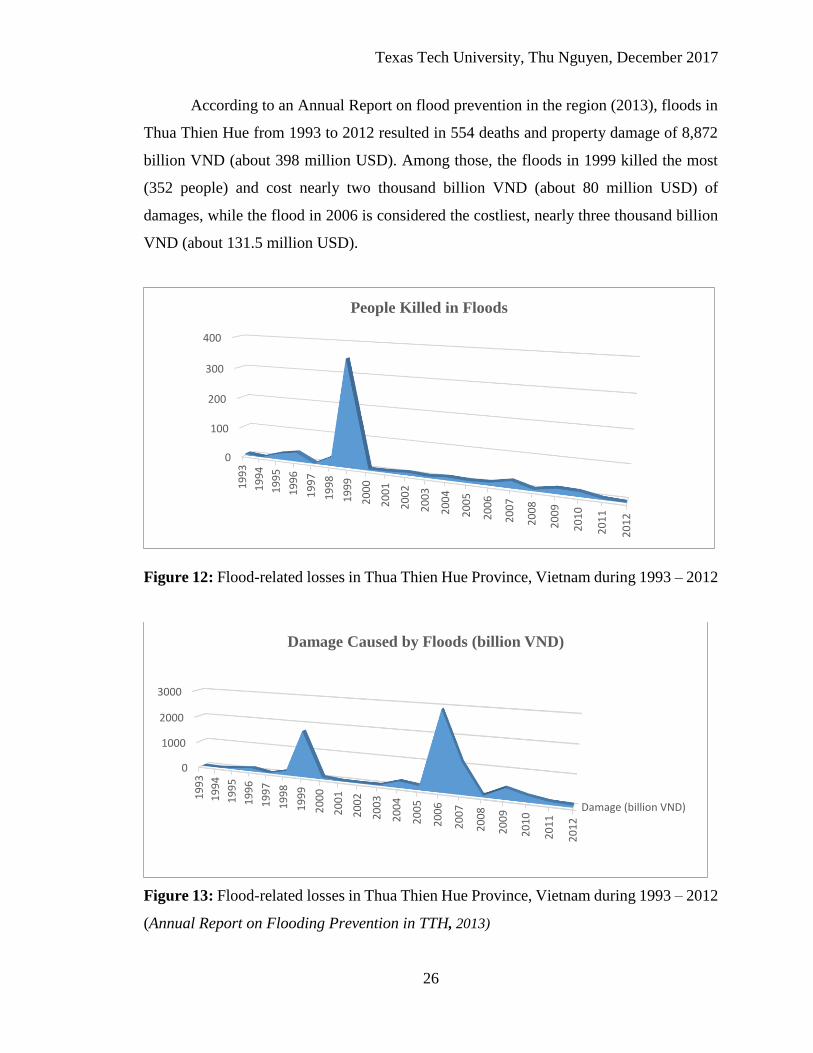
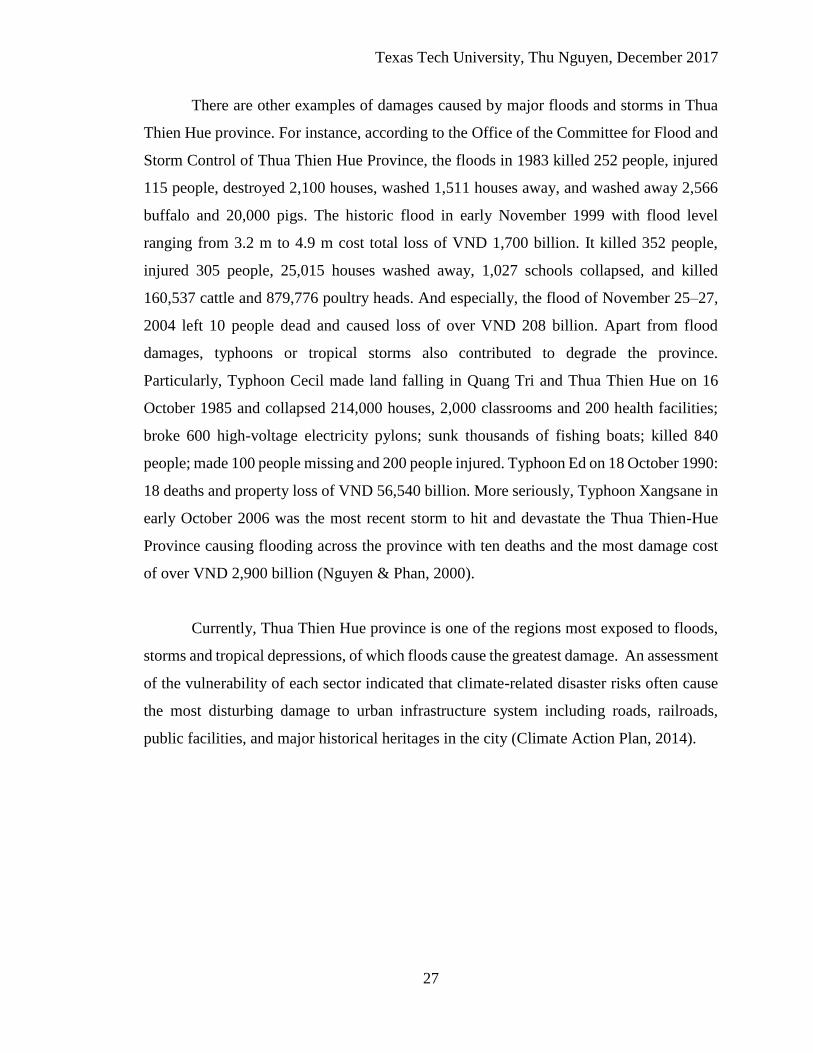
According to an Annual Report on flood prevention in the region (2013), floods in
Thua Thien Hue from 1993 to 2012 resulted in 554 deaths and property damage of 8,872
billion VND (about 398 million USD). Among those, the floods in 1999 killed the most
(352 people) and cost nearly two thousand billion VND (about 80 million USD) of
damages, while the flood in 2006 is considered the costliest, nearly three thousand billion
VND (about 131.5 million USD).
Figure 12: Flood-related losses in Thua Thien Hue Province, Vietnam during 1993 – 2012
Figure 13: Flood-related losses in Thua Thien Hue Province, Vietnam during 1993 – 2012
(Annual Report on Flooding Prevention in TTH, 2013)
0
100
200
300
400
19
93
19
94
19
95
19
96
19
97
19
98
19
99
20
00
20
01
20
02
20
03
20
04
20
05
20
06
20
07
20
08
20
09
20
10
20
11
20
12
People Killed in Floods
Damage (billion VND)
0
1000
2000
3000
19
93
19
94
19
95
19
96
19
97
19
98
19
99
20
00
20
01
20
02
20
03
20
04
20
05
20
06
20
07
20
08
20
09
20
10
20
11
20
12
Damage Caused by Floods (billion VND)
Texas Tech University, Thu Nguyen, December 2017
27
There are other examples of damages caused by major floods and storms in Thua
Thien Hue province. For instance, according to the Office of the Committee for Flood and
Storm Control of Thua Thien Hue Province, the floods in 1983 killed 252 people, injured
115 people, destroyed 2,100 houses, washed 1,511 houses away, and washed away 2,566
buffalo and 20,000 pigs. The historic flood in early November 1999 with flood level
ranging from 3.2 m to 4.9 m cost total loss of VND 1,700 billion. It killed 352 people,
injured 305 people, 25,015 houses washed away, 1,027 schools collapsed, and killed
160,537 cattle and 879,776 poultry heads. And especially, the flood of November 25–27,
2004 left 10 people dead and caused loss of over VND 208 billion. Apart from flood
damages, typhoons or tropical storms also contributed to degrade the province.
Particularly, Typhoon Cecil made land falling in Quang Tri and Thua Thien Hue on 16
October 1985 and collapsed 214,000 houses, 2,000 classrooms and 200 health facilities;
broke 600 high-voltage electricity pylons; sunk thousands of fishing boats; killed 840
people; made 100 people missing and 200 people injured. Typhoon Ed on 18 October 1990:
18 deaths and property loss of VND 56,540 billion. More seriously, Typhoon Xangsane in
early October 2006 was the most recent storm to hit and devastate the Thua Thien-Hue
Province causing flooding across the province with ten deaths and the most damage cost
of over VND 2,900 billion (Nguyen & Phan, 2000).
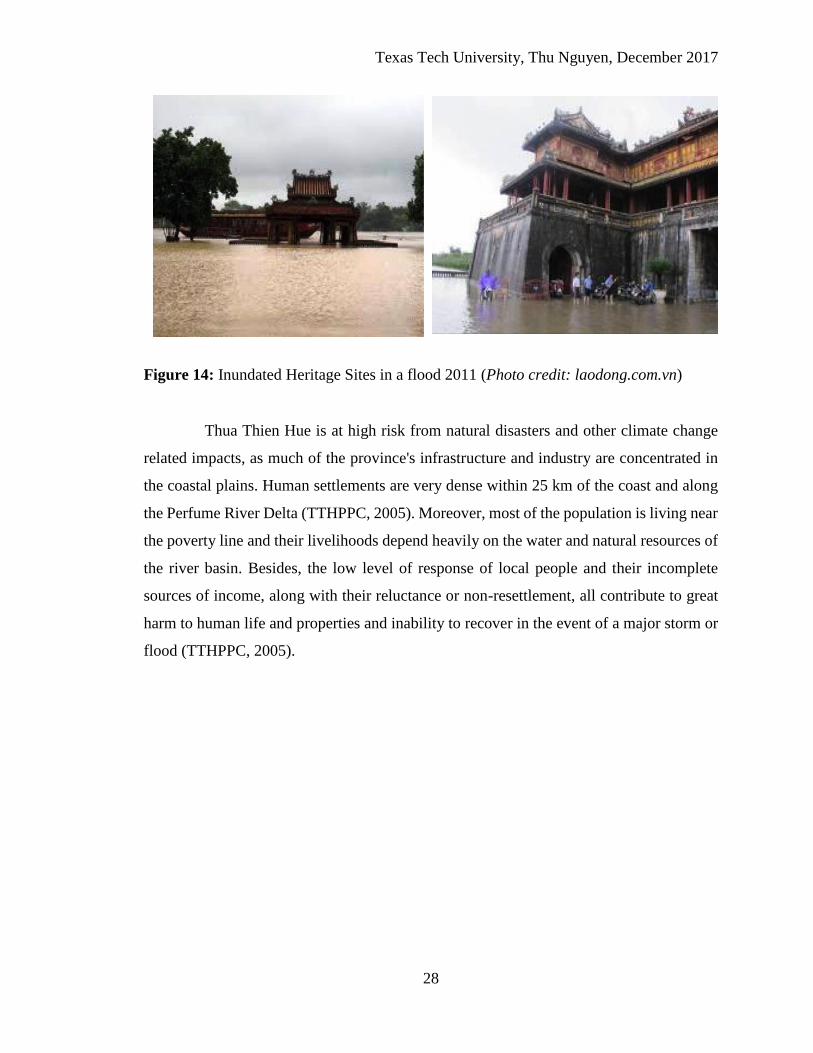
Currently, Thua Thien Hue province is one of the regions most exposed to floods,
storms and tropical depressions, of which floods cause the greatest damage. An assessment
of the vulnerability of each sector indicated that climate-related disaster risks often cause
the most disturbing damage to urban infrastructure system including roads, railroads,
public facilities, and major historical heritages in the city (Climate Action Plan, 2014).
Texas Tech University, Thu Nguyen, December 2017
28
Figure 14: Inundated Heritage Sites in a flood 2011 (Photo credit: laodong.com.vn)
Thua Thien Hue is at high risk from natural disasters and other climate change
related impacts, as much of the province's infrastructure and industry are concentrated in
the coastal plains. Human settlements are very dense within 25 km of the coast and along
the Perfume River Delta (TTHPPC, 2005). Moreover, most of the population is living near
the poverty line and their livelihoods depend heavily on the water and natural resources of
the river basin. Besides, the low level of response of local people and their incomplete
sources of income, along with their reluctance or non-resettlement, all contribute to great
harm to human life and properties and inability to recover in the event of a major storm or
flood (TTHPPC, 2005).
Texas Tech University, Thu Nguyen, December 2017
29
CHAPTER FOUR
METHODOLOGY
There are a several studies which investigate the combined impacts of storm surge
induced coastal flooding, sea level rise, and land subsidence in Southeast Asia. They have
been exploring different aspects of the problem. For example, recently Chen & Liu (2016)
have used a semi-implicit Eulerian–Lagrangian Finite-Element (SELFE) model, which is
a three-dimensional hydrodynamic model developed at the Center for Coastal Margin
Observation and Prediction as an open source community model. They revised and
employed SELFE to calculate the storm surge and the potential inundation areas in the
southern coast of Taiwan. Another related study on the combined effects of three
phenomena of sea level rise, land subsidence, and storm tides employed “an established
diffusion-based flood inundation model” (FloodMap), which combined a 1D river flow
model and a 2D floodplain flow model to simulate the flood process and produce flood
potential maps for the Huangpu River in Shanghai, China (Yin et al., 2013). Others used
different types of software for inundation simulation, including GeoCA-Urban software
package applied for China (Yin et al., 2011), MWH Soft model (formerly Wallingford
software) combined with InforWorks River Simulation, which involves ArcGIS software,
implemented for Malaysia (Mah et al., 2011), or ArcGIS software only employed for
coastal inundation due to sea level rise in Indonesia (Marfai & King, 2008).
There are not many studies related to this topic for Vietnam. Searching for existing
literature, I could find very few related studies done recently and most of them took
advantage of ArcGIS software for their study methods. For instance, Isaac Boateng (2012)
applied ArcGIS to assess the coastal vulnerability to climate change in Vietnam. Similarly,
Nguyen & Woodroffe (2015) also integrated ArcGIS to determine the vulnerability to sea
level rise in the Mekong Delta in Vietnam. Other studies also used ArcGIS to “map impacts
upon agriculture from extreme floods” in Central Vietnam (Chau et al., 2013), or even
ArcGIS raster model to simulate the flood in Perfume River Basin, Thua Thien Hue
province, Vietnam (Villegas, 2004). One study of storm surge impacts on population for
Red River Delta in the North applied the Sea, Lake, and Overland Surges from Hurricanes
Texas Tech University, Thu Nguyen, December 2017
30
(SLOSH) model used by the National Weather Service (NWS) to define the maximum
surges (Neumann et al., 2012). Another study on climate change impact on flood hazard in
the Mekong Delta used a 1D hydrodynamic model named MIKE 11 to simulate a flood
event (Dinh et al., 2012). For some reason, it is hard to find any related studies in which
they could use some applicable numerical models in their research methods. It seems that
ArcGIS is more popular for the researchers to conduct their studies in Vietnam.
In this research, a new research method is developed, a combination of a
hydrodynamic model and ArcGIS software. The model named MIKE 21 FM is coupled
with ArcGIS tools to simulate storm surge corresponding to the historical Xangsane storm
that occurred in 2006 with different storm tracks to demonstrate the inundation areas. More
importantly, the availability of data also contributes to my making decision of research area
of Thua Thien Hue province. I hope that my study will make significant contributions to
providing the awareness of the importance of sea level rise, tropical storms, storm surges
and coastal flooding impacts in the region as well as help reduce the damages, limit the
loss of lives and property caused by them, and facilitate social economic development in
the region.
1. Data Sets and Pre-Processing
There are generally two main types of data sets used in this study: spatial and non-
spatial ones. Spatial data are digital elevation model (DEM), XYZ elevation text files,
bathymetry shape files, coastline digitalized shape file, and property shape files with value
attributes (transportation infrastructure layers). Non-spatial data include population figures
created from Statistical Year Book issued in 2014 and historical weather data. Most of the
data sets are available in many different sources and they must be edited and preprocessed
before they can be used as inputs for the hydrological modeling and for analysis using
ArcGIS software.
Texas Tech University, Thu Nguyen, December 2017
31
Table 2: Summary of original data and their sources
Coverage
Name
Format Source
NGA SRTM 1
arcsec
Raster Global Data Explorer at https://gdex.cr.usgs.gov/gdex/
Data available from the U.S. Geological Survey. See
USGS Visual Identity System Guidance (link is
external) for further details.
SRTM15_PLUS Raster
National Oceanic and Atmospheric Administration at
https://www.ngdc.noaa.gov/mgg/announcements/annou
nce_predict.html
In-land
topography
(10K)
XYZ files Key Laboratory of River and Coastal Engineering,
Vietnam Academy for Water Resources
Nearshore
topography
Shape
files
Vietnam Ocean Data and Information Center at
http://vodic.vn/trang-chu-vi.aspx
Provincial
coastline
KML file Google Earth Pro
Population Figure Created from Statistic Book 2014
Transportation
Infrastructure
Shape file Downloaded from https://gis.thuathienhue.gov.vn/
Historical tidal
data
Text Key Laboratory of River and Coastal Engineering,
Vietnam Academy for Water Resources.
Historical
Xangsane data
Text http://www.solar.ifa.hawaii.edu/Tropical/tropical.html
http://www.jma.go.jp/jma/jma-eng/jma-center/rsmc-
hp-pub-eg/trackarchives.html
http://weather.unisys.com/hurricane/w_pacific/2006H/i
ndex.php
1.1 Data sets for MIKE 21 FM modeling
The Shuttle Radar Topography Mission (SRTM) 1 arc second is global elevation
bathymetric data that provide worldwide coverage of void filled data at a resolution of 1
Texas Tech University, Thu Nguyen, December 2017
32
arc-second (30 meters) and offer open distribution of this high resolution global data set.
The National Geospatial Intelligence Agency (NGA) worked with the National
Aeronautics and Space Administration (NASA) to secure the radar data to generate the first
near-global set of land elevations. The SRTM 1 Arc-Second Global (30 meters) data set
released 2014 (USGS, 2015). The data for the study area is downloaded for vertical
accuracy assessment. For use in the hydrodynamic model, the data must be re-processed
using ArcGIS tools. After downloaded, the SRTM raster data firstly is re-projected to have
the same projection with the original topography data. The SRTM raster layer is clipped to
match with the original studied layer. It is then processed and transformed to be fit in the
hydrodynamic modelling. The SRTM dataset is used for vertical accuracy assessment
beside to another national dataset collected inside the country of Vietnam.
SRTM15_PLUS is further ocean data obtained from National Oceanic and
Atmospheric Administration (NOAA), National Centers for Environmental Information,
and from the website of Satellite Geodesy, Scripps Institution of Oceanography, University
of California San Diego. This is a new global bathymetry data at 15 arc second resolution
for resolving seafloor fabric named SRTM15_PLUS. This SRTM15_PLUS provides the
foundational bathymetry layer for Google Earth. This data is used in the hydrodynamic
model for creating waves and surges when the simulated storm is forming.
The national in-land topography elevation dataset is xyz data type. Under the fund
of the National Target Program to Respond to Climate Change, the elevation points were
extracted and digitized from the topographic map contours with the scale of 1/10,000
(10K). The data later was calibrated with some observed elevation points by Japan
International Cooperation Agency (JICA) to serve for a project named “Building Disaster
Resilient Societies in Central Region in Vietnam”. This data is also used to simulate and
built flood hazard maps in other JICA projects (Figure 15)
The nearshore topography data (Figure 15) is provided by Vietnam Ocean Data and
Information Center after face to face meetings and ID verification. The bathymetry data is
collected with the scale 1/50,000 and sea level of about 30km deep. The methods and the
technology used in achieving data is not revealed by provider.
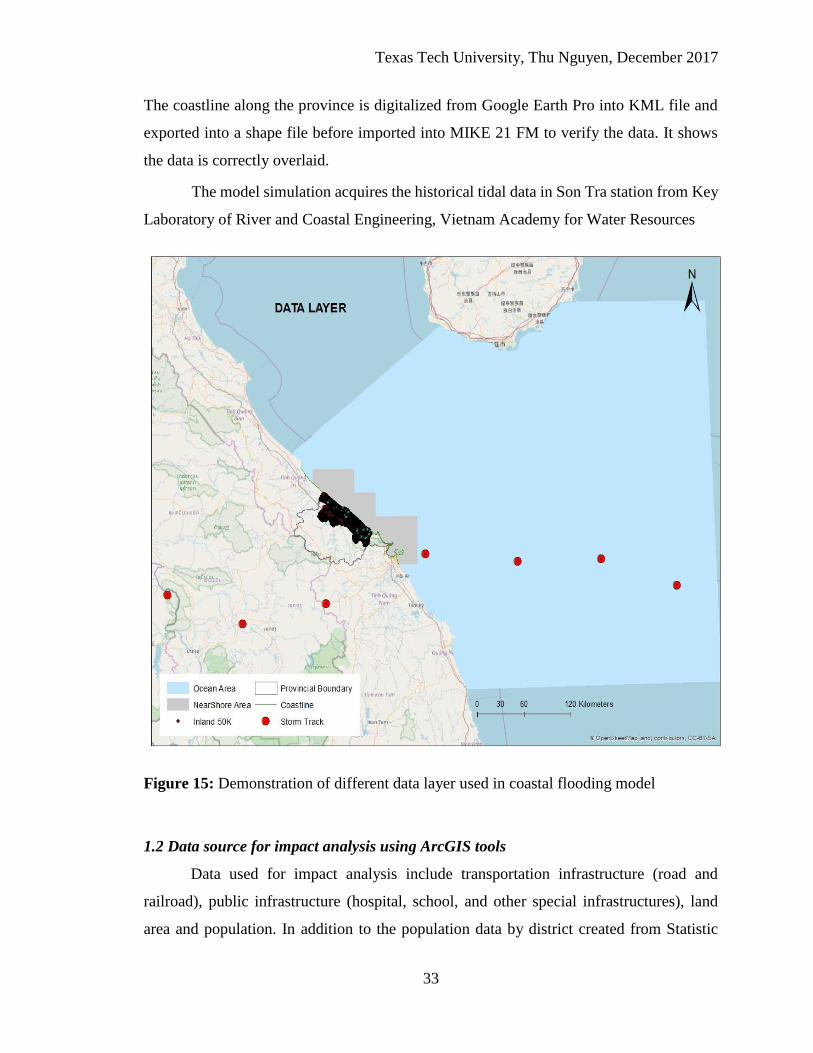
Texas Tech University, Thu Nguyen, December 2017
33
The coastline along the province is digitalized from Google Earth Pro into KML file and
exported into a shape file before imported into MIKE 21 FM to verify the data. It shows
the data is correctly overlaid.
The model simulation acquires the historical tidal data in Son Tra station from Key
Laboratory of River and Coastal Engineering, Vietnam Academy for Water Resources
Figure 15: Demonstration of different data layer used in coastal flooding model
1.2 Data source for impact analysis using ArcGIS tools
Data used for impact analysis include transportation infrastructure (road and
railroad), public infrastructure (hospital, school, and other special infrastructures), land
area and population. In addition to the population data by district created from Statistic
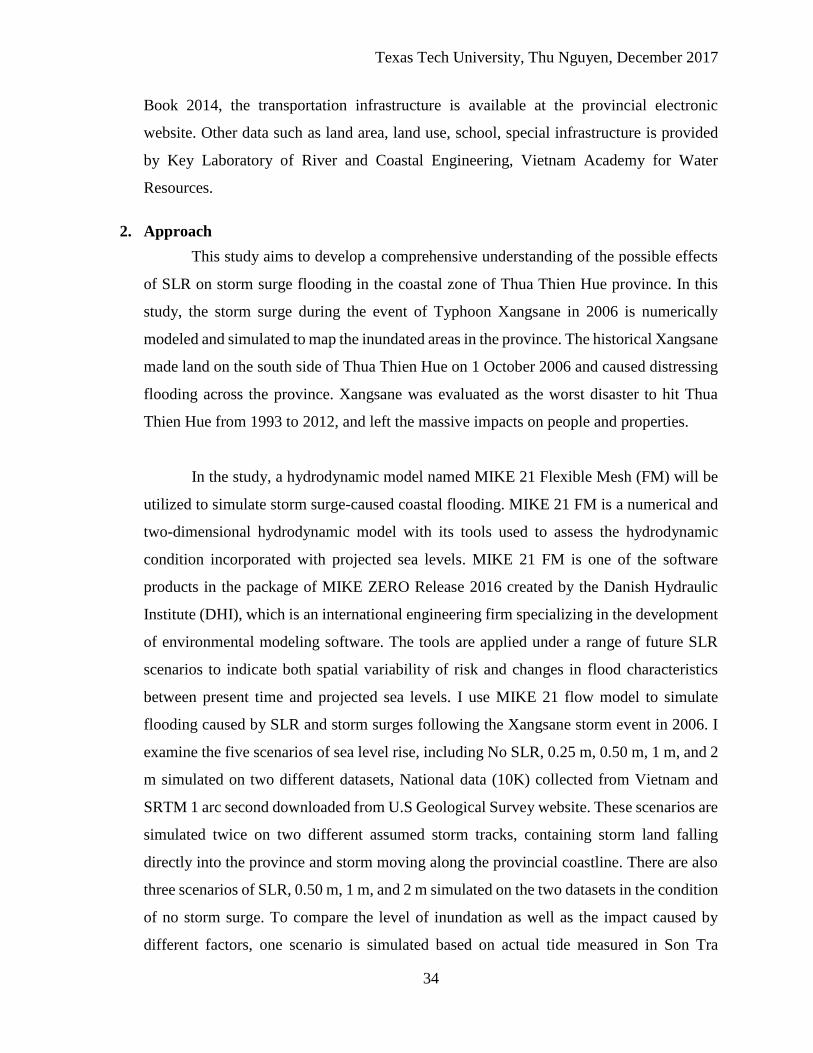
Texas Tech University, Thu Nguyen, December 2017
34
Book 2014, the transportation infrastructure is available at the provincial electronic
website. Other data such as land area, land use, school, special infrastructure is provided
by Key Laboratory of River and Coastal Engineering, Vietnam Academy for Water
Resources.
2. Approach
This study aims to develop a comprehensive understanding of the possible effects
of SLR on storm surge flooding in the coastal zone of Thua Thien Hue province. In this
study, the storm surge during the event of Typhoon Xangsane in 2006 is numerically
modeled and simulated to map the inundated areas in the province. The historical Xangsane
made land on the south side of Thua Thien Hue on 1 October 2006 and caused distressing
flooding across the province. Xangsane was evaluated as the worst disaster to hit Thua
Thien Hue from 1993 to 2012, and left the massive impacts on people and properties.
In the study, a hydrodynamic model named MIKE 21 Flexible Mesh (FM) will be
utilized to simulate storm surge-caused coastal flooding. MIKE 21 FM is a numerical and
two-dimensional hydrodynamic model with its tools used to assess the hydrodynamic
condition incorporated with projected sea levels. MIKE 21 FM is one of the software
products in the package of MIKE ZERO Release 2016 created by the Danish Hydraulic
Institute (DHI), which is an international engineering firm specializing in the development
of environmental modeling software. The tools are applied under a range of future SLR
scenarios to indicate both spatial variability of risk and changes in flood characteristics
between present time and projected sea levels. I use MIKE 21 flow model to simulate
flooding caused by SLR and storm surges following the Xangsane storm event in 2006. I
examine the five scenarios of sea level rise, including No SLR, 0.25 m, 0.50 m, 1 m, and 2
m simulated on two different datasets, National data (10K) collected from Vietnam and
SRTM 1 arc second downloaded from U.S Geological Survey website. These scenarios are
simulated twice on two different assumed storm tracks, containing storm land falling
directly into the province and storm moving along the provincial coastline. There are also
three scenarios of SLR, 0.50 m, 1 m, and 2 m simulated on the two datasets in the condition
of no storm surge. To compare the level of inundation as well as the impact caused by
different factors, one scenario is simulated based on actual tide measured in Son Tra
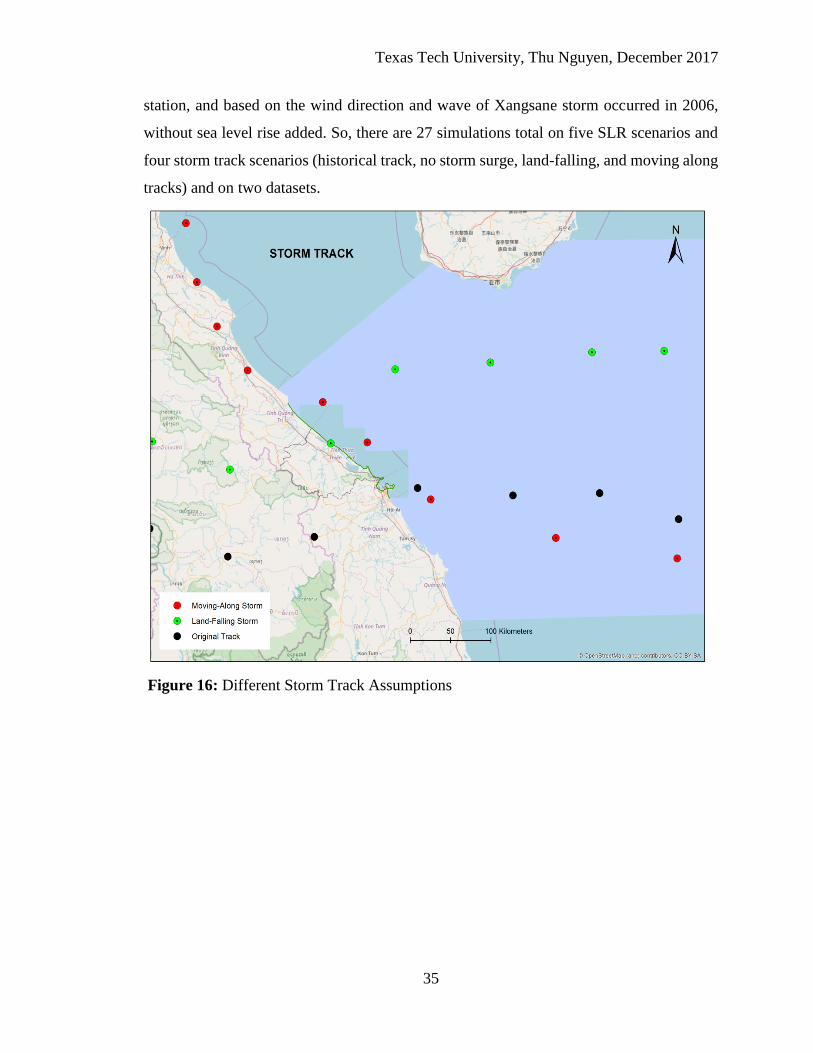
Texas Tech University, Thu Nguyen, December 2017
35
station, and based on the wind direction and wave of Xangsane storm occurred in 2006,
without sea level rise added. So, there are 27 simulations total on five SLR scenarios and
four storm track scenarios (historical track, no storm surge, land-falling, and moving along
tracks) and on two datasets.
Figure 16: Different Storm Track Assumptions
Texas Tech University, Thu Nguyen, December 2017
36
Table 3: Study Scenarios
Scenario/Dataset No SLR 0.25 m 0.50 m 1 m 2 m
Historical Xangsane
storm and tide
10K
Storm Land-Falling
Condition
10K 10K 10K 10K 10K
SRTM SRTM SRTM SRTM SRTM
Storm Along the Coast
Condition
10K 10K 10K 10K 10K
SRTM SRTM SRTM SRTM SRTM
No Storm Surge 10K 10K 10K
SRTM SRTM SRTM
The study evaluates the impacts of five SLR scenarios combined with or without
four storm tracks for the central part of Vietnam. These SLR scenarios are applied in the
study based on the range of SLR projected for the country (See Figure 3, 4, and 5 and
because they fit in the RCP projections (IPCC, 2014). The fifth scenario is out of the range
but still added into the analysis to determine the significant impacts. The net impacts of
SLR is compared on the top of the storm surge and the local tidal water surface to estimate
significant impacts with and without SLR scenarios.
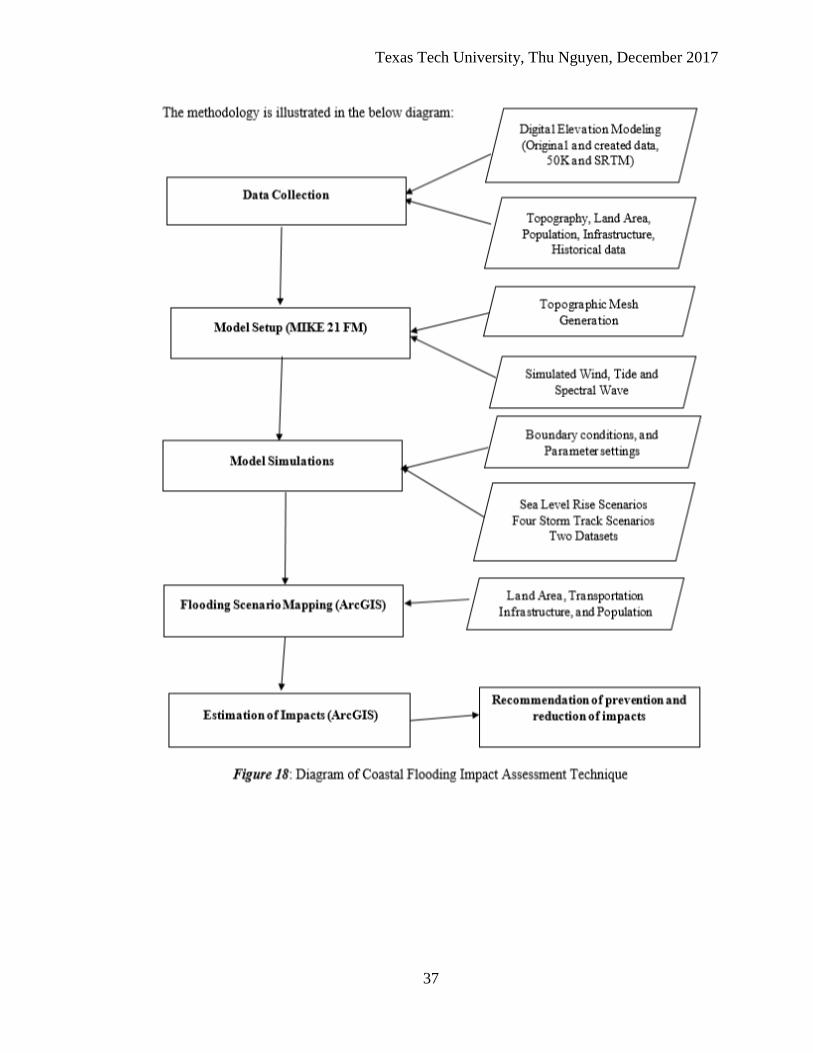
Texas Tech University, Thu Nguyen, December 2017
37
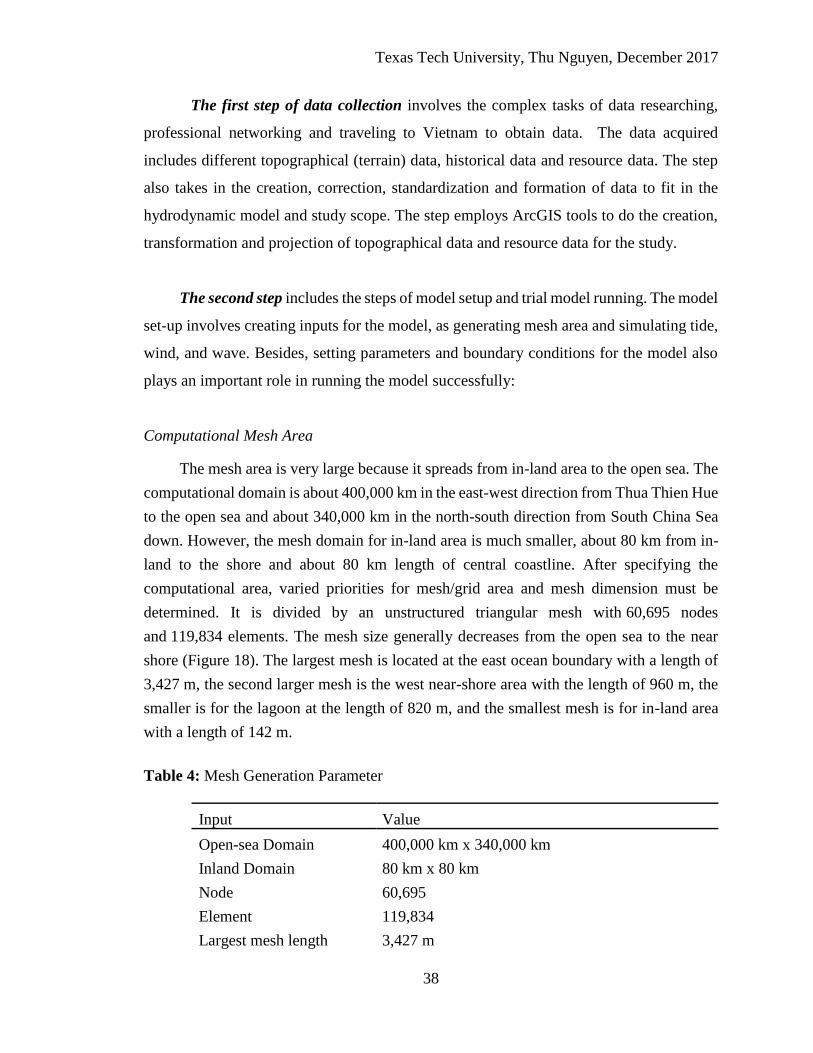
Texas Tech University, Thu Nguyen, December 2017
38
The first step of data collection involves the complex tasks of data researching,
professional networking and traveling to Vietnam to obtain data. The data acquired
includes different topographical (terrain) data, historical data and resource data. The step
also takes in the creation, correction, standardization and formation of data to fit in the
hydrodynamic model and study scope. The step employs ArcGIS tools to do the creation,
transformation and projection of topographical data and resource data for the study.
The second step includes the steps of model setup and trial model running. The model
set-up involves creating inputs for the model, as generating mesh area and simulating tide,
wind, and wave. Besides, setting parameters and boundary conditions for the model also
plays an important role in running the model successfully:
Computational Mesh Area
The mesh area is very large because it spreads from in-land area to the open sea. The
computational domain is about 400,000 km in the east-west direction from Thua Thien Hue
to the open sea and about 340,000 km in the north-south direction from South China Sea
down. However, the mesh domain for in-land area is much smaller, about 80 km from in-
land to the shore and about 80 km length of central coastline. After specifying the
computational area, varied priorities for mesh/grid area and mesh dimension must be
determined. It is divided by an unstructured triangular mesh with 60,695 nodes
and 119,834 elements. The mesh size generally decreases from the open sea to the near
shore (Figure 18). The largest mesh is located at the east ocean boundary with a length of
3,427 m, the second larger mesh is the west near-shore area with the length of 960 m, the
smaller is for the lagoon at the length of 820 m, and the smallest mesh is for in-land area
with a length of 142 m.
Table 4: Mesh Generation Parameter
Input Value
Open-sea Domain 400,000 km x 340,000 km
Inland Domain 80 km x 80 km
Node 60,695
Element 119,834
Largest mesh length 3,427 m
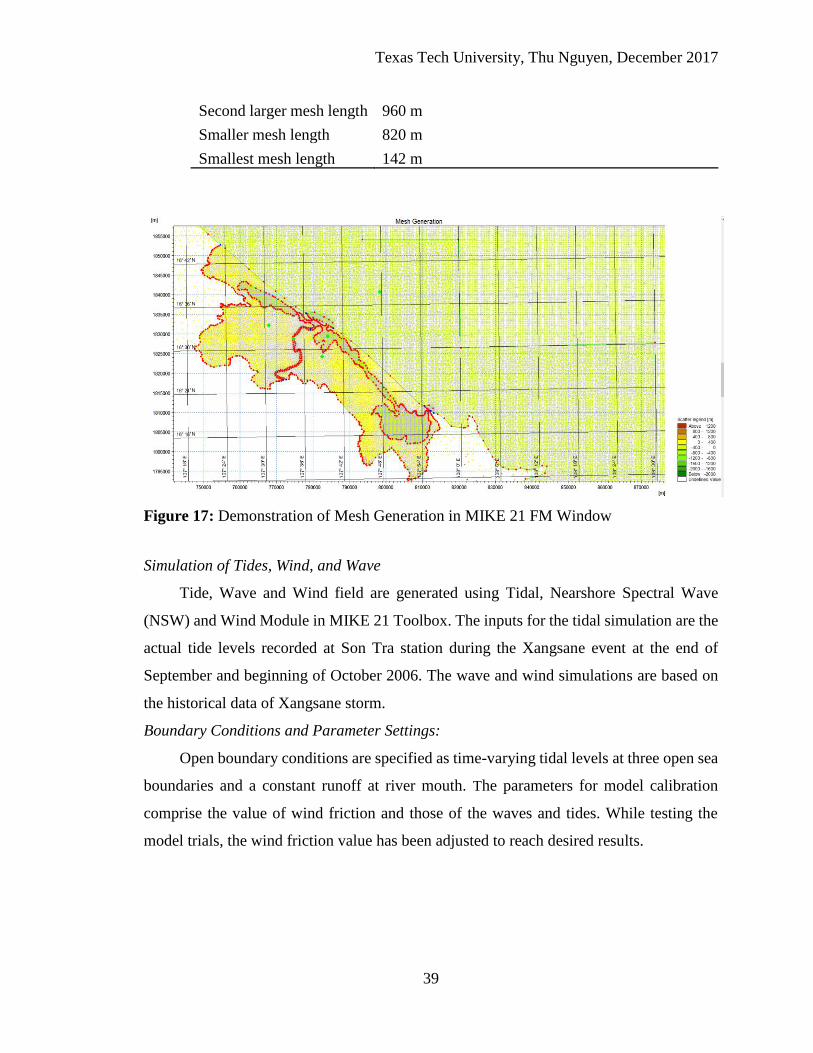
Texas Tech University, Thu Nguyen, December 2017
39
Second larger mesh length
Smaller mesh length
Smallest mesh length
960 m
820 m
142 m
Figure 17: Demonstration of Mesh Generation in MIKE 21 FM Window
Simulation of Tides, Wind, and Wave
Tide, Wave and Wind field are generated using Tidal, Nearshore Spectral Wave
(NSW) and Wind Module in MIKE 21 Toolbox. The inputs for the tidal simulation are the
actual tide levels recorded at Son Tra station during the Xangsane event at the end of
September and beginning of October 2006. The wave and wind simulations are based on
the historical data of Xangsane storm.
Boundary Conditions and Parameter Settings:
Open boundary conditions are specified as time-varying tidal levels at three open sea
boundaries and a constant runoff at river mouth. The parameters for model calibration
comprise the value of wind friction and those of the waves and tides. While testing the
model trials, the wind friction value has been adjusted to reach desired results.
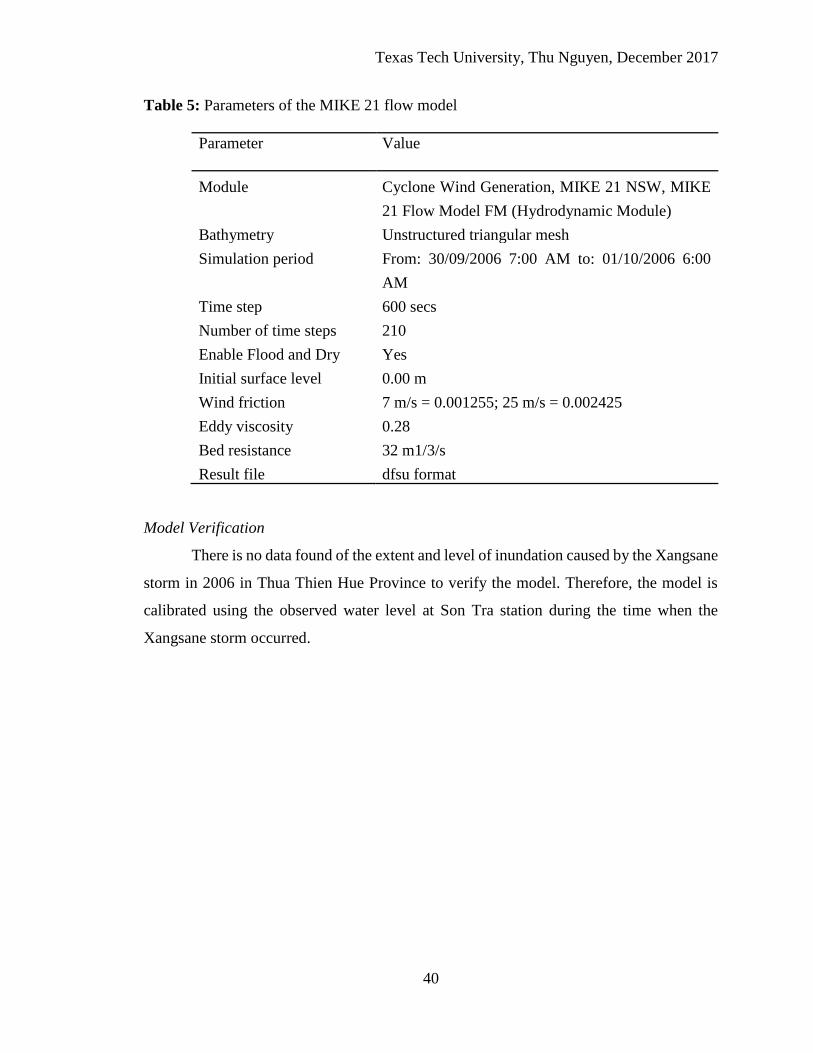
Texas Tech University, Thu Nguyen, December 2017
40
Table 5: Parameters of the MIKE 21 flow model
Parameter Value
Module Cyclone Wind Generation, MIKE 21 NSW, MIKE
21 Flow Model FM (Hydrodynamic Module)
Bathymetry Unstructured triangular mesh
Simulation period From: 30/09/2006 7:00 AM to: 01/10/2006 6:00
AM
Time step 600 secs
Number of time steps 210
Enable Flood and Dry
Initial surface level
Wind friction
Eddy viscosity
Bed resistance
Result file
Yes
0.00 m
7 m/s = 0.001255; 25 m/s = 0.002425
0.28
32 m1/3/s
dfsu format
Model Verification
There is no data found of the extent and level of inundation caused by the Xangsane
storm in 2006 in Thua Thien Hue Province to verify the model. Therefore, the model is
calibrated using the observed water level at Son Tra station during the time when the
Xangsane storm occurred.
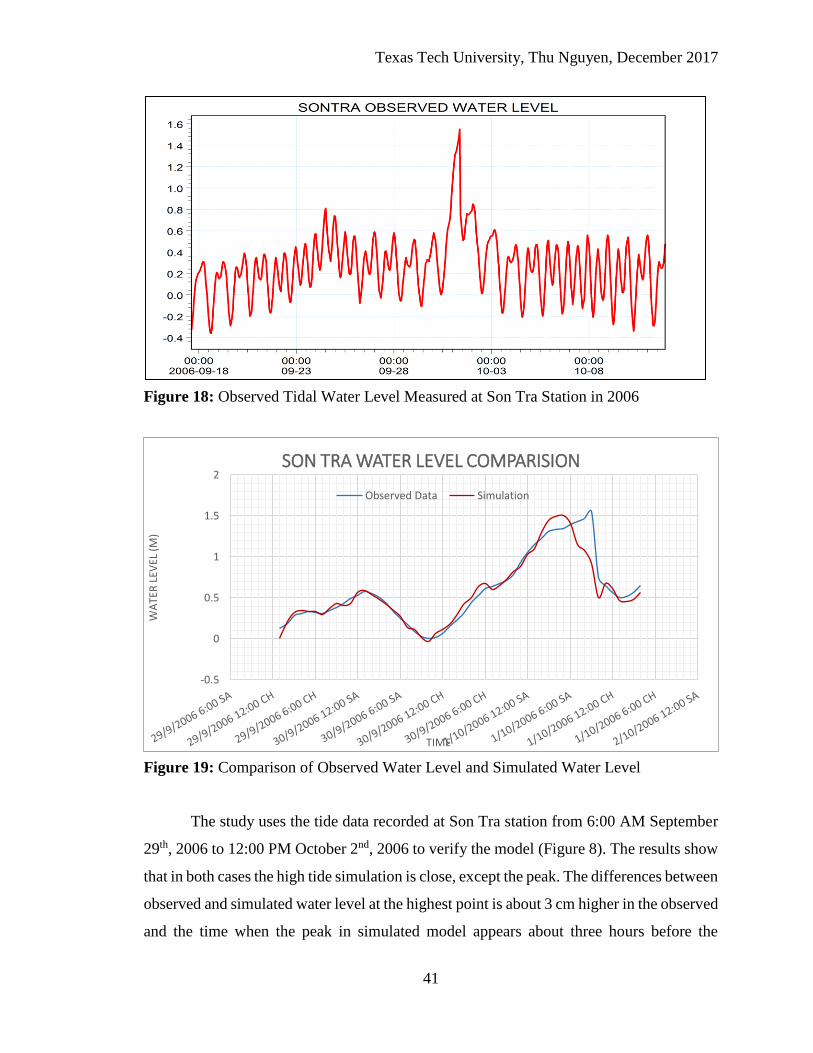
Texas Tech University, Thu Nguyen, December 2017
41
Figure 18: Observed Tidal Water Level Measured at Son Tra Station in 2006
Figure 19: Comparison of Observed Water Level and Simulated Water Level
The study uses the tide data recorded at Son Tra station from 6:00 AM September
29th, 2006 to 12:00 PM October 2nd, 2006 to verify the model (Figure 8). The results show
that in both cases the high tide simulation is close, except the peak. The differences between
observed and simulated water level at the highest point is about 3 cm higher in the observed
and the time when the peak in simulated model appears about three hours before the
-0.5
0
0.5
1
1.5
2
WA
TER
LEV
EL (
M)
TIME
SON TRA WATER LEVEL COMPARISION
Observed Data Simulation
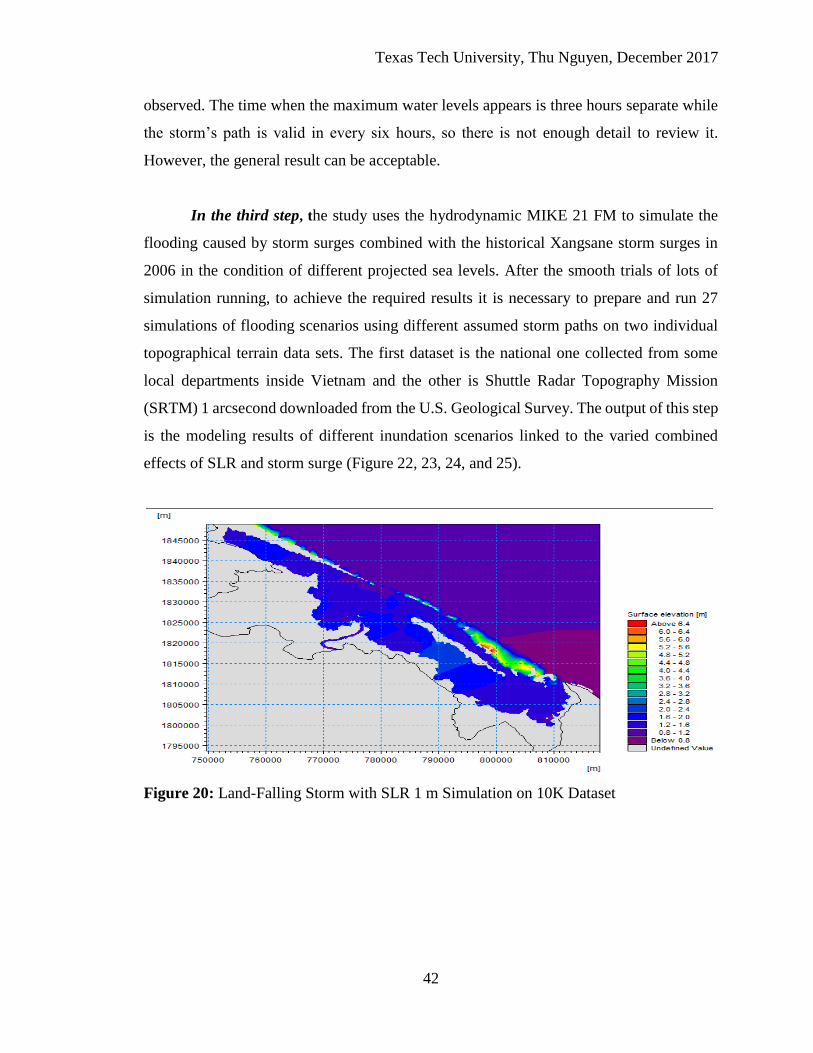
Texas Tech University, Thu Nguyen, December 2017
42
observed. The time when the maximum water levels appears is three hours separate while
the storm’s path is valid in every six hours, so there is not enough detail to review it.
However, the general result can be acceptable.
In the third step, the study uses the hydrodynamic MIKE 21 FM to simulate the
flooding caused by storm surges combined with the historical Xangsane storm surges in
2006 in the condition of different projected sea levels. After the smooth trials of lots of
simulation running, to achieve the required results it is necessary to prepare and run 27
simulations of flooding scenarios using different assumed storm paths on two individual
topographical terrain data sets. The first dataset is the national one collected from some
local departments inside Vietnam and the other is Shuttle Radar Topography Mission
(SRTM) 1 arcsecond downloaded from the U.S. Geological Survey. The output of this step
is the modeling results of different inundation scenarios linked to the varied combined
effects of SLR and storm surge (Figure 22, 23, 24, and 25).
Figure 20: Land-Falling Storm with SLR 1 m Simulation on 10K Dataset
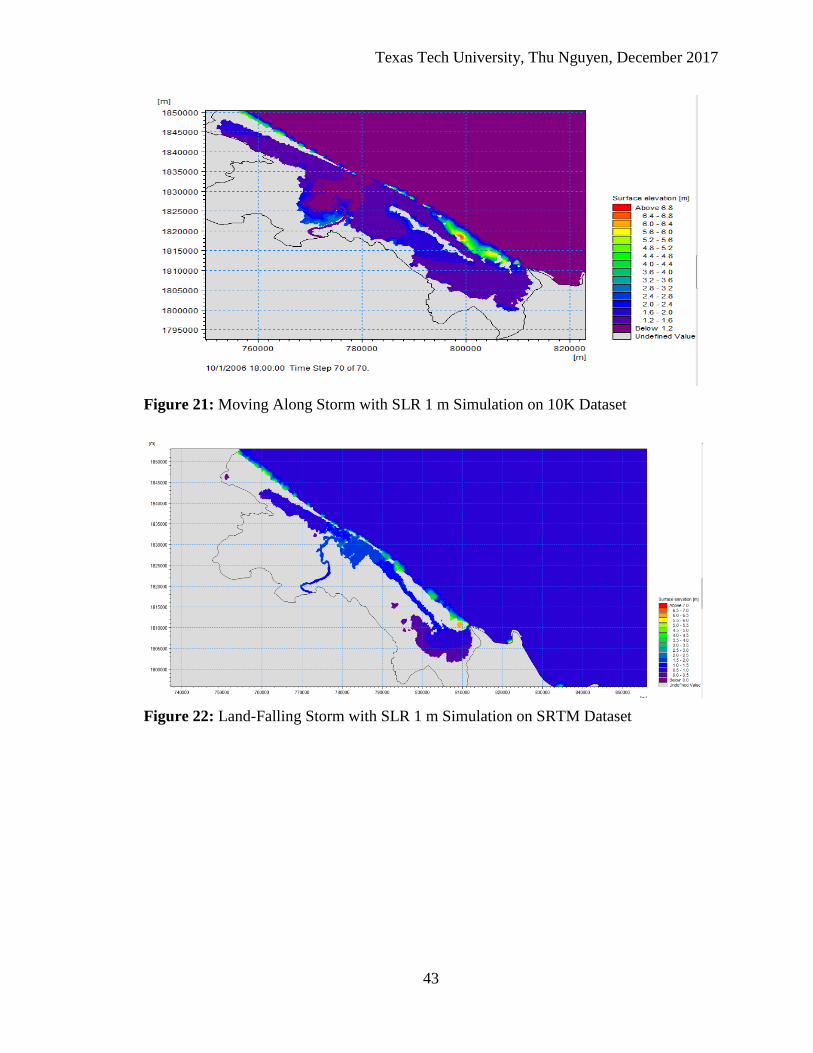
Texas Tech University, Thu Nguyen, December 2017
43
Figure 21: Moving Along Storm with SLR 1 m Simulation on 10K Dataset
Figure 22: Land-Falling Storm with SLR 1 m Simulation on SRTM Dataset
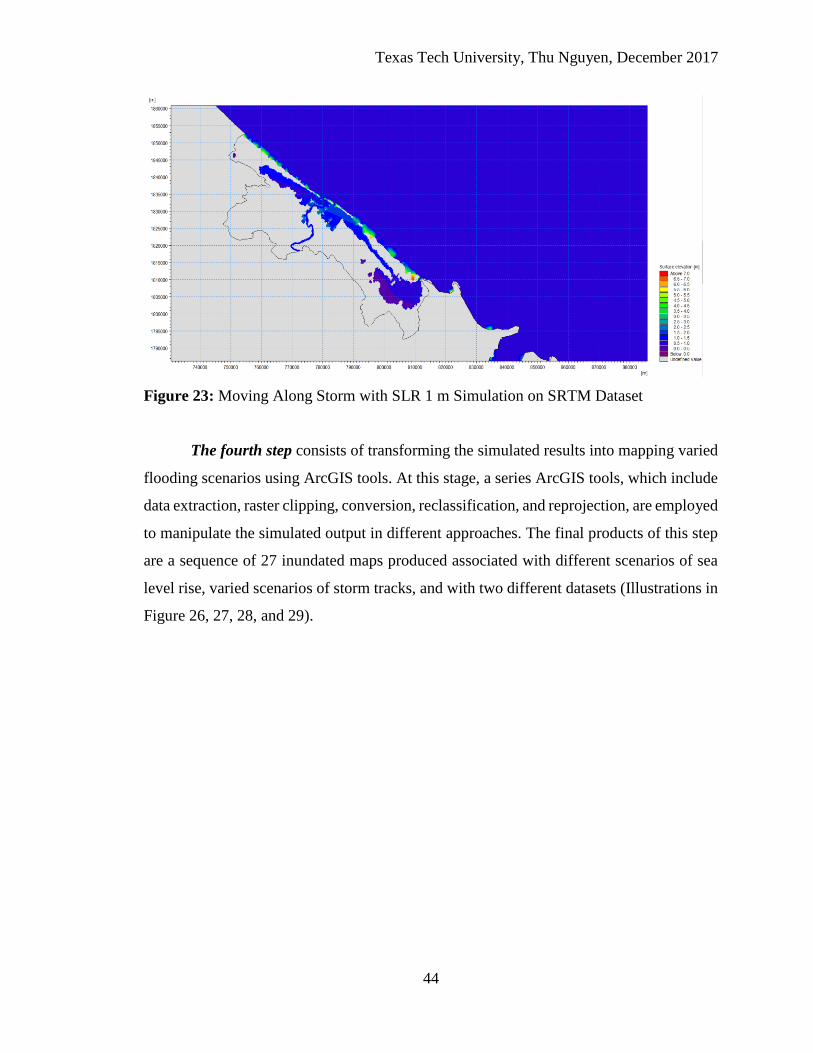
Texas Tech University, Thu Nguyen, December 2017
44
Figure 23: Moving Along Storm with SLR 1 m Simulation on SRTM Dataset
The fourth step consists of transforming the simulated results into mapping varied
flooding scenarios using ArcGIS tools. At this stage, a series ArcGIS tools, which include
data extraction, raster clipping, conversion, reclassification, and reprojection, are employed
to manipulate the simulated output in different approaches. The final products of this step
are a sequence of 27 inundated maps produced associated with different scenarios of sea
level rise, varied scenarios of storm tracks, and with two different datasets (Illustrations in
Figure 26, 27, 28, and 29).
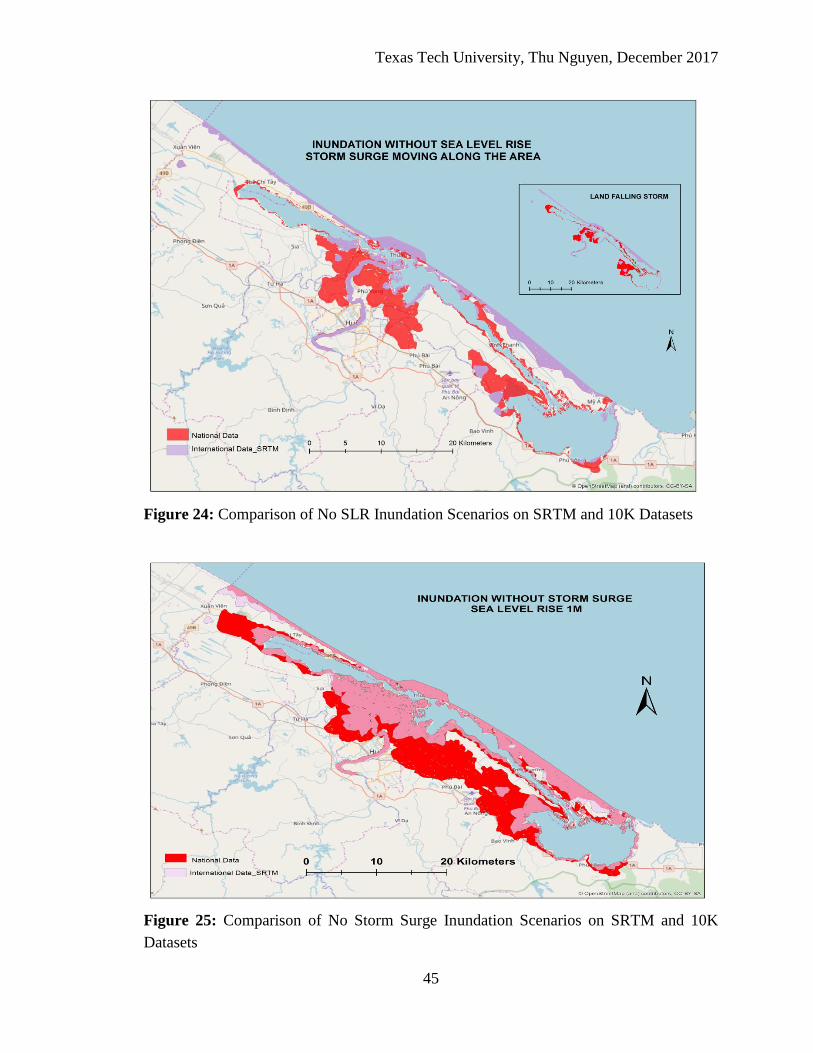
Texas Tech University, Thu Nguyen, December 2017
45
Figure 24: Comparison of No SLR Inundation Scenarios on SRTM and 10K Datasets
Figure 25: Comparison of No Storm Surge Inundation Scenarios on SRTM and 10K
Datasets
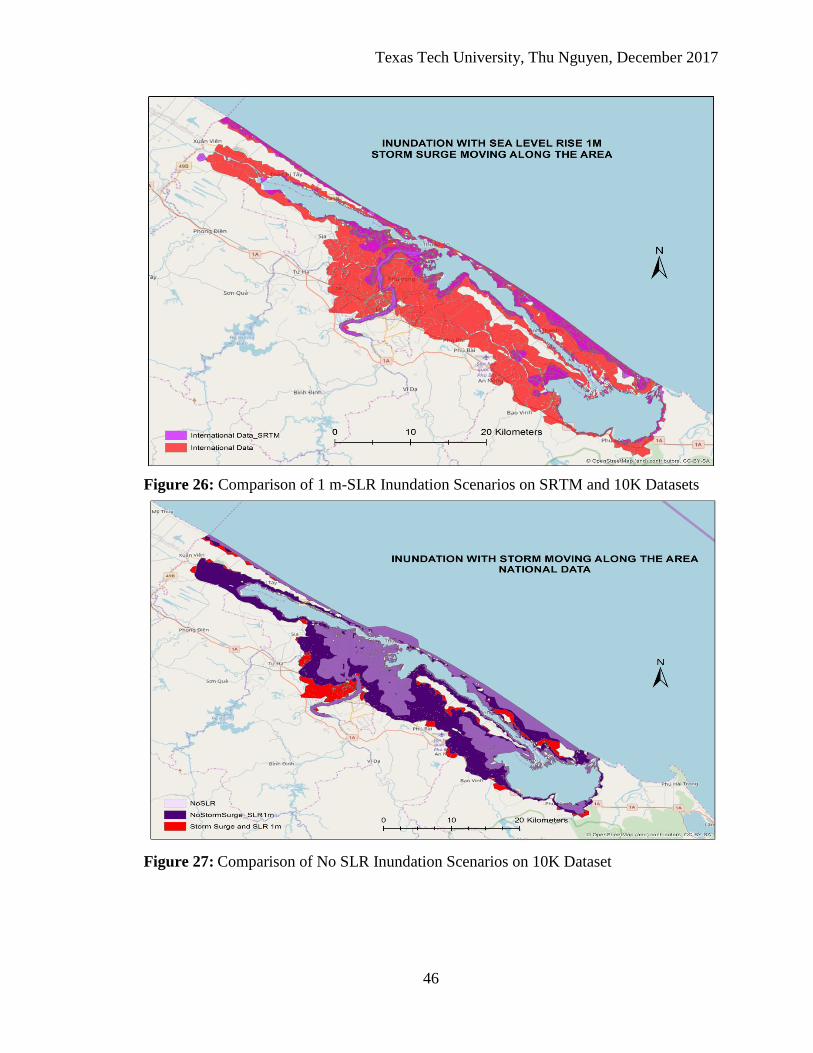
Texas Tech University, Thu Nguyen, December 2017
46
Figure 26: Comparison of 1 m-SLR Inundation Scenarios on SRTM and 10K Datasets
Figure 27: Comparison of No SLR Inundation Scenarios on 10K Dataset
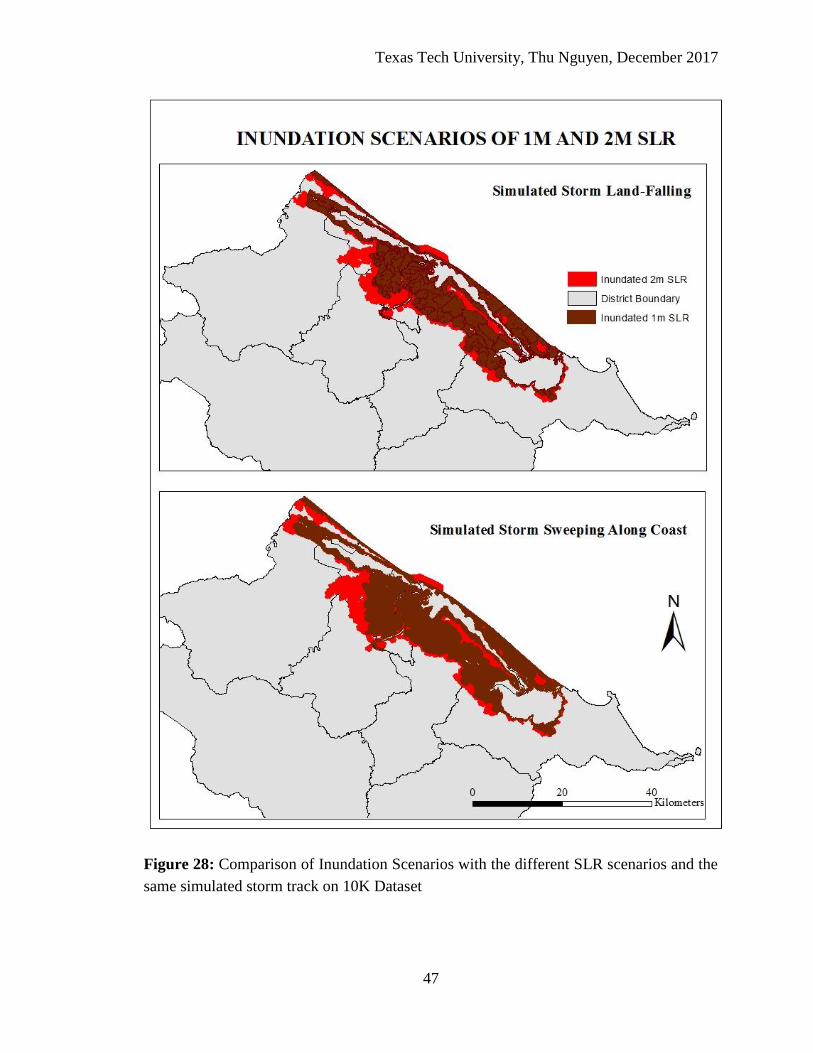
Texas Tech University, Thu Nguyen, December 2017
47
Figure 28: Comparison of Inundation Scenarios with the different SLR scenarios and the
same simulated storm track on 10K Dataset
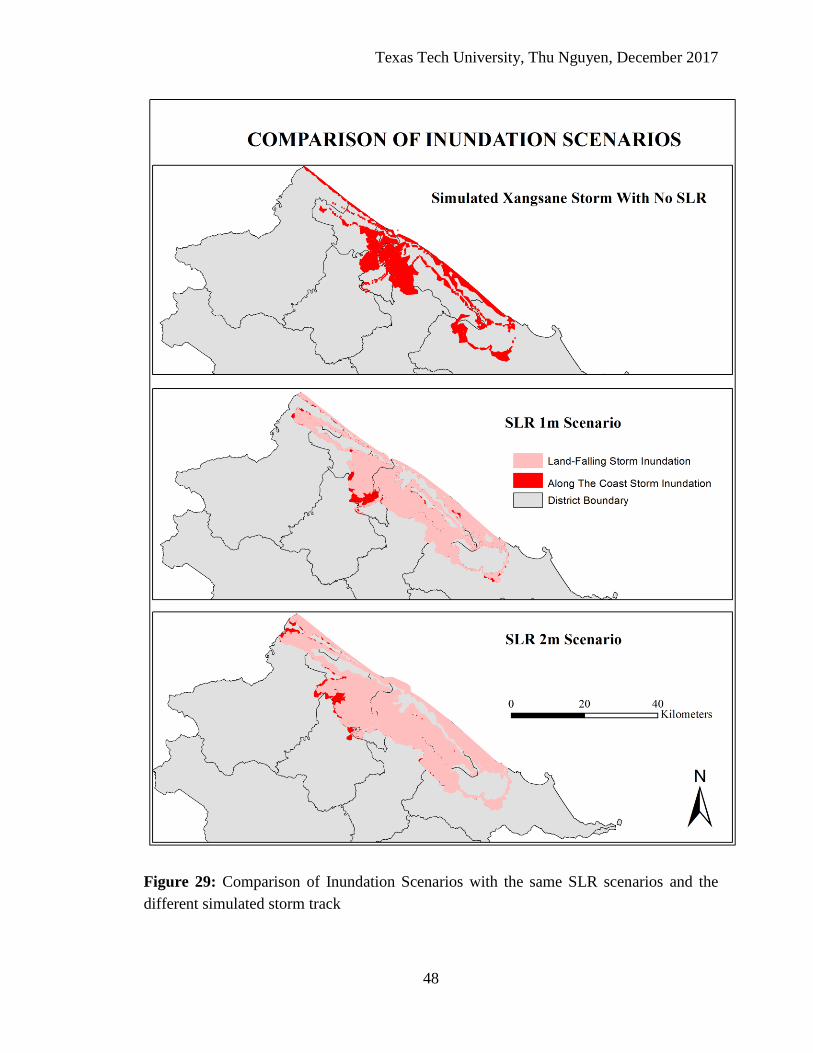
Texas Tech University, Thu Nguyen, December 2017
48
Figure 29: Comparison of Inundation Scenarios with the same SLR scenarios and the
different simulated storm track
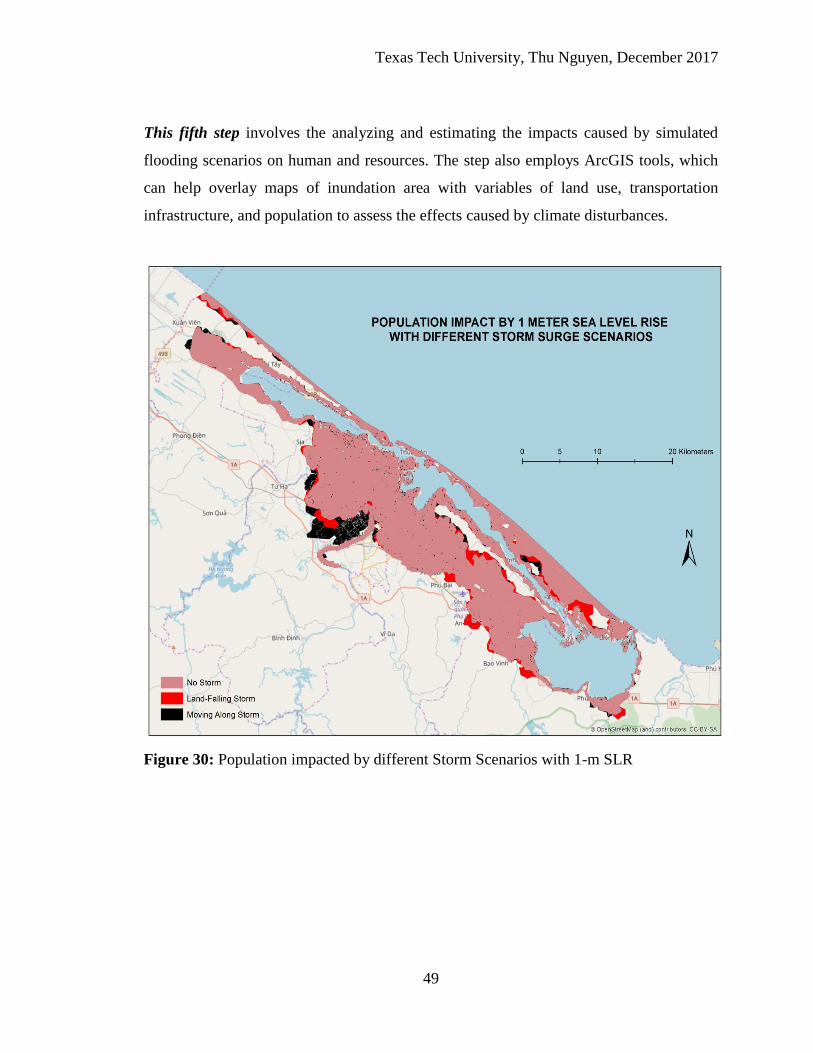
Texas Tech University, Thu Nguyen, December 2017
49
This fifth step involves the analyzing and estimating the impacts caused by simulated
flooding scenarios on human and resources. The step also employs ArcGIS tools, which
can help overlay maps of inundation area with variables of land use, transportation
infrastructure, and population to assess the effects caused by climate disturbances.
Figure 30: Population impacted by different Storm Scenarios with 1-m SLR
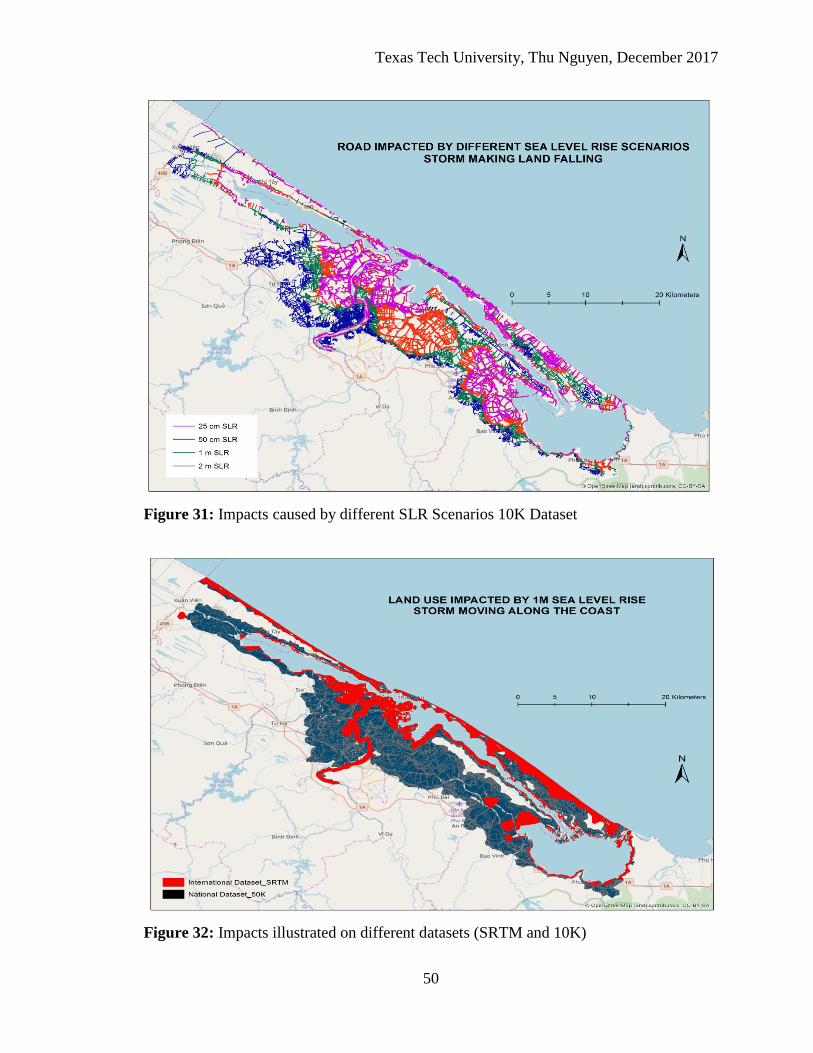
Texas Tech University, Thu Nguyen, December 2017
50
Figure 31: Impacts caused by different SLR Scenarios 10K Dataset
Figure 32: Impacts illustrated on different datasets (SRTM and 10K)
Texas Tech University, Thu Nguyen, December 2017
51
Based on the simulated inundation scenarios and analysis of the impacts, the last
step provides the recommendations and suggestions for local authorities, development
planners, policy makers, and the government on the future risks of coastal flooding, storm
surge, and SLR potentially exposed to the region. All stakeholders should be aware of the
risks so that they could make strategies for area development and planning as well as for
sound policymaking.
Texas Tech University, Thu Nguyen, December 2017
52
CHAPTER FIVE
RESULTS
1. Simulation of coastal flooding
We use an unsteady, two-dimensional MIKE 21 flow model to simulate flooding
because of sea level rise and storm surges. We examined flooding following the Xangsane
storm surge event in 2006. The results of 27 numerical simulation of flooding scenarios
are processed. The outputs for each of the simulated scenarios in selected time steps
include:
• Video animations of flooding evolution in time and space.
• Extent of flooding in form of ESRI polygon SHP file.
• Maps of water depth in form of ESRI grids with 2x2 m resolution.
The above-mentioned model results are manipulated and then overlaid with
inventory ArcGIS layers including land area, hospital, school, and special infrastructure,
road, rail road, and population.
The simulation result shows that some inland areas are inundated because sea water
level rises and spills into lagoon, and overflows onto the low-lying areas, causing flooding.
Indeed, theses low-lying areas have relatively low ground level, ranging from 0.5 m to 2
m. Hence, when storm surges appear to be about 1.5 m, that the areas are flooded is
reasonable. However, flooded duration is not very long, just a few hours, so the damages
it causes are not very significant.
2. Analysis of Impacts
The impacts caused by different SLR scenarios and storm surge scenarios are
mapped and analyzed using ArcGIS tools. The result show that the simulated storm flood
level in the study area increases significantly due to the rise in sea level that results in the
dramatically increasing impact in higher sea level rise scenarios (Figure 34 and 35; Table
6, 7 and 8).
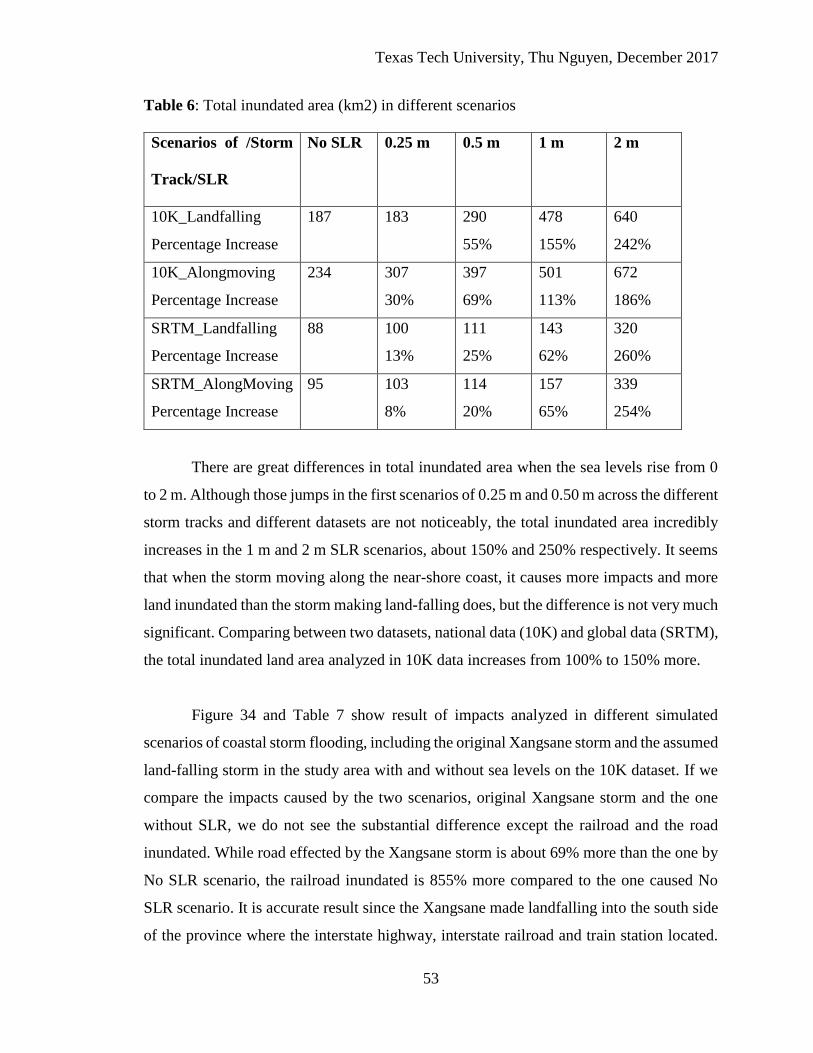
Texas Tech University, Thu Nguyen, December 2017
53
Table 6: Total inundated area (km2) in different scenarios
Scenarios of /Storm
Track/SLR
No SLR 0.25 m 0.5 m 1 m 2 m
10K_Landfalling
Percentage Increase
187 183
290
55%
478
155%
640
242%
10K_Alongmoving
Percentage Increase
234 307
30%
397
69%
501
113%
672
186%
SRTM_Landfalling
Percentage Increase
88 100
13%
111
25%
143
62%
320
260%
SRTM_AlongMoving
Percentage Increase
95 103
8%
114
20%
157
65%
339
254%
There are great differences in total inundated area when the sea levels rise from 0
to 2 m. Although those jumps in the first scenarios of 0.25 m and 0.50 m across the different
storm tracks and different datasets are not noticeably, the total inundated area incredibly
increases in the 1 m and 2 m SLR scenarios, about 150% and 250% respectively. It seems
that when the storm moving along the near-shore coast, it causes more impacts and more
land inundated than the storm making land-falling does, but the difference is not very much
significant. Comparing between two datasets, national data (10K) and global data (SRTM),
the total inundated land area analyzed in 10K data increases from 100% to 150% more.
Figure 34 and Table 7 show result of impacts analyzed in different simulated
scenarios of coastal storm flooding, including the original Xangsane storm and the assumed
land-falling storm in the study area with and without sea levels on the 10K dataset. If we
compare the impacts caused by the two scenarios, original Xangsane storm and the one
without SLR, we do not see the substantial difference except the railroad and the road
inundated. While road effected by the Xangsane storm is about 69% more than the one by
No SLR scenario, the railroad inundated is 855% more compared to the one caused No
SLR scenario. It is accurate result since the Xangsane made landfalling into the south side
of the province where the interstate highway, interstate railroad and train station located.
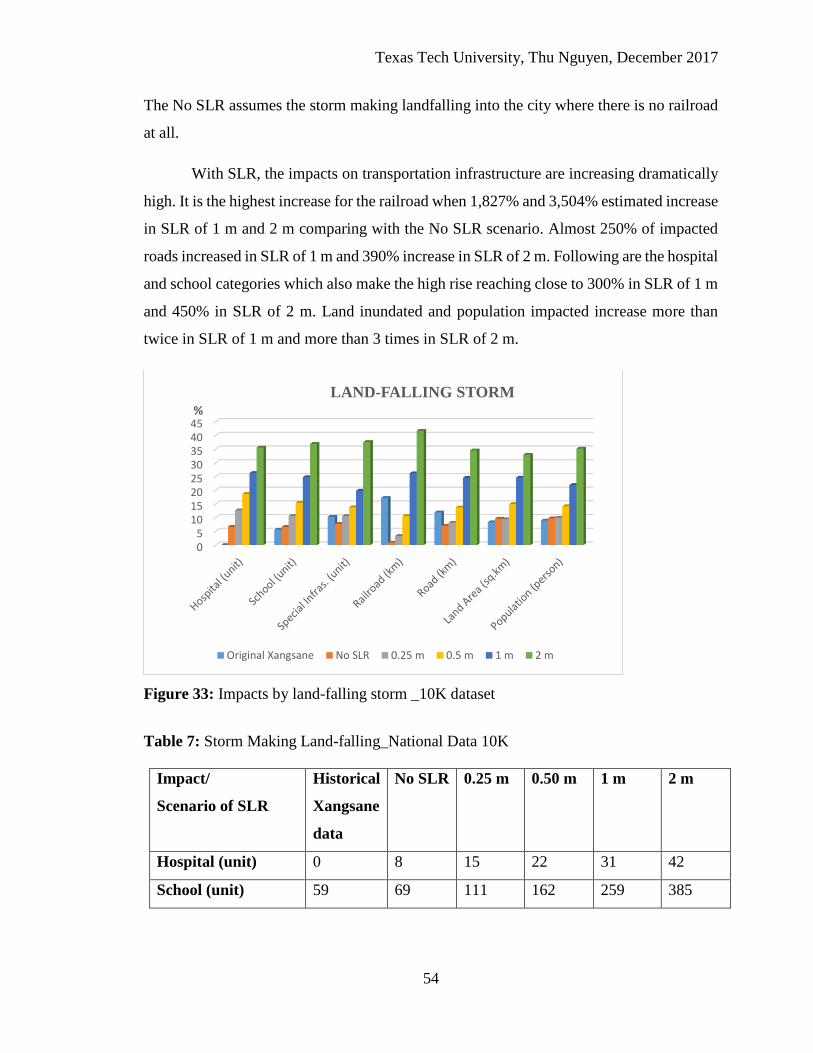
Texas Tech University, Thu Nguyen, December 2017
54
The No SLR assumes the storm making landfalling into the city where there is no railroad
at all.
With SLR, the impacts on transportation infrastructure are increasing dramatically
high. It is the highest increase for the railroad when 1,827% and 3,504% estimated increase
in SLR of 1 m and 2 m comparing with the No SLR scenario. Almost 250% of impacted
roads increased in SLR of 1 m and 390% increase in SLR of 2 m. Following are the hospital
and school categories which also make the high rise reaching close to 300% in SLR of 1 m
and 450% in SLR of 2 m. Land inundated and population impacted increase more than
twice in SLR of 1 m and more than 3 times in SLR of 2 m.
Figure 33: Impacts by land-falling storm _10K dataset
Table 7: Storm Making Land-falling_National Data 10K
Impact/
Scenario of SLR
Historical
Xangsane
data
No SLR 0.25 m 0.50 m 1 m 2 m
Hospital (unit) 0 8 15 22 31 42
School (unit) 59 69 111 162 259 385
05
1015202530354045%
LAND-FALLING STORM
Original Xangsane No SLR 0.25 m 0.5 m 1 m 2 m
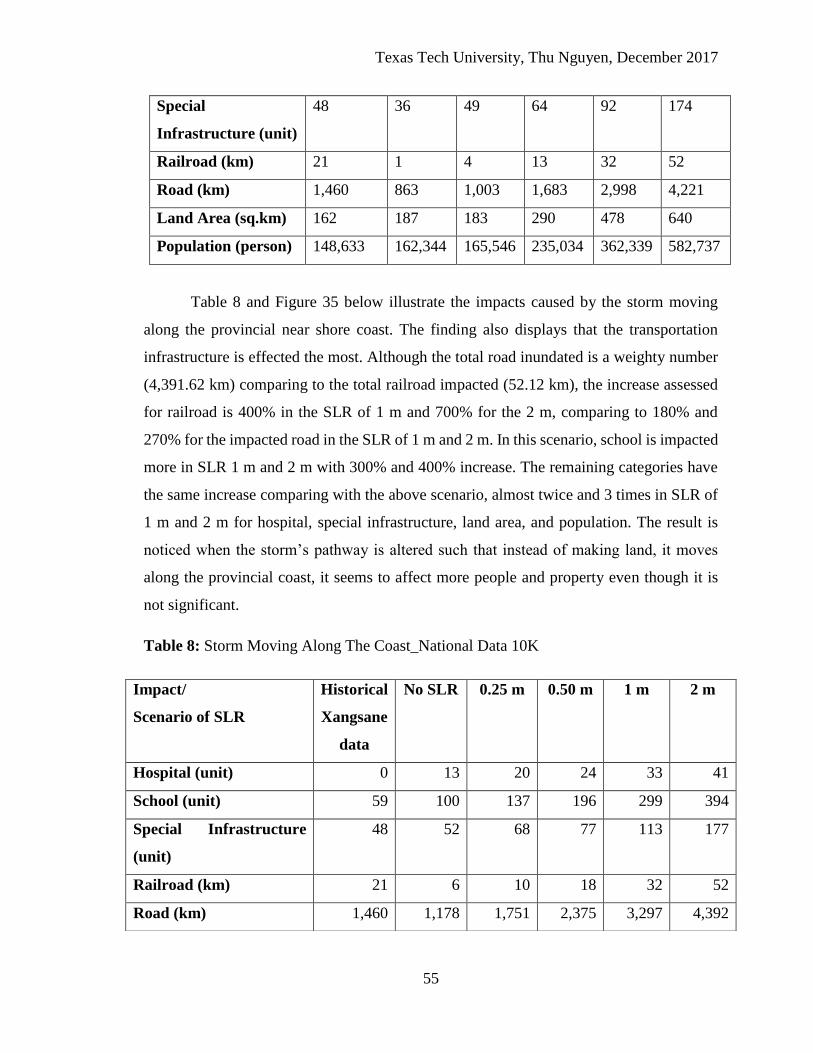
Texas Tech University, Thu Nguyen, December 2017
55
Special
Infrastructure (unit)
48 36 49 64 92 174
Railroad (km) 21 1 4 13 32 52
Road (km) 1,460 863 1,003 1,683 2,998 4,221
Land Area (sq.km) 162 187 183 290 478 640
Population (person) 148,633 162,344 165,546 235,034 362,339 582,737
Table 8 and Figure 35 below illustrate the impacts caused by the storm moving
along the provincial near shore coast. The finding also displays that the transportation
infrastructure is effected the most. Although the total road inundated is a weighty number
(4,391.62 km) comparing to the total railroad impacted (52.12 km), the increase assessed
for railroad is 400% in the SLR of 1 m and 700% for the 2 m, comparing to 180% and
270% for the impacted road in the SLR of 1 m and 2 m. In this scenario, school is impacted
more in SLR 1 m and 2 m with 300% and 400% increase. The remaining categories have
the same increase comparing with the above scenario, almost twice and 3 times in SLR of
1 m and 2 m for hospital, special infrastructure, land area, and population. The result is
noticed when the storm’s pathway is altered such that instead of making land, it moves
along the provincial coast, it seems to affect more people and property even though it is
not significant.
Table 8: Storm Moving Along The Coast_National Data 10K
Impact/
Scenario of SLR
Historical
Xangsane
data
No SLR 0.25 m 0.50 m 1 m 2 m
Hospital (unit) 0 13 20 24 33 41
School (unit) 59 100 137 196 299 394
Special Infrastructure
(unit)
48 52 68 77 113 177
Railroad (km) 21 6 10 18 32 52
Road (km) 1,460 1,178 1,751 2,375 3,297 4,392
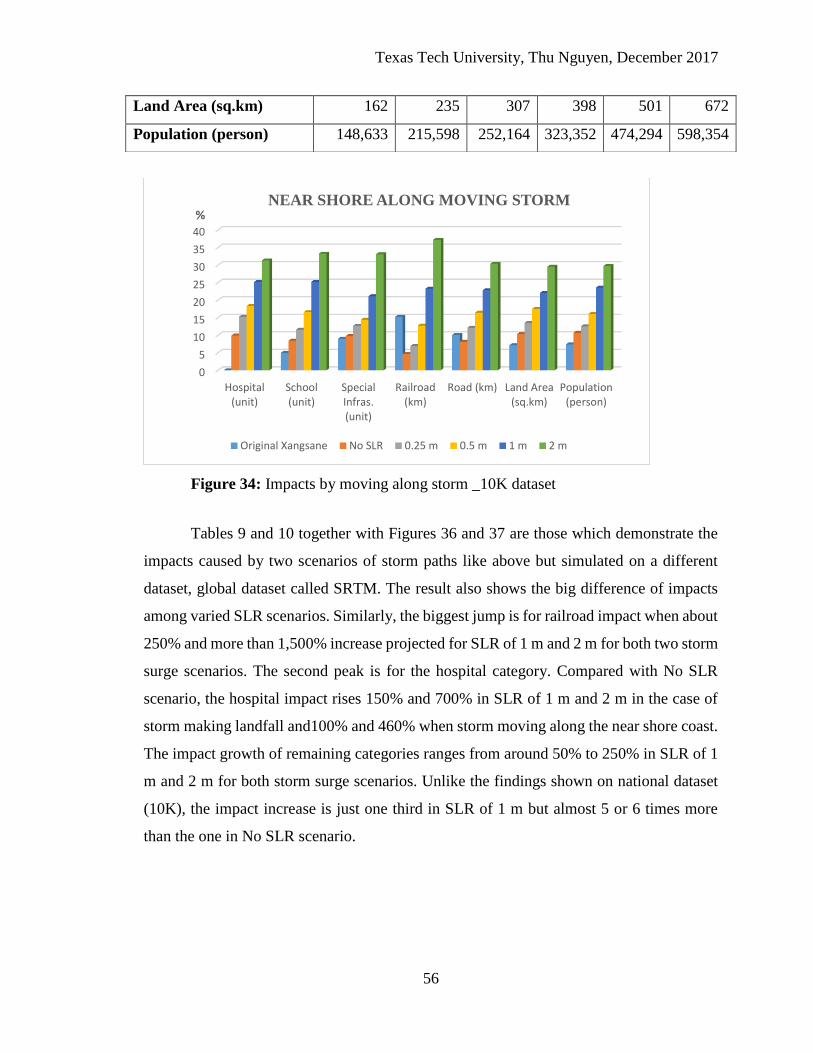
Texas Tech University, Thu Nguyen, December 2017
56
Figure 34: Impacts by moving along storm _10K dataset
Tables 9 and 10 together with Figures 36 and 37 are those which demonstrate the
impacts caused by two scenarios of storm paths like above but simulated on a different
dataset, global dataset called SRTM. The result also shows the big difference of impacts
among varied SLR scenarios. Similarly, the biggest jump is for railroad impact when about
250% and more than 1,500% increase projected for SLR of 1 m and 2 m for both two storm
surge scenarios. The second peak is for the hospital category. Compared with No SLR
scenario, the hospital impact rises 150% and 700% in SLR of 1 m and 2 m in the case of
storm making landfall and100% and 460% when storm moving along the near shore coast.
The impact growth of remaining categories ranges from around 50% to 250% in SLR of 1
m and 2 m for both storm surge scenarios. Unlike the findings shown on national dataset
(10K), the impact increase is just one third in SLR of 1 m but almost 5 or 6 times more
than the one in No SLR scenario.
0
5
10
15
20
25
30
35
40
Hospital(unit)
School(unit)
SpecialInfras.(unit)
Railroad(km)
Road (km) Land Area(sq.km)
Population(person)
%NEAR SHORE ALONG MOVING STORM
Original Xangsane No SLR 0.25 m 0.5 m 1 m 2 m
Land Area (sq.km) 162 235 307 398 501 672
Population (person) 148,633 215,598 252,164 323,352 474,294 598,354
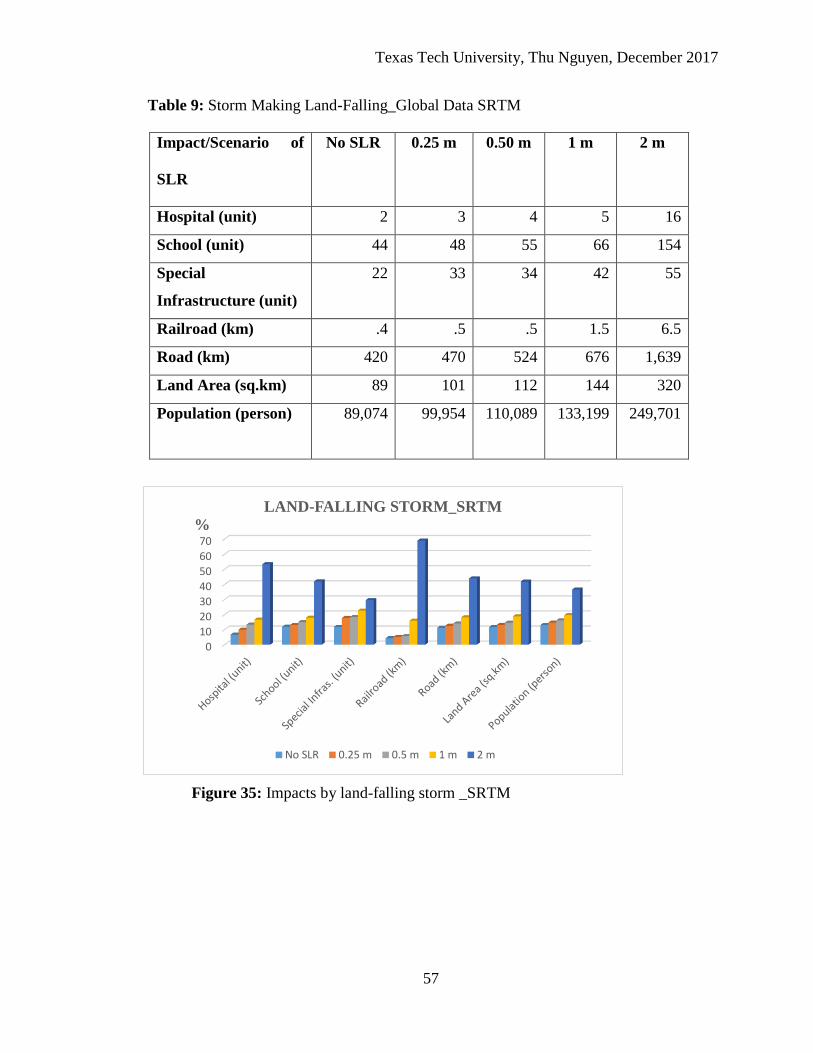
Texas Tech University, Thu Nguyen, December 2017
57
Table 9: Storm Making Land-Falling_Global Data SRTM
Impact/Scenario of
SLR
No SLR 0.25 m 0.50 m 1 m 2 m
Hospital (unit) 2 3 4 5 16
School (unit) 44 48 55 66 154
Special
Infrastructure (unit)
22 33 34 42 55
Railroad (km) .4 .5 .5 1.5 6.5
Road (km) 420 470 524 676 1,639
Land Area (sq.km) 89 101 112 144 320
Population (person) 89,074 99,954 110,089 133,199
249,701
Figure 35: Impacts by land-falling storm _SRTM
0
10
20
30
40
50
60
70
%
LAND-FALLING STORM_SRTM
No SLR 0.25 m 0.5 m 1 m 2 m
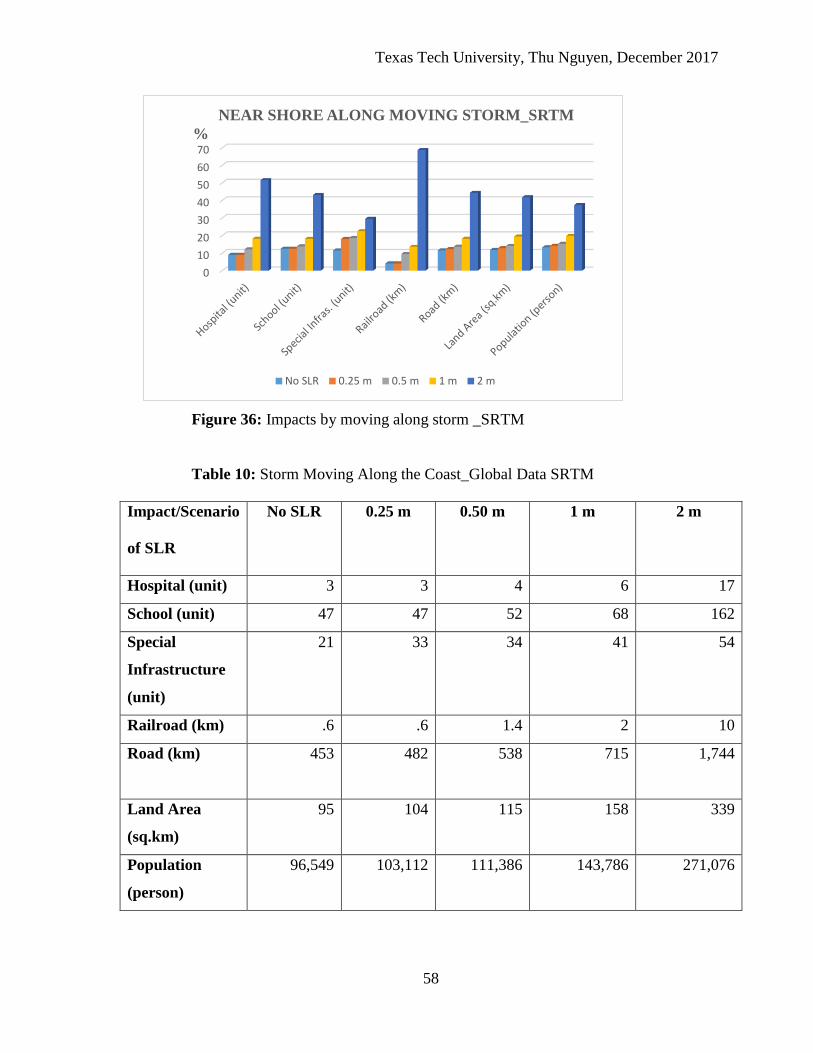
Texas Tech University, Thu Nguyen, December 2017
58
Figure 36: Impacts by moving along storm _SRTM
Table 10: Storm Moving Along the Coast_Global Data SRTM
Impact/Scenario
of SLR
No SLR 0.25 m 0.50 m 1 m 2 m
Hospital (unit) 3 3 4 6 17
School (unit) 47 47 52 68 162
Special
Infrastructure
(unit)
21 33 34 41 54
Railroad (km) .6 .6 1.4 2 10
Road (km) 453 482 538 715
1,744
Land Area
(sq.km)
95 104 115 158
339
Population
(person)
96,549 103,112 111,386 143,786
271,076
0
10
20
30
40
50
60
70%
NEAR SHORE ALONG MOVING STORM_SRTM
No SLR 0.25 m 0.5 m 1 m 2 m
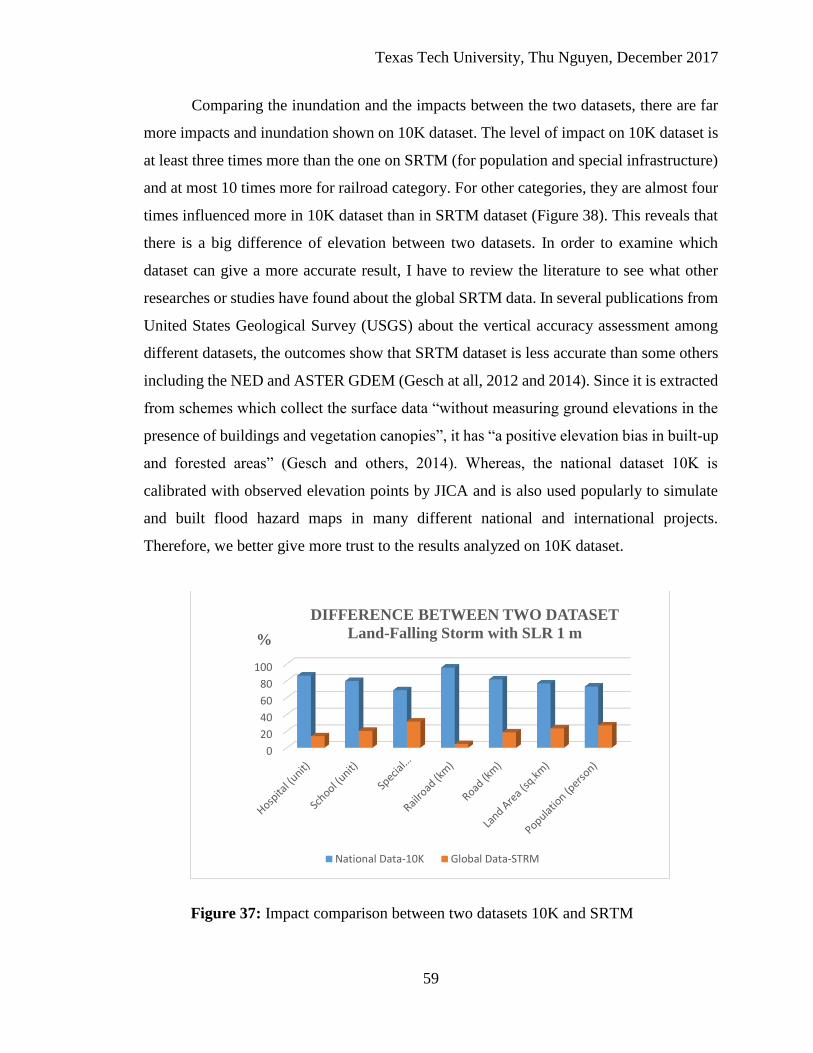
Texas Tech University, Thu Nguyen, December 2017
59
Comparing the inundation and the impacts between the two datasets, there are far
more impacts and inundation shown on 10K dataset. The level of impact on 10K dataset is
at least three times more than the one on SRTM (for population and special infrastructure)
and at most 10 times more for railroad category. For other categories, they are almost four
times influenced more in 10K dataset than in SRTM dataset (Figure 38). This reveals that
there is a big difference of elevation between two datasets. In order to examine which
dataset can give a more accurate result, I have to review the literature to see what other
researches or studies have found about the global SRTM data. In several publications from
United States Geological Survey (USGS) about the vertical accuracy assessment among
different datasets, the outcomes show that SRTM dataset is less accurate than some others
including the NED and ASTER GDEM (Gesch at all, 2012 and 2014). Since it is extracted
from schemes which collect the surface data “without measuring ground elevations in the
presence of buildings and vegetation canopies”, it has “a positive elevation bias in built-up
and forested areas” (Gesch and others, 2014). Whereas, the national dataset 10K is
calibrated with observed elevation points by JICA and is also used popularly to simulate
and built flood hazard maps in many different national and international projects.
Therefore, we better give more trust to the results analyzed on 10K dataset.
Figure 37: Impact comparison between two datasets 10K and SRTM
0
20
40
60
80
100
%
DIFFERENCE BETWEEN TWO DATASET
Land-Falling Storm with SLR 1 m
National Data-10K Global Data-STRM
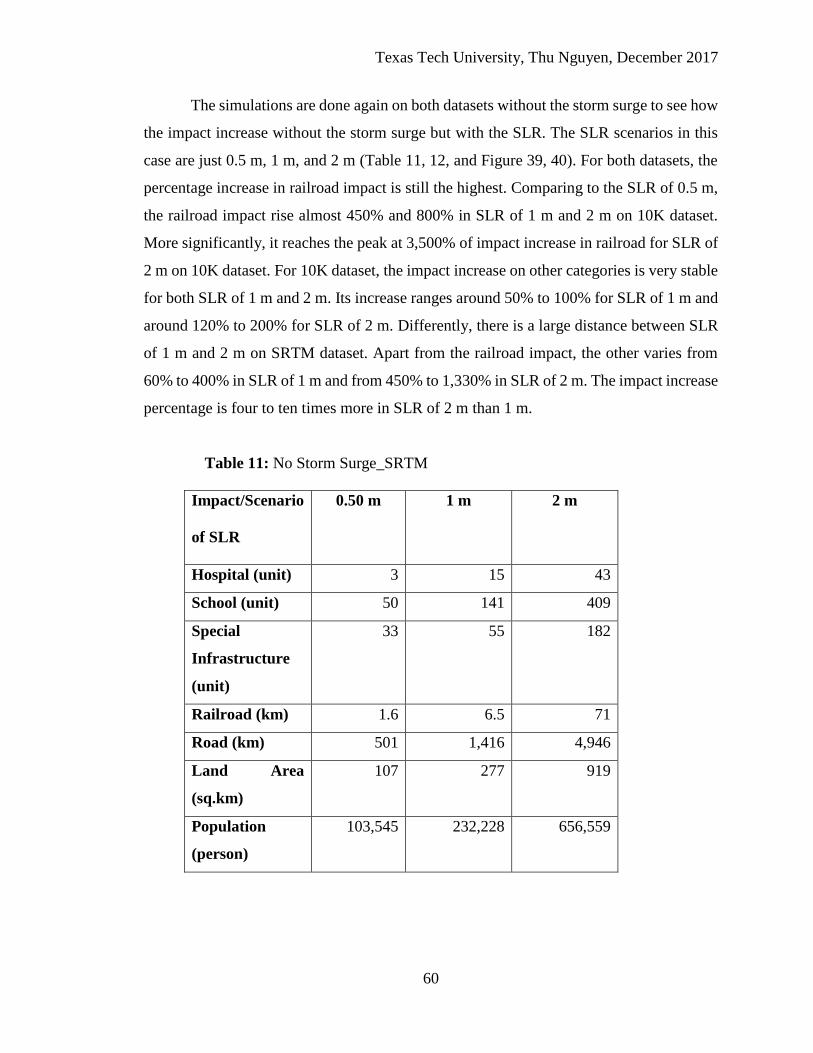
Texas Tech University, Thu Nguyen, December 2017
60
The simulations are done again on both datasets without the storm surge to see how
the impact increase without the storm surge but with the SLR. The SLR scenarios in this
case are just 0.5 m, 1 m, and 2 m (Table 11, 12, and Figure 39, 40). For both datasets, the
percentage increase in railroad impact is still the highest. Comparing to the SLR of 0.5 m,
the railroad impact rise almost 450% and 800% in SLR of 1 m and 2 m on 10K dataset.
More significantly, it reaches the peak at 3,500% of impact increase in railroad for SLR of
2 m on 10K dataset. For 10K dataset, the impact increase on other categories is very stable
for both SLR of 1 m and 2 m. Its increase ranges around 50% to 100% for SLR of 1 m and
around 120% to 200% for SLR of 2 m. Differently, there is a large distance between SLR
of 1 m and 2 m on SRTM dataset. Apart from the railroad impact, the other varies from
60% to 400% in SLR of 1 m and from 450% to 1,330% in SLR of 2 m. The impact increase
percentage is four to ten times more in SLR of 2 m than 1 m.
Table 11: No Storm Surge_SRTM
Impact/Scenario
of SLR
0.50 m 1 m 2 m
Hospital (unit) 3 15 43
School (unit) 50 141 409
Special
Infrastructure
(unit)
33 55 182
Railroad (km) 1.6 6.5 71
Road (km) 501 1,416 4,946
Land Area
(sq.km)
107 277 919
Population
(person)
103,545 232,228 656,559
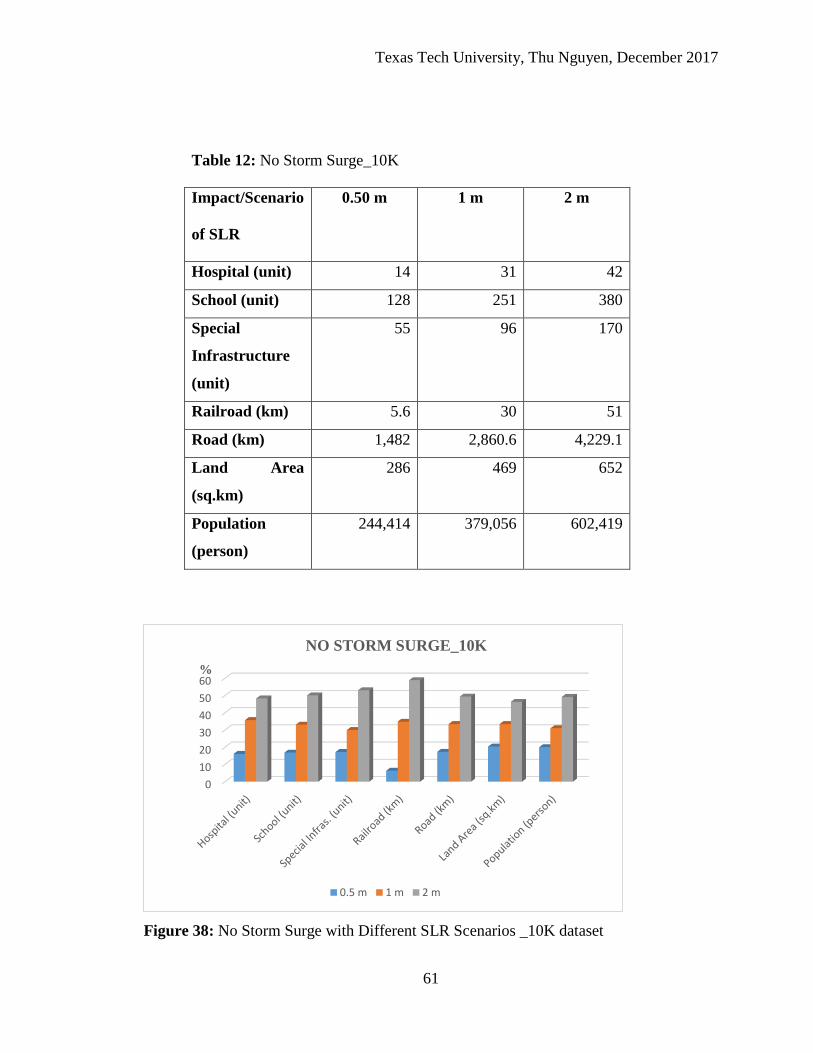
Texas Tech University, Thu Nguyen, December 2017
61
Table 12: No Storm Surge_10K
Impact/Scenario
of SLR
0.50 m 1 m 2 m
Hospital (unit) 14 31 42
School (unit) 128 251 380
Special
Infrastructure
(unit)
55 96 170
Railroad (km) 5.6 30 51
Road (km) 1,482 2,860.6 4,229.1
Land Area
(sq.km)
286 469 652
Population
(person)
244,414 379,056 602,419
Figure 38: No Storm Surge with Different SLR Scenarios _10K dataset
0
10
20
30
40
50
60%
NO STORM SURGE_10K
0.5 m 1 m 2 m
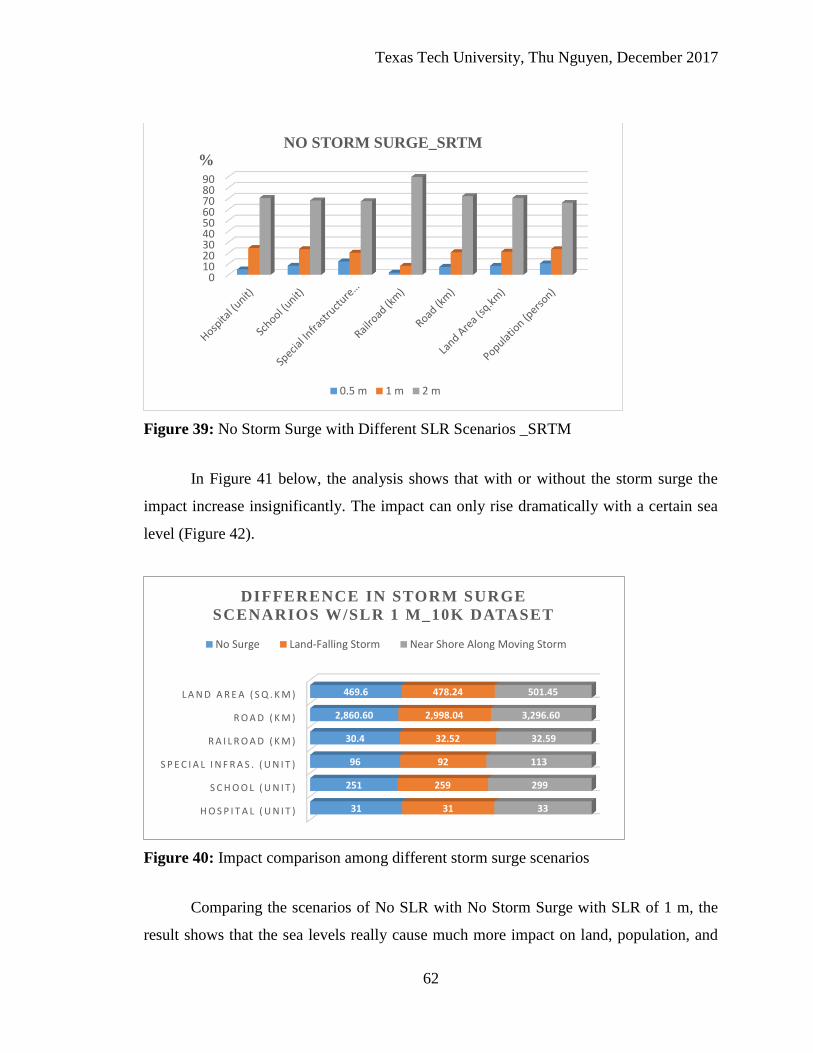
Texas Tech University, Thu Nguyen, December 2017
62
Figure 39: No Storm Surge with Different SLR Scenarios _SRTM
In Figure 41 below, the analysis shows that with or without the storm surge the
impact increase insignificantly. The impact can only rise dramatically with a certain sea
level (Figure 42).
Figure 40: Impact comparison among different storm surge scenarios
Comparing the scenarios of No SLR with No Storm Surge with SLR of 1 m, the
result shows that the sea levels really cause much more impact on land, population, and
0102030405060708090
%NO STORM SURGE_SRTM
0.5 m 1 m 2 m
H O S P I T A L ( U N I T )
S C H O O L ( U N I T )
S P E C I A L I N F R A S . ( U N I T )
R A I L R O A D ( K M )
R O A D ( K M )
L A N D A R E A ( S Q . K M )
31
251
96
30.4
2,860.60
469.6
31
259
92
32.52
2,998.04
478.24
33
299
113
32.59
3,296.60
501.45
DIFFERENCE IN STORM SURGE
SCENARIOS W/SLR 1 M_10K DATASET
No Surge Land-Falling Storm Near Shore Along Moving Storm
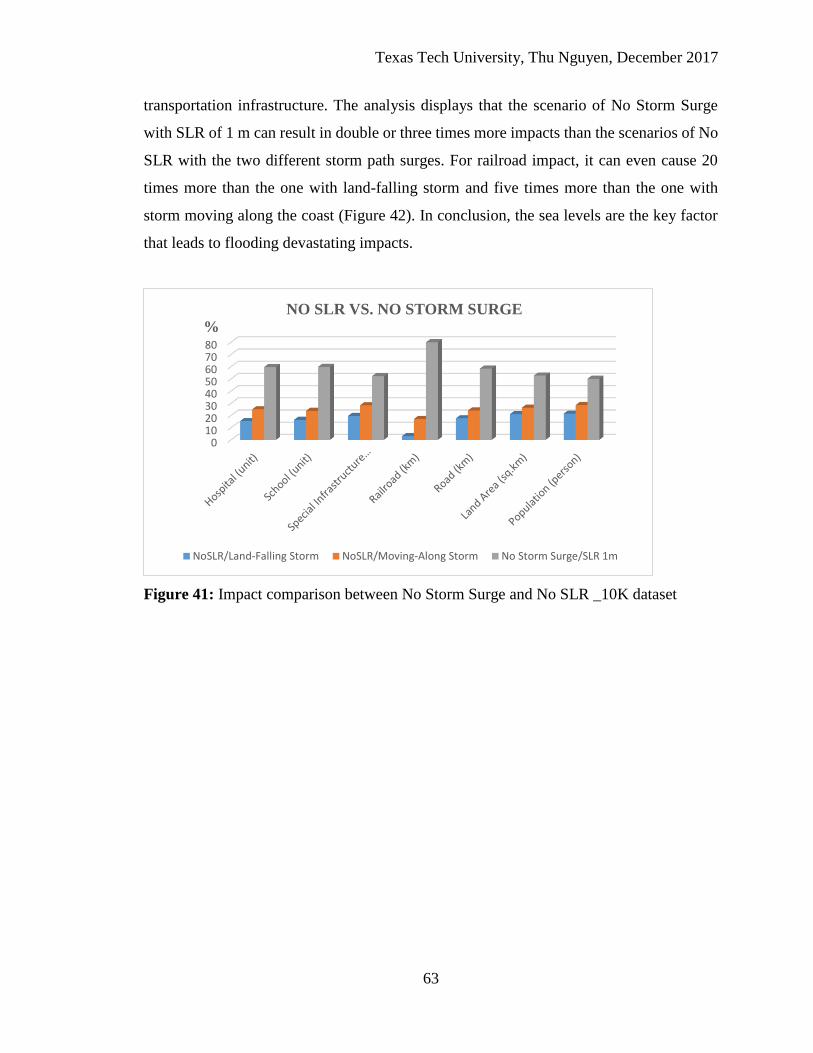
Texas Tech University, Thu Nguyen, December 2017
63
transportation infrastructure. The analysis displays that the scenario of No Storm Surge
with SLR of 1 m can result in double or three times more impacts than the scenarios of No
SLR with the two different storm path surges. For railroad impact, it can even cause 20
times more than the one with land-falling storm and five times more than the one with
storm moving along the coast (Figure 42). In conclusion, the sea levels are the key factor
that leads to flooding devastating impacts.
Figure 41: Impact comparison between No Storm Surge and No SLR _10K dataset
01020304050607080
%NO SLR VS. NO STORM SURGE
NoSLR/Land-Falling Storm NoSLR/Moving-Along Storm No Storm Surge/SLR 1m
Texas Tech University, Thu Nguyen, December 2017
64
CHAPTER SIX
CONCLUSIONS
The coastal area in the central part of Vietnam seems to be facing a variety of
weather risks related to climate change, including higher frequency and intensification of
tropical cyclones, higher storm surges, and even an accelerated rise in sea level. This
research investigates the vulnerability of the coastal zone in Vietnam against coastal
flooding related to intensification of storm surges under different scenarios of sea level
rise. A 2D hydrodynamic model named MIKE 21 FM is employed to simulate the storm
and storm surges associated with the historical storm Xangsane in 2006. Some other tools
in the package of MIKE ZERO product are used to map the inundated area when the storm
passes over. A detailed GIS analysis is applied to determine the impacts caused by storm
surge associated with and without a rise in sea-level in the region. There are 27 scenarios
taken into the study for analysis: 20 scenarios of SLR of No SLR, 0.25 m, 0.5 m, 1 m, and
2 m simulated on two different storm paths with two different datasets, 6 scenarios of No
Storm Surge with SLR of 0.5 m, 1 m, and 2 m simulated on two datasets, and one
simulation on the original Xangsane storm.
The results comparing impacts caused by No SLR with a SLR of 1 m indicates that
there is much greater loss in people and properties in the scenarios with sea level rise. With
sea level rise of 1 m, the impact on transportation infrastructure is very significant, from
200% to 400% increase, especially the effect on all types of road, railroad and inundated
land area. Roads always are heavily damaged across all scenarios. Since there is only one
interstate railroad along the whole country and it is lowland elevation in the study area, the
damage is not much for scenarios of low SLR. However, when sea level rises to a certain
one, like 1 m or 2 m, the impact percentage increases considerably, even almost 2000%
and 3500% for SLR of 1 m and 2 m with or without storm surge. For land area, building
(school and hospital), and special infrastructure, the impact increase around 250% to 450%
in SLR of 1 m and 2 m for national dataset and about 50% to 400% for SRTM dataset.
Texas Tech University, Thu Nguyen, December 2017
65
There are some conclusions drawn from the analysis. While the road impact is
highest the railroad impact percentage increases the most across all scenarios. Comparing
between the scenarios of No SLR and No Storm Surge with SLR, the latter one really
makes the greater impact. The scenarios of different storm surge paths without SLR do not
make any significant increase in impact. That means the sea levels really enhance and
accelerate the coastal flooding and cause much more impacts. Compared to the No SLR
scenario, the impact increase trend is double and three times in SLR of 1 m and 2 m for
national dataset but it is just half and even six times for SRTM dataset. So, the increase
jump is not very high in SLR of 1 m but then it goes much higher in SLR of 2 m for SRTM
dataset.
The combined effect of storm surges and SLR certainly gives rise to the high risk
of flooding in the research area (particularly in SLR of 1 m and 2 m). Based on the results
of this study, we recommend several strategies for Thua Thien Hue area:
1. Urban planning and urban infrastructure planning is of great importance to
building climate resilience. Therefore, the city planning authorities should consider the
impacts of climate-related SLR in the region for future city planning and development. The
integration of climate change into land-use plans, urban construction and infrastructure
development plans (especially transportation, public facilities such as schools, hospitals,
health clinics, historical and cultural heritage sites), tourism sector plans and socio-
economic development plans is essential. Besides, the integration of climate uncertainties
and climate resilience into development plans and urban plans is also needed.
2. The drainage system plays an important role in responding to floods in the area.
The city should take innovative solutions of preventive measures and intervention plans
into account to effectively manage the operation of the system, especially in major flood
events or reservoir failure events.
Texas Tech University, Thu Nguyen, December 2017
66
BIBLIOGRAPHY
Becker, J. J., D. T. Sandwell, W. H. F. Smith, J. Braud, B. Binder, J. Depner, D.
Fabre, J. Factor, S. Ingalls, S-H. Kim, R. Ladner, K. Marks, S. Nelson, A. Pharaoh, G.
Sharman, R. Trimmer, J. Rosenburg, G. Wallace, P. Weatherall (2009). Global
Bathymetry and Elevation Data at 30 Arc Seconds Resolution: SRTM30_PLUS, Marine
Geodesy, 32:4, 355-371.
Blake, E. S., C. W. Landsea, and E. J. Gibney (2011). The deadliest, costliest, and
most intense United States tropical cyclones from 1851 to 2010 (and other frequently
requested hurricane facts). NOAA Tech. Memo. NWS NHC-6, 49 pp.
Boateng, I. (2012). GIS assessment of coastal vulnerability to climate change and
coastal adaption planning in Vietnam. Journal of Coastal Conservation, 16 (1), 25-36.
Brown, J. D., Spencer, T., & Moeller, I. (2007). Modeling storm surge flooding of
an urban area with particular reference to modeling uncertainties: A case study of
Canvey Island, United Kingdom. Water Resources Research, 43(6).
Butler, T., Altaf, M. U., Dawson, C., Hoteit, I., Luo, X., & Mayo, T. (2012). Data
assimilation within the advanced circulation (ADCIRC) modeling framework for
hurricane storm surge forecasting. Monthly Weather Review,140(7), 2215-2231.
Carew-Reid, J. (2008). Rapid assessment of the extent and impact of sea level rise
in Viet Nam. International Centre for Environment Management (ICEM), Brisbane, 82.
CCFSC. (2005). National Report on Disasters in Vietnam, Vietnam Central
Committee for Flood and Storm Control, Working paper for the World Conference on
Disaster Reduction, 18-22 January 2005, Kobe-Hyogo, Japan.
Chau, V. N., Holland, J., Cassells, S., & Tuohy, M. (2013). Using GIS to map
impacts upon agriculture from extreme floods in Vietnam. Applied Geography, 41, 65-74.
Climate Action Plan of Hue City. (2014). To Respond to Climate Change in Hue
City Period 2014-2020. Vietnam. September 2014.
Chan, J. C., & Shi, J. E. (1996). Long‐term trends and inter-annual variability in
tropical cyclone activity over the western North Pacific. Geophysical Research
Letters, 23(20), 2765-2767.
Chen, W. B., & Liu, W. C. (2016). Assessment of storm surge inundation and
potential hazard maps for the southern coast of Taiwan. Natural Hazards,82(1), 591-616.
Church, J.A., White, N.J. (2011). Sea-level rise from the late 19th to the early 21st
century. Surv. Geophys. 32, 585e602.
Texas Tech University, Thu Nguyen, December 2017
67
D. Guha-Sapir, R. Below, Ph. Hoyois - EM-DAT: The CRED/OFDA
International Disaster Database – www.emdat.be – Université Catholique de Louvain –
Brussels – Belgium
Dang, V. K., Doubre, C., Weber, C., Gourmelen, N., & Masson, F. (2014). Recent
land subsidence caused by the rapid urban development in the Hanoi region (Vietnam)
using ALOS InSAR data. Nat. Hazards Earth Syst. Sci, 14, 657-674.
Dasgupta, S., Laplante, B., Meisner, C. M., Wheeler, D., & Jianping Yan, D.
(2007). The impact of sea level rise on developing countries: a comparative
analysis. World Bank policy research working paper, (4136).
Dinh, Q., Balica, S., Popescu, I., & Jonoski, A. (2012). Climate change impact on
flood hazard, vulnerability and risk of the Long Xuyen Quadrangle in the Mekong
Delta. International journal of river basin management, 10(1), 103-120.
Frank, W. M., & Young, G. S. (2007). The inter-annual variability of tropical
cyclones. Monthly Weather Review, 135(10), 3587-3598.
Gehrels, W.R., Woodworth, P.L., (2012). When did modern rates of sea-level rise
start?
Global Planet Change 100, 263e277.
Gesch, D. B. (2013). Consideration of vertical uncertainty in elevation-based sea-
level rise assessments: Mobile Bay, Alabama case study. Journal of Coastal
Research, 63(sp1), 197-210.
Brock, J.C.; Barras, J. A., and Williams, S.J. (eds.), Understanding and Predicting
Change in the Coastal Ecosystems of the Northern Gulf of Mexico, Journal of Coastal
Research, Special Issue No. 63, pp. 197–210, Coconut Creek (Florida), ISSN 0749-0208.
Gesch, D. B., Oimoen, M. J., & Evans, G. A. (2014). Accuracy assessment of the
US Geological Survey National Elevation Dataset, and comparison with other large-area
elevation datasets: SRTM and ASTER (No. 2014-1008). US Geological Survey.
Helen Clark (2009). VIETNAM: Preparation Mitigates Impact of Typhoon
Ketsana. By IPS CorrespondentsReprint
http://www.ipsnews.net/2009/10/vietnam-preparation-mitigates-impact-of-typhoon-
ketsana/
Hoang, Duc Cuong (2005). Study on Establishing the Climate Change Scenarios
Period 2010-2100 in Viet Nam. Institute of Meteorology and Hydrology.
Texas Tech University, Thu Nguyen, December 2017
68
Höllt, T., Altaf, M. U., Mandli, K. T., Hadwiger, M., Dawson, C. N., & Hoteit, I.
(2015). Visualizing uncertainties in a storm surge ensemble data assimilation and
forecasting system. Natural Hazards, 77(1), 317-336.
International Panel on Climate Change, (2013). Climate Change 2013: The
Physical Science Basis. Working Group 1 Contribution to the Fifth Assessment Report of
the International Panel on Climate Change. International Panel on Climate Change,
Cambridge, New York.
Jonathan, D.W., Jennifer, L.I., Suzana, J.C., (2013). Coastal Flooding by Tropical
Cyclones and Sea-Level Rise. Volume 504. Issue: 7478, p.44 to 52.
Knutson, T. R., McBride, J. L., Chan, J., Emanuel, K., Holland, G., Landsea, C.,
& Sugi, M. (2010). Tropical cyclones and climate change. Nature Geoscience, 3(3), 157-
163.
Kuang, C., Chen, W., Gu, J., Zhu, D. Z., He, L., & Huang, H. (2014). Numerical
assessment of the impacts of potential future sea-level rise on hydrodynamics of the
Yangtze River estuary, China. Journal of Coastal Research, 30(3), 586-597.
Le Minh Duc, I. P. S., Hoa, H. C., Hieu, T. T., Huong, H. T. L., & Thuan, N. T.
H. (2011). Study into the Economics of Low Carbon, Climate-Resilient Development in
Vietnam–Scoping Phase.
Leon J.X., Heuvelink G.B.M., Phinn S.R., (2014). Incorporating DEM
Uncertainty in Coastal Inundation Mapping. PLoS ONE 9(9): e108727.
doi:10.1371/journal. pone.0108727
Mah, D. Y. S., Putuhena, F. J., & Lai, S. H. (2011). Modelling the flood
vulnerability of deltaic Kuching City, Malaysia. Natural hazards, 58(3), 865-875.
Marfai, M. A., & King, L. (2008). Potential vulnerability implications of coastal
inundation due to sea level rise for the coastal zone of Semarang city,
Indonesia. Environmental Geology, 54(6), 1235-1245.
Ministry of Natural Resources and Environment of Vietnam. (2012). Climate
Change Scenarios and Sea Level Rise Scenarios for Vietnam (in Vietnamese).
Murakami, H., B. Wang, and A. Kitoh (2011). Future change of western North
Pacific typhoons: Projections by a 20-km-mesh global atmospheric model, J. Climate, 24,
1154–1169, doi:10.1175/2010JCLI3723.1.
Murty, T. S., Flather, R. A., & Henry, R. F. (1986). The storm surge problem in
the Bay of Bengal. Progress in Oceanography, 16(4), 195-233.
Texas Tech University, Thu Nguyen, December 2017
69
National Report on Disaster Reduction in Vietnam. (2005). For the World
Conference on Disaster Reduction, Kobe-Hyogo, Japan, 18-22 January 2005. Socialist
Republic of Vietnam.
Neumann, J. E., Emanuel, K. A., Ravela, S., Ludwig, L. C., & Verly, C. (2015).
Risks of Coastal Storm Surge and the Effect of Sea Level Rise in the Red River Delta,
Vietnam. Sustainability, 7(6), 6553-6572.
Ngu, N. D., & Hieu, N. T. (2004). Climate and climate resources in Vietnam.
Nguyen, T. T., & Woodroffe, C. D. (2015). Assessing relative vulnerability to
sea-level rise in the western part of the Mekong River Delta in Vietnam. Sustainability
Science, 1-15.
Nguyen, V. & Phan H., (2000). Climate Change During the Last 100 Years and
Projections for Flood Season of 2000. Science and Technology Journal of Thua Thien
Hue (27). 2000
Nhu, O. L., Thuy, N. T. T., Wilderspin, I., & Coulier, M. (2011). A preliminary
analysis of flood and storm disaster data in Vietnam. Ha Noi.
Nicholls, R. J. (1995). Coastal megacities and climate change. Geology Journal,
37(3), 369-379.
Parris, A., Bromirsji, P., Burkett, V., Cayan, D., Culver, M., Hall, J., Horton, R.,
Knuuti, K., Moss, R., Obeysekera, J., Sallenger, A.H., Weiss, J., (2012). Global Sea
Level
Rise Scenarios for the US National Climate Assessment. NOAA Technical
Report. National Oceanic and Atmospheric Administration, p. 37.
Peduzzi, P., Chatenoux, B., Dao, H., De Bono, A., Herold, C., Kossin, J., (2012). Global
trends in tropical cyclone risk. Nature climate change, 2(4), 289-294.
Perrette, M., Landerer, F., Riva, R., Frieler, K., & Meinshausen, M. (2013). A
scaling approach to project regional sea level rise and its uncertainties. Earth System
Dynamics, 4(1), 11-29.
Radić, V., Bliss, A., Beedlow, A. C., Hock, R., Miles, E., & Cogley, J. G. (2014).
Regional and global projections of twenty-first century glacier mass changes in response
to climate scenarios from global climate models. Climate Dynamics, 42(1-2), 37-58.
Razafindrabe, B. H., Kada, R., Arima, M., & Inoue, S. (2014). Analyzing flood
risk and related impacts to urban communities in central Vietnam. Mitigation and
adaptation strategies for global change, 19(2), 177-198.
Texas Tech University, Thu Nguyen, December 2017
70
Rodolfo, K. S., & Siringan, F. P. (2006). Global sea‐level rise is recognized, but
flooding from anthropogenic land subsidence is ignored around northern Manila Bay,
Philippines. Disasters, 30(1), 118-139.
Schaeffer, M., Hare, W., Rahmstorf, S., Vermeer, M., (2012). Long-term sea-level
rise
implied by 1.5_C and 2_C warming levels. Nature Climate Change 2, 867e870.
SRV (Socialist Republic of Vietnam) (2004). National report on disaster
reduction in Vietnam. Hanoi, September 2004. 31 pp
Thomas, C. (2015). Modelling marine connectivity in the Great Barrier Reef and
exploring its ecological implications (Doctoral dissertation, UCL).
Thua Thien Hue Provincial People’s Committee (2005). Five Year Social
Economic Development Plan, from 2006 to 2010 (in Vietnamese).
The World Bank. (2016). Data updated on April 11, 2016. Retrieved from the
website: http://www.worldbank.org/en/country/vietnam/overview#2 on May 5, 2016.
UNEP (1993). Viet Nam and Climate Change, Fact sheet produced by the
Information Unit on Climate Change, United Nations Environment Program, Geneva.
Unisys Weather. Retrieved June 7, 2016, from
http://weather.unisys.com/hurricane/index.php
University of Toronto. Global warming won't mean more storms: Big storms to
get bigger, small storms to shrink, experts predict. ScienceDaily, 29 January 2015.
www.sciencedaily.com/releases/2015/01/150129143040.htm
Villegas, P. (2004). Flood modelling in Perfume river basin, Hue province,
Vietnam (Doctoral dissertation, Master’s thesis, International institute for geo-
information science and earth observation (ITC), Enscede, the Netherlands).
Wang, J., Gao, W., Xu, S., & Yu, L. (2012). Evaluation of the combined risk of
sea level rise, land subsidence, and storm surges on the coastal areas of Shanghai,
China. Climatic change, 115(3-4), 537-558.
Weinkle, J., Maue, R., & Pielke Jr, R. (2012). Historical global tropical cyclone
landfalls. Journal of Climate, 25(13), 4729-4735.
Web Portal of Thua Thien Hue. Retrieved from http://www.thuathienhue.gov.vn/
on March 15th, 2016.
Webster, P. J., G. Holland, J. A. Curry, and H. R. Chang (2005). Changes in
tropical cyclone number, duration, and intensity in a warming environment. Science,
309, 1844–1846, doi:10.1126/science.1116448.
Texas Tech University, Thu Nguyen, December 2017
71
Woodruff, J. D., Irish, J. L., & Camargo, S. J. (2013). Coastal flooding by tropical
cyclones and sea-level rise. Nature, 504(7478), 44-52.
World Bank (2010). World development report 2010: development and climate
change. The World Bank, Washington.
Yang, X., & Rystedt, B. (2002). Predicting flood inundation and risk using GIS
and hydrodynamic model: a case study at Eskilstuna, Sweden. Indian Cartographer, 22,
183-191.
Yin, J., Yin, Z. E., Hu, X. M., Xu, S. Y., Wang, J., Li, Z. H., & Gan, F. B. (2011).
Multiple scenario analyses forecasting the confounding impacts of sea level rise and tides
from storm induced coastal flooding in the city of Shanghai, China. Environmental earth
sciences, 63(2), 407-414.
Yin, J., Yu, D., Yin, Z., Wang, J., & Xu, S. (2013). Modelling the combined
impacts of sea-level rise and land subsidence on storm tides induced flooding of the
Huangpu River in Shanghai, China. Climatic change, 119(3-4), 919-9

Texas Tech University, Thu Nguyen, December 2017
72