Embed Size (px)
Citation preview
Millhill
Carroll-South Hilton
Carroll Park
Shipley Hill
Carrollton Ridge
Gwynns Falls
Harlem Park
Penrose/Fayette Street Outreach
Franklin SquarePoppleton
Union Square
New Southwest/Mount Clare
Hollins Market
Mosher
Midtown-Edmondson
Boyd-Booth
Rosemont Homeowners/Tenants
Wilhelm Park
Franklintown Road
Washington Village/Pigtown
Carroll - Camden Industrial Area
Southwest Baltimore CSA and Neighborhoods
CommunityStatisticalAreas
0 0.40.2 Miles
Map created March 2014. The Baltimore Neighborhood Indicators Alliance - Jacob France Institute http://www.bniaj�.org
Vital Signs 16 Community Statistical Area (CSA) Profiles Bantimore CityPimlico/Arlington/iilltop
Population 2010 2013 2014 2015 2016
Change
15-16 % Change 2010 2013 2014 2015 2016
Change
15-16 % Change
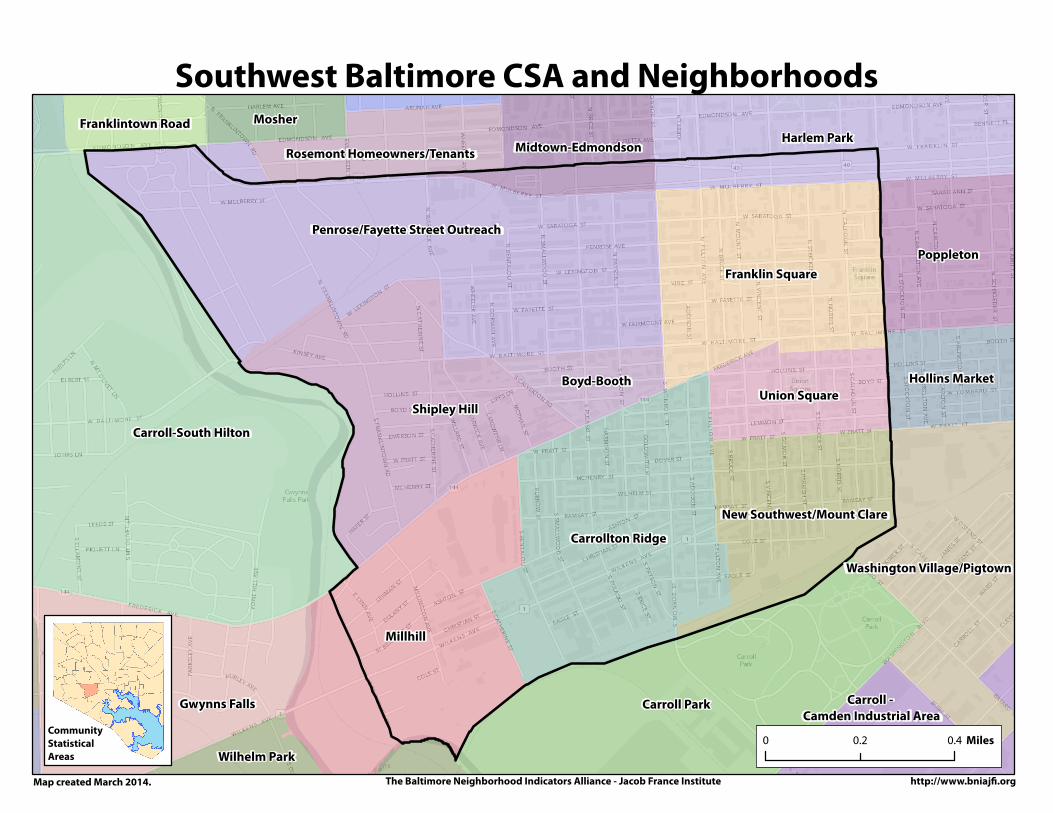
Total Population 17,885 -- -- -- -- -- -- 620,961 -- -- -- -- -- --
Total Male Population 8,685 -- -- -- -- -- -- 292,249 -- -- -- -- -- --
Total Female Population 9,200 -- -- -- -- -- -- 328,712 -- -- -- -- -- --
Race/Ethnicity*
Percent African American 75.8 -- -- -- 75.5 -- -- 63.8 -- -- -- 62.4 -- --
Percent White 16.8 -- -- -- 13.0 -- -- 28.3 -- -- -- 27.7 -- --
Percent Asian 1.1 -- -- -- 1.7 -- -- 2.3 -- -- -- 2.5 -- --
Percent Persons of Two or More Races 2.1 -- -- -- 2.3 -- -- 1.7 -- -- -- 2.0 -- --
Percent of Persons All Other Races 0.6 -- -- -- 1.0 -- -- 0.5 -- -- -- 0.6 -- --
Percent Hispanic 3.6 -- -- -- 6.5 -- -- 4.2 -- -- -- 4.8 -- --
Racial Diversity Index 43.1 -- -- -- 47.1 -- -- 54.5 -- -- -- 55.5 -- --
Age* -- -- --
Percent of Population Under 5 years old 8.0 -- -- -- 10.0 -- -- 6.6 -- -- -- 6.7 -- --
Percent of Population 5 - 17 years old 19.1 -- -- -- 18.8 -- -- 14.9 -- -- -- 14.5 -- --
Percent of Population 18 - 24 years old 11.0 -- -- -- 8.2 -- -- 12.6 -- -- -- 10.9 -- --
Percent of Population 25 - 64 years old 52.0 -- -- -- 52.5 -- -- 54.2 -- -- -- 55.7 -- --
Percent of Population 65 years and over 10.0 -- -- -- 10.6 -- -- 11.7 -- -- -- 12.3 -- --
Households
Total Households 6,288 -- -- -- -- -- -- 249,903 -- -- -- -- -- --
Percent of Female-Headed Households with Children Under 18 63.5 -- -- -- 59.9 -- -- 54.9 -- -- -- 52.6 -- --
Percent of Households with Children Under 18 36.4 -- -- -- 34.7 -- -- 28.4 -- -- -- 26.1 -- --
Average Household Size 2.8 -- -- -- 2.9 -- -- 2.4 -- -- -- 2.5 -- --
Income and Poverty* -- --
Median Household Income $28,514 -- -- -- $25,678 -- -- $38,346 -- -- -- $44,262 -- --
Percent of Households Earning Less than $25,000 43.8 -- -- -- 49.2 -- -- 34.7 -- -- -- 31.1 -- --
Percent of Households Earning $25,000 to $40,000 23.0 -- -- -- 17.9 -- -- 17.8 -- -- -- 15.1 -- --
Percent of Households Earning $40,000 to $60,000 17.2 -- -- -- 13.6 -- -- 16.6 -- -- -- 16.5 -- --
Percent of Households Earning $60,000 to $75,000 5.7 -- -- -- 8.0 -- -- 9.0 -- -- -- 8.9 -- --
Percent of Households Earning More than $75,000 10.4 -- -- -- 11.3 -- -- 21.8 -- -- -- 28.5 -- --
Percent of Households Living Below the Poverty Line -- -- -- 36.0 -- -- -- -- -- 18.3 -- --Percent of Children Living Below the Poverty Line -- -- -- 48.0 -- -- -- -- -- 33.3 -- --
Housing Market
Total Number of Homes Sold 187 105 152 143 154 11.0 7.7% 5,913 4,935 7,822 6,583 9,034 2,451 37.2%
Median Price of Homes Sold $22,500 $22,000 $23,250 $15,600 $29,144 $13,544 86.8% $115,000 $147,000 $126,325 $125,000 $138,000 $13,000 10.4%
Median Number of Days on Market 89 37 54 37 49 12.0 32.4% 101 33 38 37 33 -4.0 -10.8%
Percent of Homes Sold in Foreclosure (REO) 8.3 4.1 3.5 0.5 -3.0 -84.9% 3.4 2.0 1.6 1.0 -0.6 -34.9%
Percent of Homes Sold for Cash 89.0 86.4 88.0 84.1 -3.9 -4.4% 44.4 45.9 46.3 42.1 -4.1 -8.9%
Percent of Properties Under Mortgage Foreclosure 2.5 1.8 1.5 1.3 1.0 -0.3 -24.2% 2.2 2.5 2.0 1.7 1.4 -0.3 -16.8%
Percentage of Residential Tax Lien Sales 16.3 12.4 -4.0 5.4 4.6 -0.8 -14.3%
Percent of Properties that are Owner Occupied 29.4 26.1 25.0 25.0 23.6 -1.4 -- 60.2 57.2 56.1 56.1 54.9 -1.2 -2.1%
Percent of Residential Properties that Do Not Receive Mail 14.7 14.3 18.3 16.2 17.6 1.4 8.5% 7.5 7.6 8.4 7.5 8.2 0.6 8.2%
Housing Affordability
Affordability Index - Mortgage* 41.9 -- -- -- 30.8 -- -- 40.0 -- -- -- 35.8 -- --
Affordability Index - Rent* 54.5 -- -- -- 58.8 -- -- 52.7 -- -- -- 50.2 -- --
Rate of Housing Choice Vouchers per 1,000 Rental Units 139.2 134.9 120.4 -14.5 -10.7% 131.3 127.8 124.6 -3.1 -2.5%
* Previous data using the American Community Survey for 2007-2011, 2008-2012, 2009-2013, 2010-2014, 2011-2015 available upon request.
Southwest Baltimore
Southwest Baltimore Baltimore City
NA - Data was Not Available in that year
For more information, visit www.bniajfi.org 1 Vital Signs 16 | Community Statistical Area Profile
Vital Signs 16 Community Statistical Area (CSA) Profiles Bantimore CityPimlico/Arlington/iilltop Southwest Baltimore
Southwest Baltimore Baltimore City
Housing Tax Credits 2010 2013 2014 2015 2016
Change
15-16 % Change 2010 2013 2014 2015 2016
Change
15-16 % Change
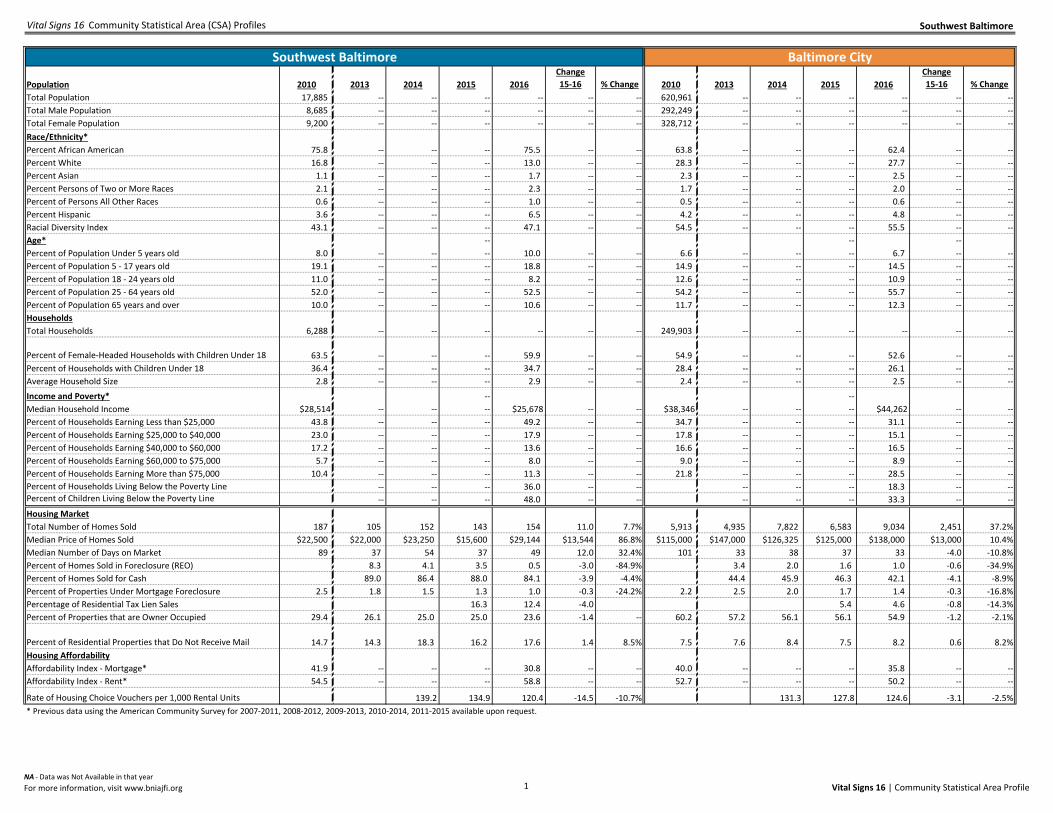
Homestead Tax Credits per 1,000 Homes 138.2 62.9 70.2 68.3 -1.9 -2.7% 380.2 272.7 258.5 251.7 -6.8 -2.6%
Homeowner's Tax Credits per 1,000 Homes 16.3 16.5 14.4 14.9 0.5 3.6% 49.3 49.4 46.5 45.3 -1.2 -2.6%
Historic Tax Credits per 1,000 Homes 3.9 3.9 5.6 6.3 0.7 13.3% 6.4 6.4 10.1 11.6 1.5 15.0%
Housing Permits and Enforcement
Percent of Properties with Rehab Permits (Over $5,000) 1.7 1.4 0.8 1.0 1.0 0.0 2.7% 2.5 3.1 2.7 2.9 3.2 0.3 10.5%
Number of New Construction Permits per 1,000 Homes 0.0 0.0 0.0 0.0 0.0 -- 0.8 2.3 2.4 1.3 -1.1 -45.8%
Number of Demolition Permits per 1,000 Homes 1.1 3.0 4.7 5.6 0.9 18.5% 1.9 2.1 3.8 3.5 -0.3 -7.9%
Percent of Properties that are Vacant and Abandoned 25.2 27.1 27.8 28.1 25.9 -2.1 -7.7% 7.9 8.0 8.1 8.2 8.0 -0.2 -2.2%
Percent of Vacant Properties Owned by Baltimore City 8.2 NA NA NA -- -- 15.2 NA NA NA -- --
Percent of Properties with Housing Violations 7.9 11.0 NA 3.5 3.4 -0.2 -5.2% 3.8 5.9 NA 2.4 2.7 0.3 11.7%
Total Residential Properties
Total Number of Residential Properties 8,243 8,217 8,252 8,252 8,234 -18 -0.2% 202,265 202,362 204,295 204,295 204,435 140 0.1%
Crime and Safety
Part 1 Crime Rate per 1,000 Residents 79.3 83.7 80.7 91.3 91.9 0.6 0.6% 61.4 63.3 60.5 65.1 63.0 -2.2 -3.3%
Violent Crime Rate per 1,000 Residents 28.8 23.8 23.9 27.6 30.5 3.0 10.8% 15.6 14.8 13.7 16.1 17.6 1.5 9.2%
Property Crime Rate per 1,000 Residents 58.5 55.8 62.6 59.7 -2.9 -4.6% 47.6 45.9 48.2 44.5 -3.7 -7.7%
Number of Adult Arrests per 1,000 Residents (Over the age of 18) 147.3 106.1 56.0 -50.1 -47.2% 48.7 30.9 21.5 -9.3 -30.2%
Juvenile Crime 0.0
Juvenile Arrest Rate per 1,000 Juveniles NA 84.3 84.8 81.4 NA -- -- NA 58.3 46.9 32.7 NA -- --
Juvenile Arrest Rate for Violent Offenses per 1,000 Juveniles NA 11.0 17.2 12.0 NA -- -- NA 13.9 13.8 8.5 NA -- --
Juvenile Arrest Rate for Drug-Related Offenses per 1,000
Juveniles NA 35.4 23.9 29.7 NA -- -- NA 14.6 9.9 4.7 NA -- --
Specific Crime Incidents
Domestic Violence Calls for Service per 1,000 Residents 72.0 NA NA NA NA -- -- 50.5 NA NA NA NA -- --
Number of Shootings per 1,000 Residents NA NA 9.2 4.6 -4.5 -49.4% NA NA 3.2 1.9 -1.3 -41.2%
Number of Gun-Related Homicides per 1,000 Residents 0.7 0.7 1.3 1.3 -0.1 -4.2% 0.3 0.3 0.5 0.4 0.0 -8.4%
Number of Common Assault Calls for Service per 1,000 Residents NA NA 136.7 99.0 -37.6 -27.5% NA NA 71.9 55.9 -16.0 -22.3%
Number of Narcotics Calls for Service per 1,000 Residents NA NA 237.1 167.6 -69.5 -29.3% NA NA 64.7 53.0 -11.7 -18.1%
Number of Automobile Accident Calls for Service per 1,000
Residents NA NA 96.7 NA -- -- NA NA 75.9 NA -- --
Personal Safety
Rate of Street Light Outages per 1,000 Residents 24.5 21.4
Student Attendance and Enrollment
Number of Students Enrolled in 1st - 5th Grade 1,305 1,336 1,355 1,366 11.0 0.8% 31,853 32,006 33,217 33,300 83 0.2%
Number of Students Enrolled in 6th - 8th Grade 682 679 664 645 -19.0 -2.9% 16,817 16,757 16,822 16,806 -16 -0.1%
Number of Students Enrolled in 9th - 12th Grade 869 840 836 820 -16.0 -1.9% 22,950 22,281 22,043 21,404 -639 -2.9%
Number of Students Ever Attended 1st - 5th Grade 1,663 1,364 1,376 1,405 1,411 6.0 0.4% 32,735 33,054 33,183 34,340 34,410 70 0.2%
Number of Students Ever Attended 6th - 8th Grade 813 697 693 682 656 -26.0 -3.8% 18,778 17,481 17,268 17,304 17,262 -42 -0.2%
Number of Students Ever Attended 9th - 12th Grade 1,154 897 858 831 856 25.0 3.0% 28,653 23,902 22,888 22,015 21,785 -230 -1.0%
Student Demographics 0.0
Percent of Students that are African American 86.1 84.4 84.4 84.1 83.9 -0.2 -0.3% 87.3 84.5 84.2 83.1 82.1 -1.0 -1.3%
Percent of Students that are White (non-Hispanic) 9.1 10.0 9.7 9.5 9.1 -0.4 -4.5% 7.3 8.1 8.1 8.0 7.9 -0.1 -1.2%
Percent of Students that are Hispanic 2.3 3.9 4.2 4.8 5.6 0.8 16.1% 2.9 5.6 6.1 7.3 8.4 1.1 15.5%
Percentage of Students Receiving Free or Reduced Meals 90.9 93.4 NA NA NA -- -- 83.2 85.1 NA NA NA -- --
Percentage of Students Enrolled in Special Education Programs 20.2 18.1 NA NA NA -- -- 17.3 16.2 NA NA NA -- --
NA - Data was Not Available in that year
For more information, visit www.bniajfi.org 2 Vital Signs 16 | Community Statistical Area Profile
Vital Signs 16 Community Statistical Area (CSA) Profiles Bantimore CityPimlico/Arlington/iilltop Southwest Baltimore
Southwest Baltimore Baltimore City
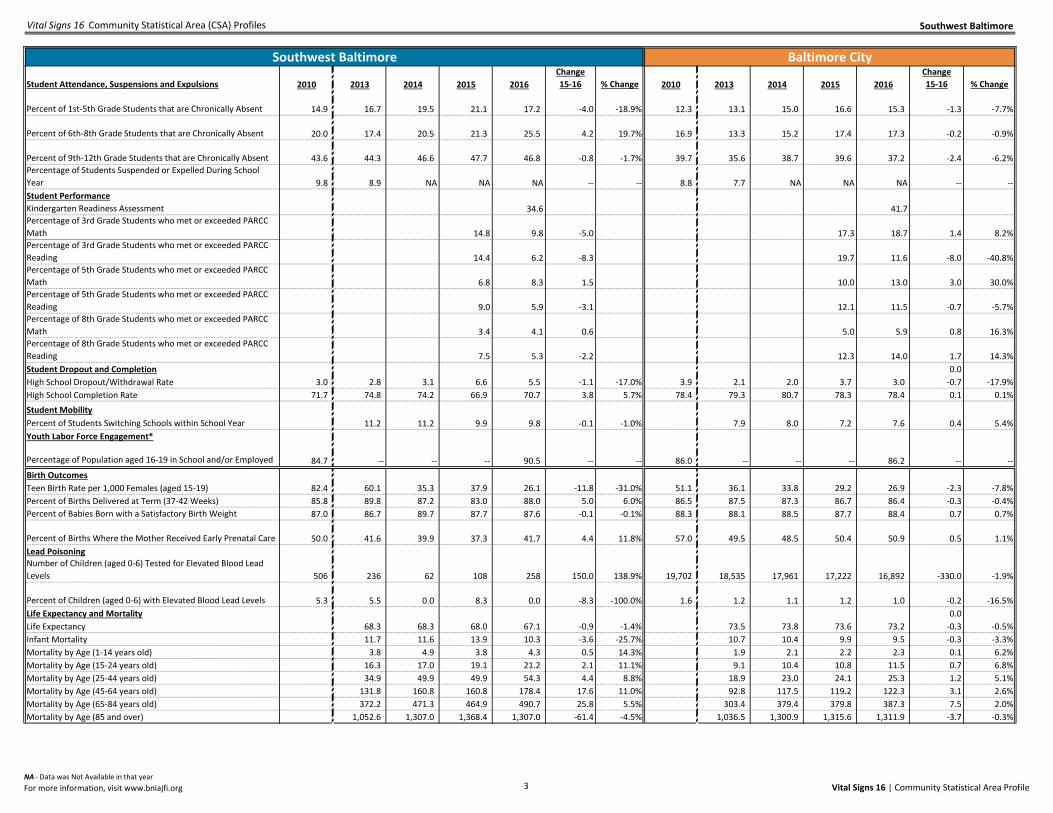
Student Attendance, Suspensions and Expulsions 2010 2013 2014 2015 2016
Change
15-16 % Change 2010 2013 2014 2015 2016
Change
15-16 % Change
Percent of 1st-5th Grade Students that are Chronically Absent 14.9 16.7 19.5 21.1 17.2 -4.0 -18.9% 12.3 13.1 15.0 16.6 15.3 -1.3 -7.7%
Percent of 6th-8th Grade Students that are Chronically Absent 20.0 17.4 20.5 21.3 25.5 4.2 19.7% 16.9 13.3 15.2 17.4 17.3 -0.2 -0.9%
Percent of 9th-12th Grade Students that are Chronically Absent 43.6 44.3 46.6 47.7 46.8 -0.8 -1.7% 39.7 35.6 38.7 39.6 37.2 -2.4 -6.2%
Percentage of Students Suspended or Expelled During School
Year 9.8 8.9 NA NA NA -- -- 8.8 7.7 NA NA NA -- --
Student Performance
Kindergarten Readiness Assessment 34.6 41.7
Percentage of 3rd Grade Students who met or exceeded PARCC
Math 14.8 9.8 -5.0 17.3 18.7 1.4 8.2%
Percentage of 3rd Grade Students who met or exceeded PARCC
Reading 14.4 6.2 -8.3 19.7 11.6 -8.0 -40.8%
Percentage of 5th Grade Students who met or exceeded PARCC
Math 6.8 8.3 1.5 10.0 13.0 3.0 30.0%
Percentage of 5th Grade Students who met or exceeded PARCC
Reading 9.0 5.9 -3.1 12.1 11.5 -0.7 -5.7%
Percentage of 8th Grade Students who met or exceeded PARCC
Math 3.4 4.1 0.6 5.0 5.9 0.8 16.3%
Percentage of 8th Grade Students who met or exceeded PARCC
Reading 7.5 5.3 -2.2 12.3 14.0 1.7 14.3%
Student Dropout and Completion 0.0
High School Dropout/Withdrawal Rate 3.0 2.8 3.1 6.6 5.5 -1.1 -17.0% 3.9 2.1 2.0 3.7 3.0 -0.7 -17.9%
High School Completion Rate 71.7 74.8 74.2 66.9 70.7 3.8 5.7% 78.4 79.3 80.7 78.3 78.4 0.1 0.1%
Student Mobility
Percent of Students Switching Schools within School Year 11.2 11.2 9.9 9.8 -0.1 -1.0% 7.9 8.0 7.2 7.6 0.4 5.4%
Youth Labor Force Engagement*
Percentage of Population aged 16-19 in School and/or Employed 84.7 -- -- -- 90.5 -- -- 86.0 -- -- -- 86.2 -- --
Birth Outcomes
Teen Birth Rate per 1,000 Females (aged 15-19) 82.4 60.1 35.3 37.9 26.1 -11.8 -31.0% 51.1 36.1 33.8 29.2 26.9 -2.3 -7.8%
Percent of Births Delivered at Term (37-42 Weeks) 85.8 89.8 87.2 83.0 88.0 5.0 6.0% 86.5 87.5 87.3 86.7 86.4 -0.3 -0.4%
Percent of Babies Born with a Satisfactory Birth Weight 87.0 86.7 89.7 87.7 87.6 -0.1 -0.1% 88.3 88.1 88.5 87.7 88.4 0.7 0.7%
Percent of Births Where the Mother Received Early Prenatal Care 50.0 41.6 39.9 37.3 41.7 4.4 11.8% 57.0 49.5 48.5 50.4 50.9 0.5 1.1%
Lead Poisoning
Number of Children (aged 0-6) Tested for Elevated Blood Lead
Levels 506 236 62 108 258 150.0 138.9% 19,702 18,535 17,961 17,222 16,892 -330.0 -1.9%
Percent of Children (aged 0-6) with Elevated Blood Lead Levels 5.3 5.5 0.0 8.3 0.0 -8.3 -100.0% 1.6 1.2 1.1 1.2 1.0 -0.2 -16.5%
Life Expectancy and Mortality 0.0
Life Expectancy 68.3 68.3 68.0 67.1 -0.9 -1.4% 73.5 73.8 73.6 73.2 -0.3 -0.5%
Infant Mortality 11.7 11.6 13.9 10.3 -3.6 -25.7% 10.7 10.4 9.9 9.5 -0.3 -3.3%
Mortality by Age (1-14 years old) 3.8 4.9 3.8 4.3 0.5 14.3% 1.9 2.1 2.2 2.3 0.1 6.2%
Mortality by Age (15-24 years old) 16.3 17.0 19.1 21.2 2.1 11.1% 9.1 10.4 10.8 11.5 0.7 6.8%
Mortality by Age (25-44 years old) 34.9 49.9 49.9 54.3 4.4 8.8% 18.9 23.0 24.1 25.3 1.2 5.1%
Mortality by Age (45-64 years old) 131.8 160.8 160.8 178.4 17.6 11.0% 92.8 117.5 119.2 122.3 3.1 2.6%
Mortality by Age (65-84 years old) 372.2 471.3 464.9 490.7 25.8 5.5% 303.4 379.4 379.8 387.3 7.5 2.0%
Mortality by Age (85 and over) 1,052.6 1,307.0 1,368.4 1,307.0 -61.4 -4.5% 1,036.5 1,300.9 1,315.6 1,311.9 -3.7 -0.3%
NA - Data was Not Available in that year
For more information, visit www.bniajfi.org 3 Vital Signs 16 | Community Statistical Area Profile

Vital Signs 16 Community Statistical Area (CSA) Profiles Bantimore CityPimlico/Arlington/iilltop Southwest Baltimore
Southwest Baltimore Baltimore City
2010 2013 2014 2015 2016
Change
15-16 % Change 2010 2013 2014 2015 2016
Change
15-16 % Change
Community Built and Food Environment
Liquor Outlet density (per 1,000 Residents) 2.2 2.1 2.2 2.2 0.0 0.0% 1.1 1.1 1.1 1.1 0.0 -3.4%
Fast Food Outlet Density (per 1,000 Residents) 2.3 NA NA NA -- -- 1.5 NA NA NA -- --
Average Healthy Food Availability Index NA NA 8.9 NA -- -- NA NA 9.4 NA -- --
Social Assistance Programs and Assistance
Percent of Families Receiving TANF 21.5 22.7 19.1 17.5 -1.7 -8.8% 9.8 9.7 8.7 7.9 -0.8 -9.2%
Public Art and Events
Number of Persons with Library Cards per 1,000 Residents 177 296 324 271 -52 -16.2% 210 342 363 313 -49.6 -13.7%
Number of Event Permits Requested per 1,000 Residents 1.0 1.4 0.9 -0.5 -36.0% 1.4 1.4 1.7 0.3 24.1%
Public Art per 1,000 Residents 1.5 1.5 1.5 0.0 0.0% 1.2 1.2 1.3 0.1 7.4%
Number of Public Murals 17 17 16 -1.0 -5.9% 218 226 295 69 30.5%
Art and Culture Economy
Number of Businesses that are Arts-Related per 1,000 Residents 0.1 0.3 0.2 0.1 0.2 0.1 50.0% 0.5 0.7 0.7 0.7 0.6 -0.1 -9.5%
Total Employment in Arts-Related Businesses 8 18 13 7 18 11 157.1% 2,837 4,258 4,014 4,177 4,353 176 4.2%
Rate of Businesses in the Creative Economy per 1,000 Residents 0.7 0.7 0.5 0.5 0 0.0% 1.7 1.6 1.6 1.4 -0.2 -10.5%
Total Employment in the Creative Economy 62 60 41 47 6 14.6% 14,369 12,619 15,477 16,090 613 4.0%
Labor Force Participation and Employment*
Percent Population 16-64 Employed 48.7 -- -- -- 49.4 -- -- 62.2 -- -- -- 61.6 -- --
Percent Population 16-64 Unemployed and Looking for Work 16.1 -- -- -- 9.9 -- -- 8.2 -- -- -- 8.9 -- --
Percent Population 16-64 Not in Labor Force 35.2 -- -- -- 40.9 -- -- 29.6 -- -- -- 30.3 -- --
Unemployment Rate 24.8 -- -- -- 16.8 -- -- 11.7 -- -- -- 12.8 -- --
Percent of Adult Population on Parole/Probation 11.1 NA NA NA -- -- 5.3 NA NA NA -- --
Educational Attainment (Population Age 25+)*
Percent with Less Than a High School Diploma or GED -- -- -- 33.4 -- -- -- -- -- 16.5 -- --
Percent with High School Diploma/Some College/ Associates
Degree -- -- -- 58.6 -- -- -- -- -- 53.7 -- --
Percent with a Bachelor's Degree or Above -- -- -- 8.0 -- -- -- -- -- 29.7 -- --
Commercial Business Activity
Total Number of Commercial Properties 700 697 648 648 648 0 0.0% 15,828 15,521 15,331 15,331 15,317 -- --
Percent of Commercial Properties with Rehab Permits Above
$5,000 3.0 1.6 3.5 2.9 2.8 -0.2 -5.3% 12.4 13.0 12.9 13.4 12.7 -0.7 -4.9%
Business and Employment
Total Number of Businesses 452 519 472 453 360 -93 -20.5% 20,243 22,869 21,127 21,195 19,019 -2,176 -10.3%
Number of Total Jobs Filled by Employees 2,959 3,046 3,139 3,331 NA -- -- 320,010 335,497 344,588 350,797 NA -- --
Number of Businesses with Under 50 Employees 443 500 449 429 345 -84 -19.6% 19,321 21,572 19,772 19,715 17,416 -2,299 -11.7%
Percent of Businesses that are 1 year old or less 9.3 7.7 6.8 7.9 2.2 -5.7 -72.0% 8.0 5.2 6.5 7.8 6.1 -1.7 -21.4%
Percent of Businesses that are 2 years old or less 20.6 24.3 17.8 14.1 10.3 -3.9 -27.3% 20.0 21.8 14.2 15.1 18.6 3.6 23.7%
Percent of Businesses that are 4 years old or less 33.4 43.2 41.9 32.9 23.3 -9.6 -29.1% 34.2 38.1 39.1 32.9 29.5 -3.4 -10.3%
Number of Businesses by Selected Neighborhood Industry 324 378 331 317 254 -63 -19.9% 14,116 15,833 14,322 14,489 13,154 -1,335 -9.2%
Neighborhood Businesses per 1,000 residents 18.1 21.1 18.5 17.7 14.2 -3.5 -19.9% 22.7 25.4 23.1 23.3 21.2 -2.1 -9.2%
Total Number of Employees by Selected Neighborhood Industry 2,564 1,916 1,729 2,668 2,285 -383 -14.4% 204,596 183,725 197,089 205,862 196,224 -9,638 -4.7%
Banking
Number of Banks and Bank Branches per 1,000 Residents 0.1 0.1 0.1 0.1 0.0 0.0% 0.2 0.2 0.2 0.2 0.0 1.7%
Regional Dynamics
Percentage of Residents Commuting to Work Outside of City 56.9 60.9 60.9 58.7 NA -- -- 54.2 60.6 53.1 53.5 NA -- --
* Previous data using the American Community Survey for 2007-2011, 2008-2012, 2009-2013, 2010-2014, 2011-2015 available upon request.
NA - Data was Not Available in that year
For more information, visit www.bniajfi.org 4 Vital Signs 16 | Community Statistical Area Profile
Vital Signs 16 Community Statistical Area (CSA) Profiles Bantimore CityPimlico/Arlington/iilltop Southwest Baltimore
Southwest Baltimore Baltimore City
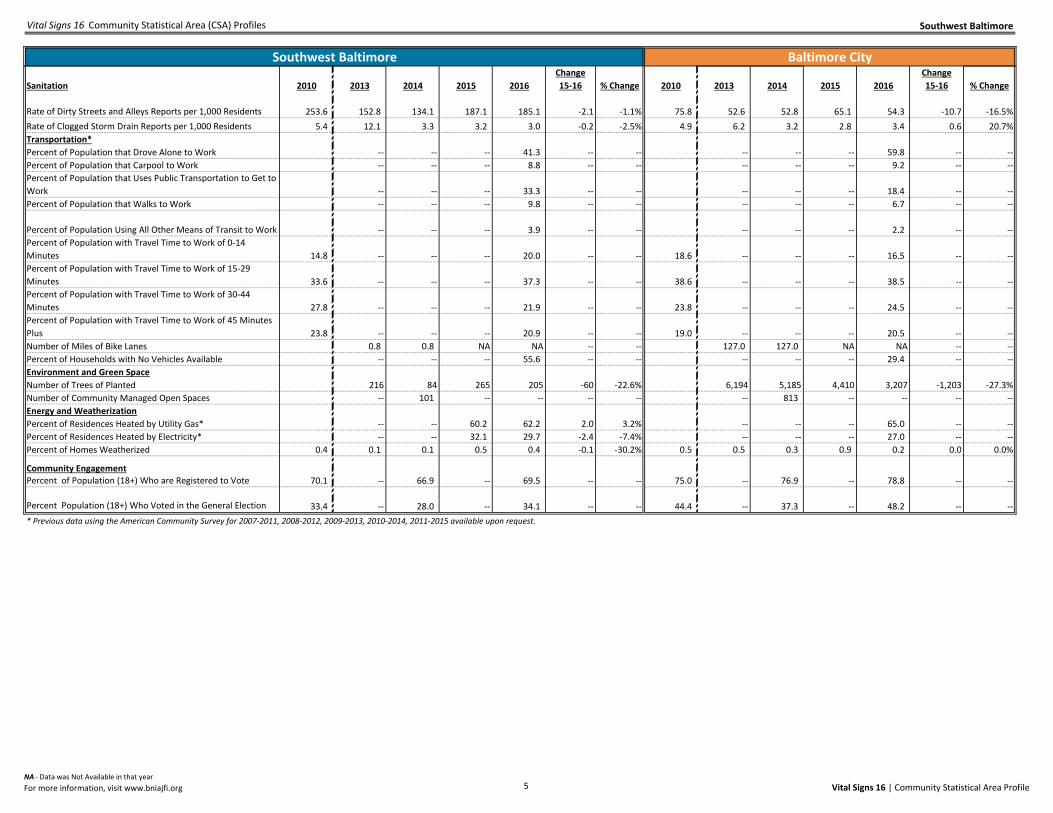
Sanitation 2010 2013 2014 2015 2016
Change
15-16 % Change 2010 2013 2014 2015 2016
Change
15-16 % Change
Rate of Dirty Streets and Alleys Reports per 1,000 Residents 253.6 152.8 134.1 187.1 185.1 -2.1 -1.1% 75.8 52.6 52.8 65.1 54.3 -10.7 -16.5%
Rate of Clogged Storm Drain Reports per 1,000 Residents 5.4 12.1 3.3 3.2 3.0 -0.2 -2.5% 4.9 6.2 3.2 2.8 3.4 0.6 20.7%
Transportation*
Percent of Population that Drove Alone to Work -- -- -- 41.3 -- -- -- -- -- 59.8 -- --
Percent of Population that Carpool to Work -- -- -- 8.8 -- -- -- -- -- 9.2 -- --
Percent of Population that Uses Public Transportation to Get to
Work -- -- -- 33.3 -- -- -- -- -- 18.4 -- --
Percent of Population that Walks to Work -- -- -- 9.8 -- -- -- -- -- 6.7 -- --
Percent of Population Using All Other Means of Transit to Work -- -- -- 3.9 -- -- -- -- -- 2.2 -- --
Percent of Population with Travel Time to Work of 0-14
Minutes 14.8 -- -- -- 20.0 -- -- 18.6 -- -- -- 16.5 -- --
Percent of Population with Travel Time to Work of 15-29
Minutes 33.6 -- -- -- 37.3 -- -- 38.6 -- -- -- 38.5 -- --
Percent of Population with Travel Time to Work of 30-44
Minutes 27.8 -- -- -- 21.9 -- -- 23.8 -- -- -- 24.5 -- --
Percent of Population with Travel Time to Work of 45 Minutes
Plus 23.8 -- -- -- 20.9 -- -- 19.0 -- -- -- 20.5 -- --
Number of Miles of Bike Lanes 0.8 0.8 NA NA -- -- 127.0 127.0 NA NA -- --
Percent of Households with No Vehicles Available -- -- -- 55.6 -- -- -- -- -- 29.4 -- --
Environment and Green Space
Number of Trees of Planted 216 84 265 205 -60 -22.6% 6,194 5,185 4,410 3,207 -1,203 -27.3%
Number of Community Managed Open Spaces -- 101 -- -- -- -- -- 813 -- -- -- --
Energy and Weatherization
Percent of Residences Heated by Utility Gas* -- -- 60.2 62.2 2.0 3.2% -- -- -- 65.0 -- --
Percent of Residences Heated by Electricity* -- -- 32.1 29.7 -2.4 -7.4% -- -- -- 27.0 -- --
Percent of Homes Weatherized 0.4 0.1 0.1 0.5 0.4 -0.1 -30.2% 0.5 0.5 0.3 0.9 0.2 0.0 0.0%
Community EngagementPercent of Population (18+) Who are Registered to Vote 70.1 -- 66.9 -- 69.5 -- -- 75.0 -- 76.9 -- 78.8 -- --
Percent Population (18+) Who Voted in the General Election 33.4 -- 28.0 -- 34.1 -- -- 44.4 -- 37.3 -- 48.2 -- --
* Previous data using the American Community Survey for 2007-2011, 2008-2012, 2009-2013, 2010-2014, 2011-2015 available upon request.
NA - Data was Not Available in that year
For more information, visit www.bniajfi.org 5 Vital Signs 16 | Community Statistical Area Profile