Embed Size (px)
Citation preview
Boston-Logan International Airport 2016 EDR
E Activity Levels This appendix provides detailed tables in support of Chapter 2, Activity Levels:
Table E-1 Logan Airport Historical Air Passenger and Operations Data
Table E-2 Logan Airport Changes in Domestic Passenger Operations by Carrier
Table E-3 Logan Airport Changes in International Passenger Operations by Carrier
Table E-4 Logan Airport Scheduled Passenger Departures by Destination
Appendix E, Activity Levels E-1

Boston-Logan International Airport 2016 EDR
This Page Intentionally Left Blank.
Appendix E, Activity Levels E-2
Boston-Logan International Airport 2016 EDR
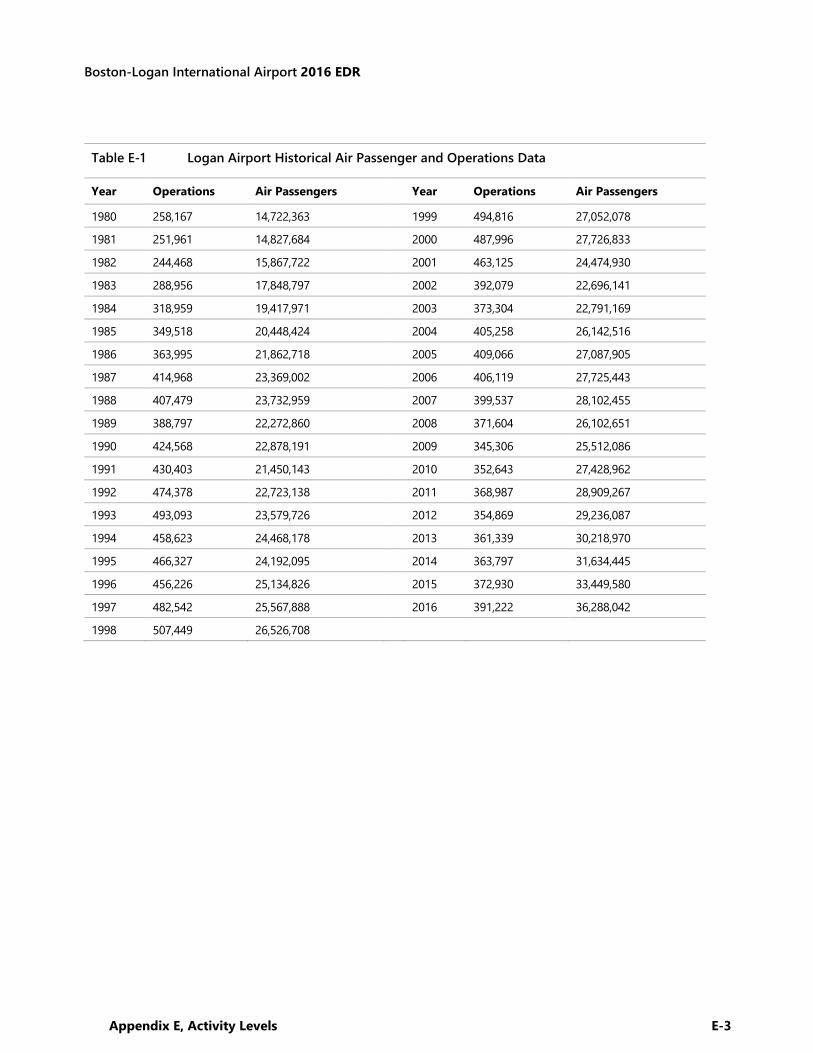
Table E-1 Logan Airport Historical Air Passenger and Operations Data
Year Operations Air Passengers Year Operations Air Passengers
1980 258,167 14,722,363 1999 494,816 27,052,078 1981 251,961 14,827,684 2000 487,996 27,726,833 1982 244,468 15,867,722 2001 463,125 24,474,930 1983 288,956 17,848,797 2002 392,079 22,696,141 1984 318,959 19,417,971 2003 373,304 22,791,169 1985 349,518 20,448,424 2004 405,258 26,142,516 1986 363,995 21,862,718 2005 409,066 27,087,905 1987 414,968 23,369,002 2006 406,119 27,725,443 1988 407,479 23,732,959 2007 399,537 28,102,455 1989 388,797 22,272,860 2008 371,604 26,102,651 1990 424,568 22,878,191 2009 345,306 25,512,086 1991 430,403 21,450,143 2010 352,643 27,428,962 1992 474,378 22,723,138 2011 368,987 28,909,267 1993 493,093 23,579,726 2012 354,869 29,236,087 1994 458,623 24,468,178 2013 361,339 30,218,970 1995 466,327 24,192,095 2014 363,797 31,634,445 1996 456,226 25,134,826 2015 372,930 33,449,580 1997 482,542 25,567,888 2016 391,222 36,288,042 1998 507,449 26,526,708
Appendix E, Activity Levels E-3

Boston-Logan International Airport 2016 EDR
This Page Intentionally Left Blank.
Appendix E, Activity Levels E-4
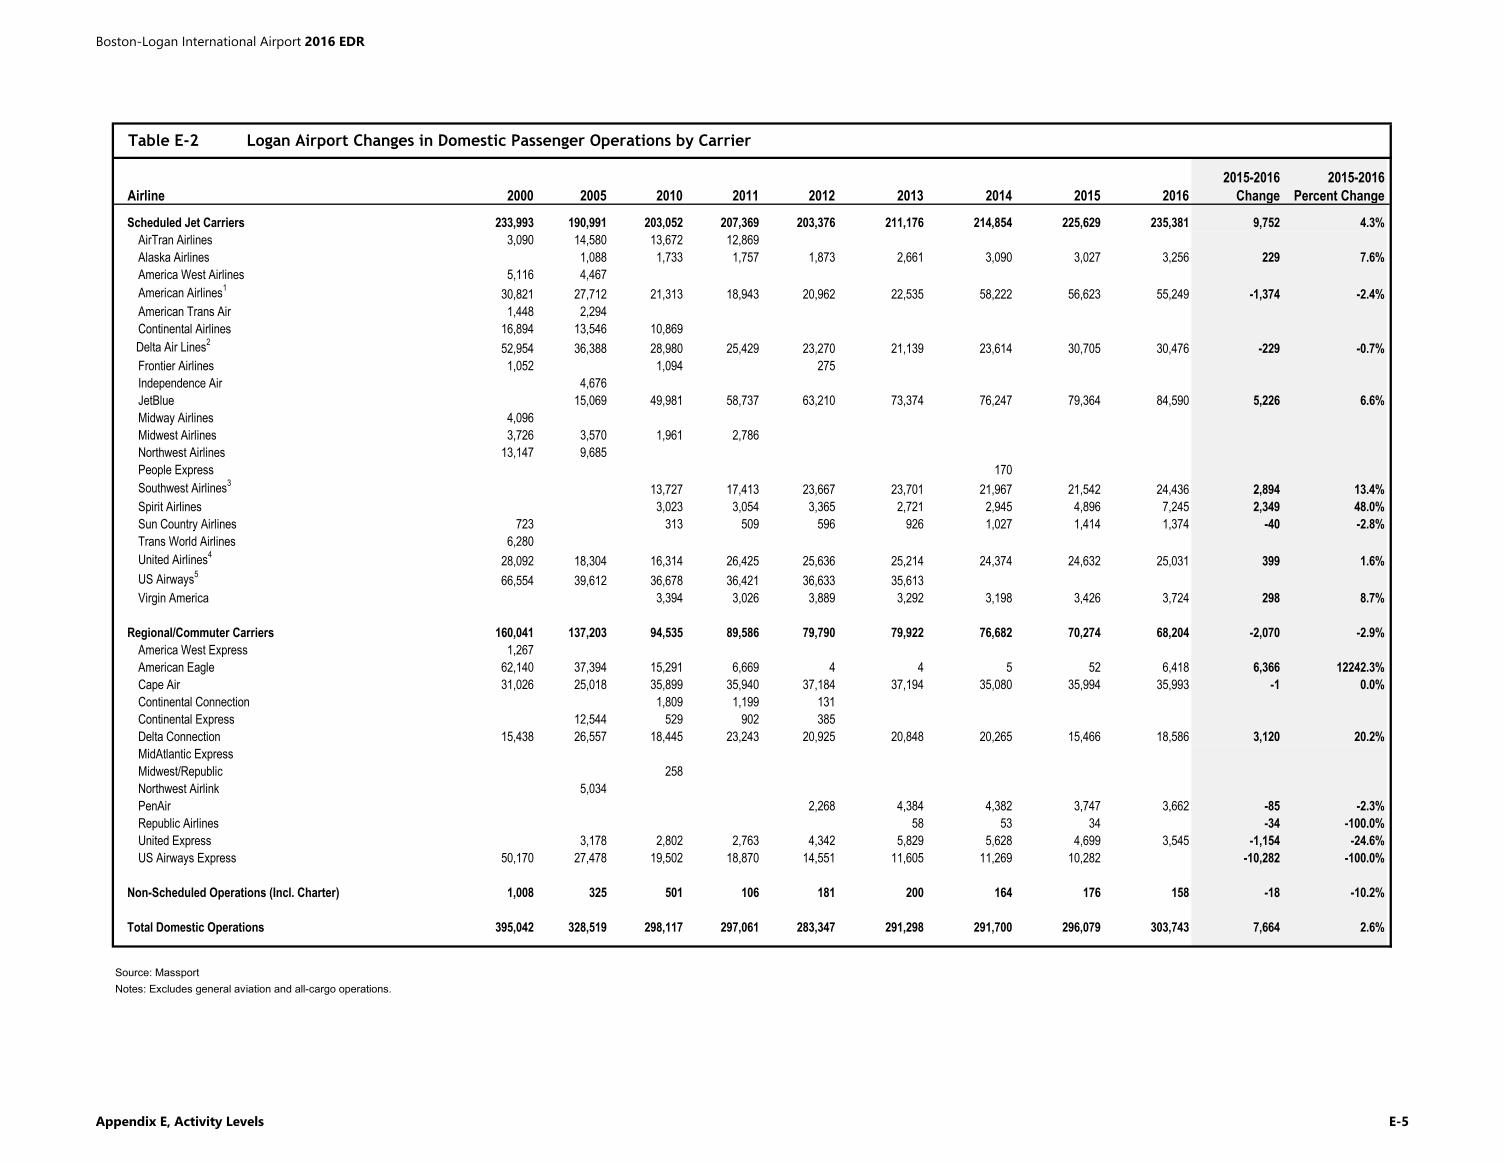
Table E-2 Logan Airport Changes in Domestic Passenger Operations by Carrier
Airline 2000 2005 2010 2011 2012 2013 2014 2015 2016
2015-2016
Change
2015-2016
Percent Change
Scheduled Jet Carriers 233,993 190,991 203,052 207,369 203,376 211,176 214,854 225,629 235,381 9,752 4.3%
AirTran Airlines 3,090 14,580 13,672 12,869
Alaska Airlines 1,088 1,733 1,757 1,873 2,661 3,090 3,027 3,256 229 7.6%
America West Airlines 5,116 4,467
American Airlines1
30,821 27,712 21,313 18,943 20,962 22,535 58,222 56,623 55,249 -1,374 -2.4%
American Trans Air 1,448 2,294
Continental Airlines 16,894 13,546 10,869
Delta Air Lines2
52,954 36,388 28,980 25,429 23,270 21,139 23,614 30,705 30,476 -229 -0.7%
Frontier Airlines 1,052 1,094 275
Independence Air 4,676
JetBlue 15,069 49,981 58,737 63,210 73,374 76,247 79,364 84,590 5,226 6.6%
Midway Airlines 4,096
Midwest Airlines 3,726 3,570 1,961 2,786
Northwest Airlines 13,147 9,685
People Express 170
Southwest Airlines3
13,727 17,413 23,667 23,701 21,967 21,542 24,436 2,894 13.4%
Spirit Airlines 3,023 3,054 3,365 2,721 2,945 4,896 7,245 2,349 48.0%
Sun Country Airlines 723 313 509 596 926 1,027 1,414 1,374 -40 -2.8%
Trans World Airlines 6,280
United Airlines4
28,092 18,304 16,314 26,425 25,636 25,214 24,374 24,632 25,031 399 1.6%
US Airways5
66,554 39,612 36,678 36,421 36,633 35,613
Virgin America 3,394 3,026 3,889 3,292 3,198 3,426 3,724 298 8.7%
Regional/Commuter Carriers 160,041 137,203 94,535 89,586 79,790 79,922 76,682 70,274 68,204 -2,070 -2.9%
America West Express 1,267
American Eagle 62,140 37,394 15,291 6,669 4 4 5 52 6,418 6,366 12242.3%
Cape Air 31,026 25,018 35,899 35,940 37,184 37,194 35,080 35,994 35,993 -1 0.0%
Continental Connection 1,809 1,199 131
Continental Express 12,544 529 902 385
Delta Connection 15,438 26,557 18,445 23,243 20,925 20,848 20,265 15,466 18,586 3,120 20.2%
MidAtlantic Express
Midwest/Republic 258
Northwest Airlink 5,034
PenAir 2,268 4,384 4,382 3,747 3,662 -85 -2.3%
Republic Airlines 58 53 34 -34 -100.0%
United Express 3,178 2,802 2,763 4,342 5,829 5,628 4,699 3,545 -1,154 -24.6%
US Airways Express 50,170 27,478 19,502 18,870 14,551 11,605 11,269 10,282 -10,282 -100.0%
Non-Scheduled Operations (Incl. Charter) 1,008 325 501 106 181 200 164 176 158 -18 -10.2%
Total Domestic Operations 395,042 328,519 298,117 297,061 283,347 291,298 291,700 296,079 303,743 7,664 2.6%
Source: MassportNotes: Excludes general aviation and all-cargo operations.
Boston-Logan International Airport 2016 EDR
Appendix E, Activity Levels E-5
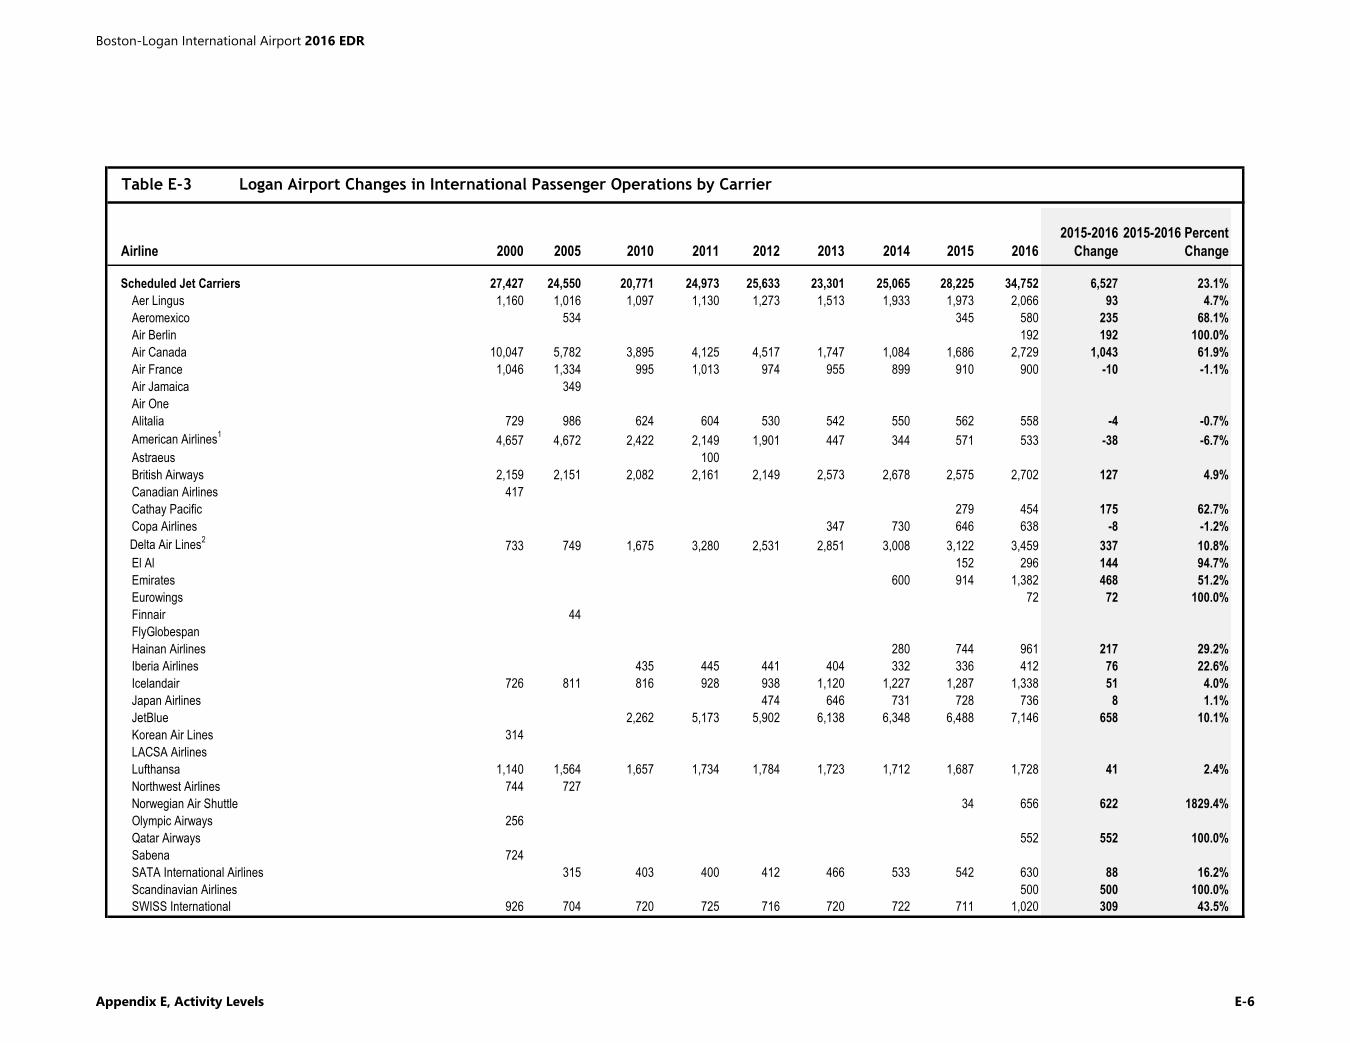
Table E-3 Logan Airport Changes in International Passenger Operations by Carrier
Airline 2000 2005 2010 2011 2012 2013 2014 2015 2016
2015-2016
Change
2015-2016 Percent
Change
Scheduled Jet Carriers 27,427 24,550 20,771 24,973 25,633 23,301 25,065 28,225 34,752 6,527 23.1%
Aer Lingus 1,160 1,016 1,097 1,130 1,273 1,513 1,933 1,973 2,066 93 4.7%
Aeromexico 534 345 580 235 68.1%
Air Berlin 192 192 100.0%
Air Canada 10,047 5,782 3,895 4,125 4,517 1,747 1,084 1,686 2,729 1,043 61.9%
Air France 1,046 1,334 995 1,013 974 955 899 910 900 -10 -1.1%
Air Jamaica 349
Air One
Alitalia 729 986 624 604 530 542 550 562 558 -4 -0.7%
American Airlines1
4,657 4,672 2,422 2,149 1,901 447 344 571 533 -38 -6.7%
Astraeus 100
British Airways 2,159 2,151 2,082 2,161 2,149 2,573 2,678 2,575 2,702 127 4.9%
Canadian Airlines 417
Cathay Pacific 279 454 175 62.7%
Copa Airlines 347 730 646 638 -8 -1.2%
Delta Air Lines2
733 749 1,675 3,280 2,531 2,851 3,008 3,122 3,459 337 10.8%
El Al 152 296 144 94.7%
Emirates 600 914 1,382 468 51.2%
Eurowings 72 72 100.0%
Finnair 44
FlyGlobespan
Hainan Airlines 280 744 961 217 29.2%
Iberia Airlines 435 445 441 404 332 336 412 76 22.6%
Icelandair 726 811 816 928 938 1,120 1,227 1,287 1,338 51 4.0%
Japan Airlines 474 646 731 728 736 8 1.1%
JetBlue 2,262 5,173 5,902 6,138 6,348 6,488 7,146 658 10.1%
Korean Air Lines 314
LACSA Airlines
Lufthansa 1,140 1,564 1,657 1,734 1,784 1,723 1,712 1,687 1,728 41 2.4%
Northwest Airlines 744 727
Norwegian Air Shuttle 34 656 622 1829.4%
Olympic Airways 256
Qatar Airways 552 552 100.0%
Sabena 724
SATA International Airlines 315 403 400 412 466 533 542 630 88 16.2%
Scandinavian Airlines 500 500 100.0%
SWISS International 926 704 720 725 716 720 722 711 1,020 309 43.5%
Boston-Logan International Airport 2016 EDR
Appendix E, Activity Levels E-6
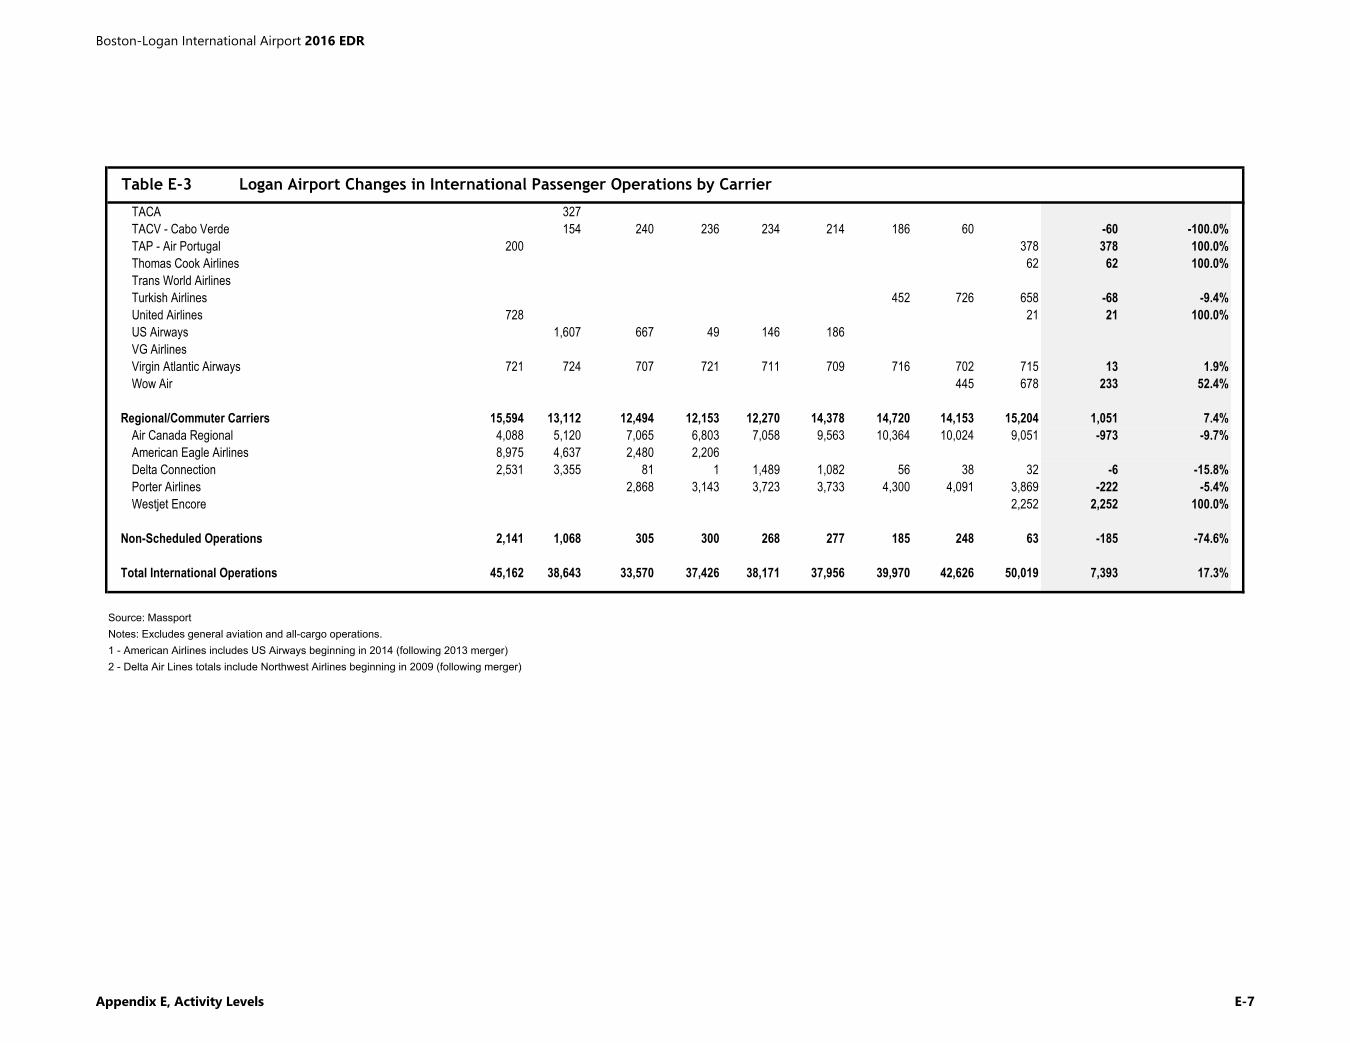
Table E-3 Logan Airport Changes in International Passenger Operations by Carrier
TACA 327
TACV - Cabo Verde 154 240 236 234 214 186 60 -60 -100.0%
TAP - Air Portugal 200 378 378 100.0%
Thomas Cook Airlines 62 62 100.0%
Trans World Airlines
Turkish Airlines 452 726 658 -68 -9.4%
United Airlines 728 21 21 100.0%
US Airways 1,607 667 49 146 186
VG Airlines
Virgin Atlantic Airways 721 724 707 721 711 709 716 702 715 13 1.9%
Wow Air 445 678 233 52.4%
Regional/Commuter Carriers 15,594 13,112 12,494 12,153 12,270 14,378 14,720 14,153 15,204 1,051 7.4%
Air Canada Regional 4,088 5,120 7,065 6,803 7,058 9,563 10,364 10,024 9,051 -973 -9.7%
American Eagle Airlines 8,975 4,637 2,480 2,206
Delta Connection 2,531 3,355 81 1 1,489 1,082 56 38 32 -6 -15.8%
Porter Airlines 2,868 3,143 3,723 3,733 4,300 4,091 3,869 -222 -5.4%
Westjet Encore 2,252 2,252 100.0%
Non-Scheduled Operations 2,141 1,068 305 300 268 277 185 248 63 -185 -74.6%
Total International Operations 45,162 38,643 33,570 37,426 38,171 37,956 39,970 42,626 50,019 7,393 17.3%
Source: MassportNotes: Excludes general aviation and all-cargo operations.1 - American Airlines includes US Airways beginning in 2014 (following 2013 merger)2 - Delta Air Lines totals include Northwest Airlines beginning in 2009 (following merger)
Boston-Logan International Airport 2016 EDR
Appendix E, Activity Levels E-7
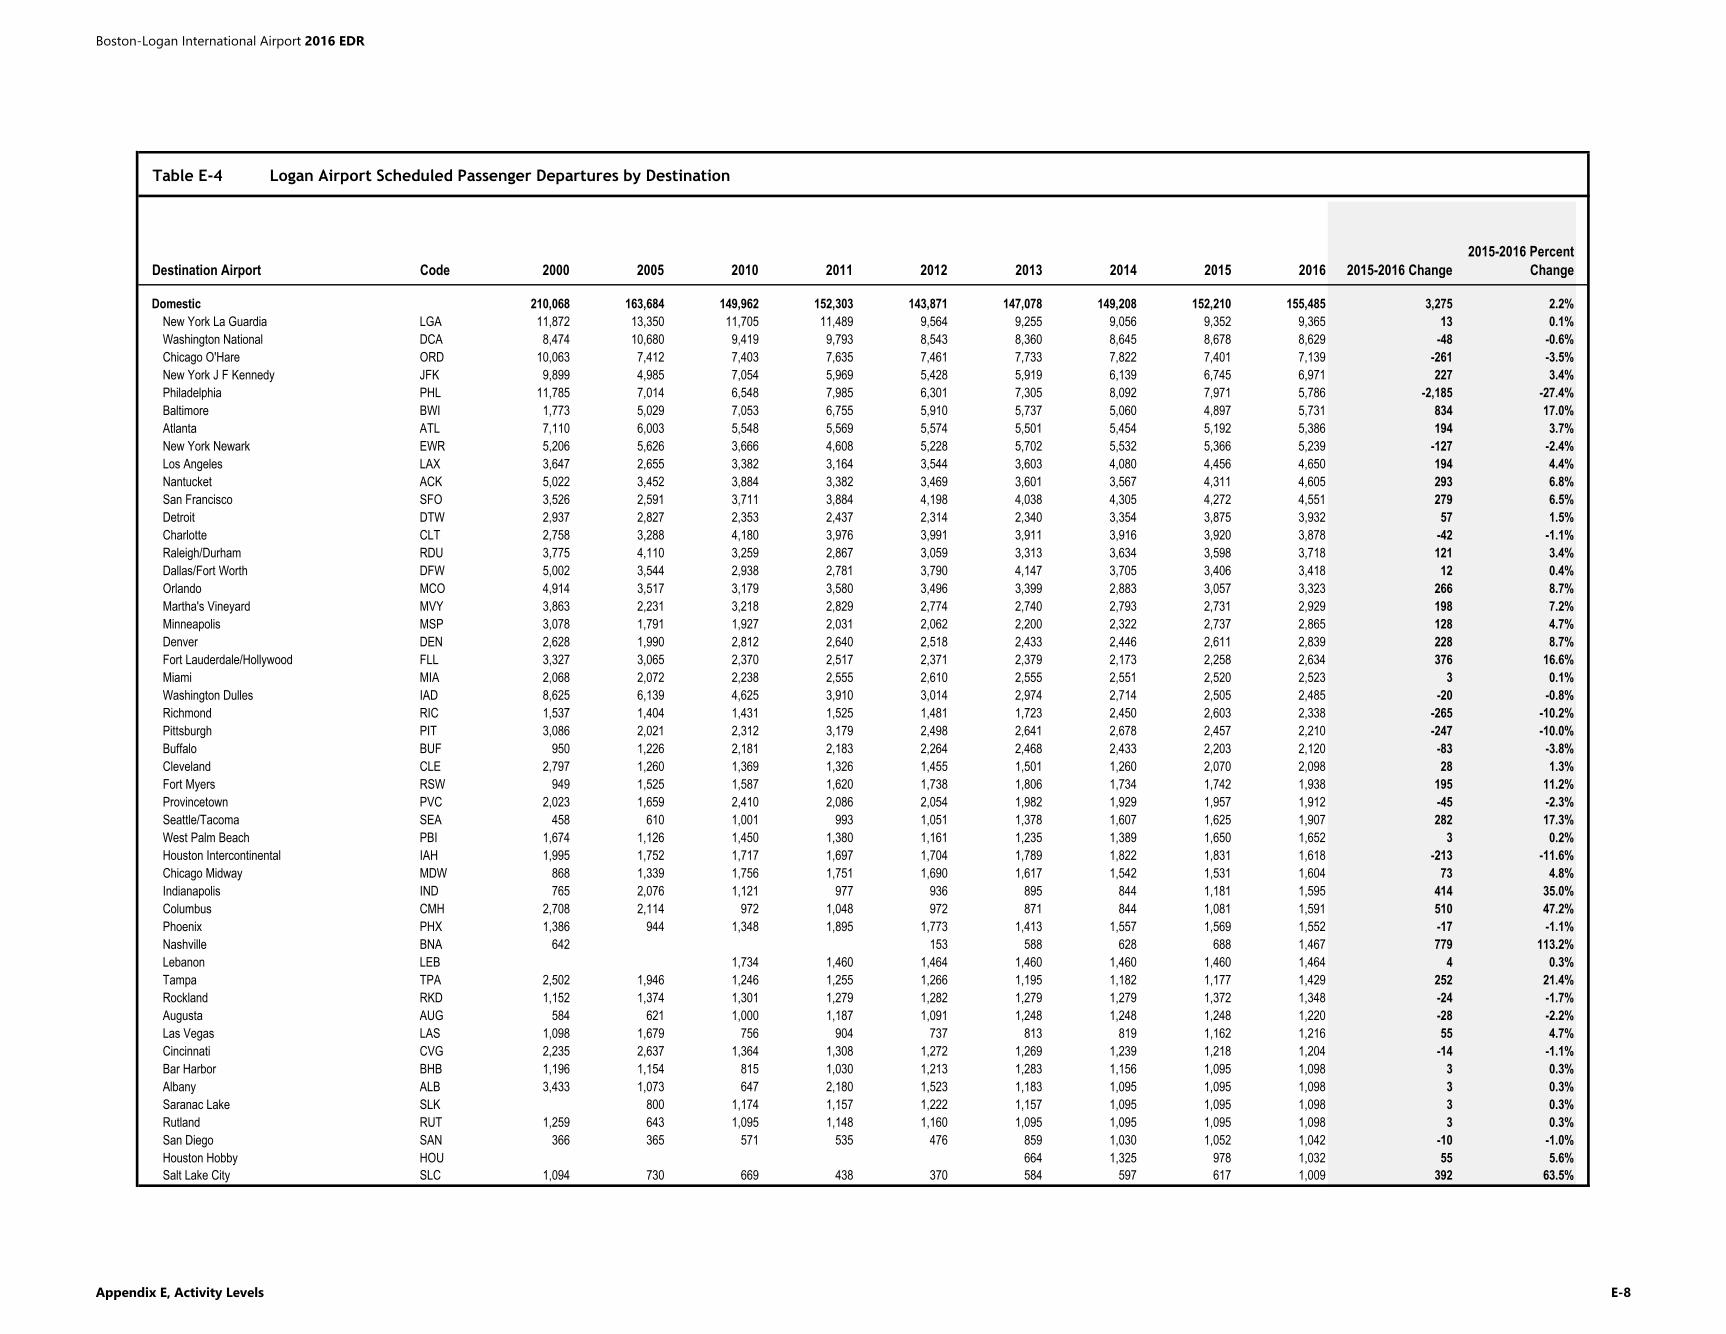
Table E-4 Logan Airport Scheduled Passenger Departures by Destination
Destination Airport Code 2000 2005 2010 2011 2012 2013 2014 2015 2016 2015-2016 Change
2015-2016 Percent
Change
Domestic 210,068 163,684 149,962 152,303 143,871 147,078 149,208 152,210 155,485 3,275 2.2%
New York La Guardia LGA 11,872 13,350 11,705 11,489 9,564 9,255 9,056 9,352 9,365 13 0.1%
Washington National DCA 8,474 10,680 9,419 9,793 8,543 8,360 8,645 8,678 8,629 -48 -0.6%
Chicago O'Hare ORD 10,063 7,412 7,403 7,635 7,461 7,733 7,822 7,401 7,139 -261 -3.5%
New York J F Kennedy JFK 9,899 4,985 7,054 5,969 5,428 5,919 6,139 6,745 6,971 227 3.4%
Philadelphia PHL 11,785 7,014 6,548 7,985 6,301 7,305 8,092 7,971 5,786 -2,185 -27.4%
Baltimore BWI 1,773 5,029 7,053 6,755 5,910 5,737 5,060 4,897 5,731 834 17.0%
Atlanta ATL 7,110 6,003 5,548 5,569 5,574 5,501 5,454 5,192 5,386 194 3.7%
New York Newark EWR 5,206 5,626 3,666 4,608 5,228 5,702 5,532 5,366 5,239 -127 -2.4%
Los Angeles LAX 3,647 2,655 3,382 3,164 3,544 3,603 4,080 4,456 4,650 194 4.4%
Nantucket ACK 5,022 3,452 3,884 3,382 3,469 3,601 3,567 4,311 4,605 293 6.8%
San Francisco SFO 3,526 2,591 3,711 3,884 4,198 4,038 4,305 4,272 4,551 279 6.5%
Detroit DTW 2,937 2,827 2,353 2,437 2,314 2,340 3,354 3,875 3,932 57 1.5%
Charlotte CLT 2,758 3,288 4,180 3,976 3,991 3,911 3,916 3,920 3,878 -42 -1.1%
Raleigh/Durham RDU 3,775 4,110 3,259 2,867 3,059 3,313 3,634 3,598 3,718 121 3.4%
Dallas/Fort Worth DFW 5,002 3,544 2,938 2,781 3,790 4,147 3,705 3,406 3,418 12 0.4%
Orlando MCO 4,914 3,517 3,179 3,580 3,496 3,399 2,883 3,057 3,323 266 8.7%
Martha's Vineyard MVY 3,863 2,231 3,218 2,829 2,774 2,740 2,793 2,731 2,929 198 7.2%
Minneapolis MSP 3,078 1,791 1,927 2,031 2,062 2,200 2,322 2,737 2,865 128 4.7%
Denver DEN 2,628 1,990 2,812 2,640 2,518 2,433 2,446 2,611 2,839 228 8.7%
Fort Lauderdale/Hollywood FLL 3,327 3,065 2,370 2,517 2,371 2,379 2,173 2,258 2,634 376 16.6%
Miami MIA 2,068 2,072 2,238 2,555 2,610 2,555 2,551 2,520 2,523 3 0.1%
Washington Dulles IAD 8,625 6,139 4,625 3,910 3,014 2,974 2,714 2,505 2,485 -20 -0.8%
Richmond RIC 1,537 1,404 1,431 1,525 1,481 1,723 2,450 2,603 2,338 -265 -10.2%
Pittsburgh PIT 3,086 2,021 2,312 3,179 2,498 2,641 2,678 2,457 2,210 -247 -10.0%
Buffalo BUF 950 1,226 2,181 2,183 2,264 2,468 2,433 2,203 2,120 -83 -3.8%
Cleveland CLE 2,797 1,260 1,369 1,326 1,455 1,501 1,260 2,070 2,098 28 1.3%
Fort Myers RSW 949 1,525 1,587 1,620 1,738 1,806 1,734 1,742 1,938 195 11.2%
Provincetown PVC 2,023 1,659 2,410 2,086 2,054 1,982 1,929 1,957 1,912 -45 -2.3%
Seattle/Tacoma SEA 458 610 1,001 993 1,051 1,378 1,607 1,625 1,907 282 17.3%
West Palm Beach PBI 1,674 1,126 1,450 1,380 1,161 1,235 1,389 1,650 1,652 3 0.2%
Houston Intercontinental IAH 1,995 1,752 1,717 1,697 1,704 1,789 1,822 1,831 1,618 -213 -11.6%
Chicago Midway MDW 868 1,339 1,756 1,751 1,690 1,617 1,542 1,531 1,604 73 4.8%
Indianapolis IND 765 2,076 1,121 977 936 895 844 1,181 1,595 414 35.0%
Columbus CMH 2,708 2,114 972 1,048 972 871 844 1,081 1,591 510 47.2%
Phoenix PHX 1,386 944 1,348 1,895 1,773 1,413 1,557 1,569 1,552 -17 -1.1%
Nashville BNA 642 153 588 628 688 1,467 779 113.2%
Lebanon LEB 1,734 1,460 1,464 1,460 1,460 1,460 1,464 4 0.3%
Tampa TPA 2,502 1,946 1,246 1,255 1,266 1,195 1,182 1,177 1,429 252 21.4%
Rockland RKD 1,152 1,374 1,301 1,279 1,282 1,279 1,279 1,372 1,348 -24 -1.7%
Augusta AUG 584 621 1,000 1,187 1,091 1,248 1,248 1,248 1,220 -28 -2.2%
Las Vegas LAS 1,098 1,679 756 904 737 813 819 1,162 1,216 55 4.7%
Cincinnati CVG 2,235 2,637 1,364 1,308 1,272 1,269 1,239 1,218 1,204 -14 -1.1%
Bar Harbor BHB 1,196 1,154 815 1,030 1,213 1,283 1,156 1,095 1,098 3 0.3%
Albany ALB 3,433 1,073 647 2,180 1,523 1,183 1,095 1,095 1,098 3 0.3%
Saranac Lake SLK 800 1,174 1,157 1,222 1,157 1,095 1,095 1,098 3 0.3%
Rutland RUT 1,259 643 1,095 1,148 1,160 1,095 1,095 1,095 1,098 3 0.3%
San Diego SAN 366 365 571 535 476 859 1,030 1,052 1,042 -10 -1.0%
Houston Hobby HOU 664 1,325 978 1,032 55 5.6%
Salt Lake City SLC 1,094 730 669 438 370 584 597 617 1,009 392 63.5%
Boston-Logan International Airport 2016 EDR
Appendix E, Activity Levels E-8
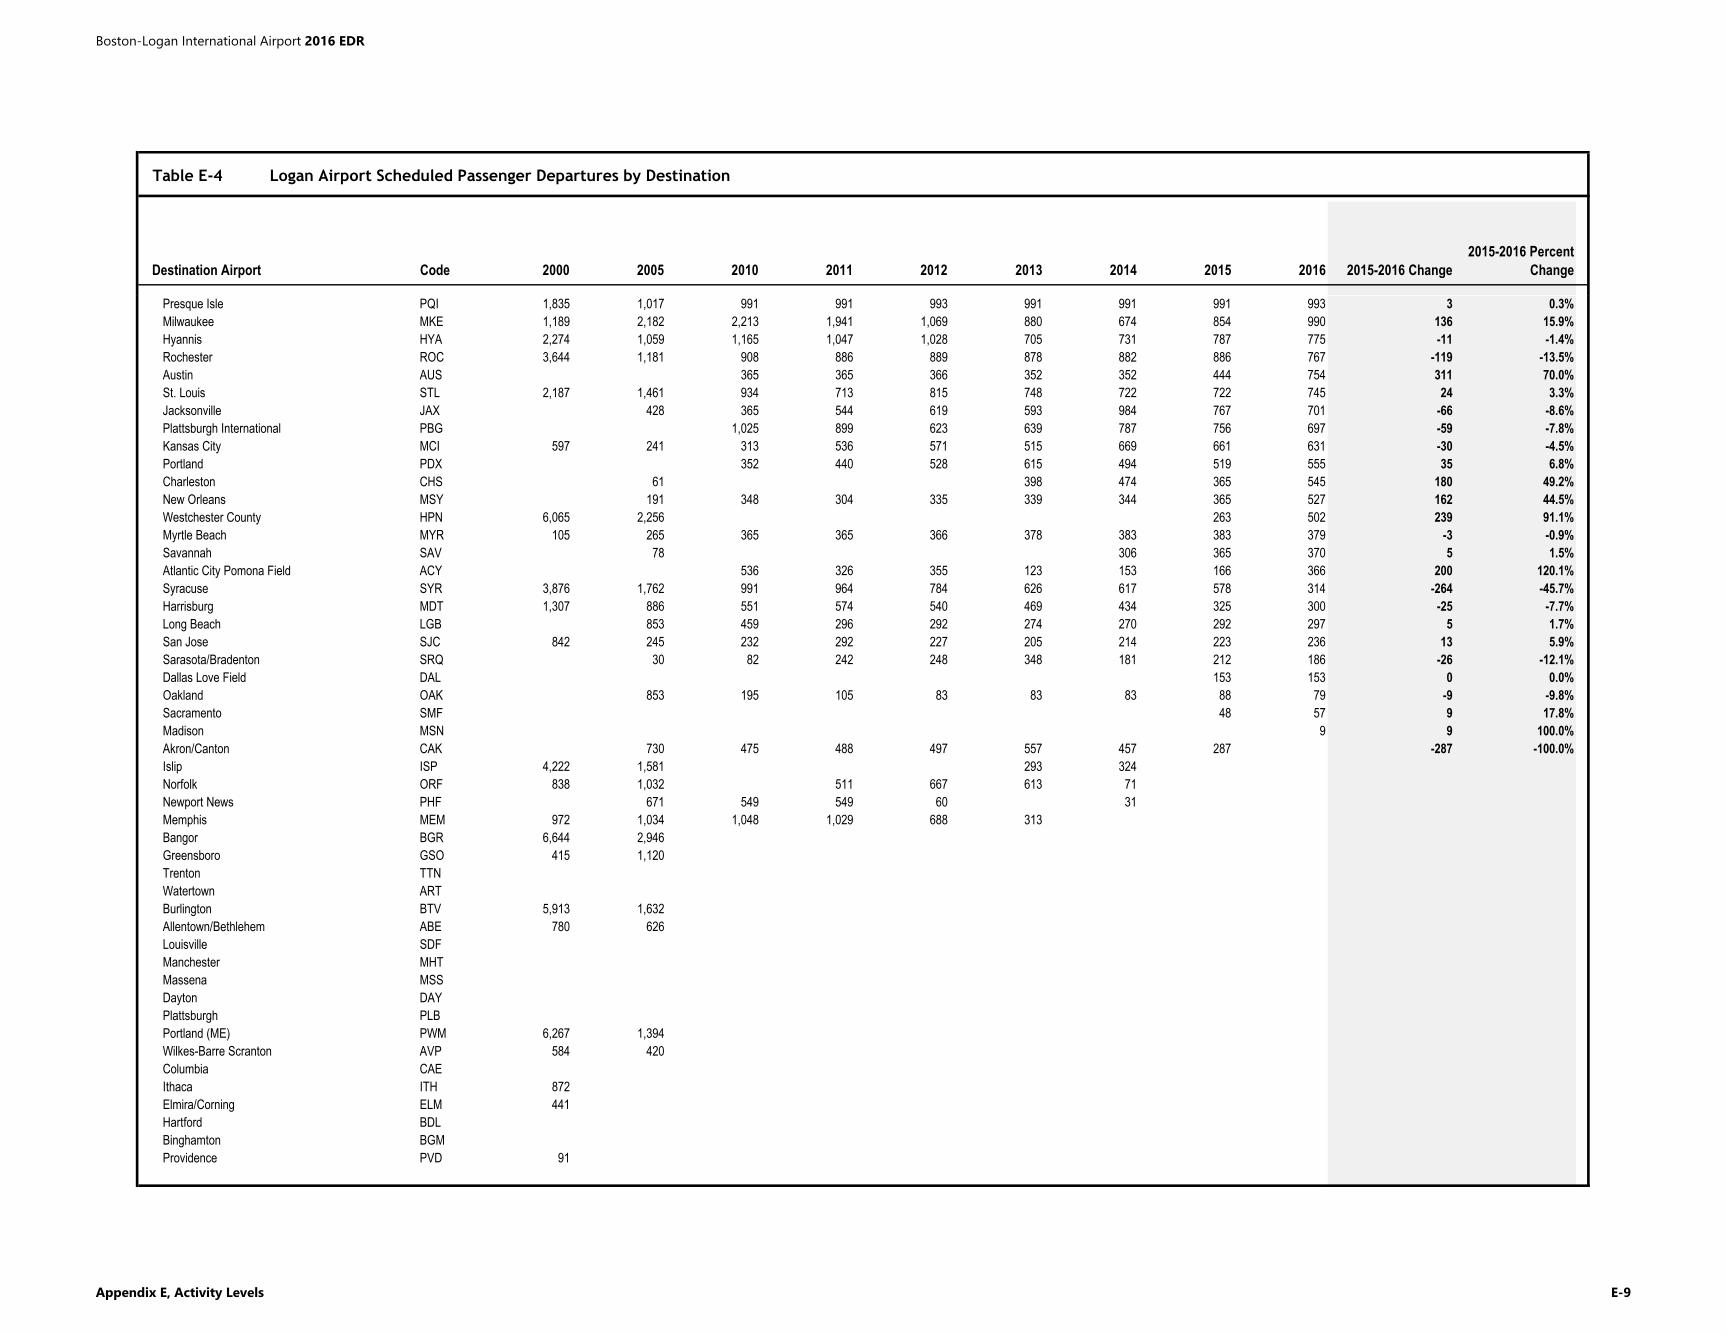
Table E-4 Logan Airport Scheduled Passenger Departures by Destination
Destination Airport Code 2000 2005 2010 2011 2012 2013 2014 2015 2016 2015-2016 Change
2015-2016 Percent
Change
Presque Isle PQI 1,835 1,017 991 991 993 991 991 991 993 3 0.3%
Milwaukee MKE 1,189 2,182 2,213 1,941 1,069 880 674 854 990 136 15.9%
Hyannis HYA 2,274 1,059 1,165 1,047 1,028 705 731 787 775 -11 -1.4%
Rochester ROC 3,644 1,181 908 886 889 878 882 886 767 -119 -13.5%
Austin AUS 365 365 366 352 352 444 754 311 70.0%
St. Louis STL 2,187 1,461 934 713 815 748 722 722 745 24 3.3%
Jacksonville JAX 428 365 544 619 593 984 767 701 -66 -8.6%
Plattsburgh International PBG 1,025 899 623 639 787 756 697 -59 -7.8%
Kansas City MCI 597 241 313 536 571 515 669 661 631 -30 -4.5%
Portland PDX 352 440 528 615 494 519 555 35 6.8%
Charleston CHS 61 398 474 365 545 180 49.2%
New Orleans MSY 191 348 304 335 339 344 365 527 162 44.5%
Westchester County HPN 6,065 2,256 263 502 239 91.1%
Myrtle Beach MYR 105 265 365 365 366 378 383 383 379 -3 -0.9%
Savannah SAV 78 306 365 370 5 1.5%
Atlantic City Pomona Field ACY 536 326 355 123 153 166 366 200 120.1%
Syracuse SYR 3,876 1,762 991 964 784 626 617 578 314 -264 -45.7%
Harrisburg MDT 1,307 886 551 574 540 469 434 325 300 -25 -7.7%
Long Beach LGB 853 459 296 292 274 270 292 297 5 1.7%
San Jose SJC 842 245 232 292 227 205 214 223 236 13 5.9%
Sarasota/Bradenton SRQ 30 82 242 248 348 181 212 186 -26 -12.1%
Dallas Love Field DAL 153 153 0 0.0%
Oakland OAK 853 195 105 83 83 83 88 79 -9 -9.8%
Sacramento SMF 48 57 9 17.8%
Madison MSN 9 9 100.0%
Akron/Canton CAK 730 475 488 497 557 457 287 -287 -100.0%
Islip ISP 4,222 1,581 293 324
Norfolk ORF 838 1,032 511 667 613 71
Newport News PHF 671 549 549 60 31
Memphis MEM 972 1,034 1,048 1,029 688 313
Bangor BGR 6,644 2,946
Greensboro GSO 415 1,120
Trenton TTN
Watertown ART
Burlington BTV 5,913 1,632
Allentown/Bethlehem ABE 780 626
Louisville SDF
Manchester MHT
Massena MSS
Dayton DAY
Plattsburgh PLB
Portland (ME) PWM 6,267 1,394
Wilkes-Barre Scranton AVP 584 420
Columbia CAE
Ithaca ITH 872
Elmira/Corning ELM 441
Hartford BDL
Binghamton BGM
Providence PVD 91
Boston-Logan International Airport 2016 EDR
Appendix E, Activity Levels E-9
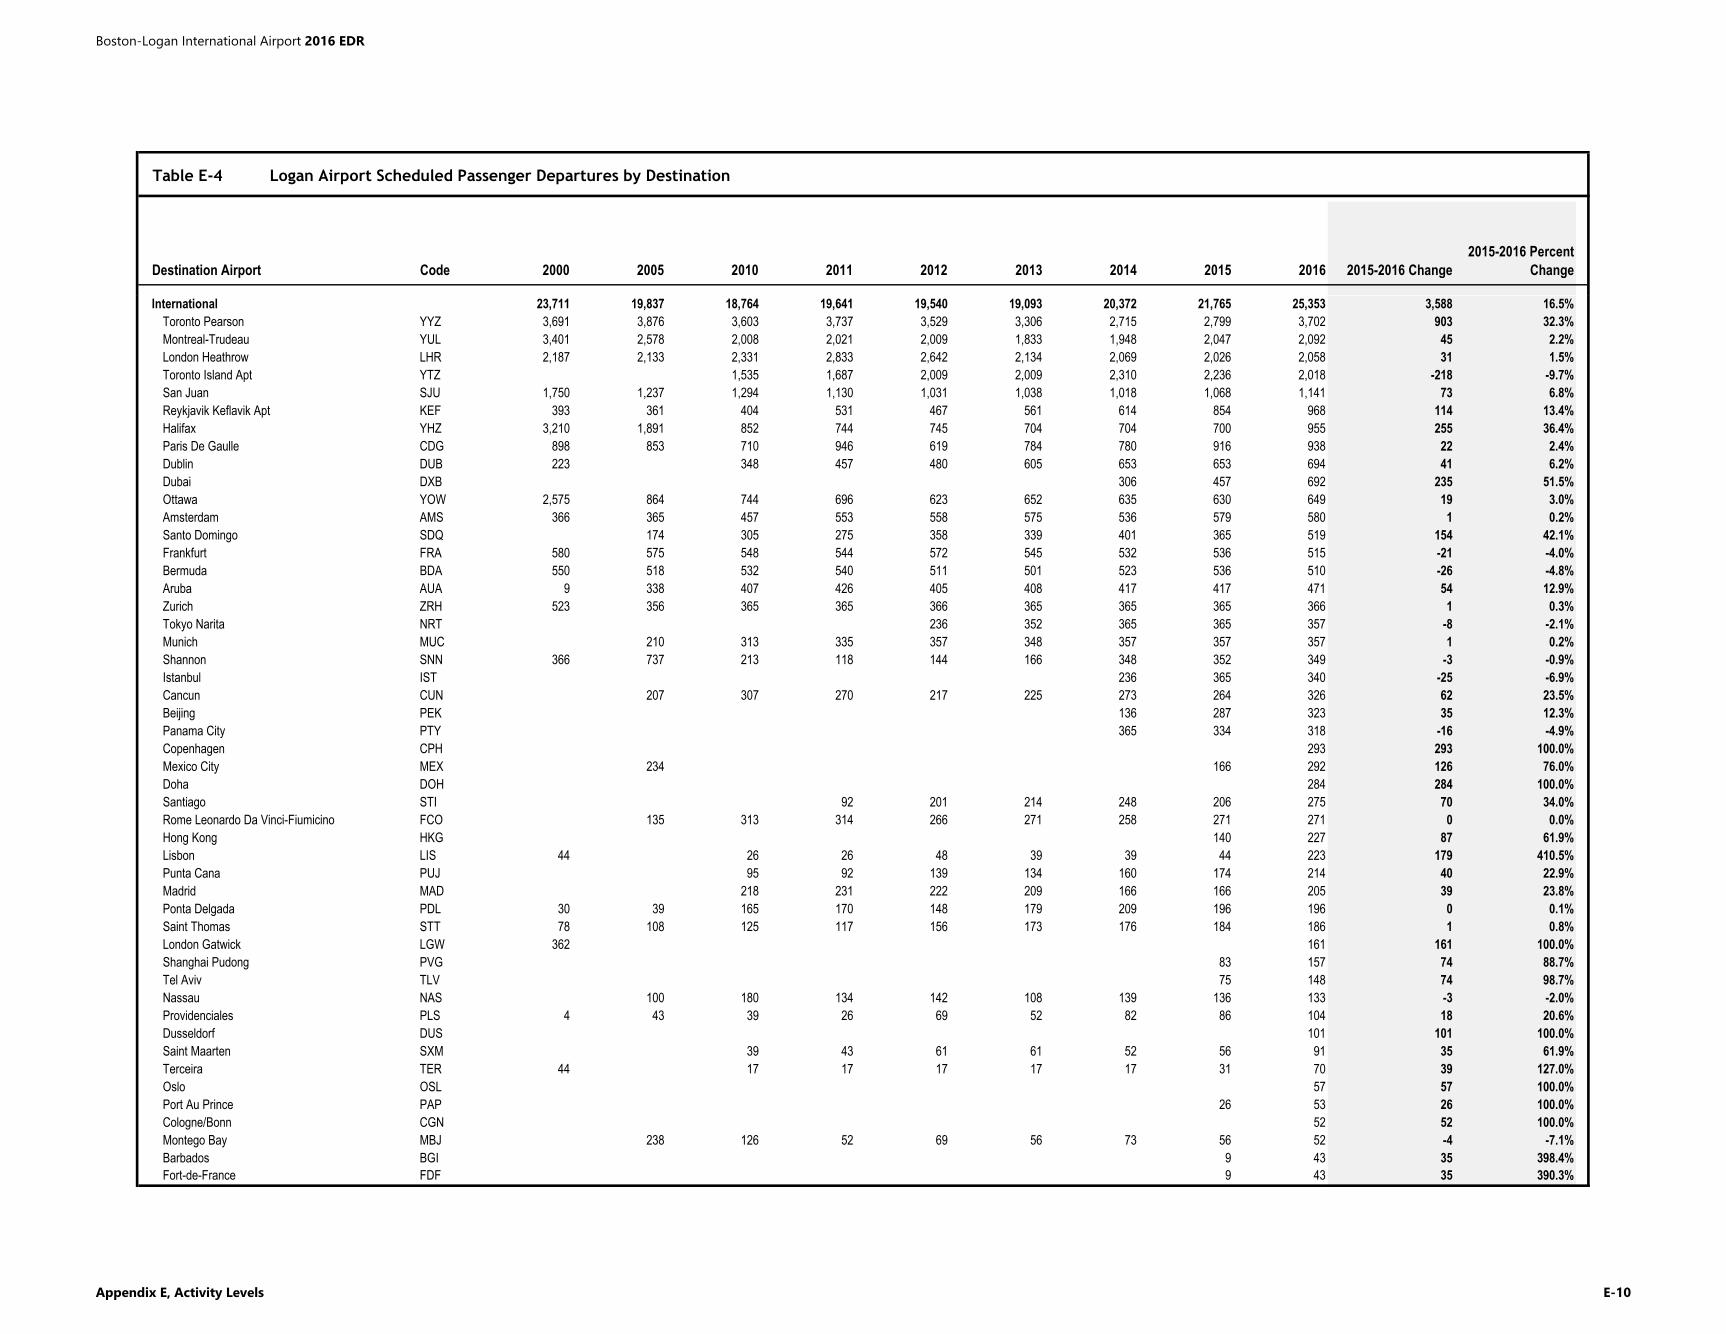
Table E-4 Logan Airport Scheduled Passenger Departures by Destination
Destination Airport Code 2000 2005 2010 2011 2012 2013 2014 2015 2016 2015-2016 Change
2015-2016 Percent
Change
International 23,711 19,837 18,764 19,641 19,540 19,093 20,372 21,765 25,353 3,588 16.5%
Toronto Pearson YYZ 3,691 3,876 3,603 3,737 3,529 3,306 2,715 2,799 3,702 903 32.3%
Montreal-Trudeau YUL 3,401 2,578 2,008 2,021 2,009 1,833 1,948 2,047 2,092 45 2.2%
London Heathrow LHR 2,187 2,133 2,331 2,833 2,642 2,134 2,069 2,026 2,058 31 1.5%
Toronto Island Apt YTZ 1,535 1,687 2,009 2,009 2,310 2,236 2,018 -218 -9.7%
San Juan SJU 1,750 1,237 1,294 1,130 1,031 1,038 1,018 1,068 1,141 73 6.8%
Reykjavik Keflavik Apt KEF 393 361 404 531 467 561 614 854 968 114 13.4%
Halifax YHZ 3,210 1,891 852 744 745 704 704 700 955 255 36.4%
Paris De Gaulle CDG 898 853 710 946 619 784 780 916 938 22 2.4%
Dublin DUB 223 348 457 480 605 653 653 694 41 6.2%
Dubai DXB 306 457 692 235 51.5%
Ottawa YOW 2,575 864 744 696 623 652 635 630 649 19 3.0%
Amsterdam AMS 366 365 457 553 558 575 536 579 580 1 0.2%
Santo Domingo SDQ 174 305 275 358 339 401 365 519 154 42.1%
Frankfurt FRA 580 575 548 544 572 545 532 536 515 -21 -4.0%
Bermuda BDA 550 518 532 540 511 501 523 536 510 -26 -4.8%
Aruba AUA 9 338 407 426 405 408 417 417 471 54 12.9%
Zurich ZRH 523 356 365 365 366 365 365 365 366 1 0.3%
Tokyo Narita NRT 236 352 365 365 357 -8 -2.1%
Munich MUC 210 313 335 357 348 357 357 357 1 0.2%
Shannon SNN 366 737 213 118 144 166 348 352 349 -3 -0.9%
Istanbul IST 236 365 340 -25 -6.9%
Cancun CUN 207 307 270 217 225 273 264 326 62 23.5%
Beijing PEK 136 287 323 35 12.3%
Panama City PTY 365 334 318 -16 -4.9%
Copenhagen CPH 293 293 100.0%
Mexico City MEX 234 166 292 126 76.0%
Doha DOH 284 284 100.0%
Santiago STI 92 201 214 248 206 275 70 34.0%
Rome Leonardo Da Vinci-Fiumicino FCO 135 313 314 266 271 258 271 271 0 0.0%
Hong Kong HKG 140 227 87 61.9%
Lisbon LIS 44 26 26 48 39 39 44 223 179 410.5%
Punta Cana PUJ 95 92 139 134 160 174 214 40 22.9%
Madrid MAD 218 231 222 209 166 166 205 39 23.8%
Ponta Delgada PDL 30 39 165 170 148 179 209 196 196 0 0.1%
Saint Thomas STT 78 108 125 117 156 173 176 184 186 1 0.8%
London Gatwick LGW 362 161 161 100.0%
Shanghai Pudong PVG 83 157 74 88.7%
Tel Aviv TLV 75 148 74 98.7%
Nassau NAS 100 180 134 142 108 139 136 133 -3 -2.0%
Providenciales PLS 4 43 39 26 69 52 82 86 104 18 20.6%
Dusseldorf DUS 101 101 100.0%
Saint Maarten SXM 39 43 61 61 52 56 91 35 61.9%
Terceira TER 44 17 17 17 17 17 31 70 39 127.0%
Oslo OSL 57 57 100.0%
Port Au Prince PAP 26 53 26 100.0%
Cologne/Bonn CGN 52 52 100.0%
Montego Bay MBJ 238 126 52 69 56 73 56 52 -4 -7.1%
Barbados BGI 9 43 35 398.4%
Fort-de-France FDF 9 43 35 390.3%
Boston-Logan International Airport 2016 EDR
Appendix E, Activity Levels E-10
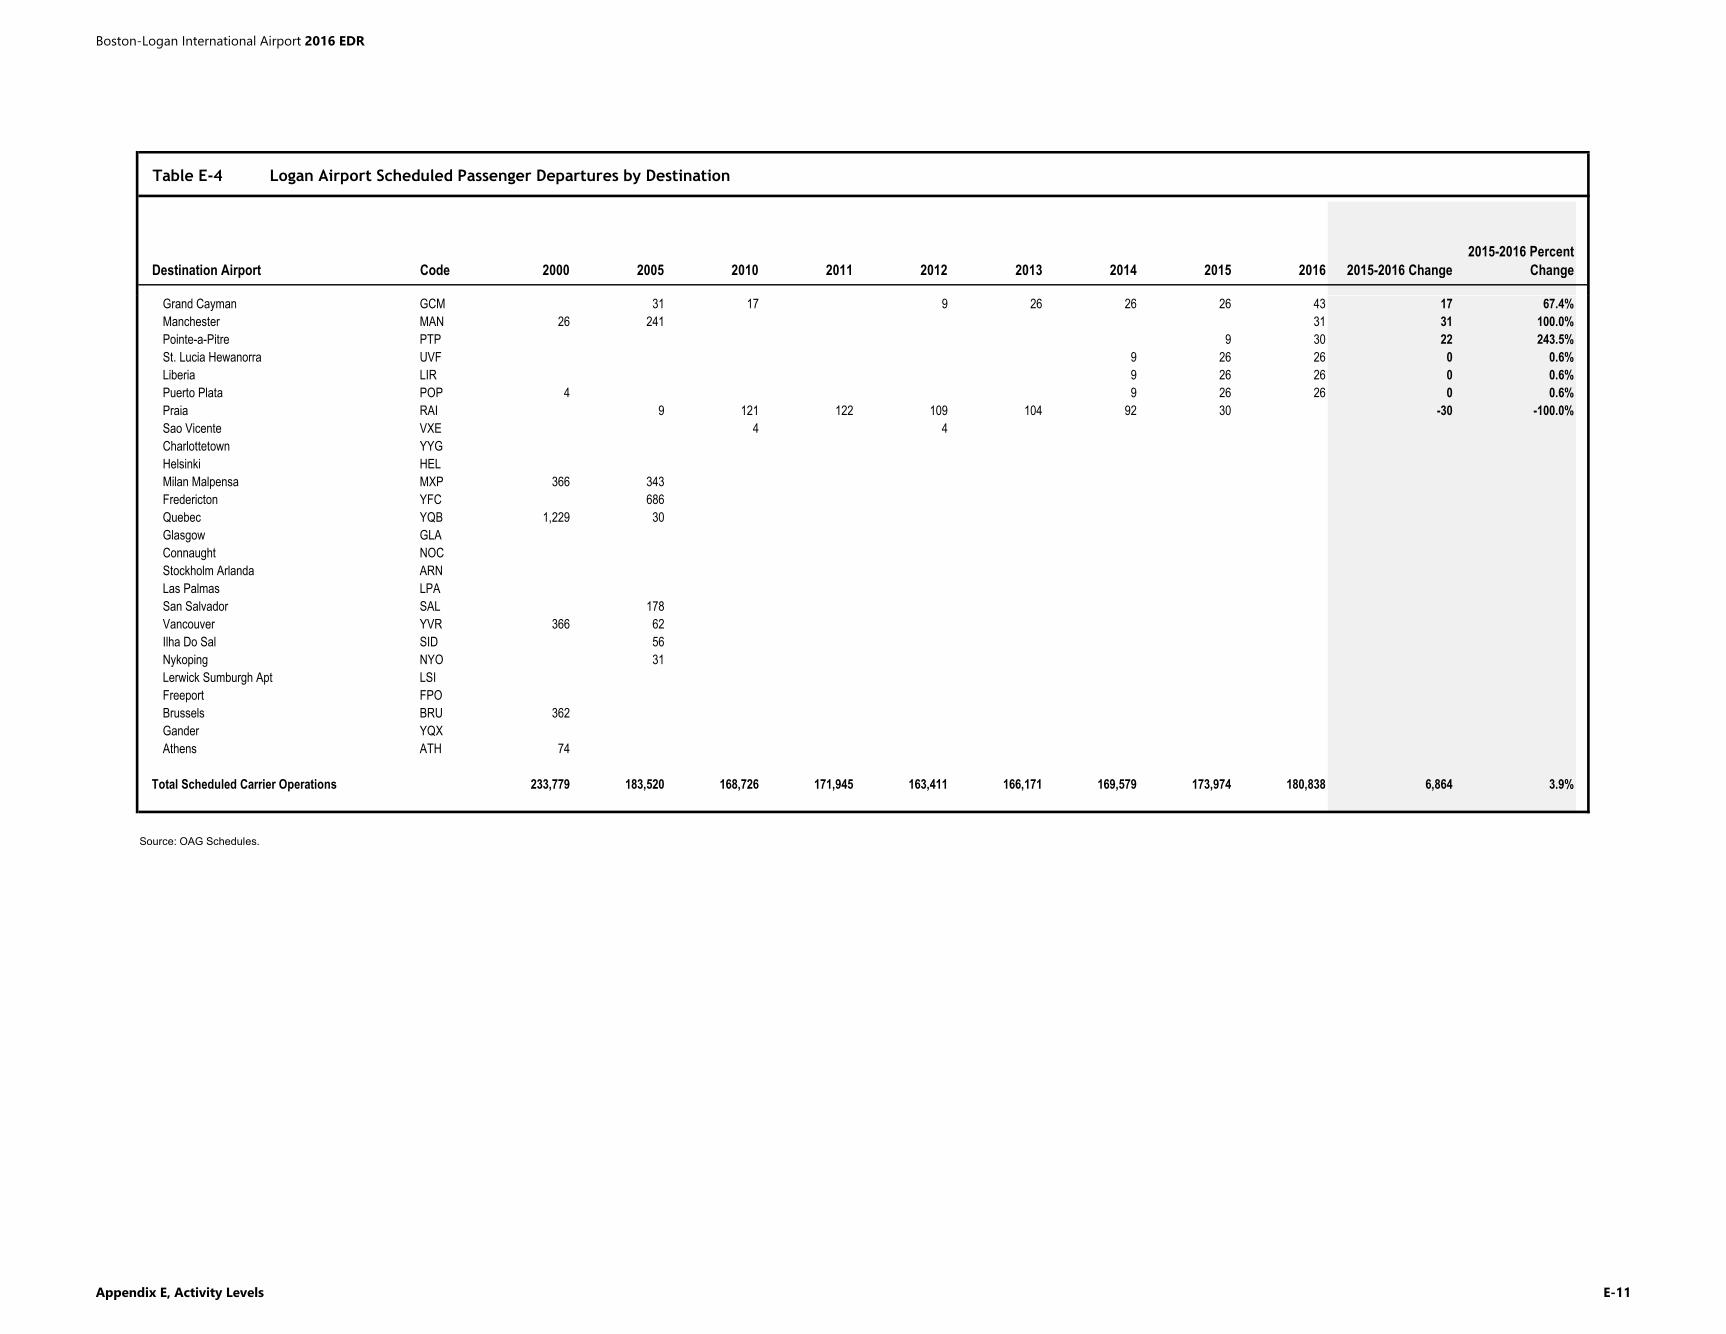
Table E-4 Logan Airport Scheduled Passenger Departures by Destination
Destination Airport Code 2000 2005 2010 2011 2012 2013 2014 2015 2016 2015-2016 Change
2015-2016 Percent
Change
Grand Cayman GCM 31 17 9 26 26 26 43 17 67.4%
Manchester MAN 26 241 31 31 100.0%
Pointe-a-Pitre PTP 9 30 22 243.5%
St. Lucia Hewanorra UVF 9 26 26 0 0.6%
Liberia LIR 9 26 26 0 0.6%
Puerto Plata POP 4 9 26 26 0 0.6%
Praia RAI 9 121 122 109 104 92 30 -30 -100.0%
Sao Vicente VXE 4 4
Charlottetown YYG
Helsinki HEL
Milan Malpensa MXP 366 343
Fredericton YFC 686
Quebec YQB 1,229 30
Glasgow GLA
Connaught NOC
Stockholm Arlanda ARN
Las Palmas LPA
San Salvador SAL 178
Vancouver YVR 366 62
Ilha Do Sal SID 56
Nykoping NYO 31
Lerwick Sumburgh Apt LSI
Freeport FPO
Brussels BRU 362
Gander YQX
Athens ATH 74
Total Scheduled Carrier Operations 233,779 183,520 168,726 171,945 163,411 166,171 169,579 173,974 180,838 6,864 3.9%
Source: OAG Schedules.
Boston-Logan International Airport 2016 EDR
Appendix E, Activity Levels E-11
Boston-Logan International Airport 2016 EDR
This Page Intentionally Left Blank.
Appendix E, Activity Levels E-12
Boston-Logan International Airport 2016 EDR
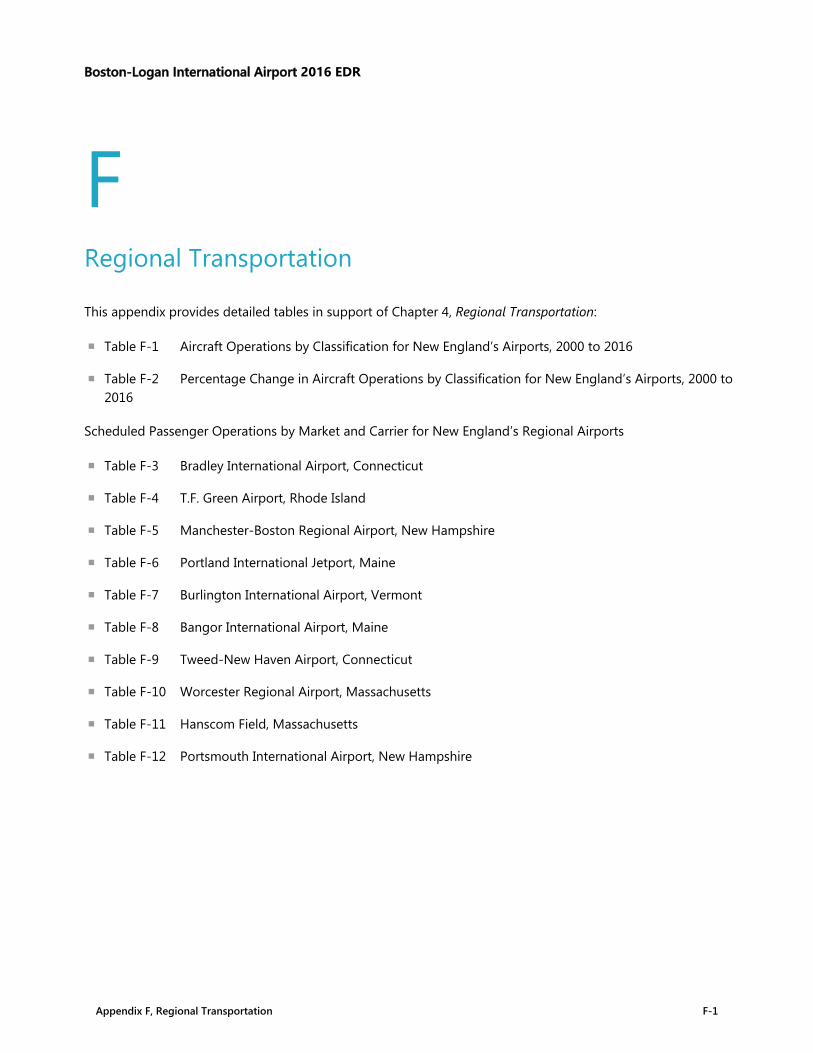
F Regional Transportation
This appendix provides detailed tables in support of Chapter 4, Regional Transportation:
▪ Table F-1 Aircraft Operations by Classification for New England’s Airports, 2000 to 2016
▪ Table F-2 Percentage Change in Aircraft Operations by Classification for New England’s Airports, 2000 to
2016
Scheduled Passenger Operations by Market and Carrier for New England’s Regional Airports
▪ Table F-3 Bradley International Airport, Connecticut
▪ Table F-4 T.F. Green Airport, Rhode Island
▪ Table F-5 Manchester-Boston Regional Airport, New Hampshire
▪ Table F-6 Portland International Jetport, Maine
▪ Table F-7 Burlington International Airport, Vermont
▪ Table F-8 Bangor International Airport, Maine
▪ Table F-9 Tweed-New Haven Airport, Connecticut
▪ Table F-10 Worcester Regional Airport, Massachusetts
▪ Table F-11 Hanscom Field, Massachusetts
▪ Table F-12 Portsmouth International Airport, New Hampshire
Appendix F, Regional Transportation F-1
Boston-Logan International Airport 2016 EDR
This Page Intentionally Left Blank.
Appendix F, Regional Transportation F-2
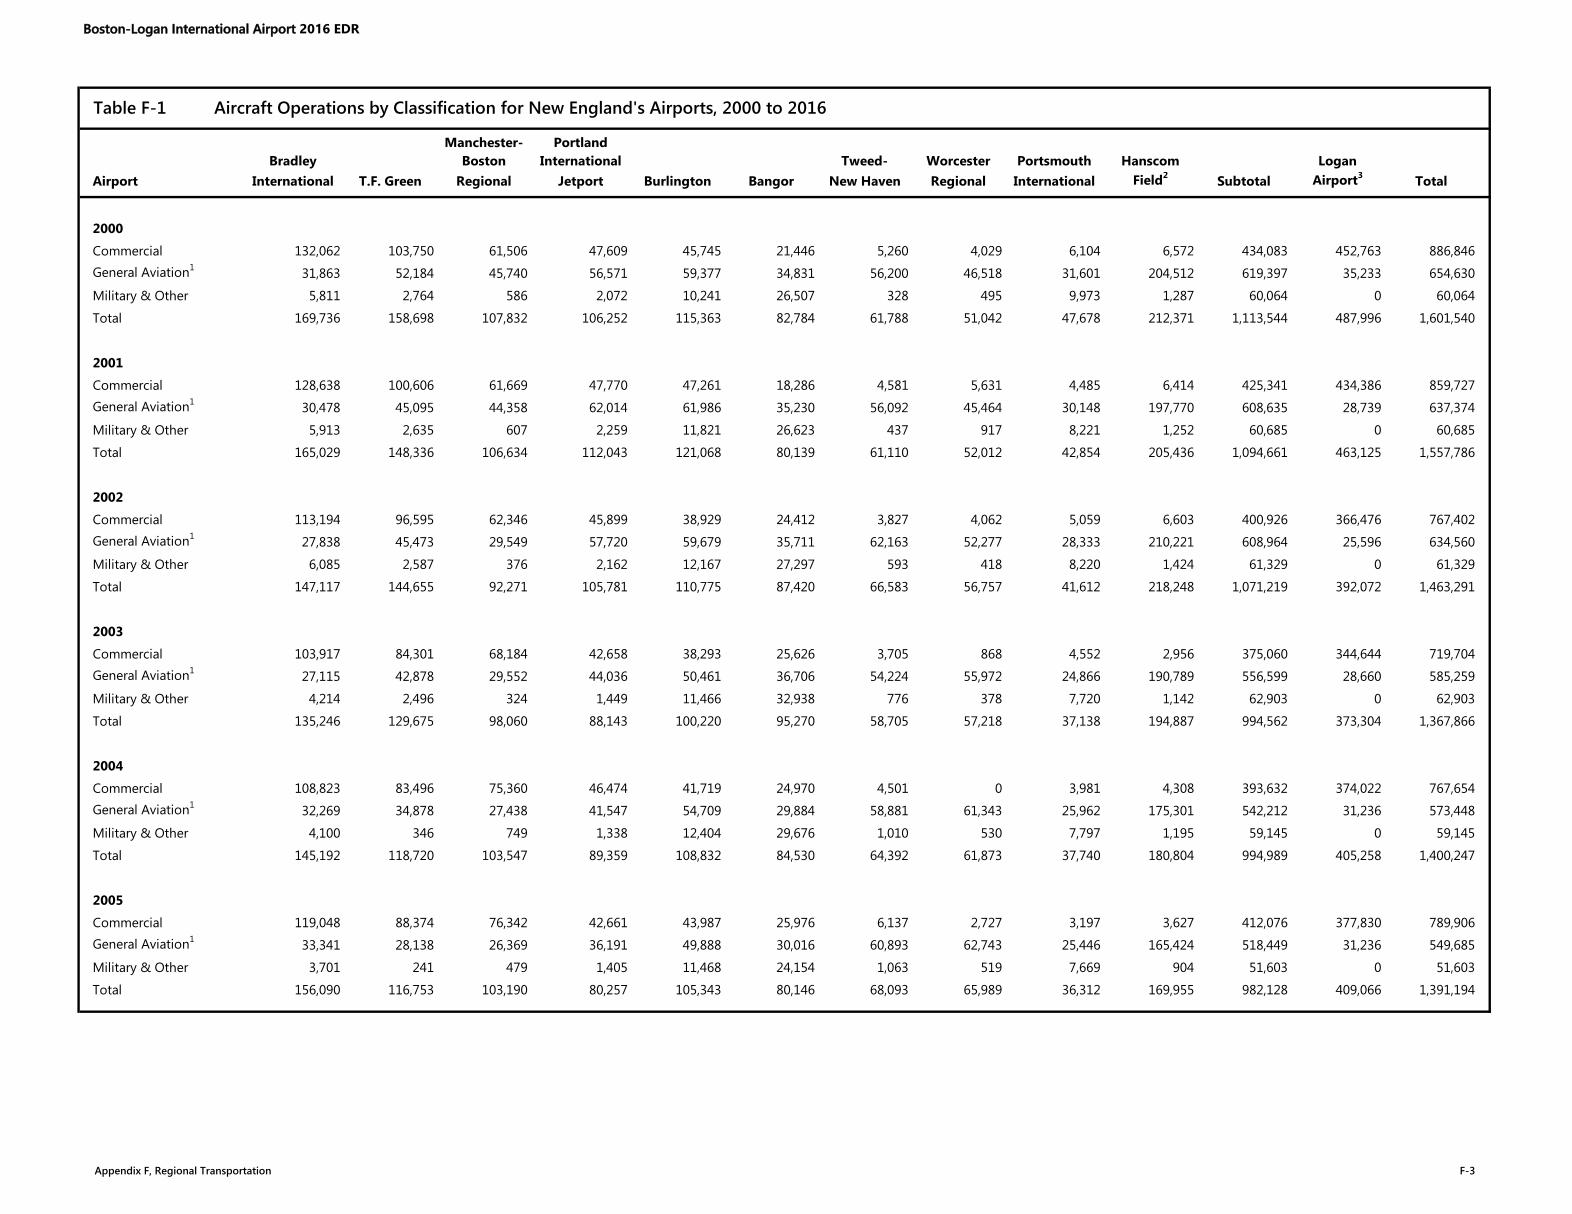
Table F-1 Aircraft Operations by Classification for New England's Airports, 2000 to 2016
Manchester- PortlandBradley Boston International Tweed- Worcester Portsmouth Hanscom Logan
Airport International T.F. Green Regional Jetport Burlington Bangor New Haven Regional International Field2 Subtotal Airport3 Total
2000
Commercial 132,062 103,750 61,506 47,609 45,745 21,446 5,260 4,029 6,104 6,572 434,083 452,763 886,846General Aviation1 31,863 52,184 45,740 56,571 59,377 34,831 56,200 46,518 31,601 204,512 619,397 35,233 654,630
Military & Other 5,811 2,764 586 2,072 10,241 26,507 328 495 9,973 1,287 60,064 0 60,064
Total 169,736 158,698 107,832 106,252 115,363 82,784 61,788 51,042 47,678 212,371 1,113,544 487,996 1,601,540
2001
Commercial 128,638 100,606 61,669 47,770 47,261 18,286 4,581 5,631 4,485 6,414 425,341 434,386 859,727General Aviation1 30,478 45,095 44,358 62,014 61,986 35,230 56,092 45,464 30,148 197,770 608,635 28,739 637,374
Military & Other 5,913 2,635 607 2,259 11,821 26,623 437 917 8,221 1,252 60,685 0 60,685
Total 165,029 148,336 106,634 112,043 121,068 80,139 61,110 52,012 42,854 205,436 1,094,661 463,125 1,557,786
2002
Commercial 113,194 96,595 62,346 45,899 38,929 24,412 3,827 4,062 5,059 6,603 400,926 366,476 767,402General Aviation1 27,838 45,473 29,549 57,720 59,679 35,711 62,163 52,277 28,333 210,221 608,964 25,596 634,560
Military & Other 6,085 2,587 376 2,162 12,167 27,297 593 418 8,220 1,424 61,329 0 61,329
Total 147,117 144,655 92,271 105,781 110,775 87,420 66,583 56,757 41,612 218,248 1,071,219 392,072 1,463,291
2003
Commercial 103,917 84,301 68,184 42,658 38,293 25,626 3,705 868 4,552 2,956 375,060 344,644 719,704General Aviation1 27,115 42,878 29,552 44,036 50,461 36,706 54,224 55,972 24,866 190,789 556,599 28,660 585,259
Military & Other 4,214 2,496 324 1,449 11,466 32,938 776 378 7,720 1,142 62,903 0 62,903
Total 135,246 129,675 98,060 88,143 100,220 95,270 58,705 57,218 37,138 194,887 994,562 373,304 1,367,866
2004
Commercial 108,823 83,496 75,360 46,474 41,719 24,970 4,501 0 3,981 4,308 393,632 374,022 767,654General Aviation1 32,269 34,878 27,438 41,547 54,709 29,884 58,881 61,343 25,962 175,301 542,212 31,236 573,448
Military & Other 4,100 346 749 1,338 12,404 29,676 1,010 530 7,797 1,195 59,145 0 59,145
Total 145,192 118,720 103,547 89,359 108,832 84,530 64,392 61,873 37,740 180,804 994,989 405,258 1,400,247
2005
Commercial 119,048 88,374 76,342 42,661 43,987 25,976 6,137 2,727 3,197 3,627 412,076 377,830 789,906General Aviation1 33,341 28,138 26,369 36,191 49,888 30,016 60,893 62,743 25,446 165,424 518,449 31,236 549,685
Military & Other 3,701 241 479 1,405 11,468 24,154 1,063 519 7,669 904 51,603 0 51,603
Total 156,090 116,753 103,190 80,257 105,343 80,146 68,093 65,989 36,312 169,955 982,128 409,066 1,391,194
Appendix F, Regional Transportation F-3
Boston-Logan International Airport 2016 EDR
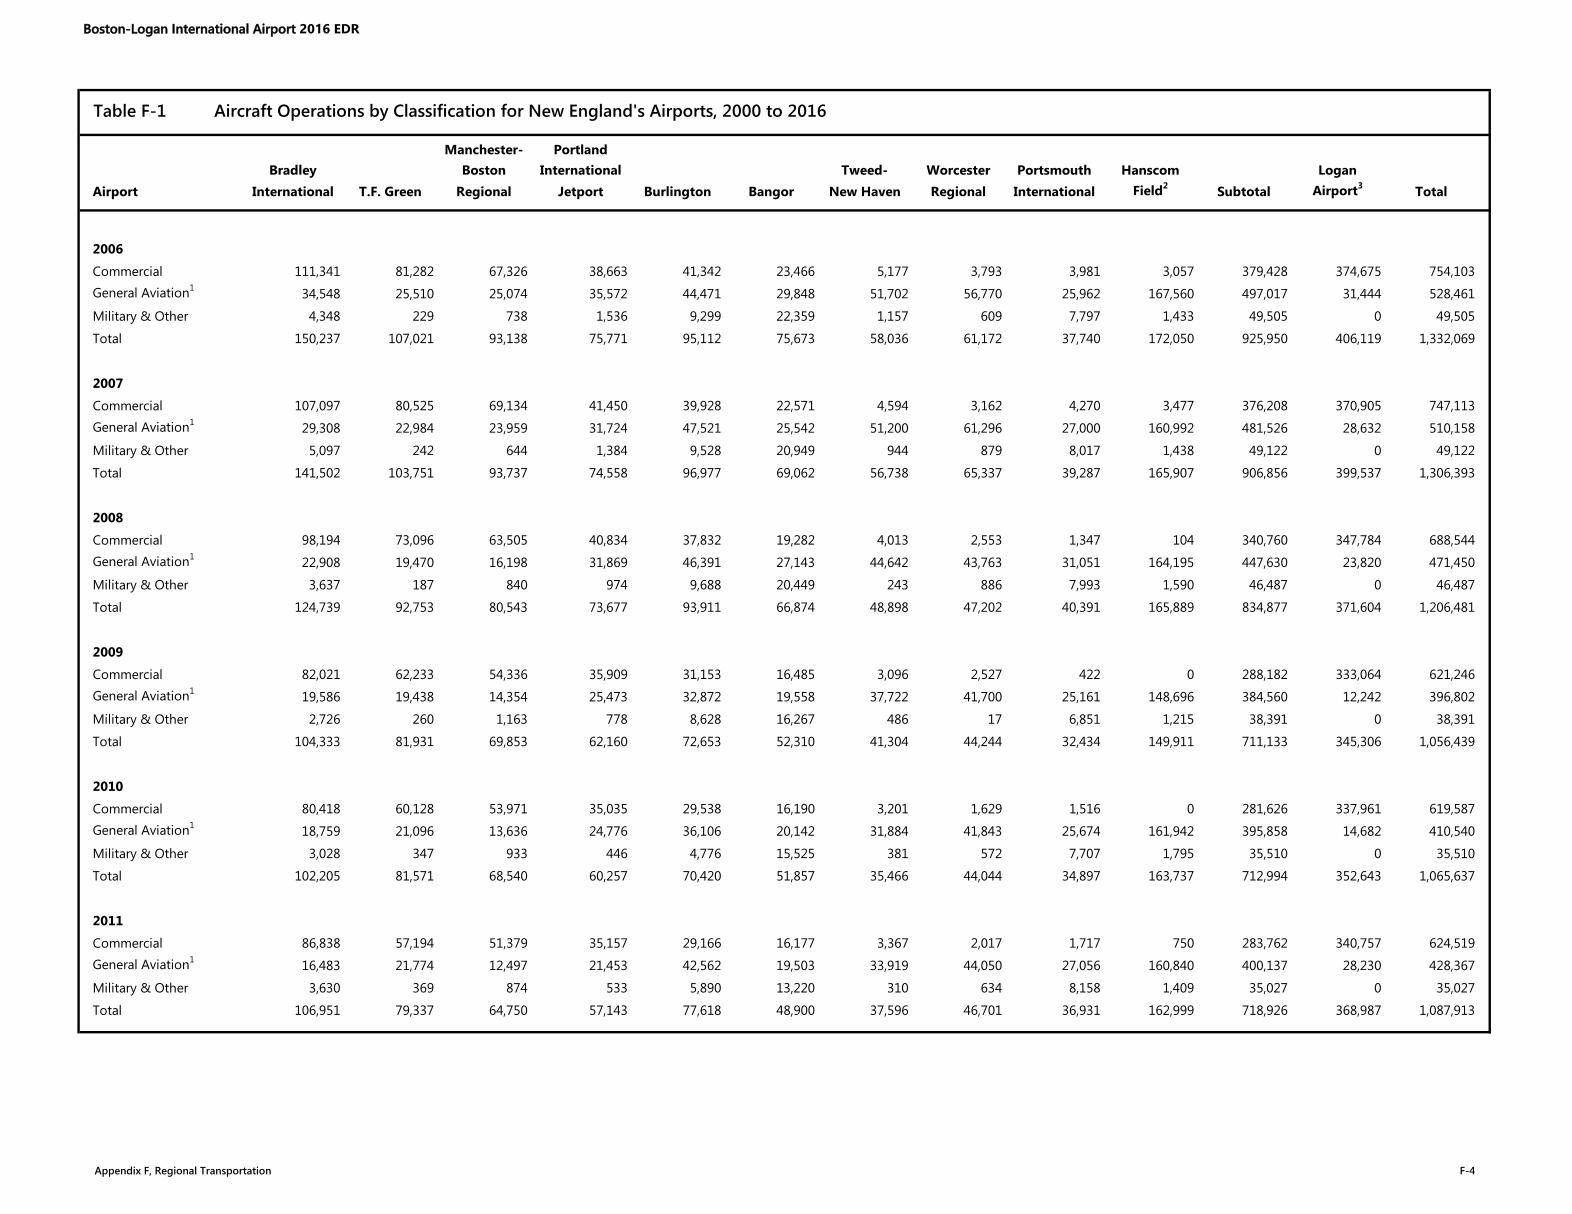
Table F-1 Aircraft Operations by Classification for New England's Airports, 2000 to 2016
Manchester- PortlandBradley Boston International Tweed- Worcester Portsmouth Hanscom Logan
Airport International T.F. Green Regional Jetport Burlington Bangor New Haven Regional International Field2 Subtotal Airport3 Total
2006
Commercial 111,341 81,282 67,326 38,663 41,342 23,466 5,177 3,793 3,981 3,057 379,428 374,675 754,103General Aviation1 34,548 25,510 25,074 35,572 44,471 29,848 51,702 56,770 25,962 167,560 497,017 31,444 528,461
Military & Other 4,348 229 738 1,536 9,299 22,359 1,157 609 7,797 1,433 49,505 0 49,505
Total 150,237 107,021 93,138 75,771 95,112 75,673 58,036 61,172 37,740 172,050 925,950 406,119 1,332,069
2007
Commercial 107,097 80,525 69,134 41,450 39,928 22,571 4,594 3,162 4,270 3,477 376,208 370,905 747,113General Aviation1 29,308 22,984 23,959 31,724 47,521 25,542 51,200 61,296 27,000 160,992 481,526 28,632 510,158
Military & Other 5,097 242 644 1,384 9,528 20,949 944 879 8,017 1,438 49,122 0 49,122
Total 141,502 103,751 93,737 74,558 96,977 69,062 56,738 65,337 39,287 165,907 906,856 399,537 1,306,393
2008
Commercial 98,194 73,096 63,505 40,834 37,832 19,282 4,013 2,553 1,347 104 340,760 347,784 688,544General Aviation1 22,908 19,470 16,198 31,869 46,391 27,143 44,642 43,763 31,051 164,195 447,630 23,820 471,450
Military & Other 3,637 187 840 974 9,688 20,449 243 886 7,993 1,590 46,487 0 46,487
Total 124,739 92,753 80,543 73,677 93,911 66,874 48,898 47,202 40,391 165,889 834,877 371,604 1,206,481
2009
Commercial 82,021 62,233 54,336 35,909 31,153 16,485 3,096 2,527 422 0 288,182 333,064 621,246General Aviation1 19,586 19,438 14,354 25,473 32,872 19,558 37,722 41,700 25,161 148,696 384,560 12,242 396,802
Military & Other 2,726 260 1,163 778 8,628 16,267 486 17 6,851 1,215 38,391 0 38,391
Total 104,333 81,931 69,853 62,160 72,653 52,310 41,304 44,244 32,434 149,911 711,133 345,306 1,056,439
2010
Commercial 80,418 60,128 53,971 35,035 29,538 16,190 3,201 1,629 1,516 0 281,626 337,961 619,587General Aviation1 18,759 21,096 13,636 24,776 36,106 20,142 31,884 41,843 25,674 161,942 395,858 14,682 410,540
Military & Other 3,028 347 933 446 4,776 15,525 381 572 7,707 1,795 35,510 0 35,510
Total 102,205 81,571 68,540 60,257 70,420 51,857 35,466 44,044 34,897 163,737 712,994 352,643 1,065,637
2011
Commercial 86,838 57,194 51,379 35,157 29,166 16,177 3,367 2,017 1,717 750 283,762 340,757 624,519General Aviation1 16,483 21,774 12,497 21,453 42,562 19,503 33,919 44,050 27,056 160,840 400,137 28,230 428,367
Military & Other 3,630 369 874 533 5,890 13,220 310 634 8,158 1,409 35,027 0 35,027
Total 106,951 79,337 64,750 57,143 77,618 48,900 37,596 46,701 36,931 162,999 718,926 368,987 1,087,913
Appendix F, Regional Transportation F-4
Boston-Logan International Airport 2016 EDR

Table F-1 Aircraft Operations by Classification for New England's Airports, 2000 to 2016
Manchester- PortlandBradley Boston International Tweed- Worcester Portsmouth Hanscom Logan
Airport International T.F. Green Regional Jetport Burlington Bangor New Haven Regional International Field2 Subtotal Airport3 Total
2012
Commercial 79,704 50,301 45,379 33,118 27,067 14,826 3,936 1,639 502 635 257,107 326,755 583,862General Aviation1 15,589 24,781 12,504 20,864 42,352 18,069 34,775 42,655 30,186 164,841 406,616 28,114 434,730
Military & Other 3,726 434 1,073 584 7,079 11,503 416 740 7,917 738 34,210 0 34,210
Total 99,019 75,516 58,956 54,566 76,498 44,398 39,127 45,034 38,605 166,214 697,933 354,869 1,052,802
2013
Commercial 78,213 48,340 43,572 31,076 26,814 14,707 4,094 1,586 560 253 249,215 334,657 583,872General Aviation1 15,192 24,729 11,432 20,021 40,413 15,535 28,794 32,888 28,951 153,706 371,661 26,682 398,343
Military & Other 2,558 435 1,224 471 6,972 11,045 423 593 7,573 529 31,823 0 31,823
Total 95,963 73,504 56,228 51,568 74,199 41,287 33,311 35,067 37,084 154,488 652,699 361,339 1,014,038
2014Commercial 79,060 44,351 38,674 29,538 26,057 14,428 4,795 2,368 8,278 256 247,805 337,381 585,186General Aviation1 14,752 29,490 12,293 16,535 40,858 15,548 26,273 29,138 24,440 133,437 342,764 26,416 369,180Military & Other 2,665 1,036 908 560 6,842 11,567 529 956 7,621 602 33,286 0 33,286Total 96,477 74,877 51,875 46,633 73,757 41,543 31,597 32,462 40,339 134,295 623,855 363,797 987,652
2015Commercial 76,425 42,417 38,060 30,415 25,178 13,618 6,316 2,414 8,547 220 243,610 344,764 588,374General Aviation1 14,402 22,700 12,934 17,916 41,576 16,487 27,711 35,711 26,848 127,467 343,752 28,166 371,918Military & Other 2,680 430 811 567 5,912 10,684 685 889 7,499 592 30,749 0 30,749Total 93,507 65,547 51,805 48,898 72,666 40,789 34,712 39,014 42,894 128,279 618,111 372,930 991,041
2016Commercial 77,174 43,659 40,589 32,171 26,405 14,603 7,195 2,616 9,512 266 254,190 360,442 614,632General Aviation1 14,460 26,032 14,447 18,334 38,614 16,965 28,811 31,858 28,341 120,891 338,753 30,780 369,533Military & Other 3,178 397 501 488 6,114 11,337 683 780 8,191 632 32,301 0 32,301Total 94,812 70,088 55,537 50,993 71,133 42,905 36,689 35,254 46,044 121,789 625,244 391,222 1,016,466
Source: Massport, Federal Aviation Administration (FAA) Tower Counts, and individual airport records.1 Includes itinerant and local general aviation (GA) operations at the regional airports. There are no local (touch-and-go training) operations at Logan Airport.2 Commercial operations at Hanscom Field include scheduled commercial operations only; other air taxi operations counted as GA.3 Operations at Logan Airport include international operations.
Appendix F, Regional Transportation F-5
Boston-Logan International Airport 2016 EDR
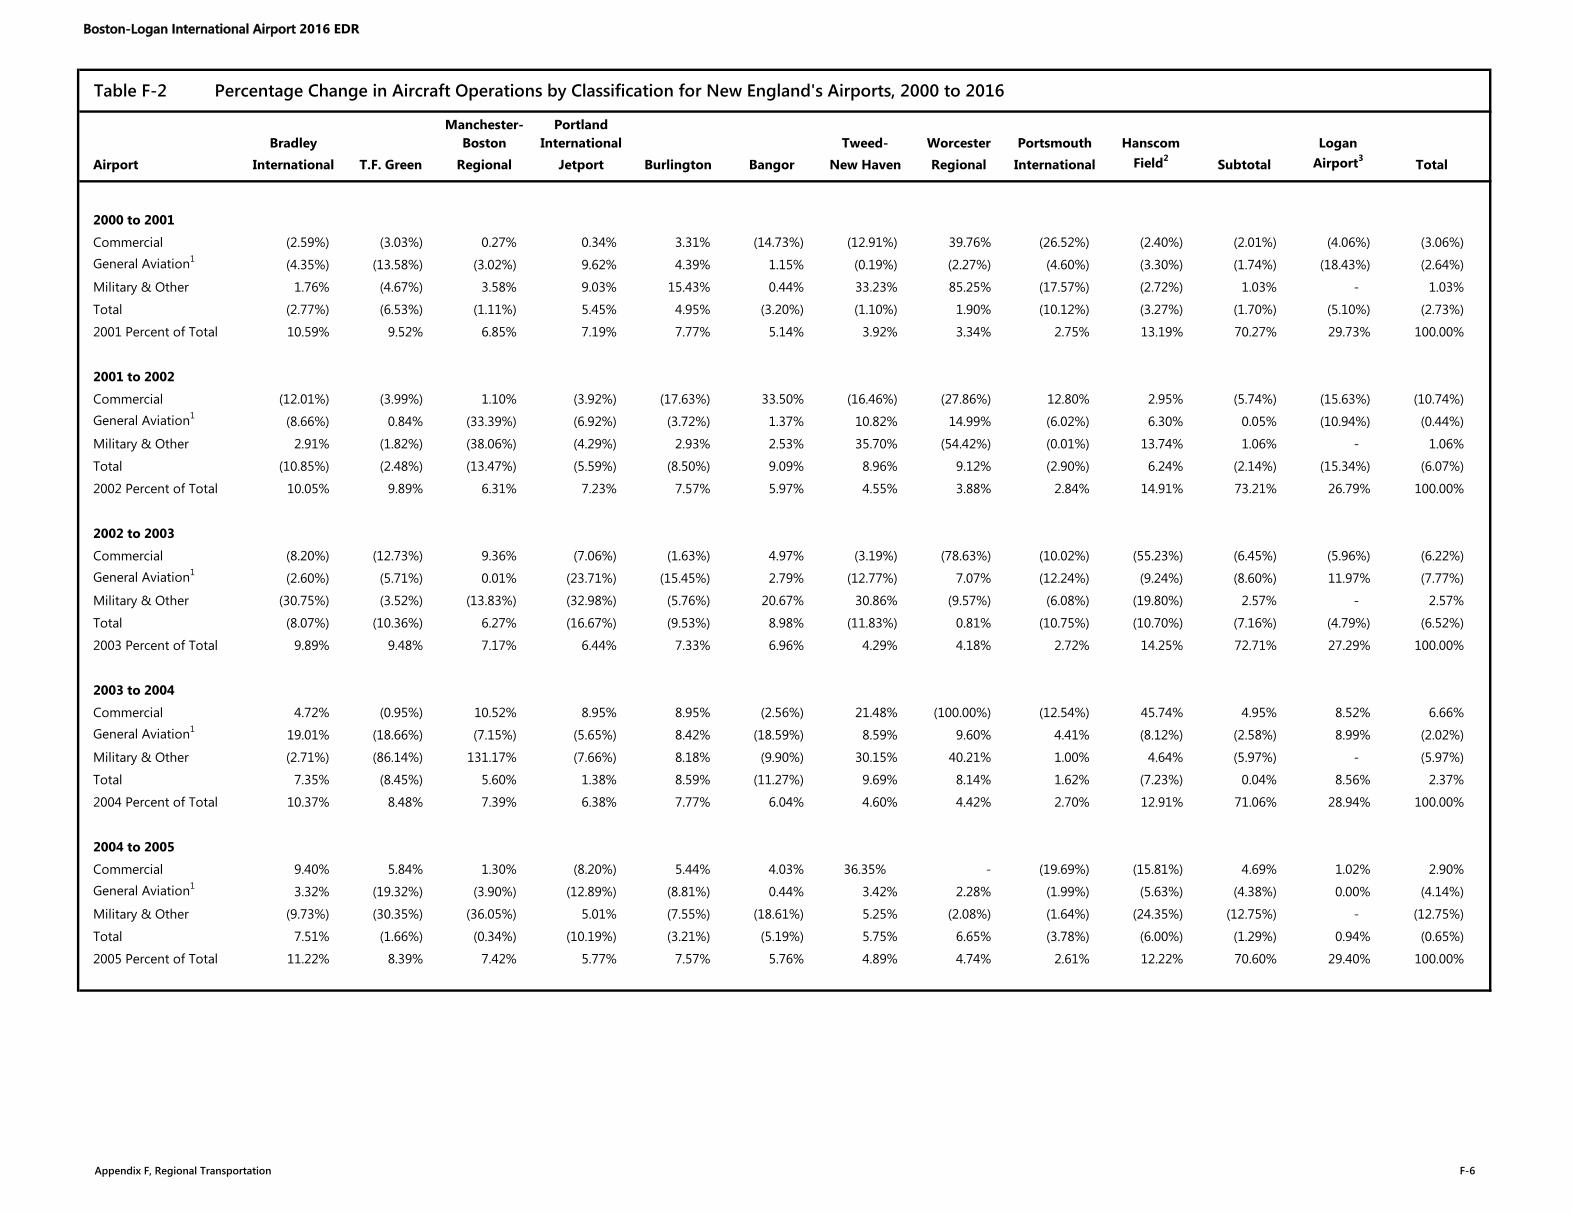
Table F-2 Percentage Change in Aircraft Operations by Classification for New England's Airports, 2000 to 2016
Manchester- PortlandBradley Boston International Tweed- Worcester Portsmouth Hanscom Logan
Airport International T.F. Green Regional Jetport Burlington Bangor New Haven Regional International Field2 Subtotal Airport3 Total
2000 to 2001
Commercial (2.59%) (3.03%) 0.27% 0.34% 3.31% (14.73%) (12.91%) 39.76% (26.52%) (2.40%) (2.01%) (4.06%) (3.06%)General Aviation1 (4.35%) (13.58%) (3.02%) 9.62% 4.39% 1.15% (0.19%) (2.27%) (4.60%) (3.30%) (1.74%) (18.43%) (2.64%)
Military & Other 1.76% (4.67%) 3.58% 9.03% 15.43% 0.44% 33.23% 85.25% (17.57%) (2.72%) 1.03% - 1.03%
Total (2.77%) (6.53%) (1.11%) 5.45% 4.95% (3.20%) (1.10%) 1.90% (10.12%) (3.27%) (1.70%) (5.10%) (2.73%)
2001 Percent of Total 10.59% 9.52% 6.85% 7.19% 7.77% 5.14% 3.92% 3.34% 2.75% 13.19% 70.27% 29.73% 100.00%
2001 to 2002
Commercial (12.01%) (3.99%) 1.10% (3.92%) (17.63%) 33.50% (16.46%) (27.86%) 12.80% 2.95% (5.74%) (15.63%) (10.74%)General Aviation1 (8.66%) 0.84% (33.39%) (6.92%) (3.72%) 1.37% 10.82% 14.99% (6.02%) 6.30% 0.05% (10.94%) (0.44%)
Military & Other 2.91% (1.82%) (38.06%) (4.29%) 2.93% 2.53% 35.70% (54.42%) (0.01%) 13.74% 1.06% - 1.06%
Total (10.85%) (2.48%) (13.47%) (5.59%) (8.50%) 9.09% 8.96% 9.12% (2.90%) 6.24% (2.14%) (15.34%) (6.07%)
2002 Percent of Total 10.05% 9.89% 6.31% 7.23% 7.57% 5.97% 4.55% 3.88% 2.84% 14.91% 73.21% 26.79% 100.00%
2002 to 2003
Commercial (8.20%) (12.73%) 9.36% (7.06%) (1.63%) 4.97% (3.19%) (78.63%) (10.02%) (55.23%) (6.45%) (5.96%) (6.22%)General Aviation1 (2.60%) (5.71%) 0.01% (23.71%) (15.45%) 2.79% (12.77%) 7.07% (12.24%) (9.24%) (8.60%) 11.97% (7.77%)
Military & Other (30.75%) (3.52%) (13.83%) (32.98%) (5.76%) 20.67% 30.86% (9.57%) (6.08%) (19.80%) 2.57% - 2.57%
Total (8.07%) (10.36%) 6.27% (16.67%) (9.53%) 8.98% (11.83%) 0.81% (10.75%) (10.70%) (7.16%) (4.79%) (6.52%)
2003 Percent of Total 9.89% 9.48% 7.17% 6.44% 7.33% 6.96% 4.29% 4.18% 2.72% 14.25% 72.71% 27.29% 100.00%
2003 to 2004
Commercial 4.72% (0.95%) 10.52% 8.95% 8.95% (2.56%) 21.48% (100.00%) (12.54%) 45.74% 4.95% 8.52% 6.66%General Aviation1 19.01% (18.66%) (7.15%) (5.65%) 8.42% (18.59%) 8.59% 9.60% 4.41% (8.12%) (2.58%) 8.99% (2.02%)
Military & Other (2.71%) (86.14%) 131.17% (7.66%) 8.18% (9.90%) 30.15% 40.21% 1.00% 4.64% (5.97%) - (5.97%)
Total 7.35% (8.45%) 5.60% 1.38% 8.59% (11.27%) 9.69% 8.14% 1.62% (7.23%) 0.04% 8.56% 2.37%
2004 Percent of Total 10.37% 8.48% 7.39% 6.38% 7.77% 6.04% 4.60% 4.42% 2.70% 12.91% 71.06% 28.94% 100.00%
2004 to 2005
Commercial 9.40% 5.84% 1.30% (8.20%) 5.44% 4.03% 36.35% - (19.69%) (15.81%) 4.69% 1.02% 2.90%General Aviation1 3.32% (19.32%) (3.90%) (12.89%) (8.81%) 0.44% 3.42% 2.28% (1.99%) (5.63%) (4.38%) 0.00% (4.14%)
Military & Other (9.73%) (30.35%) (36.05%) 5.01% (7.55%) (18.61%) 5.25% (2.08%) (1.64%) (24.35%) (12.75%) - (12.75%)
Total 7.51% (1.66%) (0.34%) (10.19%) (3.21%) (5.19%) 5.75% 6.65% (3.78%) (6.00%) (1.29%) 0.94% (0.65%)
2005 Percent of Total 11.22% 8.39% 7.42% 5.77% 7.57% 5.76% 4.89% 4.74% 2.61% 12.22% 70.60% 29.40% 100.00%
Appendix F, Regional Transportation F-6
Boston-Logan International Airport 2016 EDR
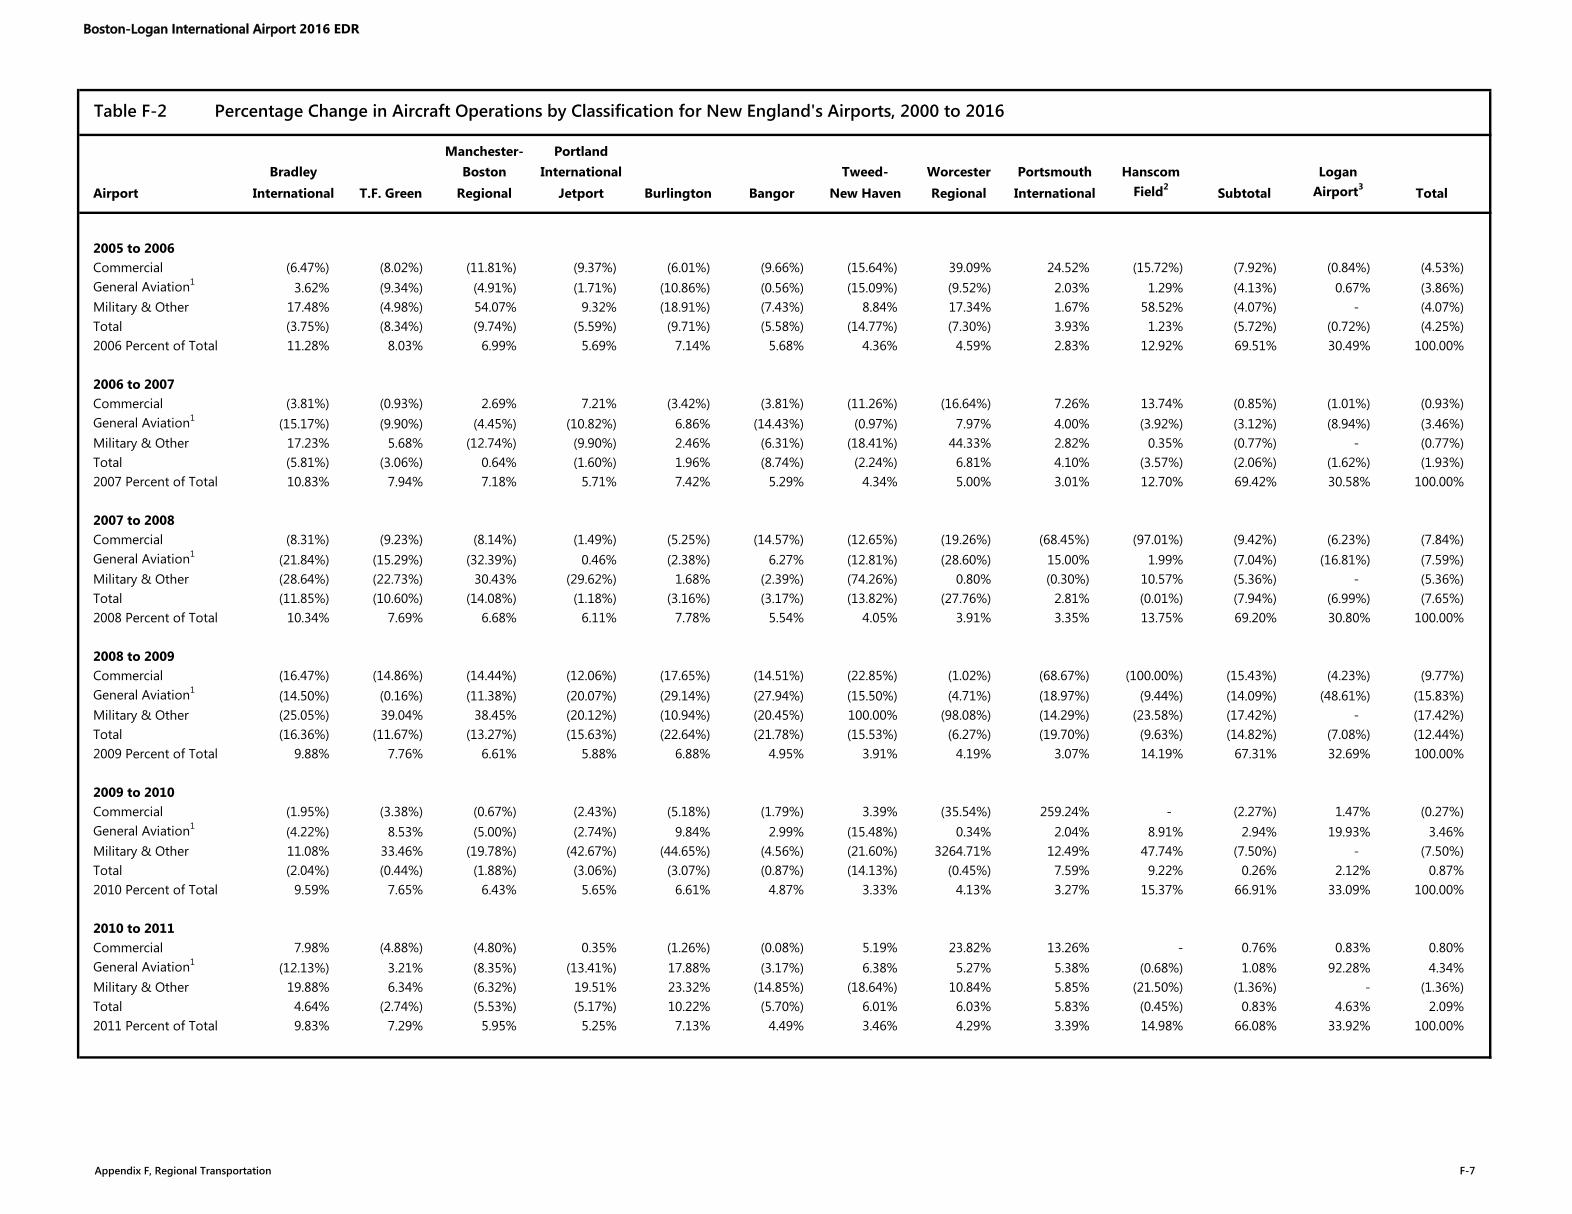
Table F-2 Percentage Change in Aircraft Operations by Classification for New England's Airports, 2000 to 2016
Manchester- PortlandBradley Boston International Tweed- Worcester Portsmouth Hanscom Logan
Airport International T.F. Green Regional Jetport Burlington Bangor New Haven Regional International Field2 Subtotal Airport3 Total
2005 to 2006Commercial (6.47%) (8.02%) (11.81%) (9.37%) (6.01%) (9.66%) (15.64%) 39.09% 24.52% (15.72%) (7.92%) (0.84%) (4.53%)General Aviation1 3.62% (9.34%) (4.91%) (1.71%) (10.86%) (0.56%) (15.09%) (9.52%) 2.03% 1.29% (4.13%) 0.67% (3.86%)Military & Other 17.48% (4.98%) 54.07% 9.32% (18.91%) (7.43%) 8.84% 17.34% 1.67% 58.52% (4.07%) - (4.07%)Total (3.75%) (8.34%) (9.74%) (5.59%) (9.71%) (5.58%) (14.77%) (7.30%) 3.93% 1.23% (5.72%) (0.72%) (4.25%)2006 Percent of Total 11.28% 8.03% 6.99% 5.69% 7.14% 5.68% 4.36% 4.59% 2.83% 12.92% 69.51% 30.49% 100.00%
2006 to 2007Commercial (3.81%) (0.93%) 2.69% 7.21% (3.42%) (3.81%) (11.26%) (16.64%) 7.26% 13.74% (0.85%) (1.01%) (0.93%)General Aviation1 (15.17%) (9.90%) (4.45%) (10.82%) 6.86% (14.43%) (0.97%) 7.97% 4.00% (3.92%) (3.12%) (8.94%) (3.46%)Military & Other 17.23% 5.68% (12.74%) (9.90%) 2.46% (6.31%) (18.41%) 44.33% 2.82% 0.35% (0.77%) - (0.77%)Total (5.81%) (3.06%) 0.64% (1.60%) 1.96% (8.74%) (2.24%) 6.81% 4.10% (3.57%) (2.06%) (1.62%) (1.93%)2007 Percent of Total 10.83% 7.94% 7.18% 5.71% 7.42% 5.29% 4.34% 5.00% 3.01% 12.70% 69.42% 30.58% 100.00%
2007 to 2008Commercial (8.31%) (9.23%) (8.14%) (1.49%) (5.25%) (14.57%) (12.65%) (19.26%) (68.45%) (97.01%) (9.42%) (6.23%) (7.84%)General Aviation1 (21.84%) (15.29%) (32.39%) 0.46% (2.38%) 6.27% (12.81%) (28.60%) 15.00% 1.99% (7.04%) (16.81%) (7.59%)Military & Other (28.64%) (22.73%) 30.43% (29.62%) 1.68% (2.39%) (74.26%) 0.80% (0.30%) 10.57% (5.36%) - (5.36%)Total (11.85%) (10.60%) (14.08%) (1.18%) (3.16%) (3.17%) (13.82%) (27.76%) 2.81% (0.01%) (7.94%) (6.99%) (7.65%)2008 Percent of Total 10.34% 7.69% 6.68% 6.11% 7.78% 5.54% 4.05% 3.91% 3.35% 13.75% 69.20% 30.80% 100.00%
2008 to 2009Commercial (16.47%) (14.86%) (14.44%) (12.06%) (17.65%) (14.51%) (22.85%) (1.02%) (68.67%) (100.00%) (15.43%) (4.23%) (9.77%)General Aviation1 (14.50%) (0.16%) (11.38%) (20.07%) (29.14%) (27.94%) (15.50%) (4.71%) (18.97%) (9.44%) (14.09%) (48.61%) (15.83%)Military & Other (25.05%) 39.04% 38.45% (20.12%) (10.94%) (20.45%) 100.00% (98.08%) (14.29%) (23.58%) (17.42%) - (17.42%)Total (16.36%) (11.67%) (13.27%) (15.63%) (22.64%) (21.78%) (15.53%) (6.27%) (19.70%) (9.63%) (14.82%) (7.08%) (12.44%)2009 Percent of Total 9.88% 7.76% 6.61% 5.88% 6.88% 4.95% 3.91% 4.19% 3.07% 14.19% 67.31% 32.69% 100.00%
2009 to 2010Commercial (1.95%) (3.38%) (0.67%) (2.43%) (5.18%) (1.79%) 3.39% (35.54%) 259.24% - (2.27%) 1.47% (0.27%)General Aviation1 (4.22%) 8.53% (5.00%) (2.74%) 9.84% 2.99% (15.48%) 0.34% 2.04% 8.91% 2.94% 19.93% 3.46%Military & Other 11.08% 33.46% (19.78%) (42.67%) (44.65%) (4.56%) (21.60%) 3264.71% 12.49% 47.74% (7.50%) - (7.50%)Total (2.04%) (0.44%) (1.88%) (3.06%) (3.07%) (0.87%) (14.13%) (0.45%) 7.59% 9.22% 0.26% 2.12% 0.87%2010 Percent of Total 9.59% 7.65% 6.43% 5.65% 6.61% 4.87% 3.33% 4.13% 3.27% 15.37% 66.91% 33.09% 100.00%
2010 to 2011Commercial 7.98% (4.88%) (4.80%) 0.35% (1.26%) (0.08%) 5.19% 23.82% 13.26% - 0.76% 0.83% 0.80%General Aviation1 (12.13%) 3.21% (8.35%) (13.41%) 17.88% (3.17%) 6.38% 5.27% 5.38% (0.68%) 1.08% 92.28% 4.34%Military & Other 19.88% 6.34% (6.32%) 19.51% 23.32% (14.85%) (18.64%) 10.84% 5.85% (21.50%) (1.36%) - (1.36%)Total 4.64% (2.74%) (5.53%) (5.17%) 10.22% (5.70%) 6.01% 6.03% 5.83% (0.45%) 0.83% 4.63% 2.09%2011 Percent of Total 9.83% 7.29% 5.95% 5.25% 7.13% 4.49% 3.46% 4.29% 3.39% 14.98% 66.08% 33.92% 100.00%
Appendix F, Regional Transportation F-7
Boston-Logan International Airport 2016 EDR
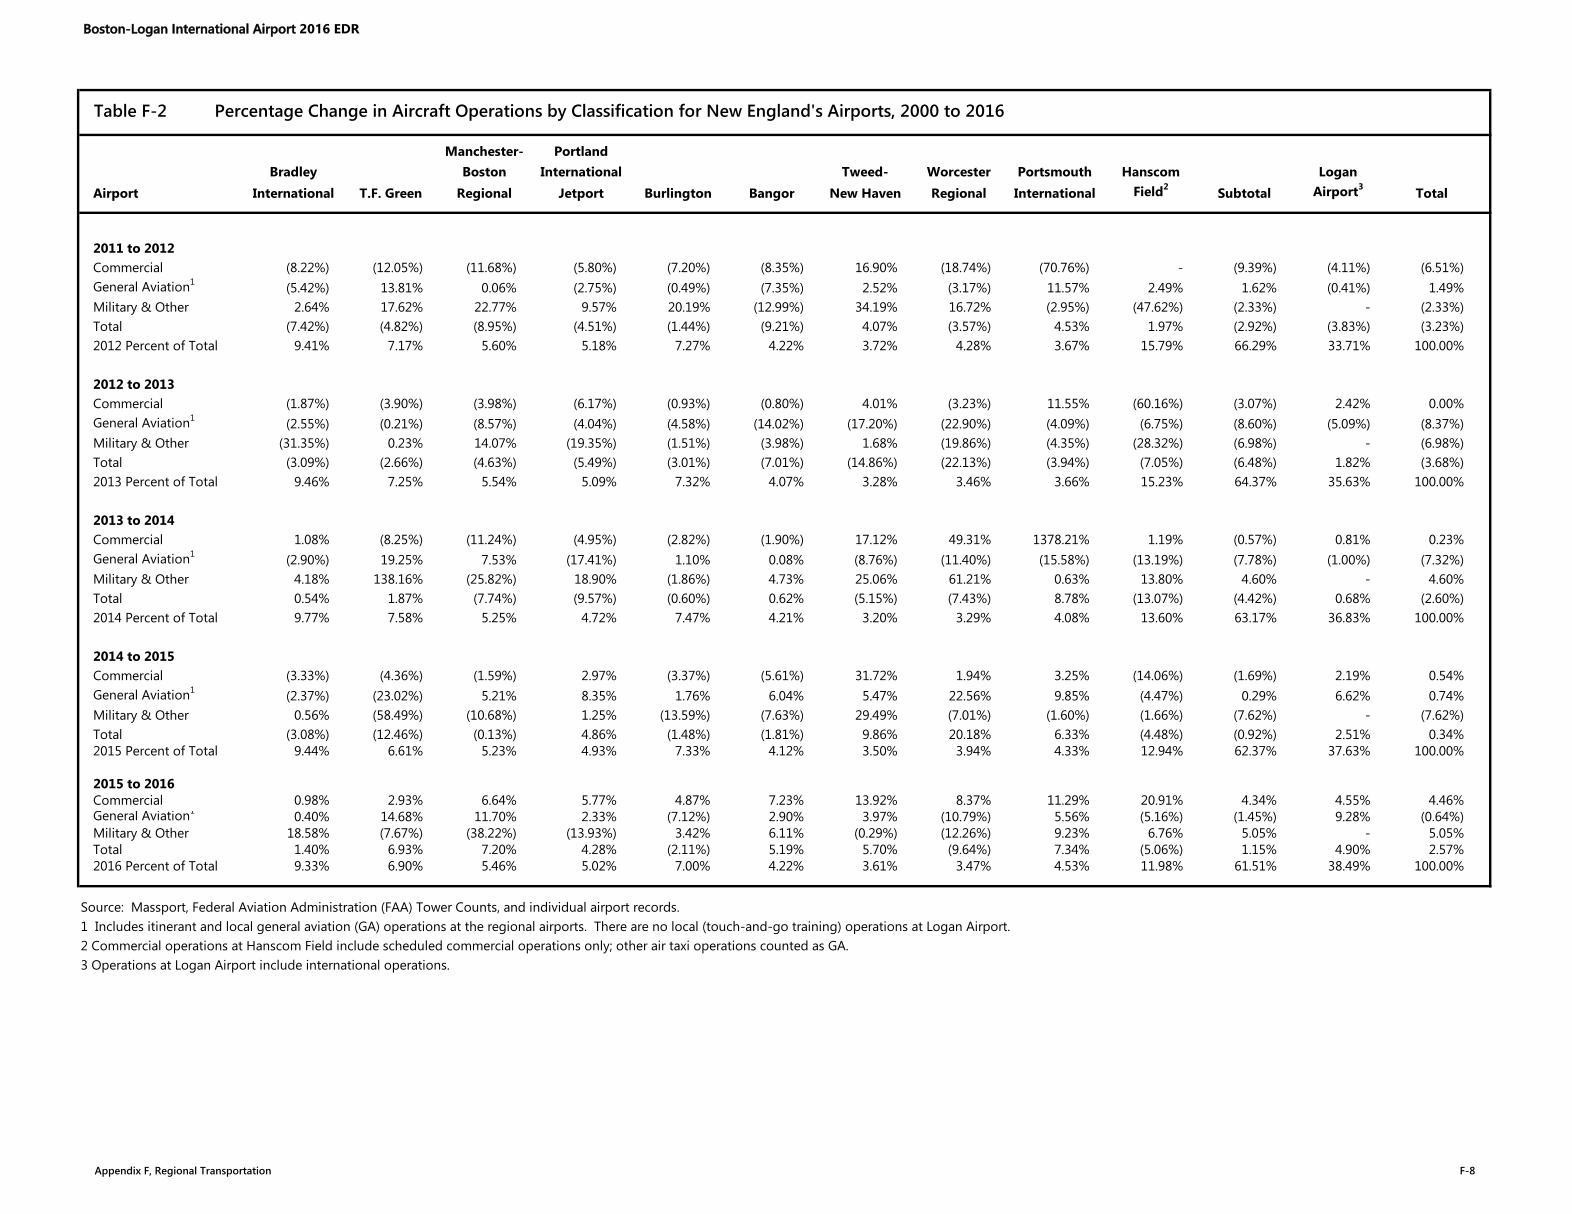
Table F-2 Percentage Change in Aircraft Operations by Classification for New England's Airports, 2000 to 2016
Manchester- PortlandBradley Boston International Tweed- Worcester Portsmouth Hanscom Logan
Airport International T.F. Green Regional Jetport Burlington Bangor New Haven Regional International Field2 Subtotal Airport3 Total
2011 to 2012Commercial (8.22%) (12.05%) (11.68%) (5.80%) (7.20%) (8.35%) 16.90% (18.74%) (70.76%) - (9.39%) (4.11%) (6.51%)General Aviation1 (5.42%) 13.81% 0.06% (2.75%) (0.49%) (7.35%) 2.52% (3.17%) 11.57% 2.49% 1.62% (0.41%) 1.49%Military & Other 2.64% 17.62% 22.77% 9.57% 20.19% (12.99%) 34.19% 16.72% (2.95%) (47.62%) (2.33%) - (2.33%)Total (7.42%) (4.82%) (8.95%) (4.51%) (1.44%) (9.21%) 4.07% (3.57%) 4.53% 1.97% (2.92%) (3.83%) (3.23%)2012 Percent of Total 9.41% 7.17% 5.60% 5.18% 7.27% 4.22% 3.72% 4.28% 3.67% 15.79% 66.29% 33.71% 100.00%
2012 to 2013Commercial (1.87%) (3.90%) (3.98%) (6.17%) (0.93%) (0.80%) 4.01% (3.23%) 11.55% (60.16%) (3.07%) 2.42% 0.00%General Aviation1 (2.55%) (0.21%) (8.57%) (4.04%) (4.58%) (14.02%) (17.20%) (22.90%) (4.09%) (6.75%) (8.60%) (5.09%) (8.37%)Military & Other (31.35%) 0.23% 14.07% (19.35%) (1.51%) (3.98%) 1.68% (19.86%) (4.35%) (28.32%) (6.98%) - (6.98%)Total (3.09%) (2.66%) (4.63%) (5.49%) (3.01%) (7.01%) (14.86%) (22.13%) (3.94%) (7.05%) (6.48%) 1.82% (3.68%)2013 Percent of Total 9.46% 7.25% 5.54% 5.09% 7.32% 4.07% 3.28% 3.46% 3.66% 15.23% 64.37% 35.63% 100.00%
2013 to 2014Commercial 1.08% (8.25%) (11.24%) (4.95%) (2.82%) (1.90%) 17.12% 49.31% 1378.21% 1.19% (0.57%) 0.81% 0.23%General Aviation1 (2.90%) 19.25% 7.53% (17.41%) 1.10% 0.08% (8.76%) (11.40%) (15.58%) (13.19%) (7.78%) (1.00%) (7.32%)Military & Other 4.18% 138.16% (25.82%) 18.90% (1.86%) 4.73% 25.06% 61.21% 0.63% 13.80% 4.60% - 4.60%Total 0.54% 1.87% (7.74%) (9.57%) (0.60%) 0.62% (5.15%) (7.43%) 8.78% (13.07%) (4.42%) 0.68% (2.60%)2014 Percent of Total 9.77% 7.58% 5.25% 4.72% 7.47% 4.21% 3.20% 3.29% 4.08% 13.60% 63.17% 36.83% 100.00%
2014 to 2015Commercial (3.33%) (4.36%) (1.59%) 2.97% (3.37%) (5.61%) 31.72% 1.94% 3.25% (14.06%) (1.69%) 2.19% 0.54%General Aviation1 (2.37%) (23.02%) 5.21% 8.35% 1.76% 6.04% 5.47% 22.56% 9.85% (4.47%) 0.29% 6.62% 0.74%Military & Other 0.56% (58.49%) (10.68%) 1.25% (13.59%) (7.63%) 29.49% (7.01%) (1.60%) (1.66%) (7.62%) - (7.62%)Total (3.08%) (12.46%) (0.13%) 4.86% (1.48%) (1.81%) 9.86% 20.18% 6.33% (4.48%) (0.92%) 2.51% 0.34%2015 Percent of Total 9.44% 6.61% 5.23% 4.93% 7.33% 4.12% 3.50% 3.94% 4.33% 12.94% 62.37% 37.63% 100.00%
2015 to 2016Commercial 0.98% 2.93% 6.64% 5.77% 4.87% 7.23% 13.92% 8.37% 11.29% 20.91% 4.34% 4.55% 4.46%General Aviation1 0.40% 14.68% 11.70% 2.33% (7.12%) 2.90% 3.97% (10.79%) 5.56% (5.16%) (1.45%) 9.28% (0.64%)Military & Other 18.58% (7.67%) (38.22%) (13.93%) 3.42% 6.11% (0.29%) (12.26%) 9.23% 6.76% 5.05% - 5.05%Total 1.40% 6.93% 7.20% 4.28% (2.11%) 5.19% 5.70% (9.64%) 7.34% (5.06%) 1.15% 4.90% 2.57%2016 Percent of Total 9.33% 6.90% 5.46% 5.02% 7.00% 4.22% 3.61% 3.47% 4.53% 11.98% 61.51% 38.49% 100.00%
Source: Massport, Federal Aviation Administration (FAA) Tower Counts, and individual airport records.1 Includes itinerant and local general aviation (GA) operations at the regional airports. There are no local (touch-and-go training) operations at Logan Airport.2 Commercial operations at Hanscom Field include scheduled commercial operations only; other air taxi operations counted as GA.3 Operations at Logan Airport include international operations.
Appendix F, Regional Transportation F-8
Boston-Logan International Airport 2016 EDR
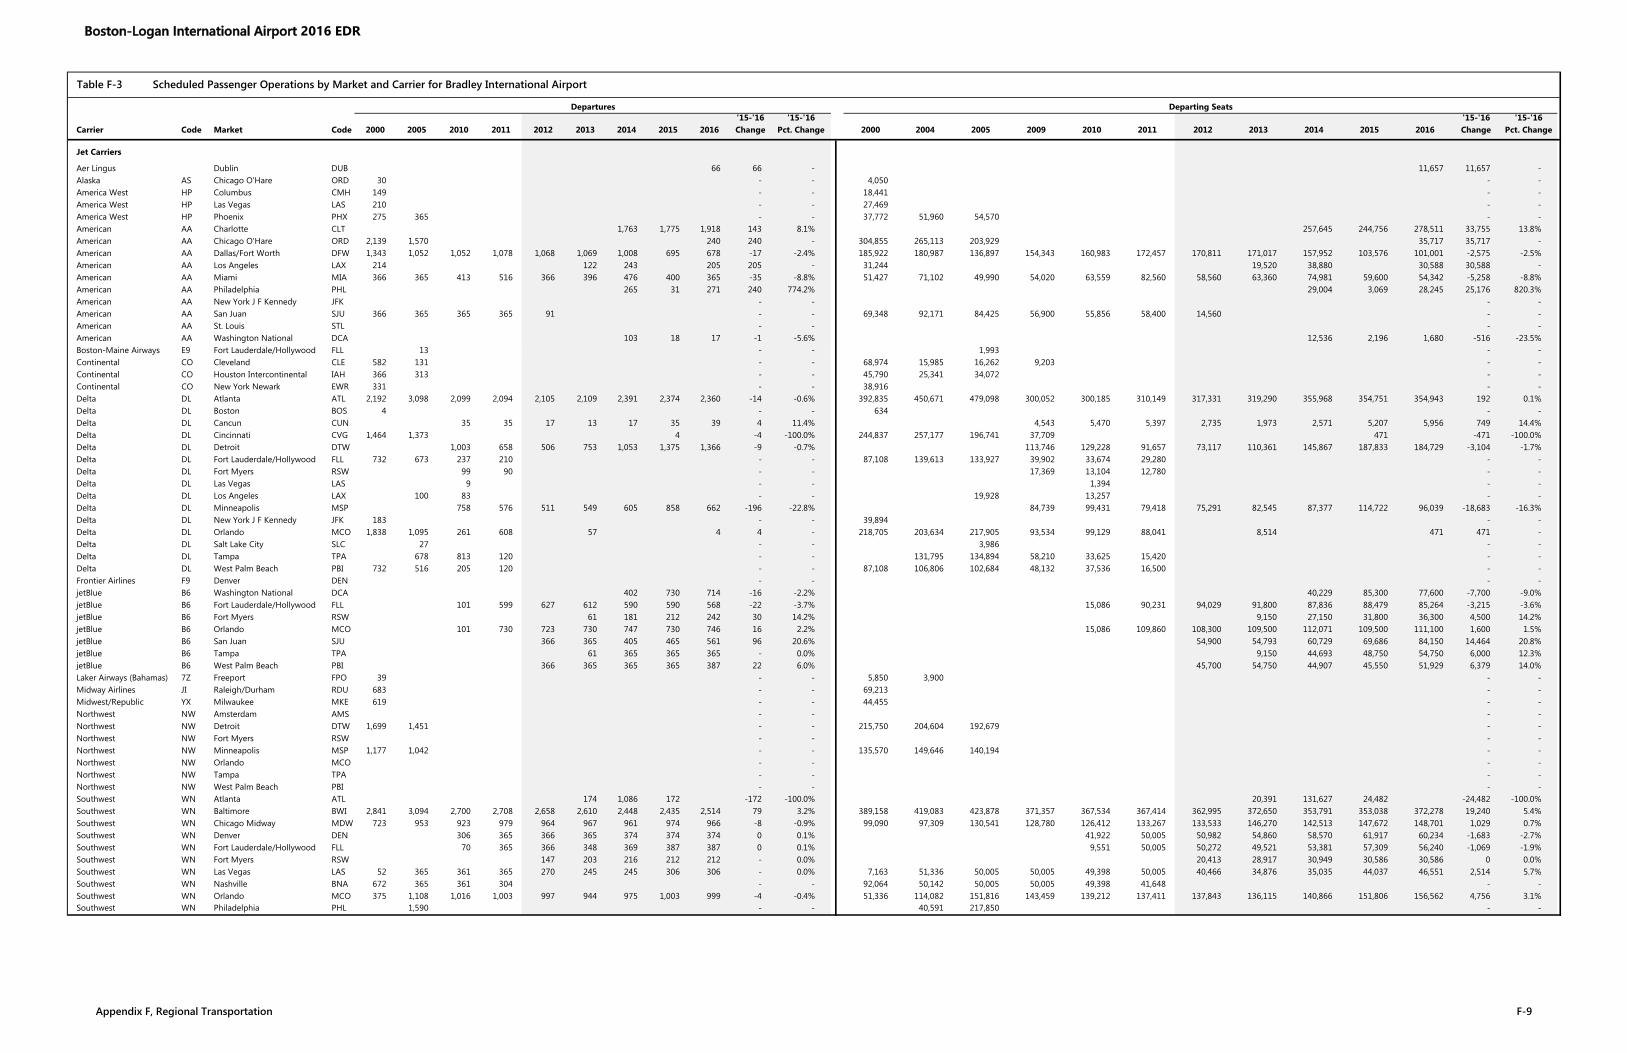
Table F-3 Scheduled Passenger Operations by Market and Carrier for Bradley International Airport
Departures Departing Seats'15-'16 '15-'16 '15-'16 '15-'16
Carrier Code Market Code 2000 2005 2010 2011 2012 2013 2014 2015 2016 Change Pct. Change 2000 2004 2005 2009 2010 2011 2012 2013 2014 2015 2016 Change Pct. Change
Jet Carriers
Aer Lingus Dublin DUB 66 66 - 11,657 11,657 -Alaska AS Chicago O'Hare ORD 30 - - 4,050 - -America West HP Columbus CMH 149 - - 18,441 - -America West HP Las Vegas LAS 210 - - 27,469 - -America West HP Phoenix PHX 275 365 - - 37,772 51,960 54,570 - -American AA Charlotte CLT 1,763 1,775 1,918 143 8.1% 257,645 244,756 278,511 33,755 13.8%American AA Chicago O'Hare ORD 2,139 1,570 240 240 - 304,855 265,113 203,929 35,717 35,717 -American AA Dallas/Fort Worth DFW 1,343 1,052 1,052 1,078 1,068 1,069 1,008 695 678 -17 -2.4% 185,922 180,987 136,897 154,343 160,983 172,457 170,811 171,017 157,952 103,576 101,001 -2,575 -2.5%American AA Los Angeles LAX 214 122 243 205 205 - 31,244 19,520 38,880 30,588 30,588 -American AA Miami MIA 366 365 413 516 366 396 476 400 365 -35 -8.8% 51,427 71,102 49,990 54,020 63,559 82,560 58,560 63,360 74,981 59,600 54,342 -5,258 -8.8%American AA Philadelphia PHL 265 31 271 240 774.2% 29,004 3,069 28,245 25,176 820.3%American AA New York J F Kennedy JFK - - - -American AA San Juan SJU 366 365 365 365 91 - - 69,348 92,171 84,425 56,900 55,856 58,400 14,560 - -American AA St. Louis STL - - - -American AA Washington National DCA 103 18 17 -1 -5.6% 12,536 2,196 1,680 -516 -23.5%Boston-Maine Airways E9 Fort Lauderdale/Hollywood FLL 13 - - 1,993 - -Continental CO Cleveland CLE 582 131 - - 68,974 15,985 16,262 9,203 - -Continental CO Houston Intercontinental IAH 366 313 - - 45,790 25,341 34,072 - -Continental CO New York Newark EWR 331 - - 38,916 - -Delta DL Atlanta ATL 2,192 3,098 2,099 2,094 2,105 2,109 2,391 2,374 2,360 -14 -0.6% 392,835 450,671 479,098 300,052 300,185 310,149 317,331 319,290 355,968 354,751 354,943 192 0.1%Delta DL Boston BOS 4 - - 634 - -Delta DL Cancun CUN 35 35 17 13 17 35 39 4 11.4% 4,543 5,470 5,397 2,735 1,973 2,571 5,207 5,956 749 14.4%Delta DL Cincinnati CVG 1,464 1,373 4 -4 -100.0% 244,837 257,177 196,741 37,709 471 -471 -100.0%Delta DL Detroit DTW 1,003 658 506 753 1,053 1,375 1,366 -9 -0.7% 113,746 129,228 91,657 73,117 110,361 145,867 187,833 184,729 -3,104 -1.7%Delta DL Fort Lauderdale/Hollywood FLL 732 673 237 210 - - 87,108 139,613 133,927 39,902 33,674 29,280 - -Delta DL Fort Myers RSW 99 90 - - 17,369 13,104 12,780 - -Delta DL Las Vegas LAS 9 - - 1,394 - -Delta DL Los Angeles LAX 100 83 - - 19,928 13,257 - -Delta DL Minneapolis MSP 758 576 511 549 605 858 662 -196 -22.8% 84,739 99,431 79,418 75,291 82,545 87,377 114,722 96,039 -18,683 -16.3%Delta DL New York J F Kennedy JFK 183 - - 39,894 - -Delta DL Orlando MCO 1,838 1,095 261 608 57 4 4 - 218,705 203,634 217,905 93,534 99,129 88,041 8,514 471 471 -Delta DL Salt Lake City SLC 27 - - 3,986 - -Delta DL Tampa TPA 678 813 120 - - 131,795 134,894 58,210 33,625 15,420 - -Delta DL West Palm Beach PBI 732 516 205 120 - - 87,108 106,806 102,684 48,132 37,536 16,500 - -Frontier Airlines F9 Denver DEN - - - -jetBlue B6 Washington National DCA 402 730 714 -16 -2.2% 40,229 85,300 77,600 -7,700 -9.0%jetBlue B6 Fort Lauderdale/Hollywood FLL 101 599 627 612 590 590 568 -22 -3.7% 15,086 90,231 94,029 91,800 87,836 88,479 85,264 -3,215 -3.6%jetBlue B6 Fort Myers RSW 61 181 212 242 30 14.2% 9,150 27,150 31,800 36,300 4,500 14.2%jetBlue B6 Orlando MCO 101 730 723 730 747 730 746 16 2.2% 15,086 109,860 108,300 109,500 112,071 109,500 111,100 1,600 1.5%jetBlue B6 San Juan SJU 366 365 405 465 561 96 20.6% 54,900 54,793 60,729 69,686 84,150 14,464 20.8%jetBlue B6 Tampa TPA 61 365 365 365 - 0.0% 9,150 44,693 48,750 54,750 6,000 12.3%jetBlue B6 West Palm Beach PBI 366 365 365 365 387 22 6.0% 45,700 54,750 44,907 45,550 51,929 6,379 14.0%Laker Airways (Bahamas) 7Z Freeport FPO 39 - - 5,850 3,900 - -Midway Airlines JI Raleigh/Durham RDU 683 - - 69,213 - -Midwest/Republic YX Milwaukee MKE 619 - - 44,455 - -Northwest NW Amsterdam AMS - - - -Northwest NW Detroit DTW 1,699 1,451 - - 215,750 204,604 192,679 - -Northwest NW Fort Myers RSW - - - -Northwest NW Minneapolis MSP 1,177 1,042 - - 135,570 149,646 140,194 - -Northwest NW Orlando MCO - - - -Northwest NW Tampa TPA - - - -Northwest NW West Palm Beach PBI - - - -Southwest WN Atlanta ATL 174 1,086 172 -172 -100.0% 20,391 131,627 24,482 -24,482 -100.0%Southwest WN Baltimore BWI 2,841 3,094 2,700 2,708 2,658 2,610 2,448 2,435 2,514 79 3.2% 389,158 419,083 423,878 371,357 367,534 367,414 362,995 372,650 353,791 353,038 372,278 19,240 5.4%Southwest WN Chicago Midway MDW 723 953 923 979 964 967 961 974 966 -8 -0.9% 99,090 97,309 130,541 128,780 126,412 133,267 133,533 146,270 142,513 147,672 148,701 1,029 0.7%Southwest WN Denver DEN 306 365 366 365 374 374 374 0 0.1% 41,922 50,005 50,982 54,860 58,570 61,917 60,234 -1,683 -2.7%Southwest WN Fort Lauderdale/Hollywood FLL 70 365 366 348 369 387 387 0 0.1% 9,551 50,005 50,272 49,521 53,381 57,309 56,240 -1,069 -1.9%Southwest WN Fort Myers RSW 147 203 216 212 212 - 0.0% 20,413 28,917 30,949 30,586 30,586 0 0.0%Southwest WN Las Vegas LAS 52 365 361 365 270 245 245 306 306 - 0.0% 7,163 51,336 50,005 50,005 49,398 50,005 40,466 34,876 35,035 44,037 46,551 2,514 5.7%Southwest WN Nashville BNA 672 365 361 304 - - 92,064 50,142 50,005 50,005 49,398 41,648 - -Southwest WN Orlando MCO 375 1,108 1,016 1,003 997 944 975 1,003 999 -4 -0.4% 51,336 114,082 151,816 143,459 139,212 137,411 137,843 136,115 140,866 151,806 156,562 4,756 3.1%Southwest WN Philadelphia PHL 1,590 - - 40,591 217,850 - -
Appendix F, Regional Transportation F-9
Boston-Logan International Airport 2016 EDR

Table F-3 Scheduled Passenger Operations by Market and Carrier for Bradley International Airport
Departures Departing Seats'15-'16 '15-'16 '15-'16 '15-'16
Carrier Code Market Code 2000 2005 2010 2011 2012 2013 2014 2015 2016 Change Pct. Change 2000 2004 2005 2009 2010 2011 2012 2013 2014 2015 2016 Change Pct. Change
Southwest WN Tampa TPA 695 570 656 623 629 656 651 642 -9 -1.4% 52,530 95,156 58,362 78,129 89,852 85,873 90,219 93,662 93,905 93,646 -259 -0.3%Southwest WN West Palm Beach PBI 61 4 4 - 0.0% 8,357 633 633 - 0.0%Sunworld International SM Philadelphia PHL - - - -Trans World Airlines TW Portland (ME) PWM 305 - - 43,310 - -Trans World Airlines TW St. Louis STL 1,460 - - 206,109 - -United UA Chicago O'Hare ORD 2,034 1,812 1,296 1,077 697 593 800 554 605 51 9.2% 299,522 317,682 259,437 200,920 198,709 159,738 104,725 86,911 112,864 72,529 84,972 12,443 17.2%United UA Denver DEN 366 275 275 - 46,901 36,838 36,838 -United UA New York Newark EWR 18 - - 2,126 - -United UA San Francisco SFO 366 - - 45,384 - -United UA Washington Dulles IAD 1,455 726 1,192 812 514 180 222 82 472 390 475.6% 173,869 63,854 81,631 131,883 155,750 108,500 66,780 25,418 32,132 11,182 73,998 62,816 561.8%US Airways US Baltimore BWI 488 - - 41,760 - -US Airways US Charlotte CLT 1,464 2,188 1,588 1,664 1,665 1,734 - - 214,719 229,826 350,776 146,512 228,119 238,508 241,320 255,885 - -US Airways US Fort Lauderdale/Hollywood FLL 366 123 - - 39,232 1,272 15,161 - -US Airways US Orlando MCO 1,098 30 - - 117,696 5,986 3,842 - -US Airways US Philadelphia PHL 2,148 2,102 361 317 340 365 - - 310,118 267,741 301,242 58,153 49,914 44,595 46,989 49,083 - -US Airways US Phoenix PHX - - - -US Airways US Pittsburgh PIT 1,800 27 - - 278,575 157,633 3,189 - -US Airways US Washington Dulles IAD 732 - - 86,376 - -US Airways US Washington National DCA 1,329 1,064 361 365 335 208 - - 171,891 141,901 141,068 84,917 51,434 52,210 46,511 25,610 - -US Airways US West Palm Beach PBI 366 - - 39,232 - -USA 3000 Airlines U5 Cancun CUN 26 - - 4,336 - -USA 3000 Airlines U5 Punta Cana PUJ 13 - - 2,128 - - Subtotal 38,171 30,507 18,695 18,841 16,686 16,845 19,331 18,175 19,530 1,354 7.5% 5,179,671 4,361,471 4,486,236 2,496,754 2,622,086 2,693,666 2,404,036 2,484,577 2,765,786 2,604,342 2,846,211 241,870 9.3%Regional/Commuter Carriers
Air Canada Express AC Montreal Dorval YUL 1,385 1,038 1,021 986 976 952 996 1,008 1,038 30 3.0% 19,392 21,557 19,475 19,157 19,399 18,739 18,549 17,144 17,925 18,141 18,692 551 3.0%Air Canada Express AC Toronto YYZ 1,589 1,342 1,287 1,308 1,294 1,295 1,313 1,395 1,399 4 0.3% 61,991 35,666 38,242 38,410 36,960 38,342 33,044 28,103 25,102 25,118 35,328 10,210 40.6%America West Express HP Columbus CMH 450 - - 22,493 - -American Connection AA St. Louis STL 947 - - 32,571 44,356 9,240 - -American Eagle AA Charlotte CLT 366 290 156 -134 -46.1% 28,940 22,265 11,774 -10,491 -47.1%American Eagle AA Chicago O'Hare ORD 1,501 1,630 1,613 1,630 1,622 1,604 1,421 -183 -11.4% 416 50,374 79,594 95,985 80,413 90,663 115,856 115,366 93,468 -21,898 -19.0%American Eagle AA New York J F Kennedy JFK 1,460 - - 48,166 - -American Eagle AA Philadelphia PHL 2,234 2,502 2,133 -369 -14.8% 136,683 146,222 123,285 -22,937 -15.7%American Eagle AA Pittsburgh PIT 939 782 -782 -100.0% 67,549 39,086 -39,086 -100.0%American Eagle AA Raleigh/Durham RDU 1,364 257 - - 46,535 54,521 45,154 10,774 - -American Eagle AA St. Louis STL - - 4,600 - -American Eagle AA Washington National DCA 2,119 2,125 2,251 126 5.9% 141,783 130,975 142,309 11,334 8.7%Continental Connection CO Albany ALB 51 - - 16,337 961 - -Continental Connection CO Binghamton BGM - - - -Continental Connection CO Boston BOS - - - -Continental Connection CO Buffalo BUF 89 - - 1,683 - -Continental Connection CO Burlington BTV 4 - - 84 - -Continental Connection CO New York J F Kennedy JFK - - - -Continental Connection CO New York Newark EWR 608 - - 13,859 22,485 - -Continental Connection CO Philadelphia PHL - - - -Continental Connection CO Rochester ROC 93 - - 1,767 - -Continental Connection CO Syracuse SYR 97 - - 1,851 - -Continental Express CO Cleveland CLE 803 1,102 1,208 - - 39,357 56,179 54,951 58,179 60,400 - -Continental Express CO New York Newark EWR 1,747 1,351 465 - - 82,365 68,285 67,455 42,029 23,264 - -Delta Connection DL Atlanta ATL 48 9 4 4 4 -4 -100.0% 3,396 647 279 288 326 -326 -100.0%Delta Connection DL Cincinnati CVG 1,218 1,251 902 895 839 475 300 -175 -36.8% 60,954 61,642 66,559 45,181 44,757 43,557 25,537 22,800 -2,737 -10.7%Delta Connection DL Cleveland CLE 170 243 266 23 9.5% 11,898 15,450 19,798 4,348 28.1%Delta Connection DL Columbus CMH 994 - - 4,650 49,196 - -Delta Connection DL Detroit DTW 1,004 1,323 1,429 1,195 659 313 264 -49 -15.7% 53,556 54,265 82,915 100,525 80,351 45,421 20,860 18,905 -1,955 -9.4%Delta Connection DL Fort Lauderdale/Hollywood FLL - - - -Delta Connection DL Fort Myers RSW 612 - - 42,840 - -Delta Connection DL Indianapolis IND - - 3,857 - -Delta Connection DL Minneapolis MSP 481 814 858 812 738 342 539 197 57.6% 34,895 36,567 61,731 64,643 61,035 55,233 25,556 40,845 15,289 59.8%Delta Connection DL Myrtle Beach MYR 61 - - 3,057 - -Delta Connection DL New York J F Kennedy JFK 365 304 183 - - 39,736 18,250 15,200 9,216 - -Delta Connection DL Orlando MCO 43 35 8 -27 -77.1% 3,156 2,354 641 -1,713 -72.8%Delta Connection DL Raleigh/Durham RDU 100 569 454 270 257 261 253 -8 -3.1% 6,136 28,436 22,686 13,500 12,850 17,611 18,054 443 2.5%Delta Connection DL Tampa TPA - - - -Delta Connection DL Washington National DCA 166 929 360 - - 11,324 51,524 18,074 - -Delta Connection DL West Palm Beach PBI - - - -Frontier Express F9 Milwaukee MKE 140 417 - - 6,313 18,746 - -Independence Air DH Washington Dulles IAD 1,966 - - 57,714 98,307 - -Midway Airlines JI Raleigh/Durham RDU 1,348 - - 67,393 - -Midwest Connect YX Milwaukee MKE 4 965 - - 142 30,117 30,871 - -
Appendix F, Regional Transportation F-10
Boston-Logan International Airport 2016 EDR
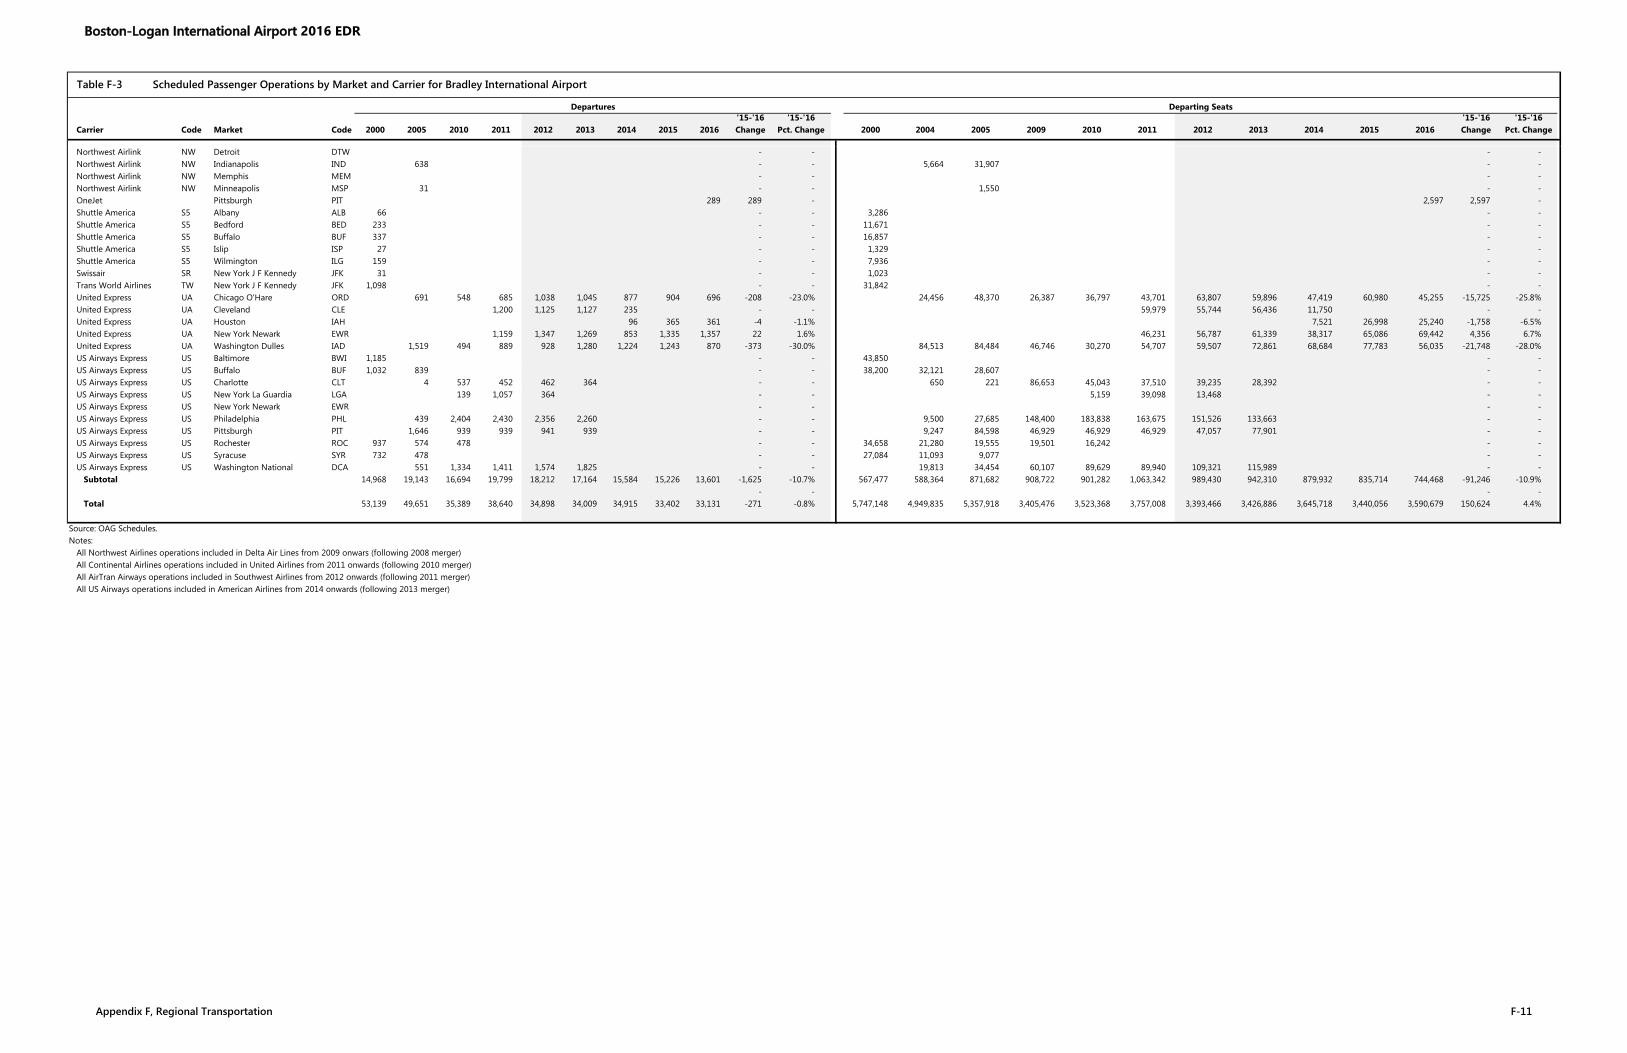
Table F-3 Scheduled Passenger Operations by Market and Carrier for Bradley International Airport
Departures Departing Seats'15-'16 '15-'16 '15-'16 '15-'16
Carrier Code Market Code 2000 2005 2010 2011 2012 2013 2014 2015 2016 Change Pct. Change 2000 2004 2005 2009 2010 2011 2012 2013 2014 2015 2016 Change Pct. Change
Northwest Airlink NW Detroit DTW - - - -Northwest Airlink NW Indianapolis IND 638 - - 5,664 31,907 - -Northwest Airlink NW Memphis MEM - - - -Northwest Airlink NW Minneapolis MSP 31 - - 1,550 - -OneJet Pittsburgh PIT 289 289 - 2,597 2,597 -Shuttle America S5 Albany ALB 66 - - 3,286 - -Shuttle America S5 Bedford BED 233 - - 11,671 - -Shuttle America S5 Buffalo BUF 337 - - 16,857 - -Shuttle America S5 Islip ISP 27 - - 1,329 - -Shuttle America S5 Wilmington ILG 159 - - 7,936 - -Swissair SR New York J F Kennedy JFK 31 - - 1,023 - -Trans World Airlines TW New York J F Kennedy JFK 1,098 - - 31,842 - -United Express UA Chicago O'Hare ORD 691 548 685 1,038 1,045 877 904 696 -208 -23.0% 24,456 48,370 26,387 36,797 43,701 63,807 59,896 47,419 60,980 45,255 -15,725 -25.8%United Express UA Cleveland CLE 1,200 1,125 1,127 235 - - 59,979 55,744 56,436 11,750 - -United Express UA Houston IAH 96 365 361 -4 -1.1% 7,521 26,998 25,240 -1,758 -6.5%United Express UA New York Newark EWR 1,159 1,347 1,269 853 1,335 1,357 22 1.6% 46,231 56,787 61,339 38,317 65,086 69,442 4,356 6.7%United Express UA Washington Dulles IAD 1,519 494 889 928 1,280 1,224 1,243 870 -373 -30.0% 84,513 84,484 46,746 30,270 54,707 59,507 72,861 68,684 77,783 56,035 -21,748 -28.0%US Airways Express US Baltimore BWI 1,185 - - 43,850 - -US Airways Express US Buffalo BUF 1,032 839 - - 38,200 32,121 28,607 - -US Airways Express US Charlotte CLT 4 537 452 462 364 - - 650 221 86,653 45,043 37,510 39,235 28,392 - -US Airways Express US New York La Guardia LGA 139 1,057 364 - - 5,159 39,098 13,468 - -US Airways Express US New York Newark EWR - - - -US Airways Express US Philadelphia PHL 439 2,404 2,430 2,356 2,260 - - 9,500 27,685 148,400 183,838 163,675 151,526 133,663 - -US Airways Express US Pittsburgh PIT 1,646 939 939 941 939 - - 9,247 84,598 46,929 46,929 46,929 47,057 77,901 - -US Airways Express US Rochester ROC 937 574 478 - - 34,658 21,280 19,555 19,501 16,242 - -US Airways Express US Syracuse SYR 732 478 - - 27,084 11,093 9,077 - -US Airways Express US Washington National DCA 551 1,334 1,411 1,574 1,825 - - 19,813 34,454 60,107 89,629 89,940 109,321 115,989 - - Subtotal 14,968 19,143 16,694 19,799 18,212 17,164 15,584 15,226 13,601 -1,625 -10.7% 567,477 588,364 871,682 908,722 901,282 1,063,342 989,430 942,310 879,932 835,714 744,468 -91,246 -10.9%
- - - -Total 53,139 49,651 35,389 38,640 34,898 34,009 34,915 33,402 33,131 -271 -0.8% 5,747,148 4,949,835 5,357,918 3,405,476 3,523,368 3,757,008 3,393,466 3,426,886 3,645,718 3,440,056 3,590,679 150,624 4.4%
Source: OAG Schedules.Notes:
All Northwest Airlines operations included in Delta Air Lines from 2009 onwars (following 2008 merger)All Continental Airlines operations included in United Airlines from 2011 onwards (following 2010 merger)All AirTran Airways operations included in Southwest Airlines from 2012 onwards (following 2011 merger)All US Airways operations included in American Airlines from 2014 onwards (following 2013 merger)
Appendix F, Regional Transportation F-11
Boston-Logan International Airport 2016 EDR
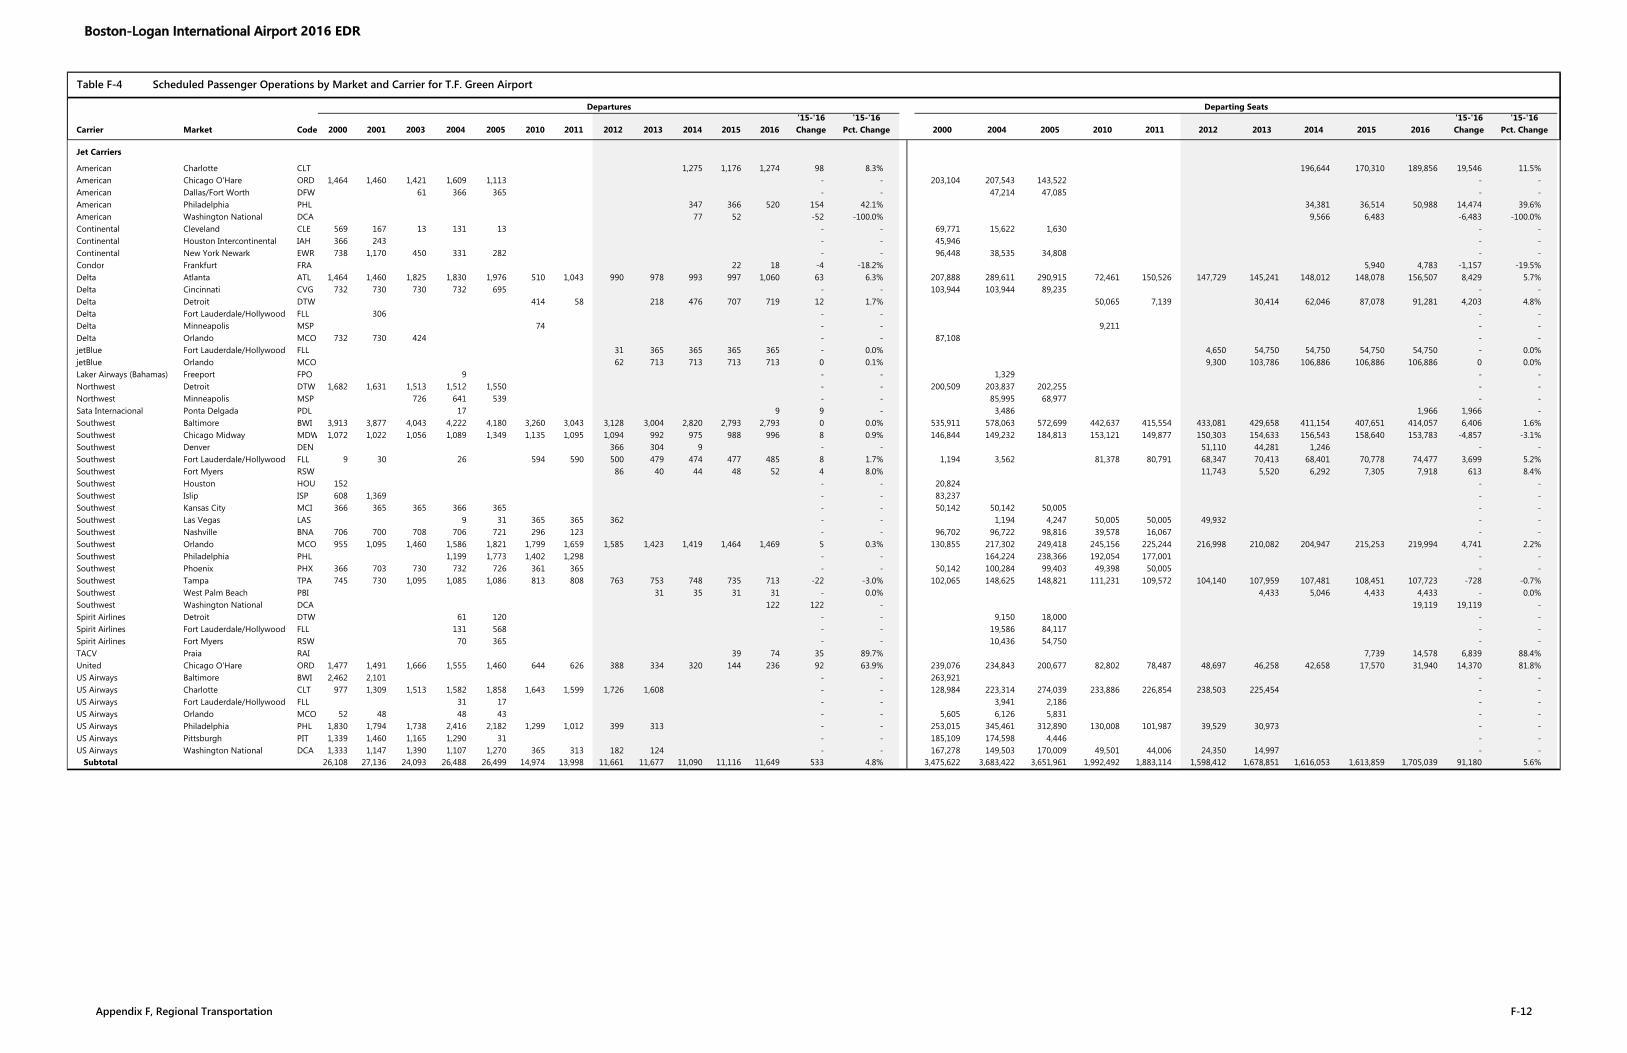
Table F-4 Scheduled Passenger Operations by Market and Carrier for T.F. Green Airport
Departures Departing Seats'15-'16 '15-'16 '15-'16 '15-'16
Carrier Market Code 2000 2001 2003 2004 2005 2010 2011 2012 2013 2014 2015 2016 Change Pct. Change 2000 2004 2005 2010 2011 2012 2013 2014 2015 2016 Change Pct. Change
Jet Carriers
American Charlotte CLT 1,275 1,176 1,274 98 8.3% 196,644 170,310 189,856 19,546 11.5%American Chicago O'Hare ORD 1,464 1,460 1,421 1,609 1,113 - - 203,104 207,543 143,522 - -American Dallas/Fort Worth DFW 61 366 365 - - 47,214 47,085 - -American Philadelphia PHL 347 366 520 154 42.1% 34,381 36,514 50,988 14,474 39.6%American Washington National DCA 77 52 -52 -100.0% 9,566 6,483 -6,483 -100.0%Continental Cleveland CLE 569 167 13 131 13 - - 69,771 15,622 1,630 - -Continental Houston Intercontinental IAH 366 243 - - 45,946 - -Continental New York Newark EWR 738 1,170 450 331 282 - - 96,448 38,535 34,808 - -Condor Frankfurt FRA 22 18 -4 -18.2% 5,940 4,783 -1,157 -19.5%Delta Atlanta ATL 1,464 1,460 1,825 1,830 1,976 510 1,043 990 978 993 997 1,060 63 6.3% 207,888 289,611 290,915 72,461 150,526 147,729 145,241 148,012 148,078 156,507 8,429 5.7%Delta Cincinnati CVG 732 730 730 732 695 - - 103,944 103,944 89,235 - -Delta Detroit DTW 414 58 218 476 707 719 12 1.7% 50,065 7,139 30,414 62,046 87,078 91,281 4,203 4.8%Delta Fort Lauderdale/Hollywood FLL 306 - - - -Delta Minneapolis MSP 74 - - 9,211 - -Delta Orlando MCO 732 730 424 - - 87,108 - -jetBlue Fort Lauderdale/Hollywood FLL 31 365 365 365 365 - 0.0% 4,650 54,750 54,750 54,750 54,750 - 0.0%jetBlue Orlando MCO 62 713 713 713 713 0 0.1% 9,300 103,786 106,886 106,886 106,886 0 0.0%Laker Airways (Bahamas) Freeport FPO 9 - - 1,329 - -Northwest Detroit DTW 1,682 1,631 1,513 1,512 1,550 - - 200,509 203,837 202,255 - -Northwest Minneapolis MSP 726 641 539 - - 85,995 68,977 - -Sata Internacional Ponta Delgada PDL 17 9 9 - 3,486 1,966 1,966 -Southwest Baltimore BWI 3,913 3,877 4,043 4,222 4,180 3,260 3,043 3,128 3,004 2,820 2,793 2,793 0 0.0% 535,911 578,063 572,699 442,637 415,554 433,081 429,658 411,154 407,651 414,057 6,406 1.6%Southwest Chicago Midway MDW 1,072 1,022 1,056 1,089 1,349 1,135 1,095 1,094 992 975 988 996 8 0.9% 146,844 149,232 184,813 153,121 149,877 150,303 154,633 156,543 158,640 153,783 -4,857 -3.1%Southwest Denver DEN 366 304 9 - - 51,110 44,281 1,246 - -Southwest Fort Lauderdale/Hollywood FLL 9 30 26 594 590 500 479 474 477 485 8 1.7% 1,194 3,562 81,378 80,791 68,347 70,413 68,401 70,778 74,477 3,699 5.2%Southwest Fort Myers RSW 86 40 44 48 52 4 8.0% 11,743 5,520 6,292 7,305 7,918 613 8.4%Southwest Houston HOU 152 - - 20,824 - -Southwest Islip ISP 608 1,369 - - 83,237 - -Southwest Kansas City MCI 366 365 365 366 365 - - 50,142 50,142 50,005 - -Southwest Las Vegas LAS 9 31 365 365 362 - - 1,194 4,247 50,005 50,005 49,932 - -Southwest Nashville BNA 706 700 708 706 721 296 123 - - 96,702 96,722 98,816 39,578 16,067 - -Southwest Orlando MCO 955 1,095 1,460 1,586 1,821 1,799 1,659 1,585 1,423 1,419 1,464 1,469 5 0.3% 130,855 217,302 249,418 245,156 225,244 216,998 210,082 204,947 215,253 219,994 4,741 2.2%Southwest Philadelphia PHL 1,199 1,773 1,402 1,298 - - 164,224 238,366 192,054 177,001 - -Southwest Phoenix PHX 366 703 730 732 726 361 365 - - 50,142 100,284 99,403 49,398 50,005 - -Southwest Tampa TPA 745 730 1,095 1,085 1,086 813 808 763 753 748 735 713 -22 -3.0% 102,065 148,625 148,821 111,231 109,572 104,140 107,959 107,481 108,451 107,723 -728 -0.7%Southwest West Palm Beach PBI 31 35 31 31 - 0.0% 4,433 5,046 4,433 4,433 - 0.0%Southwest Washington National DCA 122 122 - 19,119 19,119 -Spirit Airlines Detroit DTW 61 120 - - 9,150 18,000 - -Spirit Airlines Fort Lauderdale/Hollywood FLL 131 568 - - 19,586 84,117 - -Spirit Airlines Fort Myers RSW 70 365 - - 10,436 54,750 - -TACV Praia RAI 39 74 35 89.7% 7,739 14,578 6,839 88.4%United Chicago O'Hare ORD 1,477 1,491 1,666 1,555 1,460 644 626 388 334 320 144 236 92 63.9% 239,076 234,843 200,677 82,802 78,487 48,697 46,258 42,658 17,570 31,940 14,370 81.8%US Airways Baltimore BWI 2,462 2,101 - - 263,921 - -US Airways Charlotte CLT 977 1,309 1,513 1,582 1,858 1,643 1,599 1,726 1,608 - - 128,984 223,314 274,039 233,886 226,854 238,503 225,454 - -US Airways Fort Lauderdale/Hollywood FLL 31 17 - - 3,941 2,186 - -US Airways Orlando MCO 52 48 48 43 - - 5,605 6,126 5,831 - -US Airways Philadelphia PHL 1,830 1,794 1,738 2,416 2,182 1,299 1,012 399 313 - - 253,015 345,461 312,890 130,008 101,987 39,529 30,973 - -US Airways Pittsburgh PIT 1,339 1,460 1,165 1,290 31 - - 185,109 174,598 4,446 - -US Airways Washington National DCA 1,333 1,147 1,390 1,107 1,270 365 313 182 124 - - 167,278 149,503 170,009 49,501 44,006 24,350 14,997 - - Subtotal 26,108 27,136 24,093 26,488 26,499 14,974 13,998 11,661 11,677 11,090 11,116 11,649 533 4.8% 3,475,622 3,683,422 3,651,961 1,992,492 1,883,114 1,598,412 1,678,851 1,616,053 1,613,859 1,705,039 91,180 5.6%
Appendix F, Regional Transportation F-12
Boston-Logan International Airport 2016 EDR
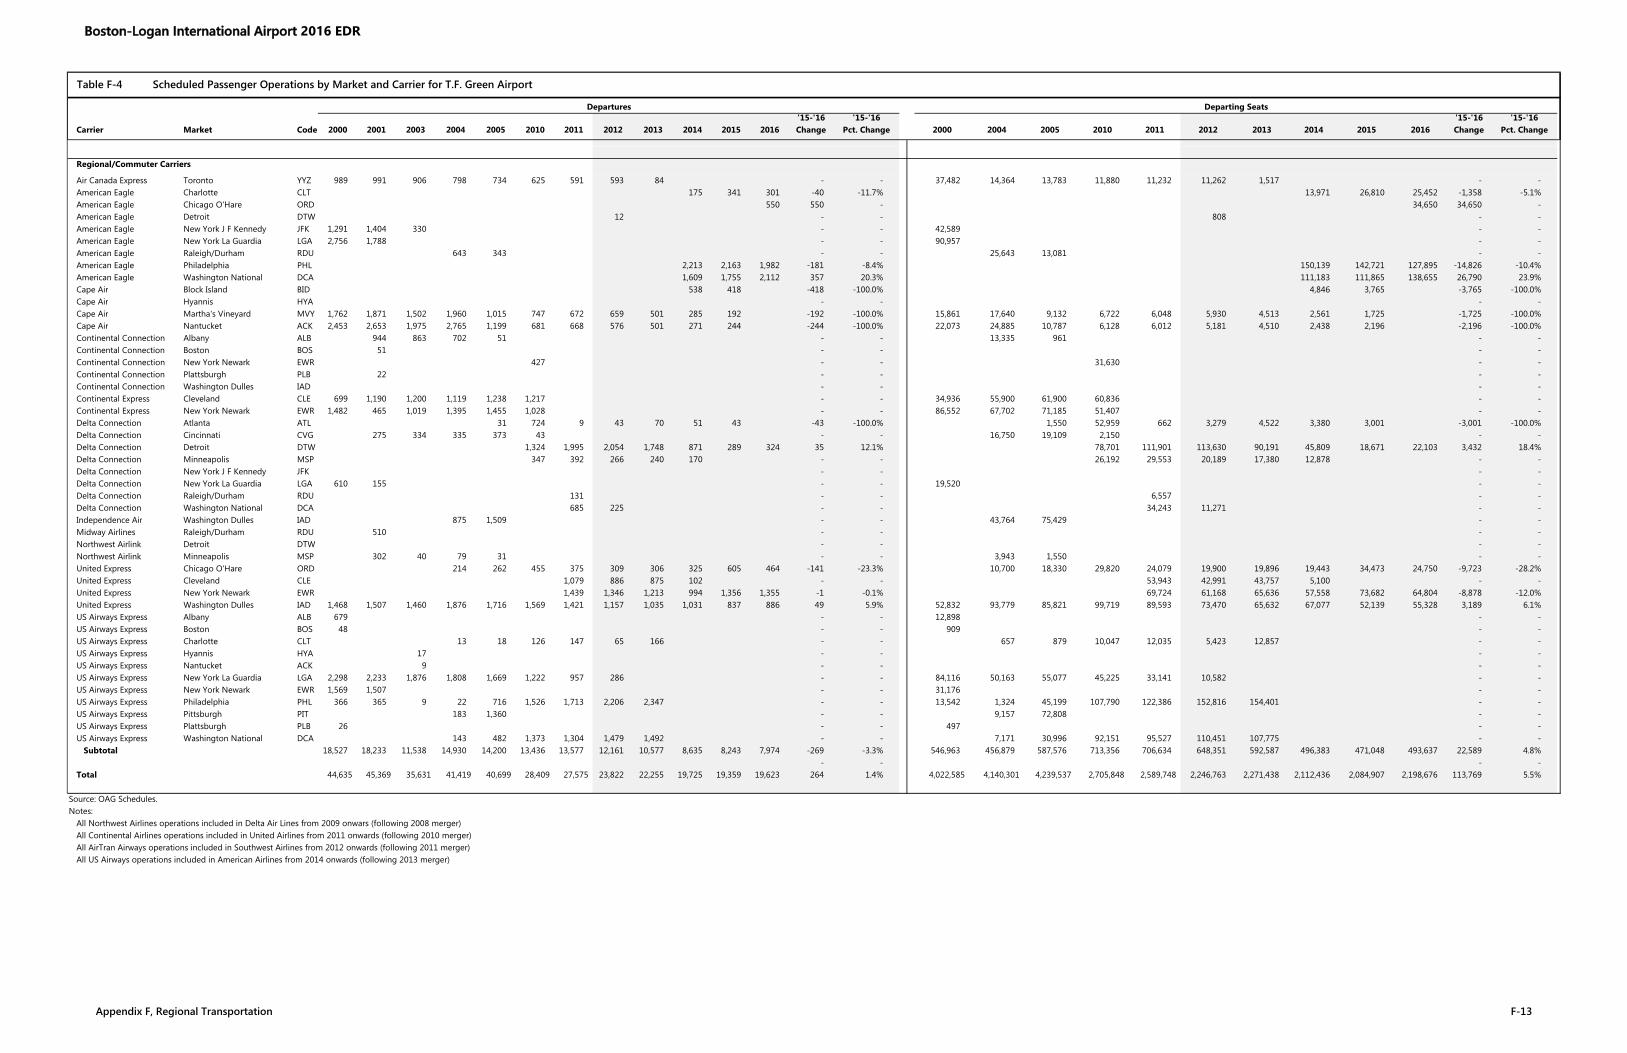
Table F-4 Scheduled Passenger Operations by Market and Carrier for T.F. Green Airport
Departures Departing Seats'15-'16 '15-'16 '15-'16 '15-'16
Carrier Market Code 2000 2001 2003 2004 2005 2010 2011 2012 2013 2014 2015 2016 Change Pct. Change 2000 2004 2005 2010 2011 2012 2013 2014 2015 2016 Change Pct. Change
Regional/Commuter Carriers
Air Canada Express Toronto YYZ 989 991 906 798 734 625 591 593 84 - - 37,482 14,364 13,783 11,880 11,232 11,262 1,517 - -American Eagle Charlotte CLT 175 341 301 -40 -11.7% 13,971 26,810 25,452 -1,358 -5.1%American Eagle Chicago O'Hare ORD 550 550 - 34,650 34,650 -American Eagle Detroit DTW 12 - - 808 - -American Eagle New York J F Kennedy JFK 1,291 1,404 330 - - 42,589 - -American Eagle New York La Guardia LGA 2,756 1,788 - - 90,957 - -American Eagle Raleigh/Durham RDU 643 343 - - 25,643 13,081 - -American Eagle Philadelphia PHL 2,213 2,163 1,982 -181 -8.4% 150,139 142,721 127,895 -14,826 -10.4%American Eagle Washington National DCA 1,609 1,755 2,112 357 20.3% 111,183 111,865 138,655 26,790 23.9%Cape Air Block Island BID 538 418 -418 -100.0% 4,846 3,765 -3,765 -100.0%Cape Air Hyannis HYA - - - -Cape Air Martha's Vineyard MVY 1,762 1,871 1,502 1,960 1,015 747 672 659 501 285 192 -192 -100.0% 15,861 17,640 9,132 6,722 6,048 5,930 4,513 2,561 1,725 -1,725 -100.0%Cape Air Nantucket ACK 2,453 2,653 1,975 2,765 1,199 681 668 576 501 271 244 -244 -100.0% 22,073 24,885 10,787 6,128 6,012 5,181 4,510 2,438 2,196 -2,196 -100.0%Continental Connection Albany ALB 944 863 702 51 - - 13,335 961 - -Continental Connection Boston BOS 51 - - - -Continental Connection New York Newark EWR 427 - - 31,630 - -Continental Connection Plattsburgh PLB 22 - - - -Continental Connection Washington Dulles IAD - - - -Continental Express Cleveland CLE 699 1,190 1,200 1,119 1,238 1,217 - - 34,936 55,900 61,900 60,836 - -Continental Express New York Newark EWR 1,482 465 1,019 1,395 1,455 1,028 - - 86,552 67,702 71,185 51,407 - -Delta Connection Atlanta ATL 31 724 9 43 70 51 43 -43 -100.0% 1,550 52,959 662 3,279 4,522 3,380 3,001 -3,001 -100.0%Delta Connection Cincinnati CVG 275 334 335 373 43 - - 16,750 19,109 2,150 - -Delta Connection Detroit DTW 1,324 1,995 2,054 1,748 871 289 324 35 12.1% 78,701 111,901 113,630 90,191 45,809 18,671 22,103 3,432 18.4%Delta Connection Minneapolis MSP 347 392 266 240 170 - - 26,192 29,553 20,189 17,380 12,878 - -Delta Connection New York J F Kennedy JFK - - - -Delta Connection New York La Guardia LGA 610 155 - - 19,520 - -Delta Connection Raleigh/Durham RDU 131 - - 6,557 - -Delta Connection Washington National DCA 685 225 - - 34,243 11,271 - -Independence Air Washington Dulles IAD 875 1,509 - - 43,764 75,429 - -Midway Airlines Raleigh/Durham RDU 510 - - - -Northwest Airlink Detroit DTW - - - -Northwest Airlink Minneapolis MSP 302 40 79 31 - - 3,943 1,550 - -United Express Chicago O'Hare ORD 214 262 455 375 309 306 325 605 464 -141 -23.3% 10,700 18,330 29,820 24,079 19,900 19,896 19,443 34,473 24,750 -9,723 -28.2%United Express Cleveland CLE 1,079 886 875 102 - - 53,943 42,991 43,757 5,100 - -United Express New York Newark EWR 1,439 1,346 1,213 994 1,356 1,355 -1 -0.1% 69,724 61,168 65,636 57,558 73,682 64,804 -8,878 -12.0%United Express Washington Dulles IAD 1,468 1,507 1,460 1,876 1,716 1,569 1,421 1,157 1,035 1,031 837 886 49 5.9% 52,832 93,779 85,821 99,719 89,593 73,470 65,632 67,077 52,139 55,328 3,189 6.1%US Airways Express Albany ALB 679 - - 12,898 - -US Airways Express Boston BOS 48 - - 909 - -US Airways Express Charlotte CLT 13 18 126 147 65 166 - - 657 879 10,047 12,035 5,423 12,857 - -US Airways Express Hyannis HYA 17 - - - -US Airways Express Nantucket ACK 9 - - - -US Airways Express New York La Guardia LGA 2,298 2,233 1,876 1,808 1,669 1,222 957 286 - - 84,116 50,163 55,077 45,225 33,141 10,582 - -US Airways Express New York Newark EWR 1,569 1,507 - - 31,176 - -US Airways Express Philadelphia PHL 366 365 9 22 716 1,526 1,713 2,206 2,347 - - 13,542 1,324 45,199 107,790 122,386 152,816 154,401 - -US Airways Express Pittsburgh PIT 183 1,360 - - 9,157 72,808 - -US Airways Express Plattsburgh PLB 26 - - 497 - -US Airways Express Washington National DCA 143 482 1,373 1,304 1,479 1,492 - - 7,171 30,996 92,151 95,527 110,451 107,775 - - Subtotal 18,527 18,233 11,538 14,930 14,200 13,436 13,577 12,161 10,577 8,635 8,243 7,974 -269 -3.3% 546,963 456,879 587,576 713,356 706,634 648,351 592,587 496,383 471,048 493,637 22,589 4.8%
- - - -Total 44,635 45,369 35,631 41,419 40,699 28,409 27,575 23,822 22,255 19,725 19,359 19,623 264 1.4% 4,022,585 4,140,301 4,239,537 2,705,848 2,589,748 2,246,763 2,271,438 2,112,436 2,084,907 2,198,676 113,769 5.5%
Source: OAG Schedules.Notes:
All Northwest Airlines operations included in Delta Air Lines from 2009 onwars (following 2008 merger)All Continental Airlines operations included in United Airlines from 2011 onwards (following 2010 merger)All AirTran Airways operations included in Southwest Airlines from 2012 onwards (following 2011 merger)All US Airways operations included in American Airlines from 2014 onwards (following 2013 merger)
Appendix F, Regional Transportation F-13
Boston-Logan International Airport 2016 EDR

Table F-5 Scheduled Passenger Operations by Market and Carrier for Manchester-Boston Regional Airport
Departures Departing Seats'15-'16 '15-'16 '15-'16 '15-'16
Carrier Market Code 2000 2004 2005 2009 2010 2011 2012 2013 2014 2015 2016 Change Pct. Change 2000 2004 2005 2009 2010 2011 2012 2013 2014 2015 2016 Change Pct. Change
Jet Carriers
Boston-Maine Airways Myrtle Beach MYR 83 - - 12,429 - -Boston-Maine Airways Portsmouth PSM 183 - - 27,471 - -Boston-Maine Airways Sanford SFB 87 - - 13,114 - -Continental Cleveland CLE 130 9 - - 16,151 1,038 - -Continental New York Newark EWR 462 314 286 - - 62,358 36,123 30,953 - -Delta Atlanta ATL 244 732 668 275 565 514 463 459 365 365 - 0.0% 34,648 103,944 94,856 39,050 81,600 76,629 69,307 68,468 53,545 54,212 667 1.2%Delta Cincinnati CVG 710 664 - - 100,840 86,583 - -Delta Detroit DTW 778 796 122 87 -35 -28.8% 93,450 89,289 14,414 9,881 -4,533 -31.4%Delta New York - LGA LGA 4 -4 -100.0% 596 -596 -100.0%Northwest Detroit DTW 1,609 1,460 1,399 - - 194,058 202,623 180,879 - -Northwest Minneapolis MSP 362 365 - - 44,835 46,933 - -Southwest Baltimore BWI 2,828 3,874 3,850 3,312 2,891 2,761 2,775 2,726 2,494 2,476 2,576 100 4.1% 387,397 530,588 527,405 450,616 393,093 376,945 385,044 387,879 364,979 363,524 383,914 20,390 5.6%Southwest Chicago Midway MDW 706 693 1,355 1,253 1,144 1,244 1,168 1,010 984 948 996 48 5.0% 96,702 94,744 185,481 169,754 155,466 169,440 161,822 158,820 157,501 148,825 153,459 4,634 3.1%Southwest Denver DEN 92 366 304 - - 12,604 50,379 43,211 - -Southwest Fort Lauderdale/Hollywood FLL 9 120 9 9 152 90 4 -4 -100.0% 1,194 16,440 1,194 1,194 21,190 12,793 633 -633 -100.0%Southwest Kansas City MCI 366 305 - - 50,142 41,785 - -Southwest Las Vegas LAS 375 365 365 365 365 122 61 9 9 -9 -100.0% 51,336 50,005 50,005 50,005 50,005 16,766 8,723 1,246 1,246 -1,246 -100.0%Southwest Nashville BNA 397 715 730 - - 54,389 97,896 99,879 - -Southwest Orlando MCO 410 1,129 1,468 1,201 1,125 977 906 831 752 743 765 22 3.0% 56,111 154,673 201,175 164,332 154,145 133,829 125,620 123,873 109,202 113,888 118,422 4,534 4.0%Southwest Philadelphia PHL 788 1,786 1,894 1,411 1,325 - - 107,995 244,356 259,275 192,456 180,871 - -Southwest Phoenix PHX 365 322 273 - - 50,005 44,114 37,401 - -Southwest Tampa TPA 845 1,099 673 782 629 579 466 470 479 487 8 1.7% 115,693 150,165 92,240 107,173 86,212 79,639 68,120 67,509 70,529 71,922 1,393 2.0%United Chicago O'Hare ORD 1,403 1,464 1,339 608 - - 221,523 209,179 179,151 85,929 - -United Portland (ME) PWM 57 - - 7,241 - -US Airways Baltimore BWI 1,782 - - 191,078 - -US Airways Charlotte CLT 1,276 1,308 378 365 51 - - 167,699 178,836 53,676 52,560 7,406 - -US Airways Orlando MCO 52 - - 5,605 - -US Airways Philadelphia PHL 1,821 1,806 2,021 395 365 313 187 351 - - 222,331 244,129 274,215 56,219 33,132 30,973 18,499 34,791 - -US Airways Pittsburgh PIT 1,085 553 - - 139,837 77,259 - -US Airways Washington National DCA 675 113 575 - - 82,085 14,323 77,461 - - Subtotal 14,026 17,876 19,279 11,352 9,850 8,604 6,769 6,302 5,168 5,150 5,276 126 2.4% 1,821,657 2,449,873 2,608,335 1,542,979 1,311,677 1,168,481 935,588 907,518 768,905 767,200 791,810 24,610 3.2%
Regional/Commuter Carriers
Air Canada Express Montreal Dorval YUL - - - -Air Canada Express Toronto YYZ 339 1,024 930 908 707 403 - - 5,616 18,758 17,439 17,252 13,441 7,652 - -American Eagle Charlotte CLT 496 730 734 4 0.5% 37,761 54,688 60,890 6,202 11.3%American Eagle New York La Guardia LGA 1,833 - - 60,480 - -American Eagle Philadelphia PHL 2,295 2,237 2,090 -147 -6.6% 149,598 152,206 136,795 -15,411 -10.1%American Eagle Washington National DCA 1,198 1,152 1,304 152 13.2% 77,065 74,008 85,620 11,612 15.7%Boston-Maine Airways Bangor BGR 4 - - 80 - -Boston-Maine Airways Martha's Vineyard MVY - - - -Boston-Maine Airways Nantucket ACK - - - -Boston-Maine Airways New London/Groton GON 22 - - 399 - -Boston-Maine Airways Portsmouth PSM 4 - - 80 - -Boston-Maine Airways Saint John YSJ - - - -Continental Connection Albany ALB 80 1,007 313 - - 1,515 19,130 5,944 - -Continental Connection New York J F Kennedy JFK - - - -Continental Connection New York Newark EWR 337 141 - - 24,906 9,483 - -Continental Connection Plattsburgh PLB - - - -Continental Connection Rochester ROC 44 - - 841 - -Continental Connection Syracuse SYR 22 - - 421 - -Continental Connection Westchester County HPN - - - -Continental Express Cleveland CLE 593 1,198 1,186 1,178 1,178 - - 29,614 59,729 58,991 58,893 58,921 - -Continental Express New York Newark EWR 1,028 1,150 1,165 1,072 1,267 - - 64,944 57,169 58,140 53,579 63,336 - -Delta Connection Atlanta ATL 488 366 485 365 90 51 59 - - 24,400 18,300 26,620 25,550 6,300 3,843 4,484 - -Delta Connection Bangor BGR 244 - - 12,200 - -Delta Connection Cincinnati CVG 1,673 750 735 - - 83,657 39,299 38,426 - -Delta Connection Detroit DTW 359 499 1,858 1,609 1,510 1,296 912 935 23 2.5% 25,524 32,795 95,802 80,786 75,507 69,261 51,960 60,782 8,822 17.0%Delta Connection New York J F Kennedy JFK - - - -Delta Connection New York La Guardia LGA 727 1,067 486 586 1,165 1,140 970 804 -166 -17.1% 36,357 53,350 24,300 31,216 66,132 63,202 55,968 49,250 -6,718 -12.0%Delta Connection Minneapolis MSP 92 - - 6,992 - -Independence Air Washington Dulles IAD 1,439 1,568 - - 71,971 78,379 - -Northwest Airlink Detroit DTW 13 - - 664 - -Northwest Airlink Minneapolis MSP 324 233 - - 16,179 11,664 - -United Express Chicago O'Hare ORD 213 31 388 1,040 983 867 695 857 779 718 -61 -7.8% 10,650 2,170 25,402 67,675 62,096 45,929 39,114 49,854 42,976 39,887 -3,089 -7.2%United Express Cleveland CLE 935 759 740 111 - - 46,736 36,046 36,986 5,564 - -United Express New York Newark EWR 1,391 1,298 1,120 965 1,304 1,284 -20 -1.5% 67,250 60,049 54,604 44,824 60,052 59,682 -370 -0.6%United Express Washington Dulles IAD 1,678 1,760 1,161 1,104 658 427 90 - - 83,900 90,419 62,534 55,951 33,514 20,788 5,444 - -US Airways Express Boston BOS - - - -US Airways Express Charlotte CLT 307 227 153 318 366 417 - - 21,863 19,547 13,146 27,181 31,476 32,885 - -
Appendix F, Regional Transportation F-14
Boston-Logan International Airport 2016 EDR
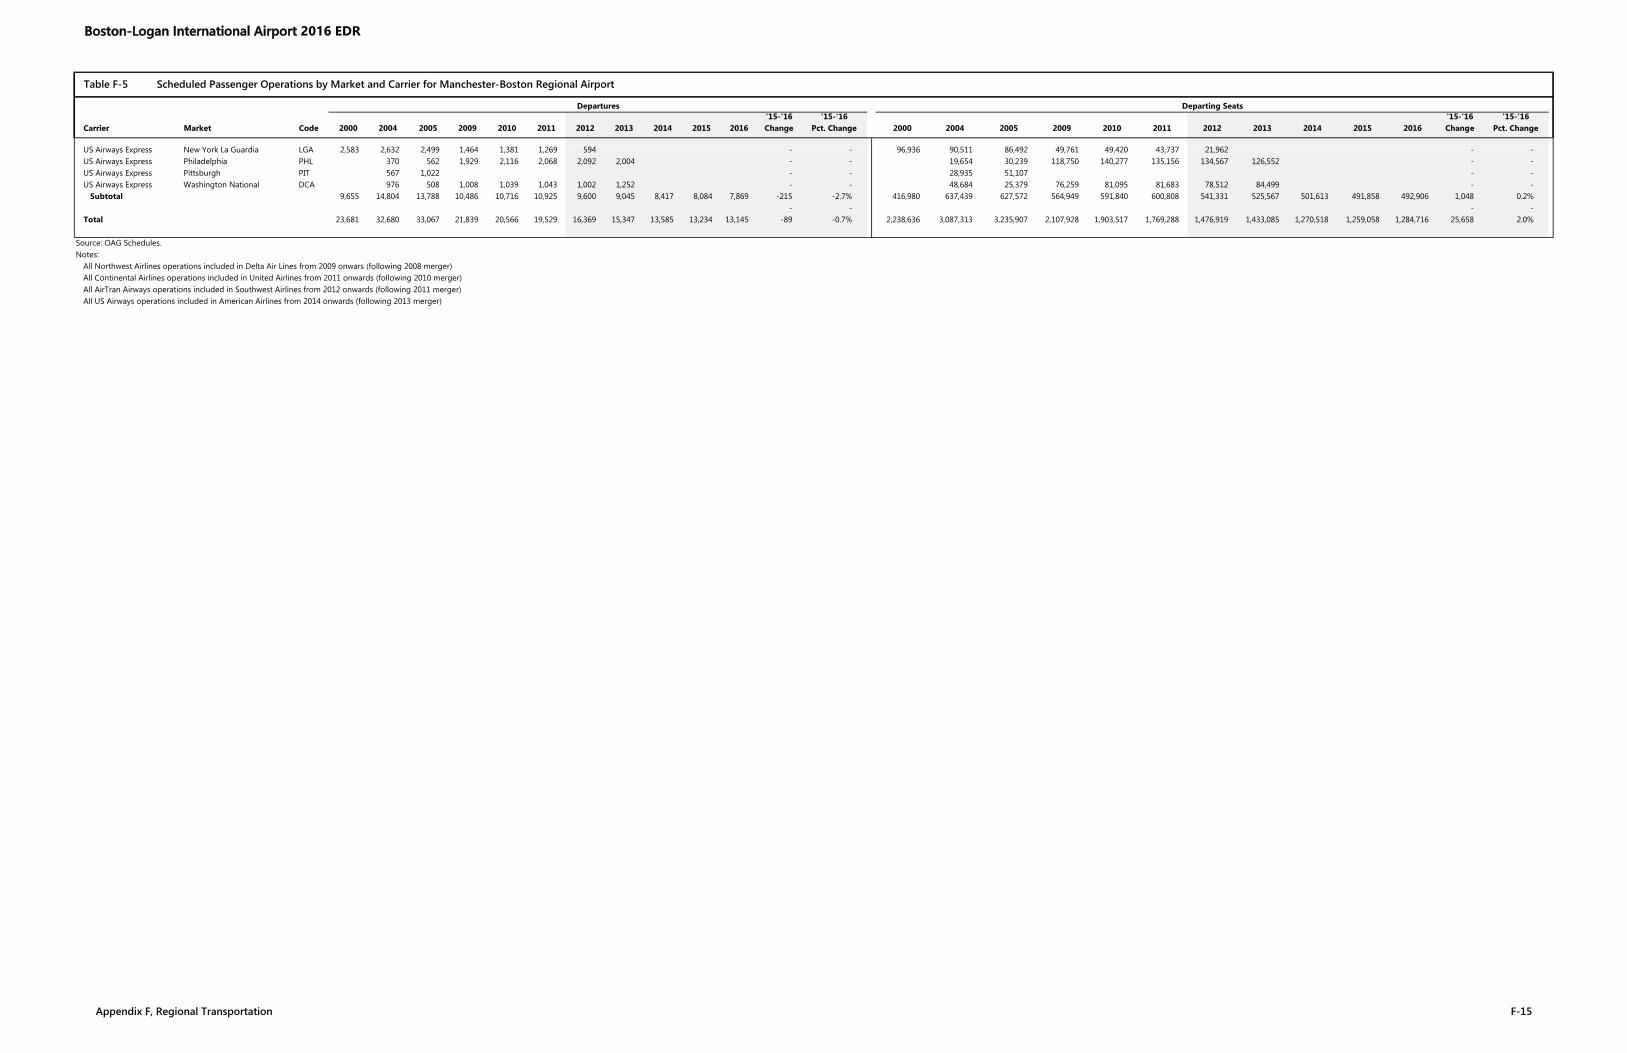
Table F-5 Scheduled Passenger Operations by Market and Carrier for Manchester-Boston Regional Airport
Departures Departing Seats'15-'16 '15-'16 '15-'16 '15-'16
Carrier Market Code 2000 2004 2005 2009 2010 2011 2012 2013 2014 2015 2016 Change Pct. Change 2000 2004 2005 2009 2010 2011 2012 2013 2014 2015 2016 Change Pct. Change
US Airways Express New York La Guardia LGA 2,583 2,632 2,499 1,464 1,381 1,269 594 - - 96,936 90,511 86,492 49,761 49,420 43,737 21,962 - -US Airways Express Philadelphia PHL 370 562 1,929 2,116 2,068 2,092 2,004 - - 19,654 30,239 118,750 140,277 135,156 134,567 126,552 - -US Airways Express Pittsburgh PIT 567 1,022 - - 28,935 51,107 - -US Airways Express Washington National DCA 976 508 1,008 1,039 1,043 1,002 1,252 - - 48,684 25,379 76,259 81,095 81,683 78,512 84,499 - - Subtotal 9,655 14,804 13,788 10,486 10,716 10,925 9,600 9,045 8,417 8,084 7,869 -215 -2.7% 416,980 637,439 627,572 564,949 591,840 600,808 541,331 525,567 501,613 491,858 492,906 1,048 0.2%
- - - -Total 23,681 32,680 33,067 21,839 20,566 19,529 16,369 15,347 13,585 13,234 13,145 -89 -0.7% 2,238,636 3,087,313 3,235,907 2,107,928 1,903,517 1,769,288 1,476,919 1,433,085 1,270,518 1,259,058 1,284,716 25,658 2.0%
Source: OAG Schedules.Notes:
All Northwest Airlines operations included in Delta Air Lines from 2009 onwars (following 2008 merger)All Continental Airlines operations included in United Airlines from 2011 onwards (following 2010 merger)All AirTran Airways operations included in Southwest Airlines from 2012 onwards (following 2011 merger)All US Airways operations included in American Airlines from 2014 onwards (following 2013 merger)
Appendix F, Regional Transportation F-15
Boston-Logan International Airport 2016 EDR
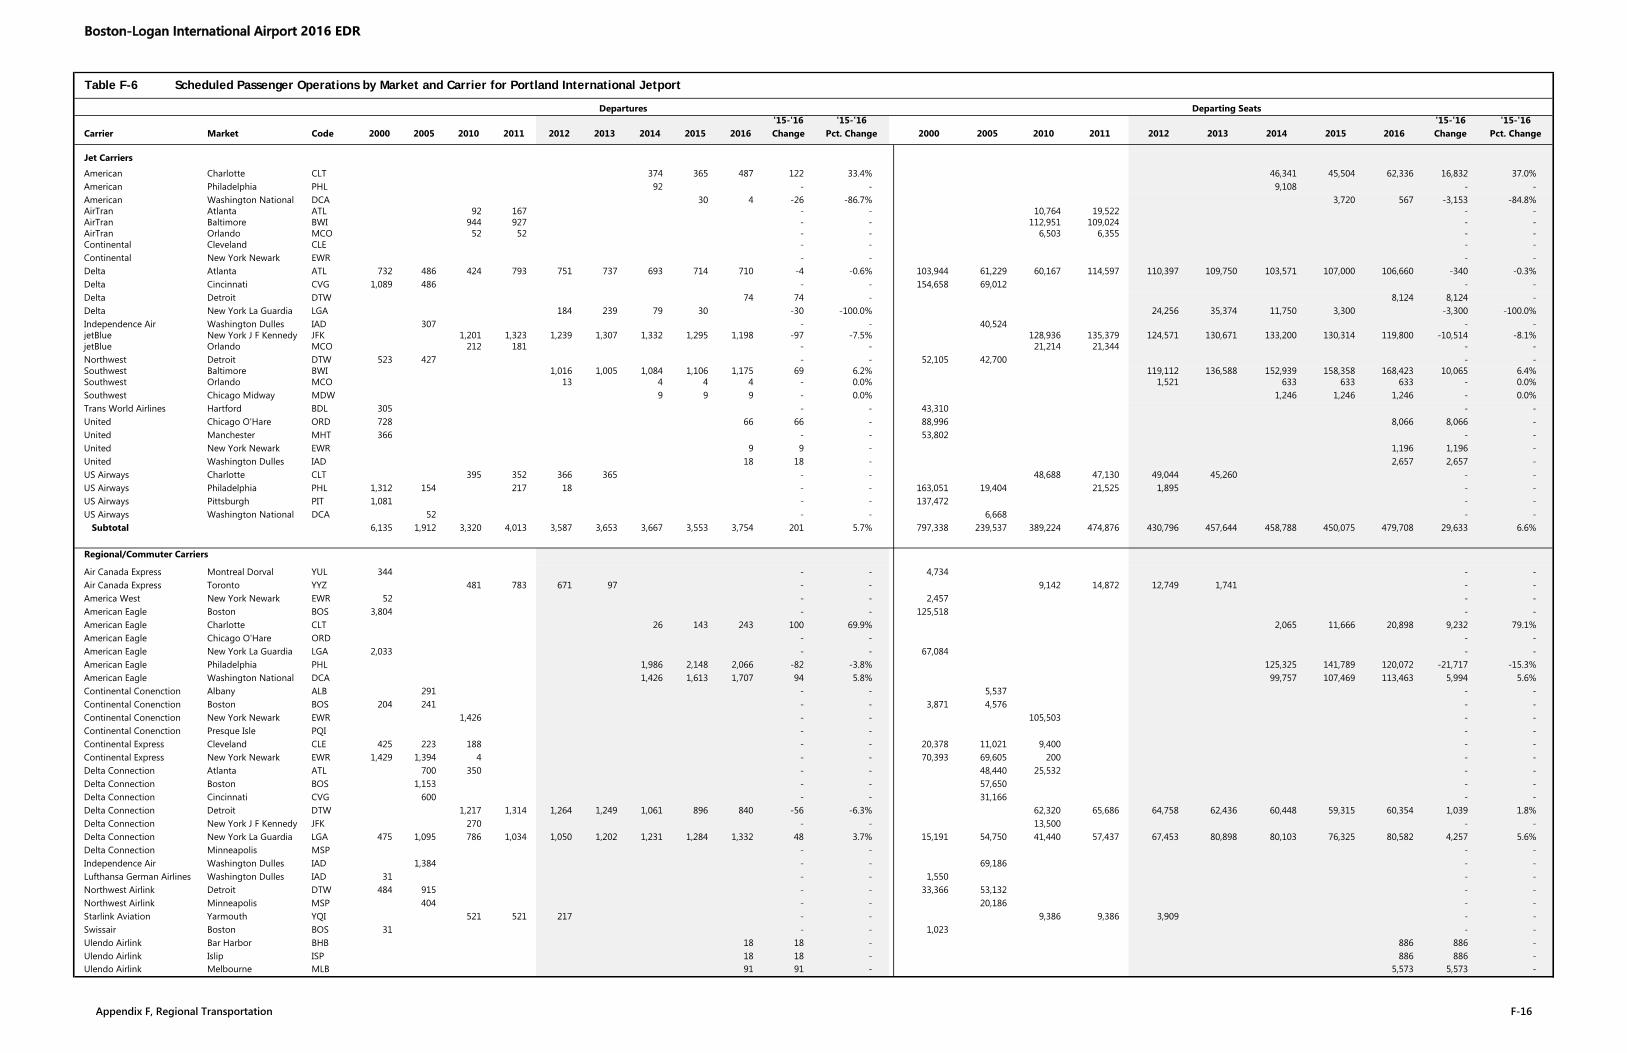
Table F-6 Scheduled Passenger Operations by Market and Carrier for Portland International Jetport
Departures Departing Seats'15-'16 '15-'16 '15-'16 '15-'16
Carrier Market Code 2000 2005 2010 2011 2012 2013 2014 2015 2016 Change Pct. Change 2000 2005 2010 2011 2012 2013 2014 2015 2016 Change Pct. Change
Jet Carriers
American Charlotte CLT 374 365 487 122 33.4% 46,341 45,504 62,336 16,832 37.0%American Philadelphia PHL 92 - - 9,108 - -American Washington National DCA 30 4 -26 -86.7% 3,720 567 -3,153 -84.8%AirTran Atlanta ATL 92 167 - - 10,764 19,522 - -AirTran Baltimore BWI 944 927 - - 112,951 109,024 - -AirTran Orlando MCO 52 52 - - 6,503 6,355 - -Continental Cleveland CLE - - - -Continental New York Newark EWR - - - -Delta Atlanta ATL 732 486 424 793 751 737 693 714 710 -4 -0.6% 103,944 61,229 60,167 114,597 110,397 109,750 103,571 107,000 106,660 -340 -0.3%Delta Cincinnati CVG 1,089 486 - - 154,658 69,012 - -Delta Detroit DTW 74 74 - 8,124 8,124 -Delta New York La Guardia LGA 184 239 79 30 -30 -100.0% 24,256 35,374 11,750 3,300 -3,300 -100.0%Independence Air Washington Dulles IAD 307 - - 40,524 - -jetBlue New York J F Kennedy JFK 1,201 1,323 1,239 1,307 1,332 1,295 1,198 -97 -7.5% 128,936 135,379 124,571 130,671 133,200 130,314 119,800 -10,514 -8.1%jetBlue Orlando MCO 212 181 - - 21,214 21,344 - -Northwest Detroit DTW 523 427 - - 52,105 42,700 - -Southwest Baltimore BWI 1,016 1,005 1,084 1,106 1,175 69 6.2% 119,112 136,588 152,939 158,358 168,423 10,065 6.4%Southwest Orlando MCO 13 4 4 4 - 0.0% 1,521 633 633 633 - 0.0%Southwest Chicago Midway MDW 9 9 9 - 0.0% 1,246 1,246 1,246 - 0.0%Trans World Airlines Hartford BDL 305 - - 43,310 - -United Chicago O'Hare ORD 728 66 66 - 88,996 8,066 8,066 -United Manchester MHT 366 - - 53,802 - -United New York Newark EWR 9 9 - 1,196 1,196 -United Washington Dulles IAD 18 18 - 2,657 2,657 -US Airways Charlotte CLT 395 352 366 365 - - 48,688 47,130 49,044 45,260 - -US Airways Philadelphia PHL 1,312 154 217 18 - - 163,051 19,404 21,525 1,895 - -US Airways Pittsburgh PIT 1,081 - - 137,472 - -US Airways Washington National DCA 52 - - 6,668 - - Subtotal 6,135 1,912 3,320 4,013 3,587 3,653 3,667 3,553 3,754 201 5.7% 797,338 239,537 389,224 474,876 430,796 457,644 458,788 450,075 479,708 29,633 6.6%
Regional/Commuter Carriers
Air Canada Express Montreal Dorval YUL 344 - - 4,734 - -Air Canada Express Toronto YYZ 481 783 671 97 - - 9,142 14,872 12,749 1,741 - -America West New York Newark EWR 52 - - 2,457 - -American Eagle Boston BOS 3,804 - - 125,518 - -American Eagle Charlotte CLT 26 143 243 100 69.9% 2,065 11,666 20,898 9,232 79.1%American Eagle Chicago O'Hare ORD - - - -American Eagle New York La Guardia LGA 2,033 - - 67,084 - -American Eagle Philadelphia PHL 1,986 2,148 2,066 -82 -3.8% 125,325 141,789 120,072 -21,717 -15.3%American Eagle Washington National DCA 1,426 1,613 1,707 94 5.8% 99,757 107,469 113,463 5,994 5.6%Continental Conenction Albany ALB 291 - - 5,537 - -Continental Conenction Boston BOS 204 241 - - 3,871 4,576 - -Continental Conenction New York Newark EWR 1,426 - - 105,503 - -Continental Conenction Presque Isle PQI - - - -Continental Express Cleveland CLE 425 223 188 - - 20,378 11,021 9,400 - -Continental Express New York Newark EWR 1,429 1,394 4 - - 70,393 69,605 200 - -Delta Connection Atlanta ATL 700 350 - - 48,440 25,532 - -Delta Connection Boston BOS 1,153 - - 57,650 - -Delta Connection Cincinnati CVG 600 - - 31,166 - -Delta Connection Detroit DTW 1,217 1,314 1,264 1,249 1,061 896 840 -56 -6.3% 62,320 65,686 64,758 62,436 60,448 59,315 60,354 1,039 1.8%Delta Connection New York J F Kennedy JFK 270 - - 13,500 - -Delta Connection New York La Guardia LGA 475 1,095 786 1,034 1,050 1,202 1,231 1,284 1,332 48 3.7% 15,191 54,750 41,440 57,437 67,453 80,898 80,103 76,325 80,582 4,257 5.6%Delta Connection Minneapolis MSP - - - -Independence Air Washington Dulles IAD 1,384 - - 69,186 - -Lufthansa German Airlines Washington Dulles IAD 31 - - 1,550 - -Northwest Airlink Detroit DTW 484 915 - - 33,366 53,132 - -Northwest Airlink Minneapolis MSP 404 - - 20,186 - -Starlink Aviation Yarmouth YQI 521 521 217 - - 9,386 9,386 3,909 - -Swissair Boston BOS 31 - - 1,023 - -Ulendo Airlink Bar Harbor BHB 18 18 - 886 886 -Ulendo Airlink Islip ISP 18 18 - 886 886 -Ulendo Airlink Melbourne MLB 91 91 - 5,573 5,573 -
Appendix F, Regional Transportation F-16
Boston-Logan International Airport 2016 EDR
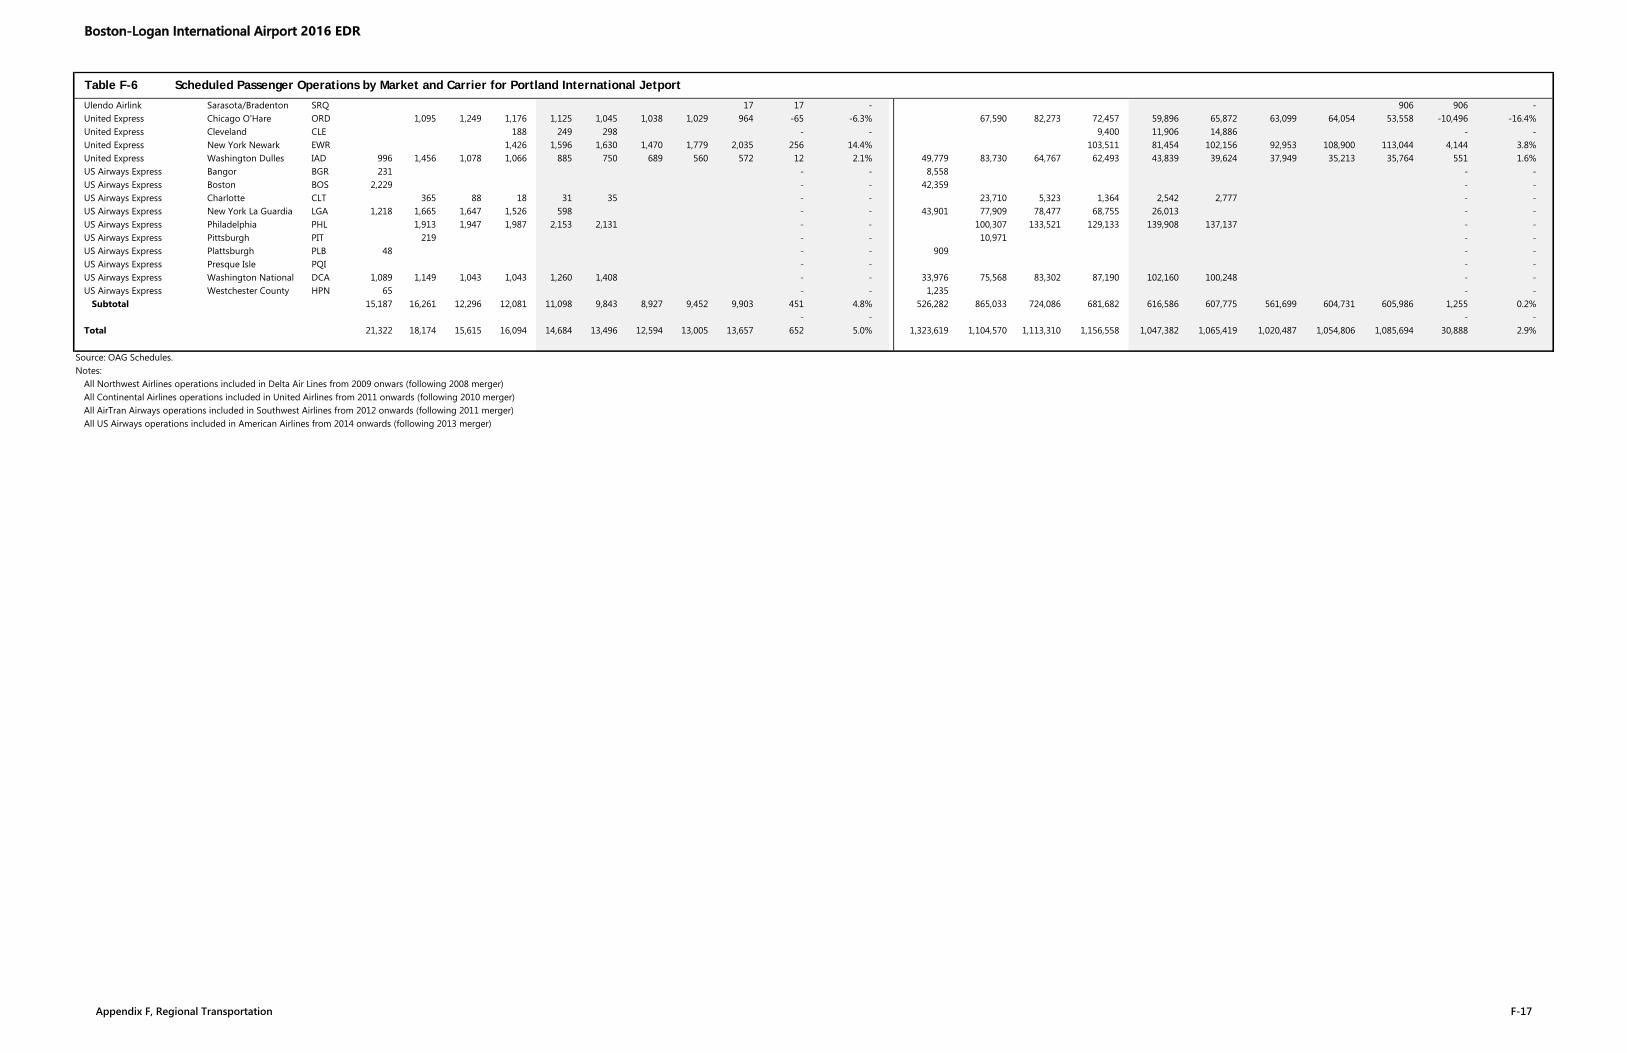
Table F-6 Scheduled Passenger Operations by Market and Carrier for Portland International Jetport
Ulendo Airlink Sarasota/Bradenton SRQ 17 17 - 906 906 -United Express Chicago O'Hare ORD 1,095 1,249 1,176 1,125 1,045 1,038 1,029 964 -65 -6.3% 67,590 82,273 72,457 59,896 65,872 63,099 64,054 53,558 -10,496 -16.4%United Express Cleveland CLE 188 249 298 - - 9,400 11,906 14,886 - -United Express New York Newark EWR 1,426 1,596 1,630 1,470 1,779 2,035 256 14.4% 103,511 81,454 102,156 92,953 108,900 113,044 4,144 3.8%United Express Washington Dulles IAD 996 1,456 1,078 1,066 885 750 689 560 572 12 2.1% 49,779 83,730 64,767 62,493 43,839 39,624 37,949 35,213 35,764 551 1.6%US Airways Express Bangor BGR 231 - - 8,558 - -US Airways Express Boston BOS 2,229 - - 42,359 - -US Airways Express Charlotte CLT 365 88 18 31 35 - - 23,710 5,323 1,364 2,542 2,777 - -US Airways Express New York La Guardia LGA 1,218 1,665 1,647 1,526 598 - - 43,901 77,909 78,477 68,755 26,013 - -US Airways Express Philadelphia PHL 1,913 1,947 1,987 2,153 2,131 - - 100,307 133,521 129,133 139,908 137,137 - -US Airways Express Pittsburgh PIT 219 - - 10,971 - -US Airways Express Plattsburgh PLB 48 - - 909 - -US Airways Express Presque Isle PQI - - - -US Airways Express Washington National DCA 1,089 1,149 1,043 1,043 1,260 1,408 - - 33,976 75,568 83,302 87,190 102,160 100,248 - -US Airways Express Westchester County HPN 65 - - 1,235 - - Subtotal 15,187 16,261 12,296 12,081 11,098 9,843 8,927 9,452 9,903 451 4.8% 526,282 865,033 724,086 681,682 616,586 607,775 561,699 604,731 605,986 1,255 0.2%
- - - -Total 21,322 18,174 15,615 16,094 14,684 13,496 12,594 13,005 13,657 652 5.0% 1,323,619 1,104,570 1,113,310 1,156,558 1,047,382 1,065,419 1,020,487 1,054,806 1,085,694 30,888 2.9%
Source: OAG Schedules.Notes:
All Northwest Airlines operations included in Delta Air Lines from 2009 onwars (following 2008 merger)All Continental Airlines operations included in United Airlines from 2011 onwards (following 2010 merger)All AirTran Airways operations included in Southwest Airlines from 2012 onwards (following 2011 merger)All US Airways operations included in American Airlines from 2014 onwards (following 2013 merger)
Appendix F, Regional Transportation F-17
Boston-Logan International Airport 2016 EDR
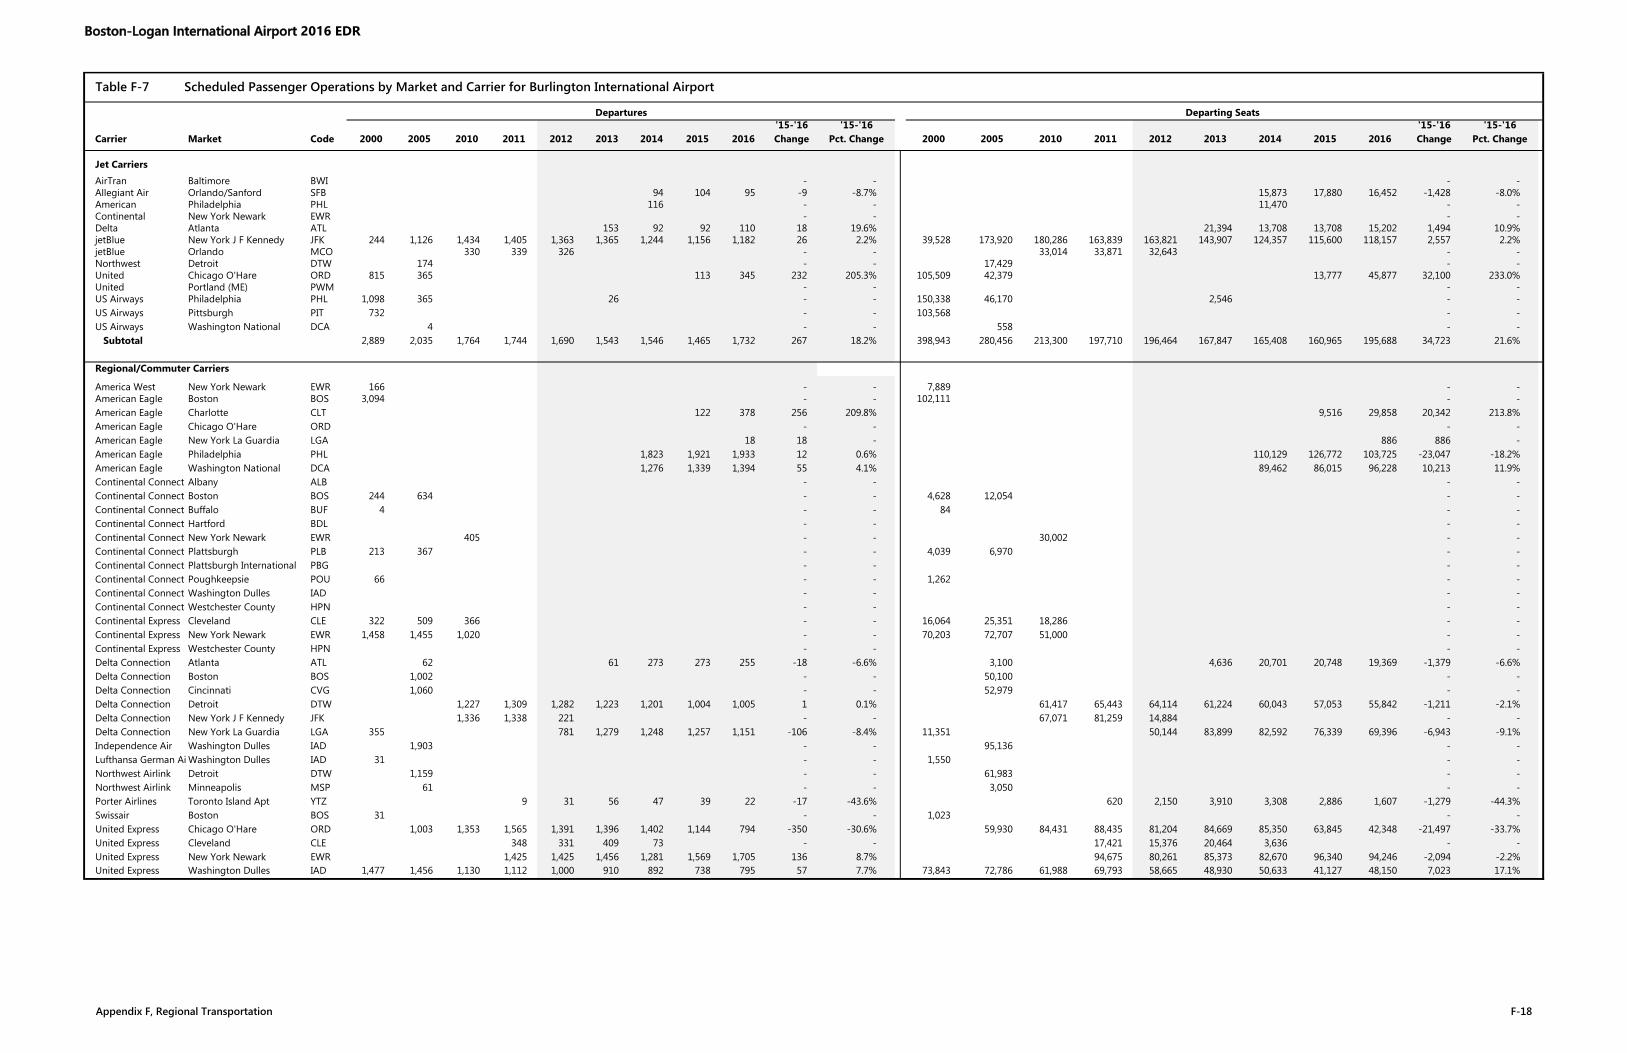
Table F-7 Scheduled Passenger Operations by Market and Carrier for Burlington International Airport
Departures Departing Seats'15-'16 '15-'16 '15-'16 '15-'16
Carrier Market Code 2000 2005 2010 2011 2012 2013 2014 2015 2016 Change Pct. Change 2000 2005 2010 2011 2012 2013 2014 2015 2016 Change Pct. Change
Jet Carriers
AirTran Baltimore BWI - - - -Allegiant Air Orlando/Sanford SFB 94 104 95 -9 -8.7% 15,873 17,880 16,452 -1,428 -8.0%American Philadelphia PHL 116 - - 11,470 - -Continental New York Newark EWR - - - -Delta Atlanta ATL 153 92 92 110 18 19.6% 21,394 13,708 13,708 15,202 1,494 10.9%jetBlue New York J F Kennedy JFK 244 1,126 1,434 1,405 1,363 1,365 1,244 1,156 1,182 26 2.2% 39,528 173,920 180,286 163,839 163,821 143,907 124,357 115,600 118,157 2,557 2.2%jetBlue Orlando MCO 330 339 326 - - 33,014 33,871 32,643 - -Northwest Detroit DTW 174 - - 17,429 - -United Chicago O'Hare ORD 815 365 113 345 232 205.3% 105,509 42,379 13,777 45,877 32,100 233.0%United Portland (ME) PWM - - - -US Airways Philadelphia PHL 1,098 365 26 - - 150,338 46,170 2,546 - -US Airways Pittsburgh PIT 732 - - 103,568 - -US Airways Washington National DCA 4 - - 558 - - Subtotal 2,889 2,035 1,764 1,744 1,690 1,543 1,546 1,465 1,732 267 18.2% 398,943 280,456 213,300 197,710 196,464 167,847 165,408 160,965 195,688 34,723 21.6%
Regional/Commuter Carriers
America West New York Newark EWR 166 - - 7,889 - -American Eagle Boston BOS 3,094 - - 102,111 - -American Eagle Charlotte CLT 122 378 256 209.8% 9,516 29,858 20,342 213.8%American Eagle Chicago O'Hare ORD - - - -American Eagle New York La Guardia LGA 18 18 - 886 886 -American Eagle Philadelphia PHL 1,823 1,921 1,933 12 0.6% 110,129 126,772 103,725 -23,047 -18.2%American Eagle Washington National DCA 1,276 1,339 1,394 55 4.1% 89,462 86,015 96,228 10,213 11.9%Continental Connecti Albany ALB - - - -Continental Connecti Boston BOS 244 634 - - 4,628 12,054 - -Continental Connecti Buffalo BUF 4 - - 84 - -Continental Connecti Hartford BDL - - - -Continental Connecti New York Newark EWR 405 - - 30,002 - -Continental Connecti Plattsburgh PLB 213 367 - - 4,039 6,970 - -Continental Connecti Plattsburgh International PBG - - - -Continental Connecti Poughkeepsie POU 66 - - 1,262 - -Continental Connecti Washington Dulles IAD - - - -Continental Connecti Westchester County HPN - - - -Continental Express Cleveland CLE 322 509 366 - - 16,064 25,351 18,286 - -Continental Express New York Newark EWR 1,458 1,455 1,020 - - 70,203 72,707 51,000 - -Continental Express Westchester County HPN - - - -Delta Connection Atlanta ATL 62 61 273 273 255 -18 -6.6% 3,100 4,636 20,701 20,748 19,369 -1,379 -6.6%Delta Connection Boston BOS 1,002 - - 50,100 - -Delta Connection Cincinnati CVG 1,060 - - 52,979 - -Delta Connection Detroit DTW 1,227 1,309 1,282 1,223 1,201 1,004 1,005 1 0.1% 61,417 65,443 64,114 61,224 60,043 57,053 55,842 -1,211 -2.1%Delta Connection New York J F Kennedy JFK 1,336 1,338 221 - - 67,071 81,259 14,884 - -Delta Connection New York La Guardia LGA 355 781 1,279 1,248 1,257 1,151 -106 -8.4% 11,351 50,144 83,899 82,592 76,339 69,396 -6,943 -9.1%Independence Air Washington Dulles IAD 1,903 - - 95,136 - -Lufthansa German Ai Washington Dulles IAD 31 - - 1,550 - -Northwest Airlink Detroit DTW 1,159 - - 61,983 - -Northwest Airlink Minneapolis MSP 61 - - 3,050 - -Porter Airlines Toronto Island Apt YTZ 9 31 56 47 39 22 -17 -43.6% 620 2,150 3,910 3,308 2,886 1,607 -1,279 -44.3%Swissair Boston BOS 31 - - 1,023 - -United Express Chicago O'Hare ORD 1,003 1,353 1,565 1,391 1,396 1,402 1,144 794 -350 -30.6% 59,930 84,431 88,435 81,204 84,669 85,350 63,845 42,348 -21,497 -33.7%United Express Cleveland CLE 348 331 409 73 - - 17,421 15,376 20,464 3,636 - -United Express New York Newark EWR 1,425 1,425 1,456 1,281 1,569 1,705 136 8.7% 94,675 80,261 85,373 82,670 96,340 94,246 -2,094 -2.2%United Express Washington Dulles IAD 1,477 1,456 1,130 1,112 1,000 910 892 738 795 57 7.7% 73,843 72,786 61,988 69,793 58,665 48,930 50,633 41,127 48,150 7,023 17.1%
Appendix F, Regional Transportation F-18
Boston-Logan International Airport 2016 EDR

Table F-7 Scheduled Passenger Operations by Market and Carrier for Burlington International Airport
Departures Departing Seats'15-'16 '15-'16 '15-'16 '15-'16
Carrier Market Code 2000 2005 2010 2011 2012 2013 2014 2015 2016 Change Pct. Change 2000 2005 2010 2011 2012 2013 2014 2015 2016 Change Pct. Change
US Airways Express Boston BOS 2,404 - - 48,139 - -US Airways Express Charlotte CLT - - - -US Airways Express New York La Guardia LGA 2,074 2,175 1,680 1,487 650 - - 76,749 80,491 62,144 55,008 24,050 - -US Airways Express Philadelphia PHL 1,980 1,903 1,956 1,873 1,803 - - 97,288 128,140 131,727 121,653 111,615 - -US Airways Express Pittsburgh PIT - - - -US Airways Express Plattsburgh PLB 2,427 - - 46,116 - -US Airways Express Poughkeepsie POU 718 - - 13,639 - -US Airways Express Saranac Lake SLK 44 - - 841 - -US Airways Express Washington National DCA 988 990 1,043 1,043 1,072 1,347 - - 31,574 61,458 77,625 82,974 85,623 100,348 - -US Airways Express Wilkes-Barre Scranton AVP 22 - - 415 - - Subtotal 16,138 15,816 11,461 11,593 10,058 9,941 9,516 9,405 9,450 45 0.5% 511,521 755,382 642,104 687,357 598,123 605,069 588,524 580,640 561,655 -18,985 -3.3%
- - - -Total 19,028 17,851 13,225 13,336 11,748 11,484 11,062 10,870 11,182 312 2.9% 910,464 1,035,838 855,404 885,067 794,588 772,916 753,932 741,605 757,343 15,738 2.1%
Source: OAG Schedules.Notes:
Allegiant stopped reporting to the OAG in 2009, so Allegiant 2009-2015 statistics from the T100 database.All Northwest Airlines operations included in Delta Air Lines from 2009 onwars (following 2008 merger)All Continental Airlines operations included in United Airlines from 2011 onwards (following 2010 merger)All AirTran Airways operations included in Southwest Airlines from 2012 onwards (following 2011 merger)All US Airways operations included in American Airlines from 2014 onwards (following 2013 merger)
Appendix F, Regional Transportation F-19
Boston-Logan International Airport 2016 EDR
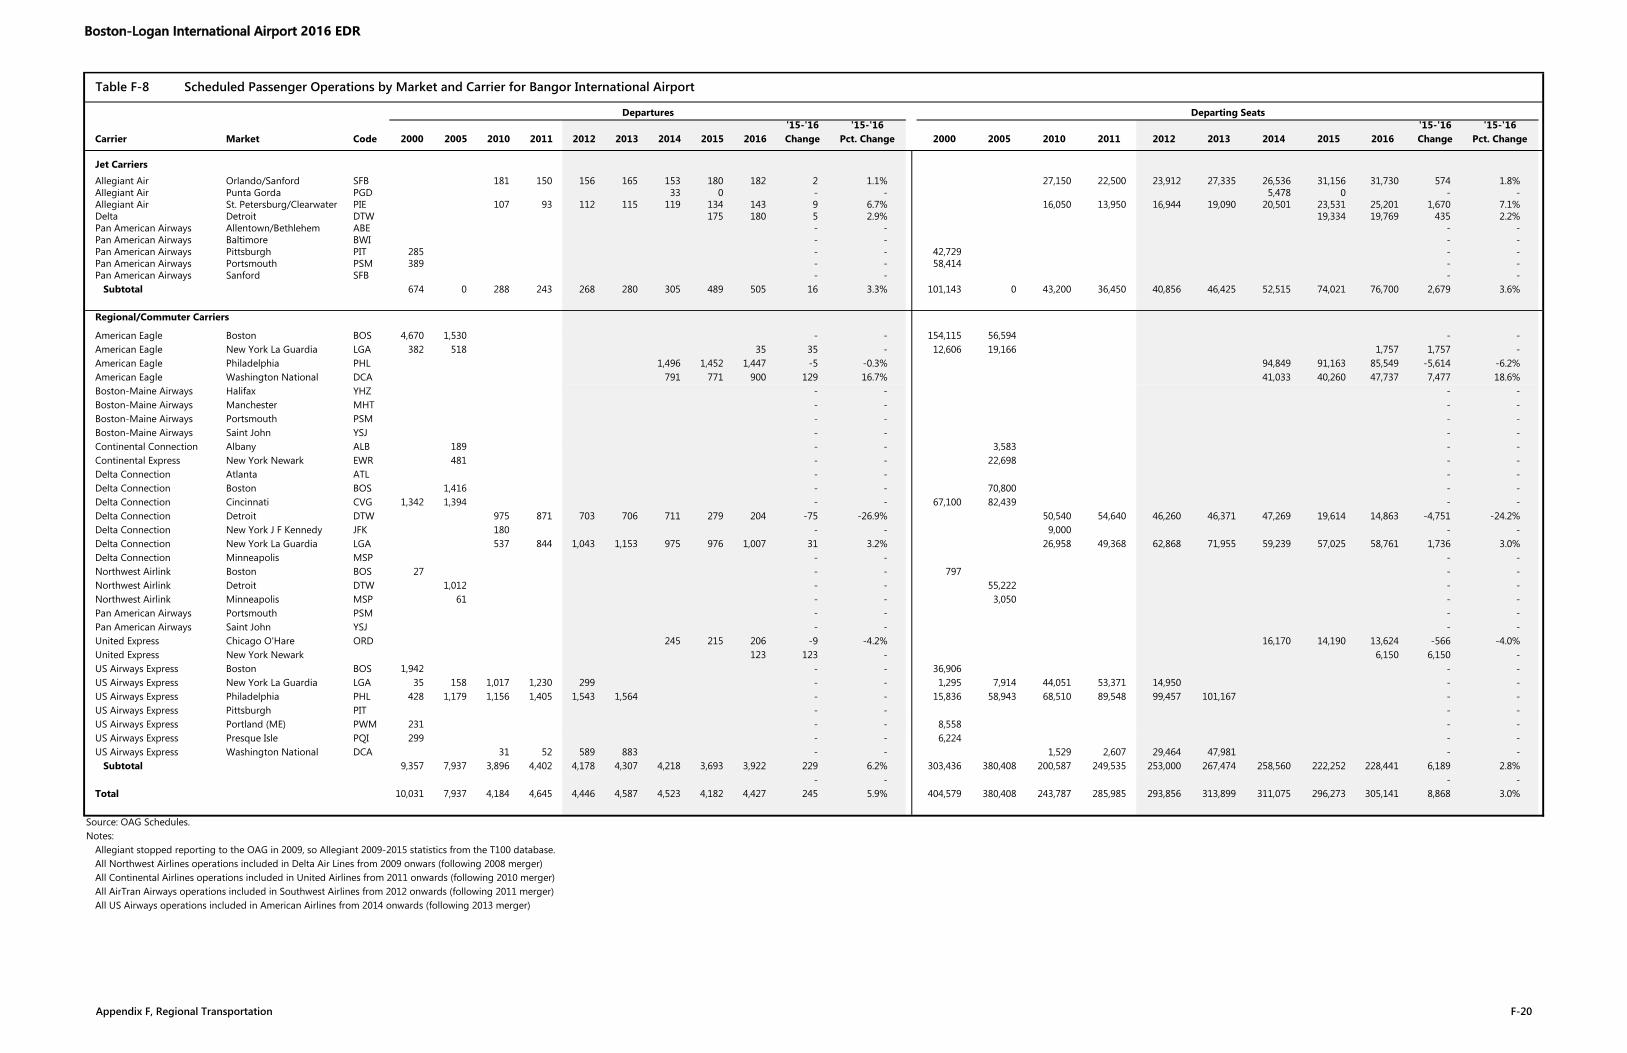
Table F-8 Scheduled Passenger Operations by Market and Carrier for Bangor International Airport
Departures Departing Seats'15-'16 '15-'16 '15-'16 '15-'16
Carrier Market Code 2000 2005 2010 2011 2012 2013 2014 2015 2016 Change Pct. Change 2000 2005 2010 2011 2012 2013 2014 2015 2016 Change Pct. Change
Jet Carriers
Allegiant Air Orlando/Sanford SFB 181 150 156 165 153 180 182 2 1.1% 27,150 22,500 23,912 27,335 26,536 31,156 31,730 574 1.8%Allegiant Air Punta Gorda PGD 33 0 - - 5,478 0 - -Allegiant Air St. Petersburg/Clearwater PIE 107 93 112 115 119 134 143 9 6.7% 16,050 13,950 16,944 19,090 20,501 23,531 25,201 1,670 7.1%Delta Detroit DTW 175 180 5 2.9% 19,334 19,769 435 2.2%Pan American Airways Allentown/Bethlehem ABE - - - -Pan American Airways Baltimore BWI - - - -Pan American Airways Pittsburgh PIT 285 - - 42,729 - -Pan American Airways Portsmouth PSM 389 - - 58,414 - -Pan American Airways Sanford SFB - - - - Subtotal 674 0 288 243 268 280 305 489 505 16 3.3% 101,143 0 43,200 36,450 40,856 46,425 52,515 74,021 76,700 2,679 3.6%
Regional/Commuter Carriers
American Eagle Boston BOS 4,670 1,530 - - 154,115 56,594 - -American Eagle New York La Guardia LGA 382 518 35 35 - 12,606 19,166 1,757 1,757 -American Eagle Philadelphia PHL 1,496 1,452 1,447 -5 -0.3% 94,849 91,163 85,549 -5,614 -6.2%American Eagle Washington National DCA 791 771 900 129 16.7% 41,033 40,260 47,737 7,477 18.6%Boston-Maine Airways Halifax YHZ - - - -Boston-Maine Airways Manchester MHT - - - -Boston-Maine Airways Portsmouth PSM - - - -Boston-Maine Airways Saint John YSJ - - - -Continental Connection Albany ALB 189 - - 3,583 - -Continental Express New York Newark EWR 481 - - 22,698 - -Delta Connection Atlanta ATL - - - -Delta Connection Boston BOS 1,416 - - 70,800 - -Delta Connection Cincinnati CVG 1,342 1,394 - - 67,100 82,439 - -Delta Connection Detroit DTW 975 871 703 706 711 279 204 -75 -26.9% 50,540 54,640 46,260 46,371 47,269 19,614 14,863 -4,751 -24.2%Delta Connection New York J F Kennedy JFK 180 - - 9,000 - -Delta Connection New York La Guardia LGA 537 844 1,043 1,153 975 976 1,007 31 3.2% 26,958 49,368 62,868 71,955 59,239 57,025 58,761 1,736 3.0%Delta Connection Minneapolis MSP - - - -Northwest Airlink Boston BOS 27 - - 797 - -Northwest Airlink Detroit DTW 1,012 - - 55,222 - -Northwest Airlink Minneapolis MSP 61 - - 3,050 - -Pan American Airways Portsmouth PSM - - - -Pan American Airways Saint John YSJ - - - -United Express Chicago O'Hare ORD 245 215 206 -9 -4.2% 16,170 14,190 13,624 -566 -4.0%United Express New York Newark 123 123 - 6,150 6,150 -US Airways Express Boston BOS 1,942 - - 36,906 - -US Airways Express New York La Guardia LGA 35 158 1,017 1,230 299 - - 1,295 7,914 44,051 53,371 14,950 - -US Airways Express Philadelphia PHL 428 1,179 1,156 1,405 1,543 1,564 - - 15,836 58,943 68,510 89,548 99,457 101,167 - -US Airways Express Pittsburgh PIT - - - -US Airways Express Portland (ME) PWM 231 - - 8,558 - -US Airways Express Presque Isle PQI 299 - - 6,224 - -US Airways Express Washington National DCA 31 52 589 883 - - 1,529 2,607 29,464 47,981 - - Subtotal 9,357 7,937 3,896 4,402 4,178 4,307 4,218 3,693 3,922 229 6.2% 303,436 380,408 200,587 249,535 253,000 267,474 258,560 222,252 228,441 6,189 2.8%
- - - -Total 10,031 7,937 4,184 4,645 4,446 4,587 4,523 4,182 4,427 245 5.9% 404,579 380,408 243,787 285,985 293,856 313,899 311,075 296,273 305,141 8,868 3.0%
Source: OAG Schedules.Notes:
Allegiant stopped reporting to the OAG in 2009, so Allegiant 2009-2015 statistics from the T100 database.All Northwest Airlines operations included in Delta Air Lines from 2009 onwars (following 2008 merger)All Continental Airlines operations included in United Airlines from 2011 onwards (following 2010 merger)All AirTran Airways operations included in Southwest Airlines from 2012 onwards (following 2011 merger)All US Airways operations included in American Airlines from 2014 onwards (following 2013 merger)
Appendix F, Regional Transportation F-20
Boston-Logan International Airport 2016 EDR
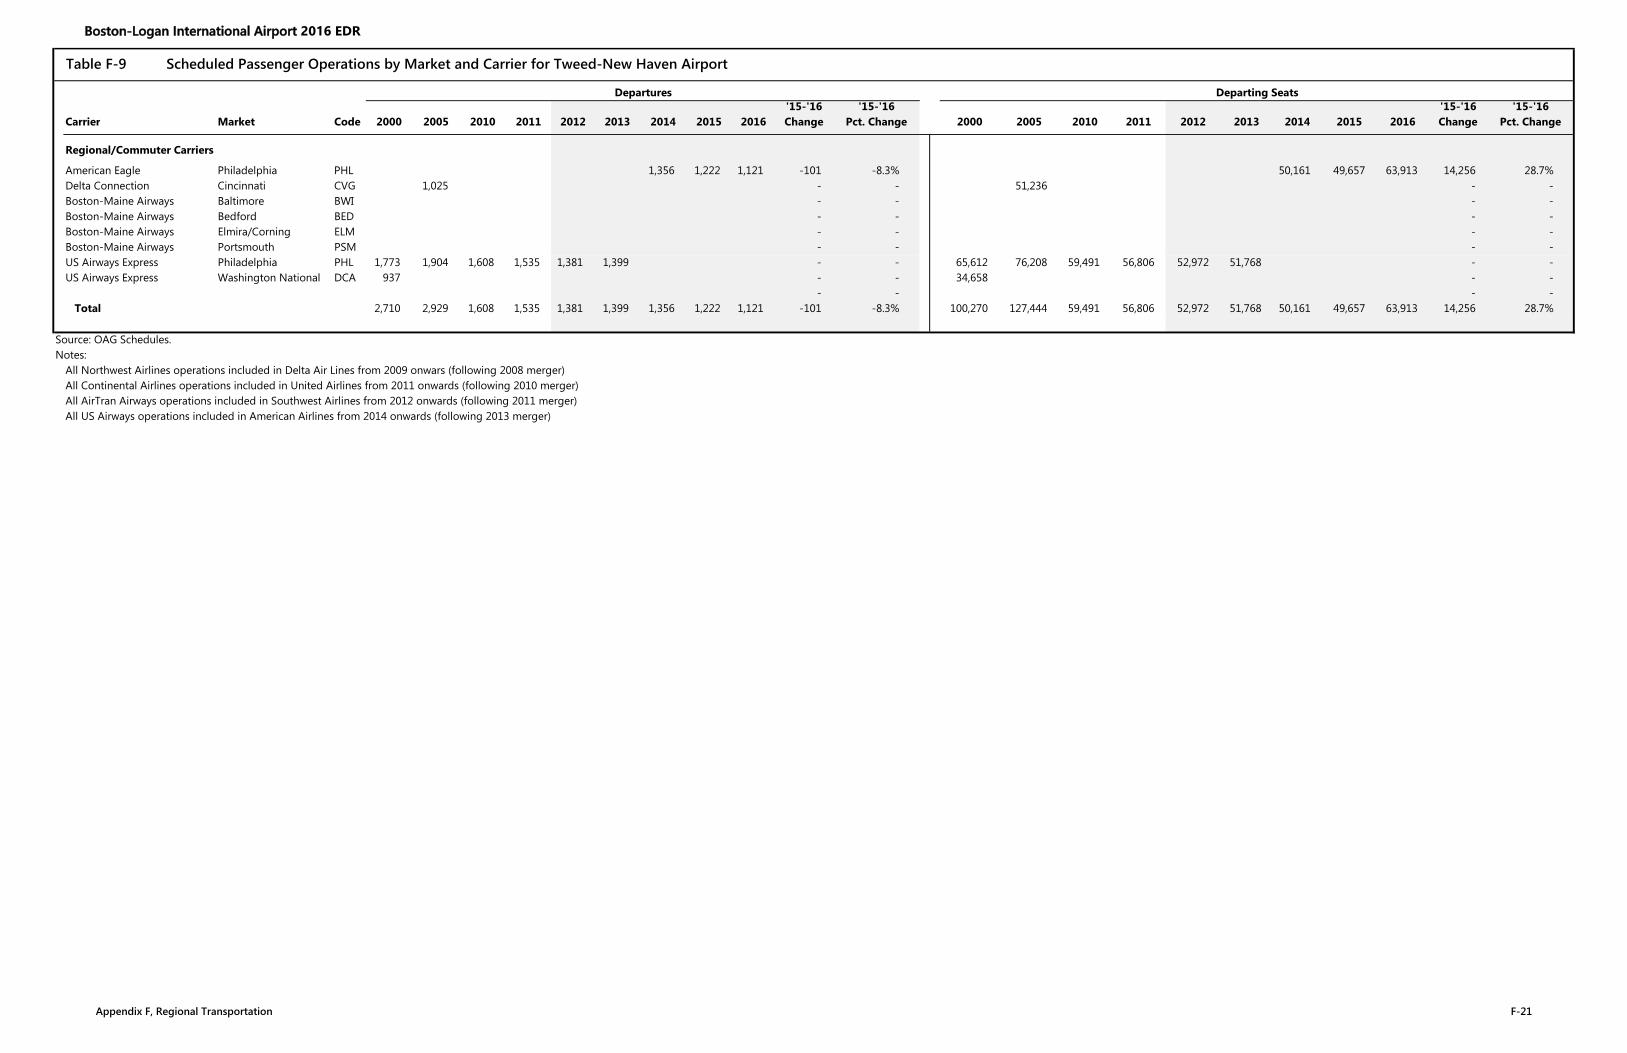
Table F-9 Scheduled Passenger Operations by Market and Carrier for Tweed-New Haven Airport
Departures Departing Seats'15-'16 '15-'16 '15-'16 '15-'16
Carrier Market Code 2000 2005 2010 2011 2012 2013 2014 2015 2016 Change Pct. Change 2000 2005 2010 2011 2012 2013 2014 2015 2016 Change Pct. Change
Regional/Commuter Carriers
American Eagle Philadelphia PHL 1,356 1,222 1,121 -101 -8.3% 50,161 49,657 63,913 14,256 28.7%Delta Connection Cincinnati CVG 1,025 - - 51,236 - -Boston-Maine Airways Baltimore BWI - - - -Boston-Maine Airways Bedford BED - - - -Boston-Maine Airways Elmira/Corning ELM - - - -Boston-Maine Airways Portsmouth PSM - - - -US Airways Express Philadelphia PHL 1,773 1,904 1,608 1,535 1,381 1,399 - - 65,612 76,208 59,491 56,806 52,972 51,768 - -US Airways Express Washington National DCA 937 - - 34,658 - -
- - - -Total 2,710 2,929 1,608 1,535 1,381 1,399 1,356 1,222 1,121 -101 -8.3% 100,270 127,444 59,491 56,806 52,972 51,768 50,161 49,657 63,913 14,256 28.7%
Source: OAG Schedules.Notes:
All Northwest Airlines operations included in Delta Air Lines from 2009 onwars (following 2008 merger)All Continental Airlines operations included in United Airlines from 2011 onwards (following 2010 merger)All AirTran Airways operations included in Southwest Airlines from 2012 onwards (following 2011 merger)All US Airways operations included in American Airlines from 2014 onwards (following 2013 merger)
Appendix F, Regional Transportation F-21
Boston-Logan International Airport 2016 EDR

Table F-10 Scheduled Passenger Operations by Market and Carrier for Worcester Regional Airport
Departures Departing Seats'15-'16 '15-'16 '15-'16 '15-'16
Carrier Market Code 2000 2005 2010 2011 2012 2013 2014 2015 2016 Change Pct. Change 2000 2005 2010 2011 2012 2013 2014 2015 2016 Change Pct. Change
Jet Carriers
Allegiant Air Sanford SFB - - - -Boston-Maine Airways Allentown/Bethlehem ABE - - - -Boston-Maine Airways Portsmouth PSM - - - -Boston-Maine Airways Sanford SFB - - - -Direct Air Myrtle Beach MYR 73 96 - - 9,782 14,120 - -Direct Air Orlando/Sanford SFB 144 148 - - 21,937 24,339 - -Direct Air Punta Gorda PGD 94 105 - - 14,541 17,287 - -Direct Air West Palm Beach PBI 13 51 - - 1,872 7,444 - -jetBlue Fort Lauderdale/Hollywood FLL 61 365 365 365 - 0.0% 6,100 36,500 36,500 36,500 - 0.0%jetBlue Orlando MCO 61 365 365 365 - 0.0% 6,100 36,500 36,500 36,500 - 0.0% Subtotal 0 0 324 400 0 122 730 730 730 - 0.0% 0 0 48,132 63,190 0 12,200 73,000 73,000 73,000 - 0.0%
Regional/Commuter Carriers
American Eagle Chicago O'Hare ORD - - - -American Eagle New York J F Kennedy JFK 552 - - 18,216 - -Delta Connection Atlanta ATL 670 - - 33,500 - -US Airways Express Philadelphia PHL 1,464 - - 54,168 - - Subtotal 2,686 0 0 0 0 0 0 0 - - 105,884 0 0 0 0 0 0 - -
- - - -Total 2,686 0 324 400 0 122 730 730 730 - 0.0% 105,884 0 48,132 63,190 0 12,200 73,000 73,000 73,000 - 0.0%
Source: OAG Schedules.Notes:
All Northwest Airlines operations included in Delta Air Lines from 2009 onwars (following 2008 merger)All Continental Airlines operations included in United Airlines from 2011 onwards (following 2010 merger)All AirTran Airways operations included in Southwest Airlines from 2012 onwards (following 2011 merger)All US Airways operations included in American Airlines from 2014 onwards (following 2013 merger)
Appendix F, Regional Transportation F-22
Boston-Logan International Airport 2016 EDR
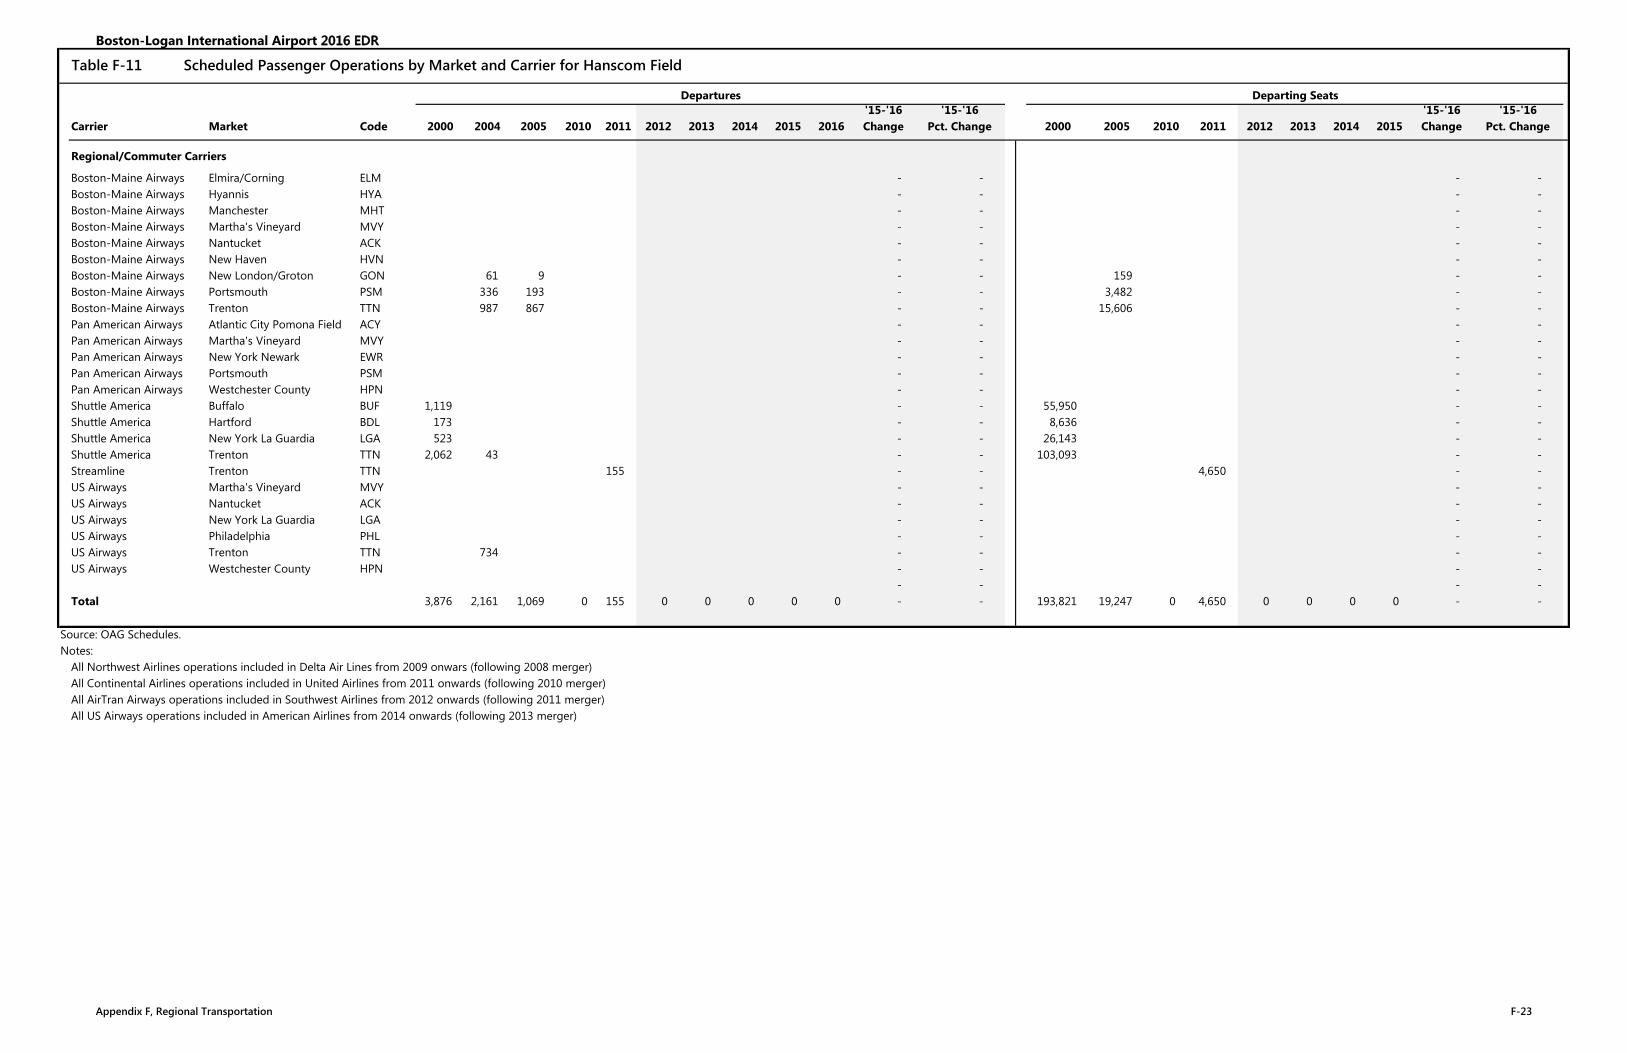
Table F-11 Scheduled Passenger Operations by Market and Carrier for Hanscom Field
Departures Departing Seats'15-'16 '15-'16 '15-'16 '15-'16
Carrier Market Code 2000 2004 2005 2010 2011 2012 2013 2014 2015 2016 Change Pct. Change 2000 2005 2010 2011 2012 2013 2014 2015 Change Pct. Change
Regional/Commuter Carriers
Boston-Maine Airways Elmira/Corning ELM - - - -Boston-Maine Airways Hyannis HYA - - - -Boston-Maine Airways Manchester MHT - - - -Boston-Maine Airways Martha's Vineyard MVY - - - -Boston-Maine Airways Nantucket ACK - - - -Boston-Maine Airways New Haven HVN - - - -Boston-Maine Airways New London/Groton GON 61 9 - - 159 - -Boston-Maine Airways Portsmouth PSM 336 193 - - 3,482 - -Boston-Maine Airways Trenton TTN 987 867 - - 15,606 - -Pan American Airways Atlantic City Pomona Field ACY - - - -Pan American Airways Martha's Vineyard MVY - - - -Pan American Airways New York Newark EWR - - - -Pan American Airways Portsmouth PSM - - - -Pan American Airways Westchester County HPN - - - -Shuttle America Buffalo BUF 1,119 - - 55,950 - -Shuttle America Hartford BDL 173 - - 8,636 - -Shuttle America New York La Guardia LGA 523 - - 26,143 - -Shuttle America Trenton TTN 2,062 43 - - 103,093 - -Streamline Trenton TTN 155 - - 4,650 - -US Airways Martha's Vineyard MVY - - - -US Airways Nantucket ACK - - - -US Airways New York La Guardia LGA - - - -US Airways Philadelphia PHL - - - -US Airways Trenton TTN 734 - - - -US Airways Westchester County HPN - - - -
- - - -Total 3,876 2,161 1,069 0 155 0 0 0 0 0 - - 193,821 19,247 0 4,650 0 0 0 0 - -
Source: OAG Schedules.Notes:
All Northwest Airlines operations included in Delta Air Lines from 2009 onwars (following 2008 merger)All Continental Airlines operations included in United Airlines from 2011 onwards (following 2010 merger)All AirTran Airways operations included in Southwest Airlines from 2012 onwards (following 2011 merger)All US Airways operations included in American Airlines from 2014 onwards (following 2013 merger)
Appendix F, Regional Transportation F-23
Boston-Logan International Airport 2016 EDR
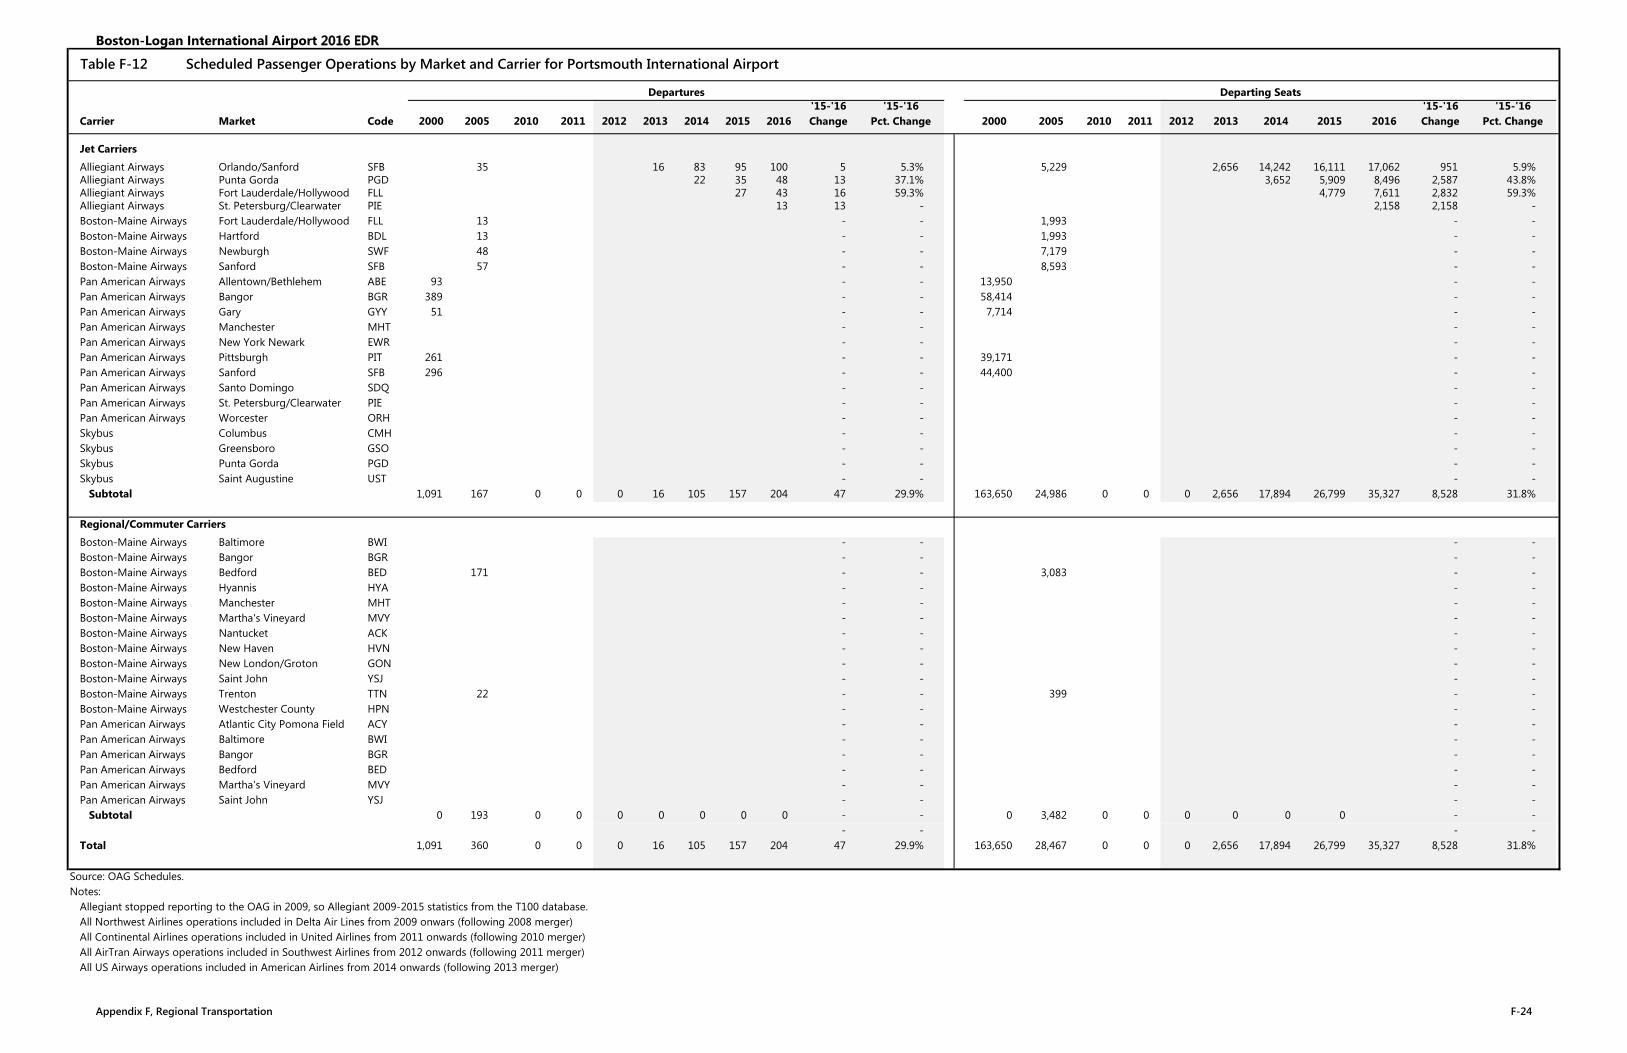
Table F-12 Scheduled Passenger Operations by Market and Carrier for Portsmouth International Airport
Departures Departing Seats'15-'16 '15-'16 '15-'16 '15-'16
Carrier Market Code 2000 2005 2010 2011 2012 2013 2014 2015 2016 Change Pct. Change 2000 2005 2010 2011 2012 2013 2014 2015 2016 Change Pct. Change
Jet Carriers
Alliegiant Airways Orlando/Sanford SFB 35 16 83 95 100 5 5.3% 5,229 2,656 14,242 16,111 17,062 951 5.9%Alliegiant Airways Punta Gorda PGD 22 35 48 13 37.1% 3,652 5,909 8,496 2,587 43.8%Alliegiant Airways Fort Lauderdale/Hollywood FLL 27 43 16 59.3% 4,779 7,611 2,832 59.3%Alliegiant Airways St. Petersburg/Clearwater PIE 13 13 - 2,158 2,158 -Boston-Maine Airways Fort Lauderdale/Hollywood FLL 13 - - 1,993 - -Boston-Maine Airways Hartford BDL 13 - - 1,993 - -Boston-Maine Airways Newburgh SWF 48 - - 7,179 - -Boston-Maine Airways Sanford SFB 57 - - 8,593 - -Pan American Airways Allentown/Bethlehem ABE 93 - - 13,950 - -Pan American Airways Bangor BGR 389 - - 58,414 - -Pan American Airways Gary GYY 51 - - 7,714 - -Pan American Airways Manchester MHT - - - -Pan American Airways New York Newark EWR - - - -Pan American Airways Pittsburgh PIT 261 - - 39,171 - -Pan American Airways Sanford SFB 296 - - 44,400 - -Pan American Airways Santo Domingo SDQ - - - -Pan American Airways St. Petersburg/Clearwater PIE - - - -Pan American Airways Worcester ORH - - - -Skybus Columbus CMH - - - -Skybus Greensboro GSO - - - -Skybus Punta Gorda PGD - - - -Skybus Saint Augustine UST - - - - Subtotal 1,091 167 0 0 0 16 105 157 204 47 29.9% 163,650 24,986 0 0 0 2,656 17,894 26,799 35,327 8,528 31.8%
Regional/Commuter Carriers
Boston-Maine Airways Baltimore BWI - - - -Boston-Maine Airways Bangor BGR - - - -Boston-Maine Airways Bedford BED 171 - - 3,083 - -Boston-Maine Airways Hyannis HYA - - - -Boston-Maine Airways Manchester MHT - - - -Boston-Maine Airways Martha's Vineyard MVY - - - -Boston-Maine Airways Nantucket ACK - - - -Boston-Maine Airways New Haven HVN - - - -Boston-Maine Airways New London/Groton GON - - - -Boston-Maine Airways Saint John YSJ - - - -Boston-Maine Airways Trenton TTN 22 - - 399 - -Boston-Maine Airways Westchester County HPN - - - -Pan American Airways Atlantic City Pomona Field ACY - - - -Pan American Airways Baltimore BWI - - - -Pan American Airways Bangor BGR - - - -Pan American Airways Bedford BED - - - -Pan American Airways Martha's Vineyard MVY - - - -Pan American Airways Saint John YSJ - - - - Subtotal 0 193 0 0 0 0 0 0 0 - - 0 3,482 0 0 0 0 0 0 - -
- - - -Total 1,091 360 0 0 0 16 105 157 204 47 29.9% 163,650 28,467 0 0 0 2,656 17,894 26,799 35,327 8,528 31.8%
Source: OAG Schedules.Notes:
Allegiant stopped reporting to the OAG in 2009, so Allegiant 2009-2015 statistics from the T100 database.All Northwest Airlines operations included in Delta Air Lines from 2009 onwars (following 2008 merger)All Continental Airlines operations included in United Airlines from 2011 onwards (following 2010 merger)All AirTran Airways operations included in Southwest Airlines from 2012 onwards (following 2011 merger)All US Airways operations included in American Airlines from 2014 onwards (following 2013 merger)
Appendix F, Regional Transportation F-24
Boston-Logan International Airport 2016 EDR
Boston-Logan International Airport 2016 EDR
Appendix G, Ground Access G-1
G Ground Access This appendix provides information in support of Chapter 5, Ground Access to and from Logan Airport: Table G-1A Logan Express Bus Service Ridership (Annual) Table G-1B Logan Express Back Bay Service Ridership (Annual) Table G-2 Water Transportation Services Ridership (Annual) Table G-3 Massachusetts Bay Transportation Authority (MBTA) Airport Station Passengers Table G-4 Annual Taxi Dispatches (Tickets Sold) Table G-5 Logan Airport Employee Parking Supply Table G-6 Logan Airport Commercial Parking Supply Table G-7 2016 Existing Conditions – Airport-Related Traffic, On-Airport Link Attributes, Traffic
Assignment, and Vehicle Miles Traveled (VMT) Summary VISSIM Traffic Roadway Network April 2016 Logan Airport Parking Space Inventory, submitted to Massachusetts Department of
Environmental Protection (also known as the Parking Freeze Report) September 2016 Logan Airport Parking Space Inventory, submitted to Massachusetts Department of
Environmental Protection (also known as the Parking Freeze Report) Massport Sustainable Transportation Options Newsletter, February 2018
Boston-Logan International Airport 2016 EDR
Appendix G, Ground Access G-2
This Page Intentionally Left Blank.
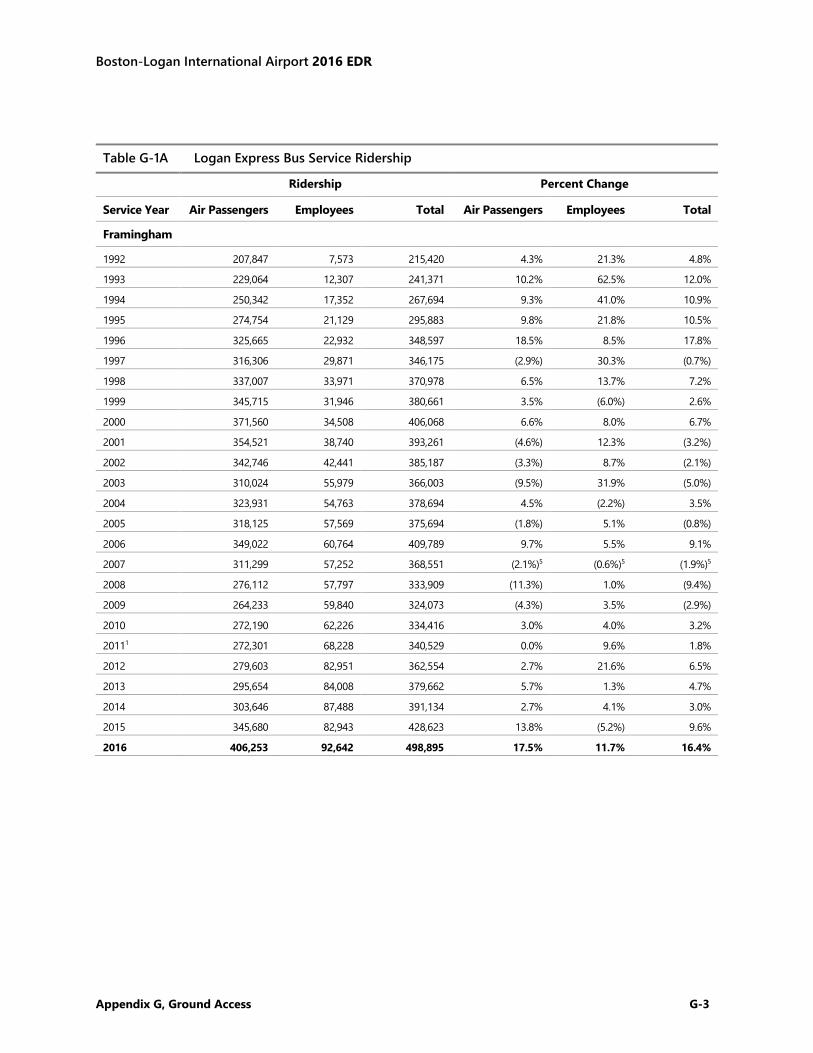
Boston-Logan International Airport 2016 EDR
Appendix G, Ground Access G-3
Table G-1A Logan Express Bus Service Ridership
Ridership Percent Change
Service Year Air Passengers Employees Total Air Passengers Employees Total
Framingham
1992 207,847 7,573 215,420 4.3% 21.3% 4.8% 1993 229,064 12,307 241,371 10.2% 62.5% 12.0% 1994 250,342 17,352 267,694 9.3% 41.0% 10.9% 1995 274,754 21,129 295,883 9.8% 21.8% 10.5% 1996 325,665 22,932 348,597 18.5% 8.5% 17.8% 1997 316,306 29,871 346,175 (2.9%) 30.3% (0.7%) 1998 337,007 33,971 370,978 6.5% 13.7% 7.2% 1999 345,715 31,946 380,661 3.5% (6.0%) 2.6% 2000 371,560 34,508 406,068 6.6% 8.0% 6.7% 2001 354,521 38,740 393,261 (4.6%) 12.3% (3.2%) 2002 342,746 42,441 385,187 (3.3%) 8.7% (2.1%) 2003 310,024 55,979 366,003 (9.5%) 31.9% (5.0%) 2004 323,931 54,763 378,694 4.5% (2.2%) 3.5% 2005 318,125 57,569 375,694 (1.8%) 5.1% (0.8%) 2006 349,022 60,764 409,789 9.7% 5.5% 9.1% 2007 311,299 57,252 368,551 (2.1%)5 (0.6%)5 (1.9%)5 2008 276,112 57,797 333,909 (11.3%) 1.0% (9.4%) 2009 264,233 59,840 324,073 (4.3%) 3.5% (2.9%) 2010 272,190 62,226 334,416 3.0% 4.0% 3.2% 20111 272,301 68,228 340,529 0.0% 9.6% 1.8% 2012 279,603 82,951 362,554 2.7% 21.6% 6.5% 2013 295,654 84,008 379,662 5.7% 1.3% 4.7% 2014 303,646 87,488 391,134 2.7% 4.1% 3.0% 2015 345,680 82,943 428,623 13.8% (5.2%) 9.6% 2016 406,253 92,642 498,895 17.5% 11.7% 16.4%
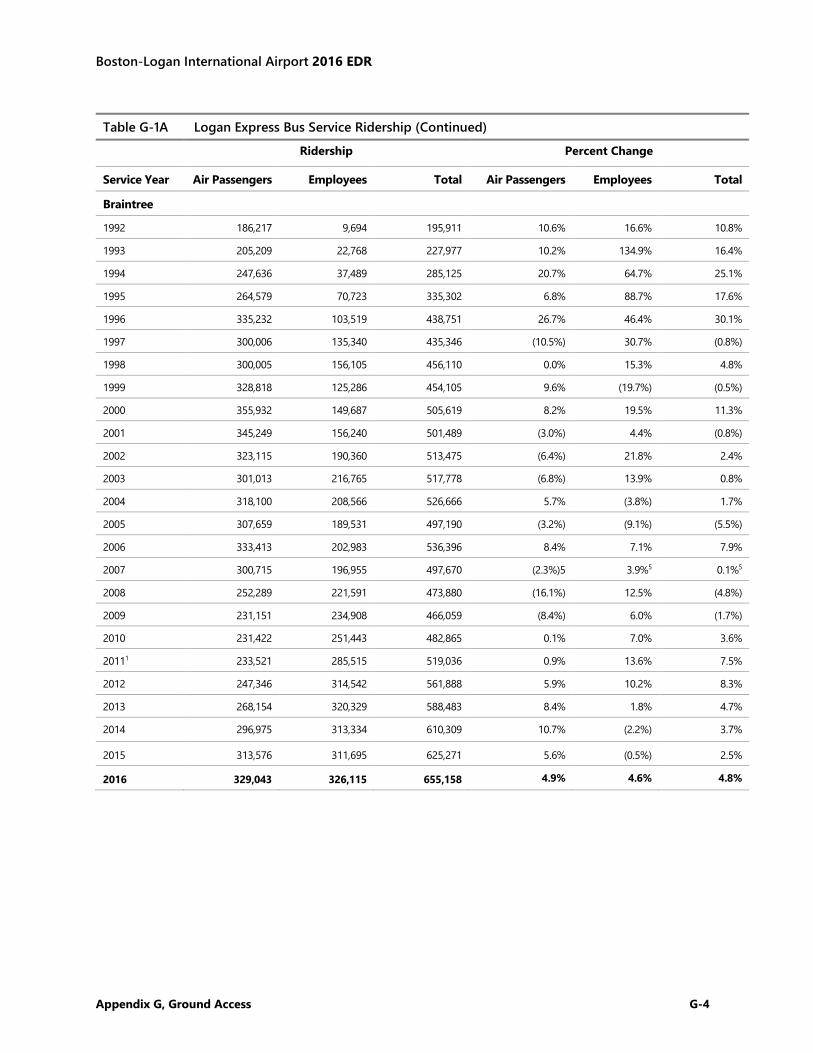
Boston-Logan International Airport 2016 EDR
Appendix G, Ground Access G-4
Table G-1A Logan Express Bus Service Ridership (Continued)
Ridership Percent Change
Service Year Air Passengers Employees Total Air Passengers Employees Total
Braintree 1992 186,217 9,694 195,911 10.6% 16.6% 10.8% 1993 205,209 22,768 227,977 10.2% 134.9% 16.4% 1994 247,636 37,489 285,125 20.7% 64.7% 25.1% 1995 264,579 70,723 335,302 6.8% 88.7% 17.6% 1996 335,232 103,519 438,751 26.7% 46.4% 30.1% 1997 300,006 135,340 435,346 (10.5%) 30.7% (0.8%) 1998 300,005 156,105 456,110 0.0% 15.3% 4.8% 1999 328,818 125,286 454,105 9.6% (19.7%) (0.5%) 2000 355,932 149,687 505,619 8.2% 19.5% 11.3% 2001 345,249 156,240 501,489 (3.0%) 4.4% (0.8%) 2002 323,115 190,360 513,475 (6.4%) 21.8% 2.4% 2003 301,013 216,765 517,778 (6.8%) 13.9% 0.8% 2004 318,100 208,566 526,666 5.7% (3.8%) 1.7% 2005 307,659 189,531 497,190 (3.2%) (9.1%) (5.5%) 2006 333,413 202,983 536,396 8.4% 7.1% 7.9% 2007 300,715 196,955 497,670 (2.3%)5 3.9%5 0.1%5 2008 252,289 221,591 473,880 (16.1%) 12.5% (4.8%) 2009 231,151 234,908 466,059 (8.4%) 6.0% (1.7%) 2010 231,422 251,443 482,865 0.1% 7.0% 3.6% 20111 233,521 285,515 519,036 0.9% 13.6% 7.5% 2012 247,346 314,542 561,888 5.9% 10.2% 8.3% 2013 268,154 320,329 588,483 8.4% 1.8% 4.7% 2014 296,975 313,334 610,309 10.7% (2.2%) 3.7%
2015 313,576 311,695 625,271 5.6% (0.5%) 2.5% 2016 329,043 326,115 655,158 4.9% 4.6% 4.8%
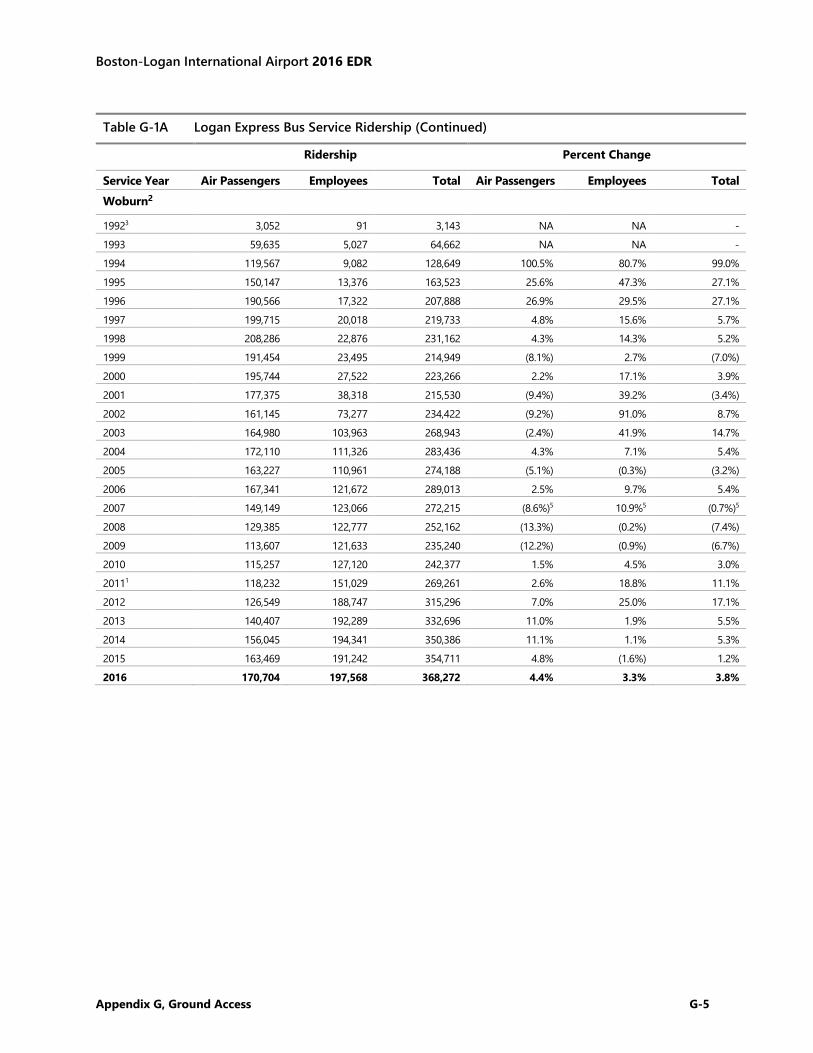
Boston-Logan International Airport 2016 EDR
Appendix G, Ground Access G-5
Table G-1A Logan Express Bus Service Ridership (Continued)
Ridership Percent Change
Service Year Air Passengers Employees Total Air Passengers Employees Total Woburn2 19923 3,052 91 3,143 NA NA - 1993 59,635 5,027 64,662 NA NA - 1994 119,567 9,082 128,649 100.5% 80.7% 99.0% 1995 150,147 13,376 163,523 25.6% 47.3% 27.1% 1996 190,566 17,322 207,888 26.9% 29.5% 27.1% 1997 199,715 20,018 219,733 4.8% 15.6% 5.7% 1998 208,286 22,876 231,162 4.3% 14.3% 5.2% 1999 191,454 23,495 214,949 (8.1%) 2.7% (7.0%) 2000 195,744 27,522 223,266 2.2% 17.1% 3.9% 2001 177,375 38,318 215,530 (9.4%) 39.2% (3.4%) 2002 161,145 73,277 234,422 (9.2%) 91.0% 8.7% 2003 164,980 103,963 268,943 (2.4%) 41.9% 14.7% 2004 172,110 111,326 283,436 4.3% 7.1% 5.4% 2005 163,227 110,961 274,188 (5.1%) (0.3%) (3.2%) 2006 167,341 121,672 289,013 2.5% 9.7% 5.4% 2007 149,149 123,066 272,215 (8.6%)5 10.9%5 (0.7%)5 2008 129,385 122,777 252,162 (13.3%) (0.2%) (7.4%) 2009 113,607 121,633 235,240 (12.2%) (0.9%) (6.7%) 2010 115,257 127,120 242,377 1.5% 4.5% 3.0% 20111 118,232 151,029 269,261 2.6% 18.8% 11.1% 2012 126,549 188,747 315,296 7.0% 25.0% 17.1% 2013 140,407 192,289 332,696 11.0% 1.9% 5.5% 2014 156,045 194,341 350,386 11.1% 1.1% 5.3% 2015 163,469 191,242 354,711 4.8% (1.6%) 1.2% 2016 170,704 197,568 368,272 4.4% 3.3% 3.8%
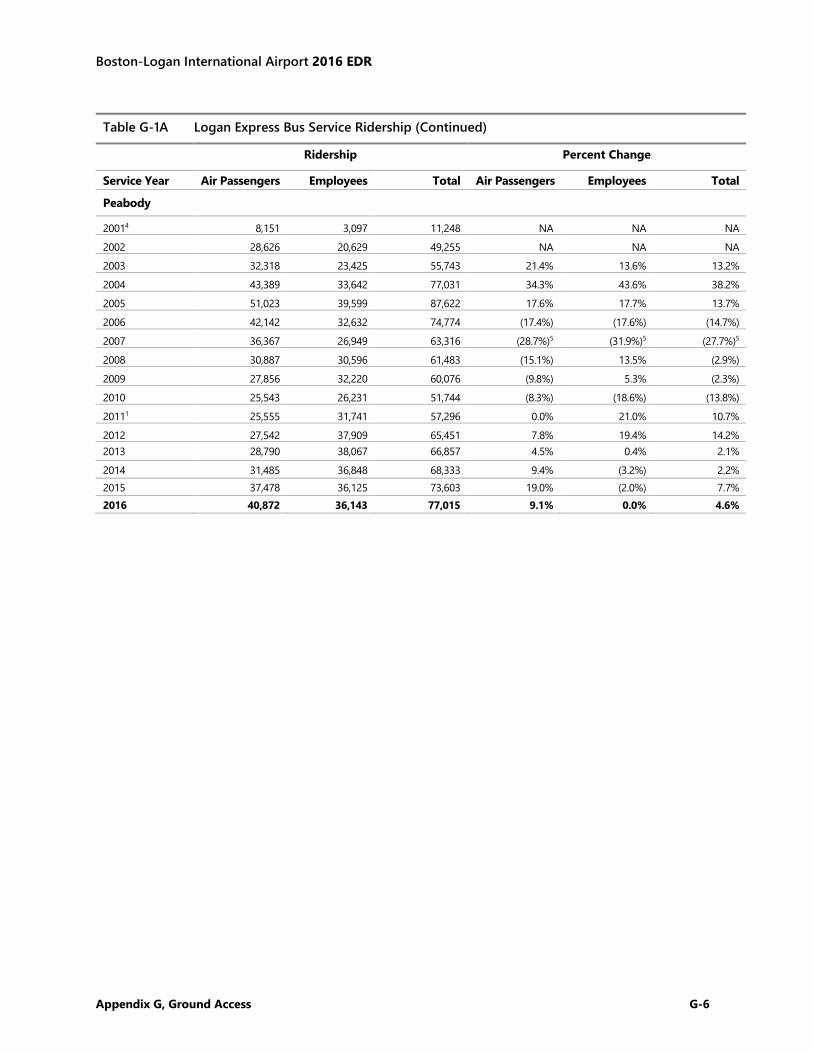
Boston-Logan International Airport 2016 EDR
Appendix G, Ground Access G-6
Table G-1A Logan Express Bus Service Ridership (Continued)
Ridership Percent Change
Service Year Air Passengers Employees Total Air Passengers Employees Total
Peabody 20014 8,151 3,097 11,248 NA NA NA 2002 28,626 20,629 49,255 NA NA NA 2003 32,318 23,425 55,743 21.4% 13.6% 13.2% 2004 43,389 33,642 77,031 34.3% 43.6% 38.2% 2005 51,023 39,599 87,622 17.6% 17.7% 13.7% 2006 42,142 32,632 74,774 (17.4%) (17.6%) (14.7%) 2007 36,367 26,949 63,316 (28.7%)5 (31.9%)5 (27.7%)5 2008 30,887 30,596 61,483 (15.1%) 13.5% (2.9%) 2009 27,856 32,220 60,076 (9.8%) 5.3% (2.3%) 2010 25,543 26,231 51,744 (8.3%) (18.6%) (13.8%) 20111 25,555 31,741 57,296 0.0% 21.0% 10.7% 2012 27,542 37,909 65,451 7.8% 19.4% 14.2% 2013 28,790 38,067 66,857 4.5% 0.4% 2.1% 2014 31,485 36,848 68,333 9.4% (3.2%) 2.2% 2015 37,478 36,125 73,603 19.0% (2.0%) 7.7% 2016 40,872 36,143 77,015 9.1% 0.0% 4.6%
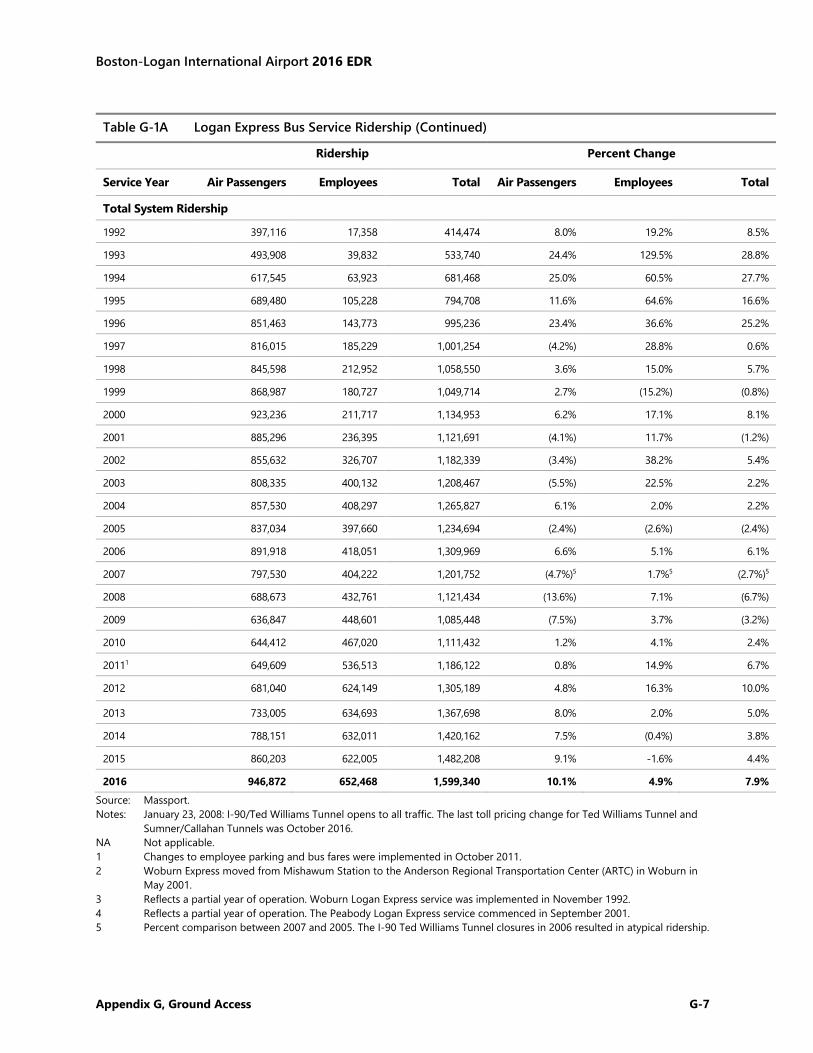
Boston-Logan International Airport 2016 EDR
Appendix G, Ground Access G-7
Table G-1A Logan Express Bus Service Ridership (Continued)
Ridership Percent Change
Service Year Air Passengers Employees Total Air Passengers Employees Total
Total System Ridership 1992 397,116 17,358 414,474 8.0% 19.2% 8.5% 1993 493,908 39,832 533,740 24.4% 129.5% 28.8% 1994 617,545 63,923 681,468 25.0% 60.5% 27.7% 1995 689,480 105,228 794,708 11.6% 64.6% 16.6% 1996 851,463 143,773 995,236 23.4% 36.6% 25.2% 1997 816,015 185,229 1,001,254 (4.2%) 28.8% 0.6% 1998 845,598 212,952 1,058,550 3.6% 15.0% 5.7% 1999 868,987 180,727 1,049,714 2.7% (15.2%) (0.8%) 2000 923,236 211,717 1,134,953 6.2% 17.1% 8.1% 2001 885,296 236,395 1,121,691 (4.1%) 11.7% (1.2%) 2002 855,632 326,707 1,182,339 (3.4%) 38.2% 5.4% 2003 808,335 400,132 1,208,467 (5.5%) 22.5% 2.2% 2004 857,530 408,297 1,265,827 6.1% 2.0% 2.2% 2005 837,034 397,660 1,234,694 (2.4%) (2.6%) (2.4%) 2006 891,918 418,051 1,309,969 6.6% 5.1% 6.1% 2007 797,530 404,222 1,201,752 (4.7%)5 1.7%5 (2.7%)5 2008 688,673 432,761 1,121,434 (13.6%) 7.1% (6.7%) 2009 636,847 448,601 1,085,448 (7.5%) 3.7% (3.2%) 2010 644,412 467,020 1,111,432 1.2% 4.1% 2.4% 20111 649,609 536,513 1,186,122 0.8% 14.9% 6.7% 2012 681,040 624,149 1,305,189 4.8% 16.3% 10.0% 2013 733,005 634,693 1,367,698 8.0% 2.0% 5.0% 2014 788,151 632,011 1,420,162 7.5% (0.4%) 3.8% 2015 860,203 622,005 1,482,208 9.1% -1.6% 4.4% 2016 946,872 652,468 1,599,340 10.1% 4.9% 7.9%
Source: Massport. Notes: January 23, 2008: I-90/Ted Williams Tunnel opens to all traffic. The last toll pricing change for Ted Williams Tunnel and
Sumner/Callahan Tunnels was October 2016. NA Not applicable. 1 Changes to employee parking and bus fares were implemented in October 2011. 2 Woburn Express moved from Mishawum Station to the Anderson Regional Transportation Center (ARTC) in Woburn in
May 2001. 3 Reflects a partial year of operation. Woburn Logan Express service was implemented in November 1992. 4 Reflects a partial year of operation. The Peabody Logan Express service commenced in September 2001. 5 Percent comparison between 2007 and 2005. The I-90 Ted Williams Tunnel closures in 2006 resulted in atypical ridership.
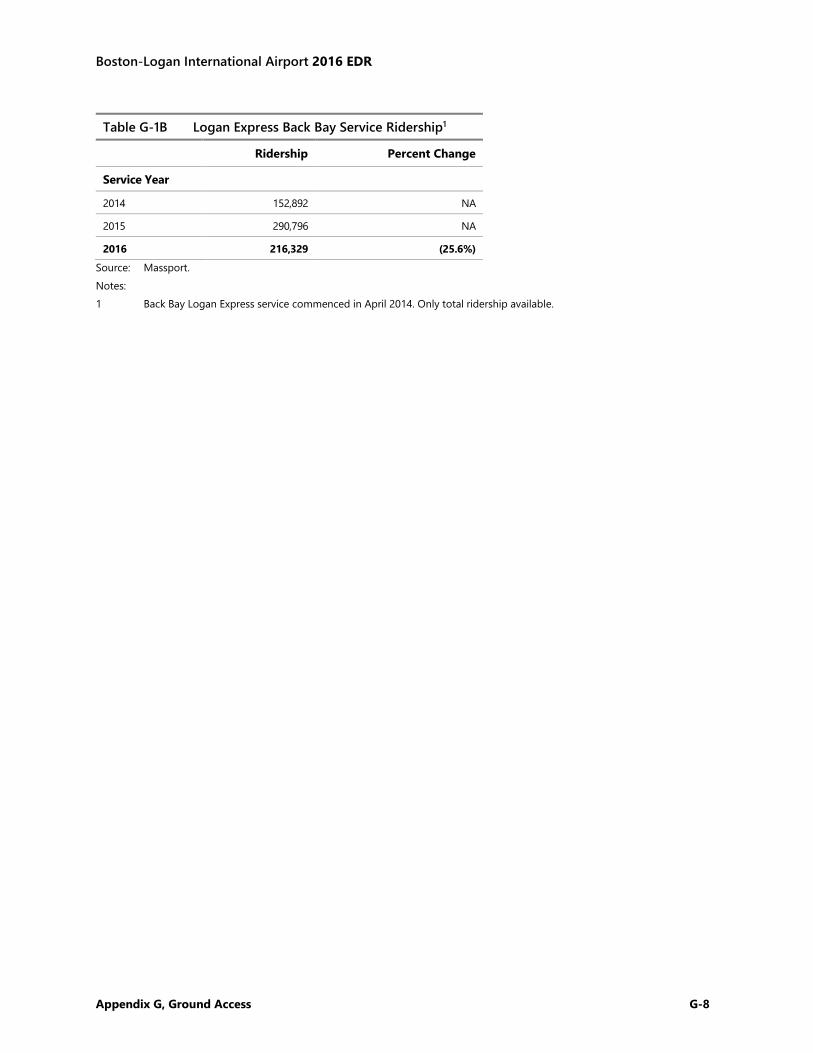
Boston-Logan International Airport 2016 EDR
Appendix G, Ground Access G-8
Table G-1B Logan Express Back Bay Service Ridership1
Ridership Percent Change
Service Year 2014 152,892 NA 2015 290,796 NA 2016 216,329 (25.6%)
Source: Massport. Notes: 1 Back Bay Logan Express service commenced in April 2014. Only total ridership available.
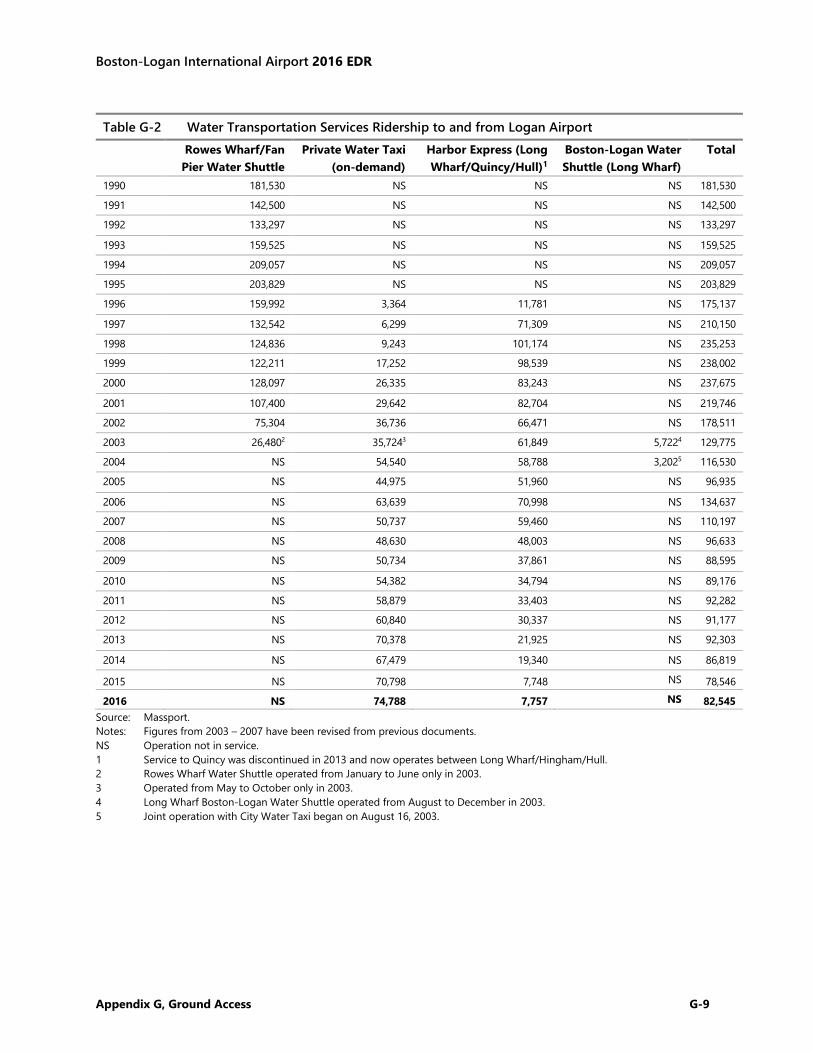
Boston-Logan International Airport 2016 EDR
Appendix G, Ground Access G-9
Table G-2 Water Transportation Services Ridership to and from Logan Airport
Rowes Wharf/Fan Pier Water Shuttle
Private Water Taxi (on-demand)
Harbor Express (Long Wharf/Quincy/Hull)1
Boston-Logan Water Shuttle (Long Wharf)
Total
1990 181,530 NS NS NS 181,530 1991 142,500 NS NS NS 142,500 1992 133,297 NS NS NS 133,297 1993 159,525 NS NS NS 159,525 1994 209,057 NS NS NS 209,057 1995 203,829 NS NS NS 203,829 1996 159,992 3,364 11,781 NS 175,137 1997 132,542 6,299 71,309 NS 210,150 1998 124,836 9,243 101,174 NS 235,253 1999 122,211 17,252 98,539 NS 238,002 2000 128,097 26,335 83,243 NS 237,675 2001 107,400 29,642 82,704 NS 219,746 2002 75,304 36,736 66,471 NS 178,511 2003 26,4802 35,7243 61,849 5,7224 129,775 2004 NS 54,540 58,788 3,2025 116,530 2005 NS 44,975 51,960 NS 96,935 2006 NS 63,639 70,998 NS 134,637 2007 NS 50,737 59,460 NS 110,197 2008 NS 48,630 48,003 NS 96,633 2009 NS 50,734 37,861 NS 88,595 2010 NS 54,382 34,794 NS 89,176 2011 NS 58,879 33,403 NS 92,282 2012 NS 60,840 30,337 NS 91,177 2013 NS 70,378 21,925 NS 92,303 2014 NS 67,479 19,340 NS 86,819 2015 NS 70,798 7,748 NS 78,546 2016 NS 74,788 7,757 NS 82,545
Source: Massport. Notes: Figures from 2003 – 2007 have been revised from previous documents. NS Operation not in service. 1 Service to Quincy was discontinued in 2013 and now operates between Long Wharf/Hingham/Hull. 2 Rowes Wharf Water Shuttle operated from January to June only in 2003. 3 Operated from May to October only in 2003. 4 Long Wharf Boston-Logan Water Shuttle operated from August to December in 2003. 5 Joint operation with City Water Taxi began on August 16, 2003.
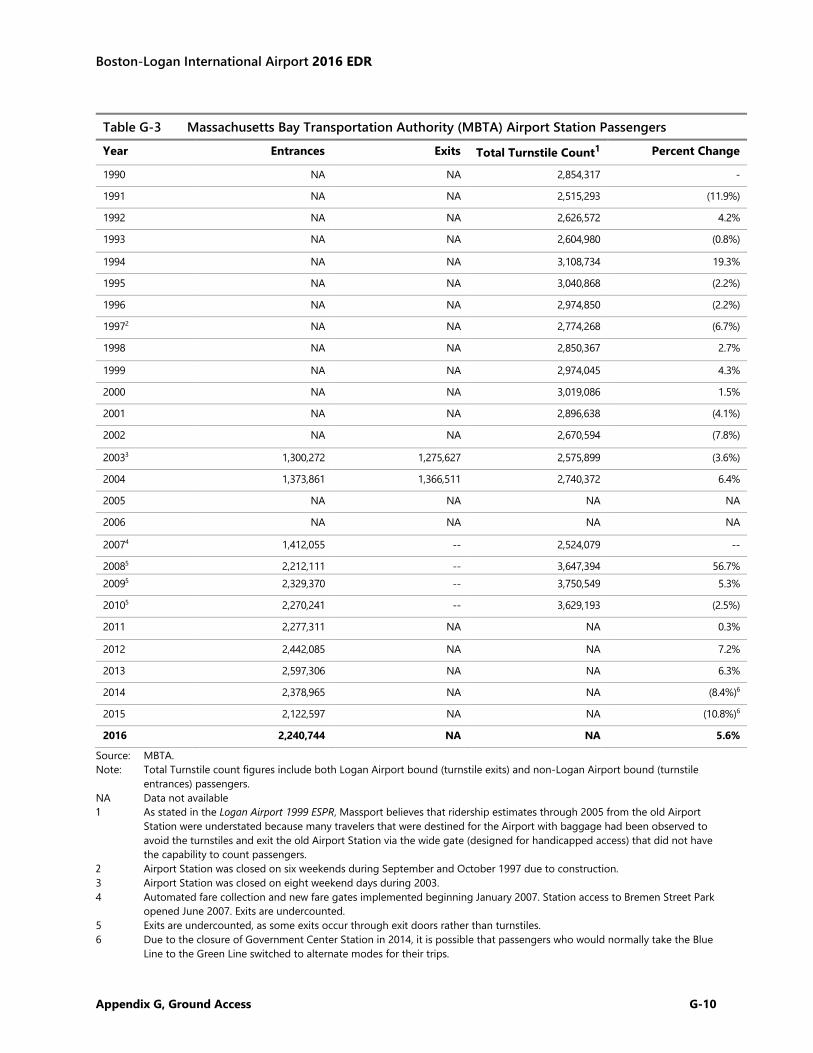
Boston-Logan International Airport 2016 EDR
Appendix G, Ground Access G-10
Table G-3 Massachusetts Bay Transportation Authority (MBTA) Airport Station Passengers
Year Entrances Exits Total Turnstile Count1 Percent Change
1990 NA NA 2,854,317 - 1991 NA NA 2,515,293 (11.9%) 1992 NA NA 2,626,572 4.2% 1993 NA NA 2,604,980 (0.8%) 1994 NA NA 3,108,734 19.3% 1995 NA NA 3,040,868 (2.2%) 1996 NA NA 2,974,850 (2.2%) 19972 NA NA 2,774,268 (6.7%) 1998 NA NA 2,850,367 2.7% 1999 NA NA 2,974,045 4.3% 2000 NA NA 3,019,086 1.5% 2001 NA NA 2,896,638 (4.1%) 2002 NA NA 2,670,594 (7.8%) 20033 1,300,272 1,275,627 2,575,899 (3.6%) 2004 1,373,861 1,366,511 2,740,372 6.4% 2005 NA NA NA NA 2006 NA NA NA NA 20074 1,412,055 -- 2,524,079 -- 20085 2,212,111 -- 3,647,394 56.7% 20095 2,329,370 -- 3,750,549 5.3% 20105 2,270,241 -- 3,629,193 (2.5%) 2011 2,277,311 NA NA 0.3% 2012 2,442,085 NA NA 7.2% 2013 2,597,306 NA NA 6.3% 2014 2,378,965 NA NA (8.4%)6 2015 2,122,597 NA NA (10.8%)6 2016 2,240,744 NA NA 5.6%
Source: MBTA. Note: Total Turnstile count figures include both Logan Airport bound (turnstile exits) and non-Logan Airport bound (turnstile
entrances) passengers. NA Data not available 1 As stated in the Logan Airport 1999 ESPR, Massport believes that ridership estimates through 2005 from the old Airport
Station were understated because many travelers that were destined for the Airport with baggage had been observed to avoid the turnstiles and exit the old Airport Station via the wide gate (designed for handicapped access) that did not have the capability to count passengers.
2 Airport Station was closed on six weekends during September and October 1997 due to construction. 3 Airport Station was closed on eight weekend days during 2003. 4 Automated fare collection and new fare gates implemented beginning January 2007. Station access to Bremen Street Park
opened June 2007. Exits are undercounted. 5 Exits are undercounted, as some exits occur through exit doors rather than turnstiles. 6 Due to the closure of Government Center Station in 2014, it is possible that passengers who would normally take the Blue
Line to the Green Line switched to alternate modes for their trips.
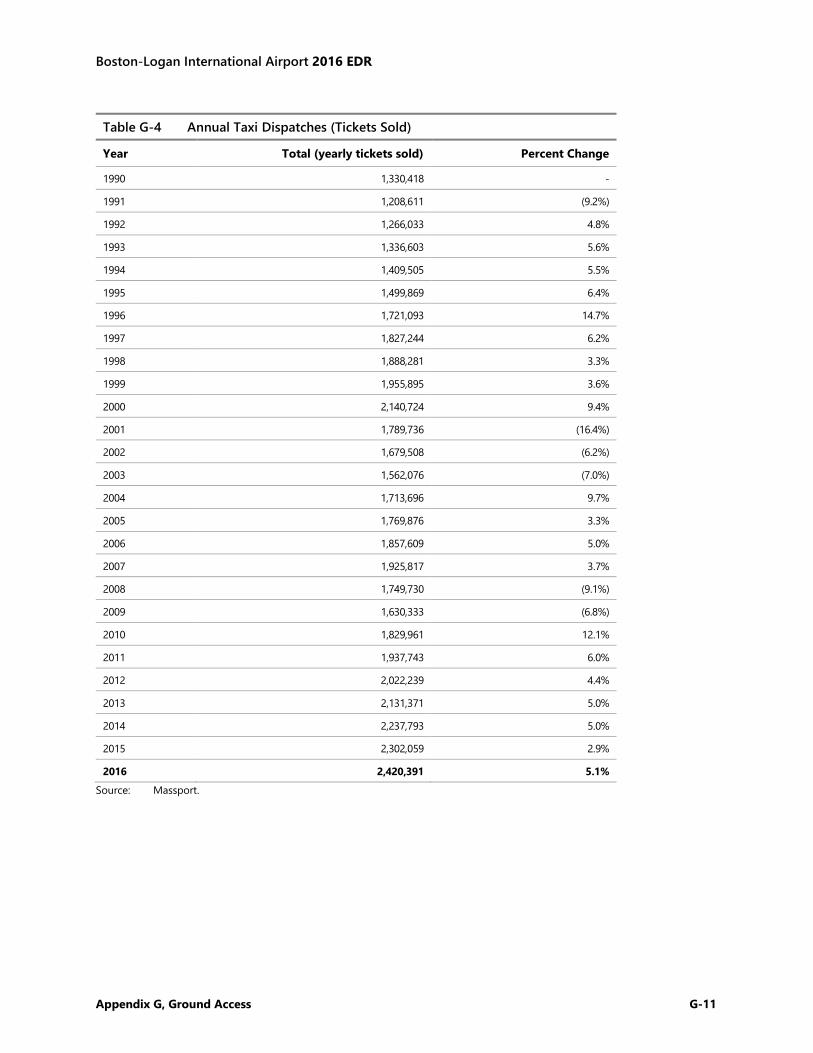
Boston-Logan International Airport 2016 EDR
Appendix G, Ground Access G-11
Table G-4 Annual Taxi Dispatches (Tickets Sold)
Year Total (yearly tickets sold) Percent Change
1990 1,330,418 - 1991 1,208,611 (9.2%) 1992 1,266,033 4.8% 1993 1,336,603 5.6% 1994 1,409,505 5.5% 1995 1,499,869 6.4% 1996 1,721,093 14.7% 1997 1,827,244 6.2% 1998 1,888,281 3.3% 1999 1,955,895 3.6% 2000 2,140,724 9.4% 2001 1,789,736 (16.4%) 2002 1,679,508 (6.2%) 2003 1,562,076 (7.0%) 2004 1,713,696 9.7% 2005 1,769,876 3.3% 2006 1,857,609 5.0% 2007 1,925,817 3.7% 2008 1,749,730 (9.1%) 2009 1,630,333 (6.8%) 2010 1,829,961 12.1% 2011 1,937,743 6.0% 2012 2,022,239 4.4% 2013 2,131,371 5.0% 2014 2,237,793 5.0% 2015 2,302,059 2.9% 2016 2,420,391 5.1%
Source: Massport.
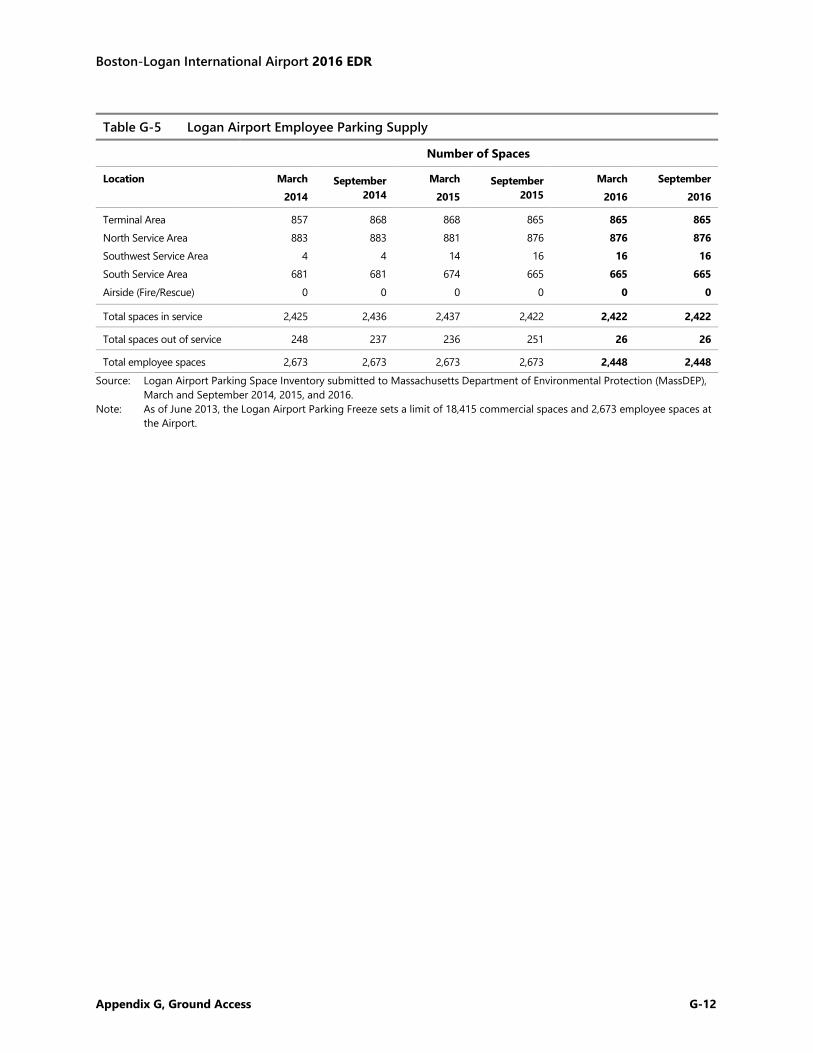
Boston-Logan International Airport 2016 EDR
Appendix G, Ground Access G-12
Table G-5 Logan Airport Employee Parking Supply
Number of Spaces
Location March 2014
September 2014
March 2015
September 2015
March 2016
September 2016
Terminal Area North Service Area Southwest Service Area South Service Area Airside (Fire/Rescue)
857 883
4 681
0
868 883
4 681
0
868 881 14
674 0
865 876 16
665 0
865 876
16 665
0
865 876
16 665
0
Total spaces in service 2,425 2,436 2,437 2,422 2,422 2,422
Total spaces out of service 248 237 236 251 26 26
Total employee spaces 2,673 2,673 2,673 2,673 2,448 2,448 Source: Logan Airport Parking Space Inventory submitted to Massachusetts Department of Environmental Protection (MassDEP),
March and September 2014, 2015, and 2016. Note: As of June 2013, the Logan Airport Parking Freeze sets a limit of 18,415 commercial spaces and 2,673 employee spaces at
the Airport.
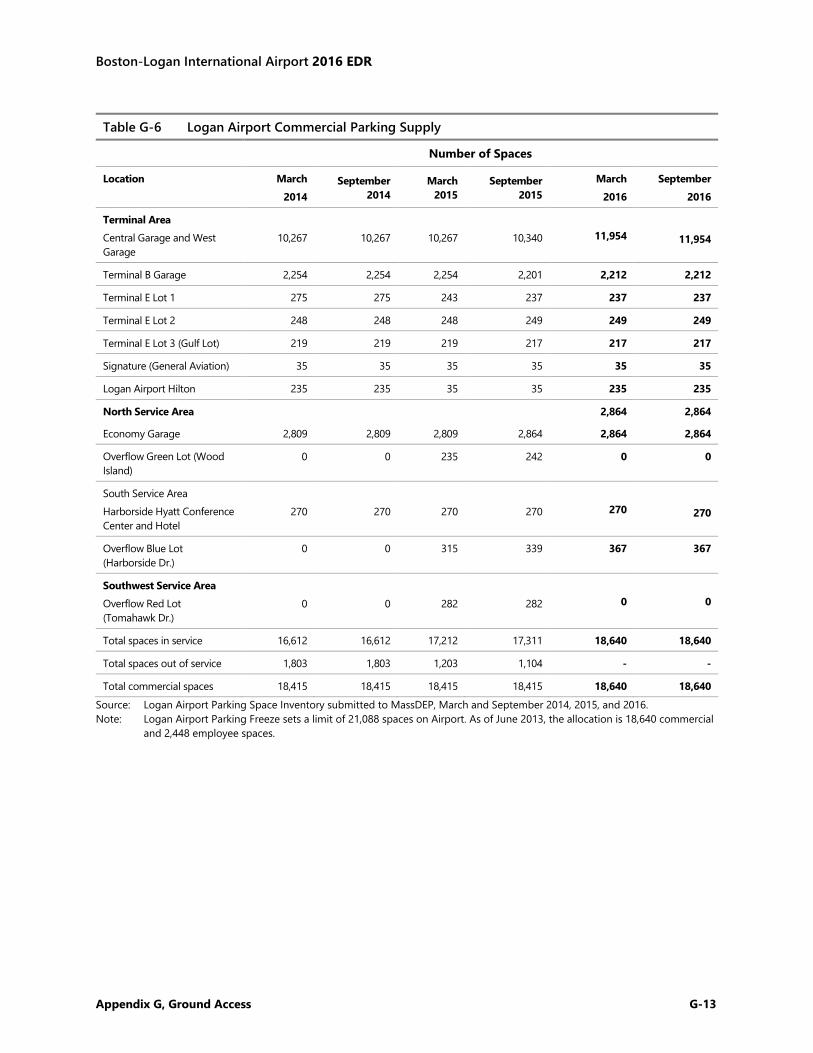
Boston-Logan International Airport 2016 EDR
Appendix G, Ground Access G-13
Table G-6 Logan Airport Commercial Parking Supply
Number of Spaces
Location March 2014
September 2014
March 2015
September 2015
March 2016
September 2016
Terminal Area Central Garage and West Garage
10,267
10,267
10,267
10,340 11,954
11,954
Terminal B Garage 2,254 2,254 2,254 2,201 2,212 2,212
Terminal E Lot 1 275 275 243 237 237 237
Terminal E Lot 2 248 248 248 249 249 249
Terminal E Lot 3 (Gulf Lot) 219 219 219 217 217 217
Signature (General Aviation) 35 35 35 35 35 35
Logan Airport Hilton 235 235 35 35 235 235
North Service Area 2,864 2,864
Economy Garage 2,809 2,809 2,809 2,864 2,864 2,864
Overflow Green Lot (Wood Island)
0 0 235 242 0 0
South Service Area Harborside Hyatt Conference Center and Hotel
270
270
270
270 270
270
Overflow Blue Lot (Harborside Dr.)
0 0 315 339 367 367
Southwest Service Area Overflow Red Lot (Tomahawk Dr.)
0
0
282
282 0 0
Total spaces in service 16,612 16,612 17,212 17,311 18,640 18,640
Total spaces out of service 1,803 1,803 1,203 1,104 - -
Total commercial spaces 18,415 18,415 18,415 18,415 18,640 18,640 Source: Logan Airport Parking Space Inventory submitted to MassDEP, March and September 2014, 2015, and 2016. Note: Logan Airport Parking Freeze sets a limit of 21,088 spaces on Airport. As of June 2013, the allocation is 18,640 commercial
and 2,448 employee spaces.
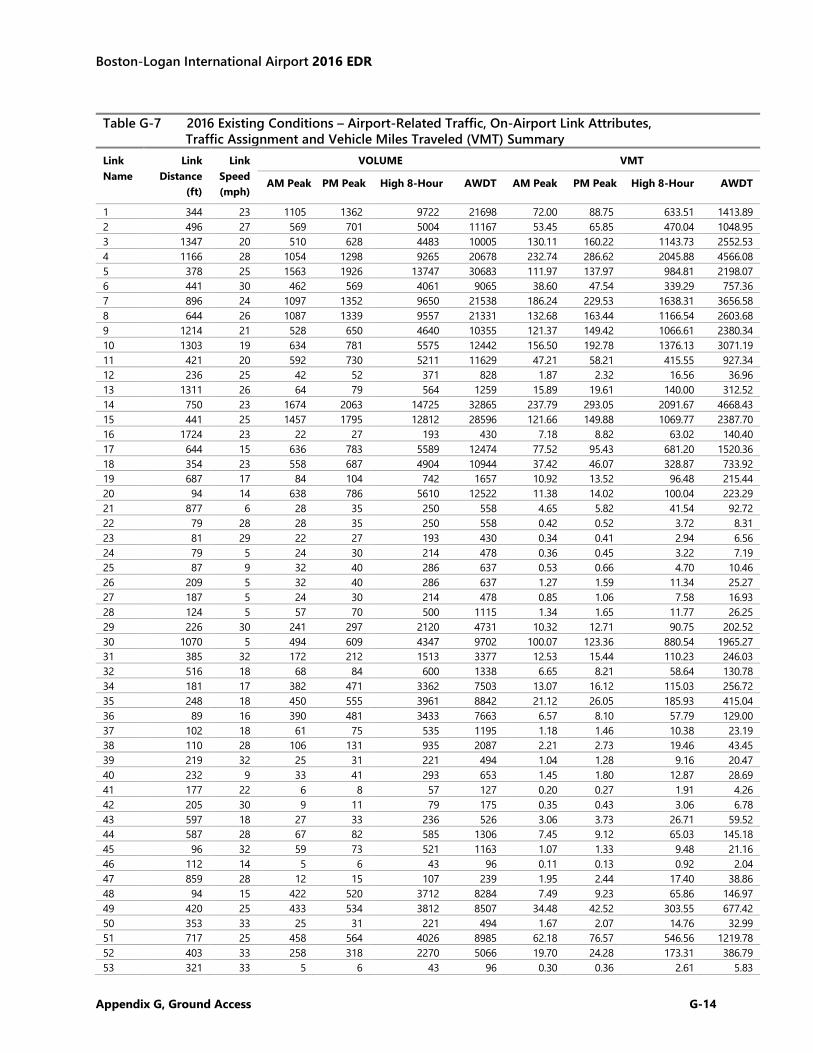
Boston-Logan International Airport 2016 EDR
Appendix G, Ground Access G-14
Table G-7 2016 Existing Conditions – Airport-Related Traffic, On-Airport Link Attributes, Traffic Assignment and Vehicle Miles Traveled (VMT) Summary
Link Name
Link Distance
(ft)
Link Speed (mph)
VOLUME VMT
AM Peak PM Peak High 8-Hour AWDT AM Peak PM Peak High 8-Hour AWDT
1 344 23 1105 1362 9722 21698 72.00 88.75 633.51 1413.89 2 496 27 569 701 5004 11167 53.45 65.85 470.04 1048.95 3 1347 20 510 628 4483 10005 130.11 160.22 1143.73 2552.53 4 1166 28 1054 1298 9265 20678 232.74 286.62 2045.88 4566.08 5 378 25 1563 1926 13747 30683 111.97 137.97 984.81 2198.07 6 441 30 462 569 4061 9065 38.60 47.54 339.29 757.36 7 896 24 1097 1352 9650 21538 186.24 229.53 1638.31 3656.58 8 644 26 1087 1339 9557 21331 132.68 163.44 1166.54 2603.68 9 1214 21 528 650 4640 10355 121.37 149.42 1066.61 2380.34 10 1303 19 634 781 5575 12442 156.50 192.78 1376.13 3071.19 11 421 20 592 730 5211 11629 47.21 58.21 415.55 927.34 12 236 25 42 52 371 828 1.87 2.32 16.56 36.96 13 1311 26 64 79 564 1259 15.89 19.61 140.00 312.52 14 750 23 1674 2063 14725 32865 237.79 293.05 2091.67 4668.43 15 441 25 1457 1795 12812 28596 121.66 149.88 1069.77 2387.70 16 1724 23 22 27 193 430 7.18 8.82 63.02 140.40 17 644 15 636 783 5589 12474 77.52 95.43 681.20 1520.36 18 354 23 558 687 4904 10944 37.42 46.07 328.87 733.92 19 687 17 84 104 742 1657 10.92 13.52 96.48 215.44 20 94 14 638 786 5610 12522 11.38 14.02 100.04 223.29 21 877 6 28 35 250 558 4.65 5.82 41.54 92.72 22 79 28 28 35 250 558 0.42 0.52 3.72 8.31 23 81 29 22 27 193 430 0.34 0.41 2.94 6.56 24 79 5 24 30 214 478 0.36 0.45 3.22 7.19 25 87 9 32 40 286 637 0.53 0.66 4.70 10.46 26 209 5 32 40 286 637 1.27 1.59 11.34 25.27 27 187 5 24 30 214 478 0.85 1.06 7.58 16.93 28 124 5 57 70 500 1115 1.34 1.65 11.77 26.25 29 226 30 241 297 2120 4731 10.32 12.71 90.75 202.52 30 1070 5 494 609 4347 9702 100.07 123.36 880.54 1965.27 31 385 32 172 212 1513 3377 12.53 15.44 110.23 246.03 32 516 18 68 84 600 1338 6.65 8.21 58.64 130.78 34 181 17 382 471 3362 7503 13.07 16.12 115.03 256.72 35 248 18 450 555 3961 8842 21.12 26.05 185.93 415.04 36 89 16 390 481 3433 7663 6.57 8.10 57.79 129.00 37 102 18 61 75 535 1195 1.18 1.46 10.38 23.19 38 110 28 106 131 935 2087 2.21 2.73 19.46 43.45 39 219 32 25 31 221 494 1.04 1.28 9.16 20.47 40 232 9 33 41 293 653 1.45 1.80 12.87 28.69 41 177 22 6 8 57 127 0.20 0.27 1.91 4.26 42 205 30 9 11 79 175 0.35 0.43 3.06 6.78 43 597 18 27 33 236 526 3.06 3.73 26.71 59.52 44 587 28 67 82 585 1306 7.45 9.12 65.03 145.18 45 96 32 59 73 521 1163 1.07 1.33 9.48 21.16 46 112 14 5 6 43 96 0.11 0.13 0.92 2.04 47 859 28 12 15 107 239 1.95 2.44 17.40 38.86 48 94 15 422 520 3712 8284 7.49 9.23 65.86 146.97 49 420 25 433 534 3812 8507 34.48 42.52 303.55 677.42 50 353 33 25 31 221 494 1.67 2.07 14.76 32.99 51 717 25 458 564 4026 8985 62.18 76.57 546.56 1219.78 52 403 33 258 318 2270 5066 19.70 24.28 173.31 386.79 53 321 33 5 6 43 96 0.30 0.36 2.61 5.83
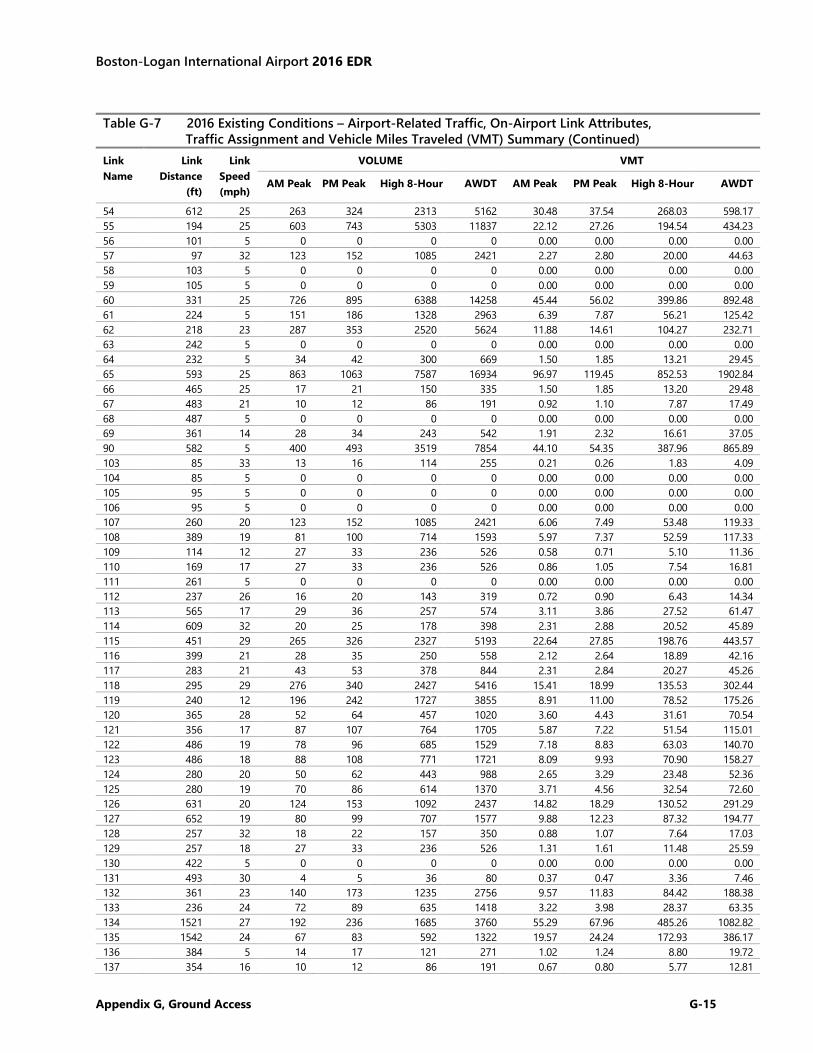
Boston-Logan International Airport 2016 EDR
Appendix G, Ground Access G-15
Table G-7 2016 Existing Conditions – Airport-Related Traffic, On-Airport Link Attributes, Traffic Assignment and Vehicle Miles Traveled (VMT) Summary (Continued)
Link Name
Link Distance
(ft)
Link Speed (mph)
VOLUME VMT
AM Peak PM Peak High 8-Hour AWDT AM Peak PM Peak High 8-Hour AWDT
54 612 25 263 324 2313 5162 30.48 37.54 268.03 598.17 55 194 25 603 743 5303 11837 22.12 27.26 194.54 434.23 56 101 5 0 0 0 0 0.00 0.00 0.00 0.00 57 97 32 123 152 1085 2421 2.27 2.80 20.00 44.63 58 103 5 0 0 0 0 0.00 0.00 0.00 0.00 59 105 5 0 0 0 0 0.00 0.00 0.00 0.00 60 331 25 726 895 6388 14258 45.44 56.02 399.86 892.48 61 224 5 151 186 1328 2963 6.39 7.87 56.21 125.42 62 218 23 287 353 2520 5624 11.88 14.61 104.27 232.71 63 242 5 0 0 0 0 0.00 0.00 0.00 0.00 64 232 5 34 42 300 669 1.50 1.85 13.21 29.45 65 593 25 863 1063 7587 16934 96.97 119.45 852.53 1902.84 66 465 25 17 21 150 335 1.50 1.85 13.20 29.48 67 483 21 10 12 86 191 0.92 1.10 7.87 17.49 68 487 5 0 0 0 0 0.00 0.00 0.00 0.00 69 361 14 28 34 243 542 1.91 2.32 16.61 37.05 90 582 5 400 493 3519 7854 44.10 54.35 387.96 865.89 103 85 33 13 16 114 255 0.21 0.26 1.83 4.09 104 85 5 0 0 0 0 0.00 0.00 0.00 0.00 105 95 5 0 0 0 0 0.00 0.00 0.00 0.00 106 95 5 0 0 0 0 0.00 0.00 0.00 0.00 107 260 20 123 152 1085 2421 6.06 7.49 53.48 119.33 108 389 19 81 100 714 1593 5.97 7.37 52.59 117.33 109 114 12 27 33 236 526 0.58 0.71 5.10 11.36 110 169 17 27 33 236 526 0.86 1.05 7.54 16.81 111 261 5 0 0 0 0 0.00 0.00 0.00 0.00 112 237 26 16 20 143 319 0.72 0.90 6.43 14.34 113 565 17 29 36 257 574 3.11 3.86 27.52 61.47 114 609 32 20 25 178 398 2.31 2.88 20.52 45.89 115 451 29 265 326 2327 5193 22.64 27.85 198.76 443.57 116 399 21 28 35 250 558 2.12 2.64 18.89 42.16 117 283 21 43 53 378 844 2.31 2.84 20.27 45.26 118 295 29 276 340 2427 5416 15.41 18.99 135.53 302.44 119 240 12 196 242 1727 3855 8.91 11.00 78.52 175.26 120 365 28 52 64 457 1020 3.60 4.43 31.61 70.54 121 356 17 87 107 764 1705 5.87 7.22 51.54 115.01 122 486 19 78 96 685 1529 7.18 8.83 63.03 140.70 123 486 18 88 108 771 1721 8.09 9.93 70.90 158.27 124 280 20 50 62 443 988 2.65 3.29 23.48 52.36 125 280 19 70 86 614 1370 3.71 4.56 32.54 72.60 126 631 20 124 153 1092 2437 14.82 18.29 130.52 291.29 127 652 19 80 99 707 1577 9.88 12.23 87.32 194.77 128 257 32 18 22 157 350 0.88 1.07 7.64 17.03 129 257 18 27 33 236 526 1.31 1.61 11.48 25.59 130 422 5 0 0 0 0 0.00 0.00 0.00 0.00 131 493 30 4 5 36 80 0.37 0.47 3.36 7.46 132 361 23 140 173 1235 2756 9.57 11.83 84.42 188.38 133 236 24 72 89 635 1418 3.22 3.98 28.37 63.35 134 1521 27 192 236 1685 3760 55.29 67.96 485.26 1082.82 135 1542 24 67 83 592 1322 19.57 24.24 172.93 386.17 136 384 5 14 17 121 271 1.02 1.24 8.80 19.72 137 354 16 10 12 86 191 0.67 0.80 5.77 12.81
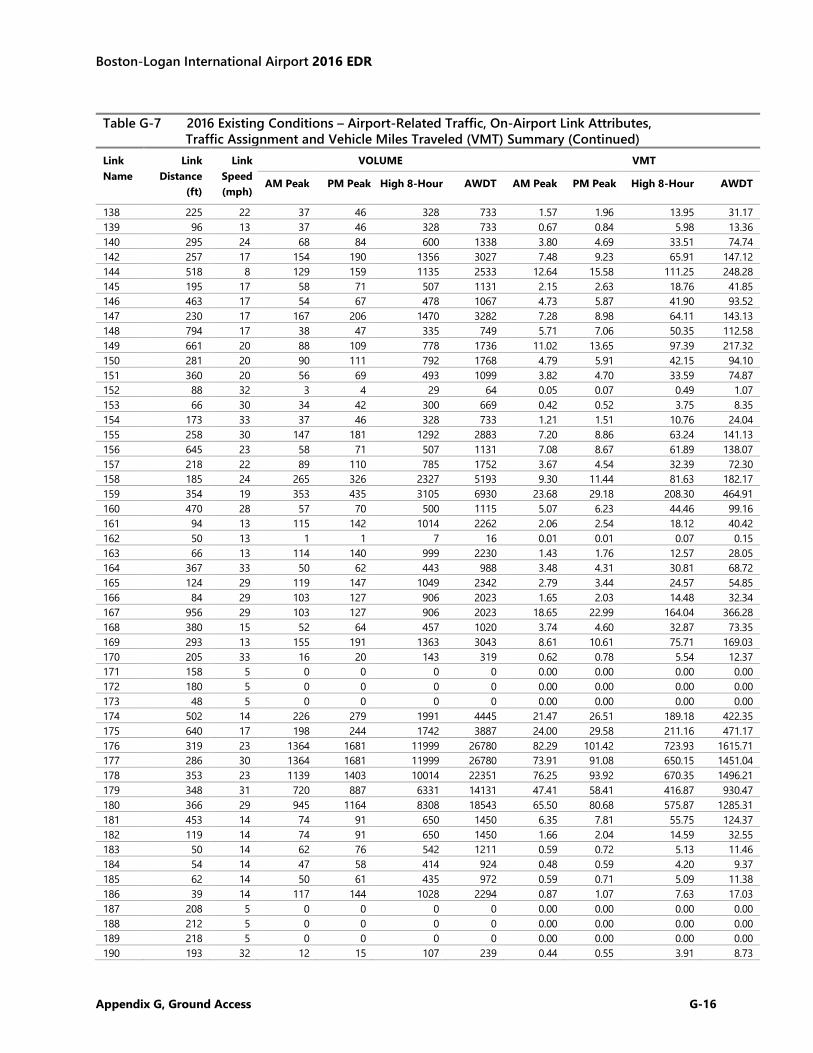
Boston-Logan International Airport 2016 EDR
Appendix G, Ground Access G-16
Table G-7 2016 Existing Conditions – Airport-Related Traffic, On-Airport Link Attributes, Traffic Assignment and Vehicle Miles Traveled (VMT) Summary (Continued)
Link Name
Link Distance
(ft)
Link Speed (mph)
VOLUME VMT
AM Peak PM Peak High 8-Hour AWDT AM Peak PM Peak High 8-Hour AWDT
138 225 22 37 46 328 733 1.57 1.96 13.95 31.17 139 96 13 37 46 328 733 0.67 0.84 5.98 13.36 140 295 24 68 84 600 1338 3.80 4.69 33.51 74.74 142 257 17 154 190 1356 3027 7.48 9.23 65.91 147.12 144 518 8 129 159 1135 2533 12.64 15.58 111.25 248.28 145 195 17 58 71 507 1131 2.15 2.63 18.76 41.85 146 463 17 54 67 478 1067 4.73 5.87 41.90 93.52 147 230 17 167 206 1470 3282 7.28 8.98 64.11 143.13 148 794 17 38 47 335 749 5.71 7.06 50.35 112.58 149 661 20 88 109 778 1736 11.02 13.65 97.39 217.32 150 281 20 90 111 792 1768 4.79 5.91 42.15 94.10 151 360 20 56 69 493 1099 3.82 4.70 33.59 74.87 152 88 32 3 4 29 64 0.05 0.07 0.49 1.07 153 66 30 34 42 300 669 0.42 0.52 3.75 8.35 154 173 33 37 46 328 733 1.21 1.51 10.76 24.04 155 258 30 147 181 1292 2883 7.20 8.86 63.24 141.13 156 645 23 58 71 507 1131 7.08 8.67 61.89 138.07 157 218 22 89 110 785 1752 3.67 4.54 32.39 72.30 158 185 24 265 326 2327 5193 9.30 11.44 81.63 182.17 159 354 19 353 435 3105 6930 23.68 29.18 208.30 464.91 160 470 28 57 70 500 1115 5.07 6.23 44.46 99.16 161 94 13 115 142 1014 2262 2.06 2.54 18.12 40.42 162 50 13 1 1 7 16 0.01 0.01 0.07 0.15 163 66 13 114 140 999 2230 1.43 1.76 12.57 28.05 164 367 33 50 62 443 988 3.48 4.31 30.81 68.72 165 124 29 119 147 1049 2342 2.79 3.44 24.57 54.85 166 84 29 103 127 906 2023 1.65 2.03 14.48 32.34 167 956 29 103 127 906 2023 18.65 22.99 164.04 366.28 168 380 15 52 64 457 1020 3.74 4.60 32.87 73.35 169 293 13 155 191 1363 3043 8.61 10.61 75.71 169.03 170 205 33 16 20 143 319 0.62 0.78 5.54 12.37 171 158 5 0 0 0 0 0.00 0.00 0.00 0.00 172 180 5 0 0 0 0 0.00 0.00 0.00 0.00 173 48 5 0 0 0 0 0.00 0.00 0.00 0.00 174 502 14 226 279 1991 4445 21.47 26.51 189.18 422.35 175 640 17 198 244 1742 3887 24.00 29.58 211.16 471.17 176 319 23 1364 1681 11999 26780 82.29 101.42 723.93 1615.71 177 286 30 1364 1681 11999 26780 73.91 91.08 650.15 1451.04 178 353 23 1139 1403 10014 22351 76.25 93.92 670.35 1496.21 179 348 31 720 887 6331 14131 47.41 58.41 416.87 930.47 180 366 29 945 1164 8308 18543 65.50 80.68 575.87 1285.31 181 453 14 74 91 650 1450 6.35 7.81 55.75 124.37 182 119 14 74 91 650 1450 1.66 2.04 14.59 32.55 183 50 14 62 76 542 1211 0.59 0.72 5.13 11.46 184 54 14 47 58 414 924 0.48 0.59 4.20 9.37 185 62 14 50 61 435 972 0.59 0.71 5.09 11.38 186 39 14 117 144 1028 2294 0.87 1.07 7.63 17.03 187 208 5 0 0 0 0 0.00 0.00 0.00 0.00 188 212 5 0 0 0 0 0.00 0.00 0.00 0.00 189 218 5 0 0 0 0 0.00 0.00 0.00 0.00 190 193 32 12 15 107 239 0.44 0.55 3.91 8.73
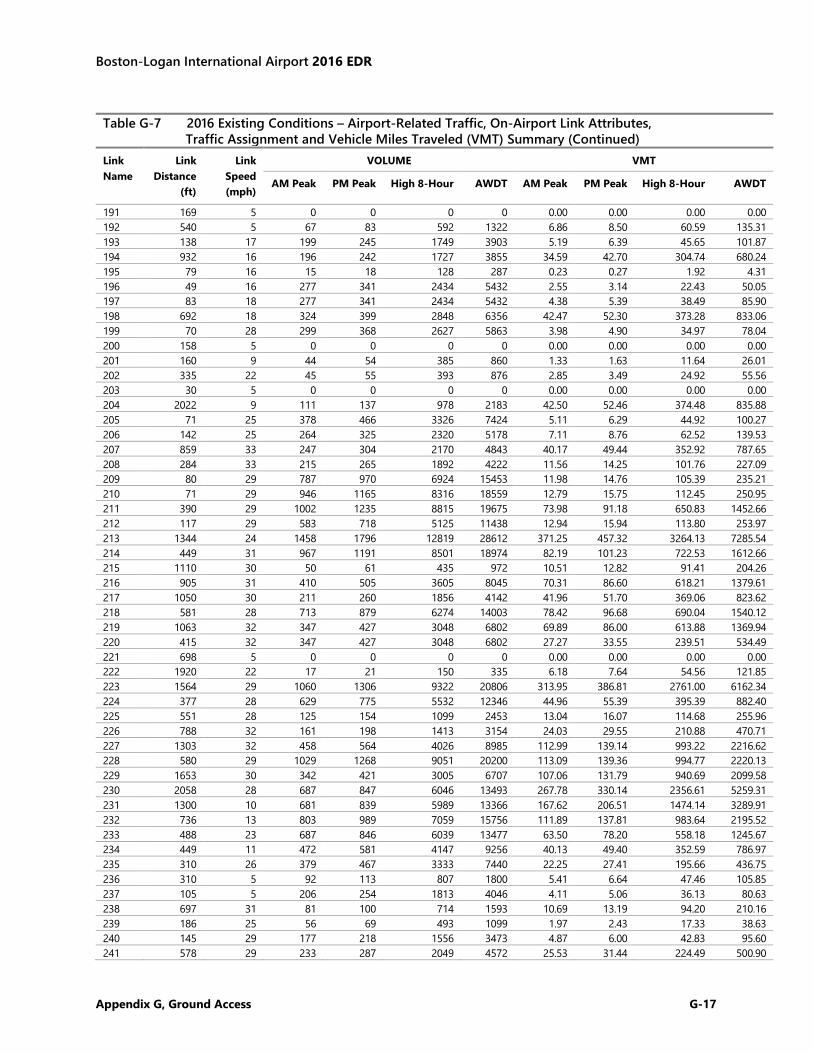
Boston-Logan International Airport 2016 EDR
Appendix G, Ground Access G-17
Table G-7 2016 Existing Conditions – Airport-Related Traffic, On-Airport Link Attributes, Traffic Assignment and Vehicle Miles Traveled (VMT) Summary (Continued)
Link Name
Link Distance
(ft)
Link Speed (mph)
VOLUME VMT
AM Peak PM Peak High 8-Hour AWDT AM Peak PM Peak High 8-Hour AWDT
191 169 5 0 0 0 0 0.00 0.00 0.00 0.00 192 540 5 67 83 592 1322 6.86 8.50 60.59 135.31 193 138 17 199 245 1749 3903 5.19 6.39 45.65 101.87 194 932 16 196 242 1727 3855 34.59 42.70 304.74 680.24 195 79 16 15 18 128 287 0.23 0.27 1.92 4.31 196 49 16 277 341 2434 5432 2.55 3.14 22.43 50.05 197 83 18 277 341 2434 5432 4.38 5.39 38.49 85.90 198 692 18 324 399 2848 6356 42.47 52.30 373.28 833.06 199 70 28 299 368 2627 5863 3.98 4.90 34.97 78.04 200 158 5 0 0 0 0 0.00 0.00 0.00 0.00 201 160 9 44 54 385 860 1.33 1.63 11.64 26.01 202 335 22 45 55 393 876 2.85 3.49 24.92 55.56 203 30 5 0 0 0 0 0.00 0.00 0.00 0.00 204 2022 9 111 137 978 2183 42.50 52.46 374.48 835.88 205 71 25 378 466 3326 7424 5.11 6.29 44.92 100.27 206 142 25 264 325 2320 5178 7.11 8.76 62.52 139.53 207 859 33 247 304 2170 4843 40.17 49.44 352.92 787.65 208 284 33 215 265 1892 4222 11.56 14.25 101.76 227.09 209 80 29 787 970 6924 15453 11.98 14.76 105.39 235.21 210 71 29 946 1165 8316 18559 12.79 15.75 112.45 250.95 211 390 29 1002 1235 8815 19675 73.98 91.18 650.83 1452.66 212 117 29 583 718 5125 11438 12.94 15.94 113.80 253.97 213 1344 24 1458 1796 12819 28612 371.25 457.32 3264.13 7285.54 214 449 31 967 1191 8501 18974 82.19 101.23 722.53 1612.66 215 1110 30 50 61 435 972 10.51 12.82 91.41 204.26 216 905 31 410 505 3605 8045 70.31 86.60 618.21 1379.61 217 1050 30 211 260 1856 4142 41.96 51.70 369.06 823.62 218 581 28 713 879 6274 14003 78.42 96.68 690.04 1540.12 219 1063 32 347 427 3048 6802 69.89 86.00 613.88 1369.94 220 415 32 347 427 3048 6802 27.27 33.55 239.51 534.49 221 698 5 0 0 0 0 0.00 0.00 0.00 0.00 222 1920 22 17 21 150 335 6.18 7.64 54.56 121.85 223 1564 29 1060 1306 9322 20806 313.95 386.81 2761.00 6162.34 224 377 28 629 775 5532 12346 44.96 55.39 395.39 882.40 225 551 28 125 154 1099 2453 13.04 16.07 114.68 255.96 226 788 32 161 198 1413 3154 24.03 29.55 210.88 470.71 227 1303 32 458 564 4026 8985 112.99 139.14 993.22 2216.62 228 580 29 1029 1268 9051 20200 113.09 139.36 994.77 2220.13 229 1653 30 342 421 3005 6707 107.06 131.79 940.69 2099.58 230 2058 28 687 847 6046 13493 267.78 330.14 2356.61 5259.31 231 1300 10 681 839 5989 13366 167.62 206.51 1474.14 3289.91 232 736 13 803 989 7059 15756 111.89 137.81 983.64 2195.52 233 488 23 687 846 6039 13477 63.50 78.20 558.18 1245.67 234 449 11 472 581 4147 9256 40.13 49.40 352.59 786.97 235 310 26 379 467 3333 7440 22.25 27.41 195.66 436.75 236 310 5 92 113 807 1800 5.41 6.64 47.46 105.85 237 105 5 206 254 1813 4046 4.11 5.06 36.13 80.63 238 697 31 81 100 714 1593 10.69 13.19 94.20 210.16 239 186 25 56 69 493 1099 1.97 2.43 17.33 38.63 240 145 29 177 218 1556 3473 4.87 6.00 42.83 95.60 241 578 29 233 287 2049 4572 25.53 31.44 224.49 500.90
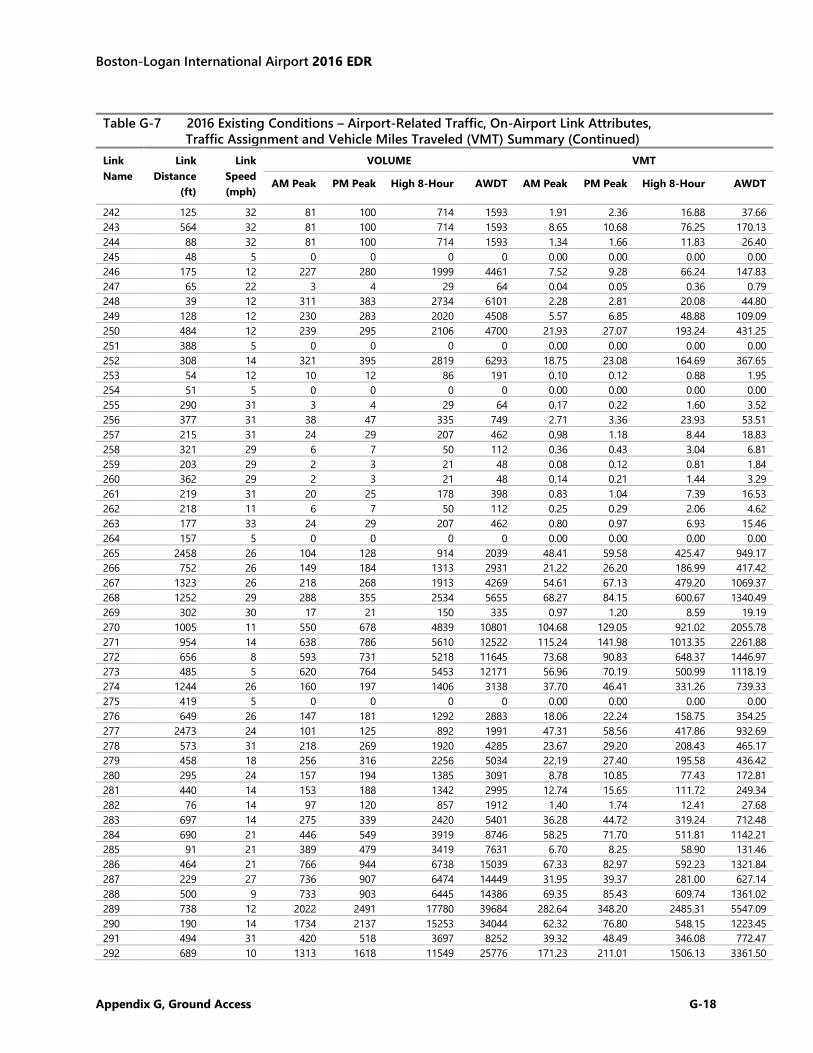
Boston-Logan International Airport 2016 EDR
Appendix G, Ground Access G-18
Table G-7 2016 Existing Conditions – Airport-Related Traffic, On-Airport Link Attributes, Traffic Assignment and Vehicle Miles Traveled (VMT) Summary (Continued)
Link Name
Link Distance
(ft)
Link Speed (mph)
VOLUME VMT
AM Peak PM Peak High 8-Hour AWDT AM Peak PM Peak High 8-Hour AWDT
242 125 32 81 100 714 1593 1.91 2.36 16.88 37.66 243 564 32 81 100 714 1593 8.65 10.68 76.25 170.13 244 88 32 81 100 714 1593 1.34 1.66 11.83 26.40 245 48 5 0 0 0 0 0.00 0.00 0.00 0.00 246 175 12 227 280 1999 4461 7.52 9.28 66.24 147.83 247 65 22 3 4 29 64 0.04 0.05 0.36 0.79 248 39 12 311 383 2734 6101 2.28 2.81 20.08 44.80 249 128 12 230 283 2020 4508 5.57 6.85 48.88 109.09 250 484 12 239 295 2106 4700 21.93 27.07 193.24 431.25 251 388 5 0 0 0 0 0.00 0.00 0.00 0.00 252 308 14 321 395 2819 6293 18.75 23.08 164.69 367.65 253 54 12 10 12 86 191 0.10 0.12 0.88 1.95 254 51 5 0 0 0 0 0.00 0.00 0.00 0.00 255 290 31 3 4 29 64 0.17 0.22 1.60 3.52 256 377 31 38 47 335 749 2.71 3.36 23.93 53.51 257 215 31 24 29 207 462 0.98 1.18 8.44 18.83 258 321 29 6 7 50 112 0.36 0.43 3.04 6.81 259 203 29 2 3 21 48 0.08 0.12 0.81 1.84 260 362 29 2 3 21 48 0.14 0.21 1.44 3.29 261 219 31 20 25 178 398 0.83 1.04 7.39 16.53 262 218 11 6 7 50 112 0.25 0.29 2.06 4.62 263 177 33 24 29 207 462 0.80 0.97 6.93 15.46 264 157 5 0 0 0 0 0.00 0.00 0.00 0.00 265 2458 26 104 128 914 2039 48.41 59.58 425.47 949.17 266 752 26 149 184 1313 2931 21.22 26.20 186.99 417.42 267 1323 26 218 268 1913 4269 54.61 67.13 479.20 1069.37 268 1252 29 288 355 2534 5655 68.27 84.15 600.67 1340.49 269 302 30 17 21 150 335 0.97 1.20 8.59 19.19 270 1005 11 550 678 4839 10801 104.68 129.05 921.02 2055.78 271 954 14 638 786 5610 12522 115.24 141.98 1013.35 2261.88 272 656 8 593 731 5218 11645 73.68 90.83 648.37 1446.97 273 485 5 620 764 5453 12171 56.96 70.19 500.99 1118.19 274 1244 26 160 197 1406 3138 37.70 46.41 331.26 739.33 275 419 5 0 0 0 0 0.00 0.00 0.00 0.00 276 649 26 147 181 1292 2883 18.06 22.24 158.75 354.25 277 2473 24 101 125 892 1991 47.31 58.56 417.86 932.69 278 573 31 218 269 1920 4285 23.67 29.20 208.43 465.17 279 458 18 256 316 2256 5034 22.19 27.40 195.58 436.42 280 295 24 157 194 1385 3091 8.78 10.85 77.43 172.81 281 440 14 153 188 1342 2995 12.74 15.65 111.72 249.34 282 76 14 97 120 857 1912 1.40 1.74 12.41 27.68 283 697 14 275 339 2420 5401 36.28 44.72 319.24 712.48 284 690 21 446 549 3919 8746 58.25 71.70 511.81 1142.21 285 91 21 389 479 3419 7631 6.70 8.25 58.90 131.46 286 464 21 766 944 6738 15039 67.33 82.97 592.23 1321.84 287 229 27 736 907 6474 14449 31.95 39.37 281.00 627.14 288 500 9 733 903 6445 14386 69.35 85.43 609.74 1361.02 289 738 12 2022 2491 17780 39684 282.64 348.20 2485.31 5547.09 290 190 14 1734 2137 15253 34044 62.32 76.80 548.15 1223.45 291 494 31 420 518 3697 8252 39.32 48.49 346.08 772.47 292 689 10 1313 1618 11549 25776 171.23 211.01 1506.13 3361.50
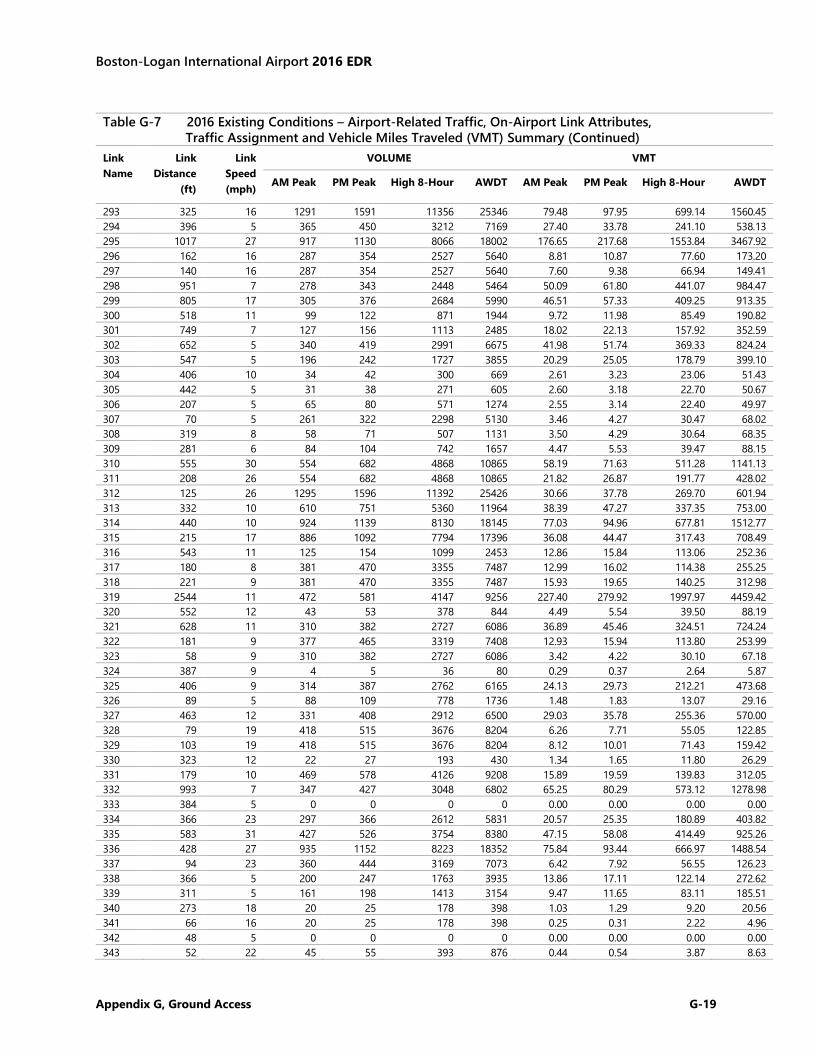
Boston-Logan International Airport 2016 EDR
Appendix G, Ground Access G-19
Table G-7 2016 Existing Conditions – Airport-Related Traffic, On-Airport Link Attributes, Traffic Assignment and Vehicle Miles Traveled (VMT) Summary (Continued)
Link Name
Link Distance
(ft)
Link Speed (mph)
VOLUME VMT
AM Peak PM Peak High 8-Hour AWDT AM Peak PM Peak High 8-Hour AWDT
293 325 16 1291 1591 11356 25346 79.48 97.95 699.14 1560.45 294 396 5 365 450 3212 7169 27.40 33.78 241.10 538.13 295 1017 27 917 1130 8066 18002 176.65 217.68 1553.84 3467.92 296 162 16 287 354 2527 5640 8.81 10.87 77.60 173.20 297 140 16 287 354 2527 5640 7.60 9.38 66.94 149.41 298 951 7 278 343 2448 5464 50.09 61.80 441.07 984.47 299 805 17 305 376 2684 5990 46.51 57.33 409.25 913.35 300 518 11 99 122 871 1944 9.72 11.98 85.49 190.82 301 749 7 127 156 1113 2485 18.02 22.13 157.92 352.59 302 652 5 340 419 2991 6675 41.98 51.74 369.33 824.24 303 547 5 196 242 1727 3855 20.29 25.05 178.79 399.10 304 406 10 34 42 300 669 2.61 3.23 23.06 51.43 305 442 5 31 38 271 605 2.60 3.18 22.70 50.67 306 207 5 65 80 571 1274 2.55 3.14 22.40 49.97 307 70 5 261 322 2298 5130 3.46 4.27 30.47 68.02 308 319 8 58 71 507 1131 3.50 4.29 30.64 68.35 309 281 6 84 104 742 1657 4.47 5.53 39.47 88.15 310 555 30 554 682 4868 10865 58.19 71.63 511.28 1141.13 311 208 26 554 682 4868 10865 21.82 26.87 191.77 428.02 312 125 26 1295 1596 11392 25426 30.66 37.78 269.70 601.94 313 332 10 610 751 5360 11964 38.39 47.27 337.35 753.00 314 440 10 924 1139 8130 18145 77.03 94.96 677.81 1512.77 315 215 17 886 1092 7794 17396 36.08 44.47 317.43 708.49 316 543 11 125 154 1099 2453 12.86 15.84 113.06 252.36 317 180 8 381 470 3355 7487 12.99 16.02 114.38 255.25 318 221 9 381 470 3355 7487 15.93 19.65 140.25 312.98 319 2544 11 472 581 4147 9256 227.40 279.92 1997.97 4459.42 320 552 12 43 53 378 844 4.49 5.54 39.50 88.19 321 628 11 310 382 2727 6086 36.89 45.46 324.51 724.24 322 181 9 377 465 3319 7408 12.93 15.94 113.80 253.99 323 58 9 310 382 2727 6086 3.42 4.22 30.10 67.18 324 387 9 4 5 36 80 0.29 0.37 2.64 5.87 325 406 9 314 387 2762 6165 24.13 29.73 212.21 473.68 326 89 5 88 109 778 1736 1.48 1.83 13.07 29.16 327 463 12 331 408 2912 6500 29.03 35.78 255.36 570.00 328 79 19 418 515 3676 8204 6.26 7.71 55.05 122.85 329 103 19 418 515 3676 8204 8.12 10.01 71.43 159.42 330 323 12 22 27 193 430 1.34 1.65 11.80 26.29 331 179 10 469 578 4126 9208 15.89 19.59 139.83 312.05 332 993 7 347 427 3048 6802 65.25 80.29 573.12 1278.98 333 384 5 0 0 0 0 0.00 0.00 0.00 0.00 334 366 23 297 366 2612 5831 20.57 25.35 180.89 403.82 335 583 31 427 526 3754 8380 47.15 58.08 414.49 925.26 336 428 27 935 1152 8223 18352 75.84 93.44 666.97 1488.54 337 94 23 360 444 3169 7073 6.42 7.92 56.55 126.23 338 366 5 200 247 1763 3935 13.86 17.11 122.14 272.62 339 311 5 161 198 1413 3154 9.47 11.65 83.11 185.51 340 273 18 20 25 178 398 1.03 1.29 9.20 20.56 341 66 16 20 25 178 398 0.25 0.31 2.22 4.96 342 48 5 0 0 0 0 0.00 0.00 0.00 0.00 343 52 22 45 55 393 876 0.44 0.54 3.87 8.63
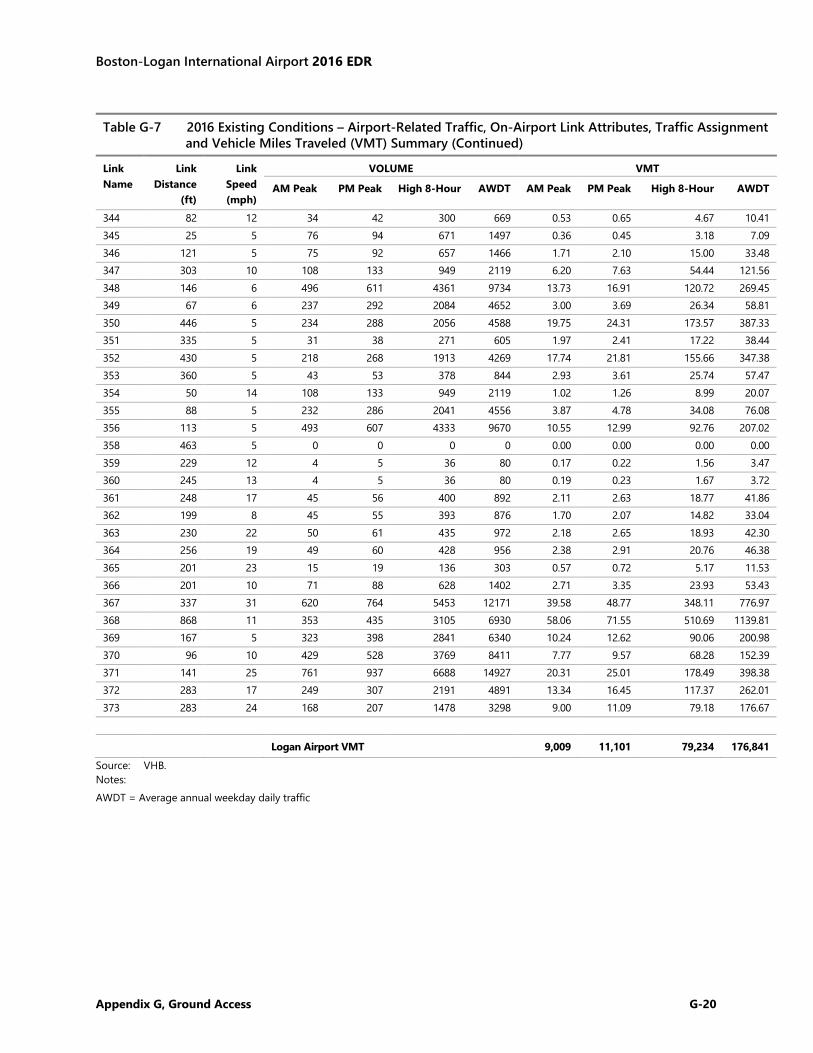
Boston-Logan International Airport 2016 EDR
Appendix G, Ground Access G-20
Table G-7 2016 Existing Conditions – Airport-Related Traffic, On-Airport Link Attributes, Traffic Assignment and Vehicle Miles Traveled (VMT) Summary (Continued)
Link Name
Link Distance
(ft)
Link Speed (mph)
VOLUME VMT
AM Peak PM Peak High 8-Hour AWDT AM Peak PM Peak High 8-Hour AWDT
344 82 12 34 42 300 669 0.53 0.65 4.67 10.41 345 25 5 76 94 671 1497 0.36 0.45 3.18 7.09 346 121 5 75 92 657 1466 1.71 2.10 15.00 33.48 347 303 10 108 133 949 2119 6.20 7.63 54.44 121.56 348 146 6 496 611 4361 9734 13.73 16.91 120.72 269.45 349 67 6 237 292 2084 4652 3.00 3.69 26.34 58.81 350 446 5 234 288 2056 4588 19.75 24.31 173.57 387.33 351 335 5 31 38 271 605 1.97 2.41 17.22 38.44 352 430 5 218 268 1913 4269 17.74 21.81 155.66 347.38 353 360 5 43 53 378 844 2.93 3.61 25.74 57.47 354 50 14 108 133 949 2119 1.02 1.26 8.99 20.07 355 88 5 232 286 2041 4556 3.87 4.78 34.08 76.08 356 113 5 493 607 4333 9670 10.55 12.99 92.76 207.02 358 463 5 0 0 0 0 0.00 0.00 0.00 0.00 359 229 12 4 5 36 80 0.17 0.22 1.56 3.47 360 245 13 4 5 36 80 0.19 0.23 1.67 3.72 361 248 17 45 56 400 892 2.11 2.63 18.77 41.86 362 199 8 45 55 393 876 1.70 2.07 14.82 33.04 363 230 22 50 61 435 972 2.18 2.65 18.93 42.30 364 256 19 49 60 428 956 2.38 2.91 20.76 46.38 365 201 23 15 19 136 303 0.57 0.72 5.17 11.53 366 201 10 71 88 628 1402 2.71 3.35 23.93 53.43 367 337 31 620 764 5453 12171 39.58 48.77 348.11 776.97 368 868 11 353 435 3105 6930 58.06 71.55 510.69 1139.81 369 167 5 323 398 2841 6340 10.24 12.62 90.06 200.98 370 96 10 429 528 3769 8411 7.77 9.57 68.28 152.39 371 141 25 761 937 6688 14927 20.31 25.01 178.49 398.38 372 283 17 249 307 2191 4891 13.34 16.45 117.37 262.01 373 283 24 168 207 1478 3298 9.00 11.09 79.18 176.67 Logan Airport VMT 9,009 11,101 79,234 176,841
Source: VHB. Notes: AWDT = Average annual weekday daily traffic
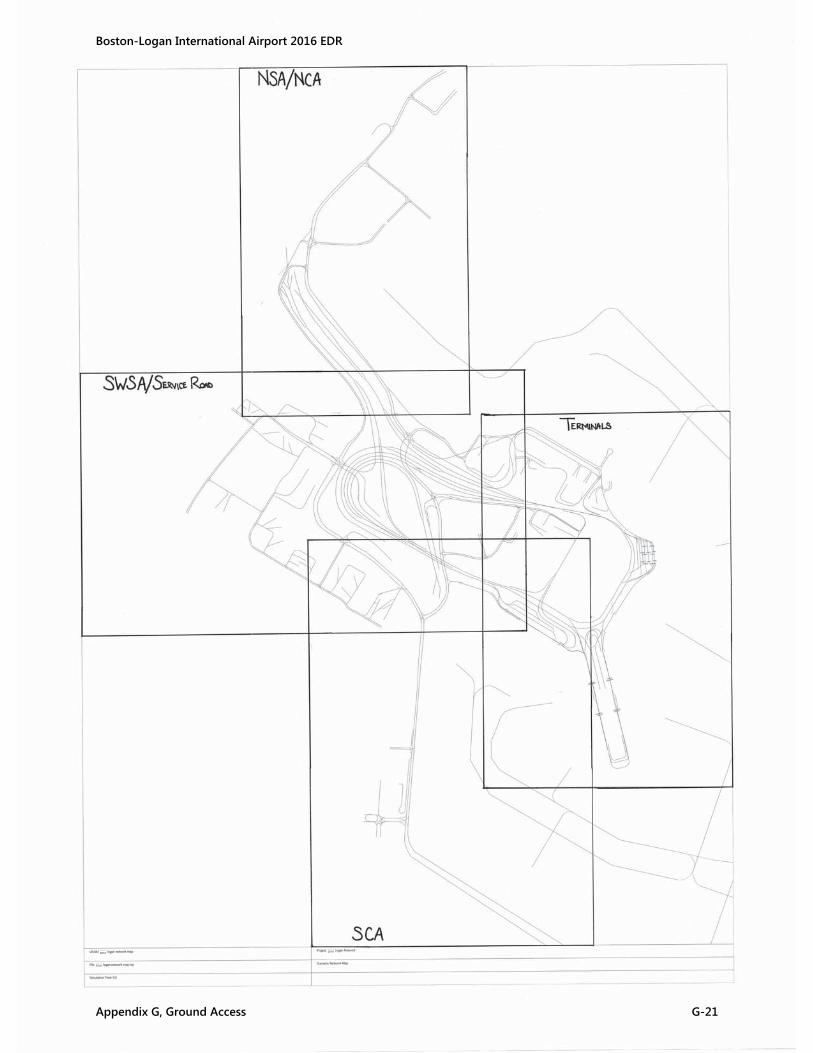
2016
2016
2016
Boston-Logan International Airport 2016 EDR
Appendix G, Ground Access G-21
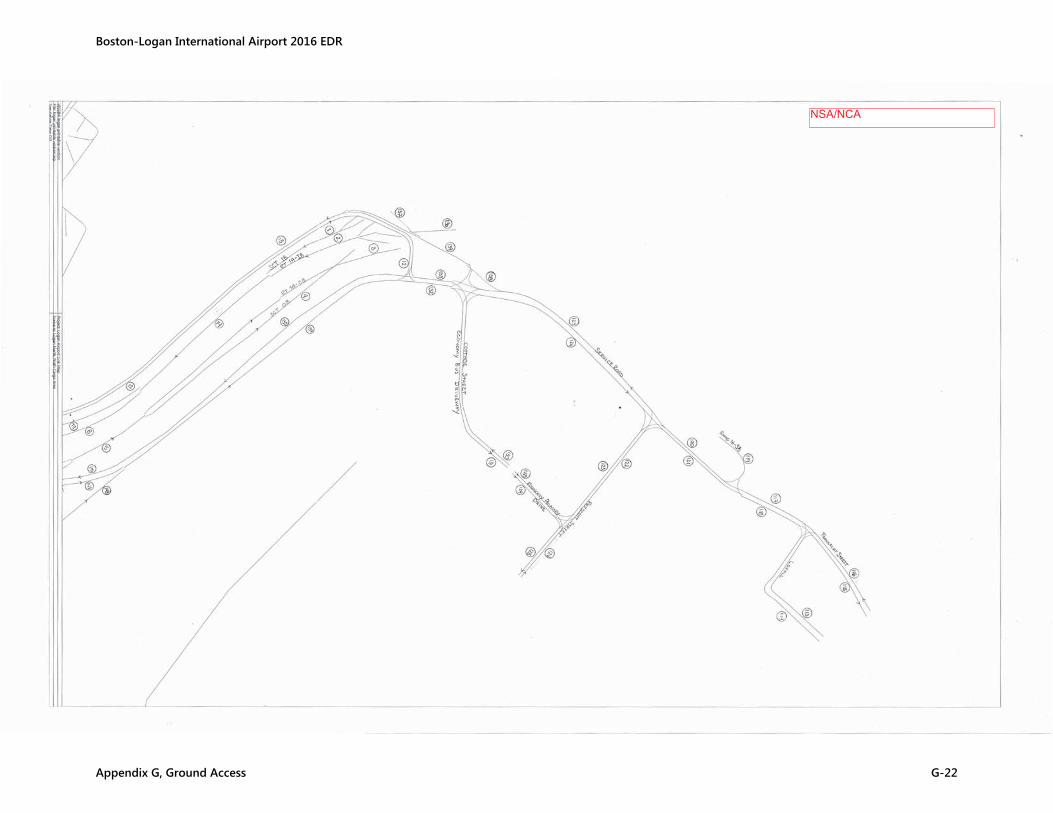
NSA/NCA
Boston-Logan International Airport 2016 EDR
Appendix G, Ground Access G-22
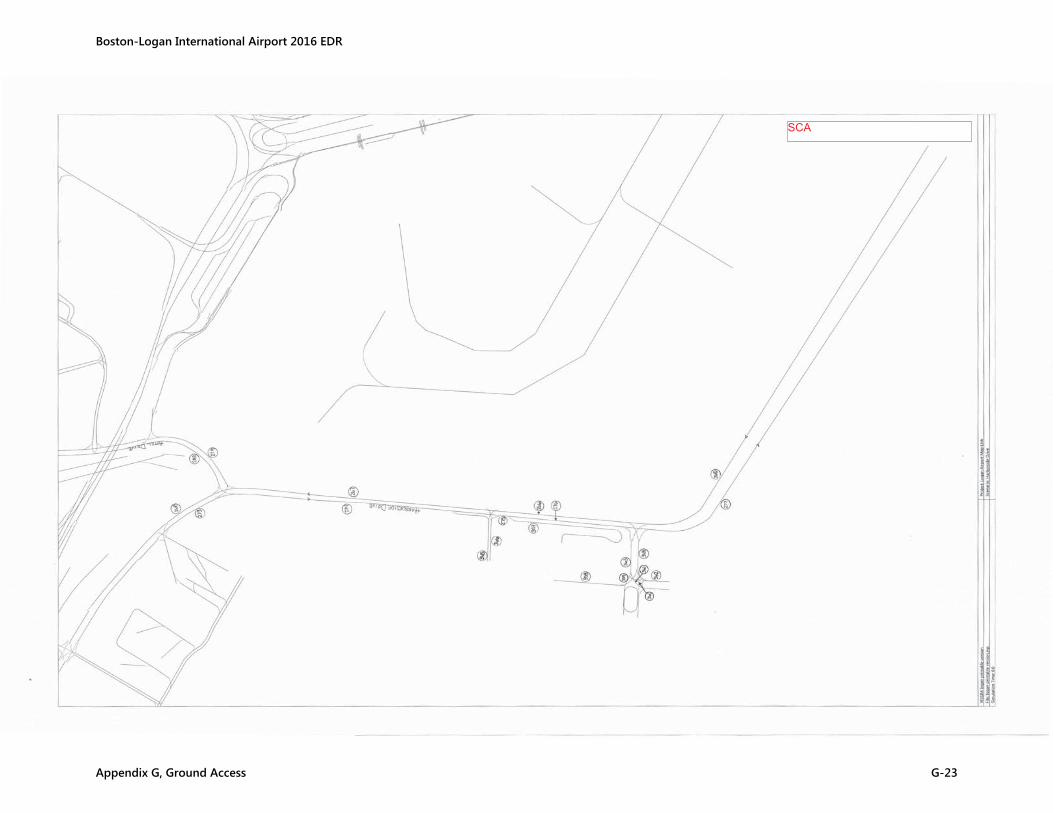
SCA
Boston-Logan International Airport 2016 EDR
Appendix G, Ground Access G-23
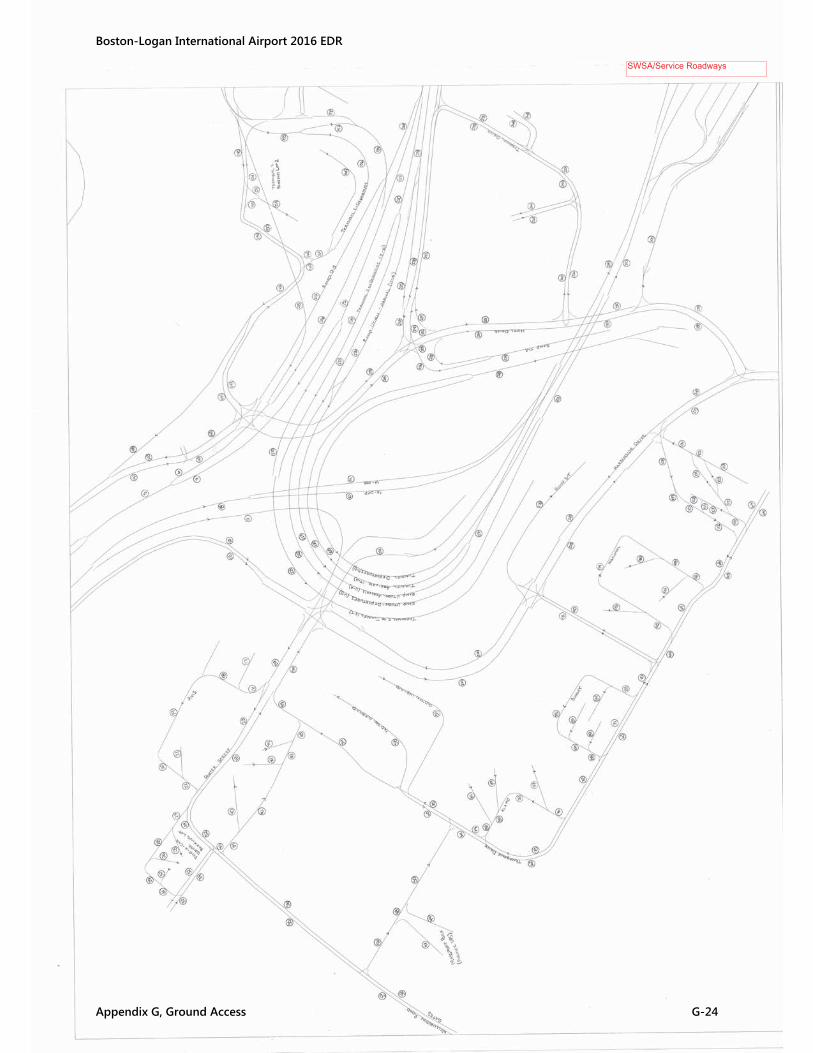
SWSA/Service Roadways
Boston-Logan International Airport 2016 EDR
Appendix G, Ground Access G-24

Terminals
Boston-Logan International Airport 2016 EDR
Appendix G, Ground Access G-25
Boston-Logan International Airport 2016 EDR
Appendix G, Ground Access G-26
Boston-Logan International Airport 2016 EDR
Appendix G, Ground Access G-27

Boston-Logan International Airport 2016 EDR
Appendix G, Ground Access G-28
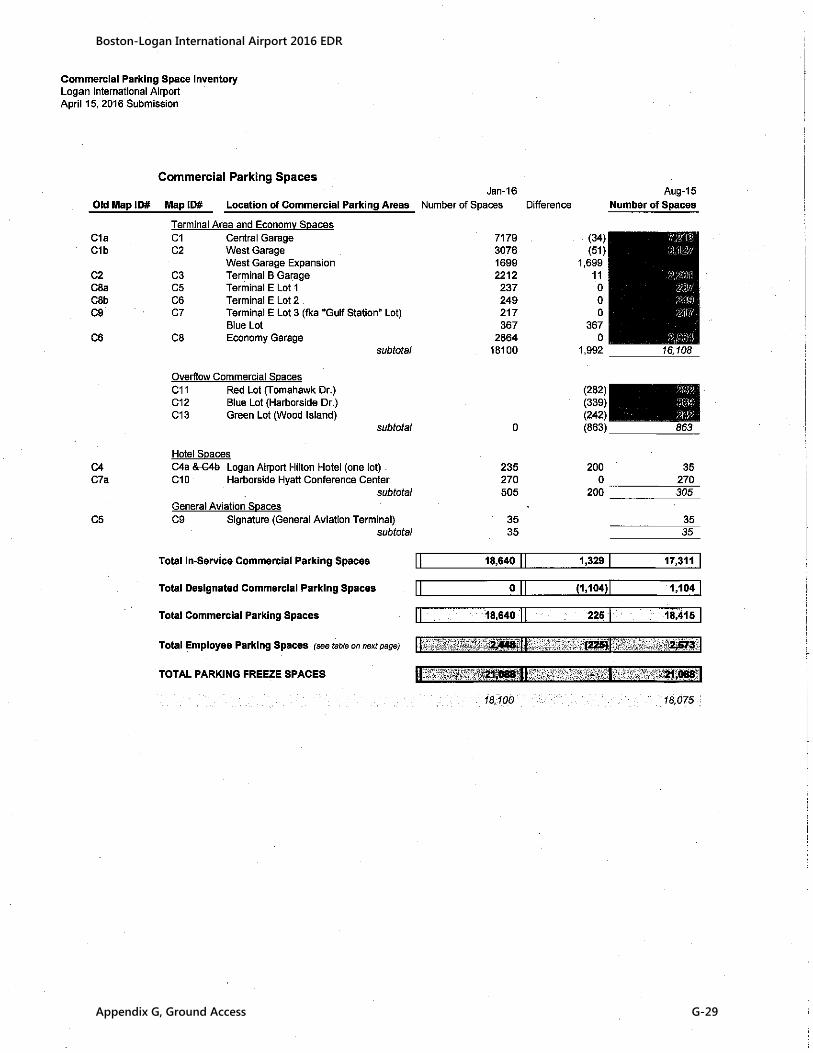
Boston-Logan International Airport 2016 EDR
Appendix G, Ground Access G-29
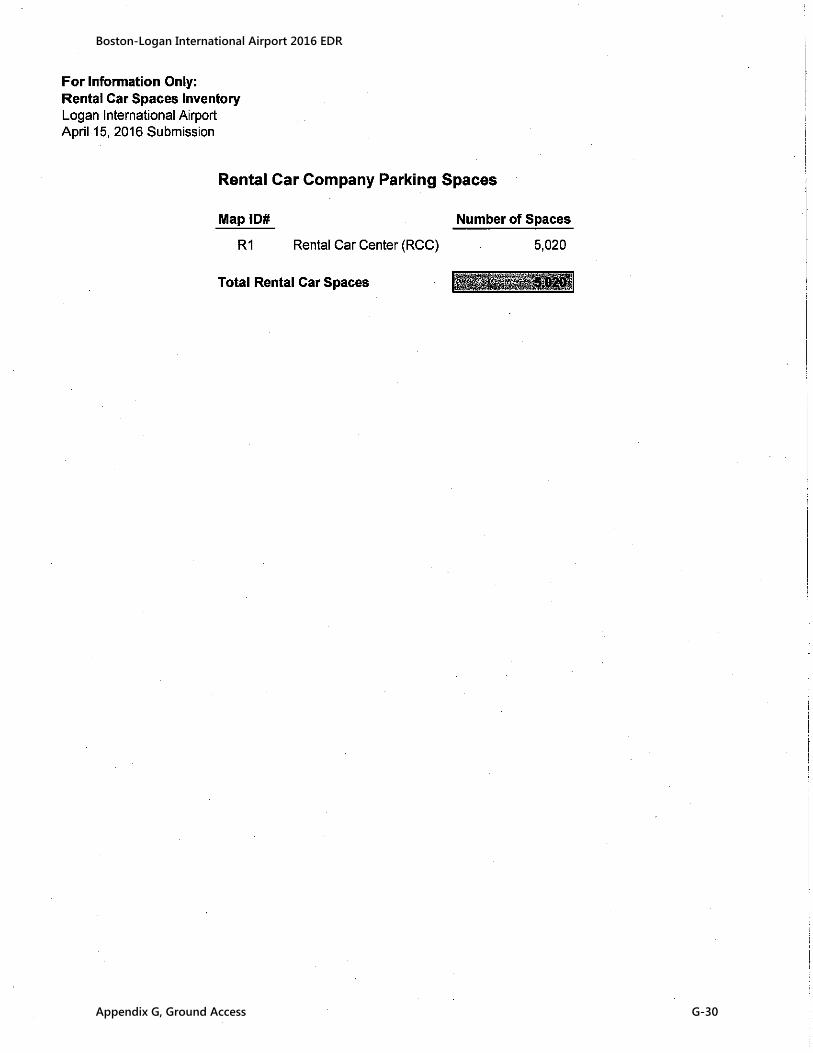
Boston-Logan International Airport 2016 EDR
Appendix G, Ground Access G-30
Boston-Logan International Airport 2016 EDR
Appendix G, Ground Access G-31

Boston-Logan International Airport 2016 EDR
Appendix G, Ground Access G-32
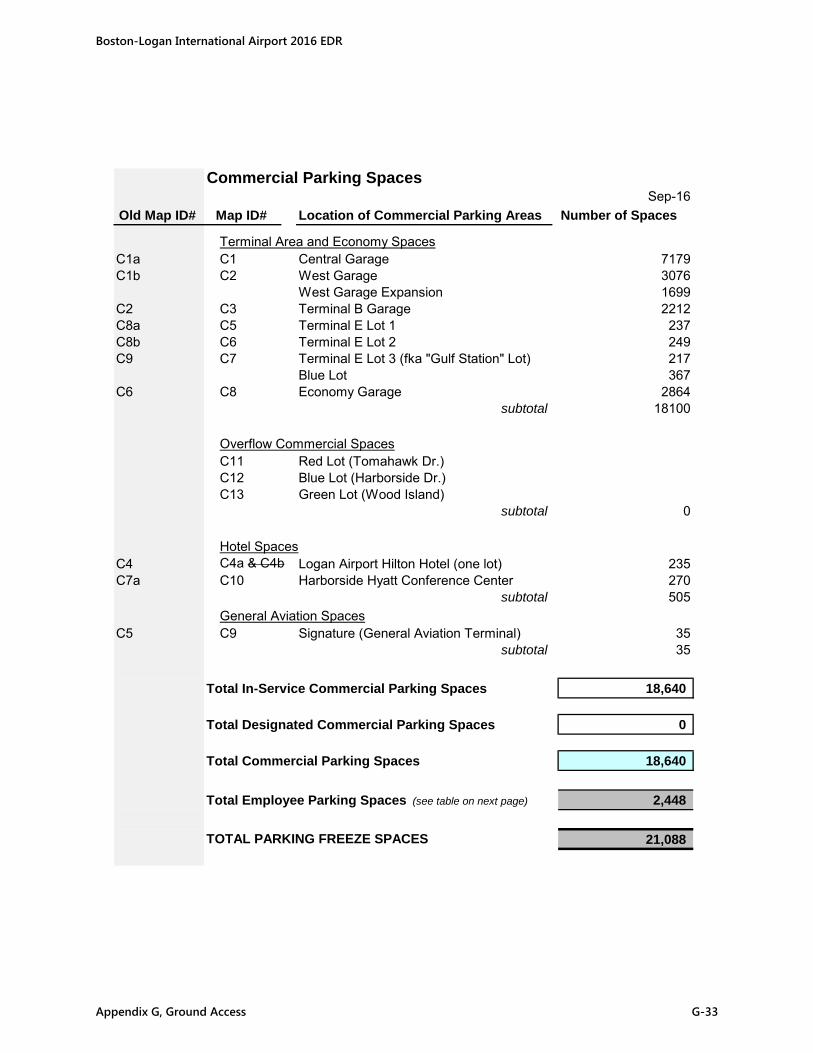
Commercial Parking SpacesSep-16
Old Map ID# Map ID# Location of Commercial Parking Areas Number of Spaces
Terminal Area and Economy SpacesC1a C1 Central Garage 7179C1b C2 West Garage 3076
West Garage Expansion 1699C2 C3 Terminal B Garage 2212C8a C5 Terminal E Lot 1 237C8b C6 Terminal E Lot 2 249C9 C7 Terminal E Lot 3 (fka "Gulf Station" Lot) 217
Blue Lot 367C6 C8 Economy Garage 2864
subtotal 18100
Overflow Commercial SpacesC11 Red Lot (Tomahawk Dr.)C12 Blue Lot (Harborside Dr.)C13 Green Lot (Wood Island)
subtotal 0
Hotel SpacesC4 C4a & C4b Logan Airport Hilton Hotel (one lot) 235C7a C10 Harborside Hyatt Conference Center 270
subtotal 505General Aviation Spaces
C5 C9 Signature (General Aviation Terminal) 35subtotal 35
Total In-Service Commercial Parking Spaces 18,640
Total Designated Commercial Parking Spaces 0
Total Commercial Parking Spaces 18,640
Total Employee Parking Spaces (see table on next page) 2,448
TOTAL PARKING FREEZE SPACES 21,088
Boston-Logan International Airport 2016 EDR
Appendix G, Ground Access G-33
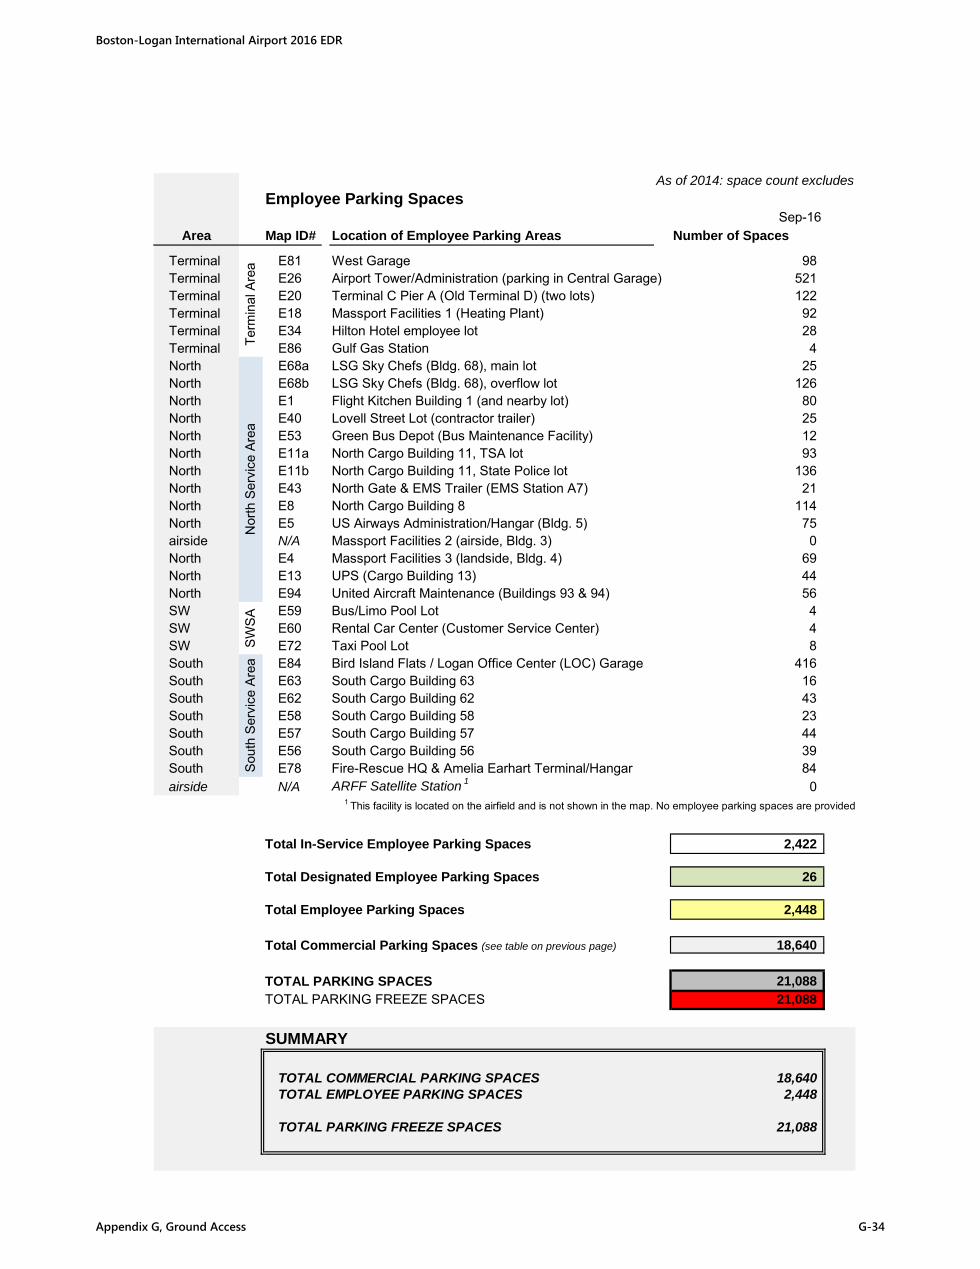
As of 2014: space count excludes Employee Parking Spaces
Sep-16Area Map ID# Location of Employee Parking Areas Number of Spaces
Terminal E81 West Garage 98Terminal E26 Airport Tower/Administration (parking in Central Garage) 521Terminal E20 Terminal C Pier A (Old Terminal D) (two lots) 122Terminal E18 Massport Facilities 1 (Heating Plant) 92Terminal E34 Hilton Hotel employee lot 28Terminal E86 Gulf Gas Station 4North E68a LSG Sky Chefs (Bldg. 68), main lot 25North E68b LSG Sky Chefs (Bldg. 68), overflow lot 126North E1 Flight Kitchen Building 1 (and nearby lot) 80North E40 Lovell Street Lot (contractor trailer) 25North E53 Green Bus Depot (Bus Maintenance Facility) 12North E11a North Cargo Building 11, TSA lot 93North E11b North Cargo Building 11, State Police lot 136North E43 North Gate & EMS Trailer (EMS Station A7) 21North E8 North Cargo Building 8 114North E5 US Airways Administration/Hangar (Bldg. 5) 75airside N/A Massport Facilities 2 (airside, Bldg. 3) 0North E4 Massport Facilities 3 (landside, Bldg. 4) 69North E13 UPS (Cargo Building 13) 44North E94 United Aircraft Maintenance (Buildings 93 & 94) 56SW E59 Bus/Limo Pool Lot 4SW E60 Rental Car Center (Customer Service Center) 4SW E72 Taxi Pool Lot 8South E84 Bird Island Flats / Logan Office Center (LOC) Garage 416South E63 South Cargo Building 63 16South E62 South Cargo Building 62 43South E58 South Cargo Building 58 23South E57 South Cargo Building 57 44South E56 South Cargo Building 56 39South E78 Fire-Rescue HQ & Amelia Earhart Terminal/Hangar 84airside N/A ARFF Satellite Station 1 0
1 This facility is located on the airfield and is not shown in the map. No employee parking spaces are provided
Total In-Service Employee Parking Spaces 2,422
Total Designated Employee Parking Spaces 26
Total Employee Parking Spaces 2,448
Total Commercial Parking Spaces (see table on previous page) 18,640
TOTAL PARKING SPACES 21,088 TOTAL PARKING FREEZE SPACES 21,088
SUMMARY
TOTAL COMMERCIAL PARKING SPACES 18,640 TOTAL EMPLOYEE PARKING SPACES 2,448
TOTAL PARKING FREEZE SPACES 21,088
Term
inal
Are
aN
orth
Ser
vice
Are
aSo
uth
Serv
ice
Area
SWSA
Boston-Logan International Airport 2016 EDR
Appendix G, Ground Access G-34
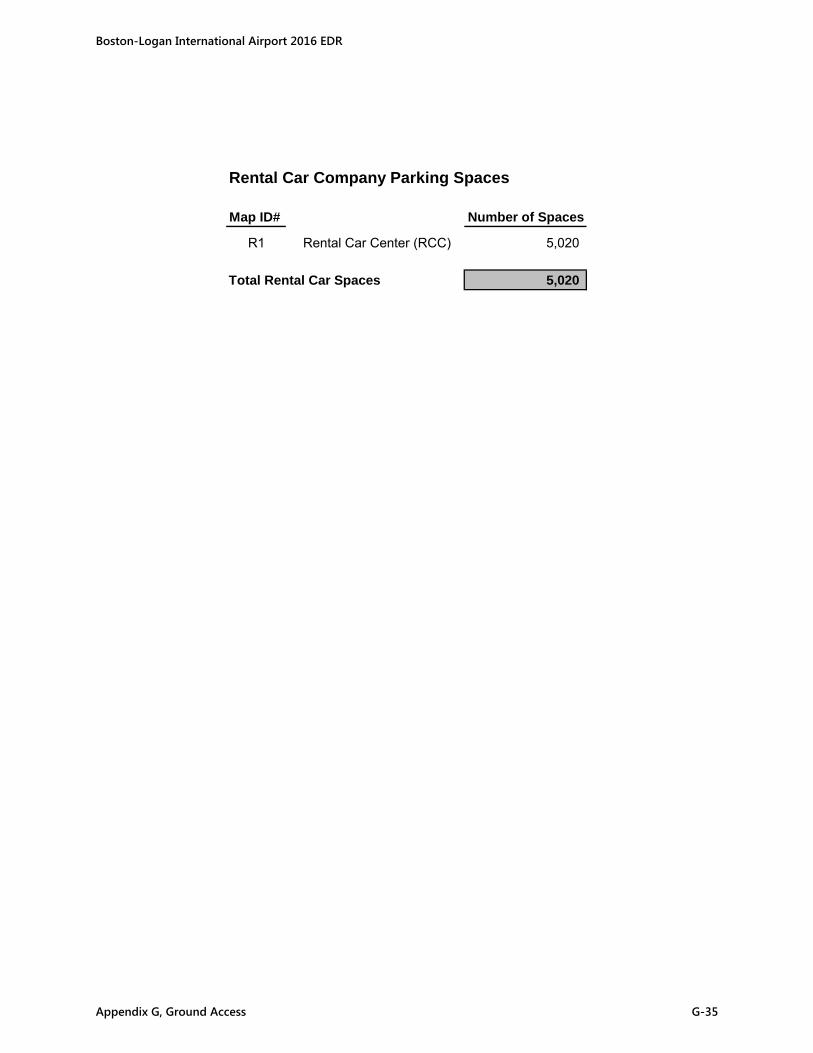
Rental Car Company Parking Spaces
Map ID# Number of Spaces
R1 Rental Car Center (RCC) 5,020
Total Rental Car Spaces 5,020
Boston-Logan International Airport 2016 EDR
Appendix G, Ground Access G-35
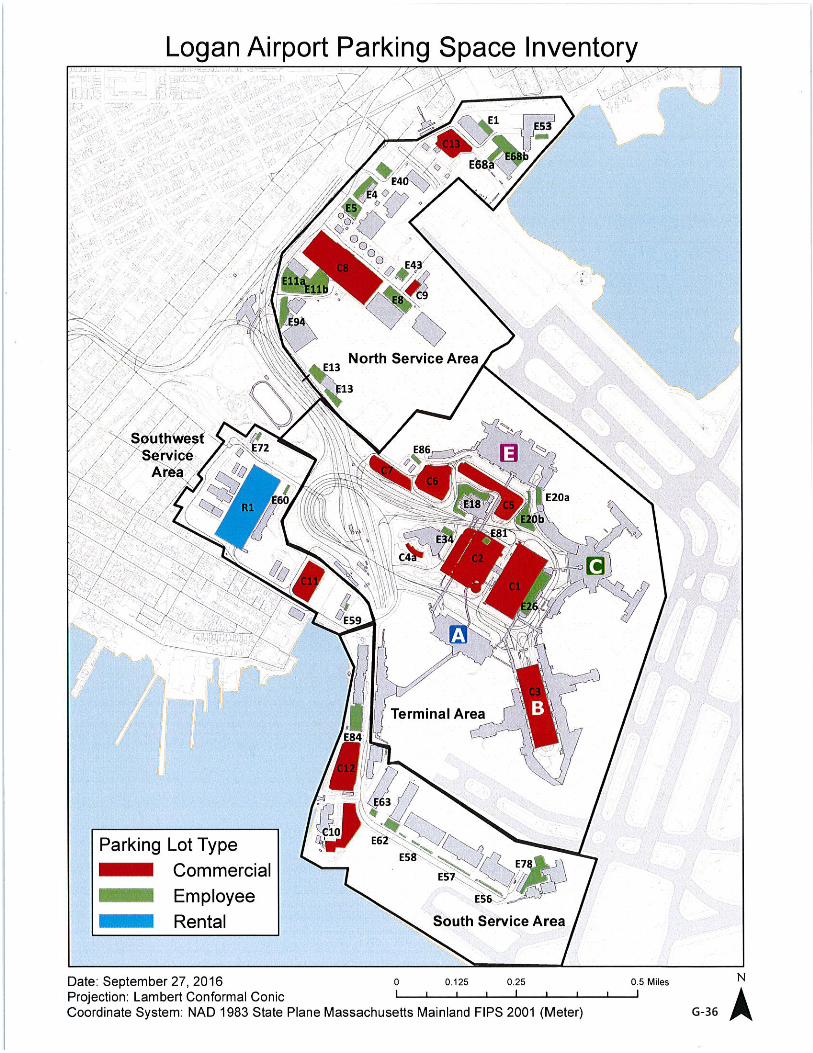
G-36
Boston-Logan International Airport 2016 EDR
Appendix H, Noise Abatement H-1
Noise Abatement This appendix provides detailed information, tables, and figures in support of Chapter 6, Noise Abatement. The contents of this appendix are summarized below.
Massport and FAA correspondence letters regarding AEDT modeling adjustments
▪ Massport AEDT Non-Standard Modeling Request dated July 12, 2017
▪ FAA Response to AEDT Non-Standard Modeling Request dated August 18, 2017
▪ Massport Letter and memorandum to FAA Regarding AEDT Model Results dated November 16, 2016
▪ FAA Response Letter Responding dated November 28, 2016
Massport and FAA correspondence letter regarding RNAV Pilot Test: Request that FAA adopt the JetBlue Airways RNAV Visual Approach Procedure to Runway 33L
Massport and FAA correspondence letter regarding Massport recommended procedural changes to RNAV
Fundamentals of Acoustics and Environmental Noise
▪ Figure H-1 Frequency-Response Characteristics of Various Weighting Networks
▪ Figure H-2 Common Environmental Sound Levels, in dBA
▪ Figure H-3 Variations in the A-Weighted Sound Level Over Time
▪ Figure H-4 Sound Exposure Level (SEL)
▪ Figure H-5 Example of a One Minute Equivalent Sound Level (Leq)
▪ Figure H-6 Daily Noise Dose
▪ Figure H-7 Examples of Day-Night Average Sound Levels (DNL)
▪ Figure H-8 Outdoor Speech Intelligibility
▪ Figure H-9 Probability of Awakening at Least Once from Indoor Noise Event
▪ Figure H-10 Percentage of People Highly Annoyed
▪ Figure H-11 Community Reaction as a Function of Outdoor DNL
Regulatory Framework
Logan Airport RealContoursTM and RC for AEDTTM Data Inputs
▪ Figure H-12 Schematic Noise Modeling Process (Standard INM vs. RC for AEDTTM)
▪ Table H-1a 2015 Annual Modeled Operations
▪ Table H-1b 2016 Annual Modeled Operations
▪ Table H-2a 2015 Modeled Runway Use by Aircraft Group
Boston-Logan International Airport 2016 EDR
Appendix H, Noise Abatement H-2
▪ Table H-2b 2016 Modeled Runway Use by Aircraft Group
▪ Table H-3a Summary of Jet and Non-Jet Aircraft Runway Use: 2015
▪ Table H-3b Summary of Jet and Non-Jet Aircraft Runway Use: 2016
▪ Table H-4 Total 2015 and 2016 Modeled Runway Use by All Operations
▪ Table H-5 Total Count of Flight Tracks Modeled in RealContoursTM and RC for AEDTTM
(2015 and 2016)
▪ Table H-6 Modeled Daily Operations by Commercial & GA Aircraft – 1990 to 2016
▪ Table H-7 Percentage of Commercial Jet Operations by Part 36 Stage Category – 1999 to 2016
▪ Table H-8 Modeled Nighttime Operations at Logan Airport – 1990 to 2016
▪ Table H-9 Summary of Jet Aircraft Runway Use – 1990 to 2016
Annual Model Results and Status of Mitigation Programs
▪ Table H-10 Noise-Exposed Population by Community
▪ Table H-11 Residential Sound Insulation Program (RSIP) Status (1986-2016)
▪ Table H-12 Schools Treated Under Massport Sound Insulation Program
▪ Figure H-13 Number of Callers and Complaints between 2000 and 2016
▪ Table H-13 Noise Complaint Line Summary
▪ Table H-14 Cumulative Noise Index (EPNL) – 1990 to 2016
Flight Track Monitoring Report
▪ Figure H-14 Logan Airport Flight Track Monitor Gates
▪ Table H-15a Runway 4R Nahant Gate Summary for 2015
▪ Table H-15b Runway 4R Nahant Gate Summary for 2016
▪ Table H-16a Runway 4R Shoreline Crossings Above 6,000 Feet for 2015
▪ Table H-16b Runway 4R Shoreline Crossings Above 6,000 Feet for 2016
▪ Table H-17a Runway 9 Gate Summary – Winthrop Gates 1 and 2 for 2015
▪ Table H-17b Runway 9 Gate Summary – Winthrop Gates 1 and 2 for 2016
▪ Table H-18a Runway 9 Shoreline Crossings Above 6,000 feet for 2015
▪ Table H-18b Runway 9 Shoreline Crossings Above 6,000 feet for 2016
▪ Table H-19a Runway 15R Shoreline Crossings Above 6,000 feet for 2015
▪ Table H-19b Runway 15R Shoreline Crossings Above 6,000 feet for 2016
▪ Table H-20a Runways 22R and 22L Squantum 2 Gate Summary for 2015
▪ Table H-20b Runways 22R and 22L Squantum 2 Gate Summary for 2016
▪ Table H-21a Runways 15R, 22R, and 22L Hull 1 Gate Summary – North of Hull Peninsula for 2015
▪ Table H-21b Runways 15R, 22R, and 22L Hull 1 Gate Summary – North of Hull Peninsula for 2016
▪ Table H-22a Runways 22R and 22L Shoreline Crossings Above 6,000 Feet for 2015
Boston-Logan International Airport 2016 EDR
Appendix H, Noise Abatement H-3
▪ Table H-22b Runways 22R and 22L Shoreline Crossings Above 6,000 Feet for 2016
▪ Table H-23a Runway 27 Corridor Percent of Tracks Through Each Gate for 2015
▪ Table H-23b Runway 27 Corridor Percent of Tracks Through Each Gate for 2016
▪ Table H-24a Runway 33L Gates – Passages Below 3,000 Feet for 2015
▪ Table H-24b Runway 33L Gates – Passages Below 3,000 Feet for 2016
▪ Table H-25 Runway Usage by Runway End
Logan Airport Census Block Group Noise Levels
▪ Table H-26 Logan Census Block Group Noise Levels
Dourado, E. and Russell, R. October 2016. “Airport Noise NIMBYism: An Empirical Investigation.” Mercatus on Policy: Mercatus Center at George Mason University.
Boston-Logan International Airport 2016 EDR
Appendix H, Noise Abatement H-4
Massport AEDT Non-Standard Modeling Request dated July 12, 2017

Boston-Logan International Airport 2016 EDR
Appendix H, Noise Abatement H-5
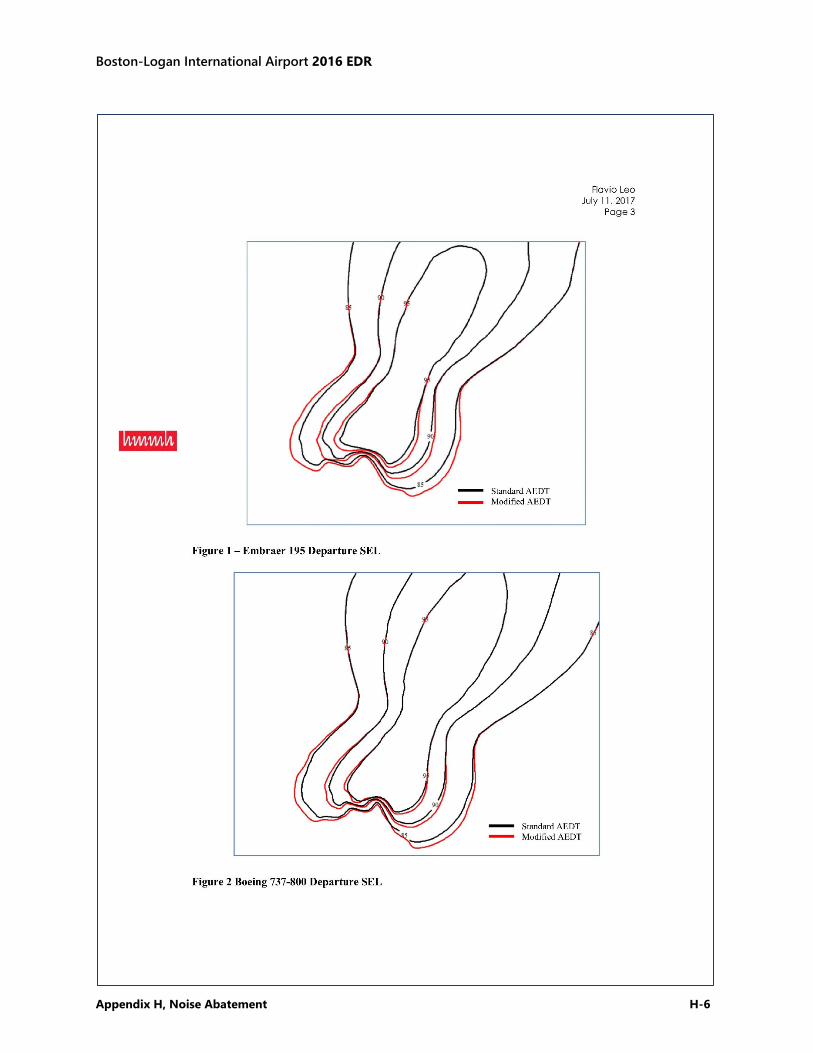
Boston-Logan International Airport 2016 EDR
Appendix H, Noise Abatement H-6
Boston-Logan International Airport 2016 EDR
Appendix H, Noise Abatement H-7
Boston-Logan International Airport 2016 EDR
Appendix H, Noise Abatement H-8
Boston-Logan International Airport 2016 EDR
Appendix H, Noise Abatement H-9
Boston-Logan International Airport 2016 EDR
Appendix H, Noise Abatement H-10
Boston-Logan International Airport 2016 EDR
Appendix H, Noise Abatement H-11
FAA Response to AEDT Non-Standard Modeling Request dated August 18, 2017
Boston-Logan International Airport 2016 EDR
Appendix H, Noise Abatement H-12
Boston-Logan International Airport 2016 EDR
Appendix H, Noise Abatement H-13
Boston-Logan International Airport 2016 EDR
Appendix H, Noise Abatement H-14
Massport Letter and Memorandum to FAA Regarding AEDT Model Results dated November 16, 2016
Boston-Logan International Airport 2016 EDR
Appendix H, Noise Abatement H-15
Boston-Logan International Airport 2016 EDR
Appendix H, Noise Abatement H-16
Boston-Logan International Airport 2016 EDR
Appendix H, Noise Abatement H-17
Boston-Logan International Airport 2016 EDR
Appendix H, Noise Abatement H-18
Boston-Logan International Airport 2016 EDR
Appendix H, Noise Abatement H-19
Boston-Logan International Airport 2016 EDR
Appendix H, Noise Abatement H-20
FAA Response Letter dated November 28, 2016
Boston-Logan International Airport 2016 EDR
Appendix H, Noise Abatement H-21

Boston-Logan International Airport 2016 EDR
Appendix H, Noise Abatement H-22
Boston-Logan International Airport 2016 EDR
Appendix H, Noise Abatement H-23
Massport and FAA correspondence letter regarding RNAV Pilot Test: Request that FAA adopt the JetBlue Airways RNAV Visual Approach Procedure to Runway 33L
Boston-Logan International Airport 2016 EDR
Appendix H, Noise Abatement H-24
Massport and FAA correspondence letter regarding Massport recommended procedural changes to RNAV
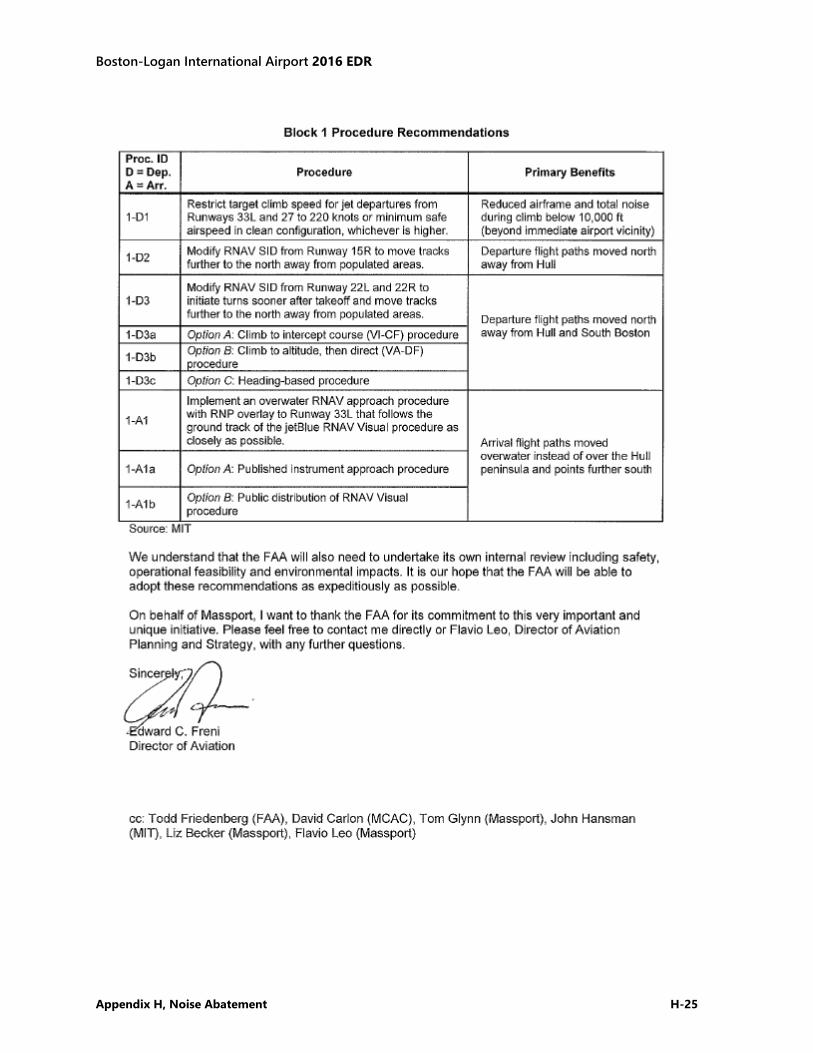
Boston-Logan International Airport 2016 EDR
Appendix H, Noise Abatement H-25
Boston-Logan International Airport 2016 EDR
Appendix H, Noise Abatement H-26
Fundamentals of Acoustics and Environmental Noise
This section introduces the fundamentals of acoustics and noise terminology as well as the effects of noise on human activity and community annoyance.
Introduction to Acoustics and Noise Terminology
Chapter 6, Noise Abatement of this 2016 Environmental Data Report (EDR) relies largely on a measure of cumulative noise exposure over an entire calendar year, in terms of a metric called the Day-Night Average Sound Level (DNL). However, DNL does not always provide a sufficient description of noise for many purposes. Other measures are available to address essentially any issue of concern. This section introduces the following acoustic metrics, which are all related to DNL, but provide bases for evaluating a broad range of noise situations. These metrics include:
Decibel (dB)
A-Weighted Decibel (dBA)
Sound Exposure Level (SEL)
Equivalent Sound Level (Leq)
Time Above (TA)
Time Above, Night (TAN)
DNL
The Decibel (dB)
All sounds come from a sound source – a musical instrument, a voice speaking, or an airplane that passes overhead. It takes energy to produce sound. The sound energy produced by any sound source is transmitted through the air in the form of sound waves – tiny, quick oscillations of pressure just above and just below atmospheric pressure. These oscillations, or sound pressures, impinge on the ear, creating the sound we hear.
Our ears are sensitive to a wide range of sound pressures. The loudest sounds that we hear without pain have about one million times more energy than the quietest sounds we hear. However, our ears are incapable of detecting small differences in these pressures. Thus, to match how we hear this sound energy, we compress the total range of sound pressures to a more meaningful range by introducing the concept of sound pressure level (SPL). SPL is a measure of the sound pressure of a given noise source relative to a standard reference value (typically the quietest sound that a young person with good hearing can detect). SPLs are measured in decibels (abbreviated dB). Decibels are logarithmic quantities – logarithms of the squared ratio of two pressures, the numerator being the pressure of the sound source of interest, and the denominator being the reference pressure (the quietest sound we can hear).
The logarithmic conversion of sound pressure to SPL means that the quietest sound we can hear (the reference pressure) has a SPL of about zero decibels, while the loudest sounds we hear without pain have SPLs of about 120 dB. Most sounds in our day-to-day environment have SPLs from 30 to 100 dB.
Boston-Logan International Airport 2016 EDR
Appendix H, Noise Abatement H-27
Because decibels are logarithmic quantities, they do not behave like regular numbers with which we are more familiar. For example, if two sound sources each produce 100 dB and they are operated together, they produce only 103 dB – not 200 dB as we might expect. Four equal sources operating simultaneously result in a total SPL of 106 dB. In fact, for every doubling of the number of equal sources, the SPL goes up another three decibels. A tenfold increase in the number of sources makes the SPL go up 10 dB. A hundredfold increase makes the level go up 20 dB, and it takes a thousand equal sources to increase the level 30 dB.
If one source is much louder than another source, the two sources together will produce the same SPL (and sound to our ears) as if the louder source were operating alone. For example, a 100-dB source plus an 80-dB source produces 100 dB when operating together. The louder source “masks” the quieter one, but if the quieter source gets louder, it will have an increasing effect on the total SPL. When the two sources are equal, as described above, they produce a level 3 dB above the sound of either one by itself.
From these basic concepts, note that one hundred 80 dB sources will produce a combined level of 100 dB; if a single 100-dB source is added, the group will produce a total SPL of 103 dB. Clearly, the loudest source has the greatest effect on the total decibel level.
A-Weighted Decibel, dBA
Another important characteristic of sound is its frequency, or “pitch.” This is the rate of repetition of the sound pressure oscillations as they reach our ear. Formerly expressed in cycles per second, frequency is now expressed in units known as Hertz (Hz).
Most people hear from about 20 Hz to about 10,000 to 15,000 Hz. People respond to sound most readily when the predominant frequency is in the range of normal conversation, around 1,000 to 2,000 Hz. Acousticians have developed "filters" to match our ears' sensitivity and help us to judge the relative loudness of sounds made up of different frequencies. The so-called "A" filter does the best job of matching the sensitivity of our ears to most environmental noises. SPLs measured through this filter are referred to as A-weighted levels (dBA). A-weighting significantly de-emphasizes noise at low and very high frequencies (below about 500 Hz and above about 10,000 Hz) where we do not hear as well. Because this filter generally matches our ears' sensitivity, sounds having higher A-weighted sound levels are usually judged louder than those with lower A-weighted sound levels, a relationship which does not always hold true for unweighted levels. It is for these reasons that A-weighted sound levels are normally used to evaluate environmental noise.
Other weighting networks include the B and C filters. They correspond to different level ranges of the ear. The rarely used B-weighting attenuates low frequencies (those less than 500 Hz), but to a lesser degree than A-weighting. C weighting is nearly flat throughout the audible frequency range, hardly de-emphasizing low frequency noise. C-weighted levels can be preferable in evaluating sounds whose low-frequency components are responsible for secondary effects such as the shaking of a building, window rattle, or perceptible vibrations. Uses include the evaluation of blasting noise, artillery fire, and in some cases, aircraft noise inside buildings. Figure H-1 compares these various weighting networks.
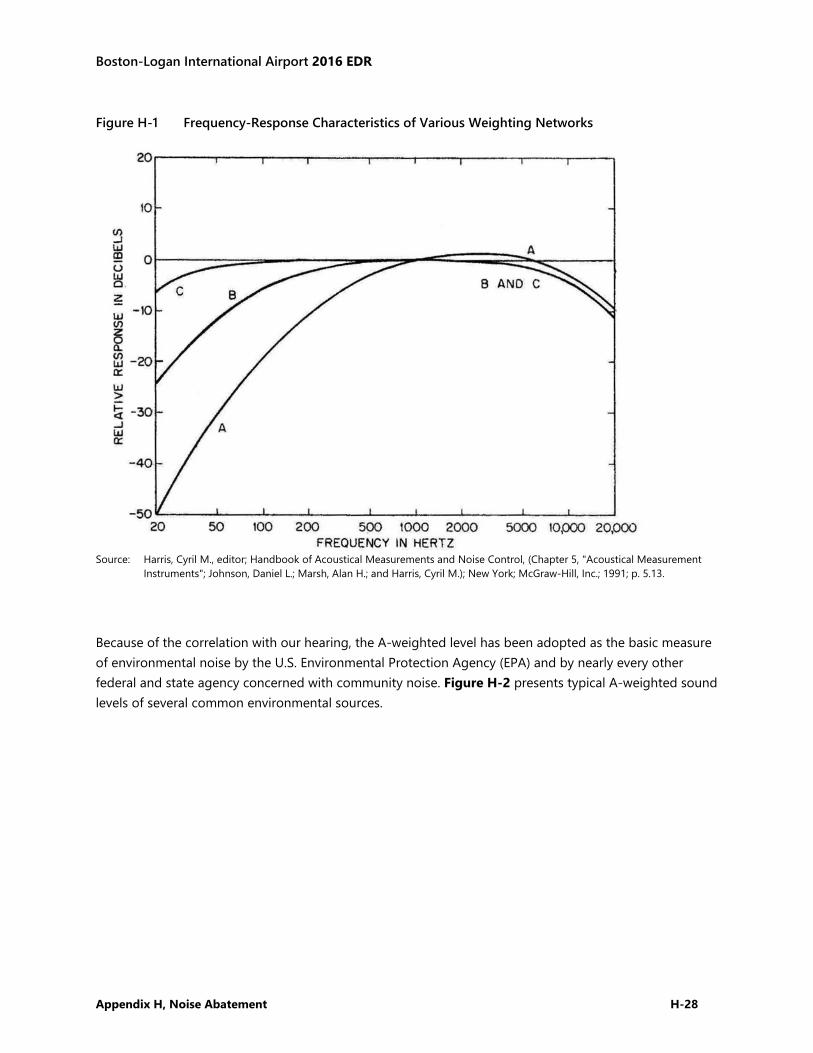
Boston-Logan International Airport 2016 EDR
Appendix H, Noise Abatement H-28
Figure H-1 Frequency-Response Characteristics of Various Weighting Networks
Source: Harris, Cyril M., editor; Handbook of Acoustical Measurements and Noise Control, (Chapter 5, "Acoustical Measurement Instruments"; Johnson, Daniel L.; Marsh, Alan H.; and Harris, Cyril M.); New York; McGraw-Hill, Inc.; 1991; p. 5.13.
Because of the correlation with our hearing, the A-weighted level has been adopted as the basic measure of environmental noise by the U.S. Environmental Protection Agency (EPA) and by nearly every other federal and state agency concerned with community noise. Figure H-2 presents typical A-weighted sound levels of several common environmental sources.
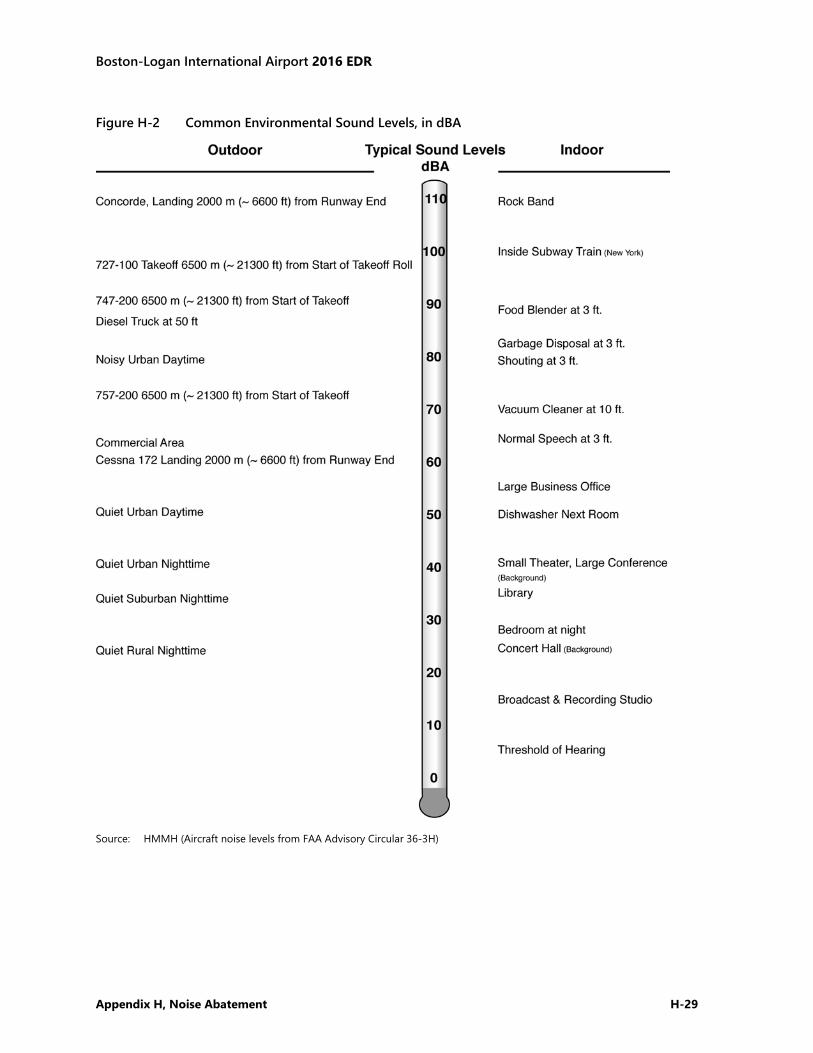
Boston-Logan International Airport 2016 EDR
Appendix H, Noise Abatement H-29
Figure H-2 Common Environmental Sound Levels, in dBA
Source: HMMH (Aircraft noise levels from FAA Advisory Circular 36-3H)
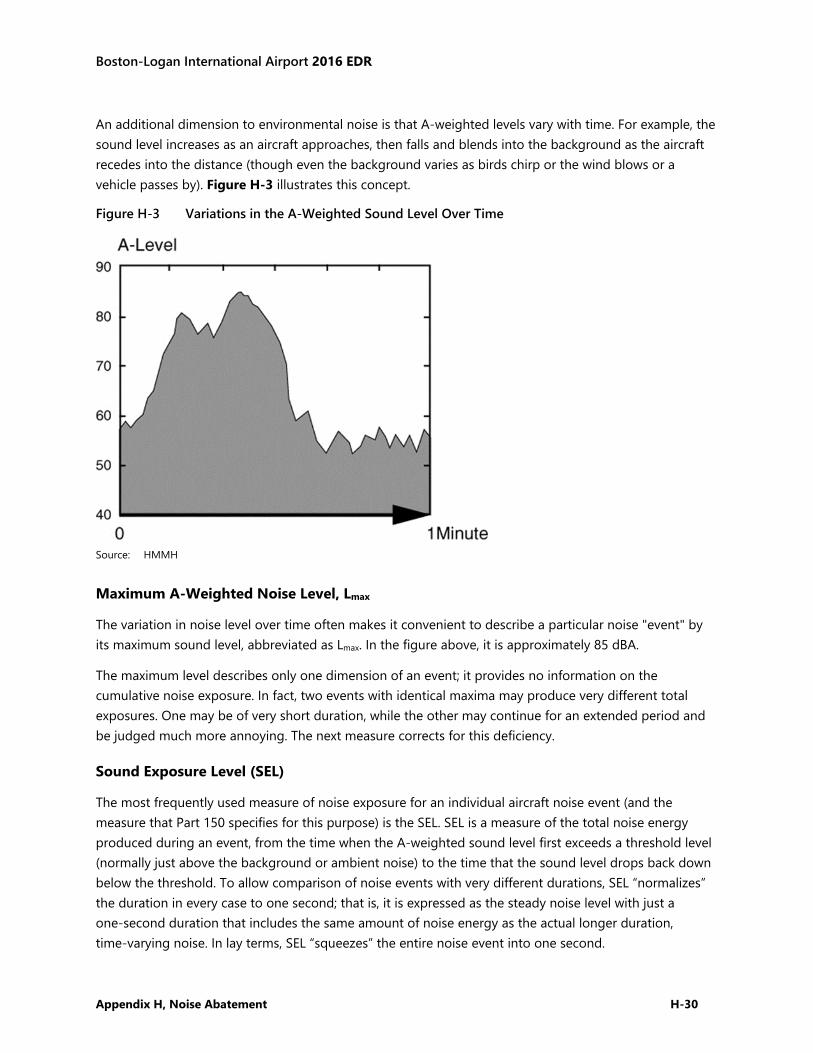
Boston-Logan International Airport 2016 EDR
Appendix H, Noise Abatement H-30
An additional dimension to environmental noise is that A-weighted levels vary with time. For example, the sound level increases as an aircraft approaches, then falls and blends into the background as the aircraft recedes into the distance (though even the background varies as birds chirp or the wind blows or a vehicle passes by). Figure H-3 illustrates this concept.
Figure H-3 Variations in the A-Weighted Sound Level Over Time
Source: HMMH
Maximum A-Weighted Noise Level, Lmax
The variation in noise level over time often makes it convenient to describe a particular noise "event" by its maximum sound level, abbreviated as Lmax. In the figure above, it is approximately 85 dBA.
The maximum level describes only one dimension of an event; it provides no information on the cumulative noise exposure. In fact, two events with identical maxima may produce very different total exposures. One may be of very short duration, while the other may continue for an extended period and be judged much more annoying. The next measure corrects for this deficiency.
Sound Exposure Level (SEL)
The most frequently used measure of noise exposure for an individual aircraft noise event (and the measure that Part 150 specifies for this purpose) is the SEL. SEL is a measure of the total noise energy produced during an event, from the time when the A-weighted sound level first exceeds a threshold level (normally just above the background or ambient noise) to the time that the sound level drops back down below the threshold. To allow comparison of noise events with very different durations, SEL “normalizes” the duration in every case to one second; that is, it is expressed as the steady noise level with just a one-second duration that includes the same amount of noise energy as the actual longer duration, time-varying noise. In lay terms, SEL “squeezes” the entire noise event into one second.
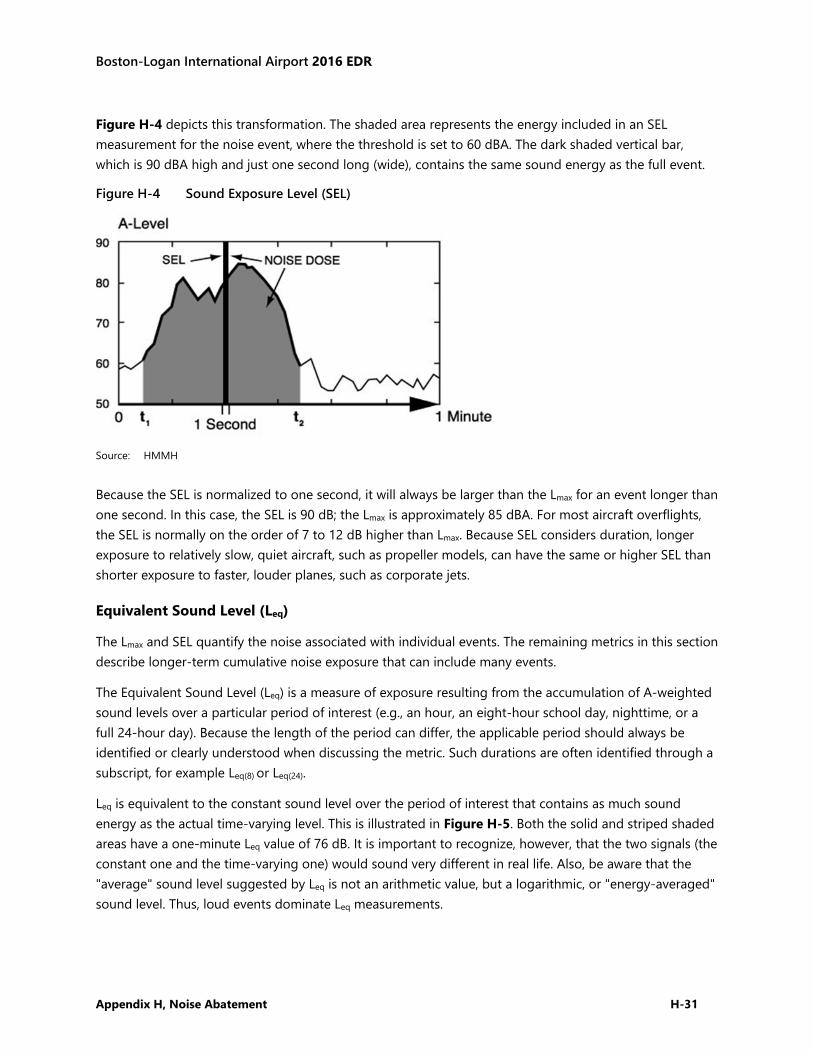
Boston-Logan International Airport 2016 EDR
Appendix H, Noise Abatement H-31
Figure H-4 depicts this transformation. The shaded area represents the energy included in an SEL measurement for the noise event, where the threshold is set to 60 dBA. The dark shaded vertical bar, which is 90 dBA high and just one second long (wide), contains the same sound energy as the full event.
Figure H-4 Sound Exposure Level (SEL)
Source: HMMH
Because the SEL is normalized to one second, it will always be larger than the Lmax for an event longer than one second. In this case, the SEL is 90 dB; the Lmax is approximately 85 dBA. For most aircraft overflights, the SEL is normally on the order of 7 to 12 dB higher than Lmax. Because SEL considers duration, longer exposure to relatively slow, quiet aircraft, such as propeller models, can have the same or higher SEL than shorter exposure to faster, louder planes, such as corporate jets.
Equivalent Sound Level (Leq)
The Lmax and SEL quantify the noise associated with individual events. The remaining metrics in this section describe longer-term cumulative noise exposure that can include many events.
The Equivalent Sound Level (Leq) is a measure of exposure resulting from the accumulation of A-weighted sound levels over a particular period of interest (e.g., an hour, an eight-hour school day, nighttime, or a full 24-hour day). Because the length of the period can differ, the applicable period should always be identified or clearly understood when discussing the metric. Such durations are often identified through a subscript, for example Leq(8) or Leq(24).
Leq is equivalent to the constant sound level over the period of interest that contains as much sound energy as the actual time-varying level. This is illustrated in Figure H-5. Both the solid and striped shaded areas have a one-minute Leq value of 76 dB. It is important to recognize, however, that the two signals (the constant one and the time-varying one) would sound very different in real life. Also, be aware that the "average" sound level suggested by Leq is not an arithmetic value, but a logarithmic, or "energy-averaged" sound level. Thus, loud events dominate Leq measurements.
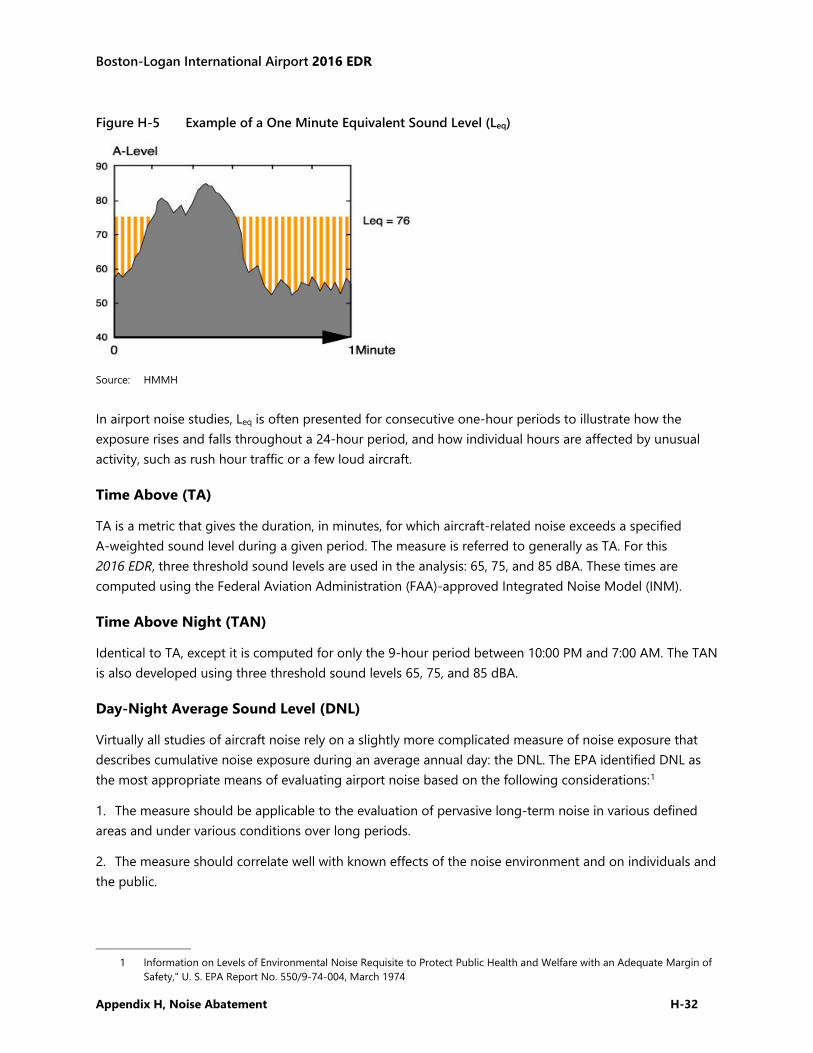
Boston-Logan International Airport 2016 EDR
Appendix H, Noise Abatement H-32
Figure H-5 Example of a One Minute Equivalent Sound Level (Leq)
Source: HMMH
In airport noise studies, Leq is often presented for consecutive one-hour periods to illustrate how the exposure rises and falls throughout a 24-hour period, and how individual hours are affected by unusual activity, such as rush hour traffic or a few loud aircraft.
Time Above (TA)
TA is a metric that gives the duration, in minutes, for which aircraft-related noise exceeds a specified A-weighted sound level during a given period. The measure is referred to generally as TA. For this 2016 EDR, three threshold sound levels are used in the analysis: 65, 75, and 85 dBA. These times are computed using the Federal Aviation Administration (FAA)-approved Integrated Noise Model (INM).
Time Above Night (TAN)
Identical to TA, except it is computed for only the 9-hour period between 10:00 PM and 7:00 AM. The TAN is also developed using three threshold sound levels 65, 75, and 85 dBA.
Day-Night Average Sound Level (DNL)
Virtually all studies of aircraft noise rely on a slightly more complicated measure of noise exposure that describes cumulative noise exposure during an average annual day: the DNL. The EPA identified DNL as the most appropriate means of evaluating airport noise based on the following considerations:1
1. The measure should be applicable to the evaluation of pervasive long-term noise in various defined areas and under various conditions over long periods.
2. The measure should correlate well with known effects of the noise environment and on individuals and the public.
–––––––––––––––– 1 Information on Levels of Environmental Noise Requisite to Protect Public Health and Welfare with an Adequate Margin of
Safety," U. S. EPA Report No. 550/9-74-004, March 1974

Boston-Logan International Airport 2016 EDR
Appendix H, Noise Abatement H-33
3. The measure should be simple, practical, and accurate. In principal, it should be useful for planning as well as for enforcement or monitoring purposes.
4. The required measurement equipment, with standard characteristics, should be commercially available.
5. The measure should be closely related to existing methods currently in use.
6. The single measure of noise at a given location should be predictable, within an acceptable tolerance, from knowledge of the physical events producing the noise.
7. The measure should lend itself to small, simple monitors, which can be left unattended in public areas for long periods.
Most federal agencies dealing with noise have formally adopted DNL. The Federal Interagency Committee on Noise (FICON) reaffirmed the appropriateness of DNL in 1992. The FICON summary report stated; “There are no new descriptors or metrics of sufficient scientific standing to substitute for the present DNL cumulative noise exposure metric.”
The DNL represents noise as it occurs over a 24-hour period, with one important exception: DNL treats nighttime noise differently from daytime noise. In determining DNL, it is assumed that the A-weighted levels occurring at night (defined as 10:00 PM to 7:00 AM) are 10 dB louder than they really are. This 10-dB penalty is applied to account for greater sensitivity to nighttime noise, and the fact that events at night are often perceived to be more intrusive because nighttime ambient noise is less than daytime ambient noise.
Figure H-4 illustrated the A-weighted sound level due to an aircraft fly-over as it changed with time. The top frame of Figure H-6 repeats this figure. The shaded area reflects the noise dose that a listener receives during the one-minute period of the sample. The center frame of Figure H-4 includes this one-minute sample within a full hour. The shaded area represents the noise during that hour with 16 noise events, each producing an SEL. Similarly, the bottom frame includes the one-hour interval within a full 24 hours. Here the shaded area represents the listener’s noise dose over a complete day. Note that several overflights occur at a time when the background noise drops some 10 dB, to approximately 45 dBA.
DNL can be measured or estimated. Measurements are practical only for obtaining DNL values for relatively limited numbers of points, and, in the absence of a permanently installed monitoring system, only for relatively short time periods. Most airport noise studies are based on computer-generated DNL estimates, determined by accounting for all the SELs from individual events, which comprise the total noise dose at a given location. Computed DNL values are often depicted in terms of equal-exposure noise contours (much as topographic maps have contours of equal elevation). Figure H-7 depicts typical DNL values for a variety of noise environments.
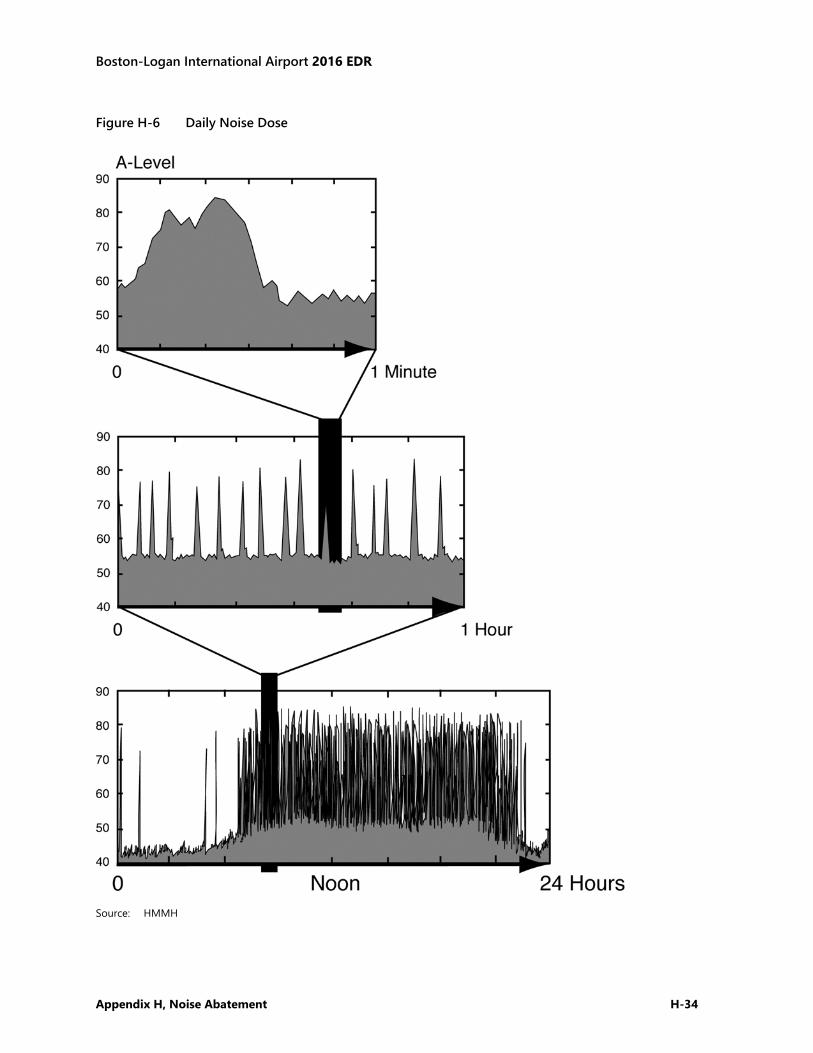
Boston-Logan International Airport 2016 EDR
Appendix H, Noise Abatement H-34
Figure H-6 Daily Noise Dose
Source: HMMH
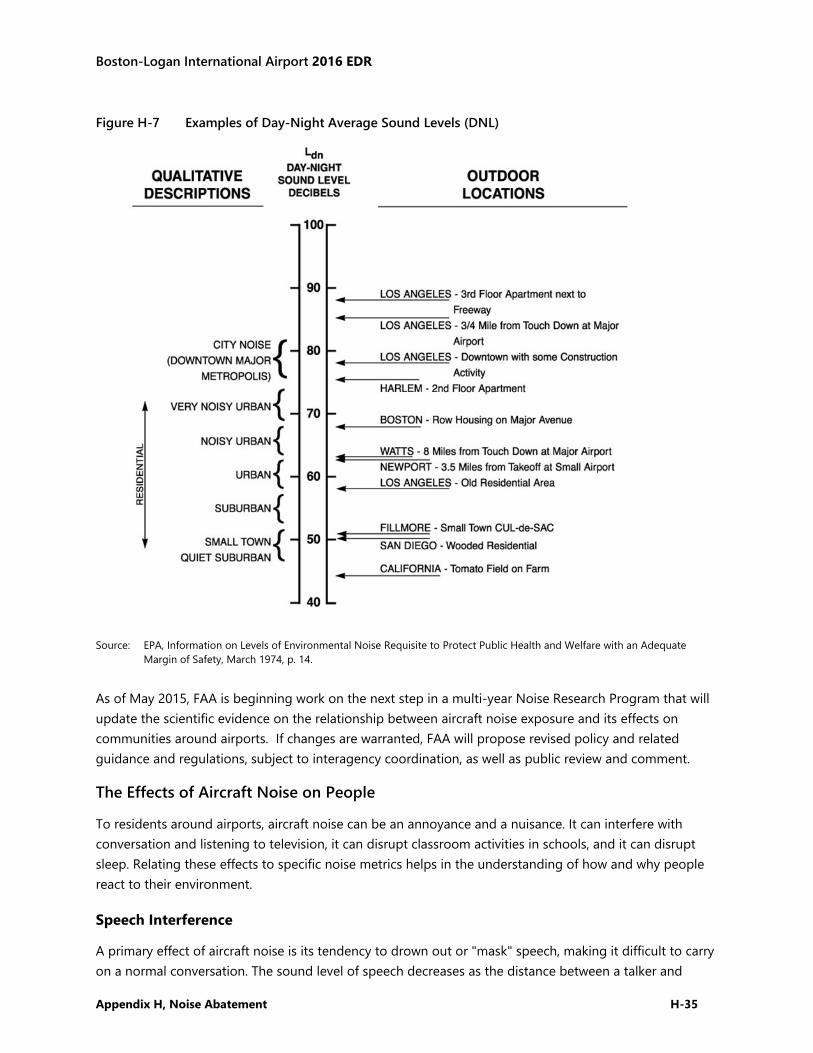
Boston-Logan International Airport 2016 EDR
Appendix H, Noise Abatement H-35
Figure H-7 Examples of Day-Night Average Sound Levels (DNL)
Source: EPA, Information on Levels of Environmental Noise Requisite to Protect Public Health and Welfare with an Adequate
Margin of Safety, March 1974, p. 14.
As of May 2015, FAA is beginning work on the next step in a multi-year Noise Research Program that will update the scientific evidence on the relationship between aircraft noise exposure and its effects on communities around airports. If changes are warranted, FAA will propose revised policy and related guidance and regulations, subject to interagency coordination, as well as public review and comment.
The Effects of Aircraft Noise on People
To residents around airports, aircraft noise can be an annoyance and a nuisance. It can interfere with conversation and listening to television, it can disrupt classroom activities in schools, and it can disrupt sleep. Relating these effects to specific noise metrics helps in the understanding of how and why people react to their environment.
Speech Interference
A primary effect of aircraft noise is its tendency to drown out or "mask" speech, making it difficult to carry on a normal conversation. The sound level of speech decreases as the distance between a talker and
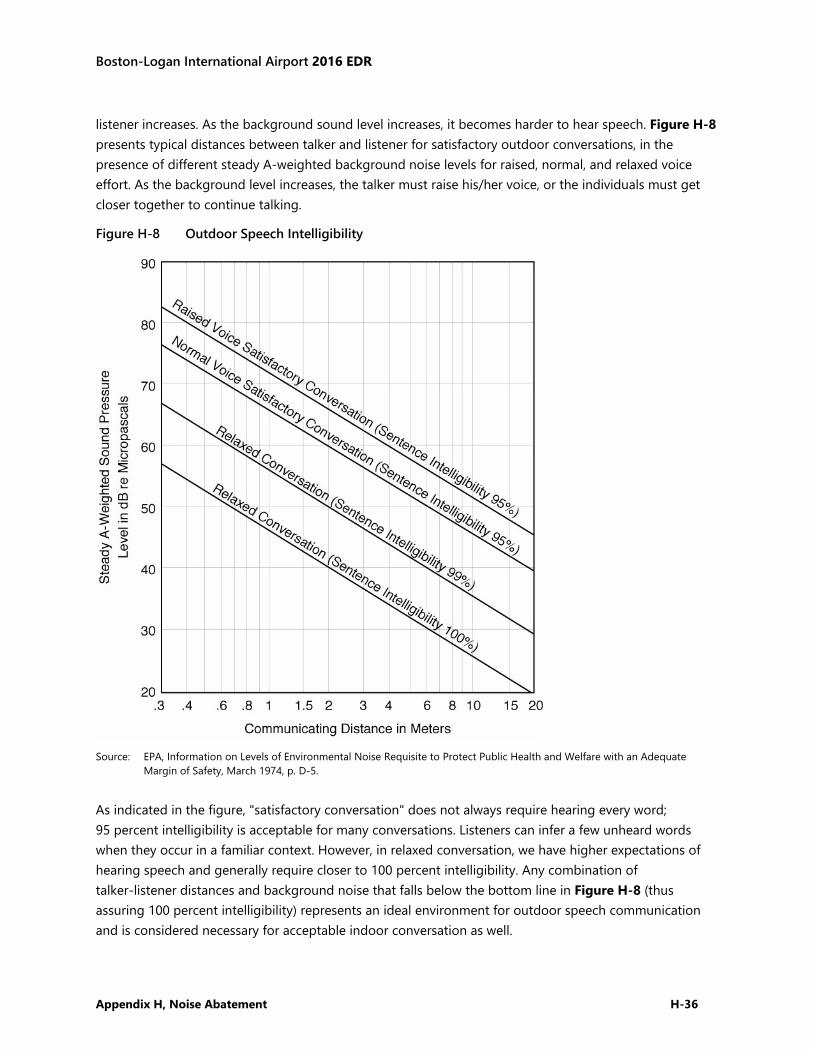
Boston-Logan International Airport 2016 EDR
Appendix H, Noise Abatement H-36
listener increases. As the background sound level increases, it becomes harder to hear speech. Figure H-8 presents typical distances between talker and listener for satisfactory outdoor conversations, in the presence of different steady A-weighted background noise levels for raised, normal, and relaxed voice effort. As the background level increases, the talker must raise his/her voice, or the individuals must get closer together to continue talking.
Figure H-8 Outdoor Speech Intelligibility
Source: EPA, Information on Levels of Environmental Noise Requisite to Protect Public Health and Welfare with an Adequate
Margin of Safety, March 1974, p. D-5.
As indicated in the figure, "satisfactory conversation" does not always require hearing every word; 95 percent intelligibility is acceptable for many conversations. Listeners can infer a few unheard words when they occur in a familiar context. However, in relaxed conversation, we have higher expectations of hearing speech and generally require closer to 100 percent intelligibility. Any combination of talker-listener distances and background noise that falls below the bottom line in Figure H-8 (thus assuring 100 percent intelligibility) represents an ideal environment for outdoor speech communication and is considered necessary for acceptable indoor conversation as well.
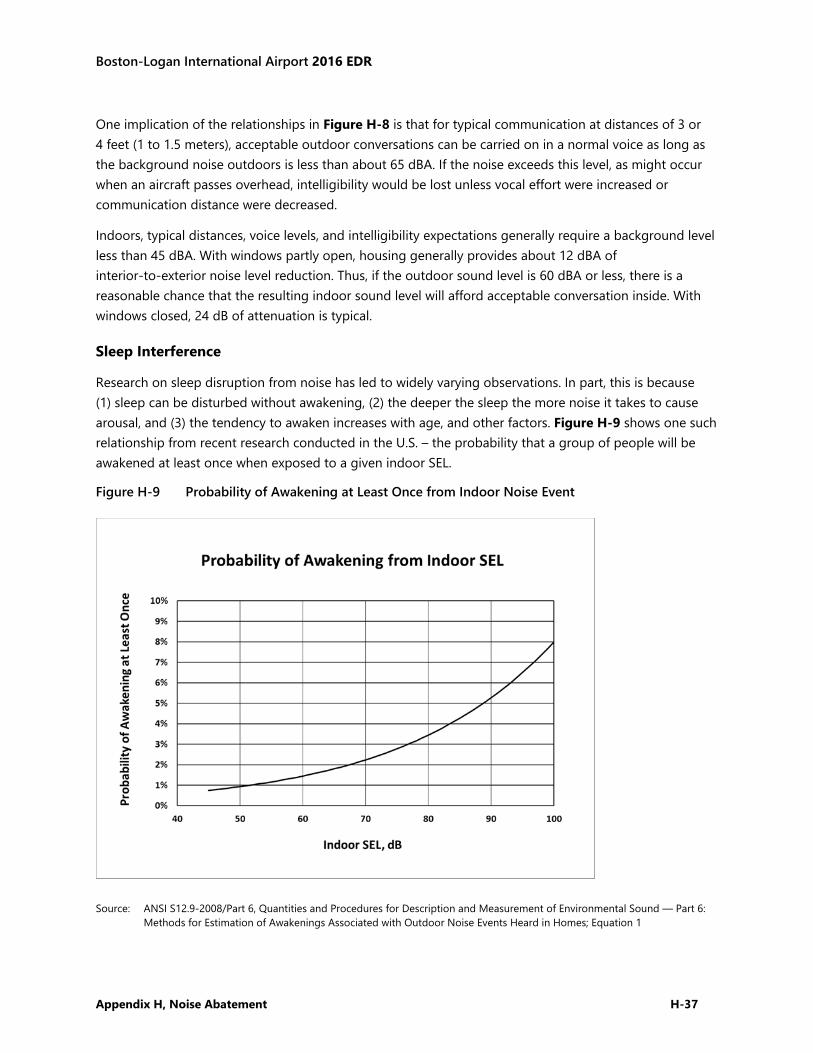
Boston-Logan International Airport 2016 EDR
Appendix H, Noise Abatement H-37
One implication of the relationships in Figure H-8 is that for typical communication at distances of 3 or 4 feet (1 to 1.5 meters), acceptable outdoor conversations can be carried on in a normal voice as long as the background noise outdoors is less than about 65 dBA. If the noise exceeds this level, as might occur when an aircraft passes overhead, intelligibility would be lost unless vocal effort were increased or communication distance were decreased.
Indoors, typical distances, voice levels, and intelligibility expectations generally require a background level less than 45 dBA. With windows partly open, housing generally provides about 12 dBA of interior-to-exterior noise level reduction. Thus, if the outdoor sound level is 60 dBA or less, there is a reasonable chance that the resulting indoor sound level will afford acceptable conversation inside. With windows closed, 24 dB of attenuation is typical.
Sleep Interference
Research on sleep disruption from noise has led to widely varying observations. In part, this is because (1) sleep can be disturbed without awakening, (2) the deeper the sleep the more noise it takes to cause arousal, and (3) the tendency to awaken increases with age, and other factors. Figure H-9 shows one such relationship from recent research conducted in the U.S. – the probability that a group of people will be awakened at least once when exposed to a given indoor SEL.
Figure H-9 Probability of Awakening at Least Once from Indoor Noise Event
Source: ANSI S12.9-2008/Part 6, Quantities and Procedures for Description and Measurement of Environmental Sound — Part 6: Methods for Estimation of Awakenings Associated with Outdoor Noise Events Heard in Homes; Equation 1
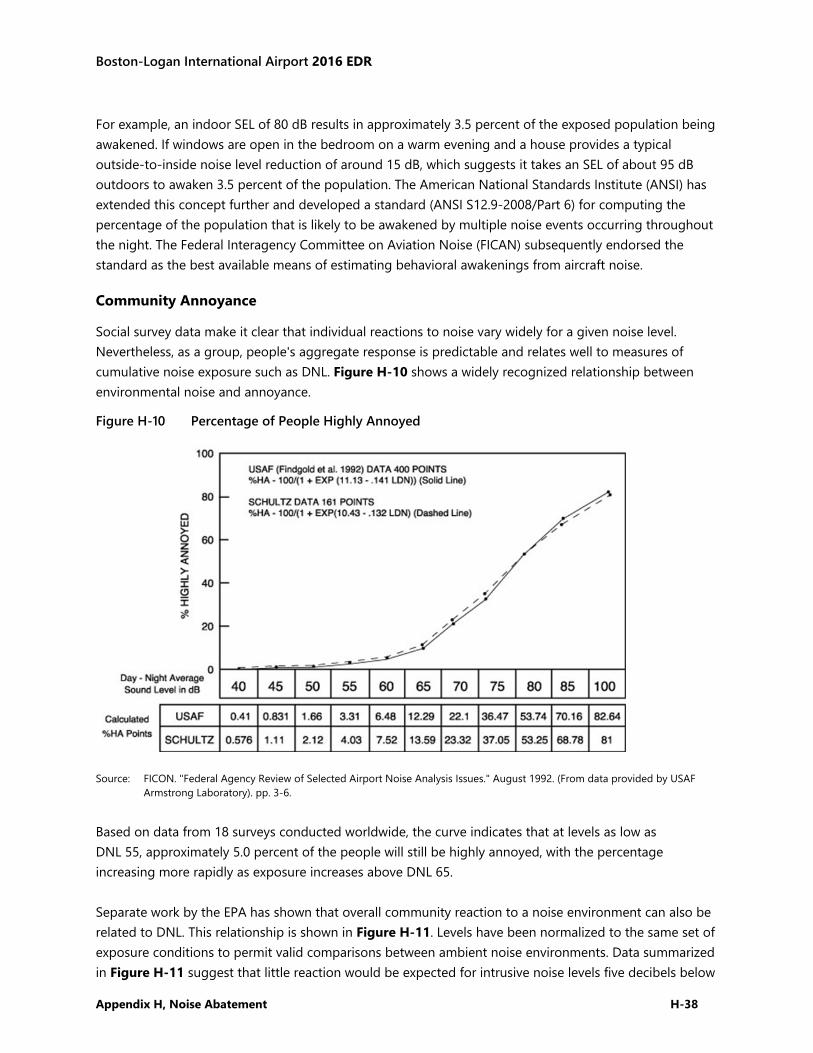
Boston-Logan International Airport 2016 EDR
Appendix H, Noise Abatement H-38
For example, an indoor SEL of 80 dB results in approximately 3.5 percent of the exposed population being awakened. If windows are open in the bedroom on a warm evening and a house provides a typical outside-to-inside noise level reduction of around 15 dB, which suggests it takes an SEL of about 95 dB outdoors to awaken 3.5 percent of the population. The American National Standards Institute (ANSI) has extended this concept further and developed a standard (ANSI S12.9-2008/Part 6) for computing the percentage of the population that is likely to be awakened by multiple noise events occurring throughout the night. The Federal Interagency Committee on Aviation Noise (FICAN) subsequently endorsed the standard as the best available means of estimating behavioral awakenings from aircraft noise.
Community Annoyance
Social survey data make it clear that individual reactions to noise vary widely for a given noise level. Nevertheless, as a group, people's aggregate response is predictable and relates well to measures of cumulative noise exposure such as DNL. Figure H-10 shows a widely recognized relationship between environmental noise and annoyance.
Figure H-10 Percentage of People Highly Annoyed
Source: FICON. "Federal Agency Review of Selected Airport Noise Analysis Issues." August 1992. (From data provided by USAF Armstrong Laboratory). pp. 3-6.
Based on data from 18 surveys conducted worldwide, the curve indicates that at levels as low as DNL 55, approximately 5.0 percent of the people will still be highly annoyed, with the percentage increasing more rapidly as exposure increases above DNL 65. Separate work by the EPA has shown that overall community reaction to a noise environment can also be related to DNL. This relationship is shown in Figure H-11. Levels have been normalized to the same set of exposure conditions to permit valid comparisons between ambient noise environments. Data summarized in Figure H-11 suggest that little reaction would be expected for intrusive noise levels five decibels below
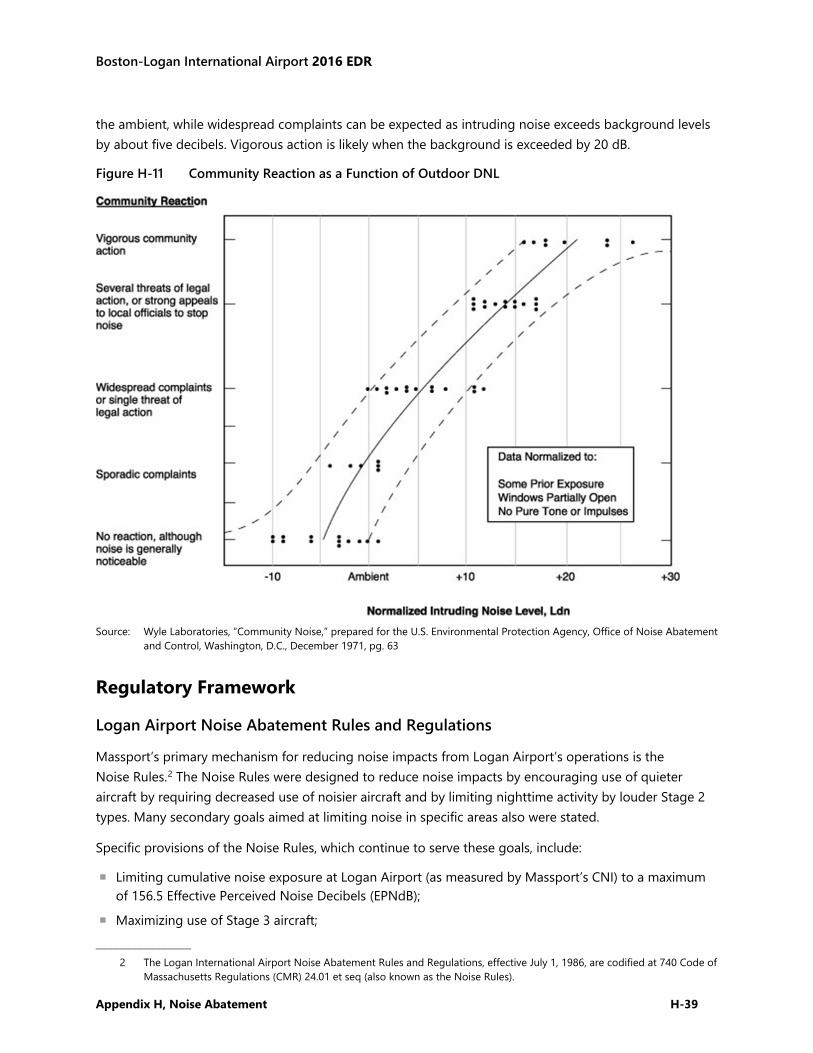
Boston-Logan International Airport 2016 EDR
Appendix H, Noise Abatement H-39
the ambient, while widespread complaints can be expected as intruding noise exceeds background levels by about five decibels. Vigorous action is likely when the background is exceeded by 20 dB.
Figure H-11 Community Reaction as a Function of Outdoor DNL
Source: Wyle Laboratories, “Community Noise,” prepared for the U.S. Environmental Protection Agency, Office of Noise Abatement
and Control, Washington, D.C., December 1971, pg. 63
Regulatory Framework
Logan Airport Noise Abatement Rules and Regulations
Massport’s primary mechanism for reducing noise impacts from Logan Airport’s operations is the Noise Rules.2 The Noise Rules were designed to reduce noise impacts by encouraging use of quieter aircraft by requiring decreased use of noisier aircraft and by limiting nighttime activity by louder Stage 2 types. Many secondary goals aimed at limiting noise in specific areas also were stated.
Specific provisions of the Noise Rules, which continue to serve these goals, include:
Limiting cumulative noise exposure at Logan Airport (as measured by Massport’s CNI) to a maximum of 156.5 Effective Perceived Noise Decibels (EPNdB);
Maximizing use of Stage 3 aircraft;
–––––––––––––––– 2 The Logan International Airport Noise Abatement Rules and Regulations, effective July 1, 1986, are codified at 740 Code of
Massachusetts Regulations (CMR) 24.01 et seq (also known as the Noise Rules).
Boston-Logan International Airport 2016 EDR
Appendix H, Noise Abatement H-40
Restricting nighttime operations by Stage 2 aircraft;
Placing limitations on times and locations of engine run-ups and use of auxiliary power units (APU); and
Restricting use of certain runways by noisier aircraft and time of day.
These restrictions and limitations are subject to FAA implementation and safe operation of the airport and airspace.
Federal Aviation Regulation (FAR) Part 36
Logan Airport operates within a framework of federal aviation regulations that limits an airport operator’s ability to control noise. For example, FAA’s FAR Part 363 sets noise limits for aircraft certification and the procedures by which aircraft noise emission levels must be measured to determine compliance. The regulation defines noise emission limits for turbojets, turboprops, and helicopters, classifying turbojets into categories referred to as stages based on noise levels at each of three locations: takeoff, landing, and to the side of the runway during takeoff (sideline). The stages are:
Stage 1 aircraft are the oldest and usually have the loudest operations, having preceded the existence of any noise emission regulation. Rare examples include old, restored civil or military aircraft. There are no Stage 1 aircraft operating at Logan Airport.
Stage 2 aircraft are less old and less noisy than Stage 1; they were the first aircraft types required to meet a noise limit. A subsequent regulation, FAR Part 91 (described in the next section), prohibits the operation of a Stage 2 aircraft in the continental U.S. unless its takeoff weight is 75,000 pounds or less. FAA Reauthorization bill of 2012 also mandated the phase out of Stage 2 aircraft with a takeoff weight less than 75,000 pounds by the end of 2015. Thus, there were no Stage 2 operations at Logan Airport for all of 2016.
Stage 3 aircraft were certified for service before 2006 and have relatively quiet jets, although some are Stage 2 aircraft that have been re-engined, or have been fitted with hushkits, enabling them to meet Stage 3 noise limits.
Stage 4 aircraft are required to operate with a cumulative noise level at least 10 dB quieter than Stage 3 aircraft at three prescribed measurement points. Jet aircraft certificated after January 1, 2006 must meet the Stage 4 limits. Although not required, the majority of aircraft in the 2016 Logan Airport fleet would also meet the Stage 4 noise limits if they were recertificated.
Stage 5 aircraft are the newest and quietest aircraft. Starting January 1, 2018, all aircraft certificated must meet Stage 5 limits which are a cumulative 7 dB below Stage 4 and 17 dB below Stage 3 aircraft. The Boeing 787, 747-8 and Airbus A350 and A380 are examples of aircraft that meet the new limits.
FAR Part 150
First implemented in February 1981, FAR Part 1504 defines procedures that an airport operator must follow if it chooses to conduct and implement an airport noise and land use compatibility plan. Part 150 Noise Compatibility studies require the use of DNL to evaluate the airport noise environment. FAR Part 150 identifies noise compatibility guidelines for different land uses depending on their sensitivity. Key
–––––––––––––––– 3 14 CFR Part 36, “Noise Standards: Aircraft Type and Air Worthiness Certification.” 4 14 CFR Part 150, “Airport Noise Compatibility Planning.”
Boston-Logan International Airport 2016 EDR
Appendix H, Noise Abatement H-41
values include a DNL of 75 dB, above which no residences, schools, hospitals, or churches are considered compatible, and a DNL of 65 dB, above which those land uses are considered compatible only if they are sound insulated.
Noise abatement or mitigation measures that an airport operator must consider in a Part 150 study include acquisition of incompatible land, construction of noise barriers, sound insulation of buildings, implementation of a preferential runway program, use of noise abatement flight tracks, implementation of airport use restrictions, and any other actions that would have a beneficial effect on the public.
While Massport has implemented variations of these and additional measures at Logan Airport, Massport has not filed an official Part 150 noise compatibility study with FAA because all of Logan Airport’s program elements, while regularly reviewed and updated, preceded the promulgation of Part 150 and are effectively grandfathered under the regulation.
FAR Parts 91 and 161
The Airport Noise and Capacity Act of 1990 (ANCA)5 directed the U.S. Secretary of Transportation to undertake three key noise-related actions:
Establish a schedule for a phase out of Part 36 Stage 2 aircraft by the year 2000;
Establish a program for FAA review of all new airport noise and access restrictions limiting operations of Stage 2 aircraft; and
Establish a program for FAA review and approval of any restriction that limits operations of Stage 3 aircraft, including public notice requirements.
FAA addressed these requirements through amendment of an existing federal regulation, “Part 91,”6 and establishment of a new regulation, “Part 161.”7 ANCA effectively ended Massport’s pursuit of any additional operational restrictions outside of this program.
Amendment to Part 91
FAA establishes and regulates operating noise limits for civil aircraft operation in Subpart I, “Operating Noise Limits,” of 14 CFR Part 91, “General Operating and Flight Rules.” The noise limits are based on aircraft noise certification criteria set forth in 14 CFR Part 36, “Noise Standards: Aircraft Type and Airworthiness Certification.” For transport category “large” aircraft (with maximum takeoff weights of 12,500 pounds or more) and for all turbojet-powered aircraft, Part 36 identifies four “stages” of aircraft with respect to their relative noisiness:
Stage 1 aircraft, which have never been shown to meet any noise standards, because they have never been tested, or because they have been tested and failed to meet any established standards;
Stage 2 aircraft, which meet original noise limits, set in 1969;
Stage 3 aircraft, which meet more stringent limits, established in 1977; and
Stage 4 aircraft, which meet the most stringent limits, established in 2005.
–––––––––––––––– 5 Pub. L. No. 101-508, 104 Stat. 1388, as recodified at 49 United States Code 47521- 47533. 6 14 CFR Part 91, “General Operating and Flight Rules.” 7 14 CFR Part 161, “Notice and Approval of Airport Noise and Access Restrictions.”
Boston-Logan International Airport 2016 EDR
Appendix H, Noise Abatement H-42
In 1976, FAA ordered a phase out of all Stage 1 aircraft with a maximum gross takeoff weight (MGTOW) over 75,000 pounds, to be completed on January 1, 1985. After that date, Stage 1 civil aircraft over 75,000 pounds MGTOW were banned from operating in the U.S. (with limited exemptions related to commercial service at “small communities,” which has since expired in 1988). ANCA required a similar phase out of Stage 2 aircraft over 75,000 pounds by December 31, 1999. The 75,000-pound weight limit exempted most “business” (or “corporate”) jets and a very small number of the very smallest “air carrier” type jets until December 31, 2015 when a full ban took effect.8 Aircraft operators responded to the Stage 1 and 2 phase-outs by retiring their non-compliant aircraft or modifying some of their aircraft to meet the more stringent standards. The modifications undertaken include installation of quieter engines, noise-reducing physical modifications to the airframe and/or existing engines, and limitation of operating weights and procedures to meet the applicable Part 36 limits. Some former Stage 2 airline aircraft that were “recertificated” as Stage 3 with these modifications still operate at Logan Airport, but are generally declining due to the aircrafts’ age and high operating costs (in particular due to the generally low fuel efficiency of these older aircraft).
From 2006 to 2017, as airlines add new aircraft, Stage 4 aircraft have been added to their fleets. The Stage 4 noise standard applies to any new jet aircraft type designs over 12,500 pounds requiring FAA approval after January 1, 2006. The International Civil Aviation Organization (ICAO) has also adopted the same regulation for international operators, but neither FAA nor ICAO have indicated there will be restrictions on the remaining recertificated Stage 3 aircraft from carrier fleets.
ICAO and FAA have adopted a higher standard of noise classification called Stage 5 (Chapter 14 for ICAO) which will be effective for new aircraft type certification after December 31, 2017 and December 31, 2020, depending on the weight of the aircraft.9
Part 161
FAA implemented the ANCA requirements related to notice, analysis, and approval of use restrictions affecting Stage 2 and 3 aircraft through the establishment of a new regulation, 14 CFR Part 161, “Notice and Approval of Airport Noise and Access Restrictions.” In simple terms, Part 161 requires an airport operator that proposes to implement a restriction on Stage 2 or 3 aircraft operations to undertake, document, and publicize certain benefit-cost analyses, comparing the noise benefits of the restriction to its economic costs. Operators must obtain specific FAA approvals of the analysis, documentation, and notice processes, and – for Stage 3 restrictions – approval of the restriction itself.
Part 161 and ANCA define more demanding requirements and explicit guidance for Stage 3 restrictions. To implement a Stage 3 restriction, formal FAA approval is required. FAA's role for Stage 2 restrictions is limited to commenting on compliance with Part 161 notice and analysis procedural requirements. Part 161 provides guidance regarding appropriate information to provide in support of these findings. While Part 161 does not require this information for a Stage 2 restriction, Part 161 states that it would be “useful.” Moreover, FAA has required airports to provide this same information for Stage 2 restrictions (and even for Stage 1 restrictions pursued under FAR Part 150), on the grounds that they are required for airports to comply with grant assurance 22(a), “Economic Nondiscrimination,” which states that an airport ––––––––––––––––
8 FAA Modernization and Reform Act of 2012 sets a January 1, 2016 ban of Stage 2 aircraft less than 75,000 lbs. 9 The Final Rule was published on October 4, 2017.
Boston-Logan International Airport 2016 EDR
Appendix H, Noise Abatement H-43
operator “will make its airport available as an airport for public use on reasonable terms and without unjust discrimination to all types, kinds, and classes of aeronautical activities, including commercial aeronautical activities offering services to the public at the Airport.”10
Although several (on the order of a dozen) airports have embarked on efforts to adopt both Stage 2 and 3 restrictions in the past two decades, FAA has found that only one, Naples Municipal Airport, a GA airport in Naples, Florida, has fully complied with Part 161 analysis, notice, and documentation requirements for a ban on Stage 2 jet operations. FAA found the airport was in violation of prior to FAA grant assurances. The airport operator successfully sued FAA to overturn that ruling and has implemented the restriction.
ANCA and Part 161 specifically exempt Stage 3 use restrictions that were effective on or before October 1, 1990 and Stage 2 restrictions that were proposed before that date. The Logan Airport Noise Rules were promulgated in 1986; therefore, ANCA and Part 161 have no bearing on their continued implementation in their current form. Any future proposals to make the rules more stringent regarding Stage 2 operations or to restrict Stage 3 operations in any way would almost certainly trigger Part 161 notice, analysis, and approval processes for Stage 3 restrictions. In 2006, Massport requested an opinion from FAA regarding the pursuit of a Part 161 waiver or exemption to allow Massport to implement a curfew of nighttime operations of hush-kitted Stage 3 aircraft. FAA informed Massport that a waiver or exemption from the requirements of Part 161 is not authorized under, or consistent with, federal statutory and regulatory requirements. A copy of FAA’s letter to Massport was provided in Appendix H, Noise Abatement in the 2005 EDR.
Logan Airport RC for AEDTTM Data Inputs
To relate portions of the foregoing discussion to the specific noise environment around Logan Airport, for this 2016 EDR, Massport has produced a set of DNL noise contours, TA noise metrics, and population counts for 2016 using the software pre-processor RC for AEDTTM. This software takes radar data from individual flights occurring throughout the year, processes the information, and formats it into a form usable as input to the latest version of FAA’s AEDT, which serves as the computational “engine” for calculating noise. Version 2c SP2 was used for 2016. The RC for AEDTTM system used the individual flight tracks taken directly from the Massport Noise and Operations Management System (NOMS) rather than relying on consolidated data summaries. Prior year INM studies used RealContoursTM which operated in a similar manner. For 2015, the INM noise model used 370,014 flights from the NOMS that retained suitable data. For 2016, the AEDT noise model used 388,857 flights from the NOMS that retained suitable data.
–––––––––––––––– 10 FAA Order 5190.6(b), “Airport Compliance Manual” Chapter 13, Section 14, paragraph (a). To be approved, restrictions
must meet the following six statutory criteria: 1) The proposed restriction is reasonable, nonarbitrary, and nondiscriminatory. 2) The proposed restriction does not create an undue burden on interstate or foreign commerce. 3) The proposed restriction maintains safe and efficient use of the navigable airspace. 4) The proposed restriction does not conflict with any existing federal statute or regulation. 5) The applicant has provided adequate opportunity for public comment on the proposed restriction. 6) The proposed restriction does not create an undue burden on the national aviation system.
Boston-Logan International Airport 2016 EDR
Appendix H, Noise Abatement H-44
Overview
Standard AEDT input methodology involves development of operational inputs and calculation of the DNL for a prototypical average annual day.11 This approach requires manually collecting, refining, and entering the enormous amount of data averaged over a full year of activity at an airport. Typically, the model inputs may include an aircraft fleet mix with several dozen representative aircraft types, on the order of 100 to 300 representative flight tracks (common for a facility the size of Logan Airport), and runway use and flight track use percentages for three or four categories of aircraft types with similar performance characteristics.
This normal approach to noise modeling meets accepted professional standards, and reduces the effort and cost that would be associated with manually entering the parameters for every actual operation. However, it represents a significant simplification of the extraordinary diversity of actual aircraft operations over a year. It also does not take full advantage of the investment that Massport has made in installing and maintaining a state-of-the-art radar system,12 which automatically collects flight track data and flight identification data for all operations at the Airport and feeds the NOMS.
Instead, for this report, Massport has utilized an AEDT pre-processor, RC for AEDTTM, which takes maximum possible advantage of both AEDT’s capabilities and the investment that Massport has made in operations monitoring. RC for AEDTTM automates the process of preparing the AEDT inputs directly from the actual flight operations, and permits airports to model the full diversity of activity as precisely as possible, at a cost equivalent to the more simplified manual approach. RC for AEDT™ improves the precision of modeling by utilizing operations monitoring results in five key areas:
Directly converts the flight track for every identified aircraft operation to an AEDT track, rather than assigning multiple operations to a limited number of prototypical tracks.
Models each operation on the specific runway that it actually used, rather than applying a generalized distribution to broad ranges of aircraft types.
Models each operation in the period that it occurred, which considers delays at the Airport during the year.
Selects the specific airframe and engine combination to model, on an operation-by-operation basis, based on the registration data for each flight wherever possible; otherwise, the published compositions of the fleets of the specific airlines operating at Logan Airport are used.
Figure H-12 provides a schematic representation of the RC for AEDTTM noise modeling process compared to the standard AEDT process.
–––––––––––––––– 11 FAA INM Version 7.0 User’s Guide, April 2007, p. 12. 12 Starting in 2010, the Massport system utilized the Airscene.com product of Era Corporation. The radar data source has
been updated and the system is now provided by Harris.
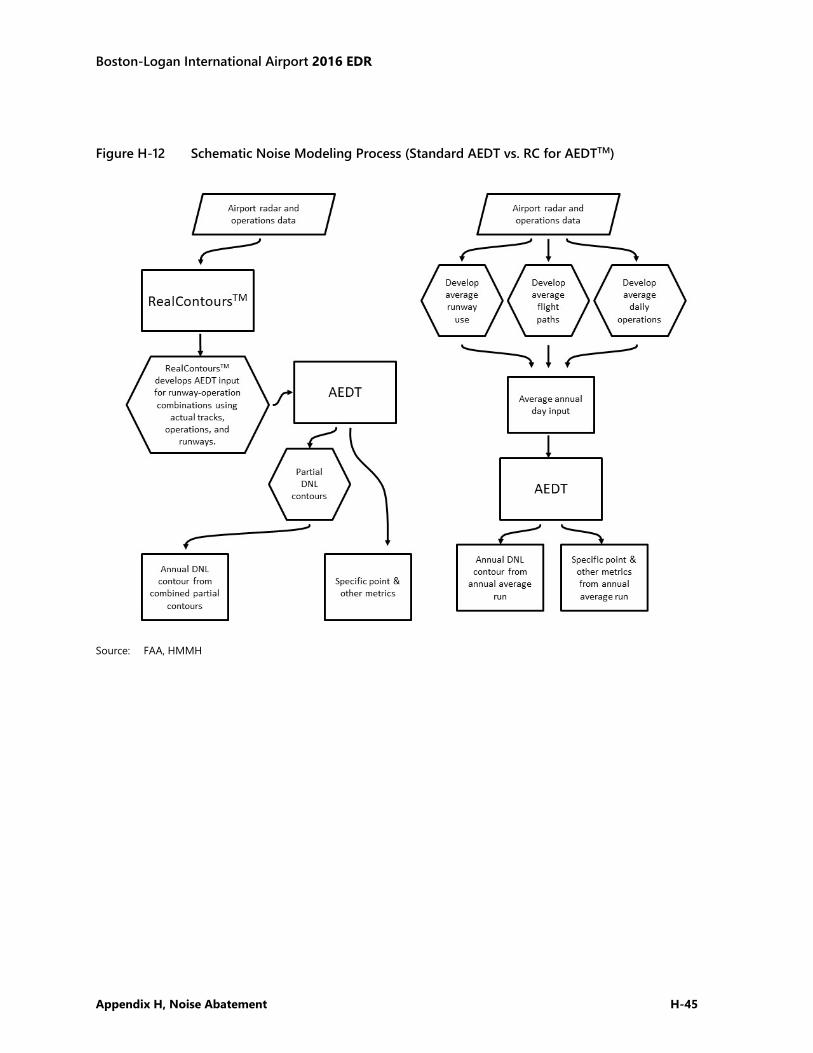
Boston-Logan International Airport 2016 EDR
Appendix H, Noise Abatement H-45
Figure H-12 Schematic Noise Modeling Process (Standard AEDT vs. RC for AEDTTM)
Source: FAA, HMMH
Boston-Logan International Airport 2016 EDR
Appendix H, Noise Abatement H-46
AEDT 2C SP2 Model FAA’s AEDT version 2c Service Pack 2 (AEDT 2cSP2) was released for general use on March 13, 2017. The latest version has been used for the 2016 DNL contour in this report as the primary analytical tool to assess the noise environment at Logan Airport. This version of the model includes data for the Boeing 787-8R, Embraer E170, and Embraer E190, all types in use at Logan Airport.
The remaining sections of this appendix provide several tables describing the data for 2016. Where possible, the data for 2015 are included for comparison and in general the tables listed as (a) are for 2015 and (b) for 2016.
2016 Radar Data
Logan Airport’s radar data provide the key to the RC for AEDT™ system. Since February 2004, Massport has collected Passive Surveillance Radar System (PASSUR) radar data, which supplies information to the Airport’s web-based Airport Monitor software. This dataset was used for the 2004 Environmental Status and Planning Report (2004 ESPR) through the 2008 EDR. Beginning with the 2009 EDR, Massport began utilizing the radar data from its Harris NOMS system. These radar data are obtained from a multilateration system of eight sensors deployed around the Airport. The positioning data from these sensors are correlated to provide better, more accurate coverage of aircraft (in areas where the traditional FAA radar has limitations) and provide a more complete set of points to define each track. Traditional radar provides points every four to five seconds where the multilateration system provides data every second.
In 2015, the Massport system switched to FAA’s Nextgen data feed, which integrates the Automatic Dependent Surveillance Broadcast (ADS-B) feed with multiple redundant real-time FAA surveillance sources into a single fused data feed. The NextGen data is a “multisensor based” subscription data source that aggregates all available surveillance sources, including:
FAA En Route Radars;
FAA Terminal Radars;
FAA Airport Surface Detection Equipment X Band (ASDE-X) Systems;
FAA Aircraft Situational Display to Industry (ASDI) Oceanic and Canadian Tracks only; and
Harris ADS-B Data Feed.
Logan Airport is supported by an FAA ASDE-X system which provides highly accurate one-second data points for aircraft situational awareness on the Airport and within at least 5 miles of the Airport. These data are fused with the other sources and provided to the Massport NOMS system in a geo-referenced data format. The geo-referenced radar data are imported into the AEDT model, which is built on a geo-referenced platform to retain accuracy of the data for modeling.
The system was able to collect 366 complete days of data for 2016 with approximately 98 percent of these tracks usable for the development of the noise exposure contours.
Fleet Mix
The 2016 radar data was first processed to establish a baseline set of operations. After processing the 366 days of radar data (396,615 operations), flight tracks with sufficient operational information were identified to use as the baseline for the 2016 contours. The operations from these tracks were then scaled
Boston-Logan International Airport 2016 EDR
Appendix H, Noise Abatement H-47
upwards by airline and aircraft type to match the reported totals provided by Massport for 2016. Tables H-1a (2015 for comparison) and H-1b (2016) provide the scaled annual operations, by INM aircraft type. Each INM type listed in Tables H-1a and H-1b is also mapped to a Runway Use group based on its weight and performance characteristics described in the Runway Use section below.
Regional jets (RJ) are defined as those aircraft with 90 or fewer seats, consistent with the categorization in Chapter 2, Activity Levels.13 For years prior to 2010, the RJs in this report were classified as aircraft with less than 100 seats. When RJs first started gaining popularity, the aircraft types available were typically 50 seats or less with the traditional air carrier jet being 100 seats and higher. As newer aircraft types have become available, the smaller 35 to 50 seat types have been replaced by 70 to 99-seat types, with the 90 and above seat types flying many of the traditional air carrier routes. The majority of the newer types fall into two categories: the 70 to 75-seat category, which remain categorized as RJs, and the 91- to 99-seat category, which are categorized as air carrier jets. The Embraer 190 falls into this category and is now in the Light Jet B group.
AEDT Analysis
In 2015, FAA released its next-generation environmental analysis software, the Aviation Environmental Design Tool (AEDT) version 2B.14 AEDT incorporates the computational engines of the legacy tools INM and the Emissions and Dispersion Modeling System (EDMS), and provides a unified database back end and graphical user interface. With a common set of aircraft and airport data that are updated regularly, AEDT ensures that noise and emissions analyses can be performed with up-to-date information.
Massport first explored the use of AEDT for the 2015 EDR. Logan Airport presents a set of unique challenges to modeling software, and over the course of several years, Massport has addressed these challenges by developing a series of adjustments and customizations to better represent the operations, conditions, and terrain that affect noise at Logan Airport. These adjustments have historically been incorporated into INM analyses, and an AEDT analysis would need to incorporate equivalent features to continue the modeling accuracy of previous efforts. These unique analysis features include:
Custom profiles. The analysis has developed custom climbing and descent profiles based on radar altitude data, rather than using default profiles built into INM. This results in more accurate aircraft thrust calculations, which in turn affects an aircraft’s noise emissions.
Daily weather data. Noise calculations have used average weather conditions for each day to determine aircraft performance and sound propagation.
Hill effect adjustment. Due to discrepancies between noise monitor data and INM calculations in the Orient Heights area close to the Airport, adjustments have been included to improve the accuracy of calculations in areas with direct line-of-sight exposure to the airfield.
–––––––––––––––– 13 U.S. Code, 2006 Edition, Supplement 3, Title 49 – Transportation Subtitle VII – Aviation Programs Part A – Air Commerce
and Safety, Subpart II, Economic Regulation, Chapter 417 - Operations or Carriers, Subchapter III - Regional Air Service Incentive Program, Sec. 41762 – Definitions – defines RJ air carrier service to be aircraft with a maximum of 75 seats. Therefore, this report categorizes aircraft with 70-75 seats and below as RJ and aircraft with 90 seats and higher aircraft as air carrier (Note: there are no types with 75 to 90 seats).
14 AEDT 2A was released in 2013 and replaced the NIRS model for airspace analysis. AEDT 2B replaces, AEDT 2A, INM and EDMS.
Boston-Logan International Airport 2016 EDR
Appendix H, Noise Abatement H-48
Over water adjustment. The INM calculations assume that noise is absorbed as it propagates over ground. However, Logan Airport is mostly surrounded by water, which reflects rather than absorbs the sound. This results in higher noise levels in areas near the Airport. An adjustment has been used that allows the INM to assume higher aircraft noise emissions when they are close to the ground.
In transitioning from INM to AEDT, Massport has investigated how to implement these adjustments in the new software. At the same time, Massport has coordinated with FAA regarding approval of any adjustments proposed. While the Massachusetts state EDR/ESPR process does not require FAA approval, Massport wishes to perform analysis to FAA standards. Massport has held numerous meetings with FAA since the release of AEDT to get approval for adjustments to AEDT. The final set of formal request memoranda from Massport to FAA, and FAA’s responses, are presented at the end of Chapter 6, Noise Abatement and the original request and response memoranda are presented at the beginning of this appendix. The following is a summary of the measures proposed to address the adjustments previously implemented in INM, and FAA’s response.
Altitude control codes. This feature of AEDT performs a similar function to the custom profiles used previously, using altitude data to more accurately calculate aircraft thrust levels. Since this is a capability built into AEDT, FAA approval is implicit and was not requested.
Aircraft weight adjustment. It has been determined that aircraft takeoff weights, based on Department of Transportation T-100 data, do not always match the weight assumptions made by AEDT. Consequently, an adjustment has been made to more accurately represent takeoff weight, and therefore aircraft thrust during takeoff. FAA concurs with this approach.
Annual weather. AEDT by default uses 30-year average weather for the Airport. Massport has proposed using an annual average for the year under study to better capture year-to-year variations in weather.15 FAA concurs with this approach.
Hill effects. Massport has proposed including the adjustments previously used in INM. FAA does not concur with this approach. There are ongoing research studies to develop modifications to the AEDT model and FAA recommends waiting until those methods are available.
Over water adjustment. Massport explored other options including the existing INM adjustment method. Massport proposed including the adjustments previously used in INM. FAA does not concur with this approach. There are ongoing research studies to develop modifications to the AEDT model and FAA recommends waiting until those methods are available.
Massport will continue to work with FAA to address these issues and to incorporate enhancements to AEDT as they become available.
At this time, FAA has approved adjustments for annual average weather and aircraft weight correction, but disapproved adjustments for over-water effects and elevated terrain line-of-sight exposure. Massport has performed an AEDT analysis for 2016 using only FAA-approved adjustments.
–––––––––––––––– 15 Daily weather is currently not an option in AEDT modeling inputs, however Massport will continue to request that FAA
allow for such an option.
Boston-Logan International Airport 2016 EDR
Appendix H, Noise Abatement H-49
Table H-1a 2015 Annual Modeled Operations
Arrivals Departures
INM Type Group Day Night Day Night Total
Commercial Jet Operations 74720B Heavy Jet A 1 0 0 1 2 747400 Heavy Jet A 1,260 33 862 431 2,586 7478 Heavy Jet A 156 0 150 5 311 A340-211 Heavy Jet A 564 6 191 379 1,139 A340-642 Heavy Jet A 350 0 230 120 701 767300 Heavy Jet B 976 489 824 641 2,931 767400 Heavy Jet B 282 3 252 33 570 767CF6 Heavy Jet B 69 7 49 27 151 767JT9 Heavy Jet B 95 28 19 104 245 777200 Heavy Jet B 583 110 578 116 1,387 7773ER Heavy Jet B 581 66 129 518 1,293 7878R Heavy Jet B 870 0 747 123 1,739 A300-622R Heavy Jet B 182 448 314 316 1,259 A310-304 Heavy Jet B 240 18 58 200 517 A330-301 Heavy Jet B 1,399 9 1,050 359 2,817 A330-343 Heavy Jet B 553 7 395 165 1,119 DC1010 Heavy Jet B 217 186 218 185 806 DC1030 Heavy Jet B 64 50 53 60 227 MD11GE Heavy Jet B 32 9 27 15 82 MD11PW Heavy Jet B 12 12 9 15 48 717200 Light Jet A 3,814 656 3,892 579 8,942 727EM2 Light Jet A 0 2 2 0 4 MD9025 Light Jet A 1,129 114 1,172 72 2,487 MD9028 Light Jet A 554 44 569 30 1,197 737300 Light Jet B 1,963 353 1,939 377 4,633 7373B2 Light Jet B 127 27 128 26 308 737400 Light Jet B 27 14 26 15 82 737500 Light Jet B 0 0 0 0 0 737700 Light Jet B 6,690 2,432 7,468 1,657 18,247 737800 Light Jet B 13,986 5,609 16,305 3,289 39,188 757300 Light Jet B 558 290 615 233 1,696 757PW Light Jet B 2,193 550 2,392 352 5,487 757RR Light Jet B 2,677 473 2,670 480 6,300 A319-131 Light Jet B 9,100 2,030 9,717 1,413 22,260 A320-211 Light Jet B 3,809 1,085 4,255 639 9,788 A320-232 Light Jet B 16,664 5,833 19,778 2,719 44,994 A321-232 Light Jet B 2,704 877 2,975 607 7,163 EMB190 Light Jet B 27,031 3,582 26,711 3,908 61,232 EMB195 Light Jet B 1,720 198 1,732 186 3,836 MD82 Light Jet B 15 0 15 0 30
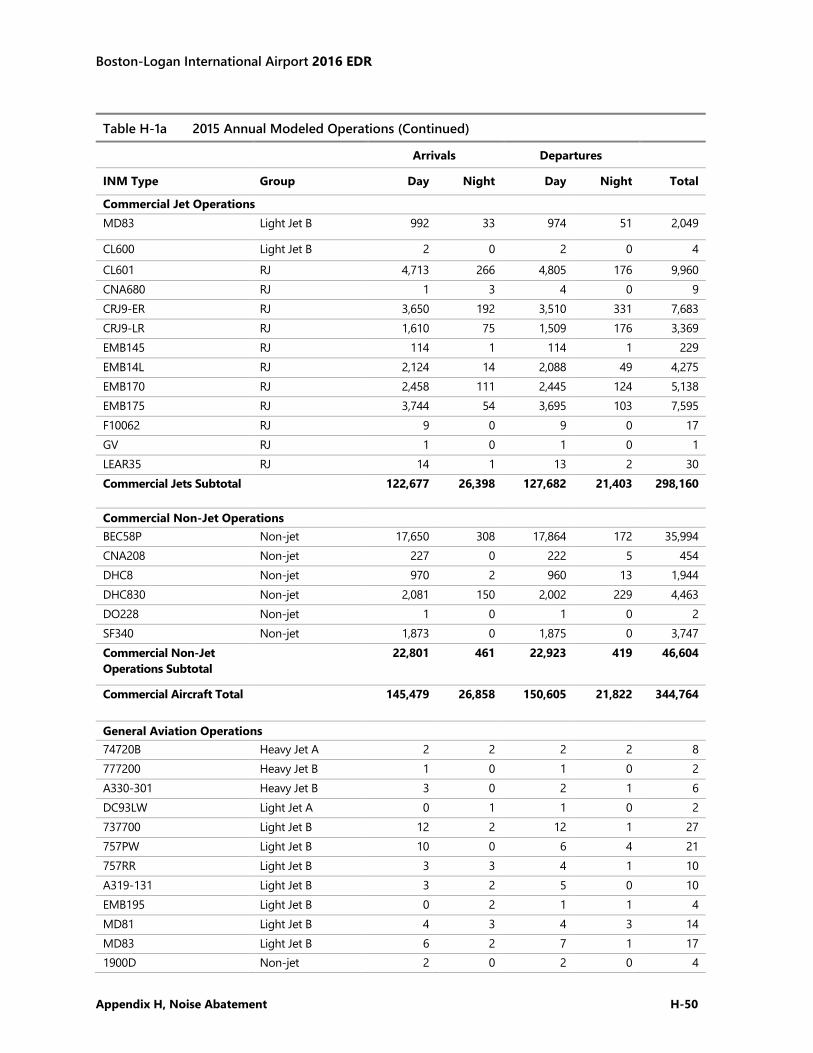
Boston-Logan International Airport 2016 EDR
Appendix H, Noise Abatement H-50
Table H-1a 2015 Annual Modeled Operations (Continued)
Arrivals Departures
INM Type Group Day Night Day Night Total
Commercial Jet Operations MD83 Light Jet B 992 33 974 51 2,049
CL600 Light Jet B 2 0 2 0 4
CL601 RJ 4,713 266 4,805 176 9,960 CNA680 RJ 1 3 4 0 9 CRJ9-ER RJ 3,650 192 3,510 331 7,683 CRJ9-LR RJ 1,610 75 1,509 176 3,369 EMB145 RJ 114 1 114 1 229 EMB14L RJ 2,124 14 2,088 49 4,275 EMB170 RJ 2,458 111 2,445 124 5,138 EMB175 RJ 3,744 54 3,695 103 7,595 F10062 RJ 9 0 9 0 17 GV RJ 1 0 1 0 1 LEAR35 RJ 14 1 13 2 30 Commercial Jets Subtotal 122,677 26,398 127,682 21,403 298,160
Commercial Non-Jet Operations BEC58P Non-jet 17,650 308 17,864 172 35,994 CNA208 Non-jet 227 0 222 5 454 DHC8 Non-jet 970 2 960 13 1,944 DHC830 Non-jet 2,081 150 2,002 229 4,463 DO228 Non-jet 1 0 1 0 2 SF340 Non-jet 1,873 0 1,875 0 3,747 Commercial Non-Jet Operations Subtotal
22,801 461 22,923 419 46,604
Commercial Aircraft Total 145,479 26,858 150,605 21,822 344,764
General Aviation Operations 74720B Heavy Jet A 2 2 2 2 8 777200 Heavy Jet B 1 0 1 0 2 A330-301 Heavy Jet B 3 0 2 1 6 DC93LW Light Jet A 0 1 1 0 2 737700 Light Jet B 12 2 12 1 27 757PW Light Jet B 10 0 6 4 21 757RR Light Jet B 3 3 4 1 10 A319-131 Light Jet B 3 2 5 0 10 EMB195 Light Jet B 0 2 1 1 4 MD81 Light Jet B 4 3 4 3 14 MD83 Light Jet B 6 2 7 1 17 1900D Non-jet 2 0 2 0 4
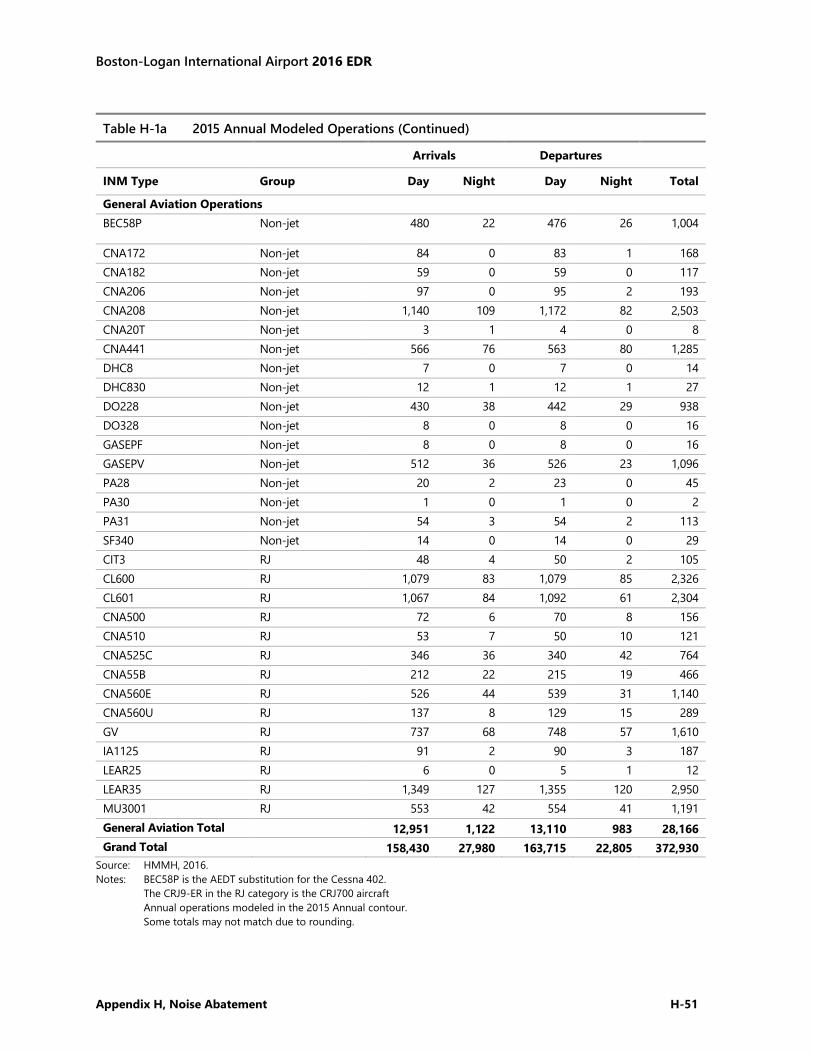
Boston-Logan International Airport 2016 EDR
Appendix H, Noise Abatement H-51
Table H-1a 2015 Annual Modeled Operations (Continued)
Arrivals Departures
INM Type Group Day Night Day Night Total
General Aviation Operations BEC58P Non-jet 480 22 476 26 1,004
CNA172 Non-jet 84 0 83 1 168 CNA182 Non-jet 59 0 59 0 117 CNA206 Non-jet 97 0 95 2 193 CNA208 Non-jet 1,140 109 1,172 82 2,503 CNA20T Non-jet 3 1 4 0 8 CNA441 Non-jet 566 76 563 80 1,285 DHC8 Non-jet 7 0 7 0 14 DHC830 Non-jet 12 1 12 1 27 DO228 Non-jet 430 38 442 29 938 DO328 Non-jet 8 0 8 0 16 GASEPF Non-jet 8 0 8 0 16 GASEPV Non-jet 512 36 526 23 1,096 PA28 Non-jet 20 2 23 0 45 PA30 Non-jet 1 0 1 0 2 PA31 Non-jet 54 3 54 2 113 SF340 Non-jet 14 0 14 0 29 CIT3 RJ 48 4 50 2 105 CL600 RJ 1,079 83 1,079 85 2,326 CL601 RJ 1,067 84 1,092 61 2,304 CNA500 RJ 72 6 70 8 156 CNA510 RJ 53 7 50 10 121 CNA525C RJ 346 36 340 42 764 CNA55B RJ 212 22 215 19 466 CNA560E RJ 526 44 539 31 1,140 CNA560U RJ 137 8 129 15 289 GV RJ 737 68 748 57 1,610 IA1125 RJ 91 2 90 3 187 LEAR25 RJ 6 0 5 1 12 LEAR35 RJ 1,349 127 1,355 120 2,950 MU3001 RJ 553 42 554 41 1,191 General Aviation Total 12,951 1,122 13,110 983 28,166 Grand Total 158,430 27,980 163,715 22,805 372,930
Source: HMMH, 2016. Notes: BEC58P is the AEDT substitution for the Cessna 402. The CRJ9-ER in the RJ category is the CRJ700 aircraft Annual operations modeled in the 2015 Annual contour. Some totals may not match due to rounding.

Boston-Logan International Airport 2016 EDR
Appendix H, Noise Abatement H-52
Table H-1b 2016 Annual Modeled Operations
Arrivals Departures
INM Type Group Day Night Day Night Total
Commercial Jet Operations 747400 HJA 877 19 491 405 1,792 7478 HJA 274 1 260 15 549 A340-211 HJA 125 0 51 75 250 A340-642 HJA 502 1 400 103 1,006 A380-841 HJA 1 1 2 0 4 A380-861 HJA 1 0 1 0 2 767300 HJB 1,051 582 979 653 3,264 767400 HJB 484 2 480 6 972 767CF6 HJB 70 1 67 3 141 767JT9 HJB 27 0 19 8 54 777200 HJB 775 123 789 109 1,797 777300 HJB 1 0 1 0 2 7773ER HJB 962 102 452 611 2,127 7878R HJB 1,224 33 1,141 117 2,515 A300-622R HJB 188 478 328 338 1,331 A310-304 HJB 190 36 91 135 451 A330-301 HJB 2,354 27 1,654 728 4,764 A330-343 HJB 1,062 7 549 520 2,138 DC1010 HJB 256 188 268 175 886 DC1030 HJB 74 48 74 47 242 MD11GE HJB 37 20 27 29 113 MD11PW HJB 22 12 18 16 68 717200 LJA 2,798 413 2,866 345 6,421 727EM2 LJA 1 0 1 0 1 MD9025 LJA 1,064 161 1,064 161 2,450 MD9028 LJA 538 72 536 74 1,220 737300 LJB 1,792 324 1,829 287 4,234 7373B2 LJB 112 25 120 18 274 737400 LJB 11 5 8 8 32 737500 LJB 1 0 1 0 2 737700 LJB 7,262 2,260 7,908 1,613 19,042 737800 LJB 16,665 6,965 19,675 3,954 47,259 737N17 LJB 1 0 1 0 2 757300 LJB 815 436 1,008 242 2,501 757PW LJB 1,516 547 1,583 480 4,125 757RR LJB 2,353 481 2,411 423 5,668 A319-131 LJB 9,753 1,822 10,077 1,499 23,151 A320-211 LJB 3,879 900 4,417 362 9,557 A320-232 LJB 17,885 6,357 20,796 3,446 48,484 A321-232 LJB 5,299 1,552 5,750 1,101 13,702 EMB190 LJB 26,332 2,907 25,460 3,779 58,477
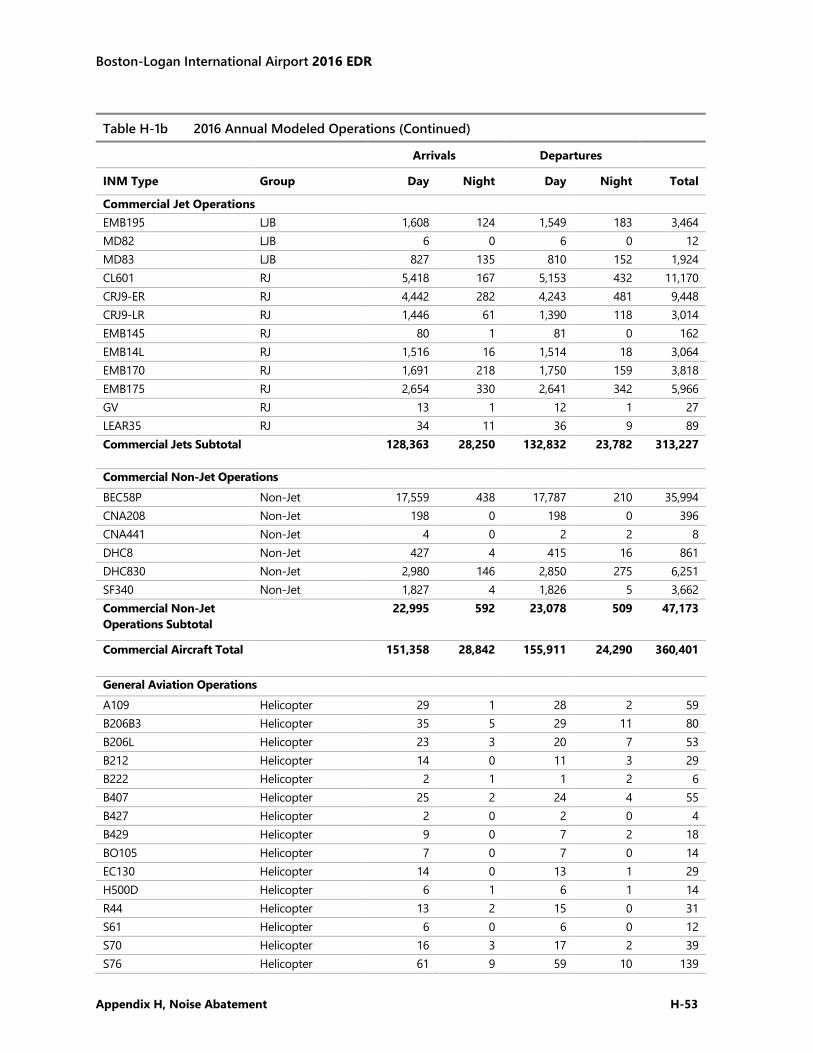
Boston-Logan International Airport 2016 EDR
Appendix H, Noise Abatement H-53
Table H-1b 2016 Annual Modeled Operations (Continued)
Arrivals Departures
INM Type Group Day Night Day Night Total
Commercial Jet Operations EMB195 LJB 1,608 124 1,549 183 3,464 MD82 LJB 6 0 6 0 12 MD83 LJB 827 135 810 152 1,924 CL601 RJ 5,418 167 5,153 432 11,170 CRJ9-ER RJ 4,442 282 4,243 481 9,448 CRJ9-LR RJ 1,446 61 1,390 118 3,014 EMB145 RJ 80 1 81 0 162 EMB14L RJ 1,516 16 1,514 18 3,064 EMB170 RJ 1,691 218 1,750 159 3,818 EMB175 RJ 2,654 330 2,641 342 5,966 GV RJ 13 1 12 1 27 LEAR35 RJ 34 11 36 9 89 Commercial Jets Subtotal 128,363 28,250 132,832 23,782 313,227
Commercial Non-Jet Operations BEC58P Non-Jet 17,559 438 17,787 210 35,994 CNA208 Non-Jet 198 0 198 0 396 CNA441 Non-Jet 4 0 2 2 8 DHC8 Non-Jet 427 4 415 16 861 DHC830 Non-Jet 2,980 146 2,850 275 6,251 SF340 Non-Jet 1,827 4 1,826 5 3,662 Commercial Non-Jet Operations Subtotal
22,995 592 23,078 509 47,173
Commercial Aircraft Total 151,358 28,842 155,911 24,290 360,401
General Aviation Operations A109 Helicopter 29 1 28 2 59 B206B3 Helicopter 35 5 29 11 80 B206L Helicopter 23 3 20 7 53 B212 Helicopter 14 0 11 3 29 B222 Helicopter 2 1 1 2 6 B407 Helicopter 25 2 24 4 55 B427 Helicopter 2 0 2 0 4 B429 Helicopter 9 0 7 2 18 BO105 Helicopter 7 0 7 0 14 EC130 Helicopter 14 0 13 1 29 H500D Helicopter 6 1 6 1 14 R44 Helicopter 13 2 15 0 31 S61 Helicopter 6 0 6 0 12 S70 Helicopter 16 3 17 2 39 S76 Helicopter 61 9 59 10 139
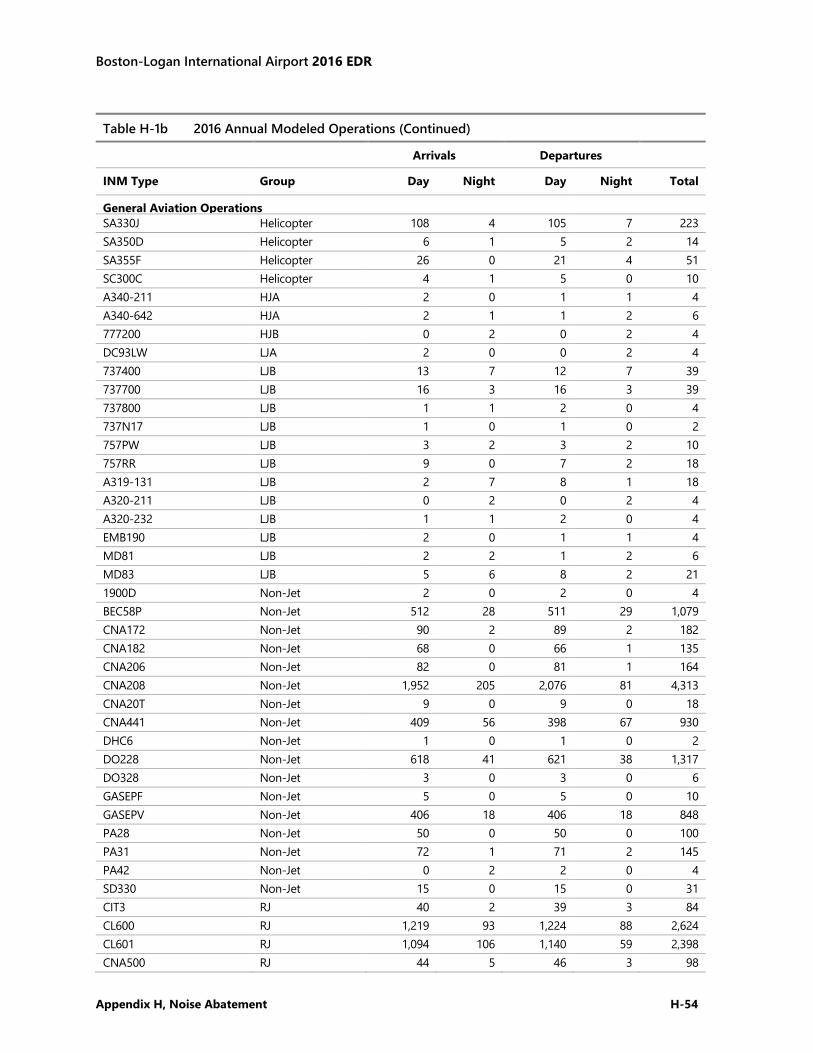
Boston-Logan International Airport 2016 EDR
Appendix H, Noise Abatement H-54
Table H-1b 2016 Annual Modeled Operations (Continued)
Arrivals Departures
INM Type Group Day Night Day Night Total
General Aviation Operations SA330J Helicopter 108 4 105 7 223 SA350D Helicopter 6 1 5 2 14 SA355F Helicopter 26 0 21 4 51 SC300C Helicopter 4 1 5 0 10 A340-211 HJA 2 0 1 1 4 A340-642 HJA 2 1 1 2 6 777200 HJB 0 2 0 2 4 DC93LW LJA 2 0 0 2 4 737400 LJB 13 7 12 7 39 737700 LJB 16 3 16 3 39 737800 LJB 1 1 2 0 4 737N17 LJB 1 0 1 0 2 757PW LJB 3 2 3 2 10 757RR LJB 9 0 7 2 18 A319-131 LJB 2 7 8 1 18 A320-211 LJB 0 2 0 2 4 A320-232 LJB 1 1 2 0 4 EMB190 LJB 2 0 1 1 4 MD81 LJB 2 2 1 2 6 MD83 LJB 5 6 8 2 21 1900D Non-Jet 2 0 2 0 4 BEC58P Non-Jet 512 28 511 29 1,079 CNA172 Non-Jet 90 2 89 2 182 CNA182 Non-Jet 68 0 66 1 135 CNA206 Non-Jet 82 0 81 1 164 CNA208 Non-Jet 1,952 205 2,076 81 4,313 CNA20T Non-Jet 9 0 9 0 18 CNA441 Non-Jet 409 56 398 67 930 DHC6 Non-Jet 1 0 1 0 2 DO228 Non-Jet 618 41 621 38 1,317 DO328 Non-Jet 3 0 3 0 6 GASEPF Non-Jet 5 0 5 0 10 GASEPV Non-Jet 406 18 406 18 848 PA28 Non-Jet 50 0 50 0 100 PA31 Non-Jet 72 1 71 2 145 PA42 Non-Jet 0 2 2 0 4 SD330 Non-Jet 15 0 15 0 31 CIT3 RJ 40 2 39 3 84 CL600 RJ 1,219 93 1,224 88 2,624 CL601 RJ 1,094 106 1,140 59 2,398 CNA500 RJ 44 5 46 3 98
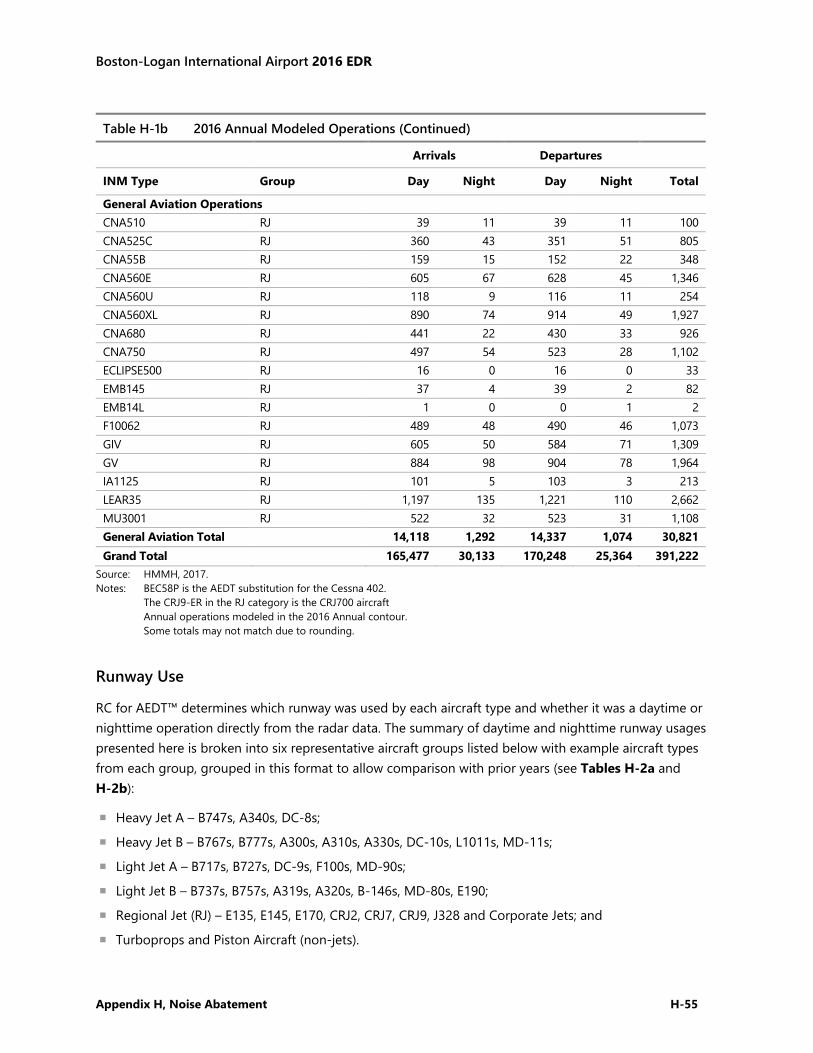
Boston-Logan International Airport 2016 EDR
Appendix H, Noise Abatement H-55
Table H-1b 2016 Annual Modeled Operations (Continued)
Arrivals Departures
INM Type Group Day Night Day Night Total
General Aviation Operations CNA510 RJ 39 11 39 11 100 CNA525C RJ 360 43 351 51 805 CNA55B RJ 159 15 152 22 348 CNA560E RJ 605 67 628 45 1,346 CNA560U RJ 118 9 116 11 254 CNA560XL RJ 890 74 914 49 1,927 CNA680 RJ 441 22 430 33 926 CNA750 RJ 497 54 523 28 1,102 ECLIPSE500 RJ 16 0 16 0 33 EMB145 RJ 37 4 39 2 82 EMB14L RJ 1 0 0 1 2 F10062 RJ 489 48 490 46 1,073 GIV RJ 605 50 584 71 1,309 GV RJ 884 98 904 78 1,964 IA1125 RJ 101 5 103 3 213 LEAR35 RJ 1,197 135 1,221 110 2,662 MU3001 RJ 522 32 523 31 1,108 General Aviation Total 14,118 1,292 14,337 1,074 30,821 Grand Total 165,477 30,133 170,248 25,364 391,222
Source: HMMH, 2017. Notes: BEC58P is the AEDT substitution for the Cessna 402. The CRJ9-ER in the RJ category is the CRJ700 aircraft Annual operations modeled in the 2016 Annual contour. Some totals may not match due to rounding.
Runway Use
RC for AEDT™ determines which runway was used by each aircraft type and whether it was a daytime or nighttime operation directly from the radar data. The summary of daytime and nighttime runway usages presented here is broken into six representative aircraft groups listed below with example aircraft types from each group, grouped in this format to allow comparison with prior years (see Tables H-2a and H-2b):
Heavy Jet A – B747s, A340s, DC-8s;
Heavy Jet B – B767s, B777s, A300s, A310s, A330s, DC-10s, L1011s, MD-11s;
Light Jet A – B717s, B727s, DC-9s, F100s, MD-90s;
Light Jet B – B737s, B757s, A319s, A320s, B-146s, MD-80s, E190;
Regional Jet (RJ) – E135, E145, E170, CRJ2, CRJ7, CRJ9, J328 and Corporate Jets; and
Turboprops and Piston Aircraft (non-jets).
Boston-Logan International Airport 2016 EDR
Appendix H, Noise Abatement H-56
Table H-2a shows the runway use that was used to model the 2015 noise conditions. Table H-2b shows the runway used to model the 2016 noise conditions. As described above, turbojet aircraft in the table were grouped into different categories for reporting purposes. Because the 2015 contours developed using RealContours™ and 2016 contours developed using RC for AEDTTM reflect the individual use of the runways by each INM aircraft type, they accurately represent Logan Airport’s noisiest aircraft by modeling them on the actual runways that they used during the year. The modeled runway use for each particular aircraft type may be different from the overall group runway use presented in Table H-2a for 2015 and Table H-2b for 2016.
Comparing Table H-2b (2016) with the similar Table H-2a (2015) in this 2016 EDR, the largest change was a 20 percent decrease in the share of nighttime arrivals of the Heavy Jet B group on Runway 33L. These operations shifted to Runway 22L and Runway 27, with increases of 14 percent and 9 percent, respectively.
Departures on Runway 33L showed the broadest increases. Heavy Jet departures from Runway 33L had increased shares for both nighttime and daytime operations. The share of operations on Runway 22R fell broadly across all aircraft groups, with the largest decrease among Heavy Jet A aircraft.
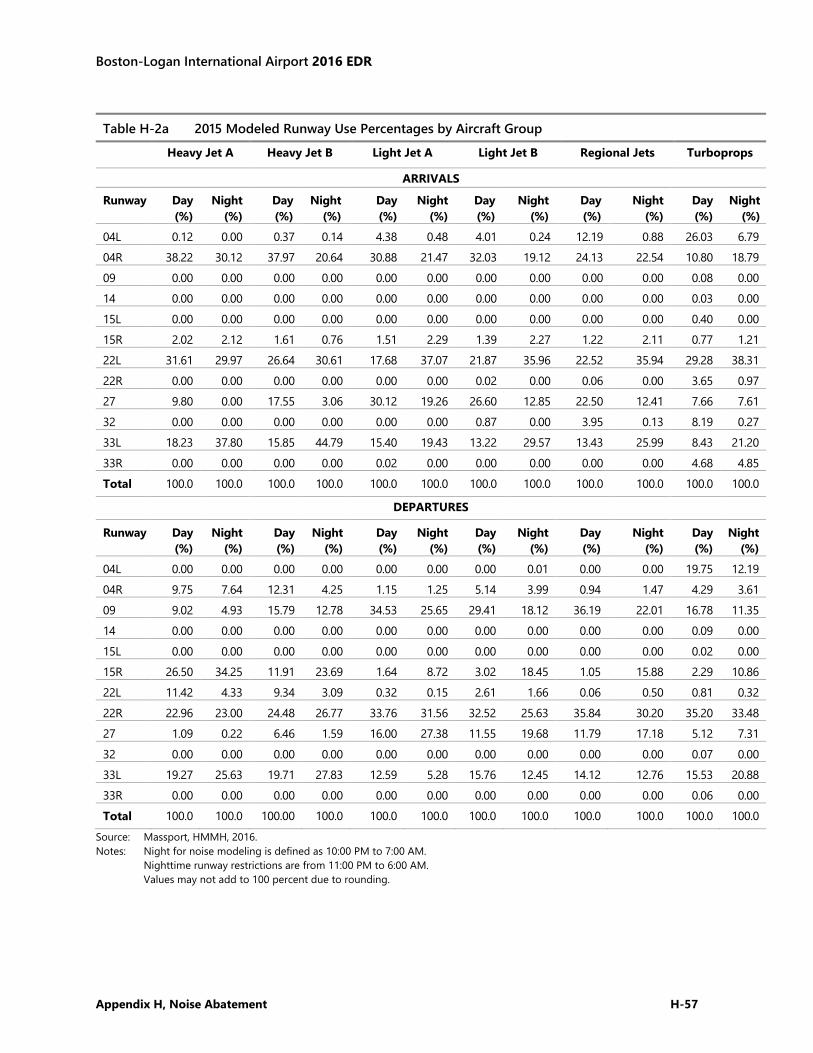
Boston-Logan International Airport 2016 EDR
Appendix H, Noise Abatement H-57
Table H-2a 2015 Modeled Runway Use Percentages by Aircraft Group
Heavy Jet A Heavy Jet B Light Jet A Light Jet B Regional Jets Turboprops
ARRIVALS
Runway Day (%)
Night (%)
Day (%)
Night (%)
Day (%)
Night (%)
Day (%)
Night (%)
Day (%)
Night (%)
Day (%)
Night (%)
04L 0.12 0.00 0.37 0.14 4.38 0.48 4.01 0.24 12.19 0.88 26.03 6.79 04R 38.22 30.12 37.97 20.64 30.88 21.47 32.03 19.12 24.13 22.54 10.80 18.79 09 0.00 0.00 0.00 0.00 0.00 0.00 0.00 0.00 0.00 0.00 0.08 0.00 14 0.00 0.00 0.00 0.00 0.00 0.00 0.00 0.00 0.00 0.00 0.03 0.00 15L 0.00 0.00 0.00 0.00 0.00 0.00 0.00 0.00 0.00 0.00 0.40 0.00 15R 2.02 2.12 1.61 0.76 1.51 2.29 1.39 2.27 1.22 2.11 0.77 1.21 22L 31.61 29.97 26.64 30.61 17.68 37.07 21.87 35.96 22.52 35.94 29.28 38.31 22R 0.00 0.00 0.00 0.00 0.00 0.00 0.02 0.00 0.06 0.00 3.65 0.97 27 9.80 0.00 17.55 3.06 30.12 19.26 26.60 12.85 22.50 12.41 7.66 7.61 32 0.00 0.00 0.00 0.00 0.00 0.00 0.87 0.00 3.95 0.13 8.19 0.27 33L 18.23 37.80 15.85 44.79 15.40 19.43 13.22 29.57 13.43 25.99 8.43 21.20 33R 0.00 0.00 0.00 0.00 0.02 0.00 0.00 0.00 0.00 0.00 4.68 4.85 Total 100.0 100.0 100.0 100.0 100.0 100.0 100.0 100.0 100.0 100.0 100.0 100.0
DEPARTURES
Runway Day (%)
Night (%)
Day (%)
Night (%)
Day (%)
Night (%)
Day (%)
Night (%)
Day (%)
Night (%)
Day (%)
Night (%)
04L 0.00 0.00 0.00 0.00 0.00 0.00 0.00 0.01 0.00 0.00 19.75 12.19 04R 9.75 7.64 12.31 4.25 1.15 1.25 5.14 3.99 0.94 1.47 4.29 3.61 09 9.02 4.93 15.79 12.78 34.53 25.65 29.41 18.12 36.19 22.01 16.78 11.35 14 0.00 0.00 0.00 0.00 0.00 0.00 0.00 0.00 0.00 0.00 0.09 0.00 15L 0.00 0.00 0.00 0.00 0.00 0.00 0.00 0.00 0.00 0.00 0.02 0.00 15R 26.50 34.25 11.91 23.69 1.64 8.72 3.02 18.45 1.05 15.88 2.29 10.86 22L 11.42 4.33 9.34 3.09 0.32 0.15 2.61 1.66 0.06 0.50 0.81 0.32 22R 22.96 23.00 24.48 26.77 33.76 31.56 32.52 25.63 35.84 30.20 35.20 33.48 27 1.09 0.22 6.46 1.59 16.00 27.38 11.55 19.68 11.79 17.18 5.12 7.31 32 0.00 0.00 0.00 0.00 0.00 0.00 0.00 0.00 0.00 0.00 0.07 0.00 33L 19.27 25.63 19.71 27.83 12.59 5.28 15.76 12.45 14.12 12.76 15.53 20.88 33R 0.00 0.00 0.00 0.00 0.00 0.00 0.00 0.00 0.00 0.00 0.06 0.00 Total 100.0 100.0 100.00 100.0 100.0 100.0 100.0 100.0 100.0 100.0 100.0 100.0
Source: Massport, HMMH, 2016. Notes: Night for noise modeling is defined as 10:00 PM to 7:00 AM. Nighttime runway restrictions are from 11:00 PM to 6:00 AM. Values may not add to 100 percent due to rounding.
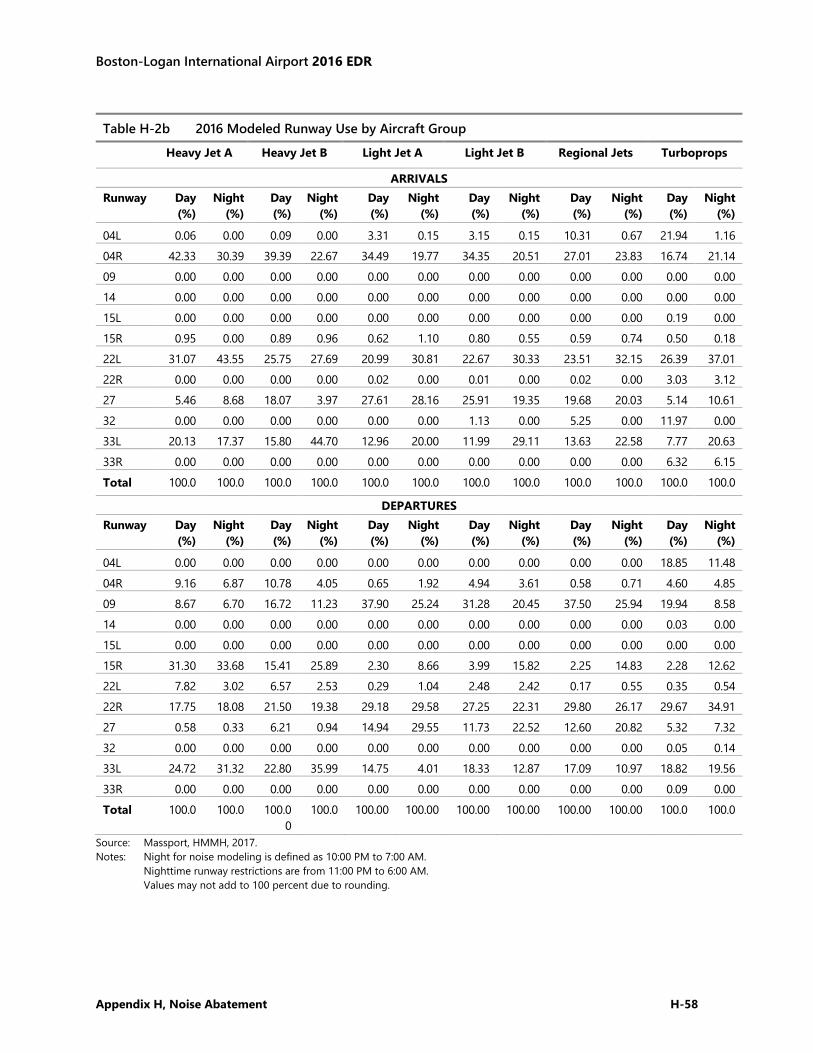
Boston-Logan International Airport 2016 EDR
Appendix H, Noise Abatement H-58
Source: Massport, HMMH, 2017. Notes: Night for noise modeling is defined as 10:00 PM to 7:00 AM. Nighttime runway restrictions are from 11:00 PM to 6:00 AM. Values may not add to 100 percent due to rounding.
Table H-2b 2016 Modeled Runway Use by Aircraft Group
Heavy Jet A Heavy Jet B Light Jet A Light Jet B Regional Jets Turboprops
ARRIVALS Runway Day
(%) Night
(%) Day (%)
Night (%)
Day (%)
Night (%)
Day (%)
Night (%)
Day (%)
Night (%)
Day (%)
Night (%)
04L 0.06 0.00 0.09 0.00 3.31 0.15 3.15 0.15 10.31 0.67 21.94 1.16 04R 42.33 30.39 39.39 22.67 34.49 19.77 34.35 20.51 27.01 23.83 16.74 21.14 09 0.00 0.00 0.00 0.00 0.00 0.00 0.00 0.00 0.00 0.00 0.00 0.00 14 0.00 0.00 0.00 0.00 0.00 0.00 0.00 0.00 0.00 0.00 0.00 0.00 15L 0.00 0.00 0.00 0.00 0.00 0.00 0.00 0.00 0.00 0.00 0.19 0.00 15R 0.95 0.00 0.89 0.96 0.62 1.10 0.80 0.55 0.59 0.74 0.50 0.18 22L 31.07 43.55 25.75 27.69 20.99 30.81 22.67 30.33 23.51 32.15 26.39 37.01 22R 0.00 0.00 0.00 0.00 0.02 0.00 0.01 0.00 0.02 0.00 3.03 3.12 27 5.46 8.68 18.07 3.97 27.61 28.16 25.91 19.35 19.68 20.03 5.14 10.61 32 0.00 0.00 0.00 0.00 0.00 0.00 1.13 0.00 5.25 0.00 11.97 0.00 33L 20.13 17.37 15.80 44.70 12.96 20.00 11.99 29.11 13.63 22.58 7.77 20.63 33R 0.00 0.00 0.00 0.00 0.00 0.00 0.00 0.00 0.00 0.00 6.32 6.15 Total 100.0 100.0 100.0 100.0 100.0 100.0 100.0 100.0 100.0 100.0 100.0 100.0
DEPARTURES Runway Day
(%) Night
(%) Day (%)
Night (%)
Day (%)
Night (%)
Day (%)
Night (%)
Day (%)
Night (%)
Day (%)
Night (%)
04L 0.00 0.00 0.00 0.00 0.00 0.00 0.00 0.00 0.00 0.00 18.85 11.48 04R 9.16 6.87 10.78 4.05 0.65 1.92 4.94 3.61 0.58 0.71 4.60 4.85 09 8.67 6.70 16.72 11.23 37.90 25.24 31.28 20.45 37.50 25.94 19.94 8.58 14 0.00 0.00 0.00 0.00 0.00 0.00 0.00 0.00 0.00 0.00 0.03 0.00 15L 0.00 0.00 0.00 0.00 0.00 0.00 0.00 0.00 0.00 0.00 0.00 0.00 15R 31.30 33.68 15.41 25.89 2.30 8.66 3.99 15.82 2.25 14.83 2.28 12.62 22L 7.82 3.02 6.57 2.53 0.29 1.04 2.48 2.42 0.17 0.55 0.35 0.54 22R 17.75 18.08 21.50 19.38 29.18 29.58 27.25 22.31 29.80 26.17 29.67 34.91 27 0.58 0.33 6.21 0.94 14.94 29.55 11.73 22.52 12.60 20.82 5.32 7.32 32 0.00 0.00 0.00 0.00 0.00 0.00 0.00 0.00 0.00 0.00 0.05 0.14 33L 24.72 31.32 22.80 35.99 14.75 4.01 18.33 12.87 17.09 10.97 18.82 19.56 33R 0.00 0.00 0.00 0.00 0.00 0.00 0.00 0.00 0.00 0.00 0.09 0.00 Total 100.0 100.0 100.0
0 100.0 100.00 100.00 100.00 100.00 100.00 100.00 100.0 100.0
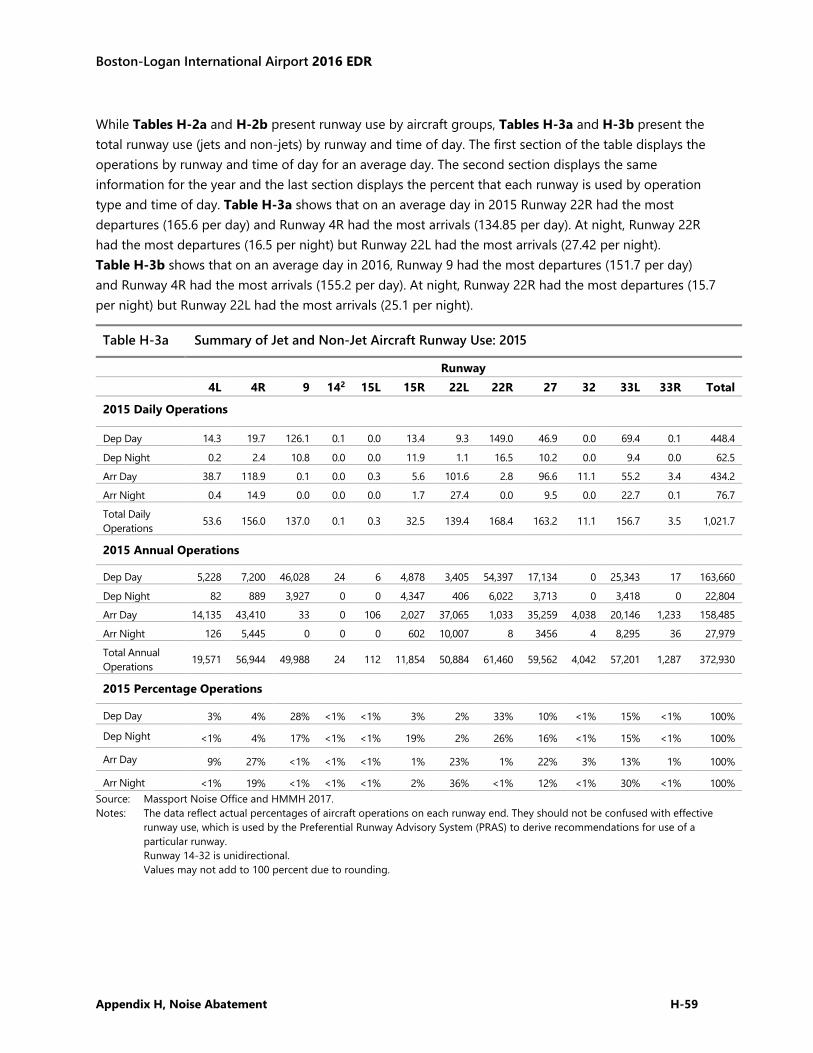
Boston-Logan International Airport 2016 EDR
Appendix H, Noise Abatement H-59
While Tables H-2a and H-2b present runway use by aircraft groups, Tables H-3a and H-3b present the total runway use (jets and non-jets) by runway and time of day. The first section of the table displays the operations by runway and time of day for an average day. The second section displays the same information for the year and the last section displays the percent that each runway is used by operation type and time of day. Table H-3a shows that on an average day in 2015 Runway 22R had the most departures (165.6 per day) and Runway 4R had the most arrivals (134.85 per day). At night, Runway 22R had the most departures (16.5 per night) but Runway 22L had the most arrivals (27.42 per night). Table H-3b shows that on an average day in 2016, Runway 9 had the most departures (151.7 per day) and Runway 4R had the most arrivals (155.2 per day). At night, Runway 22R had the most departures (15.7 per night) but Runway 22L had the most arrivals (25.1 per night).
Table H-3a Summary of Jet and Non-Jet Aircraft Runway Use: 2015
Runway 4L 4R 9 142 15L 15R 22L 22R 27 32 33L 33R Total
2015 Daily Operations
Dep Day 14.3 19.7 126.1 0.1 0.0 13.4 9.3 149.0 46.9 0.0 69.4 0.1 448.4
Dep Night 0.2 2.4 10.8 0.0 0.0 11.9 1.1 16.5 10.2 0.0 9.4 0.0 62.5
Arr Day 38.7 118.9 0.1 0.0 0.3 5.6 101.6 2.8 96.6 11.1 55.2 3.4 434.2
Arr Night 0.4 14.9 0.0 0.0 0.0 1.7 27.4 0.0 9.5 0.0 22.7 0.1 76.7
Total Daily Operations 53.6 156.0 137.0 0.1 0.3 32.5 139.4 168.4 163.2 11.1 156.7 3.5 1,021.7
2015 Annual Operations
Dep Day 5,228 7,200 46,028 24 6 4,878 3,405 54,397 17,134 0 25,343 17 163,660
Dep Night 82 889 3,927 0 0 4,347 406 6,022 3,713 0 3,418 0 22,804
Arr Day 14,135 43,410 33 0 106 2,027 37,065 1,033 35,259 4,038 20,146 1,233 158,485
Arr Night 126 5,445 0 0 0 602 10,007 8 3456 4 8,295 36 27,979
Total Annual Operations 19,571 56,944 49,988 24 112 11,854 50,884 61,460 59,562 4,042 57,201 1,287 372,930
2015 Percentage Operations
Dep Day 3% 4% 28% <1% <1% 3% 2% 33% 10% <1% 15% <1% 100%
Dep Night <1% 4% 17% <1% <1% 19% 2% 26% 16% <1% 15% <1% 100%
Arr Day 9% 27% <1% <1% <1% 1% 23% 1% 22% 3% 13% 1% 100%
Arr Night <1% 19% <1% <1% <1% 2% 36% <1% 12% <1% 30% <1% 100% Source: Massport Noise Office and HMMH 2017. Notes: The data reflect actual percentages of aircraft operations on each runway end. They should not be confused with effective
runway use, which is used by the Preferential Runway Advisory System (PRAS) to derive recommendations for use of a particular runway.
Runway 14-32 is unidirectional. Values may not add to 100 percent due to rounding.
Boston-Logan International Airport 2016 EDR
Appendix H, Noise Abatement H-60
Table H-3b Summary of Jet and Non-Jet Aircraft Runway Use: 2016
Runway
4L 4R 9 142 15L 15R 22L 22R 27 32 33L 33R Total
2016 Daily Operations
Dep Day 14.2 20.3 138.4 0.0 0.0 18.8 8.9 129.0 49.2 0.0 85.2 0.1 464.1
Dep Night 0.2 2.4 13.2 0.0 0.0 12.0 1.5 15.7 12.8 0.0 11.3 0.0 69.1
Arr Day 32.6 138.1 0.0 0.0 0.1 3.2 106.6 2.3 94.2 15.7 53.5 4.7 451.0
Arr Night 0.2 17.2 0.0 0.0 0.0 0.5 25.1 0.1 15.2 0.0 23.9 0.2 82.2
Total Daily Operations 47.1 177.9 151.7 0.0 0.1 34.5 142.1 147.0 171.4 15.8 173.9 4.9 1,066.5
2016 Annual Operations
Dep Day 5,179 7,413 50,669 8 0 6,897 3,268 47,196 18,019 14 31,175 25 169,865
Dep Night 86 880 4,836 0 0 4,375 555 5,743 4,699 1 4,130 0 25,305
Arr Day 11,921 50,529 0 0 53 1,185 39,010 837 34,462 5,752 19,597 1,723 165,069
Arr Night 62 6,278 0 0 0 176 9,191 30 5,555 0 8,750 58 30100
Total Annual Operations 17,247 65,101 55,505 8 53 12,633 52,024 53,806 62,736 5,768 63,653 1,806 390,339
2016 Percentage Operations
Dep Day 3% 4% 30% <1% <1% 4% 2% 28% 11% <1% 18% <1% 100%
Dep Night <1% 3% 19% <1% <1% 17% 2% 23% 19% <1% 16% <1% 100%
Arr Day 7% 31% <1% <1% <1% 1% 24% 1% 21% 3% 12% 1% 100%
Arr Night <1% 21% <1% <1% <1% 1% 31% <1% 18% <1% 29% <1% 100% Source: Massport Noise Office and HMMH 2017. Notes: The data reflect actual percentages of aircraft operations on each runway end. They should not be confused with effective
runway use, which is used by the Preferential Runway Advisory System (PRAS) to derive recommendations for use of a particular runway.
Runway 14-32 is unidirectional. Values may not add to 100 percent due to rounding.
Runway use can also be presented in terms of percent of total operations as shown in Table H-4 for 2015 and 2016. Tables H-2a and H-2b total the runway use by aircraft group and time of day. Tables H-3a and H-3b total the runway use by operation type and time of day. Table H-4 presents the 2015 and 2016 runway use for all operations which use Logan Airport.
In 2015, Runway 22R was the runway with the highest activity (primarily jet departures) with Runway 27 a very close second (primarily by jet arrivals). For 2016, Runway 04R was the most active, with primarily jet arrivals, followed by Runway 33L, with a mix of arrivals and departures
Each year, non-jet activity makes up approximately 7 percent of the arrivals and 7 percent of the departures at Logan Airport.
Boston-Logan International Airport 2016 EDR
Appendix H, Noise Abatement H-61
Table H-4 Total 2015 and 2016 Modeled Runway Use by All Operations
Jet Arrivals Non-Jet Arrivals Jet Departures
Non-Jet Departures All Operations Day Night Day Night Day Night Day Night
Runway 2015 Operations
4L 2.0% <0.1% 1.8% <0.1% <0.1% <0.1% 1.4% <0.1% 5.2%
4R 10.9% 1.4% 0.8% <0.1% 1.6% <0.1% <0.1% <0.1% 15.3%
9 0.0% 0.0% <0.1% 0.0% 11.2% 1.0% 1.2% <0.1% 13.4%
14 0.0% 0.0% <0.1% 0.0% <0.1% 0.0% <0.1% 0.0% <0.1%
15L 0.0% 0.0% <0.1% 0.0% 0.0% 0.0% <0.1% 0.0% <0.1%
15R <0.1% <0.1% <0.1% <0.1% 1.1% 1.1% <0.1% <0.1% 3.2%
22L 7.9% 2.6% 2.1% <0.1% 0.9% <0.1% <0.1% <0.1% 13.6%
22R <0.1% <0.1% <0.1% <0.1% 12.1% 1.6% 2.5% <0.1% 16.5%
27 8.9% 0.9% 0.5% <0.1% 4.2% 1.0% <0.1% <0.1% 16.0%
32 0.5% <0.1% 0.6% <0.1% 0.0% 0.0% <0.1% 0.0% 1.1%
33L 4.8% 2.2% 0.6% <0.1% 5.7% 0.9% 1.1% <0.1% 15.3%
33R <0.1% 0.0% <0.1% <0.1% 0.0% 0.0% <0.1% 0.0% <0.1%
Total 35.4% 7.3% 7.1% <0.1% 36.8% 5.9% 7.1% <0.1% 100.0%
Runway 2016 Operations
4L 1.5% <0.1% 1.5% <0.1% 0.0% 0.0% 1.3% <0.1% 4.4%
4R 11.8% 1.6% 1.2% <0.1% 1.6% <0.1% <0.1% <0.1% 16.7%
9 0.0% 0.0% 0.0% 0.0% 11.6% 1.2% 1.4% <0.1% 14.2%
14 0.0% 0.0% 0.0% 0.0% 0.0% 0.0% <0.1% 0.0% <0.1%
15L 0.0% 0.0% <0.1% 0.0% 0.0% 0.0% 0.0% 0.0% <0.1%
15R <0.1% <0.1% <0.1% <0.1% 1.6% 1.1% <0.1% <0.1% 3.2%
22L 8.1% 2.3% 1.8% <0.1% 0.8% <0.1% <0.1% <0.1% 13.3%
22R <0.1% 0.0% <0.1% <0.1% 10.0% 1.4% 2.1% <0.1% 13.8%
27 8.5% 1.4% <0.1% <0.1% 4.2% 1.2% <0.1% <0.1% 16.1%
32 0.6% 0.0% 0.8% 0.0% 0.0% 0.0% <0.1% <0.1% 1.5%
33L 4.5% 2.2% 0.5% <0.1% 6.7% 1.0% 1.3% <0.1% 16.3%
33R 0.0% 0.0% <0.1% <0.1% 0.0% 0.0% <0.1% 0.0% <0.1%
Total 35.3% 7.5% 7.0% <0.1% 36.5% 6.3% 7.0% <0.1% 100.0%
Boston-Logan International Airport 2016 EDR
Appendix H, Noise Abatement H-62
Flight Tracks
RC for AEDTTM converts each radar track to an AEDT model track and then models the scaled aircraft operation on that track. This method keeps the lateral and vertical dispersion of the aircraft types consistent with the radar data, and ensures that anomalies in the departure paths are captured in the RC for AEDTTM system. Table H-5 lists the number of flight tracks used in the RealContoursTM modeling system for 2015 and the RC for AEDTTM modeling system for 2016. A sample of flight tracks from 2016 are displayed in Figures 6-3 through 6-9 in Chapter 6, Noise Abatement.
Table H-5 Total Count of Flight Tracks Modeled in RealContoursTM (2015) and RC for AEDTTM (2016) Runway
4L 4R 9 14 15L 15R 22L 22R 27 32 33L 33R
2015
Departures 5,310 8,089 49,955 24 6 9,225 3,811 60,419 20,847 0 28,761 17 Arrivals 14,261 48,855 33 0 106 2,629 47,073 1,041 38,715 4,042 28,440 1,269 2016 Departures 5,265 8,294 55,505 8 0 11,272 3,823 52,939 22,719 15 35,305 25 Arrivals 11,982 56,807 0 0 53 1,362 48,201 867 40,017 5,752 28,347 1,782
Source: HMMH, 2016/2017; Harris NOMS data.
Fleet Mix
Table H-6 summarizes the numbers of operations by categories of aircraft operating at Logan Airport from 1990 through 2016. Operations are summarized by operator category (commercial/GA), aircraft category, and day or night operation (night defined as 10:00 PM to 7:00 AM, consistent with the definition of DNL). General aviation (GA) operations were not included in the noise modeling prior to 1998 and commercial jet operations were not separated until 1999.
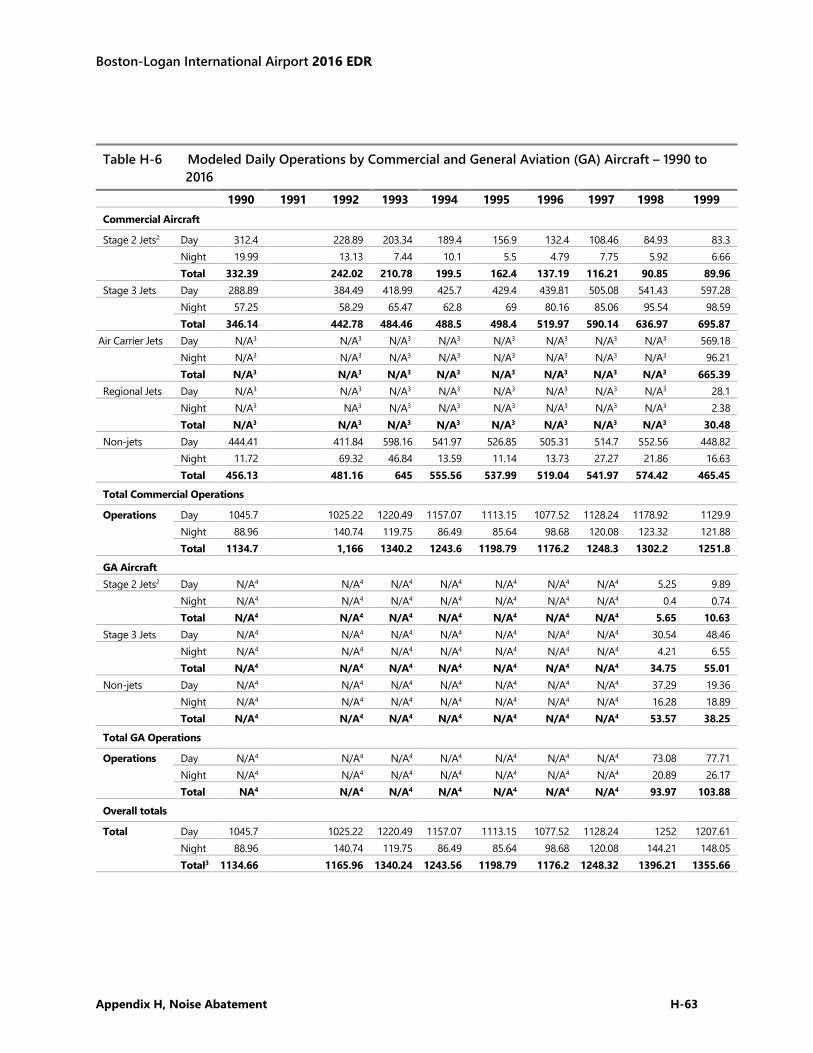
Boston-Logan International Airport 2016 EDR
Appendix H, Noise Abatement H-63
Table H-6 Modeled Daily Operations by Commercial and General Aviation (GA) Aircraft – 1990 to 2016
1990 1991 1992 1993 1994 1995 1996 1997 1998 1999 Commercial Aircraft
Stage 2 Jets2 Day 312.4 228.89 203.34 189.4 156.9 132.4 108.46 84.93 83.3 Night 19.99 13.13 7.44 10.1 5.5 4.79 7.75 5.92 6.66
Total 332.39 242.02 210.78 199.5 162.4 137.19 116.21 90.85 89.96 Stage 3 Jets Day 288.89 384.49 418.99 425.7 429.4 439.81 505.08 541.43 597.28 Night 57.25 58.29 65.47 62.8 69 80.16 85.06 95.54 98.59
Total 346.14 442.78 484.46 488.5 498.4 519.97 590.14 636.97 695.87 Air Carrier Jets Day N/A3 N/A3 N/A3 N/A3 N/A3 N/A3 N/A3 N/A3 569.18 Night N/A3 N/A3 N/A3 N/A3 N/A3 N/A3 N/A3 N/A3 96.21
Total N/A3 N/A3 N/A3 N/A3 N/A3 N/A3 N/A3 N/A3 665.39 Regional Jets Day N/A3 N/A3 N/A3 N/A3 N/A3 N/A3 N/A3 N/A3 28.1 Night N/A3 NA3 N/A3 N/A3 N/A3 N/A3 N/A3 N/A3 2.38
Total N/A3 N/A3 N/A3 N/A3 N/A3 N/A3 N/A3 N/A3 30.48 Non-jets Day 444.41 411.84 598.16 541.97 526.85 505.31 514.7 552.56 448.82 Night 11.72 69.32 46.84 13.59 11.14 13.73 27.27 21.86 16.63
Total 456.13 481.16 645 555.56 537.99 519.04 541.97 574.42 465.45
Total Commercial Operations
Operations Day 1045.7 1025.22 1220.49 1157.07 1113.15 1077.52 1128.24 1178.92 1129.9 Night 88.96 140.74 119.75 86.49 85.64 98.68 120.08 123.32 121.88 Total 1134.7 1,166 1340.2 1243.6 1198.79 1176.2 1248.3 1302.2 1251.8
GA Aircraft Stage 2 Jets2 Day N/A4 N/A4 N/A4 N/A4 N/A4 N/A4 N/A4 5.25 9.89 Night N/A4 N/A4 N/A4 N/A4 N/A4 N/A4 N/A4 0.4 0.74
Total N/A4 N/A4 N/A4 N/A4 N/A4 N/A4 N/A4 5.65 10.63 Stage 3 Jets Day N/A4 N/A4 N/A4 N/A4 N/A4 N/A4 N/A4 30.54 48.46 Night N/A4 N/A4 N/A4 N/A4 N/A4 N/A4 N/A4 4.21 6.55
Total N/A4 N/A4 N/A4 N/A4 N/A4 N/A4 N/A4 34.75 55.01 Non-jets Day N/A4 N/A4 N/A4 N/A4 N/A4 N/A4 N/A4 37.29 19.36 Night N/A4 N/A4 N/A4 N/A4 N/A4 N/A4 N/A4 16.28 18.89
Total N/A4 N/A4 N/A4 N/A4 N/A4 N/A4 N/A4 53.57 38.25
Total GA Operations
Operations Day N/A4 N/A4 N/A4 N/A4 N/A4 N/A4 N/A4 73.08 77.71 Night N/A4 N/A4 N/A4 N/A4 N/A4 N/A4 N/A4 20.89 26.17 Total NA4 N/A4 N/A4 N/A4 N/A4 N/A4 N/A4 93.97 103.88
Overall totals
Total Day 1045.7 1025.22 1220.49 1157.07 1113.15 1077.52 1128.24 1252 1207.61 Night 88.96 140.74 119.75 86.49 85.64 98.68 120.08 144.21 148.05 Total3 1134.66 1165.96 1340.24 1243.56 1198.79 1176.2 1248.32 1396.21 1355.66
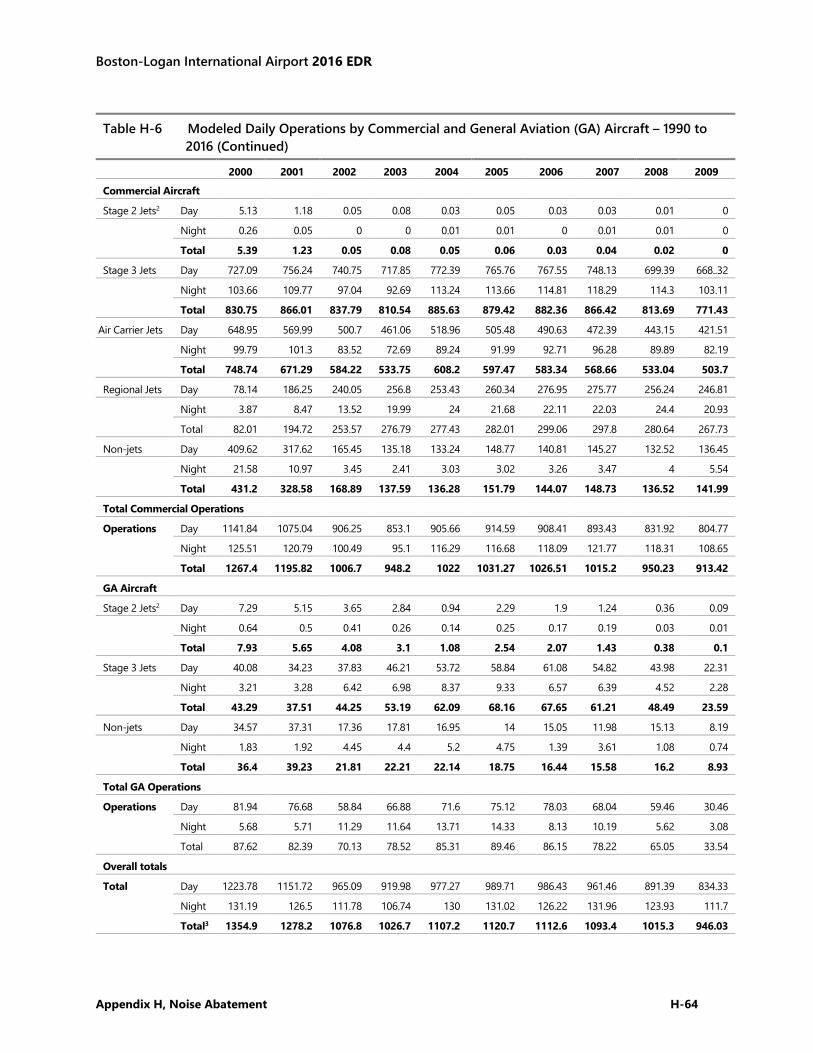
Boston-Logan International Airport 2016 EDR
Appendix H, Noise Abatement H-64
Table H-6 Modeled Daily Operations by Commercial and General Aviation (GA) Aircraft – 1990 to 2016 (Continued)
2000 2001 2002 2003 2004 2005 2006 2007 2008 2009
Commercial Aircraft
Stage 2 Jets2 Day 5.13 1.18 0.05 0.08 0.03 0.05 0.03 0.03 0.01 0
Night 0.26 0.05 0 0 0.01 0.01 0 0.01 0.01 0
Total 5.39 1.23 0.05 0.08 0.05 0.06 0.03 0.04 0.02 0
Stage 3 Jets Day 727.09 756.24 740.75 717.85 772.39 765.76 767.55 748.13 699.39 668..32
Night 103.66 109.77 97.04 92.69 113.24 113.66 114.81 118.29 114.3 103.11
Total 830.75 866.01 837.79 810.54 885.63 879.42 882.36 866.42 813.69 771.43
Air Carrier Jets Day 648.95 569.99 500.7 461.06 518.96 505.48 490.63 472.39 443.15 421.51
Night 99.79 101.3 83.52 72.69 89.24 91.99 92.71 96.28 89.89 82.19
Total 748.74 671.29 584.22 533.75 608.2 597.47 583.34 568.66 533.04 503.7
Regional Jets Day 78.14 186.25 240.05 256.8 253.43 260.34 276.95 275.77 256.24 246.81
Night 3.87 8.47 13.52 19.99 24 21.68 22.11 22.03 24.4 20.93
Total 82.01 194.72 253.57 276.79 277.43 282.01 299.06 297.8 280.64 267.73
Non-jets Day 409.62 317.62 165.45 135.18 133.24 148.77 140.81 145.27 132.52 136.45
Night 21.58 10.97 3.45 2.41 3.03 3.02 3.26 3.47 4 5.54
Total 431.2 328.58 168.89 137.59 136.28 151.79 144.07 148.73 136.52 141.99
Total Commercial Operations
Operations Day 1141.84 1075.04 906.25 853.1 905.66 914.59 908.41 893.43 831.92 804.77
Night 125.51 120.79 100.49 95.1 116.29 116.68 118.09 121.77 118.31 108.65
Total 1267.4 1195.82 1006.7 948.2 1022 1031.27 1026.51 1015.2 950.23 913.42
GA Aircraft
Stage 2 Jets2 Day 7.29 5.15 3.65 2.84 0.94 2.29 1.9 1.24 0.36 0.09
Night 0.64 0.5 0.41 0.26 0.14 0.25 0.17 0.19 0.03 0.01
Total 7.93 5.65 4.08 3.1 1.08 2.54 2.07 1.43 0.38 0.1
Stage 3 Jets Day 40.08 34.23 37.83 46.21 53.72 58.84 61.08 54.82 43.98 22.31
Night 3.21 3.28 6.42 6.98 8.37 9.33 6.57 6.39 4.52 2.28
Total 43.29 37.51 44.25 53.19 62.09 68.16 67.65 61.21 48.49 23.59
Non-jets Day 34.57 37.31 17.36 17.81 16.95 14 15.05 11.98 15.13 8.19
Night 1.83 1.92 4.45 4.4 5.2 4.75 1.39 3.61 1.08 0.74
Total 36.4 39.23 21.81 22.21 22.14 18.75 16.44 15.58 16.2 8.93
Total GA Operations
Operations Day 81.94 76.68 58.84 66.88 71.6 75.12 78.03 68.04 59.46 30.46
Night 5.68 5.71 11.29 11.64 13.71 14.33 8.13 10.19 5.62 3.08
Total 87.62 82.39 70.13 78.52 85.31 89.46 86.15 78.22 65.05 33.54
Overall totals
Total Day 1223.78 1151.72 965.09 919.98 977.27 989.71 986.43 961.46 891.39 834.33
Night 131.19 126.5 111.78 106.74 130 131.02 126.22 131.96 123.93 111.7
Total3 1354.9 1278.2 1076.8 1026.7 1107.2 1120.7 1112.6 1093.4 1015.3 946.03
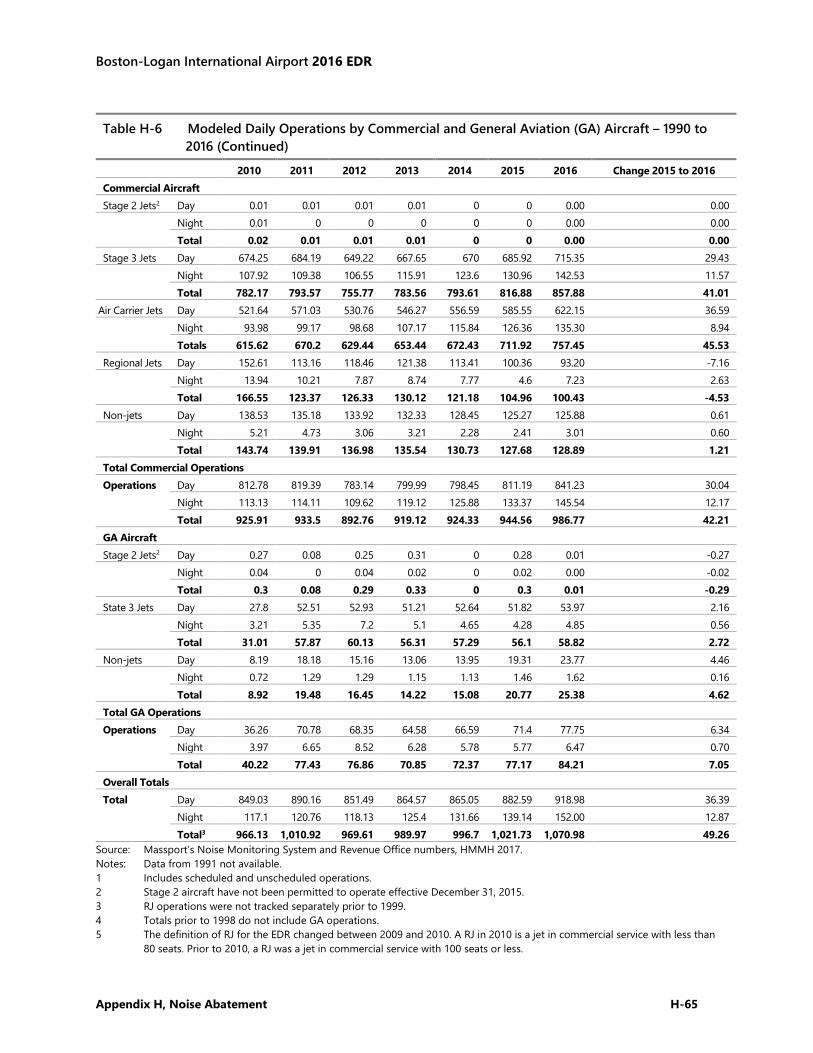
Boston-Logan International Airport 2016 EDR
Appendix H, Noise Abatement H-65
Table H-6 Modeled Daily Operations by Commercial and General Aviation (GA) Aircraft – 1990 to 2016 (Continued)
2010 2011 2012 2013 2014 2015 2016 Change 2015 to 2016 Commercial Aircraft Stage 2 Jets2 Day 0.01 0.01 0.01 0.01 0 0 0.00 0.00 Night 0.01 0 0 0 0 0 0.00 0.00
Total 0.02 0.01 0.01 0.01 0 0 0.00 0.00 Stage 3 Jets Day 674.25 684.19 649.22 667.65 670 685.92 715.35 29.43 Night 107.92 109.38 106.55 115.91 123.6 130.96 142.53 11.57
Total 782.17 793.57 755.77 783.56 793.61 816.88 857.88 41.01 Air Carrier Jets Day 521.64 571.03 530.76 546.27 556.59 585.55 622.15 36.59 Night 93.98 99.17 98.68 107.17 115.84 126.36 135.30 8.94
Totals 615.62 670.2 629.44 653.44 672.43 711.92 757.45 45.53 Regional Jets Day 152.61 113.16 118.46 121.38 113.41 100.36 93.20 -7.16 Night 13.94 10.21 7.87 8.74 7.77 4.6 7.23 2.63
Total 166.55 123.37 126.33 130.12 121.18 104.96 100.43 -4.53 Non-jets Day 138.53 135.18 133.92 132.33 128.45 125.27 125.88 0.61 Night 5.21 4.73 3.06 3.21 2.28 2.41 3.01 0.60
Total 143.74 139.91 136.98 135.54 130.73 127.68 128.89 1.21 Total Commercial Operations Operations Day 812.78 819.39 783.14 799.99 798.45 811.19 841.23 30.04
Night 113.13 114.11 109.62 119.12 125.88 133.37 145.54 12.17 Total 925.91 933.5 892.76 919.12 924.33 944.56 986.77 42.21
GA Aircraft Stage 2 Jets2 Day 0.27 0.08 0.25 0.31 0 0.28 0.01 -0.27 Night 0.04 0 0.04 0.02 0 0.02 0.00 -0.02
Total 0.3 0.08 0.29 0.33 0 0.3 0.01 -0.29 State 3 Jets Day 27.8 52.51 52.93 51.21 52.64 51.82 53.97 2.16 Night 3.21 5.35 7.2 5.1 4.65 4.28 4.85 0.56
Total 31.01 57.87 60.13 56.31 57.29 56.1 58.82 2.72 Non-jets Day 8.19 18.18 15.16 13.06 13.95 19.31 23.77 4.46 Night 0.72 1.29 1.29 1.15 1.13 1.46 1.62 0.16
Total 8.92 19.48 16.45 14.22 15.08 20.77 25.38 4.62 Total GA Operations Operations Day 36.26 70.78 68.35 64.58 66.59 71.4 77.75 6.34
Night 3.97 6.65 8.52 6.28 5.78 5.77 6.47 0.70 Total 40.22 77.43 76.86 70.85 72.37 77.17 84.21 7.05
Overall Totals Total Day 849.03 890.16 851.49 864.57 865.05 882.59 918.98 36.39
Night 117.1 120.76 118.13 125.4 131.66 139.14 152.00 12.87 Total3 966.13 1,010.92 969.61 989.97 996.7 1,021.73 1,070.98 49.26
Source: Massport’s Noise Monitoring System and Revenue Office numbers, HMMH 2017. Notes: Data from 1991 not available. 1 Includes scheduled and unscheduled operations. 2 Stage 2 aircraft have not been permitted to operate effective December 31, 2015. 3 RJ operations were not tracked separately prior to 1999. 4 Totals prior to 1998 do not include GA operations. 5 The definition of RJ for the EDR changed between 2009 and 2010. A RJ in 2010 is a jet in commercial service with less than
80 seats. Prior to 2010, a RJ was a jet in commercial service with 100 seats or less.
Boston-Logan International Airport 2016 EDR
Appendix H, Noise Abatement H-66
Commercial Jet Aircraft by Part 36 Stage Category
FAA categorizes jet aircraft currently operating at Logan Airport into three groups: Stage 2, Stage 3, and Stage 4. As described in Chapter 6, Noise Abatement, the designation refers to a noise classification specified in Federal Aviation Regulation Part 36 that sets noise emission standards at three measurement locations – takeoff, landing, and sideline – based on an aircraft’s maximum certificated weight. The heavier the aircraft, the more noise it is permitted to make within limits. Aircraft are allowed to be recertificated to the higher standard when modifications are made to the aircraft engine or design. Because of the substantial differences in noise between Stage 2, recertificated Stage 3, Stage 3, and Stage 4 aircraft, Massport tracks operations by these separate categories to follow their trends. Table H-7 shows the percentage of commercial jet operations by stage category from 1999 through 2016. One of the most significant changes occurring after the economic downturn in 2001 was the almost immediate retirement of the re-certificated aircraft from airlines’ fleets due to their high operating costs. This type of accelerated retirement is not as prevalent during the 2008 to 2009 economic downturn since it is no longer the major airlines operating these aircraft. However, these aircraft still have high operating costs and are being replaced wherever possible.
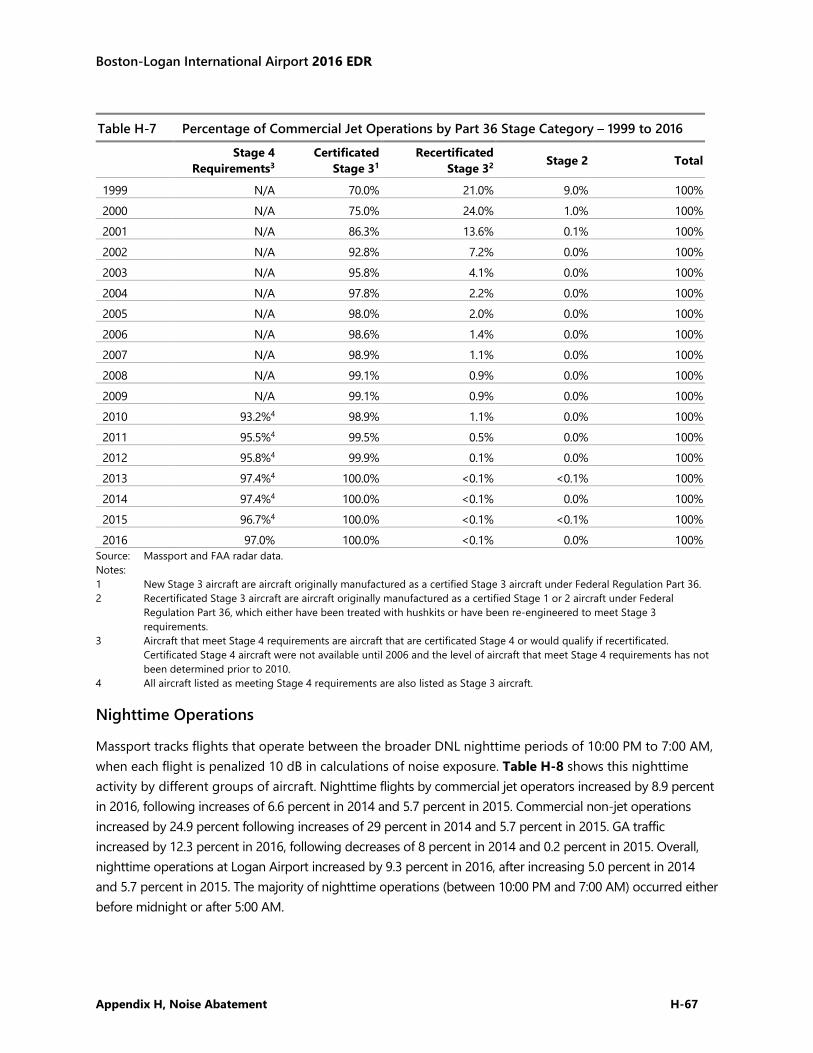
Boston-Logan International Airport 2016 EDR
Appendix H, Noise Abatement H-67
Table H-7 Percentage of Commercial Jet Operations by Part 36 Stage Category – 1999 to 2016
Stage 4 Requirements3
Certificated Stage 31
Recertificated Stage 32 Stage 2 Total
1999 N/A 70.0% 21.0% 9.0% 100% 2000 N/A 75.0% 24.0% 1.0% 100% 2001 N/A 86.3% 13.6% 0.1% 100% 2002 N/A 92.8% 7.2% 0.0% 100% 2003 N/A 95.8% 4.1% 0.0% 100% 2004 N/A 97.8% 2.2% 0.0% 100% 2005 N/A 98.0% 2.0% 0.0% 100% 2006 N/A 98.6% 1.4% 0.0% 100% 2007 N/A 98.9% 1.1% 0.0% 100% 2008 N/A 99.1% 0.9% 0.0% 100% 2009 N/A 99.1% 0.9% 0.0% 100% 2010 93.2%4 98.9% 1.1% 0.0% 100% 2011 95.5%4 99.5% 0.5% 0.0% 100% 2012 95.8%4 99.9% 0.1% 0.0% 100% 2013 97.4%4 100.0% <0.1% <0.1% 100% 2014 97.4%4 100.0% <0.1% 0.0% 100% 2015 96.7%4 100.0% <0.1% <0.1% 100% 2016 97.0% 100.0% <0.1% 0.0% 100%
Source: Massport and FAA radar data. Notes: 1 New Stage 3 aircraft are aircraft originally manufactured as a certified Stage 3 aircraft under Federal Regulation Part 36. 2 Recertificated Stage 3 aircraft are aircraft originally manufactured as a certified Stage 1 or 2 aircraft under Federal
Regulation Part 36, which either have been treated with hushkits or have been re-engineered to meet Stage 3 requirements.
3 Aircraft that meet Stage 4 requirements are aircraft that are certificated Stage 4 or would qualify if recertificated. Certificated Stage 4 aircraft were not available until 2006 and the level of aircraft that meet Stage 4 requirements has not been determined prior to 2010.
4 All aircraft listed as meeting Stage 4 requirements are also listed as Stage 3 aircraft.
Nighttime Operations
Massport tracks flights that operate between the broader DNL nighttime periods of 10:00 PM to 7:00 AM, when each flight is penalized 10 dB in calculations of noise exposure. Table H-8 shows this nighttime activity by different groups of aircraft. Nighttime flights by commercial jet operators increased by 8.9 percent in 2016, following increases of 6.6 percent in 2014 and 5.7 percent in 2015. Commercial non-jet operations increased by 24.9 percent following increases of 29 percent in 2014 and 5.7 percent in 2015. GA traffic increased by 12.3 percent in 2016, following decreases of 8 percent in 2014 and 0.2 percent in 2015. Overall, nighttime operations at Logan Airport increased by 9.3 percent in 2016, after increasing 5.0 percent in 2014 and 5.7 percent in 2015. The majority of nighttime operations (between 10:00 PM and 7:00 AM) occurred either before midnight or after 5:00 AM.
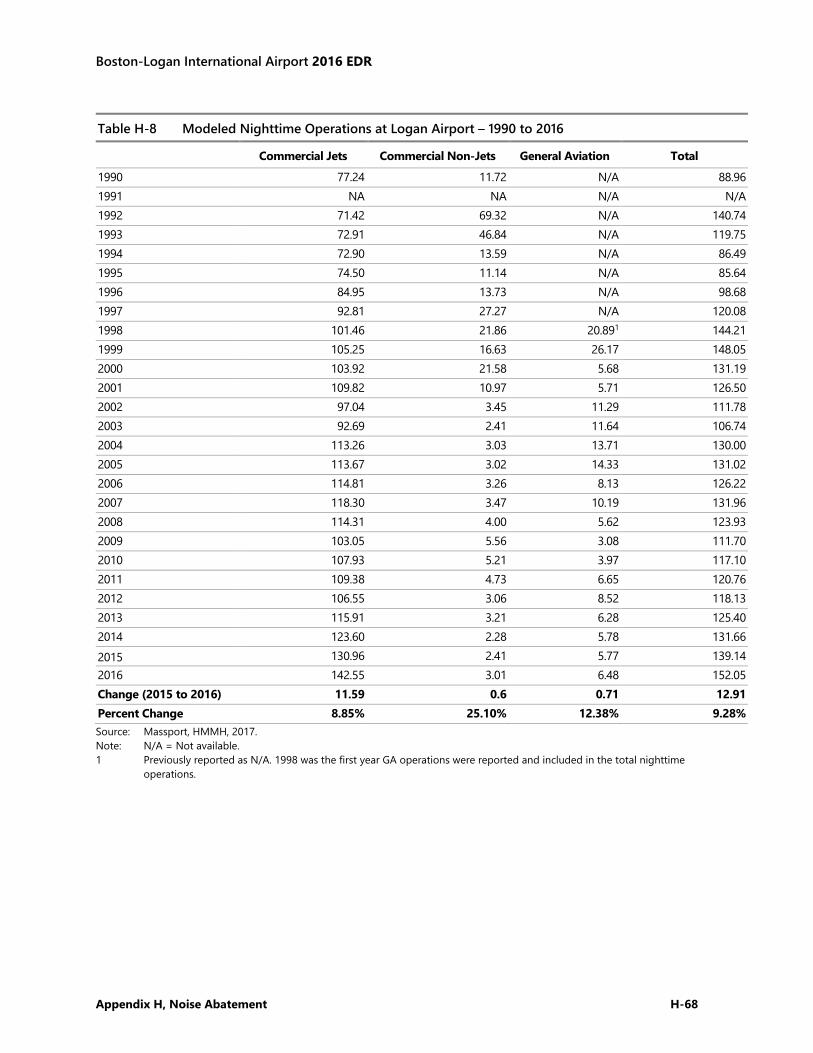
Boston-Logan International Airport 2016 EDR
Appendix H, Noise Abatement H-68
Table H-8 Modeled Nighttime Operations at Logan Airport – 1990 to 2016
Commercial Jets Commercial Non-Jets General Aviation Total
1990 77.24 11.72 N/A 88.96 1991 NA NA N/A N/A 1992 71.42 69.32 N/A 140.74 1993 72.91 46.84 N/A 119.75 1994 72.90 13.59 N/A 86.49 1995 74.50 11.14 N/A 85.64 1996 84.95 13.73 N/A 98.68 1997 92.81 27.27 N/A 120.08 1998 101.46 21.86 20.891 144.21 1999 105.25 16.63 26.17 148.05 2000 103.92 21.58 5.68 131.19 2001 109.82 10.97 5.71 126.50 2002 97.04 3.45 11.29 111.78 2003 92.69 2.41 11.64 106.74 2004 113.26 3.03 13.71 130.00 2005 113.67 3.02 14.33 131.02 2006 114.81 3.26 8.13 126.22 2007 118.30 3.47 10.19 131.96 2008 114.31 4.00 5.62 123.93 2009 103.05 5.56 3.08 111.70 2010 107.93 5.21 3.97 117.10 2011 109.38 4.73 6.65 120.76 2012 106.55 3.06 8.52 118.13 2013 115.91 3.21 6.28 125.40 2014 123.60 2.28 5.78 131.66 2015 130.96 2.41 5.77 139.14 2016 142.55 3.01 6.48 152.05 Change (2015 to 2016) 11.59 0.6 0.71 12.91 Percent Change 8.85% 25.10% 12.38% 9.28% Source: Massport, HMMH, 2017. Note: N/A = Not available. 1 Previously reported as N/A. 1998 was the first year GA operations were reported and included in the total nighttime
operations.
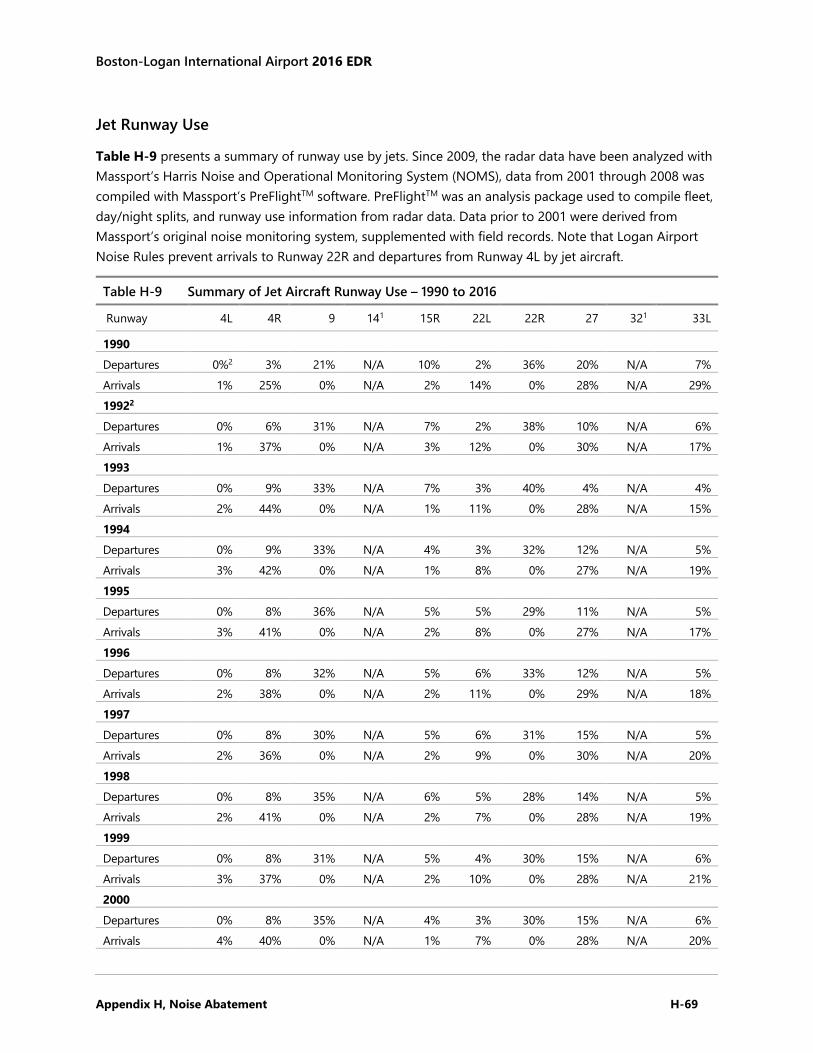
Boston-Logan International Airport 2016 EDR
Appendix H, Noise Abatement H-69
Jet Runway Use
Table H-9 presents a summary of runway use by jets. Since 2009, the radar data have been analyzed with Massport’s Harris Noise and Operational Monitoring System (NOMS), data from 2001 through 2008 was compiled with Massport’s PreFlightTM software. PreFlightTM was an analysis package used to compile fleet, day/night splits, and runway use information from radar data. Data prior to 2001 were derived from Massport’s original noise monitoring system, supplemented with field records. Note that Logan Airport Noise Rules prevent arrivals to Runway 22R and departures from Runway 4L by jet aircraft.
Table H-9 Summary of Jet Aircraft Runway Use – 1990 to 2016
Runway 4L 4R 9 141 15R 22L 22R 27 321 33L
1990 Departures 0%2 3% 21% N/A 10% 2% 36% 20% N/A 7% Arrivals 1% 25% 0% N/A 2% 14% 0% 28% N/A 29% 19922 Departures 0% 6% 31% N/A 7% 2% 38% 10% N/A 6% Arrivals 1% 37% 0% N/A 3% 12% 0% 30% N/A 17% 1993 Departures 0% 9% 33% N/A 7% 3% 40% 4% N/A 4% Arrivals 2% 44% 0% N/A 1% 11% 0% 28% N/A 15% 1994 Departures 0% 9% 33% N/A 4% 3% 32% 12% N/A 5% Arrivals 3% 42% 0% N/A 1% 8% 0% 27% N/A 19% 1995 Departures 0% 8% 36% N/A 5% 5% 29% 11% N/A 5% Arrivals 3% 41% 0% N/A 2% 8% 0% 27% N/A 17% 1996 Departures 0% 8% 32% N/A 5% 6% 33% 12% N/A 5% Arrivals 2% 38% 0% N/A 2% 11% 0% 29% N/A 18% 1997 Departures 0% 8% 30% N/A 5% 6% 31% 15% N/A 5% Arrivals 2% 36% 0% N/A 2% 9% 0% 30% N/A 20% 1998 Departures 0% 8% 35% N/A 6% 5% 28% 14% N/A 5% Arrivals 2% 41% 0% N/A 2% 7% 0% 28% N/A 19% 1999 Departures 0% 8% 31% N/A 5% 4% 30% 15% N/A 6% Arrivals 3% 37% 0% N/A 2% 10% 0% 28% N/A 21% 2000 Departures 0% 8% 35% N/A 4% 3% 30% 15% N/A 6% Arrivals 4% 40% 0% N/A 1% 7% 0% 28% N/A 20%
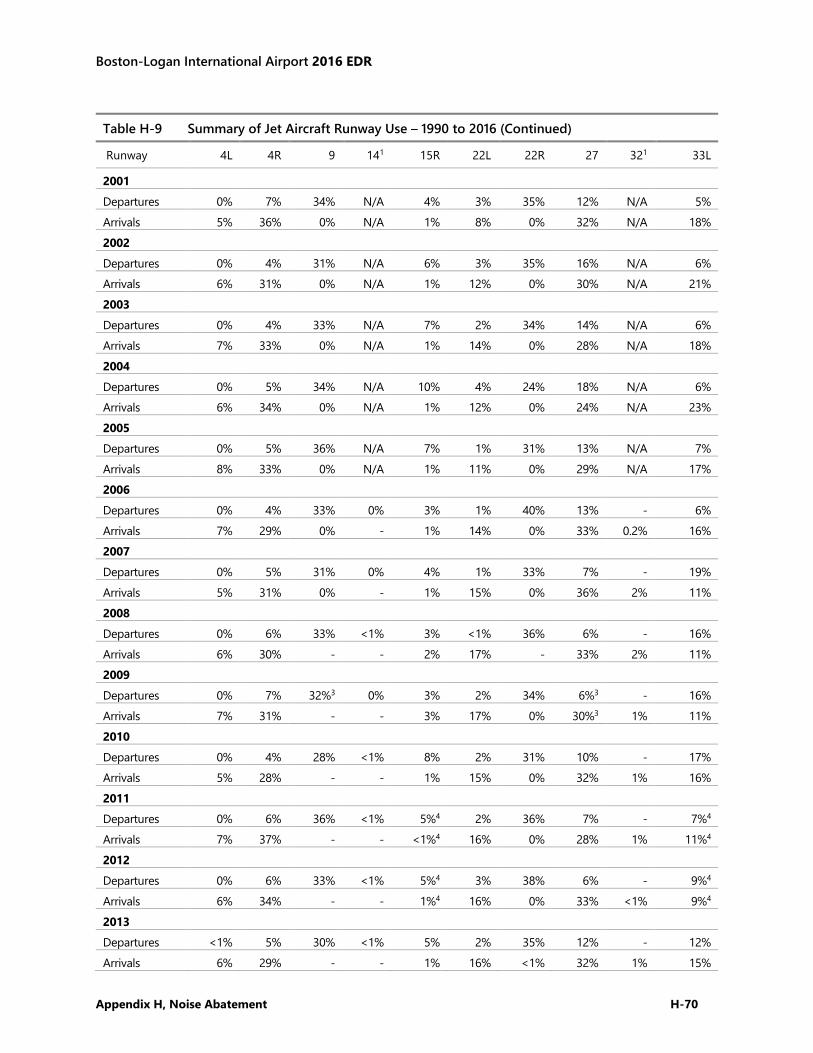
Boston-Logan International Airport 2016 EDR
Appendix H, Noise Abatement H-70
Table H-9 Summary of Jet Aircraft Runway Use – 1990 to 2016 (Continued)
Runway 4L 4R 9 141 15R 22L 22R 27 321 33L
2001 Departures 0% 7% 34% N/A 4% 3% 35% 12% N/A 5% Arrivals 5% 36% 0% N/A 1% 8% 0% 32% N/A 18% 2002 Departures 0% 4% 31% N/A 6% 3% 35% 16% N/A 6% Arrivals 6% 31% 0% N/A 1% 12% 0% 30% N/A 21% 2003 Departures 0% 4% 33% N/A 7% 2% 34% 14% N/A 6% Arrivals 7% 33% 0% N/A 1% 14% 0% 28% N/A 18% 2004 Departures 0% 5% 34% N/A 10% 4% 24% 18% N/A 6% Arrivals 6% 34% 0% N/A 1% 12% 0% 24% N/A 23% 2005 Departures 0% 5% 36% N/A 7% 1% 31% 13% N/A 7% Arrivals 8% 33% 0% N/A 1% 11% 0% 29% N/A 17% 2006 Departures 0% 4% 33% 0% 3% 1% 40% 13% - 6% Arrivals 7% 29% 0% - 1% 14% 0% 33% 0.2% 16% 2007 Departures 0% 5% 31% 0% 4% 1% 33% 7% - 19% Arrivals 5% 31% 0% - 1% 15% 0% 36% 2% 11% 2008 Departures 0% 6% 33% <1% 3% <1% 36% 6% - 16% Arrivals 6% 30% - - 2% 17% - 33% 2% 11% 2009 Departures 0% 7% 32%3 0% 3% 2% 34% 6%3 - 16% Arrivals 7% 31% - - 3% 17% 0% 30%3 1% 11% 2010 Departures 0% 4% 28% <1% 8% 2% 31% 10% - 17% Arrivals 5% 28% - - 1% 15% 0% 32% 1% 16% 2011 Departures 0% 6% 36% <1% 5%4 2% 36% 7% - 7%4
Arrivals 7% 37% - - <1%4 16% 0% 28% 1% 11%4
2012 Departures 0% 6% 33% <1% 5%4 3% 38% 6% - 9%4 Arrivals 6% 34% - - 1%4 16% 0% 33% <1% 9%4 2013 Departures <1% 5% 30% <1% 5% 2% 35% 12% - 12% Arrivals 6% 29% - - 1% 16% <1% 32% 1% 15%
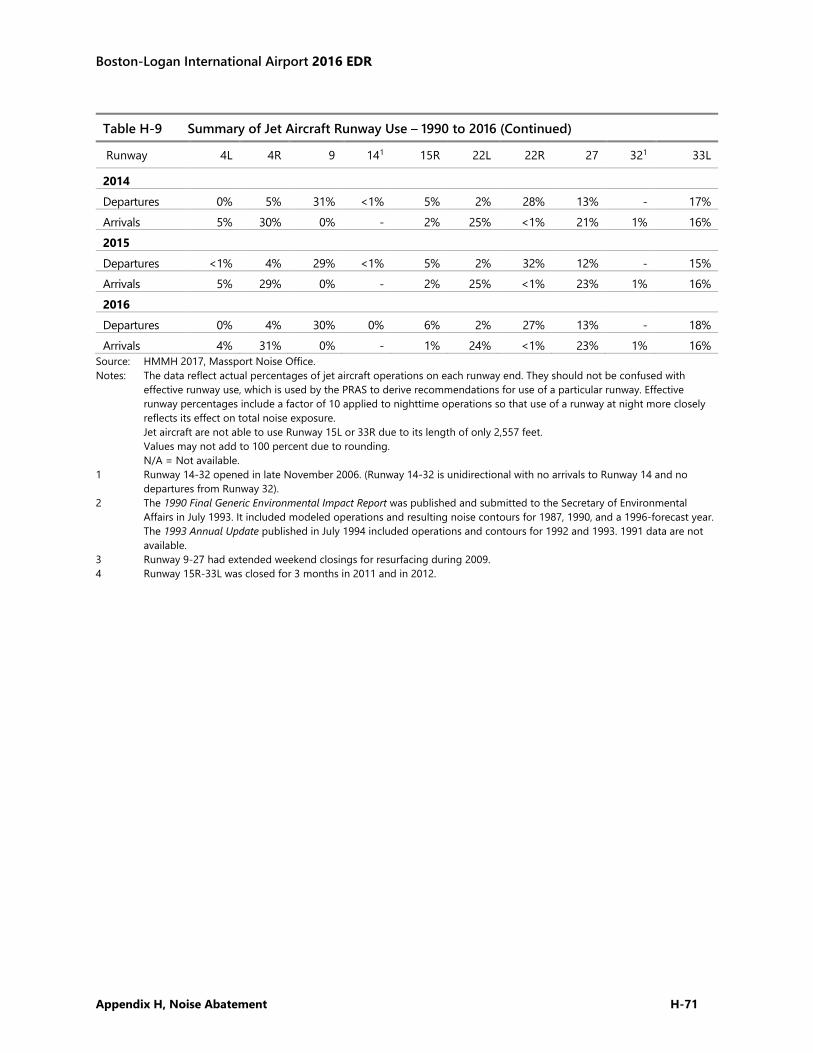
Boston-Logan International Airport 2016 EDR
Appendix H, Noise Abatement H-71
Table H-9 Summary of Jet Aircraft Runway Use – 1990 to 2016 (Continued)
Runway 4L 4R 9 141 15R 22L 22R 27 321 33L
2014 Departures 0% 5% 31% <1% 5% 2% 28% 13% - 17% Arrivals 5% 30% 0% - 2% 25% <1% 21% 1% 16% 2015 Departures <1% 4% 29% <1% 5% 2% 32% 12% - 15% Arrivals 5% 29% 0% - 2% 25% <1% 23% 1% 16% 2016 Departures 0% 4% 30% 0% 6% 2% 27% 13% - 18% Arrivals 4% 31% 0% - 1% 24% <1% 23% 1% 16%
Source: HMMH 2017, Massport Noise Office. Notes: The data reflect actual percentages of jet aircraft operations on each runway end. They should not be confused with
effective runway use, which is used by the PRAS to derive recommendations for use of a particular runway. Effective runway percentages include a factor of 10 applied to nighttime operations so that use of a runway at night more closely reflects its effect on total noise exposure. Jet aircraft are not able to use Runway 15L or 33R due to its length of only 2,557 feet. Values may not add to 100 percent due to rounding. N/A = Not available.
1 Runway 14-32 opened in late November 2006. (Runway 14-32 is unidirectional with no arrivals to Runway 14 and no departures from Runway 32).
2 The 1990 Final Generic Environmental Impact Report was published and submitted to the Secretary of Environmental Affairs in July 1993. It included modeled operations and resulting noise contours for 1987, 1990, and a 1996-forecast year. The 1993 Annual Update published in July 1994 included operations and contours for 1992 and 1993. 1991 data are not available.
3 Runway 9-27 had extended weekend closings for resurfacing during 2009. 4 Runway 15R-33L was closed for 3 months in 2011 and in 2012.
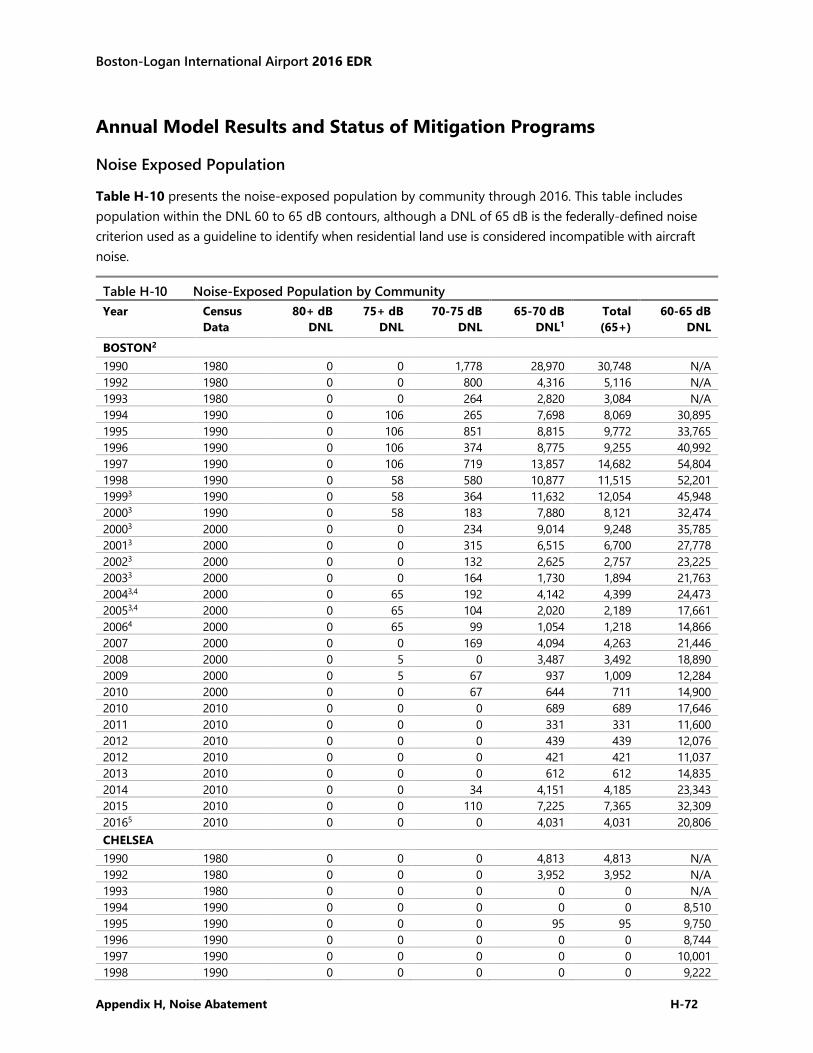
Boston-Logan International Airport 2016 EDR
Appendix H, Noise Abatement H-72
Annual Model Results and Status of Mitigation Programs
Noise Exposed Population
Table H-10 presents the noise-exposed population by community through 2016. This table includes population within the DNL 60 to 65 dB contours, although a DNL of 65 dB is the federally-defined noise criterion used as a guideline to identify when residential land use is considered incompatible with aircraft noise.
Table H-10 Noise-Exposed Population by Community Year Census
Data 80+ dB
DNL 75+ dB
DNL 70-75 dB
DNL 65-70 dB
DNL1 Total (65+)
60-65 dB DNL
BOSTON2 1990 1980 0 0 1,778 28,970 30,748 N/A 1992 1980 0 0 800 4,316 5,116 N/A 1993 1980 0 0 264 2,820 3,084 N/A 1994 1990 0 106 265 7,698 8,069 30,895 1995 1990 0 106 851 8,815 9,772 33,765 1996 1990 0 106 374 8,775 9,255 40,992 1997 1990 0 106 719 13,857 14,682 54,804 1998 1990 0 58 580 10,877 11,515 52,201 19993 1990 0 58 364 11,632 12,054 45,948 20003 1990 0 58 183 7,880 8,121 32,474 20003 2000 0 0 234 9,014 9,248 35,785 20013 2000 0 0 315 6,515 6,700 27,778 20023 2000 0 0 132 2,625 2,757 23,225 20033 2000 0 0 164 1,730 1,894 21,763 20043,4 2000 0 65 192 4,142 4,399 24,473 20053,4 2000 0 65 104 2,020 2,189 17,661 20064 2000 0 65 99 1,054 1,218 14,866 2007
2000 0 0 169 4,094 4,263 21,446
2008
2000 0 5 0 3,487 3,492 18,890 2009
2000 0 5 67 937 1,009 12,284
2010
2000 0 0 67 644 711 14,900 2010
2010 0 0 0 689 689 17,646
2011
2010 0 0 0 331 331 11,600 2012
2010 0 0 0 439 439 12,076
2012
2010 0 0 0 421 421 11,037 2013
2010 0 0 0 612 612 14,835
2014
2010 0 0 34 4,151 4,185 23,343 2015
2010 0 0 110 7,225 7,365 32,309
20165
2010 0 0 0 4,031 4,031 20,806 CHELSEA 1990 1980 0 0 0 4,813 4,813 N/A 1992 1980 0 0 0 3,952 3,952 N/A 1993 1980 0 0 0 0 0 N/A 1994 1990 0 0 0 0 0 8,510 1995 1990 0 0 0 95 95 9,750 1996 1990 0 0 0 0 0 8,744 1997 1990 0 0 0 0 0 10,001 1998 1990 0 0 0 0 0 9,222

Boston-Logan International Airport 2016 EDR
Appendix H, Noise Abatement H-73
Table H-10 Noise-Exposed Population by Community (Continued) Year Census
Data 80+ dB
DNL 75+ dB
DNL 70-75 dB
DNL 65-70 dB
DNL1 Total (65+)
60-65 dB DNL
CHELSEA 1999 1990 0 0 0 95 95 9,249 2000 1990 0 0 0 0 0 5,622 2000 2000 0 0 0 0 0 7,361 2001 2000 0 0 0 0 0 4,508 2002 2000 0 0 0 0 0 3,995 2003 2000 0 0 0 0 0 3,591 20044 2000 0 0 0 0 0 7,756 20054 2000 0 0 0 0 0 5,772 20064 2000 0 0 0 0 0 2,477 2007
2000 0 0 0 0 0 9,774
2008
2000 0 0 0 0 0 7,793 2009
2000 0 0 0 0 0 5,462
2010
2000 0 0 0 0 0 4,880 2010
2010 0 0 0 0 0 4,897
2011
2010 0 0 0 0 0 0 2012
2010 0 0 0 0 0 0
2012
2010 0 0 0 0 0 0 2013
2010 0 0 0 0 0 3,485
2014
2010 0 0 0 0 0 9,236 2015
2010 0 0 0 0 0 0
20165
2010 0 0 0 0 0 12,110 EVERETT 1990 1980 0 0 0 0 0 N/A 1992 1980 0 0 0 0 0 N/A 1993 1980 0 0 0 0 0 N/A 1994 1990 0 0 0 0 0 0 1995 1990 0 0 0 0 0 0 1996 1990 0 0 0 0 0 0 1997 1990 0 0 0 0 0 0 1998 1990 0 0 0 0 0 0 19993 1990 0 0 0 0 0 0 20003 1990 0 0 0 0 0 0 20003 2000 0 0 0 0 0 0 20013 2000 0 0 0 0 0 0 20023 2000 0 0 0 0 0 0 20033 2000 0 0 0 0 0 0 20043,4 2000 0 0 0 0 0 0 20053,4 2000 0 0 0 0 0 0 20064 2000 0 0 0 0 0 0 2007
2000 0 0 0 0 0 0
2008
2000 0 0 0 0 0 0 2009
2000 0 0 0 0 0 0
2010
2000 0 0 0 0 0 0 2010
2010 0 0 0 0 0 0
2011
2010 0 0 0 0 0 0 2012
2010 0 0 0 0 0 0
2012
2010 0 0 0 0 0 0 2013
2010 0 0 0 0 0 0
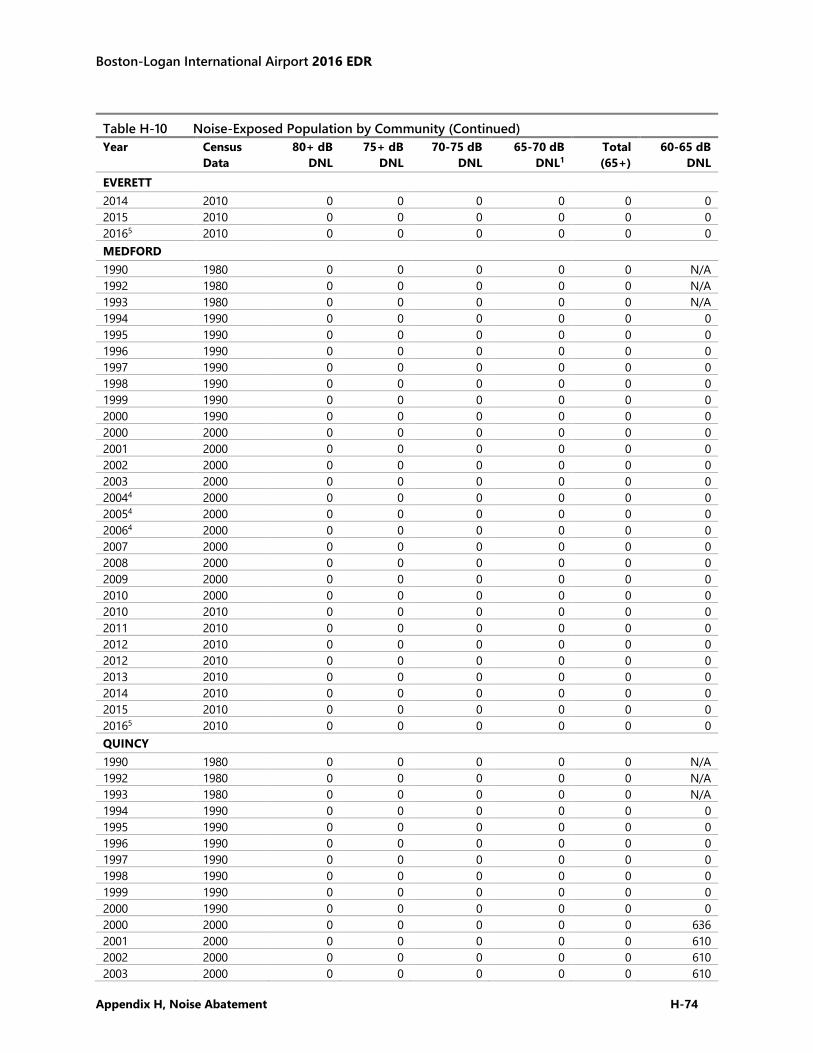
Boston-Logan International Airport 2016 EDR
Appendix H, Noise Abatement H-74
Table H-10 Noise-Exposed Population by Community (Continued) Year Census
Data 80+ dB
DNL 75+ dB
DNL 70-75 dB
DNL 65-70 dB
DNL1 Total (65+)
60-65 dB DNL
EVERETT 2014
2010 0 0 0 0 0 0
2015
2010 0 0 0 0 0 0 20165
2010 0 0 0 0 0 0
MEDFORD 1990 1980 0 0 0 0 0 N/A 1992 1980 0 0 0 0 0 N/A 1993 1980 0 0 0 0 0 N/A 1994 1990 0 0 0 0 0 0 1995 1990 0 0 0 0 0 0 1996 1990 0 0 0 0 0 0 1997 1990 0 0 0 0 0 0 1998 1990 0 0 0 0 0 0 1999 1990 0 0 0 0 0 0 2000 1990 0 0 0 0 0 0 2000 2000 0 0 0 0 0 0 2001 2000 0 0 0 0 0 0 2002 2000 0 0 0 0 0 0 2003 2000 0 0 0 0 0 0 20044 2000 0 0 0 0 0 0 20054 2000 0 0 0 0 0 0 20064 2000 0 0 0 0 0 0 2007
2000 0 0 0 0 0 0
2008
2000 0 0 0 0 0 0 2009
2000 0 0 0 0 0 0
2010
2000 0 0 0 0 0 0 2010
2010 0 0 0 0 0 0
2011
2010 0 0 0 0 0 0 2012
2010 0 0 0 0 0 0
2012
2010 0 0 0 0 0 0 2013
2010 0 0 0 0 0 0
2014
2010 0 0 0 0 0 0 2015
2010 0 0 0 0 0 0
20165
2010 0 0 0 0 0 0 QUINCY 1990 1980 0 0 0 0 0 N/A 1992 1980 0 0 0 0 0 N/A 1993 1980 0 0 0 0 0 N/A 1994 1990 0 0 0 0 0 0 1995 1990 0 0 0 0 0 0 1996 1990 0 0 0 0 0 0 1997 1990 0 0 0 0 0 0 1998 1990 0 0 0 0 0 0 1999 1990 0 0 0 0 0 0 2000 1990 0 0 0 0 0 0 2000 2000 0 0 0 0 0 636 2001 2000 0 0 0 0 0 610 2002 2000 0 0 0 0 0 610 2003 2000 0 0 0 0 0 610
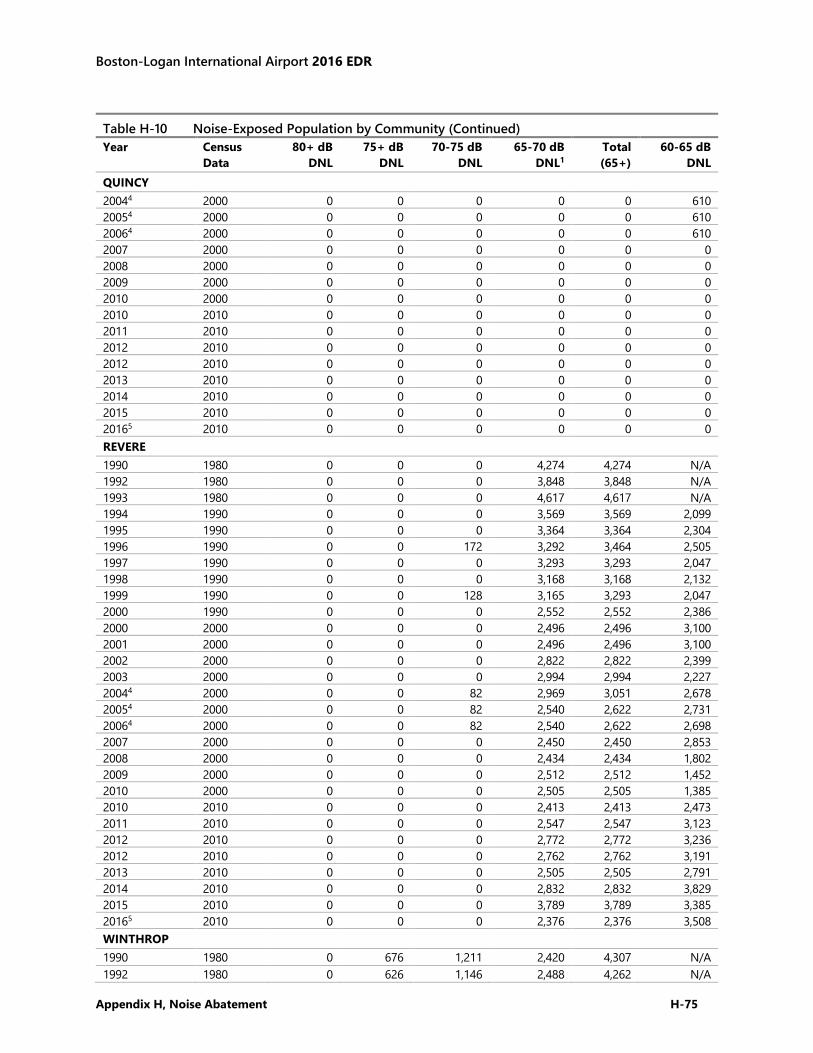
Boston-Logan International Airport 2016 EDR
Appendix H, Noise Abatement H-75
Table H-10 Noise-Exposed Population by Community (Continued) Year Census
Data 80+ dB
DNL 75+ dB
DNL 70-75 dB
DNL 65-70 dB
DNL1 Total (65+)
60-65 dB DNL
QUINCY 20044 2000 0 0 0 0 0 610 20054 2000 0 0 0 0 0 610 20064 2000 0 0 0 0 0 610 2007
2000 0 0 0 0 0 0
2008
2000 0 0 0 0 0 0 2009
2000 0 0 0 0 0 0
2010
2000 0 0 0 0 0 0 2010
2010 0 0 0 0 0 0
2011
2010 0 0 0 0 0 0 2012
2010 0 0 0 0 0 0
2012
2010 0 0 0 0 0 0 2013
2010 0 0 0 0 0 0
2014
2010 0 0 0 0 0 0 2015
2010 0 0 0 0 0 0
20165
2010 0 0 0 0 0 0 REVERE 1990 1980 0 0 0 4,274 4,274 N/A 1992 1980 0 0 0 3,848 3,848 N/A 1993 1980 0 0 0 4,617 4,617 N/A 1994 1990 0 0 0 3,569 3,569 2,099 1995 1990 0 0 0 3,364 3,364 2,304 1996 1990 0 0 172 3,292 3,464 2,505 1997 1990 0 0 0 3,293 3,293 2,047 1998 1990 0 0 0 3,168 3,168 2,132 1999 1990 0 0 128 3,165 3,293 2,047 2000 1990 0 0 0 2,552 2,552 2,386 2000 2000 0 0 0 2,496 2,496 3,100 2001 2000 0 0 0 2,496 2,496 3,100 2002 2000 0 0 0 2,822 2,822 2,399 2003 2000 0 0 0 2,994 2,994 2,227 20044 2000 0 0 82 2,969 3,051 2,678 20054 2000 0 0 82 2,540 2,622 2,731 20064 2000 0 0 82 2,540 2,622 2,698 2007
2000 0 0 0 2,450 2,450 2,853
2008
2000 0 0 0 2,434 2,434 1,802 2009
2000 0 0 0 2,512 2,512 1,452
2010
2000 0 0 0 2,505 2,505 1,385 2010
2010 0 0 0 2,413 2,413 2,473
2011
2010 0 0 0 2,547 2,547 3,123 2012
2010 0 0 0 2,772 2,772 3,236
2012
2010 0 0 0 2,762 2,762 3,191 2013
2010 0 0 0 2,505 2,505 2,791
2014
2010 0 0 0 2,832 2,832 3,829 2015
2010 0 0 0 3,789 3,789 3,385
20165
2010 0 0 0 2,376 2,376 3,508 WINTHROP 1990 1980 0 676 1,211 2,420 4,307 N/A 1992 1980 0 626 1,146 2,488 4,262 N/A
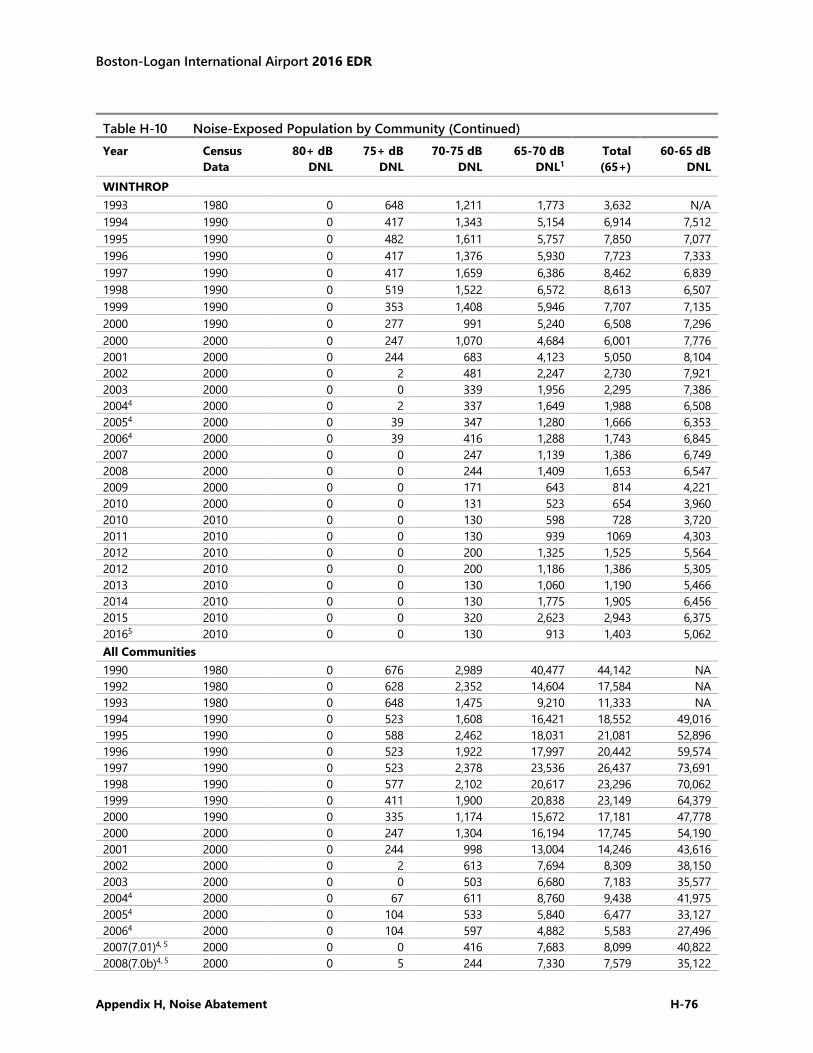
Boston-Logan International Airport 2016 EDR
Appendix H, Noise Abatement H-76
Table H-10 Noise-Exposed Population by Community (Continued) Year Census
Data 80+ dB
DNL 75+ dB
DNL 70-75 dB
DNL 65-70 dB
DNL1 Total (65+)
60-65 dB DNL
WINTHROP 1993 1980 0 648 1,211 1,773 3,632 N/A 1994 1990 0 417 1,343 5,154 6,914 7,512 1995 1990 0 482 1,611 5,757 7,850 7,077 1996 1990 0 417 1,376 5,930 7,723 7,333 1997 1990 0 417 1,659 6,386 8,462 6,839 1998 1990 0 519 1,522 6,572 8,613 6,507 1999 1990 0 353 1,408 5,946 7,707 7,135 2000 1990 0 277 991 5,240 6,508 7,296 2000 2000 0 247 1,070 4,684 6,001 7,776 2001 2000 0 244 683 4,123 5,050 8,104 2002 2000 0 2 481 2,247 2,730 7,921 2003 2000 0 0 339 1,956 2,295 7,386 20044 2000 0 2 337 1,649 1,988 6,508 20054 2000 0 39 347 1,280 1,666 6,353 20064 2000 0 39 416 1,288 1,743 6,845 2007
2000 0 0 247 1,139 1,386 6,749
2008
2000 0 0 244 1,409 1,653 6,547 2009
2000 0 0 171 643 814 4,221
2010
2000 0 0 131 523 654 3,960 2010
2010 0 0 130 598 728 3,720
2011
2010 0 0 130 939 1069 4,303 2012
2010 0 0 200 1,325 1,525 5,564
2012
2010 0 0 200 1,186 1,386 5,305 2013
2010 0 0 130 1,060 1,190 5,466
2014
2010 0 0 130 1,775 1,905 6,456 2015
2010 0 0 320 2,623 2,943 6,375
20165
2010 0 0 130 913 1,403 5,062 All Communities 1990 1980 0 676 2,989 40,477 44,142 NA 1992 1980 0 628 2,352 14,604 17,584 NA 1993 1980 0 648 1,475 9,210 11,333 NA 1994 1990 0 523 1,608 16,421 18,552 49,016 1995 1990 0 588 2,462 18,031 21,081 52,896 1996 1990 0 523 1,922 17,997 20,442 59,574 1997 1990 0 523 2,378 23,536 26,437 73,691 1998 1990 0 577 2,102 20,617 23,296 70,062 1999 1990 0 411 1,900 20,838 23,149 64,379 2000 1990 0 335 1,174 15,672 17,181 47,778 2000 2000 0 247 1,304 16,194 17,745 54,190 2001 2000 0 244 998 13,004 14,246 43,616 2002 2000 0 2 613 7,694 8,309 38,150 2003 2000 0 0 503 6,680 7,183 35,577 20044 2000 0 67 611 8,760 9,438 41,975 20054 2000 0 104 533 5,840 6,477 33,127 20064 2000 0 104 597 4,882 5,583 27,496 2007(7.01)4, 5 2000 0 0 416 7,683 8,099 40,822 2008(7.0b)4, 5 2000 0 5 244 7,330 7,579 35,122
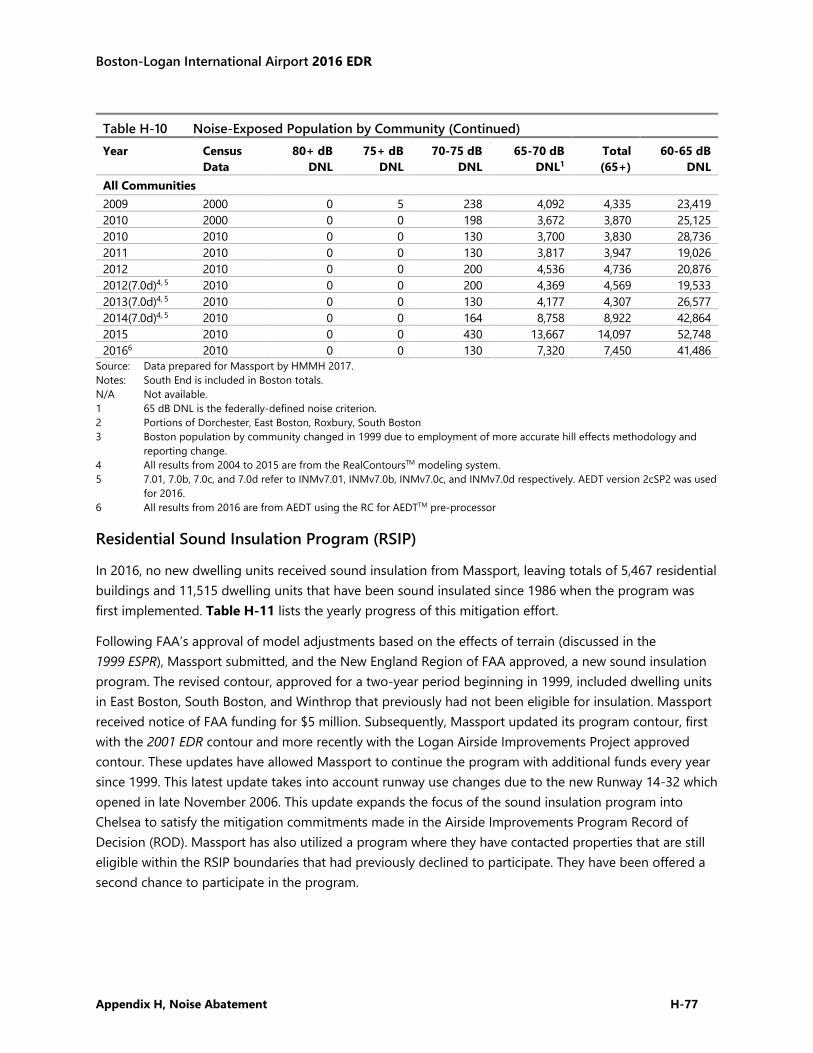
Boston-Logan International Airport 2016 EDR
Appendix H, Noise Abatement H-77
Table H-10 Noise-Exposed Population by Community (Continued) Year Census
Data 80+ dB
DNL 75+ dB
DNL 70-75 dB
DNL 65-70 dB
DNL1 Total (65+)
60-65 dB DNL
All Communities 2009
2000 0 5 238 4,092 4,335 23,419
2010
2000 0 0 198 3,672 3,870 25,125 2010
2010 0 0 130 3,700 3,830 28,736
2011
2010 0 0 130 3,817 3,947 19,026 2012
2010 0 0 200 4,536 4,736 20,876
2012(7.0d)4, 5 2010 0 0 200 4,369 4,569 19,533 2013(7.0d)4, 5 2010 0 0 130 4,177 4,307 26,577 2014(7.0d)4, 5 2010 0 0 164 8,758 8,922 42,864 2015
2010 0 0 430 13,667 14,097 52,748
20166
2010 0 0 130 7,320 7,450 41,486 Source: Data prepared for Massport by HMMH 2017. Notes: South End is included in Boston totals. N/A Not available. 1 65 dB DNL is the federally-defined noise criterion. 2 Portions of Dorchester, East Boston, Roxbury, South Boston 3 Boston population by community changed in 1999 due to employment of more accurate hill effects methodology and
reporting change. 4 All results from 2004 to 2015 are from the RealContoursTM modeling system. 5 7.01, 7.0b, 7.0c, and 7.0d refer to INMv7.01, INMv7.0b, INMv7.0c, and INMv7.0d respectively. AEDT version 2cSP2 was used
for 2016. 6 All results from 2016 are from AEDT using the RC for AEDTTM pre-processor
Residential Sound Insulation Program (RSIP)
In 2016, no new dwelling units received sound insulation from Massport, leaving totals of 5,467 residential buildings and 11,515 dwelling units that have been sound insulated since 1986 when the program was first implemented. Table H-11 lists the yearly progress of this mitigation effort.
Following FAA’s approval of model adjustments based on the effects of terrain (discussed in the 1999 ESPR), Massport submitted, and the New England Region of FAA approved, a new sound insulation program. The revised contour, approved for a two-year period beginning in 1999, included dwelling units in East Boston, South Boston, and Winthrop that previously had not been eligible for insulation. Massport received notice of FAA funding for $5 million. Subsequently, Massport updated its program contour, first with the 2001 EDR contour and more recently with the Logan Airside Improvements Project approved contour. These updates have allowed Massport to continue the program with additional funds every year since 1999. This latest update takes into account runway use changes due to the new Runway 14-32 which opened in late November 2006. This update expands the focus of the sound insulation program into Chelsea to satisfy the mitigation commitments made in the Airside Improvements Program Record of Decision (ROD). Massport has also utilized a program where they have contacted properties that are still eligible within the RSIP boundaries that had previously declined to participate. They have been offered a second chance to participate in the program.
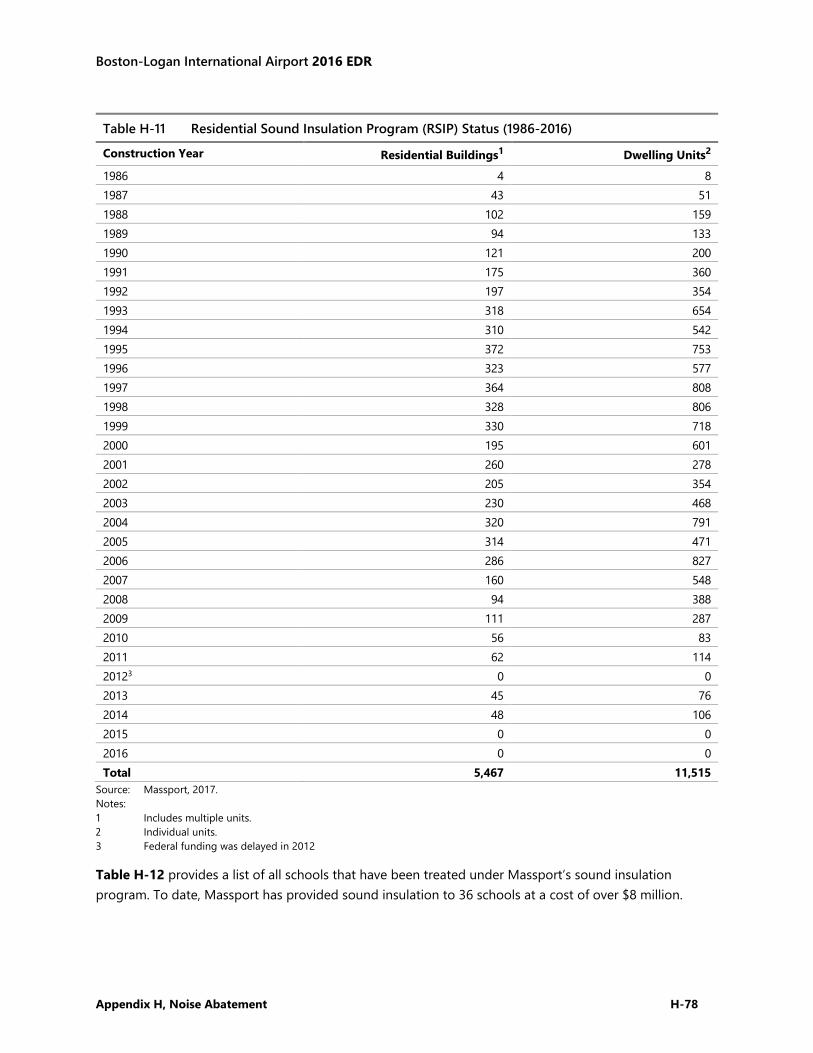
Boston-Logan International Airport 2016 EDR
Appendix H, Noise Abatement H-78
Table H-11 Residential Sound Insulation Program (RSIP) Status (1986-2016)
Construction Year Residential Buildings1 Dwelling Units2
1986 4 8 1987 43 51 1988 102 159 1989 94 133 1990 121 200 1991 175 360 1992 197 354 1993 318 654 1994 310 542 1995 372 753 1996 323 577 1997 364 808 1998 328 806 1999 330 718 2000 195 601 2001 260 278 2002 205 354 2003 230 468 2004 320 791 2005 314 471 2006 286 827 2007 160 548 2008 94 388 2009 111 287 2010 56 83 2011 62 114 20123 0 0 2013 45 76 2014 48 106 2015 0 0 2016 0 0 Total 5,467 11,515
Source: Massport, 2017. Notes: 1 Includes multiple units. 2 Individual units. 3 Federal funding was delayed in 2012
Table H-12 provides a list of all schools that have been treated under Massport’s sound insulation program. To date, Massport has provided sound insulation to 36 schools at a cost of over $8 million.
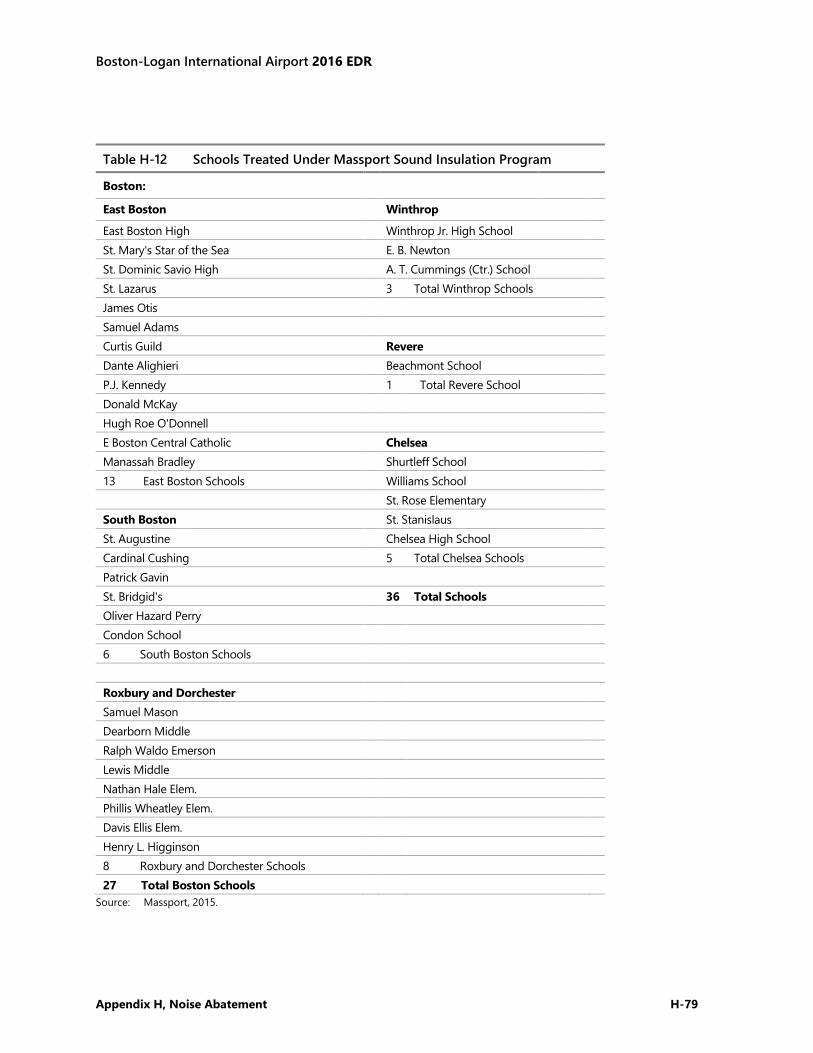
Boston-Logan International Airport 2016 EDR
Appendix H, Noise Abatement H-79
Table H-12 Schools Treated Under Massport Sound Insulation Program
Boston:
East Boston Winthrop East Boston High Winthrop Jr. High School St. Mary's Star of the Sea E. B. Newton St. Dominic Savio High A. T. Cummings (Ctr.) School St. Lazarus 3 Total Winthrop Schools James Otis
Samuel Adams
Curtis Guild Revere
Dante Alighieri Beachmont School P.J. Kennedy 1 Total Revere School Donald McKay Hugh Roe O'Donnell
E Boston Central Catholic Chelsea Manassah Bradley Shurtleff School 13 East Boston Schools Williams School St. Rose Elementary South Boston St. Stanislaus St. Augustine Chelsea High School Cardinal Cushing 5 Total Chelsea Schools Patrick Gavin St. Bridgid's 36 Total Schools Oliver Hazard Perry Condon School
6 South Boston Schools
Roxbury and Dorchester
Samuel Mason
Dearborn Middle
Ralph Waldo Emerson
Lewis Middle
Nathan Hale Elem.
Phillis Wheatley Elem.
Davis Ellis Elem.
Henry L. Higginson
8 Roxbury and Dorchester Schools
27 Total Boston Schools Source: Massport, 2015.
Boston-Logan International Airport 2016 EDR
Appendix H, Noise Abatement H-80
Noise Complaints
Table H-13 presents a detailed list by community of the total complaints made in 2015 and 2016, which can be filed either on Massport’s Noise Complaint Line, through a form on Massport’s website or through the PublicVue flight track portal. The Noise Complaint Line provides individuals the ability to express their concerns about aviation noise (activities) or to ask questions regarding noise at Logan Airport. Callers ask a range of questions such as “Why is this runway in use?”; “What times do the planes stop flying?” and “Was that aircraft off-course?”
The Noise Abatement Office (NAO) staff documents noise line complaints by obtaining information from the caller about the nature of the complaint, time of the occurrence, location of caller’s residence, and the activity that was disturbed. The NAO uses the collected information to determine the probable activity responsible for the complaint and writes a letter report to the complainant. The letter includes the original complaint, a response that identifies the activity responsible for the call (arrivals, departures, run-up, etc.), meteorological information at the time of the call (a major factor in aviation activities), runways in use at the time of the call, and a notice that FAA will receive a copy of the report.
In 2016, Massport received 38,053 noise complaints from 82 communities (Figure H-13), an increase from 17,369 in 2015. The number of individual complainants increased at a much smaller rate, by 1,903 individuals in 2015 to 2,255 individuals in 2016, indicating that noise annoyance is growing among a concentrated population rather than spreading to a larger population. This is consistent with a recent survey of U.S. airports that finds noise complaints concentrated among relatively small numbers of complainants.16 This research, completed by George Mason University, shows that a small number of people account for a disproportionately high share of the total number of noise complaints (the full article is included at the end of this appendix). Massport’s website, http://www.massport.com/logan-airport/about-logan/noise-abatement/complaints/), provides for additional general questions and answers regarding the Noise Complaint Line.
–––––––––––––––– 16 Dourado, E. and Russell, R. October 2016. Airport Noise NIMBYism: An Empirical Investigation. Mercatus Center at George
Mason University. https://www.mercatus.org/system/files/dourado-airport-noise-mop-v1.pdf. Accessed September 27 ,2017.
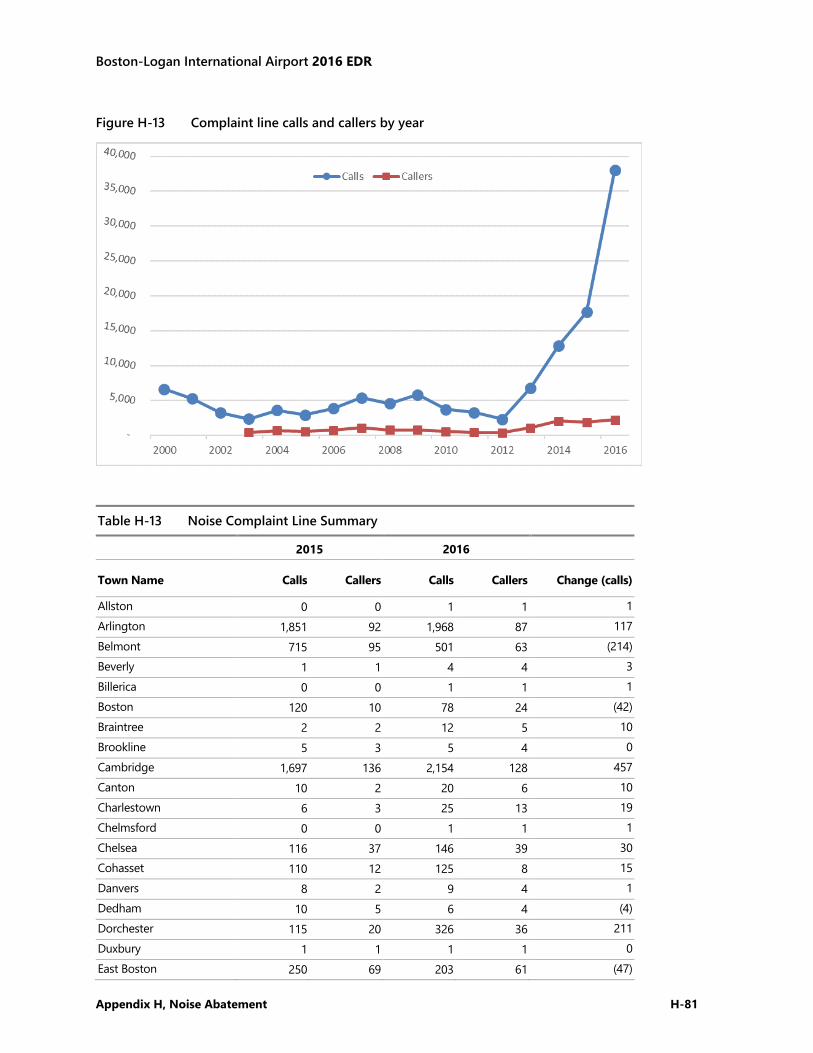
Boston-Logan International Airport 2016 EDR
Appendix H, Noise Abatement H-81
Figure H-13 Complaint line calls and callers by year
Table H-13 Noise Complaint Line Summary
2015 2016
Town Name Calls Callers Calls Callers Change (calls)
Allston 0 0 1 1 1 Arlington 1,851 92 1,968 87 117 Belmont 715 95 501 63 (214) Beverly 1 1 4 4 3 Billerica 0 0 1 1 1 Boston 120 10 78 24 (42) Braintree 2 2 12 5 10 Brookline 5 3 5 4 0 Cambridge 1,697 136 2,154 128 457 Canton 10 2 20 6 10 Charlestown 6 3 25 13 19 Chelmsford 0 0 1 1 1 Chelsea 116 37 146 39 30 Cohasset 110 12 125 8 15 Danvers 8 2 9 4 1 Dedham 10 5 6 4 (4) Dorchester 115 20 326 36 211 Duxbury 1 1 1 1 0 East Boston 250 69 203 61 (47)
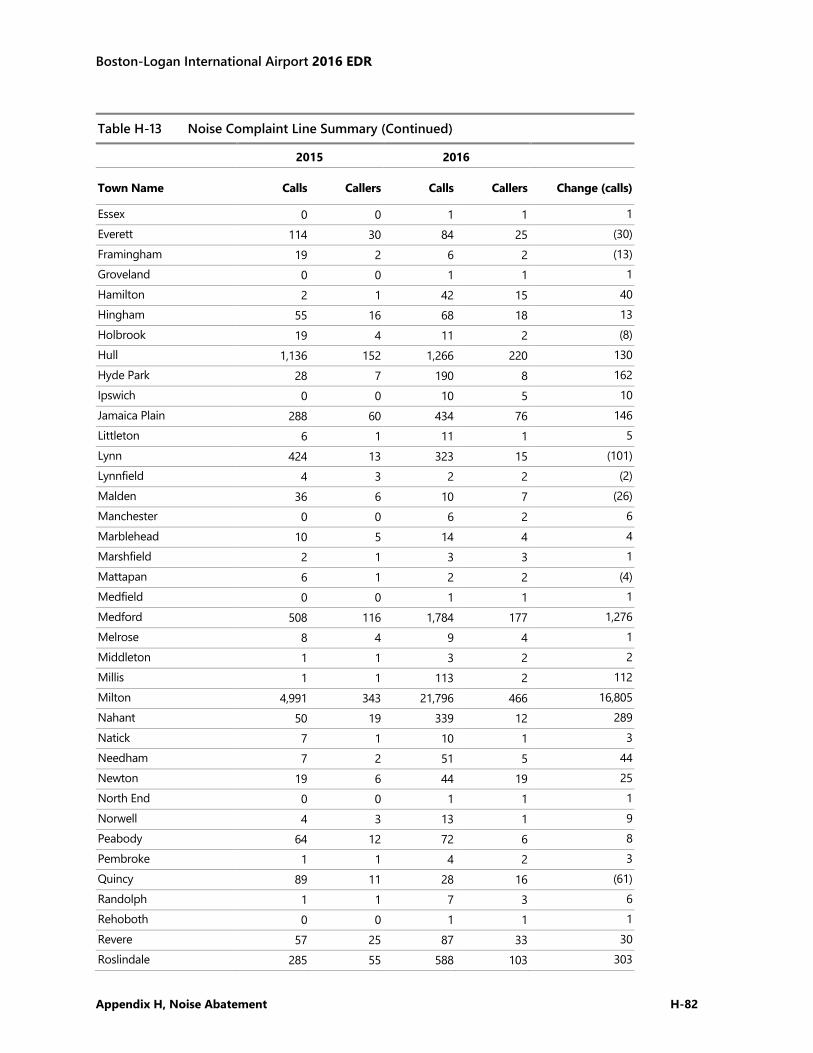
Boston-Logan International Airport 2016 EDR
Appendix H, Noise Abatement H-82
Table H-13 Noise Complaint Line Summary (Continued)
2015 2016
Town Name Calls Callers Calls Callers Change (calls)
Essex 0 0 1 1 1 Everett 114 30 84 25 (30) Framingham 19 2 6 2 (13) Groveland 0 0 1 1 1 Hamilton 2 1 42 15 40 Hingham 55 16 68 18 13 Holbrook 19 4 11 2 (8) Hull 1,136 152 1,266 220 130 Hyde Park 28 7 190 8 162 Ipswich 0 0 10 5 10 Jamaica Plain 288 60 434 76 146 Littleton 6 1 11 1 5 Lynn 424 13 323 15 (101) Lynnfield 4 3 2 2 (2) Malden 36 6 10 7 (26) Manchester 0 0 6 2 6 Marblehead 10 5 14 4 4 Marshfield 2 1 3 3 1 Mattapan 6 1 2 2 (4) Medfield 0 0 1 1 1 Medford 508 116 1,784 177 1,276 Melrose 8 4 9 4 1 Middleton 1 1 3 2 2 Millis 1 1 113 2 112 Milton 4,991 343 21,796 466 16,805 Nahant 50 19 339 12 289 Natick 7 1 10 1 3 Needham 7 2 51 5 44 Newton 19 6 44 19 25 North End 0 0 1 1 1 Norwell 4 3 13 1 9 Peabody 64 12 72 6 8 Pembroke 1 1 4 2 3 Quincy 89 11 28 16 (61) Randolph 1 1 7 3 6 Rehoboth 0 0 1 1 1 Revere 57 25 87 33 30 Roslindale 285 55 588 103 303
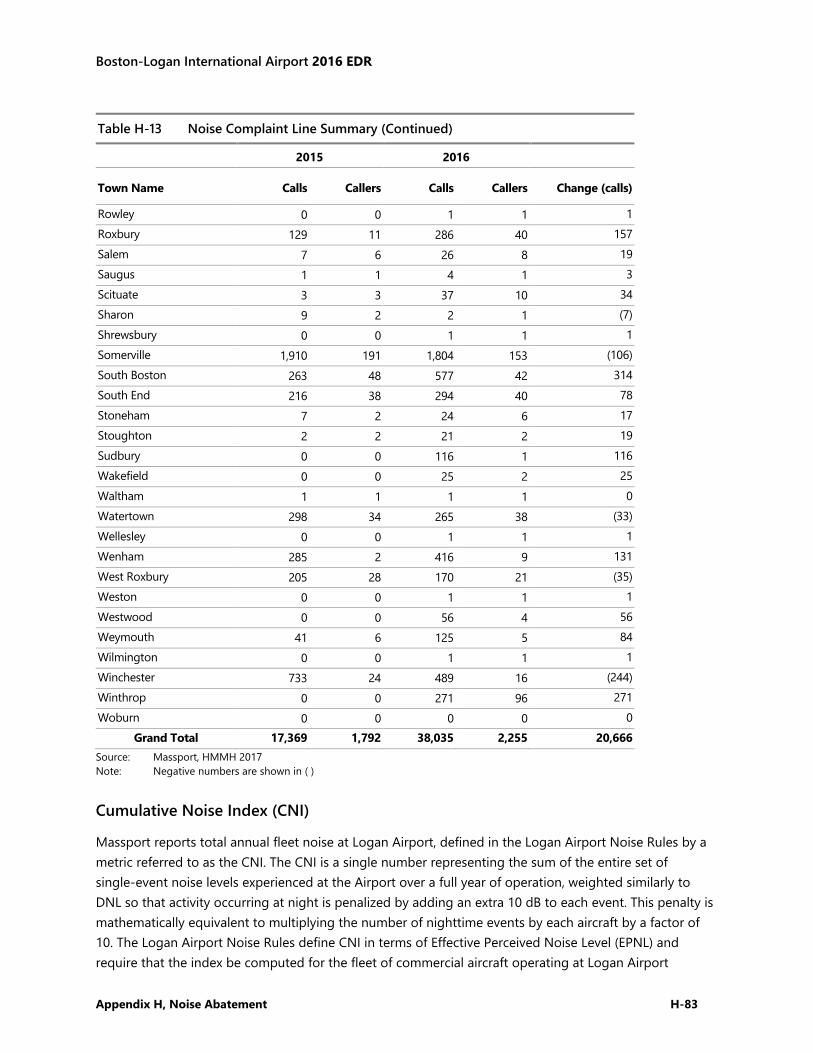
Boston-Logan International Airport 2016 EDR
Appendix H, Noise Abatement H-83
Table H-13 Noise Complaint Line Summary (Continued)
2015 2016
Town Name Calls Callers Calls Callers Change (calls)
Rowley 0 0 1 1 1 Roxbury 129 11 286 40 157 Salem 7 6 26 8 19 Saugus 1 1 4 1 3 Scituate 3 3 37 10 34 Sharon 9 2 2 1 (7) Shrewsbury 0 0 1 1 1 Somerville 1,910 191 1,804 153 (106) South Boston 263 48 577 42 314 South End 216 38 294 40 78 Stoneham 7 2 24 6 17 Stoughton 2 2 21 2 19 Sudbury 0 0 116 1 116 Wakefield 0 0 25 2 25 Waltham 1 1 1 1 0 Watertown 298 34 265 38 (33) Wellesley 0 0 1 1 1 Wenham 285 2 416 9 131 West Roxbury 205 28 170 21 (35) Weston 0 0 1 1 1 Westwood 0 0 56 4 56 Weymouth 41 6 125 5 84 Wilmington 0 0 1 1 1 Winchester 733 24 489 16 (244) Winthrop 0 0 271 96 271 Woburn 0 0 0 0 0
Grand Total 17,369 1,792 38,035 2,255 20,666 Source: Massport, HMMH 2017 Note: Negative numbers are shown in ( )
Cumulative Noise Index (CNI)
Massport reports total annual fleet noise at Logan Airport, defined in the Logan Airport Noise Rules by a metric referred to as the CNI. The CNI is a single number representing the sum of the entire set of single-event noise levels experienced at the Airport over a full year of operation, weighted similarly to DNL so that activity occurring at night is penalized by adding an extra 10 dB to each event. This penalty is mathematically equivalent to multiplying the number of nighttime events by each aircraft by a factor of 10. The Logan Airport Noise Rules define CNI in terms of Effective Perceived Noise Level (EPNL) and require that the index be computed for the fleet of commercial aircraft operating at Logan Airport

Boston-Logan International Airport 2016 EDR
Appendix H, Noise Abatement H-84
throughout the year. In addition, in EDRs and ESPRs, Massport reports partial CNI values of noise at Logan Airport, so that various subsets of the fleet (cargo, night operations, passenger jets, etc.) are identified (see Table H-14). The Noise Rules, adopted by Massport following public hearings held in February 1986, established a CNI limit of 156.5 Effective Perceived Noise Decibels (EPNdB). The CNI generally has decreased since 1990, remaining below that cap, with changes from year to year on the order of a few tenths of a decibel. The 2016 CNI remains well below the cap of 156.5 EPNL.
Table H-14 Cumulative Noise Index (EPNL) – 1990 to 2015 (limit 156.5)
1990 1991 1992 1993 1994 1995 1996 1997 1998 1999
Full CNI (Entire Commercial Jet Fleet)
156.4 155.8 155.5 155.3 155.4 155.3 155.1 154.8 154.7 154.9
Total Passenger Jets 155.2 154.8 154.6 154.4 154.4 154.2 154.1 153.9 153.7 153.9 Total Cargo Jets 150.1 148.9 148.0 147.9 148.3 148.8 148.6 147.5 147.9 148.0 Total Daytime 152.5 152.1 152.4 152.1 152.1 151.6 151.2 150.8 150.4 150.4 Total Nighttime 154.4 153.4 152.6 152.4 152.6 152.9 152.9 152.5 152.7 153.1 Total Stage 2 Jets N/A N/A N/A N/A 151.0 150.2 149.4 149.2 147.7 147.1 Total Stage 3 Jets N/A N/A N/A N/A 153.4 153.8 153.8 153.4 153.8 154.2 Daytime Stage 2 N/A N/A N/A N/A 149.0 148.5 147.6 146.5 145.2 144.1 Nighttime Stage 2 N/A N/A N/A N/A 146.7 145.1 144.8 145.8 144.1 144.0 Daytime Stage 3 N/A N/A N/A N/A 149.1 148.8 148.7 148.8 148.9 149.2 Nighttime Stage 3 N/A N/A N/A N/A 151.4 152.1 152.2 151.5 152.1 152.5 Passenger Jet Stage 2 N/A N/A N/A N/A 150.5 149.9 149.2 148.9 147.5 146.8 Passenger Jet Stage 3 N/A N/A N/A N/A 152.2 152.3 152.3 152.2 152.6 153.0 Cargo Jet Stage 2 N/A N/A N/A N/A 141.5 137.4 136.8 137.4 139.0 134.5 Cargo Jet Stage 3 N/A N/A N/A N/A 147.3 148.5 148.3 147.0 147.3 147.9 Daytime Passenger N/A 152.0 152.2 152.0 152.0 151.5 151.1 150.6 150.1 150.1 Nighttime Passenger N/A 151.6 150.9 150.6 150.8 151.0 151.0 151.1 151.2 151.6 Daytime Cargo 137.1 137.1 137.6 135.2 136.1 138.0 136.7 136.2 138.0 138.2 Nighttime Cargo 149.9 148.6 147.6 147.6 148.0 148.4 148.3 147.1 147.5 147.6 Daytime Passenger Stage 2 N/A N/A N/A N/A 148.9 148.4 147.6 146.5 145.0 143.9 Daytime Passenger Stage 3 N/A N/A N/A N/A 149.0 148.5 148.4 148.5 148.6 149.0 Nighttime Passenger Stage 2 N/A N/A N/A N/A 149.0 148.5 148.4 148.5 142.8 143.7 Nighttime Passenger Stage 3 N/A N/A N/A N/A 149.4 149.9 150.1 149.8 150.5 150.8 Daytime Cargo Stage 2 N/A N/A N/A N/A 128.3 126.7 124.6 126.4 131.6 131.5 Daytime Cargo Stage 3 N/A N/A N/A N/A 135.3 137.7 136.4 135.7 136.9 137.1 Nighttime Cargo Stage 2 N/A N/A N/A N/A 141.3 137.0 136.5 137.0 138.2 131.5 Nighttime Cargo Stage 3 N/A N/A N/A N/A 147.0 148.1 148.0 146.6 146.9 147.5
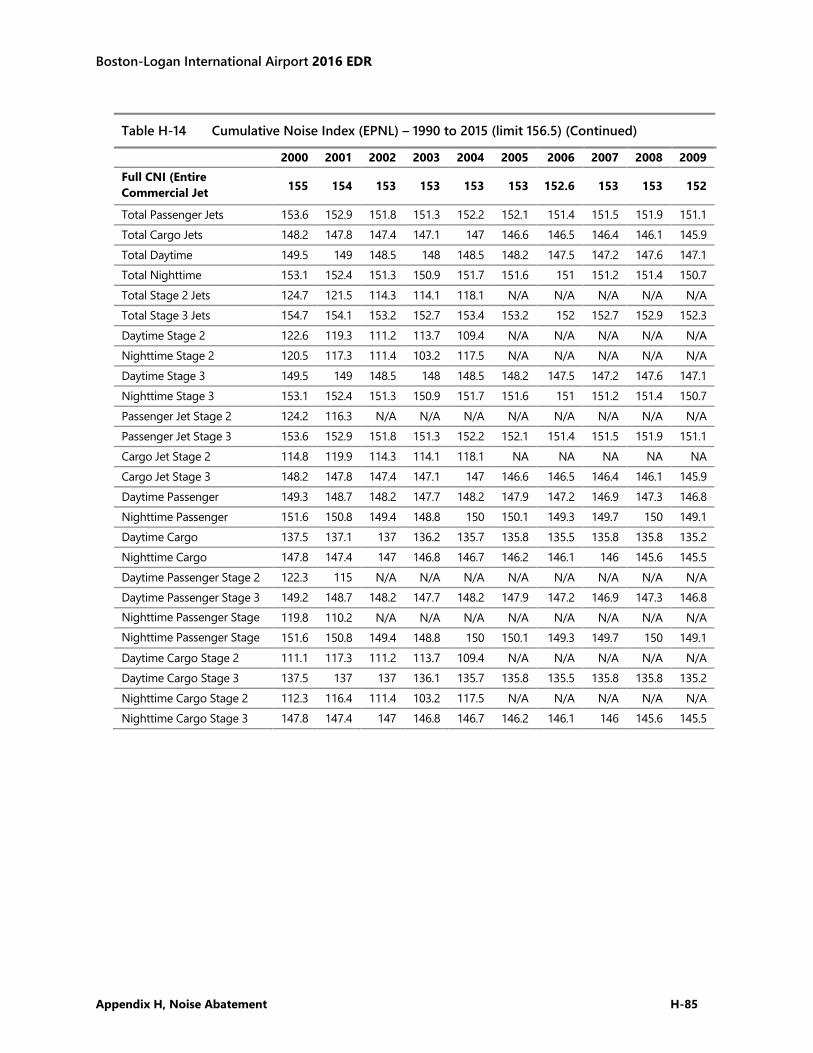
Boston-Logan International Airport 2016 EDR
Appendix H, Noise Abatement H-85
Table H-14 Cumulative Noise Index (EPNL) – 1990 to 2015 (limit 156.5) (Continued)
2000 2001 2002 2003 2004 2005 2006 2007 2008 2009 Full CNI (Entire Commercial Jet
155 154 153 153 153 153 152.6 153 153 152
Total Passenger Jets 153.6 152.9 151.8 151.3 152.2 152.1 151.4 151.5 151.9 151.1 Total Cargo Jets 148.2 147.8 147.4 147.1 147 146.6 146.5 146.4 146.1 145.9 Total Daytime 149.5 149 148.5 148 148.5 148.2 147.5 147.2 147.6 147.1 Total Nighttime 153.1 152.4 151.3 150.9 151.7 151.6 151 151.2 151.4 150.7 Total Stage 2 Jets 124.7 121.5 114.3 114.1 118.1 N/A N/A N/A N/A N/A Total Stage 3 Jets 154.7 154.1 153.2 152.7 153.4 153.2 152 152.7 152.9 152.3 Daytime Stage 2 122.6 119.3 111.2 113.7 109.4 N/A N/A N/A N/A N/A Nighttime Stage 2 120.5 117.3 111.4 103.2 117.5 N/A N/A N/A N/A N/A Daytime Stage 3 149.5 149 148.5 148 148.5 148.2 147.5 147.2 147.6 147.1 Nighttime Stage 3 153.1 152.4 151.3 150.9 151.7 151.6 151 151.2 151.4 150.7 Passenger Jet Stage 2 124.2 116.3 N/A N/A N/A N/A N/A N/A N/A N/A Passenger Jet Stage 3 153.6 152.9 151.8 151.3 152.2 152.1 151.4 151.5 151.9 151.1 Cargo Jet Stage 2 114.8 119.9 114.3 114.1 118.1 NA NA NA NA NA Cargo Jet Stage 3 148.2 147.8 147.4 147.1 147 146.6 146.5 146.4 146.1 145.9 Daytime Passenger 149.3 148.7 148.2 147.7 148.2 147.9 147.2 146.9 147.3 146.8 Nighttime Passenger 151.6 150.8 149.4 148.8 150 150.1 149.3 149.7 150 149.1 Daytime Cargo 137.5 137.1 137 136.2 135.7 135.8 135.5 135.8 135.8 135.2 Nighttime Cargo 147.8 147.4 147 146.8 146.7 146.2 146.1 146 145.6 145.5 Daytime Passenger Stage 2 122.3 115 N/A N/A N/A N/A N/A N/A N/A N/A Daytime Passenger Stage 3 149.2 148.7 148.2 147.7 148.2 147.9 147.2 146.9 147.3 146.8 Nighttime Passenger Stage
119.8 110.2 N/A N/A N/A N/A N/A N/A N/A N/A Nighttime Passenger Stage
151.6 150.8 149.4 148.8 150 150.1 149.3 149.7 150 149.1 Daytime Cargo Stage 2 111.1 117.3 111.2 113.7 109.4 N/A N/A N/A N/A N/A Daytime Cargo Stage 3 137.5 137 137 136.1 135.7 135.8 135.5 135.8 135.8 135.2 Nighttime Cargo Stage 2 112.3 116.4 111.4 103.2 117.5 N/A N/A N/A N/A N/A Nighttime Cargo Stage 3 147.8 147.4 147 146.8 146.7 146.2 146.1 146 145.6 145.5
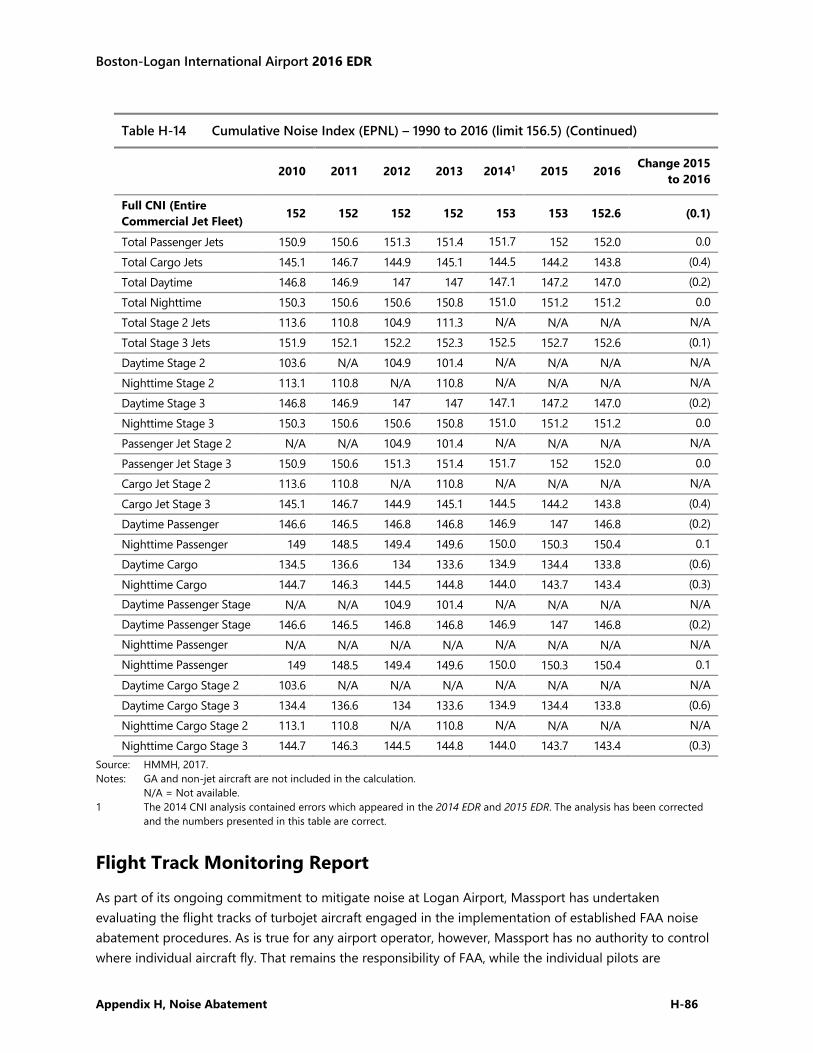
Boston-Logan International Airport 2016 EDR
Appendix H, Noise Abatement H-86
Table H-14 Cumulative Noise Index (EPNL) – 1990 to 2016 (limit 156.5) (Continued)
2010 2011 2012 2013 20141 2015 2016 Change 2015 to 2016
Full CNI (Entire Commercial Jet Fleet) 152 152 152 152 153 153 152.6 (0.1)
Total Passenger Jets 150.9 150.6 151.3 151.4 151.7 152 152.0 0.0 Total Cargo Jets 145.1 146.7 144.9 145.1 144.5 144.2 143.8 (0.4) Total Daytime 146.8 146.9 147 147 147.1 147.2 147.0 (0.2) Total Nighttime 150.3 150.6 150.6 150.8 151.0 151.2 151.2 0.0 Total Stage 2 Jets 113.6 110.8 104.9 111.3 N/A N/A N/A N/A Total Stage 3 Jets 151.9 152.1 152.2 152.3 152.5 152.7 152.6 (0.1) Daytime Stage 2 103.6 N/A 104.9 101.4 N/A N/A N/A N/A Nighttime Stage 2 113.1 110.8 N/A 110.8 N/A N/A N/A N/A Daytime Stage 3 146.8 146.9 147 147 147.1 147.2 147.0 (0.2) Nighttime Stage 3 150.3 150.6 150.6 150.8 151.0 151.2 151.2 0.0 Passenger Jet Stage 2 N/A N/A 104.9 101.4 N/A N/A N/A N/A Passenger Jet Stage 3 150.9 150.6 151.3 151.4 151.7 152 152.0 0.0 Cargo Jet Stage 2 113.6 110.8 N/A 110.8 N/A N/A N/A N/A Cargo Jet Stage 3 145.1 146.7 144.9 145.1 144.5 144.2 143.8 (0.4) Daytime Passenger 146.6 146.5 146.8 146.8 146.9 147 146.8 (0.2) Nighttime Passenger 149 148.5 149.4 149.6 150.0 150.3 150.4 0.1 Daytime Cargo 134.5 136.6 134 133.6 134.9 134.4 133.8 (0.6) Nighttime Cargo 144.7 146.3 144.5 144.8 144.0 143.7 143.4 (0.3) Daytime Passenger Stage
N/A N/A 104.9 101.4 N/A N/A N/A N/A Daytime Passenger Stage
146.6 146.5 146.8 146.8 146.9 147 146.8 (0.2) Nighttime Passenger
N/A N/A N/A N/A N/A N/A N/A N/A
Nighttime Passenger
149 148.5 149.4 149.6 150.0 150.3 150.4 0.1 Daytime Cargo Stage 2 103.6 N/A N/A N/A N/A N/A N/A N/A Daytime Cargo Stage 3 134.4 136.6 134 133.6 134.9 134.4 133.8 (0.6) Nighttime Cargo Stage 2 113.1 110.8 N/A 110.8 N/A N/A N/A N/A Nighttime Cargo Stage 3 144.7 146.3 144.5 144.8 144.0 143.7 143.4 (0.3)
Source: HMMH, 2017. Notes: GA and non-jet aircraft are not included in the calculation. N/A = Not available. 1 The 2014 CNI analysis contained errors which appeared in the 2014 EDR and 2015 EDR. The analysis has been corrected
and the numbers presented in this table are correct.
Flight Track Monitoring Report
As part of its ongoing commitment to mitigate noise at Logan Airport, Massport has undertaken evaluating the flight tracks of turbojet aircraft engaged in the implementation of established FAA noise abatement procedures. As is true for any airport operator, however, Massport has no authority to control where individual aircraft fly. That remains the responsibility of FAA, while the individual pilots are
Boston-Logan International Airport 2016 EDR
Appendix H, Noise Abatement H-87
responsible for safely executing FAA’s instructions. The flight procedures, which are used by the Air Traffic Control (ATC) staff at Boston Tower to achieve desired noise abatement tracks, are contained in FAA’s Tower Order (BOS TWR 7040.1).
This is the fifteenth annual report for flight track monitoring. Prior to 2002, Massport had issued semi-annual reports, an outgrowth of the Flight Track Monitoring Program study. That study was contained in the Generic Environmental Impact Report filed with Massachusetts Environmental Policy Act (MEPA) in July 1996, and was the subject of two Community Working Group workshops in September and October 1996. The fourteenth annual report was published in Appendix H, Noise Abatement in the 2015 EDR. The information for 2015 is repeated in this report for reference. The period covered by this 2016 EDR is January 1, 2016 through December 31, 2016.
The purpose of the ongoing monitoring program is to identify any systematic changes in flight tracks that may occur and to reduce flight track dispersion, where appropriate. The next report will cover the period January 1, 2017 through December 31, 2017, and will be included in the 2017 ESPR.
FAA Air Traffic Control (ATC) Procedures
FAA Tower Order BOS TWR 7040.1 entitled “Noise Abatement” describes the series of noise abatement policies, rules, regulations, and the procedures to be followed by FAA air traffic controllers in meeting their designated responsibilities to be “a good neighbor, while meeting our operational objectives/ responsibilities to the National Airspace System.” Section 7.a.3 of the Order, subtitled “Turbojet Departure Noise Abatement Procedures,” states that all turbojet departures shall be issued the Standard Instrument Departure (SID) procedure appropriate for the departure runway. They are paraphrased from the LOGAN NINE SID17 below.
Note in the descriptions that follow that terms such as “BOS 2 DME” are used frequently. Here, BOS refers to an aid to navigation known as the BOSTON VORTAC, a radio beacon physically located on Logan Airport near the eastern shoreline between the ends of Runways 27 and 33L (see Figure H-14). DME refers to “Distance Measuring Equipment,” a co-located aid to navigation that provides pilots with a cockpit display of the number of nautical miles that the aircraft is from the designated radio beacon. Thus, BOS 2 DME means an aircraft should be two nautical miles away from the BOS. The term “vectored” means the pilot is assigned to fly a magnetic heading given by and at the discretion of FAA air traffic controller to maintain the safe separation of aircraft. “MSL” is defined as feet above mean sea level and is the indicator of aircraft altitude used both by the pilot in the cockpit and the air traffic controller on the ground.
During 2010, several of the conventional-only (or radar vector) and RNAV procedures from the Boston Logan Airport Noise Study Categorical Exclusion (CATEX)18 were implemented. There are eight new RNAV procedures for departures from Logan Airport. These eight procedures are used by aircraft departing Runways 4R, 9, 15R, 22L, 22R, 27, and 33L (Runways 27 and 33L were added in 2014). These procedures primarily affected departures flying over the North and South shores and were designed to increase the amount of jet traffic crossing back over land above 6,000 feet to minimize noise impacts to communities. ––––––––––––––––
17 Accessed 04/07/2016 18 Federal Aviation Administration (FAA) Boston Logan Airport Noise Study Categorical Exclusion Record of Decision (CATEX
ROD), Issued October 16, 2007
Boston-Logan International Airport 2016 EDR
Appendix H, Noise Abatement H-88
A ninth RNAV procedure, which is used by Runway 27, has been in use at the Airport and has been modified several times. For departures, the conventional procedures (flown by non-RNAV equipped aircraft) from the LOGAN NINE SID are:
For Runway 4R, climb heading 036 degrees to BOS 4 DME, then turn right to a heading of 090 degrees, and then expect radar vectors to assigned route/navaid/fix. Aircraft that are initially vectored over water can expect to cross the coastline above 6,000 MSL before proceeding on course.
For Runway 9, climb heading 093 degrees, and then expect radar vectors to assigned route/navaid/fix. Aircraft that are initially vectored over water can expect to cross the coastline above 6,000 MSL before proceeding on course.
For Runway 14, climb heading 142 degrees to BOS 1 DME, then turn left to heading 120 degrees, then expect radar vectors to assigned route/navaid/fix. Aircraft that are initially vectored over water can expect to cross the coastline above 6,000 MSL before proceeding on course.
For Runway 15R, climb heading 151 degrees to BOS 1 DME then turn left to 120 degrees, then expect radar vectors to assigned route/navaid/fix. Aircraft that are initially vectored over water can expect to cross the coastline above 6,000 MSL before proceeding on course.
For Runways 22R and 22L, climbing left turn to a heading of 140 degrees, then expect radar vectors to assigned route/navaid/fix. Aircraft that are initially vectored over water can expect to cross the coastline above 6,000 MSL before proceeding on course.
For Runway 33L, climb heading 331 degrees to BOS 2 DME then turn left to 316 degrees, then expect radar vectors to assigned route/navaid/fix.
For Runway 27, climb heading 273 to BOS 2.2 DME, then turn left heading 235 degrees, then expect radar vectors to assigned route/navaid/fix.
The RNAV procedures (used only by Turbojets)19 and the runways they serve:
BLZZR THREE – Runways 4L, 9, 15R, 22L, 22R, 27, and 33L: This procedure directs most jet traffic in a well-defined flight corridor over the ocean and crossing back over the South Shore near Cohasset and Scituate.
BRUWN FOUR – Runways 4L, 9, 15R, 22L, 22R, 27, and 33L: This procedure directs most jet traffic in a well-defined flight corridor over the ocean towards Cape Cod.
CELTK FOUR – Runways 4L, 9, 15R, 22L, 22R, 27, and 33L: This procedure directs most jet traffic in a well-defined flight corridor over the ocean.
HYLND FOUR – 4L, 9, 15R, 22L, 22R, 27, and 33L: This procedure directs most jet traffic in a well-defined flight corridor over the ocean and crossing back over the North Shore near Beverly.
LBSTA FOUR – 4L, 9, 15R, 22L, 22R, 27, 33L: This procedure directs most jet traffic in a well-defined flight corridor over the ocean and crossing back over the North Shore near Manchester and Gloucester.
PATSS FOUR – 4L, 9, 15R, 22L, 22R, 27, 33L: This procedure directs most jet traffic in a well-defined flight corridor over the ocean and crossing back over the South Shore near Cohasset and Scituate.
REVSS THREE – 4L, 9, 15R, 22L, 22R, 27, 33L: This procedure directs most jet traffic in a well-defined flight corridor over the ocean and crossing back over the South Shore near Cohasset and Scituate.
–––––––––––––––– 19 These are the procedures as defined on April 7, 2016. Procedures may be adjusted at points throughout the year.
Boston-Logan International Airport 2016 EDR
Appendix H, Noise Abatement H-89
SSOXS FOUR – 4L, 9, 15R, 22L, 22R, 27, 33L: This procedure directs most jet traffic in a well-defined flight corridor over the ocean and crossing back over the South Shore over Marshfield.
WYLYY TWO – 27: This procedure directs most jet traffic in a well-defined flight corridor on a heading of 273 degrees then a turn to 235 degrees over South Boston.
These brief procedural statements form the basis of the verbal instructions and flight clearances that are passed from controller to pilot to achieve reduced noise in the communities surrounding Logan Airport while also maintaining the safe and efficient flow of aircraft in and out of the Airport. However, consistency with which these procedures are used varies due to air traffic demands, controller workloads, weather conditions, and other operational factors, as noted in the Flight Track Monitoring Program Study.
Figure H-14 presents the gates used in the analysis for the Flight Track Monitoring Report. These gates are virtual vertical planes, which are used in the analysis to capture the aircraft flight paths. The gates are defined using a geographic coordinate for each end of the gate along with a floor and a ceiling altitude. The gates also capture direction of flights (in or out). The edges of each gate in Figure H-14 point in the direction that the aircraft is coming from. This information is used to evaluate the performance of the flight procedures off each runway end and is presented below. Figure H-14 also displays the BOS location, which is used for the distance measurements for the conventional procedures.
The RNAV procedures are still captured by the original flight track monitoring gates. Traffic crossing over the North Shore passes through the Marblehead Gate and traffic passing over the South Shore passes through the Hull 2, Hull 3, and Cohasset Gates. Turbojets departing Runway 27 on the RNAV pass through the Runway 27 gates and the new Runway 33L RNAV flight tracks still pass between the Somerville and Everett gates as expected.
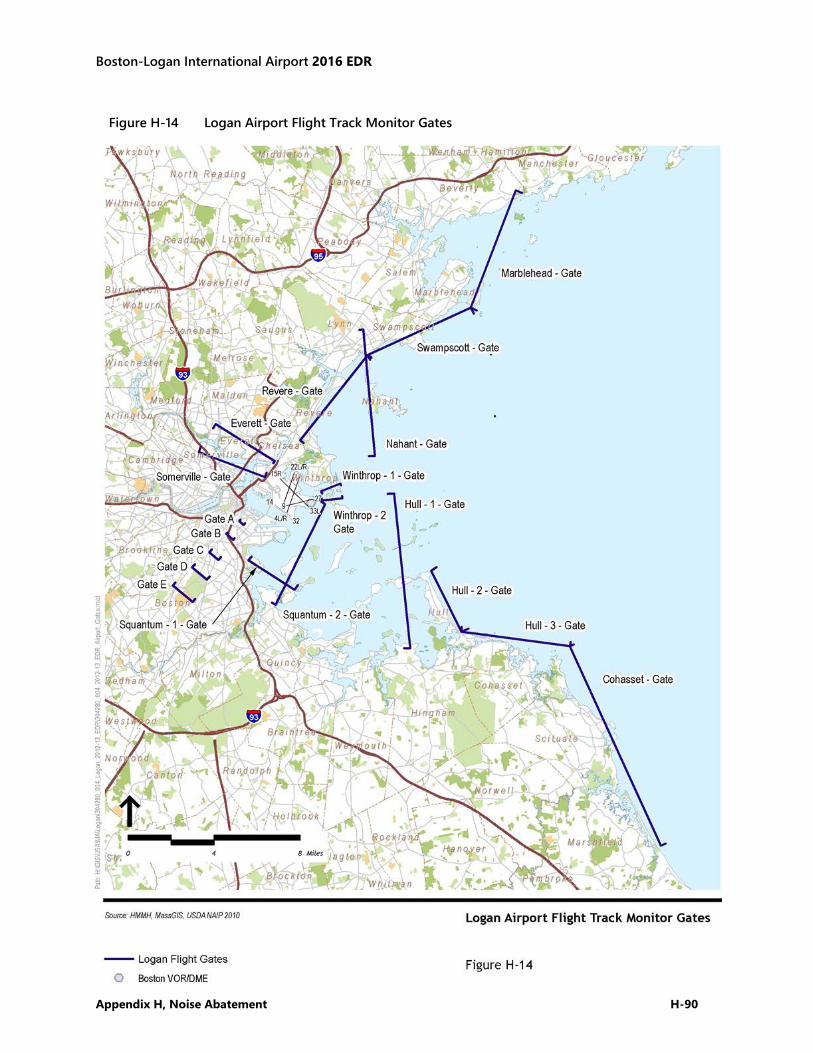
Boston-Logan International Airport 2016 EDR
Appendix H, Noise Abatement H-90
Figure H-14 Logan Airport Flight Track Monitor Gates
Boston-Logan International Airport 2016 EDR
Appendix H, Noise Abatement H-91
Statistical Analyses of Flight Tracks - Runway 4R
The Nahant Gate (Figure H-14) monitors aircraft after the first turn at 4 DME. The Swampscott and Marblehead Gates monitor northbound shoreline crossings, while the Hull 2, Hull 3, and Cohasset Gates monitor southbound shoreline crossings.
Tables H-15a and H-15b show that Runway 4R departures for 2016 were concentrated, with 99.5 percent “over the Causeway,” and about 0.1 percent over the south end of the gate compared to 99.2 percent over the Causeway in 2015 and 0.3 percent over the south end of the gate. Departures through the north end of the gate remained the same at 0.5 percent in 2015 and 2016.
Table H-15a Runway 4R Nahant Gate Summary for 2015
Number of Tracks Through Gate Segment
Total Number of Tracks Through Gate
Percentage of Tracks Through Gate Segment
North End of Gate 35 6,851 0.5% Over Causeway 6,797 6,851 99.2% South End of Gate 19 6,851 0.3% Total 6,851 6,851 100.0%
Source: Massport, HMMH 2016.
Table H-15b Runway 4R Nahant Gate Summary for 2016
Number of Tracks Through Gate Segment
Total Number of Tracks Through Gate
Percentage of Tracks Through Gate Segment
North End of Gate 31 6,850 0.5% Over Causeway 6,814 6,850 99.5% South End of Gate 5 6,850 0.1% Total 6,850 6,850 100.0%
Source: Massport, HMMH 2017.
Table H-16a and H-16b show how many of the shoreline crossings from Runway 4R were above 6,000 feet. For 2016, 98.3 percent of the flights were above 6,000 feet compared to 97.2 percent in 2015. The Swampscott gate had 97.9 percent of flights above 6,000 feet in 2016 compared to 23.3 percent in 2015. The number of flights through the Swampscott gate increased in 2015 (116 in 2015, up to 234 in 2016). The crossing percentage for this gate is historically lower than most gates due to its proximity to the Nahant gate itself. As seen in Figure H-14, the Swampscott gate is adjacent to the Nahant gate and aircraft would have to climb very quickly to be above 6,000 feet when crossing the Swampscott gate.
Boston-Logan International Airport 2016 EDR
Appendix H, Noise Abatement H-92
Table H-16a Runway 4R Shoreline Crossings Above 6,000 Feet for 2015
Number of Tracks Through Gate
Number Above 6,000 ft
Percentage Above 6,000 ft
Swampscott Gate 116 27 23.3% Marblehead Gate 2,770 2,735 98.7% Hull 2 Gate 345 345 100.0% Hull 3 Gate 1,034 1,033 99.9% Cohasset Gate 196 196 100.0% Total 4,461 4,336 97.2%
Source: Massport, HMMH 2016.
Table H-16b Runway 4R Shoreline Crossings Above 6,000 Feet for 2016
Number of Tracks Through Gate
Number Above 6,000 ft
Percentage Above 6,000 ft
Swampscott Gate 234 229 97.9% Marblehead Gate 2,532 2,531 100.0% Hull 2 Gate 82 18 22.0% Hull 3 Gate 386 354 91.7% Cohasset Gate 3032 3030 99.9% Total 6,266 6,162 98.3%
Source: Massport, HMMH 2017.
Statistical Analyses of Flight Tracks - Runway 9
The Winthrop 1 and Winthrop 2 gates (Figure H-14) monitor early turns for departures off Runway 9. The Revere, Swampscott, or Marblehead gates monitor northbound shoreline crossings, while the Hull 2, Hull 3, or Cohasset gates monitor southbound shoreline crossings.
Tables H-17a and H-17b show how many tracks turned prior to the BOS 2 DME. Northbound turns before BOS 2 DME pass through the Winthrop 1 Gate. Southbound traffic would pass through the Winthrop 2 Gate. In 2016, between both gates there were a total of 52 such turns, 0.1 percent. In 2015, 44 tracks or 0.1 percent of the total also crossed these gates.
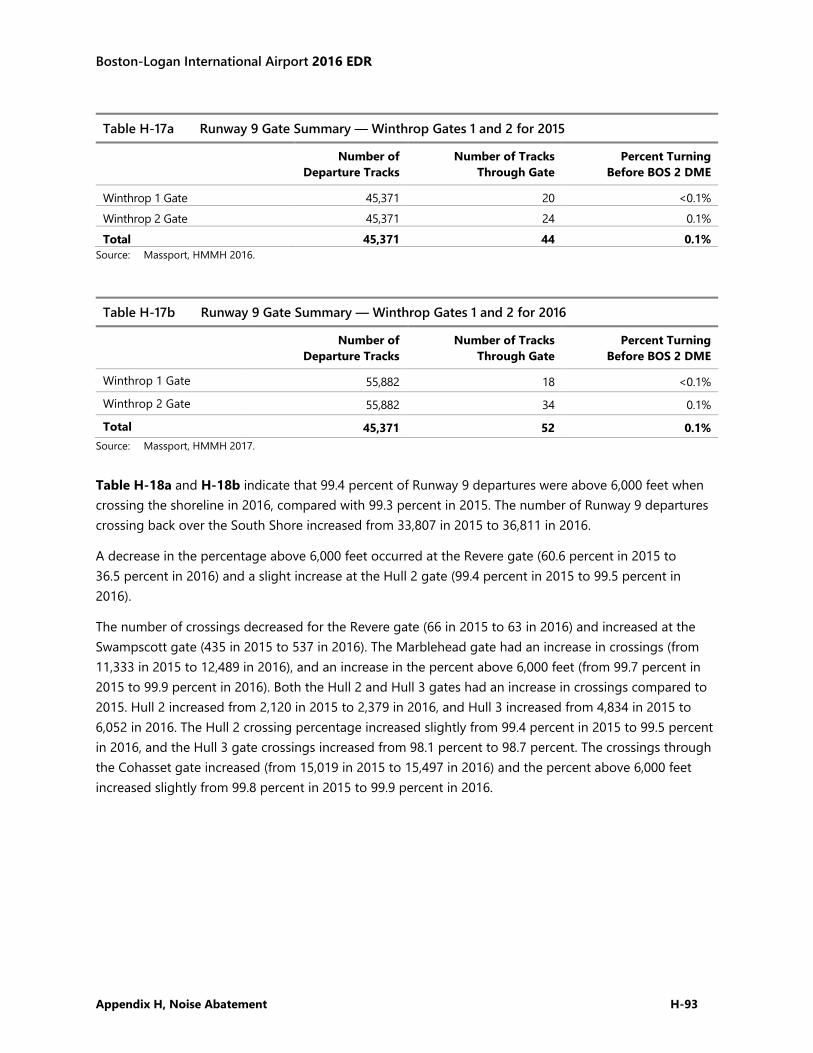
Boston-Logan International Airport 2016 EDR
Appendix H, Noise Abatement H-93
Table H-17a Runway 9 Gate Summary — Winthrop Gates 1 and 2 for 2015
Number of Departure Tracks
Number of Tracks Through Gate
Percent Turning Before BOS 2 DME
Winthrop 1 Gate 45,371 20 <0.1% Winthrop 2 Gate 45,371 24 0.1% Total 45,371 44 0.1%
Source: Massport, HMMH 2016.
Table H-17b Runway 9 Gate Summary — Winthrop Gates 1 and 2 for 2016
Number of Departure Tracks
Number of Tracks Through Gate
Percent Turning Before BOS 2 DME
Winthrop 1 Gate 55,882 18 <0.1%
Winthrop 2 Gate 55,882 34 0.1%
Total 45,371 52 0.1% Source: Massport, HMMH 2017.
Table H-18a and H-18b indicate that 99.4 percent of Runway 9 departures were above 6,000 feet when crossing the shoreline in 2016, compared with 99.3 percent in 2015. The number of Runway 9 departures crossing back over the South Shore increased from 33,807 in 2015 to 36,811 in 2016.
A decrease in the percentage above 6,000 feet occurred at the Revere gate (60.6 percent in 2015 to 36.5 percent in 2016) and a slight increase at the Hull 2 gate (99.4 percent in 2015 to 99.5 percent in 2016).
The number of crossings decreased for the Revere gate (66 in 2015 to 63 in 2016) and increased at the Swampscott gate (435 in 2015 to 537 in 2016). The Marblehead gate had an increase in crossings (from 11,333 in 2015 to 12,489 in 2016), and an increase in the percent above 6,000 feet (from 99.7 percent in 2015 to 99.9 percent in 2016). Both the Hull 2 and Hull 3 gates had an increase in crossings compared to 2015. Hull 2 increased from 2,120 in 2015 to 2,379 in 2016, and Hull 3 increased from 4,834 in 2015 to 6,052 in 2016. The Hull 2 crossing percentage increased slightly from 99.4 percent in 2015 to 99.5 percent in 2016, and the Hull 3 gate crossings increased from 98.1 percent to 98.7 percent. The crossings through the Cohasset gate increased (from 15,019 in 2015 to 15,497 in 2016) and the percent above 6,000 feet increased slightly from 99.8 percent in 2015 to 99.9 percent in 2016.
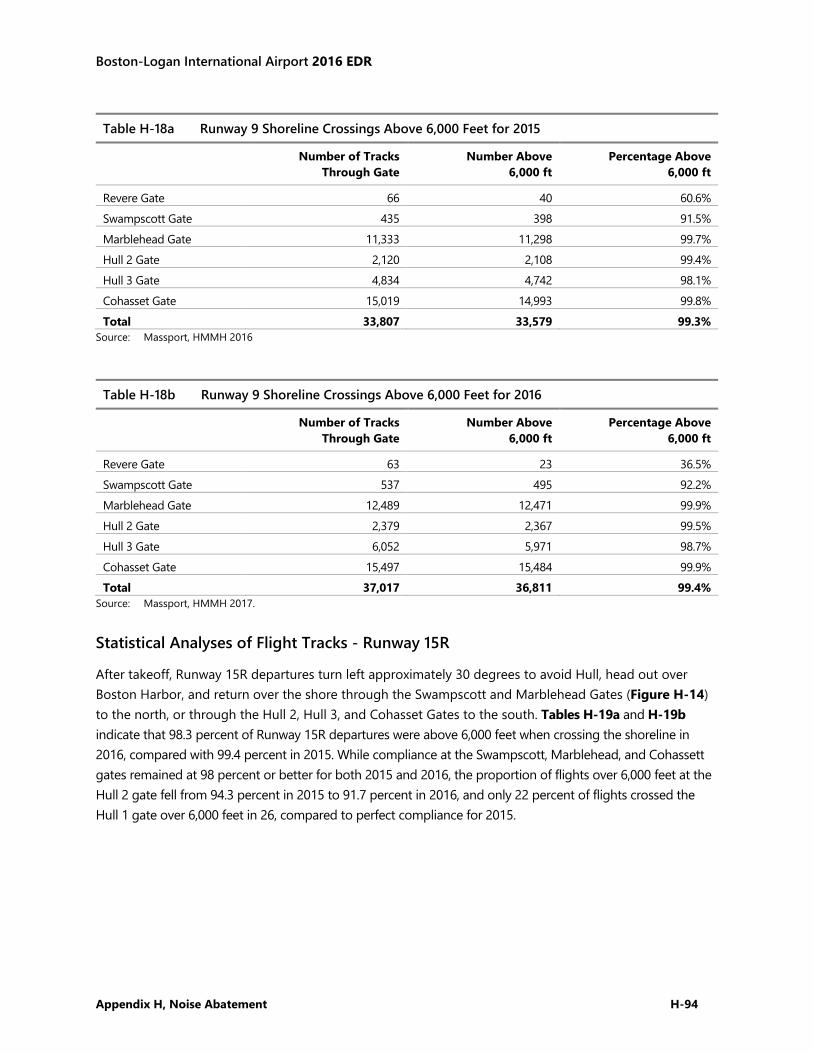
Boston-Logan International Airport 2016 EDR
Appendix H, Noise Abatement H-94
Table H-18a Runway 9 Shoreline Crossings Above 6,000 Feet for 2015
Number of Tracks Through Gate
Number Above 6,000 ft
Percentage Above 6,000 ft
Revere Gate 66 40 60.6% Swampscott Gate 435 398 91.5% Marblehead Gate 11,333 11,298 99.7% Hull 2 Gate 2,120 2,108 99.4% Hull 3 Gate 4,834 4,742 98.1% Cohasset Gate 15,019 14,993 99.8% Total 33,807 33,579 99.3%
Source: Massport, HMMH 2016
Table H-18b Runway 9 Shoreline Crossings Above 6,000 Feet for 2016
Number of Tracks Through Gate
Number Above 6,000 ft
Percentage Above 6,000 ft
Revere Gate 63 23 36.5% Swampscott Gate 537 495 92.2% Marblehead Gate 12,489 12,471 99.9% Hull 2 Gate 2,379 2,367 99.5% Hull 3 Gate 6,052 5,971 98.7% Cohasset Gate 15,497 15,484 99.9% Total 37,017 36,811 99.4%
Source: Massport, HMMH 2017.
Statistical Analyses of Flight Tracks - Runway 15R
After takeoff, Runway 15R departures turn left approximately 30 degrees to avoid Hull, head out over Boston Harbor, and return over the shore through the Swampscott and Marblehead Gates (Figure H-14) to the north, or through the Hull 2, Hull 3, and Cohasset Gates to the south. Tables H-19a and H-19b indicate that 98.3 percent of Runway 15R departures were above 6,000 feet when crossing the shoreline in 2016, compared with 99.4 percent in 2015. While compliance at the Swampscott, Marblehead, and Cohassett gates remained at 98 percent or better for both 2015 and 2016, the proportion of flights over 6,000 feet at the Hull 2 gate fell from 94.3 percent in 2015 to 91.7 percent in 2016, and only 22 percent of flights crossed the Hull 1 gate over 6,000 feet in 26, compared to perfect compliance for 2015.
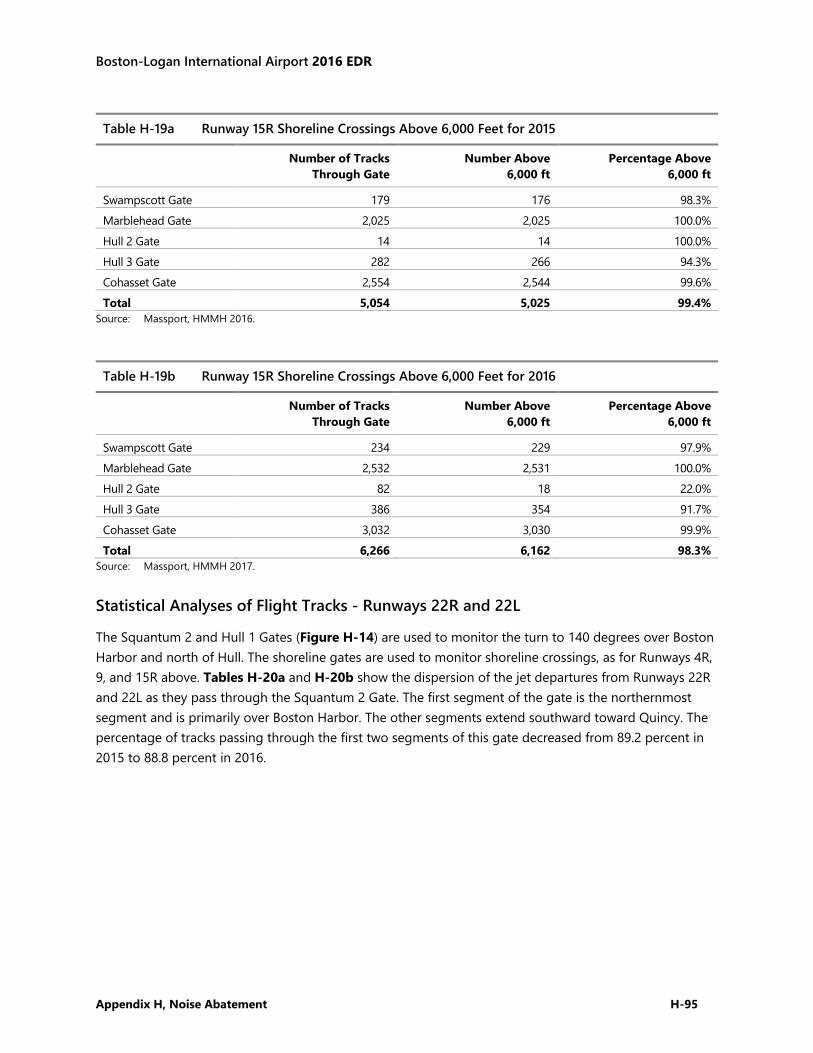
Boston-Logan International Airport 2016 EDR
Appendix H, Noise Abatement H-95
Table H-19a Runway 15R Shoreline Crossings Above 6,000 Feet for 2015
Number of Tracks Through Gate
Number Above 6,000 ft
Percentage Above 6,000 ft
Swampscott Gate 179 176 98.3% Marblehead Gate 2,025 2,025 100.0% Hull 2 Gate 14 14 100.0% Hull 3 Gate 282 266 94.3% Cohasset Gate 2,554 2,544 99.6% Total 5,054 5,025 99.4%
Source: Massport, HMMH 2016.
Table H-19b Runway 15R Shoreline Crossings Above 6,000 Feet for 2016
Number of Tracks Through Gate
Number Above 6,000 ft
Percentage Above 6,000 ft
Swampscott Gate 234 229 97.9% Marblehead Gate 2,532 2,531 100.0% Hull 2 Gate 82 18 22.0% Hull 3 Gate 386 354 91.7% Cohasset Gate 3,032 3,030 99.9% Total 6,266 6,162 98.3%
Source: Massport, HMMH 2017.
Statistical Analyses of Flight Tracks - Runways 22R and 22L
The Squantum 2 and Hull 1 Gates (Figure H-14) are used to monitor the turn to 140 degrees over Boston Harbor and north of Hull. The shoreline gates are used to monitor shoreline crossings, as for Runways 4R, 9, and 15R above. Tables H-20a and H-20b show the dispersion of the jet departures from Runways 22R and 22L as they pass through the Squantum 2 Gate. The first segment of the gate is the northernmost segment and is primarily over Boston Harbor. The other segments extend southward toward Quincy. The percentage of tracks passing through the first two segments of this gate decreased from 89.2 percent in 2015 to 88.8 percent in 2016.
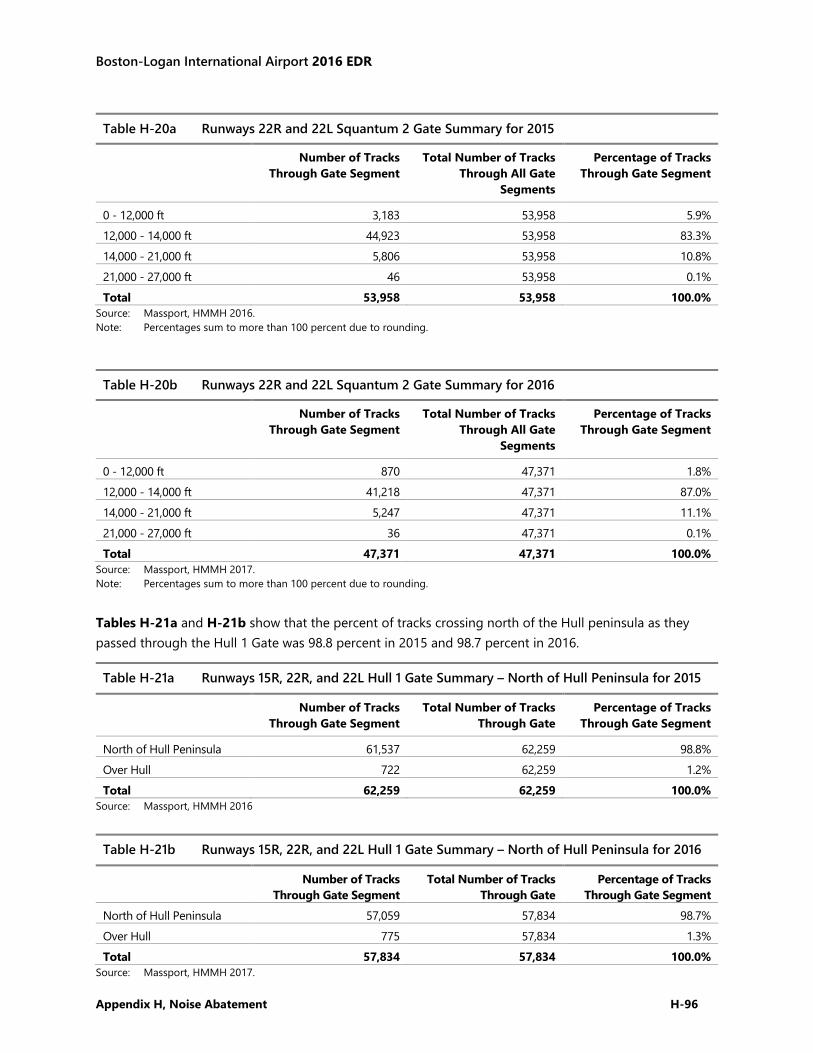
Boston-Logan International Airport 2016 EDR
Appendix H, Noise Abatement H-96
Table H-20a Runways 22R and 22L Squantum 2 Gate Summary for 2015
Number of Tracks Through Gate Segment
Total Number of Tracks Through All Gate
Segments
Percentage of Tracks Through Gate Segment
0 - 12,000 ft 3,183 53,958 5.9% 12,000 - 14,000 ft 44,923 53,958 83.3% 14,000 - 21,000 ft 5,806 53,958 10.8% 21,000 - 27,000 ft 46 53,958 0.1% Total 53,958 53,958 100.0%
Source: Massport, HMMH 2016. Note: Percentages sum to more than 100 percent due to rounding.
Table H-20b Runways 22R and 22L Squantum 2 Gate Summary for 2016
Number of Tracks Through Gate Segment
Total Number of Tracks Through All Gate
Segments
Percentage of Tracks Through Gate Segment
0 - 12,000 ft 870 47,371 1.8% 12,000 - 14,000 ft 41,218 47,371 87.0% 14,000 - 21,000 ft 5,247 47,371 11.1% 21,000 - 27,000 ft 36 47,371 0.1% Total 47,371 47,371 100.0%
Source: Massport, HMMH 2017. Note: Percentages sum to more than 100 percent due to rounding.
Tables H-21a and H-21b show that the percent of tracks crossing north of the Hull peninsula as they passed through the Hull 1 Gate was 98.8 percent in 2015 and 98.7 percent in 2016.
Table H-21a Runways 15R, 22R, and 22L Hull 1 Gate Summary – North of Hull Peninsula for 2015
Number of Tracks Through Gate Segment
Total Number of Tracks Through Gate
Percentage of Tracks Through Gate Segment
North of Hull Peninsula 61,537 62,259 98.8% Over Hull 722 62,259 1.2% Total 62,259 62,259 100.0%
Source: Massport, HMMH 2016
Table H-21b Runways 15R, 22R, and 22L Hull 1 Gate Summary – North of Hull Peninsula for 2016
Number of Tracks Through Gate Segment
Total Number of Tracks Through Gate
Percentage of Tracks Through Gate Segment
North of Hull Peninsula 57,059 57,834 98.7% Over Hull 775 57,834 1.3% Total 57,834 57,834 100.0%
Source: Massport, HMMH 2017.
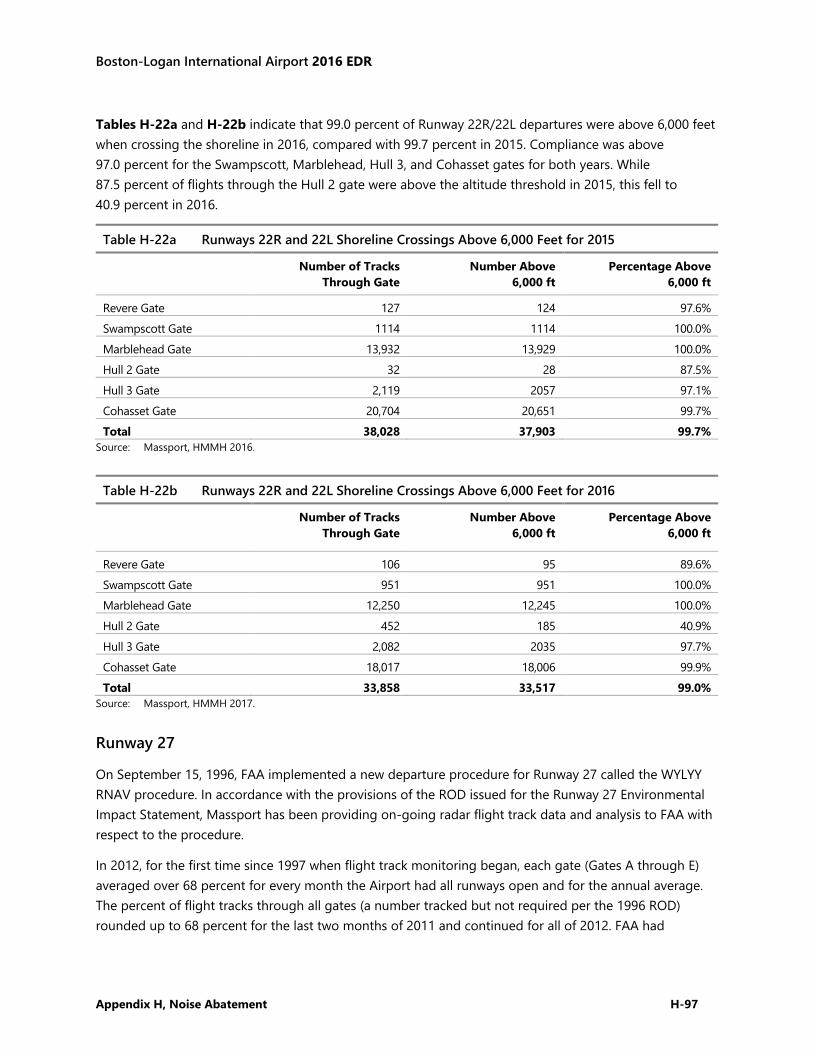
Boston-Logan International Airport 2016 EDR
Appendix H, Noise Abatement H-97
Tables H-22a and H-22b indicate that 99.0 percent of Runway 22R/22L departures were above 6,000 feet when crossing the shoreline in 2016, compared with 99.7 percent in 2015. Compliance was above 97.0 percent for the Swampscott, Marblehead, Hull 3, and Cohasset gates for both years. While 87.5 percent of flights through the Hull 2 gate were above the altitude threshold in 2015, this fell to 40.9 percent in 2016.
Table H-22a Runways 22R and 22L Shoreline Crossings Above 6,000 Feet for 2015
Number of Tracks Through Gate
Number Above 6,000 ft
Percentage Above 6,000 ft
Revere Gate 127 124 97.6% Swampscott Gate 1114 1114 100.0% Marblehead Gate 13,932 13,929 100.0% Hull 2 Gate 32 28 87.5% Hull 3 Gate 2,119 2057 97.1% Cohasset Gate 20,704 20,651 99.7% Total 38,028 37,903 99.7%
Source: Massport, HMMH 2016.
Table H-22b Runways 22R and 22L Shoreline Crossings Above 6,000 Feet for 2016
Number of Tracks Through Gate
Number Above 6,000 ft
Percentage Above 6,000 ft
Revere Gate 106 95 89.6% Swampscott Gate 951 951 100.0% Marblehead Gate 12,250 12,245 100.0% Hull 2 Gate 452 185 40.9% Hull 3 Gate 2,082 2035 97.7% Cohasset Gate 18,017 18,006 99.9% Total 33,858 33,517 99.0%
Source: Massport, HMMH 2017.
Runway 27
On September 15, 1996, FAA implemented a new departure procedure for Runway 27 called the WYLYY RNAV procedure. In accordance with the provisions of the ROD issued for the Runway 27 Environmental Impact Statement, Massport has been providing on-going radar flight track data and analysis to FAA with respect to the procedure.
In 2012, for the first time since 1997 when flight track monitoring began, each gate (Gates A through E) averaged over 68 percent for every month the Airport had all runways open and for the annual average. The percent of flight tracks through all gates (a number tracked but not required per the 1996 ROD) rounded up to 68 percent for the last two months of 2011 and continued for all of 2012. FAA had
Boston-Logan International Airport 2016 EDR
Appendix H, Noise Abatement H-98
discussed these data internally and concluded that acceptable flight track dispersion had been achieved and that no subsequent action by FAA is required per the 1996 ROD requirements.20
Massport will continue to provide Tables H-23a and H-23b in the subsequent annual reports. Table H-23a presents the conformance results for the Runway 27 corridor for 2015 and Table H-23b for 2016. The average percentage of tracks through the corridor was 83.7 percent for 2015 and 80.6 percent for 2016.
Each gate is further from the runway and falls along the procedure. The gates also increase in width as the distance is increased along the flight path and they form a noise abatement corridor. A consistent percentage of traffic through each gate means that flights are not entering the corridor late or exiting the corridor too early. The average percent through each gate was 95.1 percent in 2015 and 95.0 percent for 2016.
Table H-23a Runway 27 Corridor Percent of Tracks Through Each Gate for 2015
Month Total # of
Tracks
Total # of Tracks
Through All Gates
Percent of
Tracks Through All Gates
Average Percent
Through Each Gate
Gate A Gate B Gate C Gate D Gate E
1,4001 2,2001 2,9001 4,7001 6,3001
January 2,586 2,118 81.9% 2,212 2,435 2,524 2,560 2,538 94.9% February 3,142 2604 82.9% 2,725 2,944 3,059 3,111 3,076 94.9% March 2,706 2,207 81.6% 2,314 2,547 2,633 2,675 2,642 94.7% April 1,245 1,059 85.1% 1,100 1,189 1,222 1,235 1,224 95.9% May 685 539 78.7% 581 647 649 657 640 92.7% June 772 642 83.2% 681 727 747 760 753 95.0% July 1005 837 83.3% 868 954 975 995 989 95.1% August 996 861 86.4% 891 940 968 984 980 95.6% September 855 721 84.3% 742 809 834 846 840 95.2% October 1,821 1569 86.2% 1,604 1,736 1,794 1,806 1,793 95.9% November 1,868 1,612 86.3% 1,650 1,789 1,826 1,848 1,831 95.8% December 1,634 1,379 84.4% 1,410 1,563 1,603 1,611 1,592 95.2% Average 1,610 1,346 83.7% 1,398 1,523 1,570 1,591 1,575 95.1%
Source: Massport, HMMH 2016. Notes: Gray shading indicates the percentage rounds up to 68 percent or greater. 1 Width of each gate in feet.
–––––––––––––––– 20 Logan Airport Runway 27 Advisory Committee Meeting - January 23, 2012 meeting minutes
Boston-Logan International Airport 2016 EDR
Appendix H, Noise Abatement H-99
Table H-23b Runway 27 Corridor Percent of Tracks Through Each Gate for 2016
Month Total # of
Tracks
Total # of
Tracks Through All Gates
Percent of
Tracks Through All Gates
Average Percent
Through Each Gate
Gate A Gate B Gate C Gate D Gate E
1,4001 2,2001 2,9001 4,7001 6,3001
January 2,345 1,790 76.3% 1,849 2,256 2,297 2,313 2,299 93.9% February 1,968 1560 79.3% 1,618 1,908 1,930 1,950 1,930 94.9% March 1,895 1,509 79.6% 1,569 1,821 1,851 1,856 1,857 94.5% April 1,148 936 81.5% 972 1,115 1,130 1,127 1,106 94.9% May 988 809 81.9% 828 944 959 968 969 94.5% June 1358 1048 77.2% 1,085 1,311 1,332 1,370 1,378 95.4% July 1823 1510 82.8% 1,565 1,746 1,782 1,795 1,793 95.2% August 837 703 84.0% 721 810 825 829 840 96.2% September 737 614 83.3% 630 708 720 733 742 95.9% October 2,285 1808 79.1% 1,860 2,204 2,239 2,246 2,252 94.5% November 2,703 2,169 80.2% 2,226 2,609 2,645 2,674 2,670 94.9% December 2,926 2,380 81.3% 2,448 2,808 2,862 2,897 2,886 95.0% Average 1,751 1,403 80.6% 1,448 1,687 1,714 1,730 1,727 95.0%
Source: Massport, HMMH 2017. Notes: Gray shading indicates the percentage rounds up to 68 percent or greater. 1 Width of each gate in feet.
Statistical Analyses of Flight Tracks — Runway 33L
The Somerville and Everett Gates (Figure H-14) extend from BOS 2 DME to BOS 5 DME and are used to monitor the departure procedure for Runway 33L. Turns to the left prior to the BOS 5 DME would pass through the Somerville Gate. Turns to the right prior to the BOS 5 DME would pass through the Everett Gate.
Tables H-24a and H-24b indicate the percentage of tracks turning before BOS 5 DME decreases from 1.7 percent in 2015 to 1.5 percent in 2016. The total number of tracks increased from 24,203 in 2015 to 29,854 in 2016.
Table H-24a Runway 33L Gates — Passages Below 3,000 Feet for 2015
Number of Departure Tracks
Number of Tracks Turning
Before BOS 5 DME
Percentage of Tracks Turning
Before BOS 5 DME
Everett Gate 24,203 205 0.8% Somerville Gate 24,203 197 0.8% Total 24,203 402 1.7%
Source: Massport, HMMH 2016.
Boston-Logan International Airport 2016 EDR
Appendix H, Noise Abatement H-100
Table H-24b Runway 33L Gates — Passages Below 3,000 Feet for 2016
Number of Departure Tracks
Number of Tracks Turning
Before BOS 5 DME
Percentage of Tracks Turning
Before BOS 5 DME
Everett Gate 29,854 222 0.7% Somerville Gate 29,854 230 0.8% Total 29,854 452 1.5%
Source: Massport, HMMH 2017.
Table H-25 provides the level of traffic off each runway end in 2015 and 2016. These percentages represent the amount of activity experienced off each runway end for a given year.
Table H-25 Runway Usage by Runway End
2015 2016
By Runway End Operations(s) Total Flights
% of Total Total Flights
% of Total
04L R4L A + R22R D 74,695 20.0% 64,921 16.6%
04R R4R A + R22L D 52,664 14.1% 60,630 15.5%
09 R9 A + R27 D 20,892 5.6% 22,719 5.8%
14 N/A 0 0.0% 15 0.0%
15L R15L A + R33R D 123 0.0% 78 0.0%
15R R15R A + R33L D 31,388 8.4% 36,667 9.4%
22L R22L A + R4R D 55,164 14.8% 56,495 14.5%
22R R22R A + R4L D 6,312 1.7% 6,132 1.6%
27 R27 A + R9 D 88,683 23.8% 95,522 24.5%
32 R32 A + R14 D 4,066 1.1% 5,760 1.5%
33L R33L A + R15R D 37,667 10.1% 39,619 10.1%
33R R33R A + R15L D 1,275 0.3% 1,782 0.5%
All 372,930 100.0% 390,339 100.0% Notes: A=Arrivals 1 D=Departures
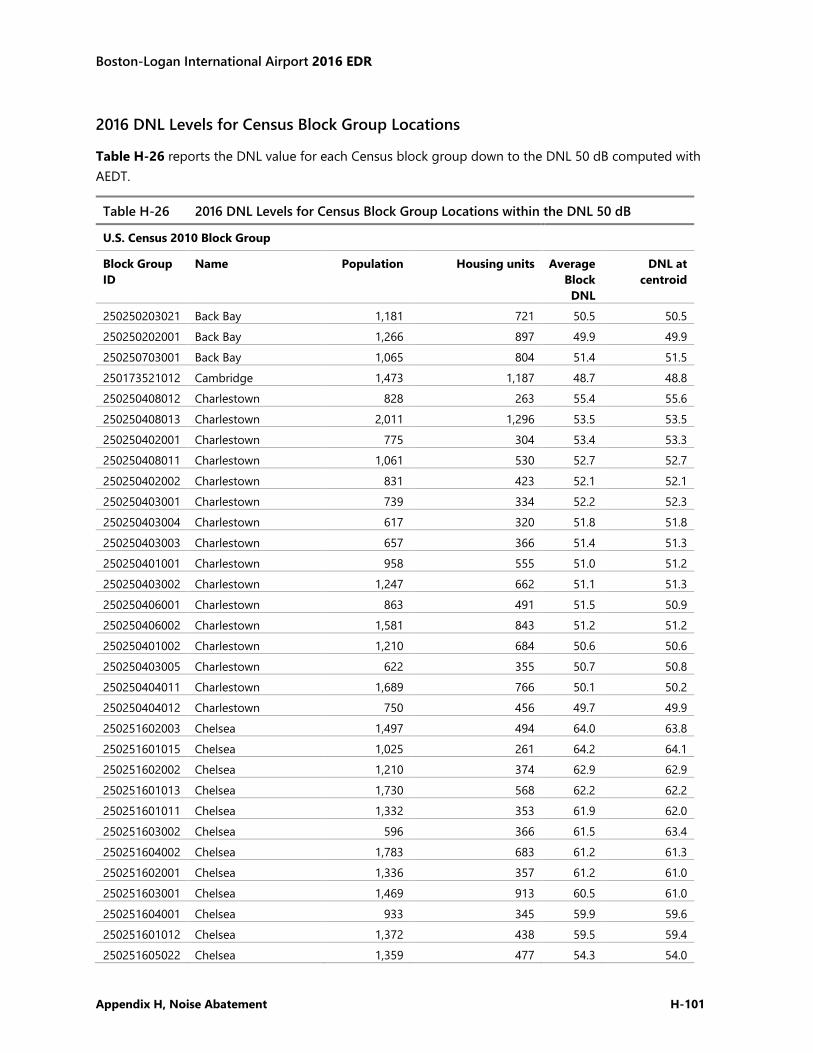
Boston-Logan International Airport 2016 EDR
Appendix H, Noise Abatement H-101
2016 DNL Levels for Census Block Group Locations
Table H-26 reports the DNL value for each Census block group down to the DNL 50 dB computed with AEDT.
Table H-26 2016 DNL Levels for Census Block Group Locations within the DNL 50 dB
U.S. Census 2010 Block Group
Block Group ID
Name Population Housing units Average Block DNL
DNL at centroid
250250203021 Back Bay 1,181 721 50.5 50.5 250250202001 Back Bay 1,266 897 49.9 49.9 250250703001 Back Bay 1,065 804 51.4 51.5 250173521012 Cambridge 1,473 1,187 48.7 48.8 250250408012 Charlestown 828 263 55.4 55.6 250250408013 Charlestown 2,011 1,296 53.5 53.5 250250402001 Charlestown 775 304 53.4 53.3 250250408011 Charlestown 1,061 530 52.7 52.7 250250402002 Charlestown 831 423 52.1 52.1 250250403001 Charlestown 739 334 52.2 52.3 250250403004 Charlestown 617 320 51.8 51.8 250250403003 Charlestown 657 366 51.4 51.3 250250401001 Charlestown 958 555 51.0 51.2 250250403002 Charlestown 1,247 662 51.1 51.3 250250406001 Charlestown 863 491 51.5 50.9 250250406002 Charlestown 1,581 843 51.2 51.2 250250401002 Charlestown 1,210 684 50.6 50.6 250250403005 Charlestown 622 355 50.7 50.8 250250404011 Charlestown 1,689 766 50.1 50.2 250250404012 Charlestown 750 456 49.7 49.9 250251602003 Chelsea 1,497 494 64.0 63.8 250251601015 Chelsea 1,025 261 64.2 64.1 250251602002 Chelsea 1,210 374 62.9 62.9 250251601013 Chelsea 1,730 568 62.2 62.2 250251601011 Chelsea 1,332 353 61.9 62.0 250251603002 Chelsea 596 366 61.5 63.4 250251604002 Chelsea 1,783 683 61.2 61.3 250251602001 Chelsea 1,336 357 61.2 61.0 250251603001 Chelsea 1,469 913 60.5 61.0 250251604001 Chelsea 933 345 59.9 59.6 250251601012 Chelsea 1,372 438 59.5 59.4 250251605022 Chelsea 1,359 477 54.3 54.0
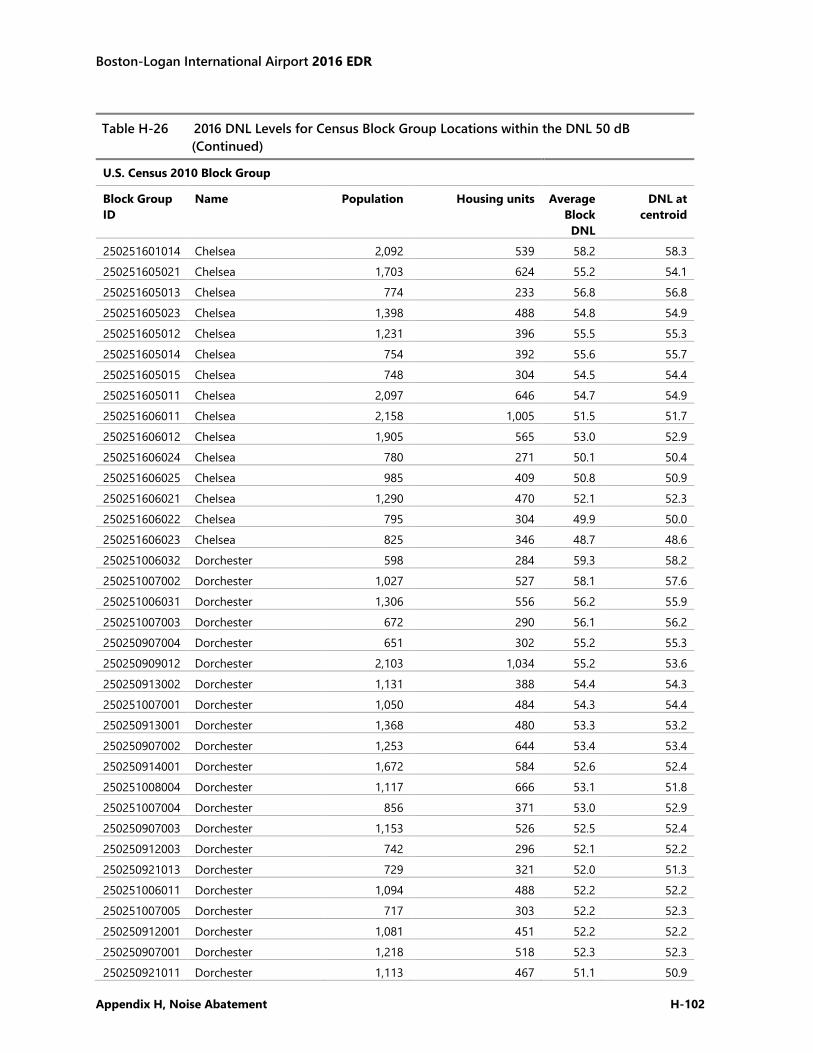
Boston-Logan International Airport 2016 EDR
Appendix H, Noise Abatement H-102
Table H-26 2016 DNL Levels for Census Block Group Locations within the DNL 50 dB (Continued)
U.S. Census 2010 Block Group
Block Group ID
Name Population Housing units Average Block DNL
DNL at centroid
250251601014 Chelsea 2,092 539 58.2 58.3 250251605021 Chelsea 1,703 624 55.2 54.1 250251605013 Chelsea 774 233 56.8 56.8 250251605023 Chelsea 1,398 488 54.8 54.9 250251605012 Chelsea 1,231 396 55.5 55.3 250251605014 Chelsea 754 392 55.6 55.7 250251605015 Chelsea 748 304 54.5 54.4 250251605011 Chelsea 2,097 646 54.7 54.9 250251606011 Chelsea 2,158 1,005 51.5 51.7 250251606012 Chelsea 1,905 565 53.0 52.9 250251606024 Chelsea 780 271 50.1 50.4 250251606025 Chelsea 985 409 50.8 50.9 250251606021 Chelsea 1,290 470 52.1 52.3 250251606022 Chelsea 795 304 49.9 50.0 250251606023 Chelsea 825 346 48.7 48.6 250251006032 Dorchester 598 284 59.3 58.2 250251007002 Dorchester 1,027 527 58.1 57.6 250251006031 Dorchester 1,306 556 56.2 55.9 250251007003 Dorchester 672 290 56.1 56.2 250250907004 Dorchester 651 302 55.2 55.3 250250909012 Dorchester 2,103 1,034 55.2 53.6 250250913002 Dorchester 1,131 388 54.4 54.3 250251007001 Dorchester 1,050 484 54.3 54.4 250250913001 Dorchester 1,368 480 53.3 53.2 250250907002 Dorchester 1,253 644 53.4 53.4 250250914001 Dorchester 1,672 584 52.6 52.4 250251008004 Dorchester 1,117 666 53.1 51.8 250251007004 Dorchester 856 371 53.0 52.9 250250907003 Dorchester 1,153 526 52.5 52.4 250250912003 Dorchester 742 296 52.1 52.2 250250921013 Dorchester 729 321 52.0 51.3 250251006011 Dorchester 1,094 488 52.2 52.2 250251007005 Dorchester 717 303 52.2 52.3 250250912001 Dorchester 1,081 451 52.2 52.2 250250907001 Dorchester 1,218 518 52.3 52.3 250250921011 Dorchester 1,113 467 51.1 50.9
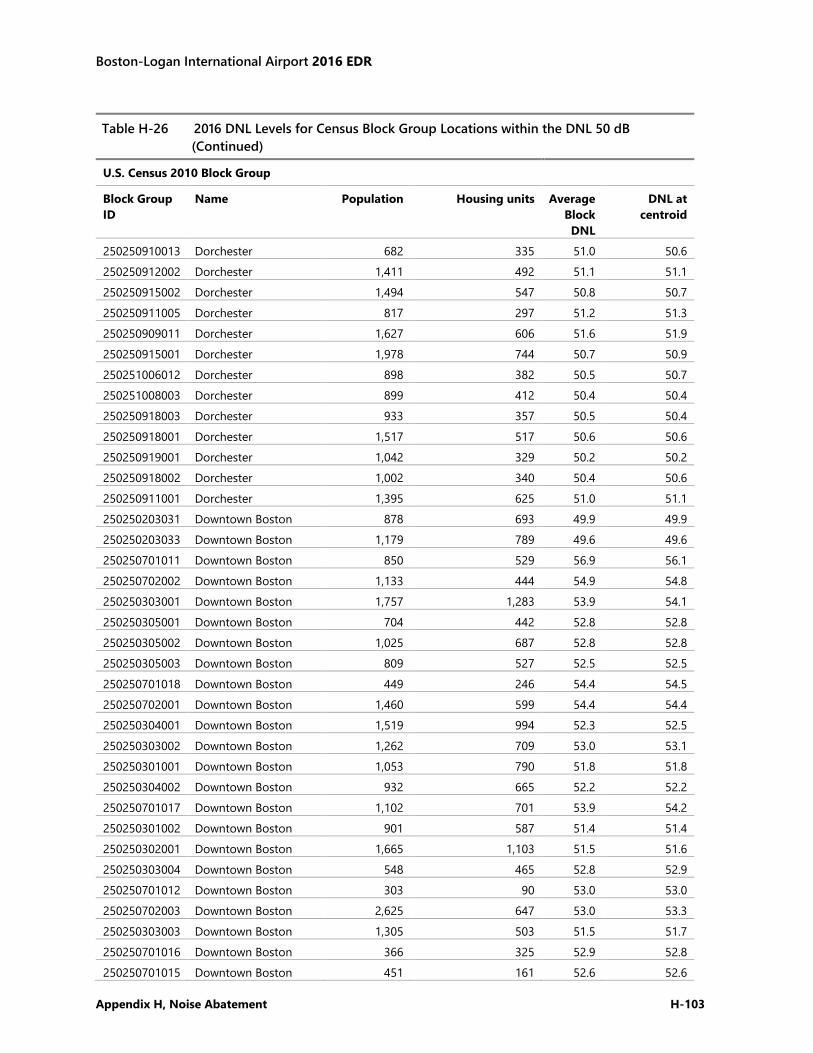
Boston-Logan International Airport 2016 EDR
Appendix H, Noise Abatement H-103
Table H-26 2016 DNL Levels for Census Block Group Locations within the DNL 50 dB (Continued)
U.S. Census 2010 Block Group
Block Group ID
Name Population Housing units Average Block DNL
DNL at centroid
250250910013 Dorchester 682 335 51.0 50.6 250250912002 Dorchester 1,411 492 51.1 51.1 250250915002 Dorchester 1,494 547 50.8 50.7 250250911005 Dorchester 817 297 51.2 51.3 250250909011 Dorchester 1,627 606 51.6 51.9 250250915001 Dorchester 1,978 744 50.7 50.9 250251006012 Dorchester 898 382 50.5 50.7 250251008003 Dorchester 899 412 50.4 50.4 250250918003 Dorchester 933 357 50.5 50.4 250250918001 Dorchester 1,517 517 50.6 50.6 250250919001 Dorchester 1,042 329 50.2 50.2 250250918002 Dorchester 1,002 340 50.4 50.6 250250911001 Dorchester 1,395 625 51.0 51.1 250250203031 Downtown Boston 878 693 49.9 49.9 250250203033 Downtown Boston 1,179 789 49.6 49.6 250250701011 Downtown Boston 850 529 56.9 56.1 250250702002 Downtown Boston 1,133 444 54.9 54.8 250250303001 Downtown Boston 1,757 1,283 53.9 54.1 250250305001 Downtown Boston 704 442 52.8 52.8 250250305002 Downtown Boston 1,025 687 52.8 52.8 250250305003 Downtown Boston 809 527 52.5 52.5 250250701018 Downtown Boston 449 246 54.4 54.5 250250702001 Downtown Boston 1,460 599 54.4 54.4 250250304001 Downtown Boston 1,519 994 52.3 52.5 250250303002 Downtown Boston 1,262 709 53.0 53.1 250250301001 Downtown Boston 1,053 790 51.8 51.8 250250304002 Downtown Boston 932 665 52.2 52.2 250250701017 Downtown Boston 1,102 701 53.9 54.2 250250301002 Downtown Boston 901 587 51.4 51.4 250250302001 Downtown Boston 1,665 1,103 51.5 51.6 250250303004 Downtown Boston 548 465 52.8 52.9 250250701012 Downtown Boston 303 90 53.0 53.0 250250702003 Downtown Boston 2,625 647 53.0 53.3 250250303003 Downtown Boston 1,305 503 51.5 51.7 250250701016 Downtown Boston 366 325 52.9 52.8 250250701015 Downtown Boston 451 161 52.6 52.6
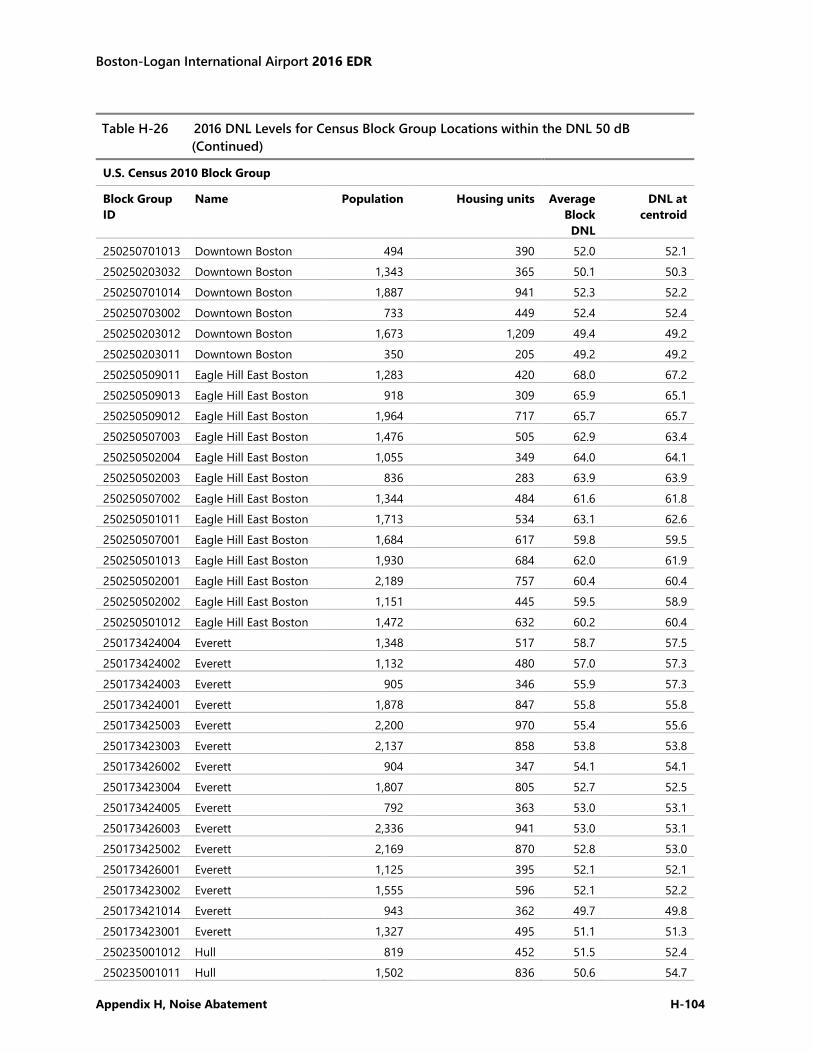
Boston-Logan International Airport 2016 EDR
Appendix H, Noise Abatement H-104
Table H-26 2016 DNL Levels for Census Block Group Locations within the DNL 50 dB (Continued)
U.S. Census 2010 Block Group
Block Group ID
Name Population Housing units Average Block DNL
DNL at centroid
250250701013 Downtown Boston 494 390 52.0 52.1 250250203032 Downtown Boston 1,343 365 50.1 50.3 250250701014 Downtown Boston 1,887 941 52.3 52.2 250250703002 Downtown Boston 733 449 52.4 52.4 250250203012 Downtown Boston 1,673 1,209 49.4 49.2 250250203011 Downtown Boston 350 205 49.2 49.2 250250509011 Eagle Hill East Boston 1,283 420 68.0 67.2 250250509013 Eagle Hill East Boston 918 309 65.9 65.1 250250509012 Eagle Hill East Boston 1,964 717 65.7 65.7 250250507003 Eagle Hill East Boston 1,476 505 62.9 63.4 250250502004 Eagle Hill East Boston 1,055 349 64.0 64.1 250250502003 Eagle Hill East Boston 836 283 63.9 63.9 250250507002 Eagle Hill East Boston 1,344 484 61.6 61.8 250250501011 Eagle Hill East Boston 1,713 534 63.1 62.6 250250507001 Eagle Hill East Boston 1,684 617 59.8 59.5 250250501013 Eagle Hill East Boston 1,930 684 62.0 61.9 250250502001 Eagle Hill East Boston 2,189 757 60.4 60.4 250250502002 Eagle Hill East Boston 1,151 445 59.5 58.9 250250501012 Eagle Hill East Boston 1,472 632 60.2 60.4 250173424004 Everett 1,348 517 58.7 57.5 250173424002 Everett 1,132 480 57.0 57.3 250173424003 Everett 905 346 55.9 57.3 250173424001 Everett 1,878 847 55.8 55.8 250173425003 Everett 2,200 970 55.4 55.6 250173423003 Everett 2,137 858 53.8 53.8 250173426002 Everett 904 347 54.1 54.1 250173423004 Everett 1,807 805 52.7 52.5 250173424005 Everett 792 363 53.0 53.1 250173426003 Everett 2,336 941 53.0 53.1 250173425002 Everett 2,169 870 52.8 53.0 250173426001 Everett 1,125 395 52.1 52.1 250173423002 Everett 1,555 596 52.1 52.2 250173421014 Everett 943 362 49.7 49.8 250173423001 Everett 1,327 495 51.1 51.3 250235001012 Hull 819 452 51.5 52.4 250235001011 Hull 1,502 836 50.6 54.7
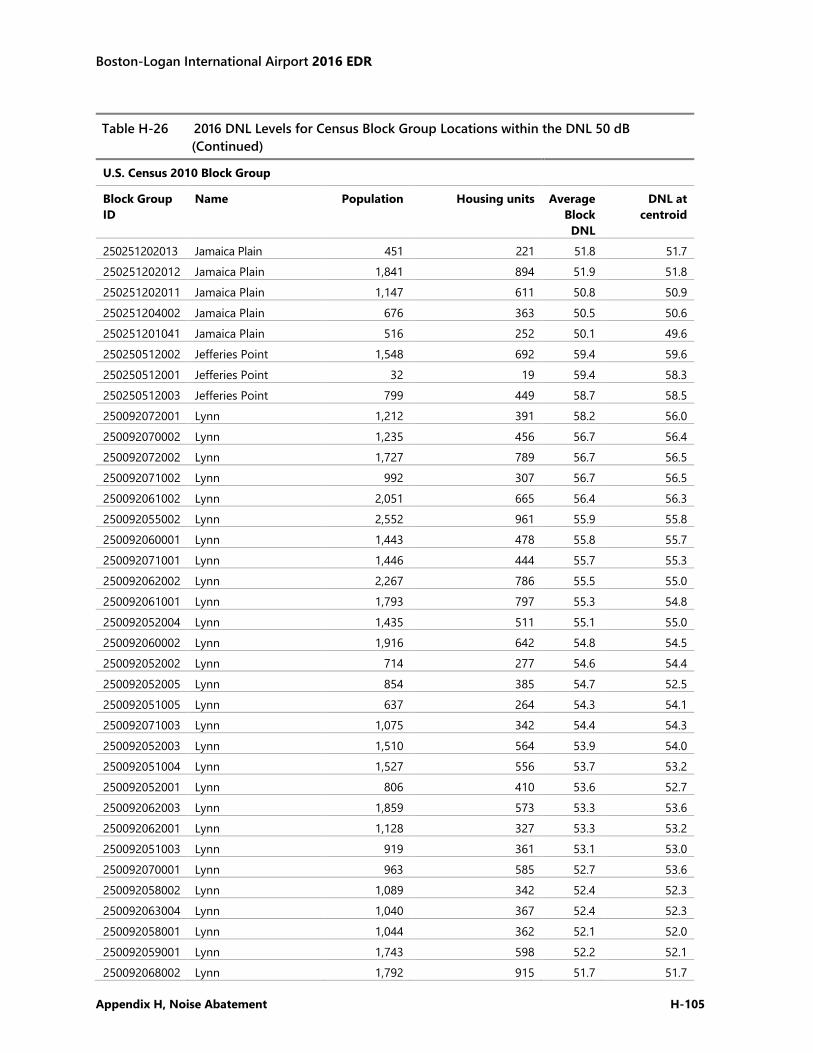
Boston-Logan International Airport 2016 EDR
Appendix H, Noise Abatement H-105
Table H-26 2016 DNL Levels for Census Block Group Locations within the DNL 50 dB (Continued)
U.S. Census 2010 Block Group
Block Group ID
Name Population Housing units Average Block DNL
DNL at centroid
250251202013 Jamaica Plain 451 221 51.8 51.7 250251202012 Jamaica Plain 1,841 894 51.9 51.8 250251202011 Jamaica Plain 1,147 611 50.8 50.9 250251204002 Jamaica Plain 676 363 50.5 50.6 250251201041 Jamaica Plain 516 252 50.1 49.6 250250512002 Jefferies Point 1,548 692 59.4 59.6 250250512001 Jefferies Point 32 19 59.4 58.3 250250512003 Jefferies Point 799 449 58.7 58.5 250092072001 Lynn 1,212 391 58.2 56.0 250092070002 Lynn 1,235 456 56.7 56.4 250092072002 Lynn 1,727 789 56.7 56.5 250092071002 Lynn 992 307 56.7 56.5 250092061002 Lynn 2,051 665 56.4 56.3 250092055002 Lynn 2,552 961 55.9 55.8 250092060001 Lynn 1,443 478 55.8 55.7 250092071001 Lynn 1,446 444 55.7 55.3 250092062002 Lynn 2,267 786 55.5 55.0 250092061001 Lynn 1,793 797 55.3 54.8 250092052004 Lynn 1,435 511 55.1 55.0 250092060002 Lynn 1,916 642 54.8 54.5 250092052002 Lynn 714 277 54.6 54.4 250092052005 Lynn 854 385 54.7 52.5 250092051005 Lynn 637 264 54.3 54.1 250092071003 Lynn 1,075 342 54.4 54.3 250092052003 Lynn 1,510 564 53.9 54.0 250092051004 Lynn 1,527 556 53.7 53.2 250092052001 Lynn 806 410 53.6 52.7 250092062003 Lynn 1,859 573 53.3 53.6 250092062001 Lynn 1,128 327 53.3 53.2 250092051003 Lynn 919 361 53.1 53.0 250092070001 Lynn 963 585 52.7 53.6 250092058002 Lynn 1,089 342 52.4 52.3 250092063004 Lynn 1,040 367 52.4 52.3 250092058001 Lynn 1,044 362 52.1 52.0 250092059001 Lynn 1,743 598 52.2 52.1 250092068002 Lynn 1,792 915 51.7 51.7
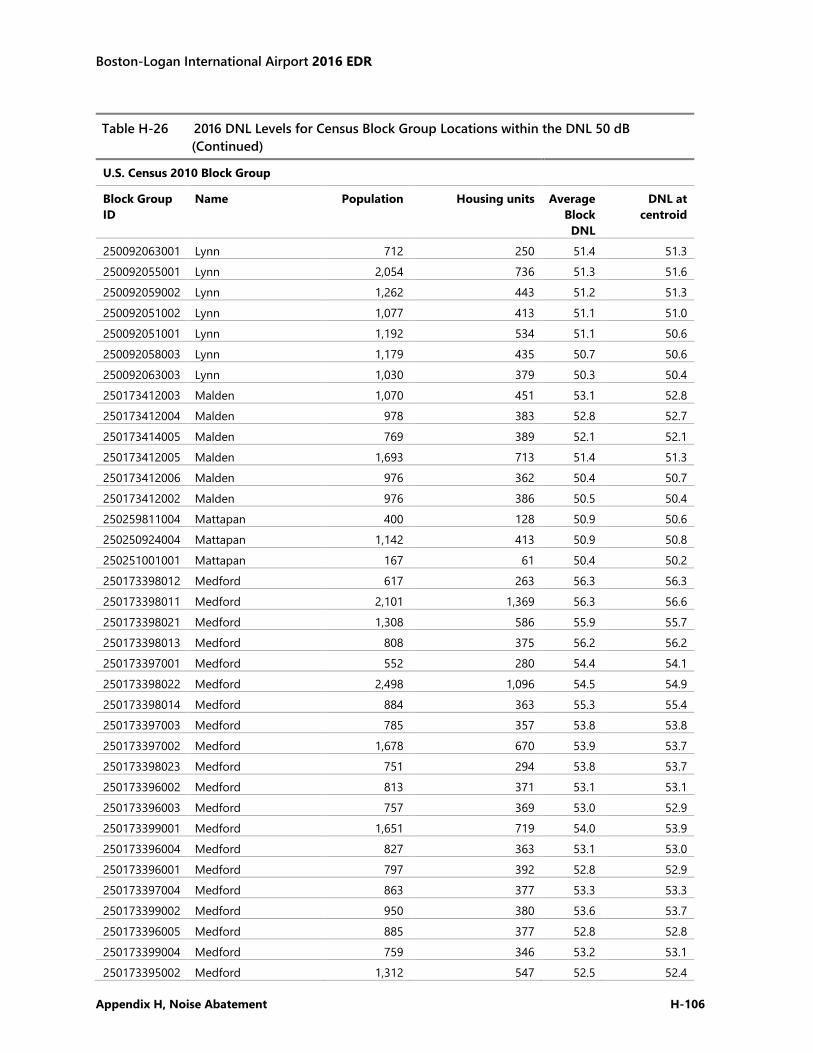
Boston-Logan International Airport 2016 EDR
Appendix H, Noise Abatement H-106
Table H-26 2016 DNL Levels for Census Block Group Locations within the DNL 50 dB (Continued)
U.S. Census 2010 Block Group
Block Group ID
Name Population Housing units Average Block DNL
DNL at centroid
250092063001 Lynn 712 250 51.4 51.3 250092055001 Lynn 2,054 736 51.3 51.6 250092059002 Lynn 1,262 443 51.2 51.3 250092051002 Lynn 1,077 413 51.1 51.0 250092051001 Lynn 1,192 534 51.1 50.6 250092058003 Lynn 1,179 435 50.7 50.6 250092063003 Lynn 1,030 379 50.3 50.4 250173412003 Malden 1,070 451 53.1 52.8 250173412004 Malden 978 383 52.8 52.7 250173414005 Malden 769 389 52.1 52.1 250173412005 Malden 1,693 713 51.4 51.3 250173412006 Malden 976 362 50.4 50.7 250173412002 Malden 976 386 50.5 50.4 250259811004 Mattapan 400 128 50.9 50.6 250250924004 Mattapan 1,142 413 50.9 50.8 250251001001 Mattapan 167 61 50.4 50.2 250173398012 Medford 617 263 56.3 56.3 250173398011 Medford 2,101 1,369 56.3 56.6 250173398021 Medford 1,308 586 55.9 55.7 250173398013 Medford 808 375 56.2 56.2 250173397001 Medford 552 280 54.4 54.1 250173398022 Medford 2,498 1,096 54.5 54.9 250173398014 Medford 884 363 55.3 55.4 250173397003 Medford 785 357 53.8 53.8 250173397002 Medford 1,678 670 53.9 53.7 250173398023 Medford 751 294 53.8 53.7 250173396002 Medford 813 371 53.1 53.1 250173396003 Medford 757 369 53.0 52.9 250173399001 Medford 1,651 719 54.0 53.9 250173396004 Medford 827 363 53.1 53.0 250173396001 Medford 797 392 52.8 52.9 250173397004 Medford 863 377 53.3 53.3 250173399002 Medford 950 380 53.6 53.7 250173396005 Medford 885 377 52.8 52.8 250173399004 Medford 759 346 53.2 53.1 250173395002 Medford 1,312 547 52.5 52.4
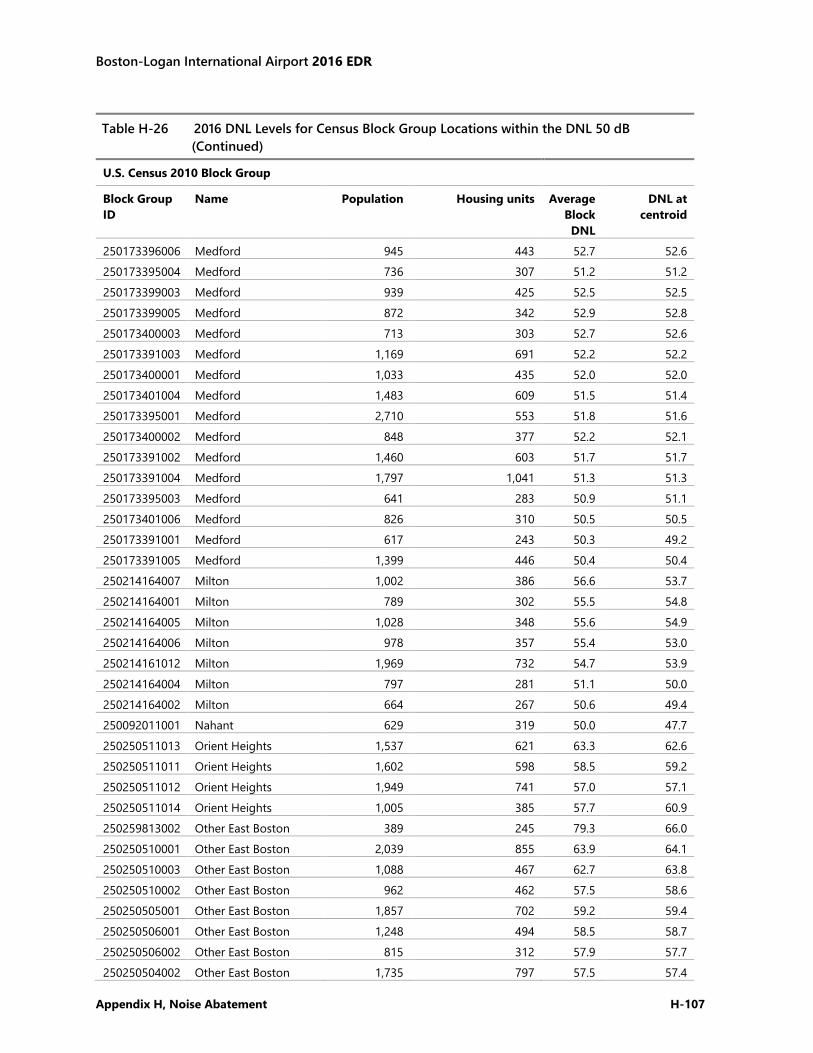
Boston-Logan International Airport 2016 EDR
Appendix H, Noise Abatement H-107
Table H-26 2016 DNL Levels for Census Block Group Locations within the DNL 50 dB (Continued)
U.S. Census 2010 Block Group
Block Group ID
Name Population Housing units Average Block DNL
DNL at centroid
250173396006 Medford 945 443 52.7 52.6 250173395004 Medford 736 307 51.2 51.2 250173399003 Medford 939 425 52.5 52.5 250173399005 Medford 872 342 52.9 52.8 250173400003 Medford 713 303 52.7 52.6 250173391003 Medford 1,169 691 52.2 52.2 250173400001 Medford 1,033 435 52.0 52.0 250173401004 Medford 1,483 609 51.5 51.4 250173395001 Medford 2,710 553 51.8 51.6 250173400002 Medford 848 377 52.2 52.1 250173391002 Medford 1,460 603 51.7 51.7 250173391004 Medford 1,797 1,041 51.3 51.3 250173395003 Medford 641 283 50.9 51.1 250173401006 Medford 826 310 50.5 50.5 250173391001 Medford 617 243 50.3 49.2 250173391005 Medford 1,399 446 50.4 50.4 250214164007 Milton 1,002 386 56.6 53.7 250214164001 Milton 789 302 55.5 54.8 250214164005 Milton 1,028 348 55.6 54.9 250214164006 Milton 978 357 55.4 53.0 250214161012 Milton 1,969 732 54.7 53.9 250214164004 Milton 797 281 51.1 50.0 250214164002 Milton 664 267 50.6 49.4 250092011001 Nahant 629 319 50.0 47.7 250250511013 Orient Heights 1,537 621 63.3 62.6 250250511011 Orient Heights 1,602 598 58.5 59.2 250250511012 Orient Heights 1,949 741 57.0 57.1 250250511014 Orient Heights 1,005 385 57.7 60.9 250259813002 Other East Boston 389 245 79.3 66.0 250250510001 Other East Boston 2,039 855 63.9 64.1 250250510003 Other East Boston 1,088 467 62.7 63.8 250250510002 Other East Boston 962 462 57.5 58.6 250250505001 Other East Boston 1,857 702 59.2 59.4 250250506001 Other East Boston 1,248 494 58.5 58.7 250250506002 Other East Boston 815 312 57.9 57.7 250250504002 Other East Boston 1,735 797 57.5 57.4
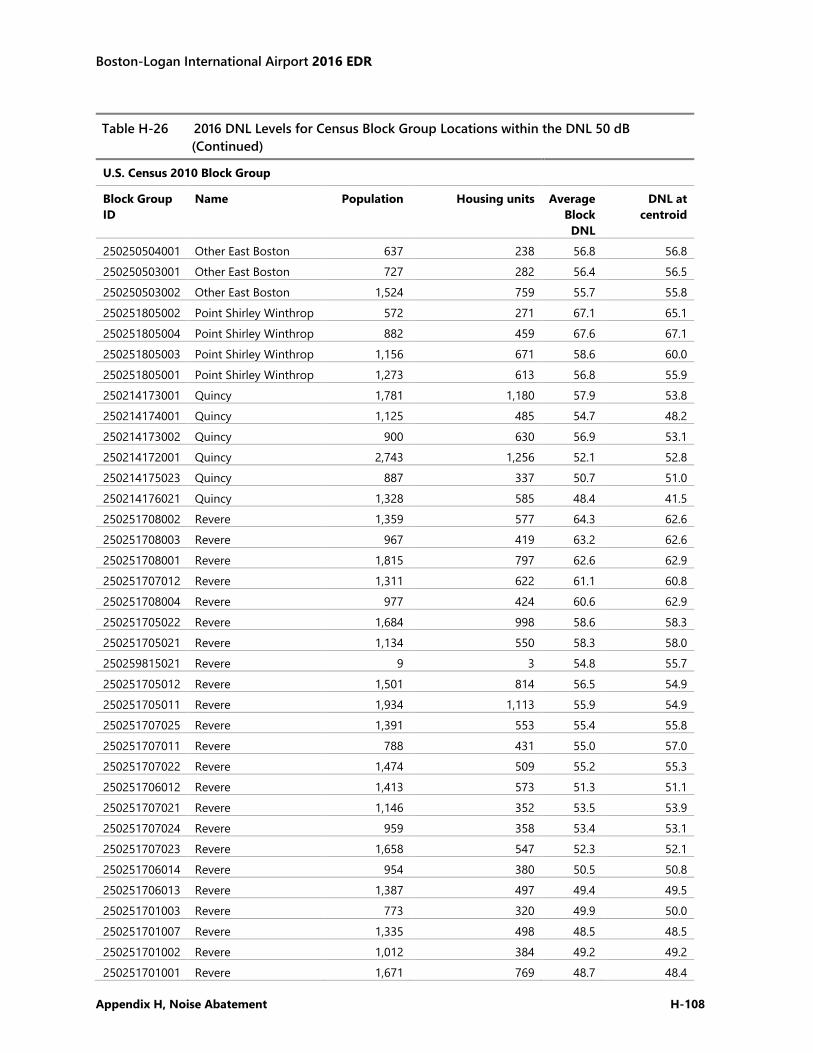
Boston-Logan International Airport 2016 EDR
Appendix H, Noise Abatement H-108
Table H-26 2016 DNL Levels for Census Block Group Locations within the DNL 50 dB (Continued)
U.S. Census 2010 Block Group
Block Group ID
Name Population Housing units Average Block DNL
DNL at centroid
250250504001 Other East Boston 637 238 56.8 56.8 250250503001 Other East Boston 727 282 56.4 56.5 250250503002 Other East Boston 1,524 759 55.7 55.8 250251805002 Point Shirley Winthrop 572 271 67.1 65.1 250251805004 Point Shirley Winthrop 882 459 67.6 67.1 250251805003 Point Shirley Winthrop 1,156 671 58.6 60.0 250251805001 Point Shirley Winthrop 1,273 613 56.8 55.9 250214173001 Quincy 1,781 1,180 57.9 53.8 250214174001 Quincy 1,125 485 54.7 48.2 250214173002 Quincy 900 630 56.9 53.1 250214172001 Quincy 2,743 1,256 52.1 52.8 250214175023 Quincy 887 337 50.7 51.0 250214176021 Quincy 1,328 585 48.4 41.5 250251708002 Revere 1,359 577 64.3 62.6 250251708003 Revere 967 419 63.2 62.6 250251708001 Revere 1,815 797 62.6 62.9 250251707012 Revere 1,311 622 61.1 60.8 250251708004 Revere 977 424 60.6 62.9 250251705022 Revere 1,684 998 58.6 58.3 250251705021 Revere 1,134 550 58.3 58.0 250259815021 Revere 9 3 54.8 55.7 250251705012 Revere 1,501 814 56.5 54.9 250251705011 Revere 1,934 1,113 55.9 54.9 250251707025 Revere 1,391 553 55.4 55.8 250251707011 Revere 788 431 55.0 57.0 250251707022 Revere 1,474 509 55.2 55.3 250251706012 Revere 1,413 573 51.3 51.1 250251707021 Revere 1,146 352 53.5 53.9 250251707024 Revere 959 358 53.4 53.1 250251707023 Revere 1,658 547 52.3 52.1 250251706014 Revere 954 380 50.5 50.8 250251706013 Revere 1,387 497 49.4 49.5 250251701003 Revere 773 320 49.9 50.0 250251701007 Revere 1,335 498 48.5 48.5 250251701002 Revere 1,012 384 49.2 49.2 250251701001 Revere 1,671 769 48.7 48.4
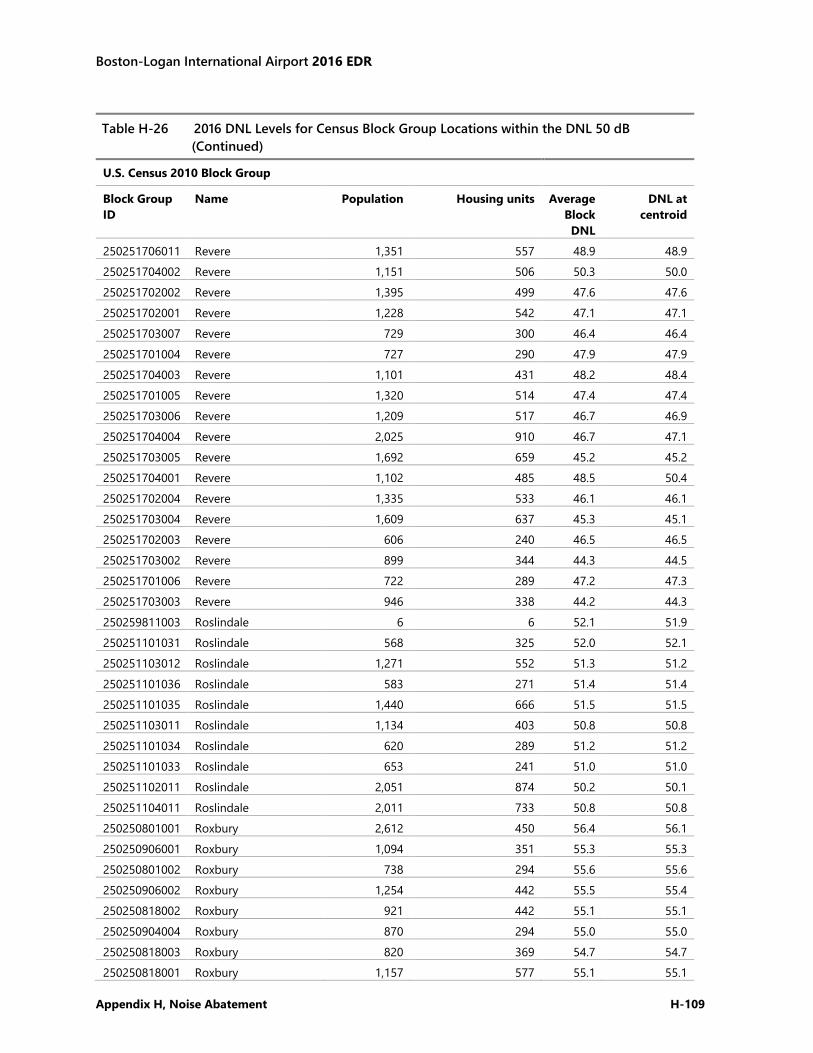
Boston-Logan International Airport 2016 EDR
Appendix H, Noise Abatement H-109
Table H-26 2016 DNL Levels for Census Block Group Locations within the DNL 50 dB (Continued)
U.S. Census 2010 Block Group
Block Group ID
Name Population Housing units Average Block DNL
DNL at centroid
250251706011 Revere 1,351 557 48.9 48.9 250251704002 Revere 1,151 506 50.3 50.0 250251702002 Revere 1,395 499 47.6 47.6 250251702001 Revere 1,228 542 47.1 47.1 250251703007 Revere 729 300 46.4 46.4 250251701004 Revere 727 290 47.9 47.9 250251704003 Revere 1,101 431 48.2 48.4 250251701005 Revere 1,320 514 47.4 47.4 250251703006 Revere 1,209 517 46.7 46.9 250251704004 Revere 2,025 910 46.7 47.1 250251703005 Revere 1,692 659 45.2 45.2 250251704001 Revere 1,102 485 48.5 50.4 250251702004 Revere 1,335 533 46.1 46.1 250251703004 Revere 1,609 637 45.3 45.1 250251702003 Revere 606 240 46.5 46.5 250251703002 Revere 899 344 44.3 44.5 250251701006 Revere 722 289 47.2 47.3 250251703003 Revere 946 338 44.2 44.3 250259811003 Roslindale 6 6 52.1 51.9 250251101031 Roslindale 568 325 52.0 52.1 250251103012 Roslindale 1,271 552 51.3 51.2 250251101036 Roslindale 583 271 51.4 51.4 250251101035 Roslindale 1,440 666 51.5 51.5 250251103011 Roslindale 1,134 403 50.8 50.8 250251101034 Roslindale 620 289 51.2 51.2 250251101033 Roslindale 653 241 51.0 51.0 250251102011 Roslindale 2,051 874 50.2 50.1 250251104011 Roslindale 2,011 733 50.8 50.8 250250801001 Roxbury 2,612 450 56.4 56.1 250250906001 Roxbury 1,094 351 55.3 55.3 250250801002 Roxbury 738 294 55.6 55.6 250250906002 Roxbury 1,254 442 55.5 55.4 250250818002 Roxbury 921 442 55.1 55.1 250250904004 Roxbury 870 294 55.0 55.0 250250818003 Roxbury 820 369 54.7 54.7 250250818001 Roxbury 1,157 577 55.1 55.1
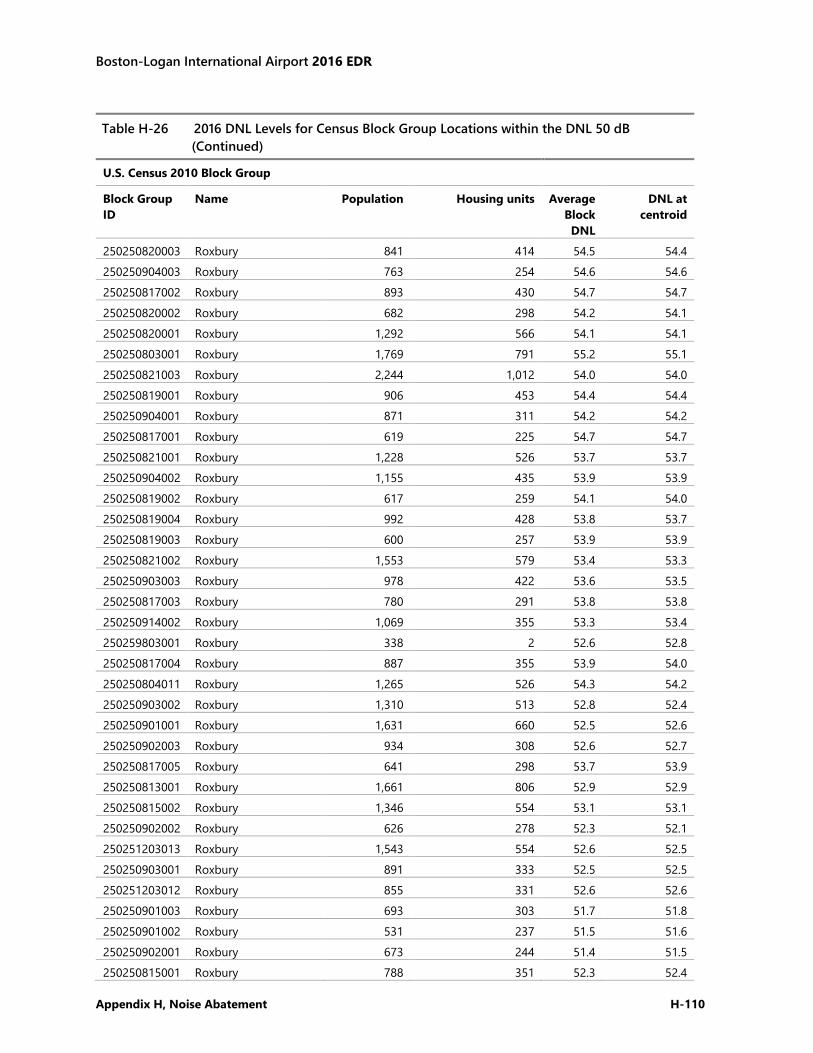
Boston-Logan International Airport 2016 EDR
Appendix H, Noise Abatement H-110
Table H-26 2016 DNL Levels for Census Block Group Locations within the DNL 50 dB (Continued)
U.S. Census 2010 Block Group
Block Group ID
Name Population Housing units Average Block DNL
DNL at centroid
250250820003 Roxbury 841 414 54.5 54.4 250250904003 Roxbury 763 254 54.6 54.6 250250817002 Roxbury 893 430 54.7 54.7 250250820002 Roxbury 682 298 54.2 54.1 250250820001 Roxbury 1,292 566 54.1 54.1 250250803001 Roxbury 1,769 791 55.2 55.1 250250821003 Roxbury 2,244 1,012 54.0 54.0 250250819001 Roxbury 906 453 54.4 54.4 250250904001 Roxbury 871 311 54.2 54.2 250250817001 Roxbury 619 225 54.7 54.7 250250821001 Roxbury 1,228 526 53.7 53.7 250250904002 Roxbury 1,155 435 53.9 53.9 250250819002 Roxbury 617 259 54.1 54.0 250250819004 Roxbury 992 428 53.8 53.7 250250819003 Roxbury 600 257 53.9 53.9 250250821002 Roxbury 1,553 579 53.4 53.3 250250903003 Roxbury 978 422 53.6 53.5 250250817003 Roxbury 780 291 53.8 53.8 250250914002 Roxbury 1,069 355 53.3 53.4 250259803001 Roxbury 338 2 52.6 52.8 250250817004 Roxbury 887 355 53.9 54.0 250250804011 Roxbury 1,265 526 54.3 54.2 250250903002 Roxbury 1,310 513 52.8 52.4 250250901001 Roxbury 1,631 660 52.5 52.6 250250902003 Roxbury 934 308 52.6 52.7 250250817005 Roxbury 641 298 53.7 53.9 250250813001 Roxbury 1,661 806 52.9 52.9 250250815002 Roxbury 1,346 554 53.1 53.1 250250902002 Roxbury 626 278 52.3 52.1 250251203013 Roxbury 1,543 554 52.6 52.5 250250903001 Roxbury 891 333 52.5 52.5 250251203012 Roxbury 855 331 52.6 52.6 250250901003 Roxbury 693 303 51.7 51.8 250250901002 Roxbury 531 237 51.5 51.6 250250902001 Roxbury 673 244 51.4 51.5 250250815001 Roxbury 788 351 52.3 52.4
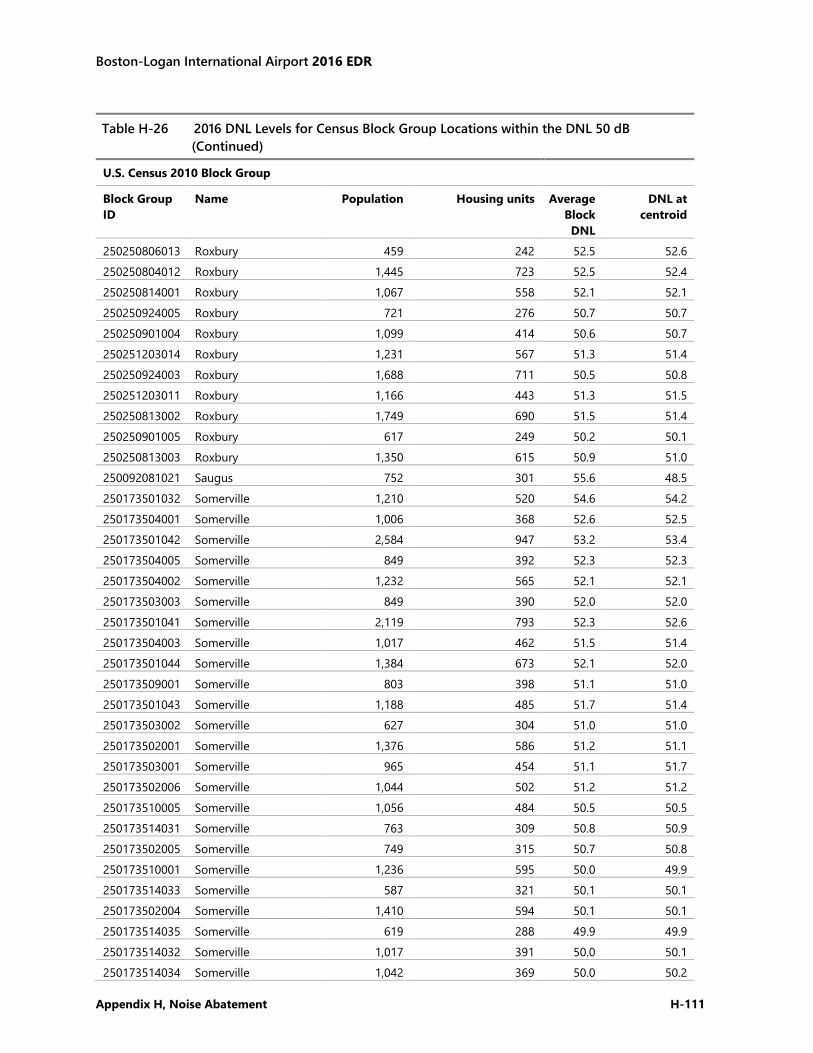
Boston-Logan International Airport 2016 EDR
Appendix H, Noise Abatement H-111
Table H-26 2016 DNL Levels for Census Block Group Locations within the DNL 50 dB (Continued)
U.S. Census 2010 Block Group
Block Group ID
Name Population Housing units Average Block DNL
DNL at centroid
250250806013 Roxbury 459 242 52.5 52.6 250250804012 Roxbury 1,445 723 52.5 52.4 250250814001 Roxbury 1,067 558 52.1 52.1 250250924005 Roxbury 721 276 50.7 50.7 250250901004 Roxbury 1,099 414 50.6 50.7 250251203014 Roxbury 1,231 567 51.3 51.4 250250924003 Roxbury 1,688 711 50.5 50.8 250251203011 Roxbury 1,166 443 51.3 51.5 250250813002 Roxbury 1,749 690 51.5 51.4 250250901005 Roxbury 617 249 50.2 50.1 250250813003 Roxbury 1,350 615 50.9 51.0 250092081021 Saugus 752 301 55.6 48.5 250173501032 Somerville 1,210 520 54.6 54.2 250173504001 Somerville 1,006 368 52.6 52.5 250173501042 Somerville 2,584 947 53.2 53.4 250173504005 Somerville 849 392 52.3 52.3 250173504002 Somerville 1,232 565 52.1 52.1 250173503003 Somerville 849 390 52.0 52.0 250173501041 Somerville 2,119 793 52.3 52.6 250173504003 Somerville 1,017 462 51.5 51.4 250173501044 Somerville 1,384 673 52.1 52.0 250173509001 Somerville 803 398 51.1 51.0 250173501043 Somerville 1,188 485 51.7 51.4 250173503002 Somerville 627 304 51.0 51.0 250173502001 Somerville 1,376 586 51.2 51.1 250173503001 Somerville 965 454 51.1 51.7 250173502006 Somerville 1,044 502 51.2 51.2 250173510005 Somerville 1,056 484 50.5 50.5 250173514031 Somerville 763 309 50.8 50.9 250173502005 Somerville 749 315 50.7 50.8 250173510001 Somerville 1,236 595 50.0 49.9 250173514033 Somerville 587 321 50.1 50.1 250173502004 Somerville 1,410 594 50.1 50.1 250173514035 Somerville 619 288 49.9 49.9 250173514032 Somerville 1,017 391 50.0 50.1 250173514034 Somerville 1,042 369 50.0 50.2
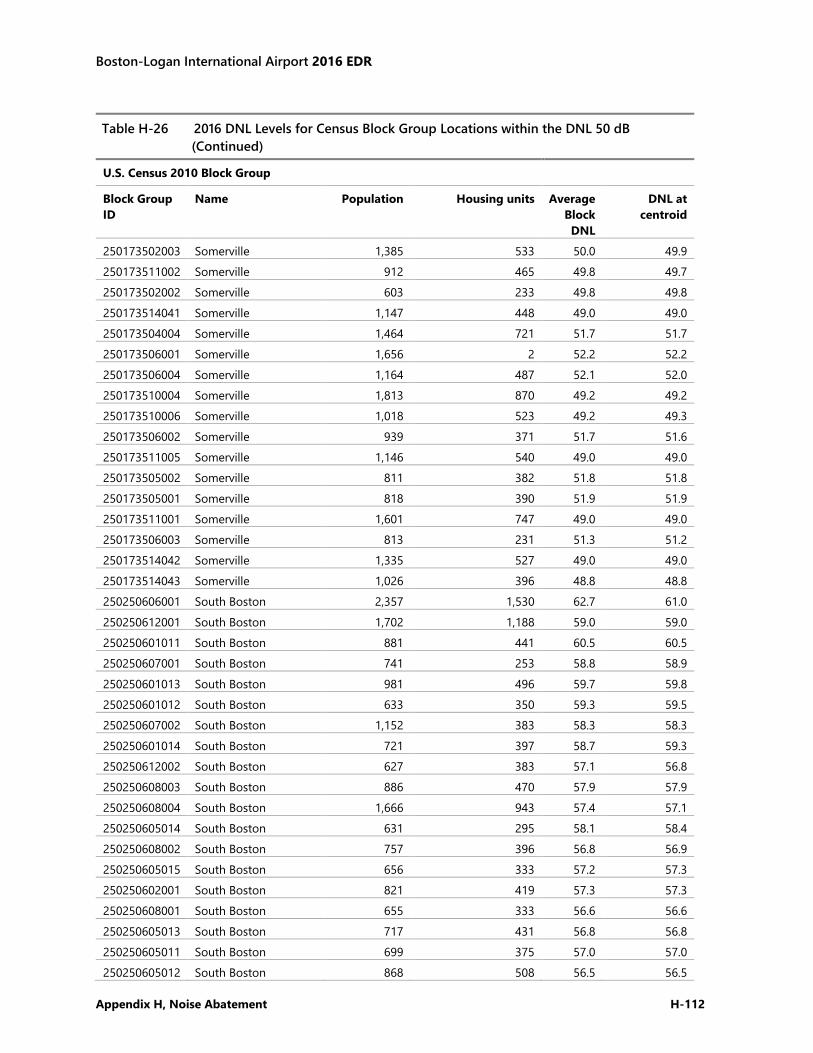
Boston-Logan International Airport 2016 EDR
Appendix H, Noise Abatement H-112
Table H-26 2016 DNL Levels for Census Block Group Locations within the DNL 50 dB (Continued)
U.S. Census 2010 Block Group
Block Group ID
Name Population Housing units Average Block DNL
DNL at centroid
250173502003 Somerville 1,385 533 50.0 49.9 250173511002 Somerville 912 465 49.8 49.7 250173502002 Somerville 603 233 49.8 49.8 250173514041 Somerville 1,147 448 49.0 49.0 250173504004 Somerville 1,464 721 51.7 51.7 250173506001 Somerville 1,656 2 52.2 52.2 250173506004 Somerville 1,164 487 52.1 52.0 250173510004 Somerville 1,813 870 49.2 49.2 250173510006 Somerville 1,018 523 49.2 49.3 250173506002 Somerville 939 371 51.7 51.6 250173511005 Somerville 1,146 540 49.0 49.0 250173505002 Somerville 811 382 51.8 51.8 250173505001 Somerville 818 390 51.9 51.9 250173511001 Somerville 1,601 747 49.0 49.0 250173506003 Somerville 813 231 51.3 51.2 250173514042 Somerville 1,335 527 49.0 49.0 250173514043 Somerville 1,026 396 48.8 48.8 250250606001 South Boston 2,357 1,530 62.7 61.0 250250612001 South Boston 1,702 1,188 59.0 59.0 250250601011 South Boston 881 441 60.5 60.5 250250607001 South Boston 741 253 58.8 58.9 250250601013 South Boston 981 496 59.7 59.8 250250601012 South Boston 633 350 59.3 59.5 250250607002 South Boston 1,152 383 58.3 58.3 250250601014 South Boston 721 397 58.7 59.3 250250612002 South Boston 627 383 57.1 56.8 250250608003 South Boston 886 470 57.9 57.9 250250608004 South Boston 1,666 943 57.4 57.1 250250605014 South Boston 631 295 58.1 58.4 250250608002 South Boston 757 396 56.8 56.9 250250605015 South Boston 656 333 57.2 57.3 250250602001 South Boston 821 419 57.3 57.3 250250608001 South Boston 655 333 56.6 56.6 250250605013 South Boston 717 431 56.8 56.8 250250605011 South Boston 699 375 57.0 57.0 250250605012 South Boston 868 508 56.5 56.5
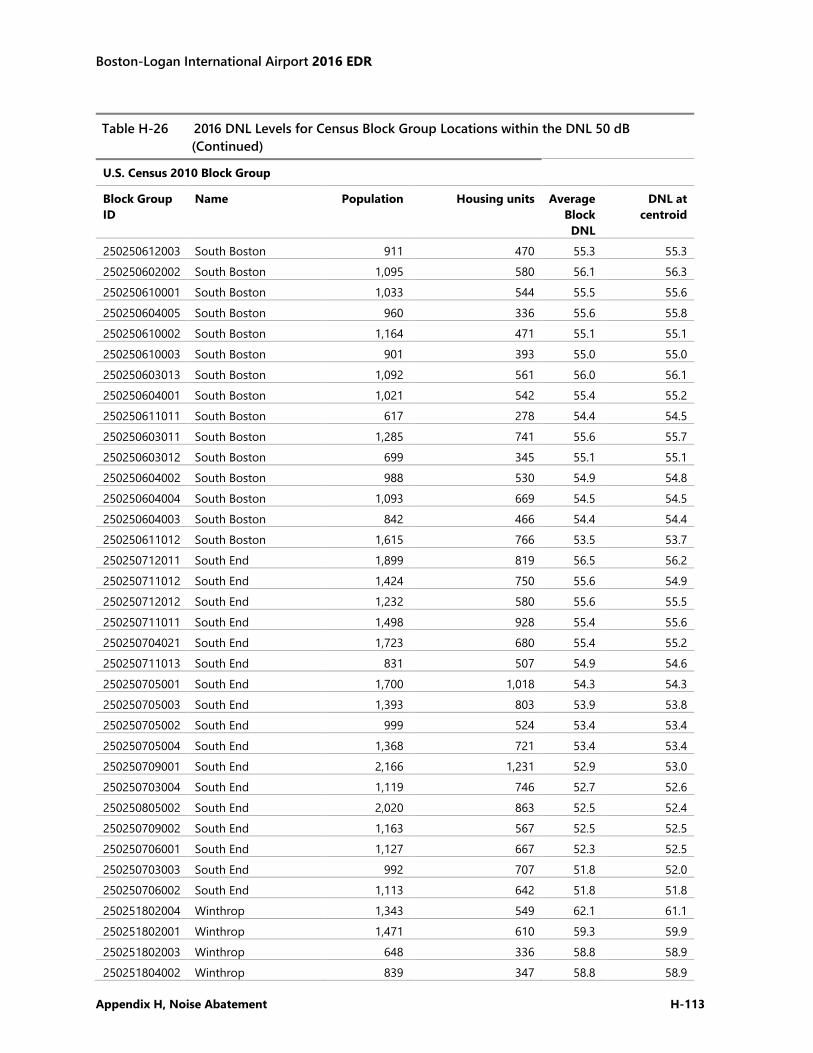
Boston-Logan International Airport 2016 EDR
Appendix H, Noise Abatement H-113
Table H-26 2016 DNL Levels for Census Block Group Locations within the DNL 50 dB (Continued)
U.S. Census 2010 Block Group
Block Group ID
Name Population Housing units Average Block DNL
DNL at centroid
250250612003 South Boston 911 470 55.3 55.3 250250602002 South Boston 1,095 580 56.1 56.3 250250610001 South Boston 1,033 544 55.5 55.6 250250604005 South Boston 960 336 55.6 55.8 250250610002 South Boston 1,164 471 55.1 55.1 250250610003 South Boston 901 393 55.0 55.0 250250603013 South Boston 1,092 561 56.0 56.1 250250604001 South Boston 1,021 542 55.4 55.2 250250611011 South Boston 617 278 54.4 54.5 250250603011 South Boston 1,285 741 55.6 55.7 250250603012 South Boston 699 345 55.1 55.1 250250604002 South Boston 988 530 54.9 54.8 250250604004 South Boston 1,093 669 54.5 54.5 250250604003 South Boston 842 466 54.4 54.4 250250611012 South Boston 1,615 766 53.5 53.7 250250712011 South End 1,899 819 56.5 56.2 250250711012 South End 1,424 750 55.6 54.9 250250712012 South End 1,232 580 55.6 55.5 250250711011 South End 1,498 928 55.4 55.6 250250704021 South End 1,723 680 55.4 55.2 250250711013 South End 831 507 54.9 54.6 250250705001 South End 1,700 1,018 54.3 54.3 250250705003 South End 1,393 803 53.9 53.8 250250705002 South End 999 524 53.4 53.4 250250705004 South End 1,368 721 53.4 53.4 250250709001 South End 2,166 1,231 52.9 53.0 250250703004 South End 1,119 746 52.7 52.6 250250805002 South End 2,020 863 52.5 52.4 250250709002 South End 1,163 567 52.5 52.5 250250706001 South End 1,127 667 52.3 52.5 250250703003 South End 992 707 51.8 52.0 250250706002 South End 1,113 642 51.8 51.8 250251802004 Winthrop 1,343 549 62.1 61.1 250251802001 Winthrop 1,471 610 59.3 59.9 250251802003 Winthrop 648 336 58.8 58.9 250251804002 Winthrop 839 347 58.8 58.9
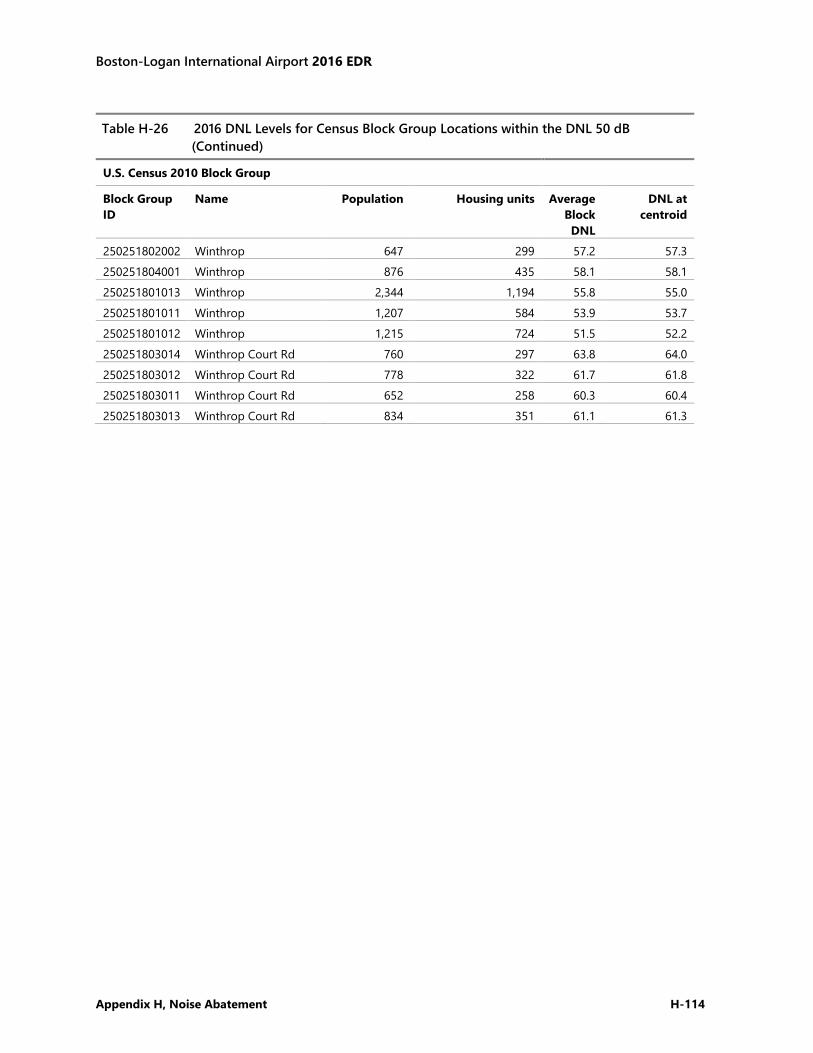
Boston-Logan International Airport 2016 EDR
Appendix H, Noise Abatement H-114
Table H-26 2016 DNL Levels for Census Block Group Locations within the DNL 50 dB (Continued)
U.S. Census 2010 Block Group
Block Group ID
Name Population Housing units Average Block DNL
DNL at centroid
250251802002 Winthrop 647 299 57.2 57.3 250251804001 Winthrop 876 435 58.1 58.1 250251801013 Winthrop 2,344 1,194 55.8 55.0 250251801011 Winthrop 1,207 584 53.9 53.7 250251801012 Winthrop 1,215 724 51.5 52.2 250251803014 Winthrop Court Rd 760 297 63.8 64.0 250251803012 Winthrop Court Rd 778 322 61.7 61.8 250251803011 Winthrop Court Rd 652 258 60.3 60.4 250251803013 Winthrop Court Rd 834 351 61.1 61.3
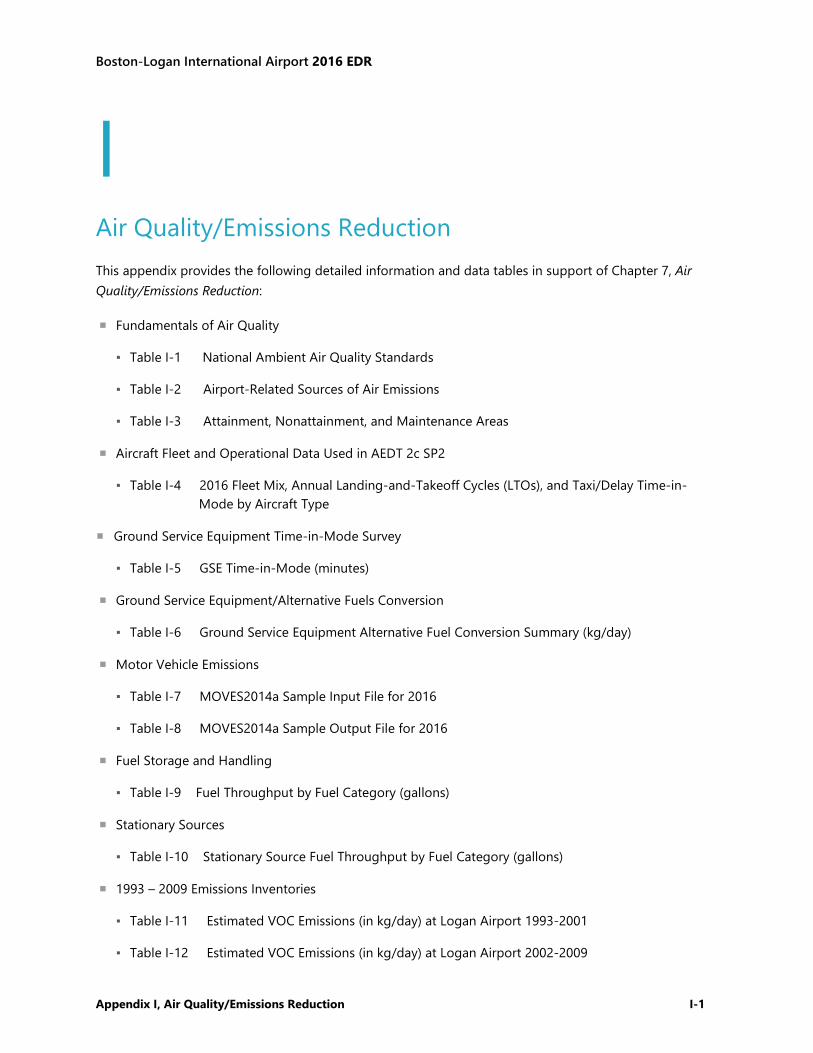
Boston-Logan International Airport 2016 EDR
Appendix I, Air Quality/Emissions Reduction I-1
I Air Quality/Emissions Reduction This appendix provides the following detailed information and data tables in support of Chapter 7, Air Quality/Emissions Reduction:
Fundamentals of Air Quality
▪ Table I-1 National Ambient Air Quality Standards
▪ Table I-2 Airport-Related Sources of Air Emissions
▪ Table I-3 Attainment, Nonattainment, and Maintenance Areas
Aircraft Fleet and Operational Data Used in AEDT 2c SP2
▪ Table I-4 2016 Fleet Mix, Annual Landing-and-Takeoff Cycles (LTOs), and Taxi/Delay Time-in- Mode by Aircraft Type
Ground Service Equipment Time-in-Mode Survey
▪ Table I-5 GSE Time-in-Mode (minutes)
Ground Service Equipment/Alternative Fuels Conversion
▪ Table I-6 Ground Service Equipment Alternative Fuel Conversion Summary (kg/day)
Motor Vehicle Emissions
▪ Table I-7 MOVES2014a Sample Input File for 2016
▪ Table I-8 MOVES2014a Sample Output File for 2016
Fuel Storage and Handling
▪ Table I-9 Fuel Throughput by Fuel Category (gallons)
Stationary Sources
▪ Table I-10 Stationary Source Fuel Throughput by Fuel Category (gallons)
1993 – 2009 Emissions Inventories
▪ Table I-11 Estimated VOC Emissions (in kg/day) at Logan Airport 1993-2001
▪ Table I-12 Estimated VOC Emissions (in kg/day) at Logan Airport 2002-2009
Boston-Logan International Airport 2016 EDR
Appendix I, Air Quality/Emissions Reduction I-2
▪ Table I-13 Estimated NOX Emissions (in kg/day) at Logan Airport 1993-2001
▪ Table I-14 Estimated NOX Emissions (in kg/day) at Logan Airport 2002-2009 ▪ Table I-15 Estimated CO Emissions (in kg/day) at Logan Airport 1993-2001
▪ Table I-16 Estimated CO Emissions (in kg/day) at Logan Airport 2002-2009
▪ Table I-17 Estimated PM10/PM2.5 Emissions (in kg/day) at Logan Airport 2005-2009
Greenhouse Gas (GHG) Emissions Inventory for 2016
▪ Table I-18 Logan Airport Greenhouse Gas (GHG) Inventory Input Data and Information for 2016
▪ Table I-19 Greenhouse Gas (GHG) Emission Factors for 2016
▪ Table I-20 Greenhouse Gas (GHG) Emissions (MMT CO2eq) for 2016 ▪ Table I-21 Logan Airport Greenhouse Gas (GHG) Emissions Compared to Massachusetts Totals
▪ Table I-22 Comparison of Estimated Total Greenhouse Gas (GHG) Emissions (MMT of CO2eq) at Logan Airport – 2007 through 2016
Measured NO2 Concentrations
▪ Table I-23 Massport and MassDEP Annual NO2 Concentration Monitoring Results (µg/m3)
Air Quality Initiative (AQI)
▪ Figure I-1 Modeled NOX Emissions Compared to AQI ▪ Table I-24 AQI Inventory Tracking of Modeled NOX Emissions (in tpy) for Logan Airport
▪ Table I-25 Contribution of NOX Air Emissions by Airline in 2015 (Estimated)
Boston-Logan International Airport 2016 EDR
Appendix I, Air Quality/Emissions Reduction I-3
Fundamentals of Air Quality
This section contains a general summary of air quality and air emissions with a particular emphasis on airport-related emissions where appropriate. This material is intended to supplement and provide background information for the materials contained in Chapter 7, Air Quality/Emissions Reduction.
Pollutant Types and Standards
The U.S. Environmental Protection Agency (EPA) has established National Ambient Air Quality Standards (NAAQS) for a select group of “criteria air pollutants” designed to protect public health, the environment, and the quality of life from the detrimental effects of air pollution. Listed alphabetically, these pollutants are briefly described below:
Carbon monoxide (CO) is a colorless, odorless, tasteless gas. It may temporarily accumulate, especially in cool, calm weather conditions, when fuel use reaches a peak and CO is chemically most stable due to the low temperatures. CO from natural sources usually dissipates quickly, posing no threat to human health. Transportation sources (e.g., motor vehicles), energy generation, and open burning are among the predominant anthropogenic (i.e., man-made) sources of CO.
Lead (Pb) in the atmosphere is generated from industrial sources including waste oil and solid waste incineration, iron and steel production, lead smelting, and battery and lead manufacturing. The lead content of motor vehicle emissions, which was the major source of lead in the past, has significantly declined with the widespread use of unleaded fuel. Low-lead fuel used in some general aviation (GA) aircraft is still a source of airport-related lead.
Nitrogen dioxide (NO2), nitric oxide (NO), and the nitrate radical (NO3) are collectively called oxides of nitrogen (NOx). These three compounds are interrelated, often changing from one form to another in chemical reactions, and NO2 is the compound commonly measured for comparison to the NAAQS. NOx is generally emitted in the form of NO, which is oxidized to NO2. The principal man-made source of NOx is fuel combustion in motor vehicles and power plants – aircraft engines are also a source. Reactions of NOx with other atmospheric chemicals can lead to formation of ozone (O3) and acidic precipitation.
Ozone (O3) is a secondary pollutant, formed from daytime reactions of NOx and volatile organic compounds (VOCs) in the presence of sunlight. VOCs, which are a subset of hydrocarbons (HC) and have no NAAQS, are released in industrial processes and from evaporation of gasoline and solvents. Sources of NOx are discussed above.
Particulate matter (PM) comprises very small particles of dirt, dust, soot, or liquid droplets called aerosols. The NAAQS for PM is segregated by sizes (i.e., less than 10 and less than 2.5 microns as PM10 and PM2.5, respectively). PM is formed as an exhaust product in the internal combustion engine or can be generated from the breakdown and dispersion of other solid materials (e.g., fugitive dust).
Sulfur oxides (SOx) are primarily composed of sulfur dioxide (SO2) which is emitted in natural processes and by man-made sources such as combustion of sulfur-containing fuels and sulfuric acid manufacturing.

Boston-Logan International Airport 2016 EDR
Appendix I, Air Quality/Emissions Reduction I-4
The NAAQS for these criteria pollutants are subdivided into the Primary Standards (designed to protect human health) and the Secondary Standards (designed to protect the environment and human welfare) and are listed below in Table I-1. Exceedances of these values constitute violations of the NAAQS.
Table I-1 National Ambient Air Quality Standards
Pollutants Averaging Time Concentration Condition of Violation
Ozone (O3) 8-hour 0.070 ppm 3-year average of the fourth-highest daily maximum 8-hour average.
Carbon Monoxide (CO) 8-hour 9 ppm No more than once per year. 1-hour 35 ppm
Nitrogen Dioxide (NO2) Annual Average 53 ppb Annual mean. 1-hour 100 ppb 3-year average of the 98th percentile of the daily
maximum 1-hour average. Sulfur Dioxide (SO2) 3-hour 0.5 ppm No more than once per year. 1-hour 75 ppb Three-year average of the 99th percentile of 1-
hour daily maximum concentrations. Particulate Matter (PM10) 24-hour 150 µg/m3 Not to be exceeded more than once per year on
average over 3 years. Particulate Matter (PM2.5) Annual (primary) 12 µg/m3 Annual mean, averaged over 3 years. Annual (secondary) 15 µg/m3 Annual mean, averaged over 3 years. 24-hour 35 µg/m3 3-year average of the 98th percentile. Lead (Pb) Rolling 3-month
average 0.15 µg/m3 Not to be exceeded.
Source: EPA, 2017, https://www.epa.gov/criteria-air-pollutants. Note: ppm - parts per million; ppb – parts per billion; µg/m3 - micrograms per cubic meter
Sources of Airport Air Emissions
Almost all large metropolitan airports generate air emissions from the following general source categories: aircraft, ground service equipment (GSE), and motor vehicles traveling to, from, and moving about the airport; fuel storage and transfer facilities; a variety of stationary sources (e.g., steam boilers, back-up generators, snow melters, etc.); an assortment of aircraft maintenance activities (e.g., painting, cleaning, repair, etc.); routine airfield, roadway, and building maintenance activities (e.g., painting, cleaning, repair, etc.); and periodic construction activities for new projects or improvements to existing facilities. Table I-2 provides a summary listing of these sources of air emissions, the pollutants, and their characteristics.
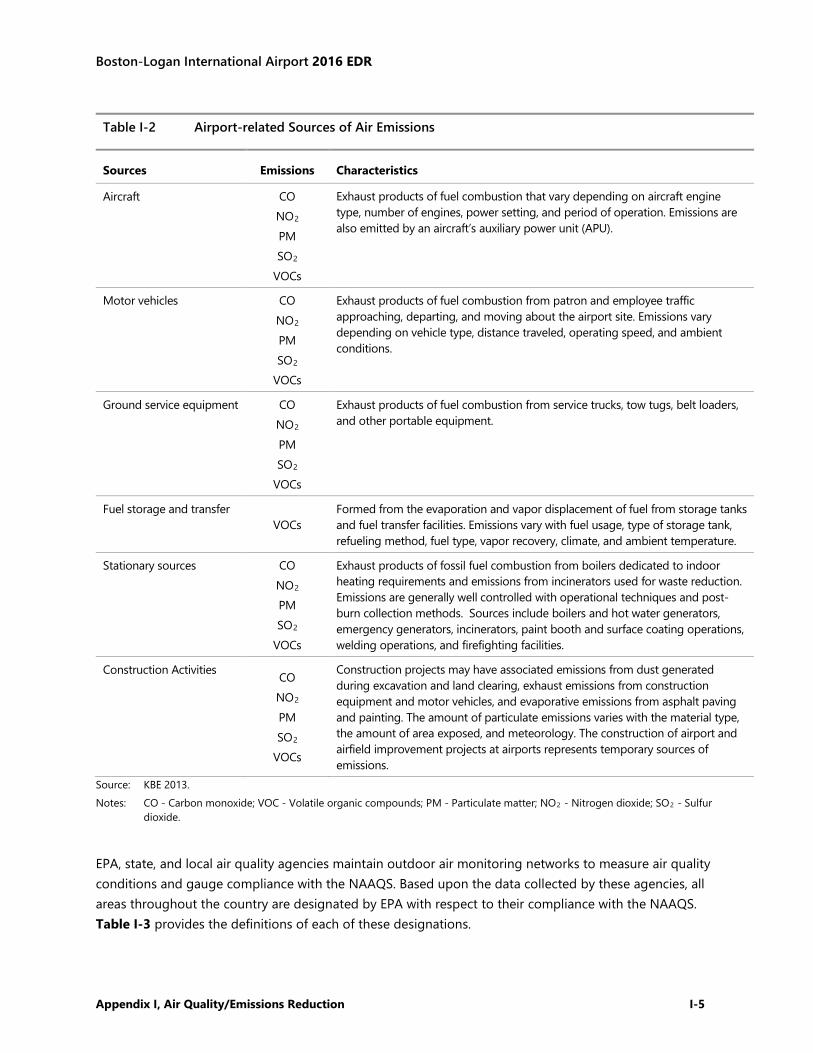
Boston-Logan International Airport 2016 EDR
Appendix I, Air Quality/Emissions Reduction I-5
Table I-2 Airport-related Sources of Air Emissions
Sources Emissions Characteristics
Aircraft CO NO2 PM SO2
VOCs
Exhaust products of fuel combustion that vary depending on aircraft engine type, number of engines, power setting, and period of operation. Emissions are also emitted by an aircraft’s auxiliary power unit (APU).
Motor vehicles CO NO2 PM SO2
VOCs
Exhaust products of fuel combustion from patron and employee traffic approaching, departing, and moving about the airport site. Emissions vary depending on vehicle type, distance traveled, operating speed, and ambient conditions.
Ground service equipment CO NO2 PM SO2
VOCs
Exhaust products of fuel combustion from service trucks, tow tugs, belt loaders, and other portable equipment.
Fuel storage and transfer VOCs
Formed from the evaporation and vapor displacement of fuel from storage tanks and fuel transfer facilities. Emissions vary with fuel usage, type of storage tank, refueling method, fuel type, vapor recovery, climate, and ambient temperature.
Stationary sources CO NO2 PM SO2
VOCs
Exhaust products of fossil fuel combustion from boilers dedicated to indoor heating requirements and emissions from incinerators used for waste reduction. Emissions are generally well controlled with operational techniques and post-burn collection methods. Sources include boilers and hot water generators, emergency generators, incinerators, paint booth and surface coating operations, welding operations, and firefighting facilities.
Construction Activities CO NO2 PM SO2
VOCs
Construction projects may have associated emissions from dust generated during excavation and land clearing, exhaust emissions from construction equipment and motor vehicles, and evaporative emissions from asphalt paving and painting. The amount of particulate emissions varies with the material type, the amount of area exposed, and meteorology. The construction of airport and airfield improvement projects at airports represents temporary sources of emissions.
Source: KBE 2013. Notes: CO - Carbon monoxide; VOC - Volatile organic compounds; PM - Particulate matter; NO2 - Nitrogen dioxide; SO2 - Sulfur
dioxide.
EPA, state, and local air quality agencies maintain outdoor air monitoring networks to measure air quality conditions and gauge compliance with the NAAQS. Based upon the data collected by these agencies, all areas throughout the country are designated by EPA with respect to their compliance with the NAAQS. Table I-3 provides the definitions of each of these designations.
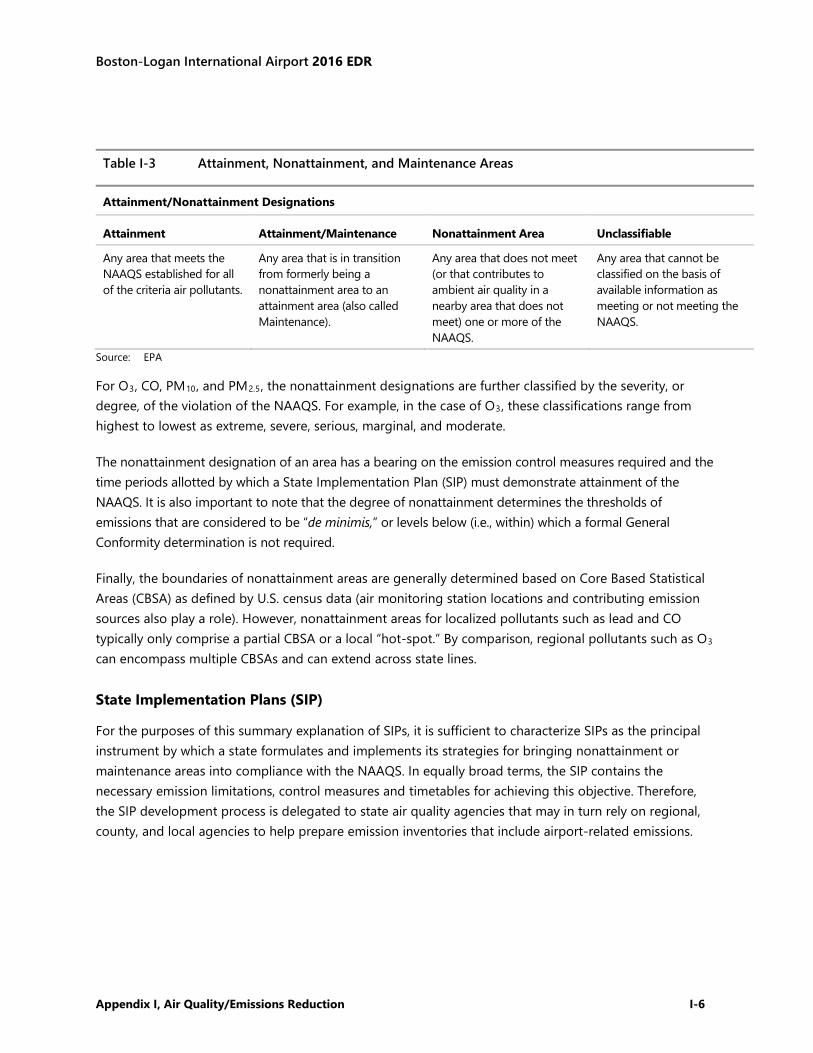
Boston-Logan International Airport 2016 EDR
Appendix I, Air Quality/Emissions Reduction I-6
Table I-3 Attainment, Nonattainment, and Maintenance Areas
Attainment/Nonattainment Designations
Attainment Attainment/Maintenance Nonattainment Area Unclassifiable
Any area that meets the NAAQS established for all of the criteria air pollutants.
Any area that is in transition from formerly being a nonattainment area to an attainment area (also called Maintenance).
Any area that does not meet (or that contributes to ambient air quality in a nearby area that does not meet) one or more of the NAAQS.
Any area that cannot be classified on the basis of available information as meeting or not meeting the NAAQS.
Source: EPA
For O3, CO, PM10, and PM2.5, the nonattainment designations are further classified by the severity, or degree, of the violation of the NAAQS. For example, in the case of O3, these classifications range from highest to lowest as extreme, severe, serious, marginal, and moderate.
The nonattainment designation of an area has a bearing on the emission control measures required and the time periods allotted by which a State Implementation Plan (SIP) must demonstrate attainment of the NAAQS. It is also important to note that the degree of nonattainment determines the thresholds of emissions that are considered to be “de minimis,” or levels below (i.e., within) which a formal General Conformity determination is not required.
Finally, the boundaries of nonattainment areas are generally determined based on Core Based Statistical Areas (CBSA) as defined by U.S. census data (air monitoring station locations and contributing emission sources also play a role). However, nonattainment areas for localized pollutants such as lead and CO typically only comprise a partial CBSA or a local “hot-spot.” By comparison, regional pollutants such as O3 can encompass multiple CBSAs and can extend across state lines.
State Implementation Plans (SIP)
For the purposes of this summary explanation of SIPs, it is sufficient to characterize SIPs as the principal instrument by which a state formulates and implements its strategies for bringing nonattainment or maintenance areas into compliance with the NAAQS. In equally broad terms, the SIP contains the necessary emission limitations, control measures and timetables for achieving this objective. Therefore, the SIP development process is delegated to state air quality agencies that may in turn rely on regional, county, and local agencies to help prepare emission inventories that include airport-related emissions.
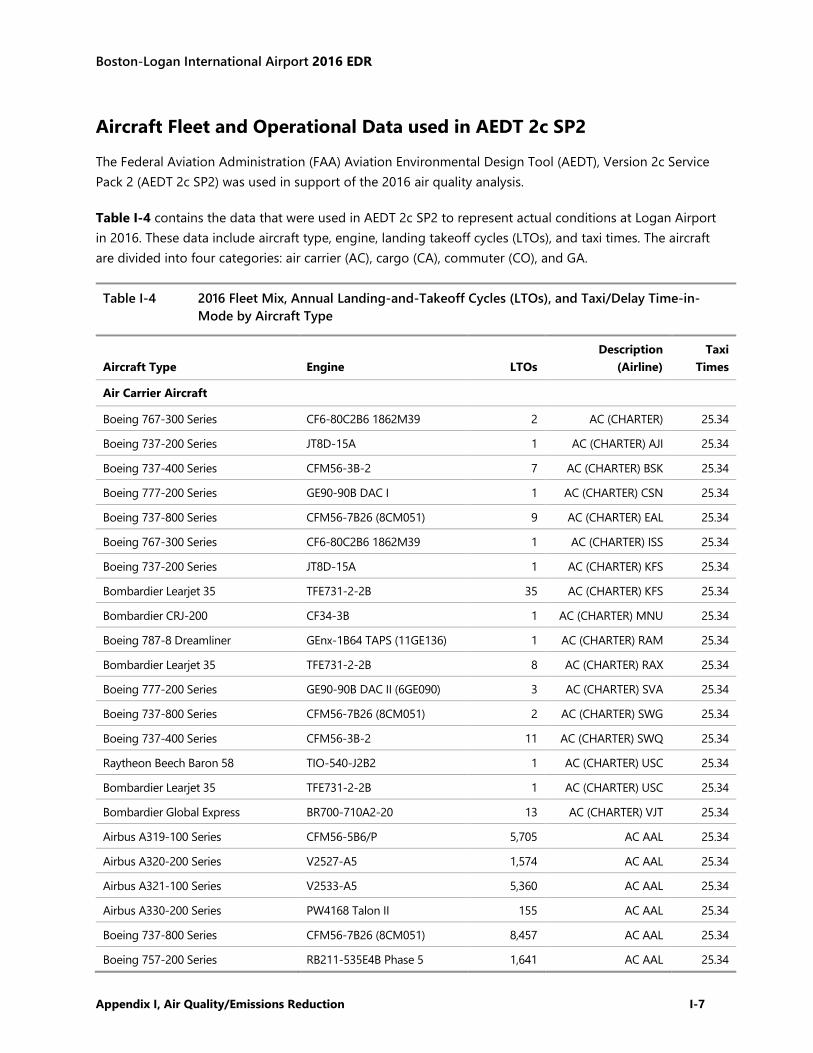
Boston-Logan International Airport 2016 EDR
Appendix I, Air Quality/Emissions Reduction I-7
Aircraft Fleet and Operational Data used in AEDT 2c SP2
The Federal Aviation Administration (FAA) Aviation Environmental Design Tool (AEDT), Version 2c Service Pack 2 (AEDT 2c SP2) was used in support of the 2016 air quality analysis.
Table I-4 contains the data that were used in AEDT 2c SP2 to represent actual conditions at Logan Airport in 2016. These data include aircraft type, engine, landing takeoff cycles (LTOs), and taxi times. The aircraft are divided into four categories: air carrier (AC), cargo (CA), commuter (CO), and GA.
Table I-4 2016 Fleet Mix, Annual Landing-and-Takeoff Cycles (LTOs), and Taxi/Delay Time-in- Mode by Aircraft Type
Aircraft Type Engine LTOs Description
(Airline) Taxi
Times
Air Carrier Aircraft Boeing 767-300 Series CF6-80C2B6 1862M39 2 AC (CHARTER) 25.34 Boeing 737-200 Series JT8D-15A 1 AC (CHARTER) AJI 25.34 Boeing 737-400 Series CFM56-3B-2 7 AC (CHARTER) BSK 25.34 Boeing 777-200 Series GE90-90B DAC I 1 AC (CHARTER) CSN 25.34 Boeing 737-800 Series CFM56-7B26 (8CM051) 9 AC (CHARTER) EAL 25.34 Boeing 767-300 Series CF6-80C2B6 1862M39 1 AC (CHARTER) ISS 25.34 Boeing 737-200 Series JT8D-15A 1 AC (CHARTER) KFS 25.34 Bombardier Learjet 35 TFE731-2-2B 35 AC (CHARTER) KFS 25.34 Bombardier CRJ-200 CF34-3B 1 AC (CHARTER) MNU 25.34 Boeing 787-8 Dreamliner GEnx-1B64 TAPS (11GE136) 1 AC (CHARTER) RAM 25.34 Bombardier Learjet 35 TFE731-2-2B 8 AC (CHARTER) RAX 25.34 Boeing 777-200 Series GE90-90B DAC II (6GE090) 3 AC (CHARTER) SVA 25.34 Boeing 737-800 Series CFM56-7B26 (8CM051) 2 AC (CHARTER) SWG 25.34 Boeing 737-400 Series CFM56-3B-2 11 AC (CHARTER) SWQ 25.34 Raytheon Beech Baron 58 TIO-540-J2B2 1 AC (CHARTER) USC 25.34 Bombardier Learjet 35 TFE731-2-2B 1 AC (CHARTER) USC 25.34 Bombardier Global Express BR700-710A2-20 13 AC (CHARTER) VJT 25.34 Airbus A319-100 Series CFM56-5B6/P 5,705 AC AAL 25.34 Airbus A320-200 Series V2527-A5 1,574 AC AAL 25.34 Airbus A321-100 Series V2533-A5 5,360 AC AAL 25.34 Airbus A330-200 Series PW4168 Talon II 155 AC AAL 25.34 Boeing 737-800 Series CFM56-7B26 (8CM051) 8,457 AC AAL 25.34 Boeing 757-200 Series RB211-535E4B Phase 5 1,641 AC AAL 25.34
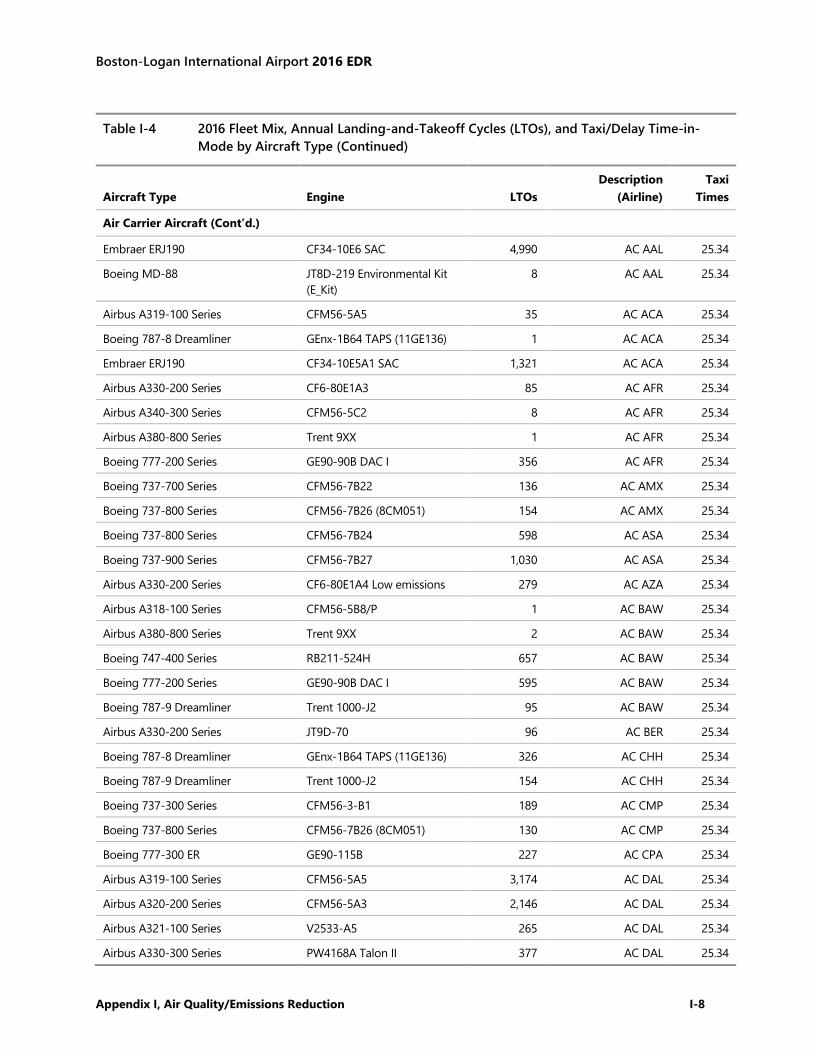
Boston-Logan International Airport 2016 EDR
Appendix I, Air Quality/Emissions Reduction I-8
Table I-4 2016 Fleet Mix, Annual Landing-and-Takeoff Cycles (LTOs), and Taxi/Delay Time-in- Mode by Aircraft Type (Continued)
Aircraft Type Engine LTOs Description
(Airline) Taxi
Times
Air Carrier Aircraft (Cont’d.)
Embraer ERJ190 CF34-10E6 SAC 4,990 AC AAL 25.34 Boeing MD-88 JT8D-219 Environmental Kit
(E_Kit) 8 AC AAL 25.34
Airbus A319-100 Series CFM56-5A5 35 AC ACA 25.34 Boeing 787-8 Dreamliner GEnx-1B64 TAPS (11GE136) 1 AC ACA 25.34 Embraer ERJ190 CF34-10E5A1 SAC 1,321 AC ACA 25.34 Airbus A330-200 Series CF6-80E1A3 85 AC AFR 25.34 Airbus A340-300 Series CFM56-5C2 8 AC AFR 25.34 Airbus A380-800 Series Trent 9XX 1 AC AFR 25.34 Boeing 777-200 Series GE90-90B DAC I 356 AC AFR 25.34 Boeing 737-700 Series CFM56-7B22 136 AC AMX 25.34 Boeing 737-800 Series CFM56-7B26 (8CM051) 154 AC AMX 25.34 Boeing 737-800 Series CFM56-7B24 598 AC ASA 25.34 Boeing 737-900 Series CFM56-7B27 1,030 AC ASA 25.34 Airbus A330-200 Series CF6-80E1A4 Low emissions 279 AC AZA 25.34 Airbus A318-100 Series CFM56-5B8/P 1 AC BAW 25.34 Airbus A380-800 Series Trent 9XX 2 AC BAW 25.34 Boeing 747-400 Series RB211-524H 657 AC BAW 25.34 Boeing 777-200 Series GE90-90B DAC I 595 AC BAW 25.34 Boeing 787-9 Dreamliner Trent 1000-J2 95 AC BAW 25.34 Airbus A330-200 Series JT9D-70 96 AC BER 25.34 Boeing 787-8 Dreamliner GEnx-1B64 TAPS (11GE136) 326 AC CHH 25.34 Boeing 787-9 Dreamliner Trent 1000-J2 154 AC CHH 25.34 Boeing 737-300 Series CFM56-3-B1 189 AC CMP 25.34 Boeing 737-800 Series CFM56-7B26 (8CM051) 130 AC CMP 25.34 Boeing 777-300 ER GE90-115B 227 AC CPA 25.34 Airbus A319-100 Series CFM56-5A5 3,174 AC DAL 25.34 Airbus A320-200 Series CFM56-5A3 2,146 AC DAL 25.34 Airbus A321-100 Series V2533-A5 265 AC DAL 25.34 Airbus A330-300 Series PW4168A Talon II 377 AC DAL 25.34

Boston-Logan International Airport 2016 EDR
Appendix I, Air Quality/Emissions Reduction I-9
Table I-4 2016 Fleet Mix, Annual Landing-and-Takeoff Cycles (LTOs), and Taxi/Delay Time-in- Mode by Aircraft Type (Continued)
Aircraft Type Engine LTOs Description
(Airline) Taxi
Times
Air Carrier Aircraft (Cont’d.)
Boeing 717-200 Series BR700-715A1-30 3,211 AC DAL 25.34 Boeing 737-800 Series CFM56-7B26 (8CM051) 1,990 AC DAL 25.34 Boeing 737-900 Series CFM56-7B26 (8CM051) 513 AC DAL 25.34 Boeing 757-200 Series PW2037 (4PW072) 1,634 AC DAL 25.34 Boeing 767-300 Series CF6-80A2 385 AC DAL 25.34 Boeing 767-400 ER CF6-80C2B7F 1862M39 480 AC DAL 25.34 Boeing MD-88 JT8D-219 Environmental Kit
(E_Kit) 960 AC DAL 25.34
Boeing MD-90 V2525-D5 1,835 AC DAL 25.34 Airbus A330-300 Series PW4168A Talon II 72 AC DLH 25.34 Airbus A340-600 Series Trent 556-61 Phase5 Tiled
(6RR041) 282 AC DLH 25.34
Boeing 747-400 Series CF6-80C2B1F 1862M39 235 AC DLH 25.34 Boeing 747-8 GEnx-2B67 TAPS (8GENX1) 275 AC DLH 25.34 Bombardier CRJ-900 CF34-8C5 LEC (8GE110) 688 AC EDV 25.34 Airbus A330-200 Series CF6-80E1A2 1862M39 208 AC EIN 25.34 Airbus A330-300 Series CF6-80E1A4 Standard 459 AC EIN 25.34 Boeing 757-200 Series PW2040 (4PW073) 275 AC EIN 25.34 Boeing 767-200 Series CF6-80A 92 AC EIN 25.34 Boeing 767-300 Series PW4060 Reduced smoke 148 AC ELY 25.34 Airbus A330-200 Series PW4168A Talon II 36 AC EWG 25.34 Bombardier CRJ-200 CF34-3B 159 AC FLG 25.34 Bombardier CRJ-900 CF34-8C5 LEC (8GE110) 2,971 AC FLG 25.34 Airbus A330-300 Series CF6-80E1A4 Standard 206 AC IBE 25.34 Boeing 757-200 Series RB211-535E4 (3RR028) 603 AC ICE 25.34 Boeing 767-300 Series CF6-80C2B6 1862M39 76 AC ICE 25.34 Boeing 787-8 Dreamliner GEnx-1B64 TAPS (11GE136) 164 AC JAL 25.34 Boeing 787-9 Dreamliner Trent 1000-J2 204 AC JAL 25.34 Airbus A320-200 Series V2527-A5 20,397 AC JBU 25.34 Airbus A321-100 Series V2533-A5 811 AC JBU 25.34
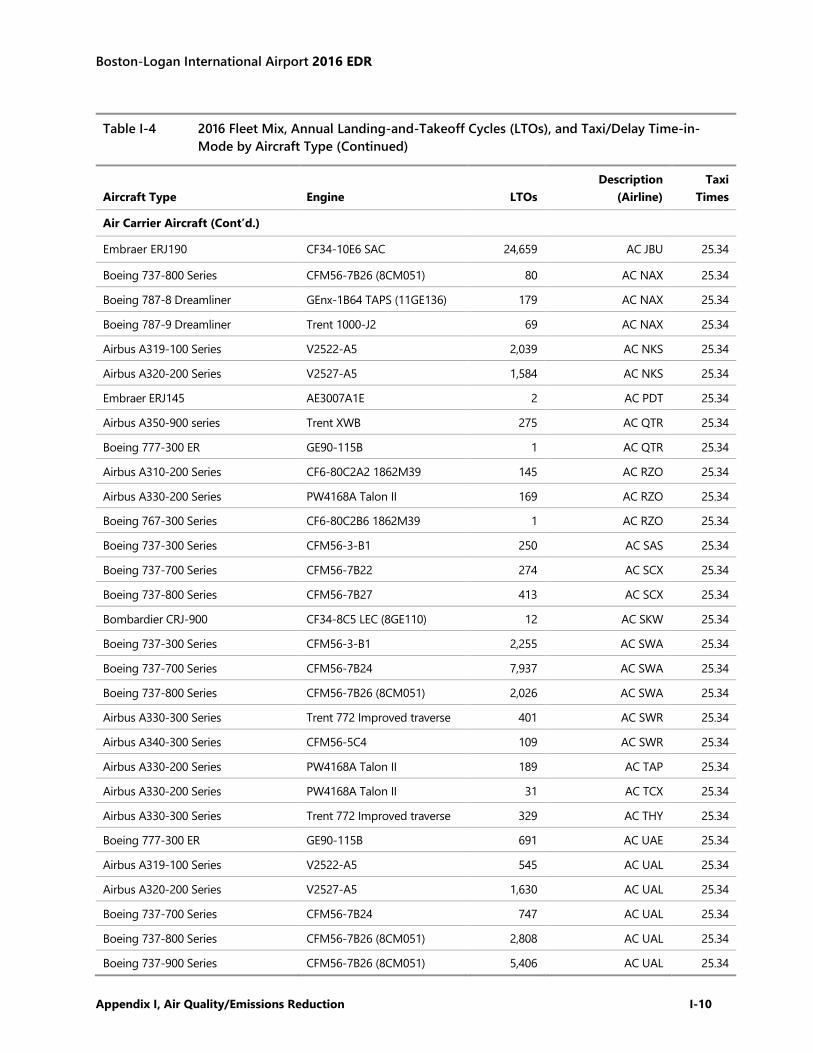
Boston-Logan International Airport 2016 EDR
Appendix I, Air Quality/Emissions Reduction I-10
Table I-4 2016 Fleet Mix, Annual Landing-and-Takeoff Cycles (LTOs), and Taxi/Delay Time-in- Mode by Aircraft Type (Continued)
Aircraft Type Engine LTOs Description
(Airline) Taxi
Times
Air Carrier Aircraft (Cont’d.) Embraer ERJ190 CF34-10E6 SAC 24,659 AC JBU 25.34 Boeing 737-800 Series CFM56-7B26 (8CM051) 80 AC NAX 25.34 Boeing 787-8 Dreamliner GEnx-1B64 TAPS (11GE136) 179 AC NAX 25.34 Boeing 787-9 Dreamliner Trent 1000-J2 69 AC NAX 25.34 Airbus A319-100 Series V2522-A5 2,039 AC NKS 25.34 Airbus A320-200 Series V2527-A5 1,584 AC NKS 25.34 Embraer ERJ145 AE3007A1E 2 AC PDT 25.34 Airbus A350-900 series Trent XWB 275 AC QTR 25.34 Boeing 777-300 ER GE90-115B 1 AC QTR 25.34 Airbus A310-200 Series CF6-80C2A2 1862M39 145 AC RZO 25.34 Airbus A330-200 Series PW4168A Talon II 169 AC RZO 25.34 Boeing 767-300 Series CF6-80C2B6 1862M39 1 AC RZO 25.34 Boeing 737-300 Series CFM56-3-B1 250 AC SAS 25.34 Boeing 737-700 Series CFM56-7B22 274 AC SCX 25.34 Boeing 737-800 Series CFM56-7B27 413 AC SCX 25.34 Bombardier CRJ-900 CF34-8C5 LEC (8GE110) 12 AC SKW 25.34 Boeing 737-300 Series CFM56-3-B1 2,255 AC SWA 25.34 Boeing 737-700 Series CFM56-7B24 7,937 AC SWA 25.34 Boeing 737-800 Series CFM56-7B26 (8CM051) 2,026 AC SWA 25.34 Airbus A330-300 Series Trent 772 Improved traverse 401 AC SWR 25.34 Airbus A340-300 Series CFM56-5C4 109 AC SWR 25.34 Airbus A330-200 Series PW4168A Talon II 189 AC TAP 25.34 Airbus A330-200 Series PW4168A Talon II 31 AC TCX 25.34 Airbus A330-300 Series Trent 772 Improved traverse 329 AC THY 25.34 Boeing 777-300 ER GE90-115B 691 AC UAE 25.34 Airbus A319-100 Series V2522-A5 545 AC UAL 25.34 Airbus A320-200 Series V2527-A5 1,630 AC UAL 25.34 Boeing 737-700 Series CFM56-7B24 747 AC UAL 25.34 Boeing 737-800 Series CFM56-7B26 (8CM051) 2,808 AC UAL 25.34 Boeing 737-900 Series CFM56-7B26 (8CM051) 5,406 AC UAL 25.34
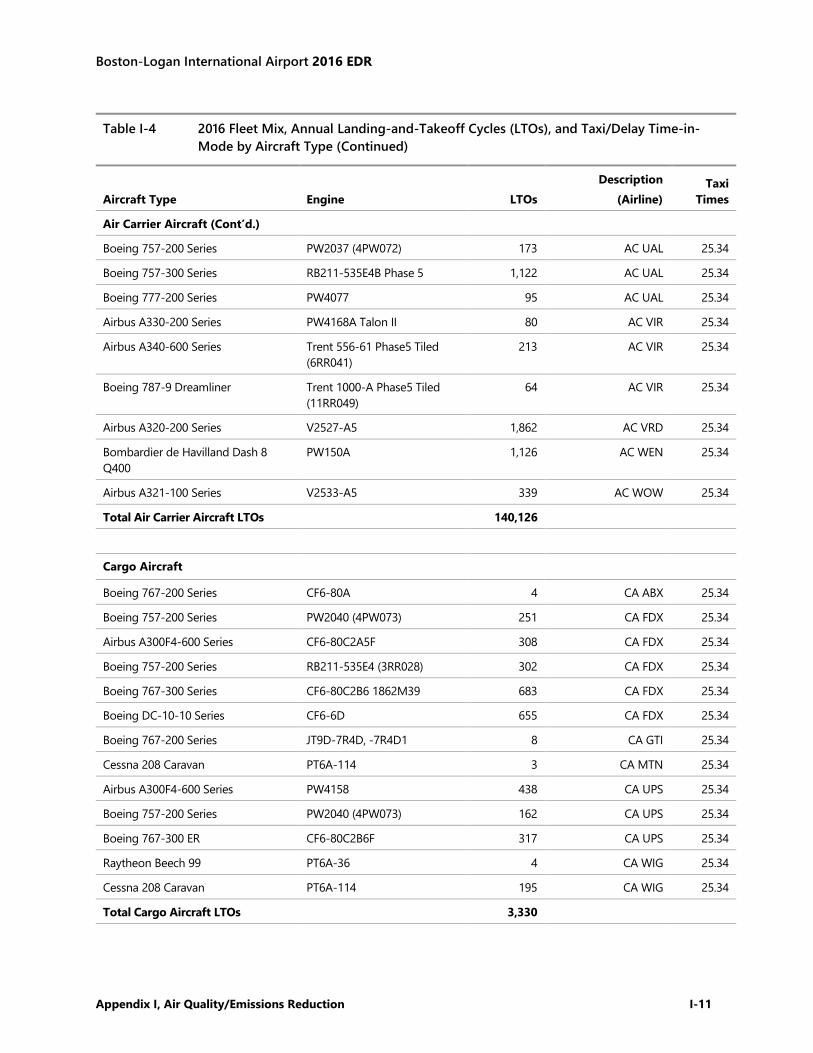
Boston-Logan International Airport 2016 EDR
Appendix I, Air Quality/Emissions Reduction I-11
Table I-4 2016 Fleet Mix, Annual Landing-and-Takeoff Cycles (LTOs), and Taxi/Delay Time-in- Mode by Aircraft Type (Continued)
Aircraft Type Engine LTOs Description
(Airline) Taxi
Times
Air Carrier Aircraft (Cont’d.) Boeing 757-200 Series PW2037 (4PW072) 173 AC UAL 25.34 Boeing 757-300 Series RB211-535E4B Phase 5 1,122 AC UAL 25.34 Boeing 777-200 Series PW4077 95 AC UAL 25.34 Airbus A330-200 Series PW4168A Talon II 80 AC VIR 25.34 Airbus A340-600 Series Trent 556-61 Phase5 Tiled
(6RR041) 213 AC VIR 25.34
Boeing 787-9 Dreamliner Trent 1000-A Phase5 Tiled (11RR049)
64 AC VIR 25.34
Airbus A320-200 Series V2527-A5 1,862 AC VRD 25.34 Bombardier de Havilland Dash 8 Q400
PW150A 1,126 AC WEN 25.34
Airbus A321-100 Series V2533-A5 339 AC WOW 25.34 Total Air Carrier Aircraft LTOs
140,126
Cargo Aircraft Boeing 767-200 Series CF6-80A 4 CA ABX 25.34 Boeing 757-200 Series PW2040 (4PW073) 251 CA FDX 25.34 Airbus A300F4-600 Series CF6-80C2A5F 308 CA FDX 25.34 Boeing 757-200 Series RB211-535E4 (3RR028) 302 CA FDX 25.34 Boeing 767-300 Series CF6-80C2B6 1862M39 683 CA FDX 25.34 Boeing DC-10-10 Series CF6-6D 655 CA FDX 25.34 Boeing 767-200 Series JT9D-7R4D, -7R4D1 8 CA GTI 25.34 Cessna 208 Caravan PT6A-114 3 CA MTN 25.34 Airbus A300F4-600 Series PW4158 438 CA UPS 25.34 Boeing 757-200 Series PW2040 (4PW073) 162 CA UPS 25.34 Boeing 767-300 ER CF6-80C2B6F 317 CA UPS 25.34 Raytheon Beech 99 PT6A-36 4 CA WIG 25.34 Cessna 208 Caravan PT6A-114 195 CA WIG 25.34 Total Cargo Aircraft LTOs
3,330
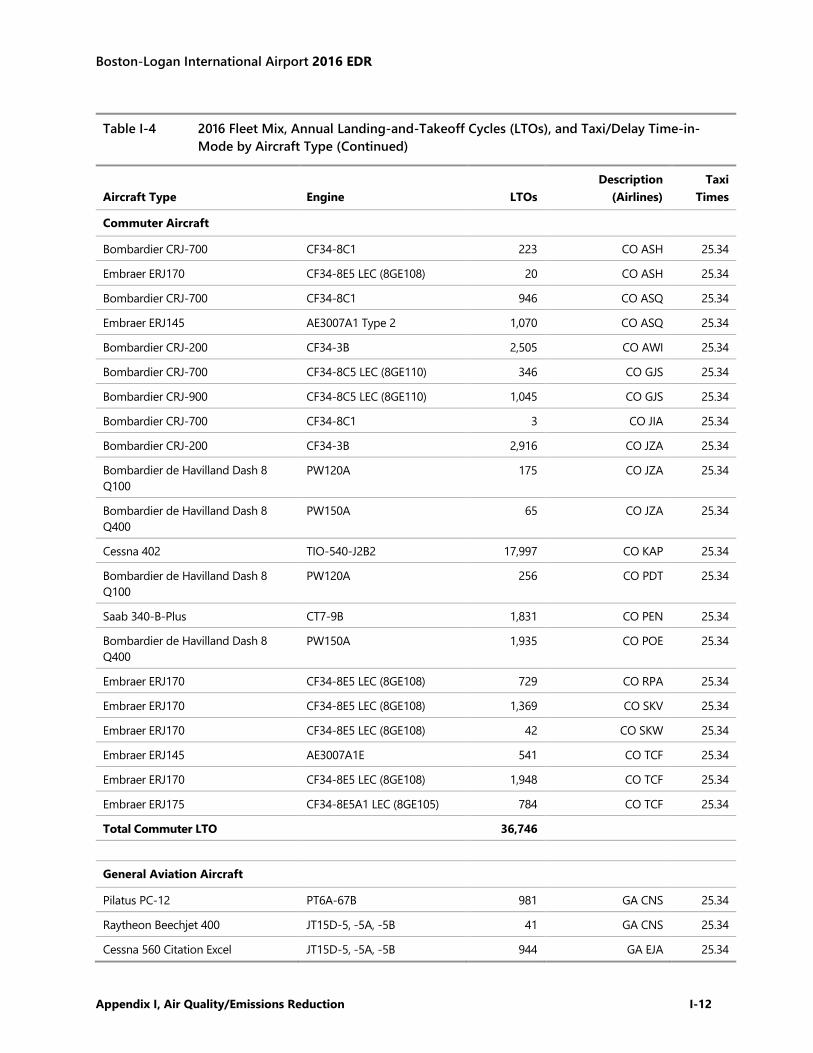
Boston-Logan International Airport 2016 EDR
Appendix I, Air Quality/Emissions Reduction I-12
Table I-4 2016 Fleet Mix, Annual Landing-and-Takeoff Cycles (LTOs), and Taxi/Delay Time-in- Mode by Aircraft Type (Continued)
Aircraft Type Engine LTOs Description
(Airlines) Taxi
Times
Commuter Aircraft Bombardier CRJ-700 CF34-8C1 223 CO ASH 25.34 Embraer ERJ170 CF34-8E5 LEC (8GE108) 20 CO ASH 25.34 Bombardier CRJ-700 CF34-8C1 946 CO ASQ 25.34 Embraer ERJ145 AE3007A1 Type 2 1,070 CO ASQ 25.34 Bombardier CRJ-200 CF34-3B 2,505 CO AWI 25.34 Bombardier CRJ-700 CF34-8C5 LEC (8GE110) 346 CO GJS 25.34 Bombardier CRJ-900 CF34-8C5 LEC (8GE110) 1,045 CO GJS 25.34 Bombardier CRJ-700 CF34-8C1 3 CO JIA 25.34 Bombardier CRJ-200 CF34-3B 2,916 CO JZA 25.34 Bombardier de Havilland Dash 8 Q100
PW120A 175 CO JZA 25.34
Bombardier de Havilland Dash 8 Q400
PW150A 65 CO JZA 25.34
Cessna 402 TIO-540-J2B2 17,997 CO KAP 25.34 Bombardier de Havilland Dash 8 Q100
PW120A 256 CO PDT 25.34
Saab 340-B-Plus CT7-9B 1,831 CO PEN 25.34 Bombardier de Havilland Dash 8 Q400
PW150A 1,935 CO POE 25.34
Embraer ERJ170 CF34-8E5 LEC (8GE108) 729 CO RPA 25.34 Embraer ERJ170 CF34-8E5 LEC (8GE108) 1,369 CO SKV 25.34 Embraer ERJ170 CF34-8E5 LEC (8GE108) 42 CO SKW 25.34 Embraer ERJ145 AE3007A1E 541 CO TCF 25.34 Embraer ERJ170 CF34-8E5 LEC (8GE108) 1,948 CO TCF 25.34 Embraer ERJ175 CF34-8E5A1 LEC (8GE105) 784 CO TCF 25.34 Total Commuter LTO
36,746
General Aviation Aircraft Pilatus PC-12 PT6A-67B 981 GA CNS 25.34 Raytheon Beechjet 400 JT15D-5, -5A, -5B 41 GA CNS 25.34 Cessna 560 Citation Excel JT15D-5, -5A, -5B 944 GA EJA 25.34
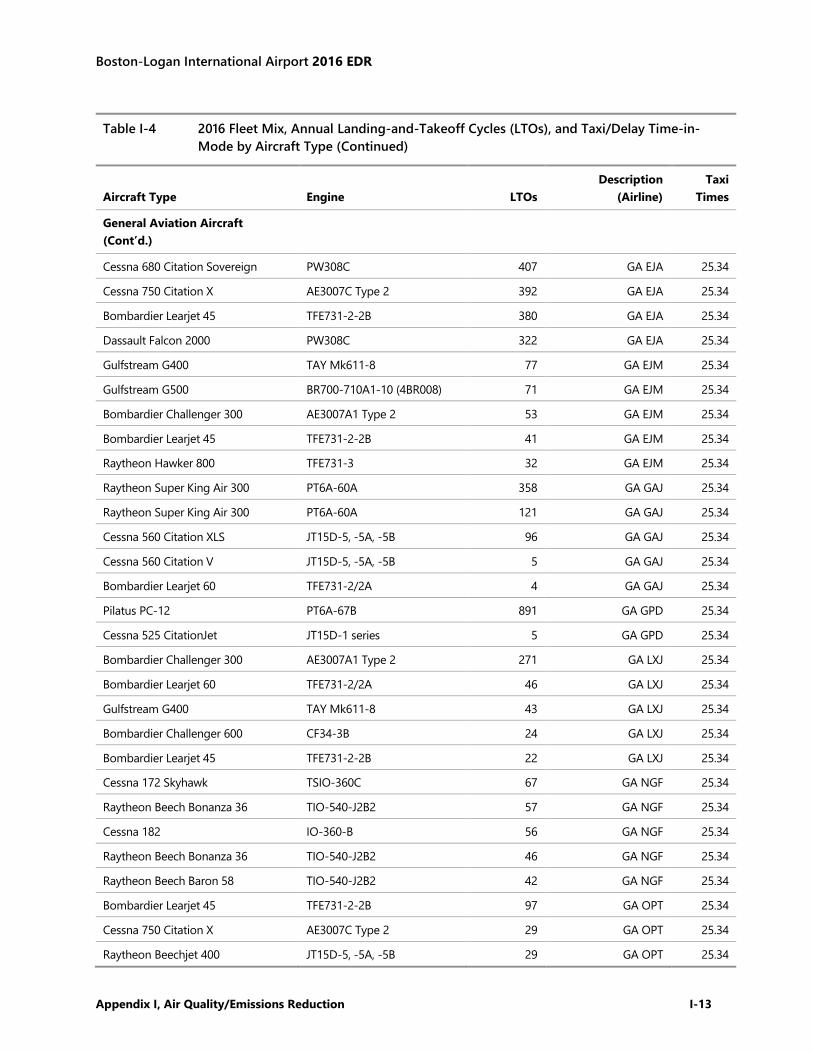
Boston-Logan International Airport 2016 EDR
Appendix I, Air Quality/Emissions Reduction I-13
Table I-4 2016 Fleet Mix, Annual Landing-and-Takeoff Cycles (LTOs), and Taxi/Delay Time-in- Mode by Aircraft Type (Continued)
Aircraft Type Engine LTOs Description
(Airline) Taxi
Times
General Aviation Aircraft (Cont’d.)
Cessna 680 Citation Sovereign PW308C 407 GA EJA 25.34 Cessna 750 Citation X AE3007C Type 2 392 GA EJA 25.34 Bombardier Learjet 45 TFE731-2-2B 380 GA EJA 25.34 Dassault Falcon 2000 PW308C 322 GA EJA 25.34 Gulfstream G400 TAY Mk611-8 77 GA EJM 25.34 Gulfstream G500 BR700-710A1-10 (4BR008) 71 GA EJM 25.34 Bombardier Challenger 300 AE3007A1 Type 2 53 GA EJM 25.34 Bombardier Learjet 45 TFE731-2-2B 41 GA EJM 25.34 Raytheon Hawker 800 TFE731-3 32 GA EJM 25.34 Raytheon Super King Air 300 PT6A-60A 358 GA GAJ 25.34 Raytheon Super King Air 300 PT6A-60A 121 GA GAJ 25.34 Cessna 560 Citation XLS JT15D-5, -5A, -5B 96 GA GAJ 25.34 Cessna 560 Citation V JT15D-5, -5A, -5B 5 GA GAJ 25.34 Bombardier Learjet 60 TFE731-2/2A 4 GA GAJ 25.34 Pilatus PC-12 PT6A-67B 891 GA GPD 25.34 Cessna 525 CitationJet JT15D-1 series 5 GA GPD 25.34 Bombardier Challenger 300 AE3007A1 Type 2 271 GA LXJ 25.34 Bombardier Learjet 60 TFE731-2/2A 46 GA LXJ 25.34 Gulfstream G400 TAY Mk611-8 43 GA LXJ 25.34 Bombardier Challenger 600 CF34-3B 24 GA LXJ 25.34 Bombardier Learjet 45 TFE731-2-2B 22 GA LXJ 25.34 Cessna 172 Skyhawk TSIO-360C 67 GA NGF 25.34 Raytheon Beech Bonanza 36 TIO-540-J2B2 57 GA NGF 25.34 Cessna 182 IO-360-B 56 GA NGF 25.34 Raytheon Beech Bonanza 36 TIO-540-J2B2 46 GA NGF 25.34 Raytheon Beech Baron 58 TIO-540-J2B2 42 GA NGF 25.34 Bombardier Learjet 45 TFE731-2-2B 97 GA OPT 25.34 Cessna 750 Citation X AE3007C Type 2 29 GA OPT 25.34 Raytheon Beechjet 400 JT15D-5, -5A, -5B 29 GA OPT 25.34

Boston-Logan International Airport 2016 EDR
Appendix I, Air Quality/Emissions Reduction I-14
Table I-4 2016 Fleet Mix, Annual Landing-and-Takeoff Cycles (LTOs), and Taxi/Delay Time-in- Mode by Aircraft Type (Continued)
Aircraft Type Engine LTOs Description
(Airline) Taxi
Times
General Aviation Aircraft (Cont’d.)
Embraer ERJ135 AE3007A1/3 Type 3 (reduced emissions)
18 GA OPT 25.34
Raytheon Beechjet 400 JT15D-5, -5A, -5B 349 GA TMC 25.34 Raytheon Hawker 800 TFE731-3 194 GA TMC 25.34 Bombardier Challenger 600 CF34-3B 17 GA TMC 25.34 Gulfstream G400 TAY Mk611-8 1,336 GA 25.34 Bombardier Challenger 600 CF34-3B 1,249 GA 25.34 Gulfstream G500 BR700-710A1-10 (4BR008) 1,161 GA 25.34 Dassault Falcon 2000 PW308C 953 GA 25.34 Raytheon Hawker 800 TFE731-3 908 GA 25.34 Raytheon Super King Air 200 PT6A-42 736 GA 25.34 Bombardier Challenger 300 AE3007A1 Type 2 643 GA 25.34 Raytheon Hawker 800 TFE731-3 194 GA TMC 25.34 Bombardier Challenger 600 CF34-3B 17 GA TMC 25.34 Gulfstream G400 TAY Mk611-8 1,336 GA 25.34 Bombardier Challenger 600 CF34-3B 1,249 GA 25.34 Gulfstream G500 BR700-710A1-10 (4BR008) 1,161 GA 25.34 Dassault Falcon 2000 PW308C 953 GA 25.34 Raytheon Hawker 800 TFE731-3 908 GA 25.34 Raytheon Super King Air 200 PT6A-42 736 GA 25.34 Bombardier Challenger 300 AE3007A1 Type 2 643 GA 25.34 Dassault Falcon 900 TFE731-3 552 GA 25.34 Cessna 525 CitationJet JT15D-1 series 544 GA 25.34 Bombardier Global Express BR700-710A2-20 483 GA 25.34 Cessna 750 Citation X AE3007C Type 2 123 GA XOJ 25.34 Bombardier Challenger 300 AE3007A1 Type 2 95 GA XOJ 25.34 Total General Aviation Aircraft LTOs
15,411
Total Fleet LTOs 195,613 Source: KBE, HMMH, and FAA ASPM 2017.
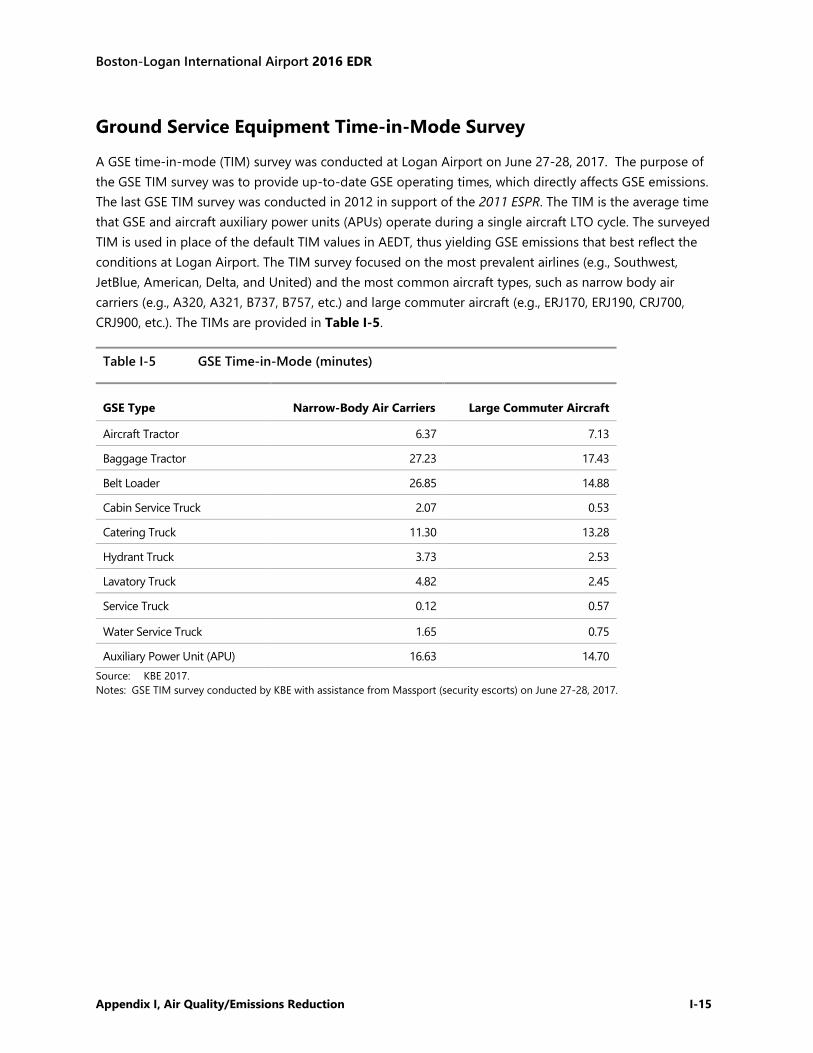
Boston-Logan International Airport 2016 EDR
Appendix I, Air Quality/Emissions Reduction I-15
Ground Service Equipment Time-in-Mode Survey
A GSE time-in-mode (TIM) survey was conducted at Logan Airport on June 27-28, 2017. The purpose of the GSE TIM survey was to provide up-to-date GSE operating times, which directly affects GSE emissions. The last GSE TIM survey was conducted in 2012 in support of the 2011 ESPR. The TIM is the average time that GSE and aircraft auxiliary power units (APUs) operate during a single aircraft LTO cycle. The surveyed TIM is used in place of the default TIM values in AEDT, thus yielding GSE emissions that best reflect the conditions at Logan Airport. The TIM survey focused on the most prevalent airlines (e.g., Southwest, JetBlue, American, Delta, and United) and the most common aircraft types, such as narrow body air carriers (e.g., A320, A321, B737, B757, etc.) and large commuter aircraft (e.g., ERJ170, ERJ190, CRJ700, CRJ900, etc.). The TIMs are provided in Table I-5.
Table I-5 GSE Time-in-Mode (minutes)
GSE Type Narrow-Body Air Carriers Large Commuter Aircraft
Aircraft Tractor 6.37 7.13 Baggage Tractor 27.23 17.43 Belt Loader 26.85 14.88 Cabin Service Truck 2.07 0.53 Catering Truck 11.30 13.28 Hydrant Truck 3.73 2.53 Lavatory Truck 4.82 2.45 Service Truck 0.12 0.57 Water Service Truck 1.65 0.75 Auxiliary Power Unit (APU) 16.63 14.70
Source: KBE 2017. Notes: GSE TIM survey conducted by KBE with assistance from Massport (security escorts) on June 27-28, 2017.
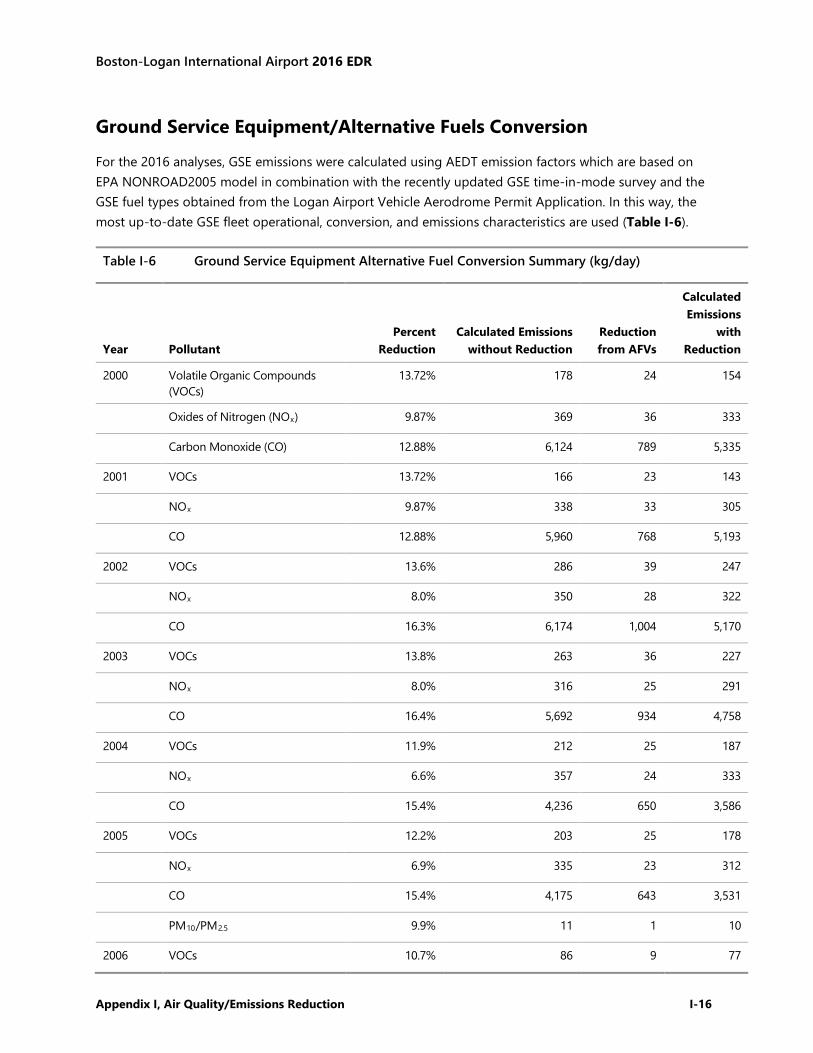
Boston-Logan International Airport 2016 EDR
Appendix I, Air Quality/Emissions Reduction I-16
Ground Service Equipment/Alternative Fuels Conversion
For the 2016 analyses, GSE emissions were calculated using AEDT emission factors which are based on EPA NONROAD2005 model in combination with the recently updated GSE time-in-mode survey and the GSE fuel types obtained from the Logan Airport Vehicle Aerodrome Permit Application. In this way, the most up-to-date GSE fleet operational, conversion, and emissions characteristics are used (Table I-6).
Table I-6 Ground Service Equipment Alternative Fuel Conversion Summary (kg/day)
Year Pollutant Percent
Reduction Calculated Emissions
without Reduction Reduction from AFVs
Calculated Emissions
with Reduction
2000 Volatile Organic Compounds (VOCs)
13.72% 178 24 154
Oxides of Nitrogen (NOx) 9.87% 369 36 333
Carbon Monoxide (CO) 12.88% 6,124 789 5,335
2001 VOCs 13.72% 166 23 143
NOx 9.87% 338 33 305
CO 12.88% 5,960 768 5,193
2002 VOCs 13.6% 286 39 247
NOx 8.0% 350 28 322
CO 16.3% 6,174 1,004 5,170
2003 VOCs 13.8% 263 36 227
NOx 8.0% 316 25 291
CO 16.4% 5,692 934 4,758
2004 VOCs 11.9% 212 25 187
NOx 6.6% 357 24 333
CO 15.4% 4,236 650 3,586
2005 VOCs 12.2% 203 25 178
NOx 6.9% 335 23 312
CO 15.4% 4,175 643 3,531
PM10/PM2.5 9.9% 11 1 10
2006 VOCs 10.7% 86 9 77
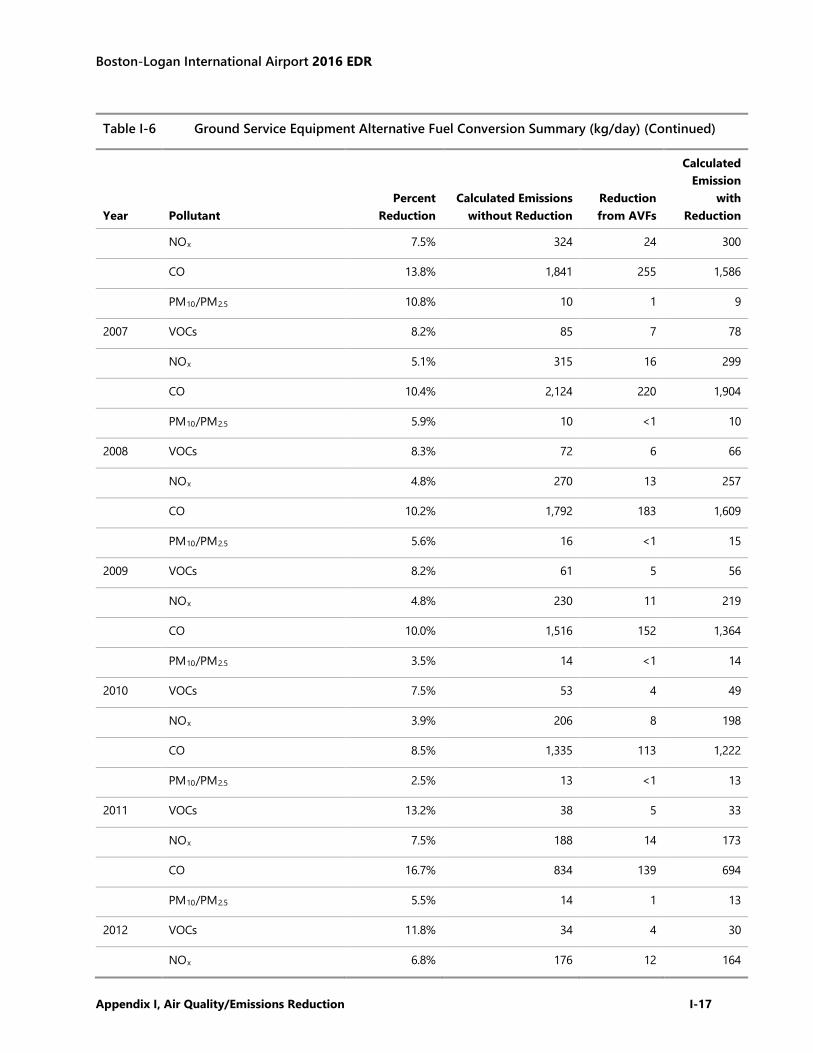
Boston-Logan International Airport 2016 EDR
Appendix I, Air Quality/Emissions Reduction I-17
Table I-6 Ground Service Equipment Alternative Fuel Conversion Summary (kg/day) (Continued)
Year Pollutant Percent
Reduction Calculated Emissions
without Reduction Reduction from AVFs
Calculated Emission
with Reduction
NOx 7.5% 324 24 300
CO 13.8% 1,841 255 1,586
PM10/PM2.5 10.8% 10 1 9
2007 VOCs 8.2% 85 7 78
NOx 5.1% 315 16 299
CO 10.4% 2,124 220 1,904
PM10/PM2.5 5.9% 10 <1 10
2008 VOCs 8.3% 72 6 66
NOx 4.8% 270 13 257
CO 10.2% 1,792 183 1,609
PM10/PM2.5 5.6% 16 <1 15
2009 VOCs 8.2% 61 5 56
NOx 4.8% 230 11 219
CO 10.0% 1,516 152 1,364
PM10/PM2.5 3.5% 14 <1 14
2010 VOCs 7.5% 53 4 49
NOx 3.9% 206 8 198
CO 8.5% 1,335 113 1,222
PM10/PM2.5 2.5% 13 <1 13
2011 VOCs 13.2% 38 5 33
NOx 7.5% 188 14 173
CO 16.7% 834 139 694
PM10/PM2.5 5.5% 14 1 13
2012 VOCs 11.8% 34 4 30
NOx 6.8% 176 12 164
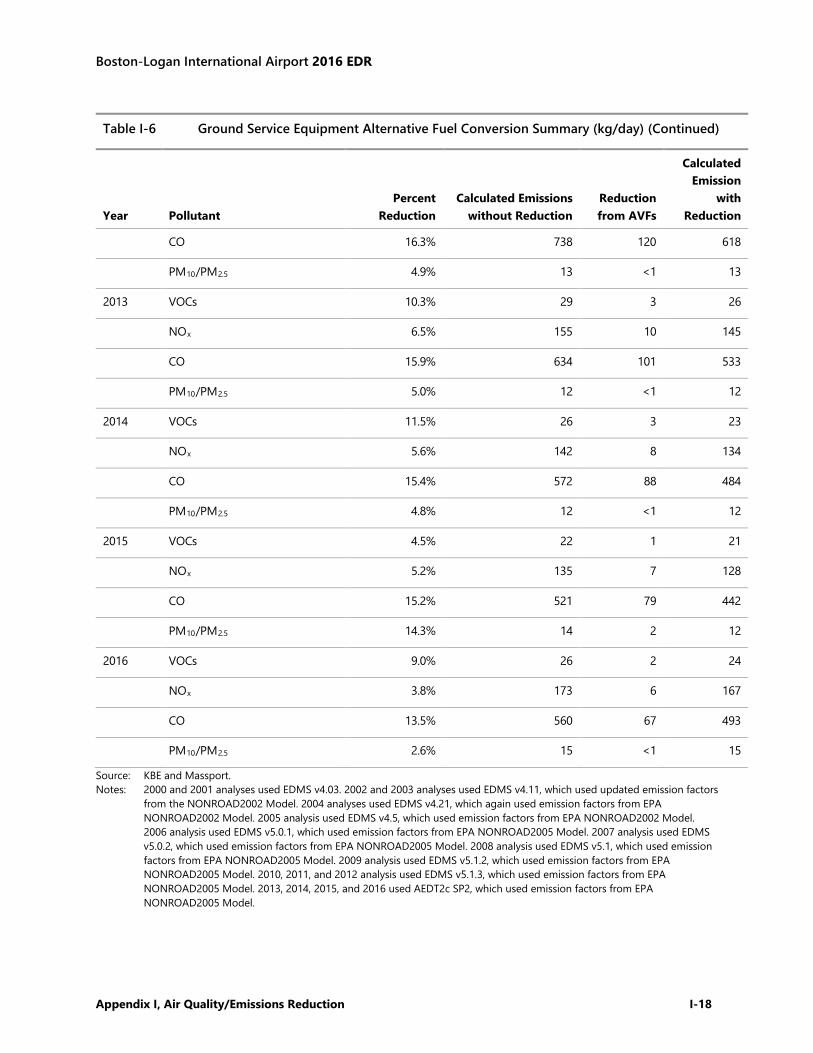
Boston-Logan International Airport 2016 EDR
Appendix I, Air Quality/Emissions Reduction I-18
Table I-6 Ground Service Equipment Alternative Fuel Conversion Summary (kg/day) (Continued)
Year Pollutant Percent
Reduction Calculated Emissions
without Reduction Reduction from AVFs
Calculated Emission
with Reduction
CO 16.3% 738 120 618
PM10/PM2.5 4.9% 13 <1 13
2013 VOCs 10.3% 29 3 26
NOx 6.5% 155 10 145
CO 15.9% 634 101 533
PM10/PM2.5 5.0% 12 <1 12
2014 VOCs 11.5% 26 3 23
NOx 5.6% 142 8 134
CO 15.4% 572 88 484
PM10/PM2.5 4.8% 12 <1 12
2015 VOCs 4.5% 22 1 21
NOx 5.2% 135 7 128
CO 15.2% 521 79 442
PM10/PM2.5 14.3% 14 2 12
2016 VOCs 9.0% 26 2 24
NOx 3.8% 173 6 167
CO 13.5% 560 67 493
PM10/PM2.5 2.6% 15 <1 15 Source: KBE and Massport. Notes: 2000 and 2001 analyses used EDMS v4.03. 2002 and 2003 analyses used EDMS v4.11, which used updated emission factors
from the NONROAD2002 Model. 2004 analyses used EDMS v4.21, which again used emission factors from EPA NONROAD2002 Model. 2005 analysis used EDMS v4.5, which used emission factors from EPA NONROAD2002 Model. 2006 analysis used EDMS v5.0.1, which used emission factors from EPA NONROAD2005 Model. 2007 analysis used EDMS v5.0.2, which used emission factors from EPA NONROAD2005 Model. 2008 analysis used EDMS v5.1, which used emission factors from EPA NONROAD2005 Model. 2009 analysis used EDMS v5.1.2, which used emission factors from EPA NONROAD2005 Model. 2010, 2011, and 2012 analysis used EDMS v5.1.3, which used emission factors from EPA NONROAD2005 Model. 2013, 2014, 2015, and 2016 used AEDT2c SP2, which used emission factors from EPA NONROAD2005 Model.

Boston-Logan International Airport 2016 EDR
Appendix I, Air Quality/Emissions Reduction I-19
Motor Vehicle Emissions
For the 2016 analysis, the motor vehicle emission factor model MOVES2014a was used. The resultant emission factors were multiplied by average daily vehicle miles to calculate daily emissions. The on-Airport traffic data are summarized in the vehicle miles traveled (VMT) analyses of Appendix G, Ground Access. Due to the new roadway configuration of the Ted Williams Tunnel, through-traffic no longer traverses Airport property. Therefore, as of 2003, emissions from these vehicles are no longer included as part of the Logan Airport emissions inventory. Further, MOVES2014a was used to obtain vehicle emissions at idle to estimate parking and curbside motor vehicle emissions. Idling emissions are determined for a unit of time and multiplied by total idling time to reach the associated emissions. The input and output files of MOVES2014a are included as Tables I-7 and I-8.
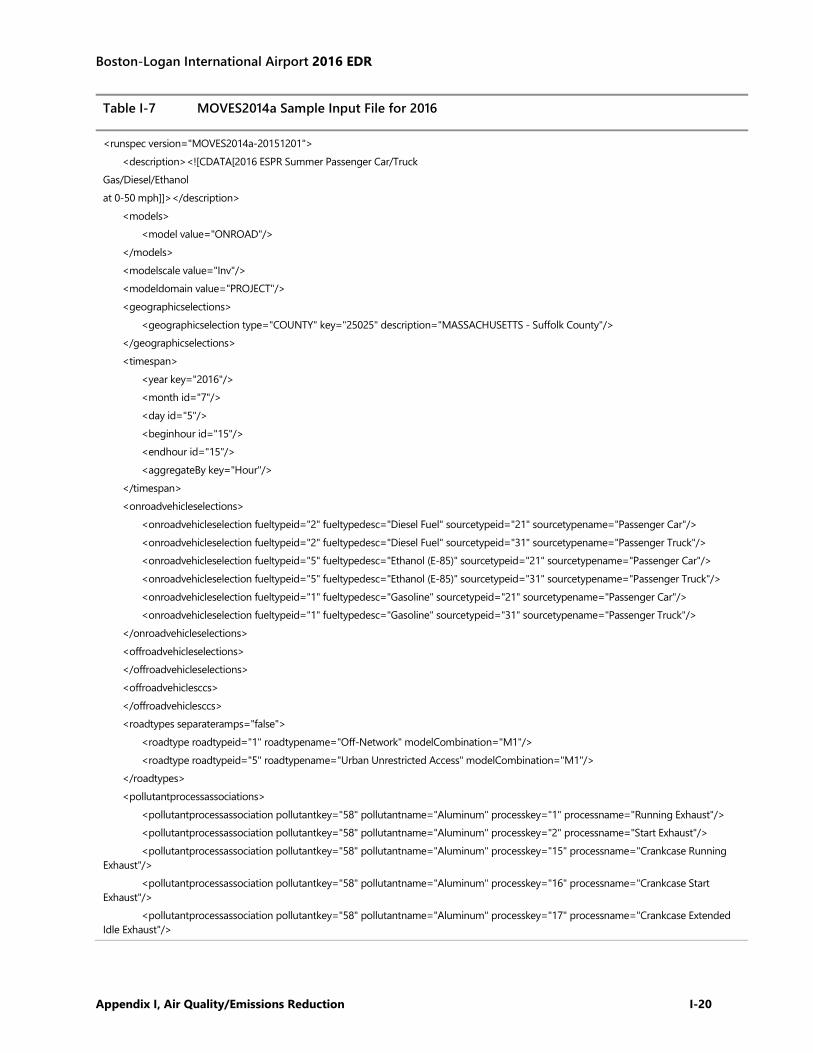
Boston-Logan International Airport 2016 EDR
Appendix I, Air Quality/Emissions Reduction I-20
Table I-7 MOVES2014a Sample Input File for 2016
<runspec version="MOVES2014a-20151201"> <description><![CDATA[2016 ESPR Summer Passenger Car/Truck Gas/Diesel/Ethanol at 0-50 mph]]></description> <models> <model value="ONROAD"/> </models> <modelscale value="Inv"/> <modeldomain value="PROJECT"/> <geographicselections> <geographicselection type="COUNTY" key="25025" description="MASSACHUSETTS - Suffolk County"/> </geographicselections> <timespan> <year key="2016"/> <month id="7"/> <day id="5"/> <beginhour id="15"/> <endhour id="15"/> <aggregateBy key="Hour"/> </timespan> <onroadvehicleselections> <onroadvehicleselection fueltypeid="2" fueltypedesc="Diesel Fuel" sourcetypeid="21" sourcetypename="Passenger Car"/> <onroadvehicleselection fueltypeid="2" fueltypedesc="Diesel Fuel" sourcetypeid="31" sourcetypename="Passenger Truck"/> <onroadvehicleselection fueltypeid="5" fueltypedesc="Ethanol (E-85)" sourcetypeid="21" sourcetypename="Passenger Car"/> <onroadvehicleselection fueltypeid="5" fueltypedesc="Ethanol (E-85)" sourcetypeid="31" sourcetypename="Passenger Truck"/> <onroadvehicleselection fueltypeid="1" fueltypedesc="Gasoline" sourcetypeid="21" sourcetypename="Passenger Car"/> <onroadvehicleselection fueltypeid="1" fueltypedesc="Gasoline" sourcetypeid="31" sourcetypename="Passenger Truck"/> </onroadvehicleselections> <offroadvehicleselections> </offroadvehicleselections> <offroadvehiclesccs> </offroadvehiclesccs> <roadtypes separateramps="false"> <roadtype roadtypeid="1" roadtypename="Off-Network" modelCombination="M1"/> <roadtype roadtypeid="5" roadtypename="Urban Unrestricted Access" modelCombination="M1"/> </roadtypes> <pollutantprocessassociations> <pollutantprocessassociation pollutantkey="58" pollutantname="Aluminum" processkey="1" processname="Running Exhaust"/> <pollutantprocessassociation pollutantkey="58" pollutantname="Aluminum" processkey="2" processname="Start Exhaust"/> <pollutantprocessassociation pollutantkey="58" pollutantname="Aluminum" processkey="15" processname="Crankcase Running Exhaust"/> <pollutantprocessassociation pollutantkey="58" pollutantname="Aluminum" processkey="16" processname="Crankcase Start Exhaust"/> <pollutantprocessassociation pollutantkey="58" pollutantname="Aluminum" processkey="17" processname="Crankcase Extended Idle Exhaust"/>
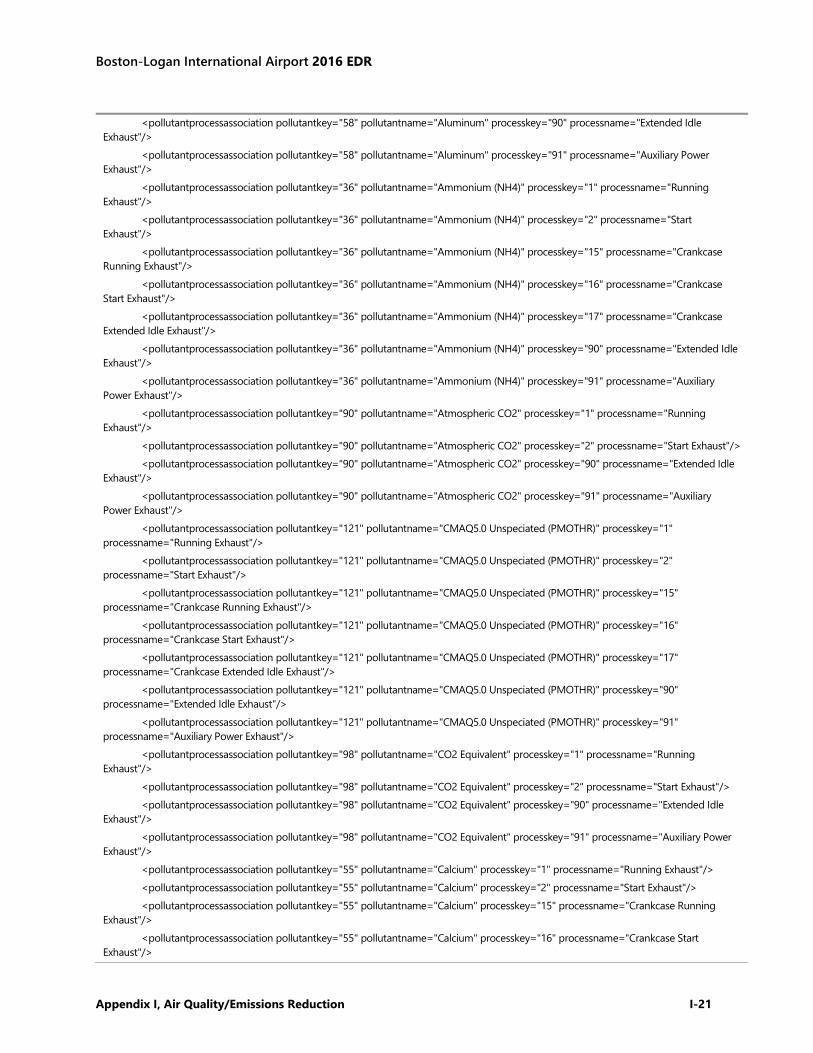
Boston-Logan International Airport 2016 EDR
Appendix I, Air Quality/Emissions Reduction I-21
<pollutantprocessassociation pollutantkey="58" pollutantname="Aluminum" processkey="90" processname="Extended Idle Exhaust"/> <pollutantprocessassociation pollutantkey="58" pollutantname="Aluminum" processkey="91" processname="Auxiliary Power Exhaust"/> <pollutantprocessassociation pollutantkey="36" pollutantname="Ammonium (NH4)" processkey="1" processname="Running Exhaust"/> <pollutantprocessassociation pollutantkey="36" pollutantname="Ammonium (NH4)" processkey="2" processname="Start Exhaust"/> <pollutantprocessassociation pollutantkey="36" pollutantname="Ammonium (NH4)" processkey="15" processname="Crankcase Running Exhaust"/> <pollutantprocessassociation pollutantkey="36" pollutantname="Ammonium (NH4)" processkey="16" processname="Crankcase Start Exhaust"/> <pollutantprocessassociation pollutantkey="36" pollutantname="Ammonium (NH4)" processkey="17" processname="Crankcase Extended Idle Exhaust"/> <pollutantprocessassociation pollutantkey="36" pollutantname="Ammonium (NH4)" processkey="90" processname="Extended Idle Exhaust"/> <pollutantprocessassociation pollutantkey="36" pollutantname="Ammonium (NH4)" processkey="91" processname="Auxiliary Power Exhaust"/> <pollutantprocessassociation pollutantkey="90" pollutantname="Atmospheric CO2" processkey="1" processname="Running Exhaust"/> <pollutantprocessassociation pollutantkey="90" pollutantname="Atmospheric CO2" processkey="2" processname="Start Exhaust"/> <pollutantprocessassociation pollutantkey="90" pollutantname="Atmospheric CO2" processkey="90" processname="Extended Idle Exhaust"/> <pollutantprocessassociation pollutantkey="90" pollutantname="Atmospheric CO2" processkey="91" processname="Auxiliary Power Exhaust"/> <pollutantprocessassociation pollutantkey="121" pollutantname="CMAQ5.0 Unspeciated (PMOTHR)" processkey="1" processname="Running Exhaust"/> <pollutantprocessassociation pollutantkey="121" pollutantname="CMAQ5.0 Unspeciated (PMOTHR)" processkey="2" processname="Start Exhaust"/> <pollutantprocessassociation pollutantkey="121" pollutantname="CMAQ5.0 Unspeciated (PMOTHR)" processkey="15" processname="Crankcase Running Exhaust"/> <pollutantprocessassociation pollutantkey="121" pollutantname="CMAQ5.0 Unspeciated (PMOTHR)" processkey="16" processname="Crankcase Start Exhaust"/> <pollutantprocessassociation pollutantkey="121" pollutantname="CMAQ5.0 Unspeciated (PMOTHR)" processkey="17" processname="Crankcase Extended Idle Exhaust"/> <pollutantprocessassociation pollutantkey="121" pollutantname="CMAQ5.0 Unspeciated (PMOTHR)" processkey="90" processname="Extended Idle Exhaust"/> <pollutantprocessassociation pollutantkey="121" pollutantname="CMAQ5.0 Unspeciated (PMOTHR)" processkey="91" processname="Auxiliary Power Exhaust"/> <pollutantprocessassociation pollutantkey="98" pollutantname="CO2 Equivalent" processkey="1" processname="Running Exhaust"/> <pollutantprocessassociation pollutantkey="98" pollutantname="CO2 Equivalent" processkey="2" processname="Start Exhaust"/> <pollutantprocessassociation pollutantkey="98" pollutantname="CO2 Equivalent" processkey="90" processname="Extended Idle Exhaust"/> <pollutantprocessassociation pollutantkey="98" pollutantname="CO2 Equivalent" processkey="91" processname="Auxiliary Power Exhaust"/> <pollutantprocessassociation pollutantkey="55" pollutantname="Calcium" processkey="1" processname="Running Exhaust"/> <pollutantprocessassociation pollutantkey="55" pollutantname="Calcium" processkey="2" processname="Start Exhaust"/> <pollutantprocessassociation pollutantkey="55" pollutantname="Calcium" processkey="15" processname="Crankcase Running Exhaust"/> <pollutantprocessassociation pollutantkey="55" pollutantname="Calcium" processkey="16" processname="Crankcase Start Exhaust"/>
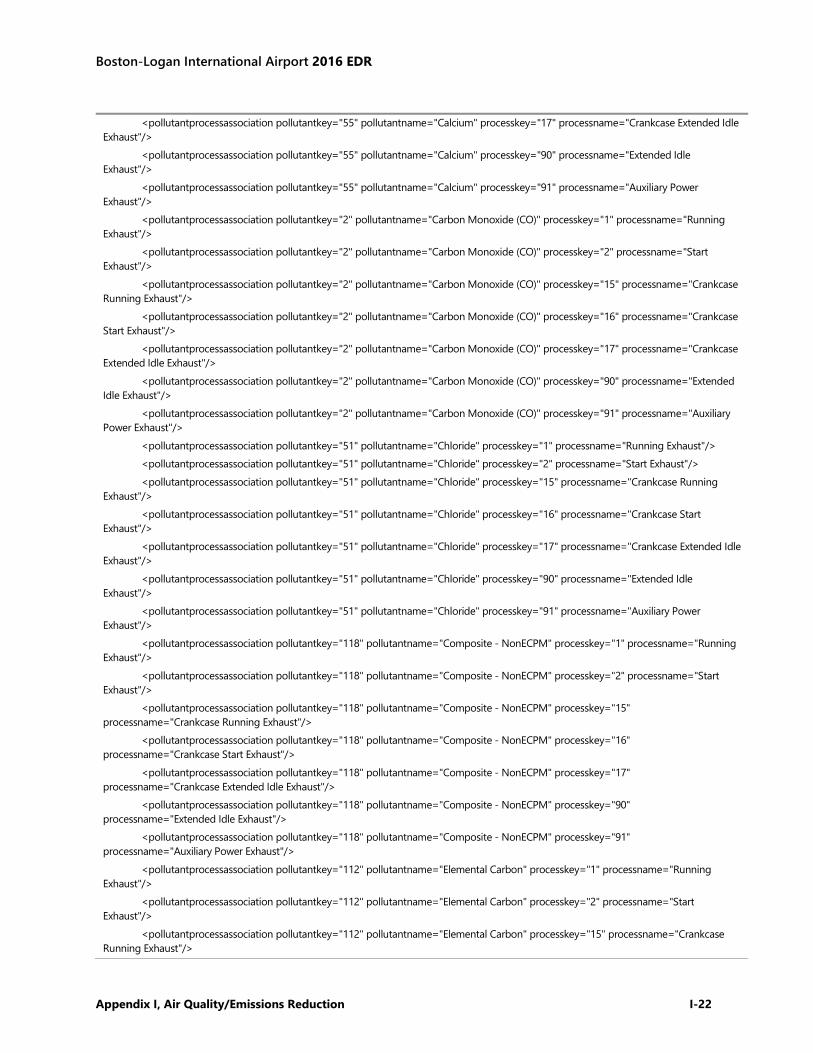
Boston-Logan International Airport 2016 EDR
Appendix I, Air Quality/Emissions Reduction I-22
<pollutantprocessassociation pollutantkey="55" pollutantname="Calcium" processkey="17" processname="Crankcase Extended Idle Exhaust"/> <pollutantprocessassociation pollutantkey="55" pollutantname="Calcium" processkey="90" processname="Extended Idle Exhaust"/> <pollutantprocessassociation pollutantkey="55" pollutantname="Calcium" processkey="91" processname="Auxiliary Power Exhaust"/> <pollutantprocessassociation pollutantkey="2" pollutantname="Carbon Monoxide (CO)" processkey="1" processname="Running Exhaust"/> <pollutantprocessassociation pollutantkey="2" pollutantname="Carbon Monoxide (CO)" processkey="2" processname="Start Exhaust"/> <pollutantprocessassociation pollutantkey="2" pollutantname="Carbon Monoxide (CO)" processkey="15" processname="Crankcase Running Exhaust"/> <pollutantprocessassociation pollutantkey="2" pollutantname="Carbon Monoxide (CO)" processkey="16" processname="Crankcase Start Exhaust"/> <pollutantprocessassociation pollutantkey="2" pollutantname="Carbon Monoxide (CO)" processkey="17" processname="Crankcase Extended Idle Exhaust"/> <pollutantprocessassociation pollutantkey="2" pollutantname="Carbon Monoxide (CO)" processkey="90" processname="Extended Idle Exhaust"/> <pollutantprocessassociation pollutantkey="2" pollutantname="Carbon Monoxide (CO)" processkey="91" processname="Auxiliary Power Exhaust"/> <pollutantprocessassociation pollutantkey="51" pollutantname="Chloride" processkey="1" processname="Running Exhaust"/> <pollutantprocessassociation pollutantkey="51" pollutantname="Chloride" processkey="2" processname="Start Exhaust"/> <pollutantprocessassociation pollutantkey="51" pollutantname="Chloride" processkey="15" processname="Crankcase Running Exhaust"/> <pollutantprocessassociation pollutantkey="51" pollutantname="Chloride" processkey="16" processname="Crankcase Start Exhaust"/> <pollutantprocessassociation pollutantkey="51" pollutantname="Chloride" processkey="17" processname="Crankcase Extended Idle Exhaust"/> <pollutantprocessassociation pollutantkey="51" pollutantname="Chloride" processkey="90" processname="Extended Idle Exhaust"/> <pollutantprocessassociation pollutantkey="51" pollutantname="Chloride" processkey="91" processname="Auxiliary Power Exhaust"/> <pollutantprocessassociation pollutantkey="118" pollutantname="Composite - NonECPM" processkey="1" processname="Running Exhaust"/> <pollutantprocessassociation pollutantkey="118" pollutantname="Composite - NonECPM" processkey="2" processname="Start Exhaust"/> <pollutantprocessassociation pollutantkey="118" pollutantname="Composite - NonECPM" processkey="15" processname="Crankcase Running Exhaust"/> <pollutantprocessassociation pollutantkey="118" pollutantname="Composite - NonECPM" processkey="16" processname="Crankcase Start Exhaust"/> <pollutantprocessassociation pollutantkey="118" pollutantname="Composite - NonECPM" processkey="17" processname="Crankcase Extended Idle Exhaust"/> <pollutantprocessassociation pollutantkey="118" pollutantname="Composite - NonECPM" processkey="90" processname="Extended Idle Exhaust"/> <pollutantprocessassociation pollutantkey="118" pollutantname="Composite - NonECPM" processkey="91" processname="Auxiliary Power Exhaust"/> <pollutantprocessassociation pollutantkey="112" pollutantname="Elemental Carbon" processkey="1" processname="Running Exhaust"/> <pollutantprocessassociation pollutantkey="112" pollutantname="Elemental Carbon" processkey="2" processname="Start Exhaust"/> <pollutantprocessassociation pollutantkey="112" pollutantname="Elemental Carbon" processkey="15" processname="Crankcase Running Exhaust"/>
Boston-Logan International Airport 2016 EDR
Appendix I, Air Quality/Emissions Reduction I-23
<pollutantprocessassociation pollutantkey="112" pollutantname="Elemental Carbon" processkey="16" processname="Crankcase Start Exhaust"/> <pollutantprocessassociation pollutantkey="112" pollutantname="Elemental Carbon" processkey="17" processname="Crankcase Extended Idle Exhaust"/> <pollutantprocessassociation pollutantkey="112" pollutantname="Elemental Carbon" processkey="90" processname="Extended Idle Exhaust"/> <pollutantprocessassociation pollutantkey="112" pollutantname="Elemental Carbon" processkey="91" processname="Auxiliary Power Exhaust"/> <pollutantprocessassociation pollutantkey="119" pollutantname="H2O (aerosol)" processkey="1" processname="Running Exhaust"/> <pollutantprocessassociation pollutantkey="119" pollutantname="H2O (aerosol)" processkey="2" processname="Start Exhaust"/> <pollutantprocessassociation pollutantkey="119" pollutantname="H2O (aerosol)" processkey="15" processname="Crankcase Running Exhaust"/> <pollutantprocessassociation pollutantkey="119" pollutantname="H2O (aerosol)" processkey="16" processname="Crankcase Start Exhaust"/> <pollutantprocessassociation pollutantkey="119" pollutantname="H2O (aerosol)" processkey="17" processname="Crankcase Extended Idle Exhaust"/> <pollutantprocessassociation pollutantkey="119" pollutantname="H2O (aerosol)" processkey="90" processname="Extended Idle Exhaust"/> <pollutantprocessassociation pollutantkey="119" pollutantname="H2O (aerosol)" processkey="91" processname="Auxiliary Power Exhaust"/> <pollutantprocessassociation pollutantkey="59" pollutantname="Iron" processkey="1" processname="Running Exhaust"/> <pollutantprocessassociation pollutantkey="59" pollutantname="Iron" processkey="2" processname="Start Exhaust"/> <pollutantprocessassociation pollutantkey="59" pollutantname="Iron" processkey="15" processname="Crankcase Running Exhaust"/> <pollutantprocessassociation pollutantkey="59" pollutantname="Iron" processkey="16" processname="Crankcase Start Exhaust"/> <pollutantprocessassociation pollutantkey="59" pollutantname="Iron" processkey="17" processname="Crankcase Extended Idle Exhaust"/> <pollutantprocessassociation pollutantkey="59" pollutantname="Iron" processkey="90" processname="Extended Idle Exhaust"/> <pollutantprocessassociation pollutantkey="59" pollutantname="Iron" processkey="91" processname="Auxiliary Power Exhaust"/> <pollutantprocessassociation pollutantkey="54" pollutantname="Magnesium" processkey="1" processname="Running Exhaust"/> <pollutantprocessassociation pollutantkey="54" pollutantname="Magnesium" processkey="2" processname="Start Exhaust"/> <pollutantprocessassociation pollutantkey="54" pollutantname="Magnesium" processkey="15" processname="Crankcase Running Exhaust"/> <pollutantprocessassociation pollutantkey="54" pollutantname="Magnesium" processkey="16" processname="Crankcase Start Exhaust"/> <pollutantprocessassociation pollutantkey="54" pollutantname="Magnesium" processkey="17" processname="Crankcase Extended Idle Exhaust"/> <pollutantprocessassociation pollutantkey="54" pollutantname="Magnesium" processkey="90" processname="Extended Idle Exhaust"/> <pollutantprocessassociation pollutantkey="54" pollutantname="Magnesium" processkey="91" processname="Auxiliary Power Exhaust"/> <pollutantprocessassociation pollutantkey="66" pollutantname="Manganese Compounds" processkey="1" processname="Running Exhaust"/> <pollutantprocessassociation pollutantkey="5" pollutantname="Methane (CH4)" processkey="1" processname="Running Exhaust"/> <pollutantprocessassociation pollutantkey="5" pollutantname="Methane (CH4)" processkey="2" processname="Start Exhaust"/> <pollutantprocessassociation pollutantkey="5" pollutantname="Methane (CH4)" processkey="15" processname="Crankcase Running Exhaust"/> <pollutantprocessassociation pollutantkey="5" pollutantname="Methane (CH4)" processkey="16" processname="Crankcase Start Exhaust"/> <pollutantprocessassociation pollutantkey="5" pollutantname="Methane (CH4)" processkey="17" processname="Crankcase Extended Idle Exhaust"/>
Boston-Logan International Airport 2016 EDR
Appendix I, Air Quality/Emissions Reduction I-24
<pollutantprocessassociation pollutantkey="5" pollutantname="Methane (CH4)" processkey="90" processname="Extended Idle Exhaust"/> <pollutantprocessassociation pollutantkey="5" pollutantname="Methane (CH4)" processkey="91" processname="Auxiliary Power Exhaust"/> <pollutantprocessassociation pollutantkey="35" pollutantname="Nitrate (NO3)" processkey="1" processname="Running Exhaust"/> <pollutantprocessassociation pollutantkey="35" pollutantname="Nitrate (NO3)" processkey="2" processname="Start Exhaust"/> <pollutantprocessassociation pollutantkey="35" pollutantname="Nitrate (NO3)" processkey="15" processname="Crankcase Running Exhaust"/> <pollutantprocessassociation pollutantkey="35" pollutantname="Nitrate (NO3)" processkey="16" processname="Crankcase Start Exhaust"/> <pollutantprocessassociation pollutantkey="35" pollutantname="Nitrate (NO3)" processkey="17" processname="Crankcase Extended Idle Exhaust"/> <pollutantprocessassociation pollutantkey="35" pollutantname="Nitrate (NO3)" processkey="90" processname="Extended Idle Exhaust"/> <pollutantprocessassociation pollutantkey="35" pollutantname="Nitrate (NO3)" processkey="91" processname="Auxiliary Power Exhaust"/> <pollutantprocessassociation pollutantkey="6" pollutantname="Nitrous Oxide (N2O)" processkey="1" processname="Running Exhaust"/> <pollutantprocessassociation pollutantkey="6" pollutantname="Nitrous Oxide (N2O)" processkey="2" processname="Start Exhaust"/> <pollutantprocessassociation pollutantkey="6" pollutantname="Nitrous Oxide (N2O)" processkey="15" processname="Crankcase Running Exhaust"/> <pollutantprocessassociation pollutantkey="6" pollutantname="Nitrous Oxide (N2O)" processkey="16" processname="Crankcase Start Exhaust"/> <pollutantprocessassociation pollutantkey="79" pollutantname="Non-Methane Hydrocarbons" processkey="1" processname="Running Exhaust"/> <pollutantprocessassociation pollutantkey="79" pollutantname="Non-Methane Hydrocarbons" processkey="2" processname="Start Exhaust"/> <pollutantprocessassociation pollutantkey="79" pollutantname="Non-Methane Hydrocarbons" processkey="11" processname="Evap Permeation"/> <pollutantprocessassociation pollutantkey="79" pollutantname="Non-Methane Hydrocarbons" processkey="13" processname="Evap Fuel Leaks"/> <pollutantprocessassociation pollutantkey="79" pollutantname="Non-Methane Hydrocarbons" processkey="90" processname="Extended Idle Exhaust"/> <pollutantprocessassociation pollutantkey="79" pollutantname="Non-Methane Hydrocarbons" processkey="91" processname="Auxiliary Power Exhaust"/> <pollutantprocessassociation pollutantkey="122" pollutantname="Non-carbon Organic Matter (NCOM)" processkey="1" processname="Running Exhaust"/> <pollutantprocessassociation pollutantkey="122" pollutantname="Non-carbon Organic Matter (NCOM)" processkey="2" processname="Start Exhaust"/> <pollutantprocessassociation pollutantkey="122" pollutantname="Non-carbon Organic Matter (NCOM)" processkey="15" processname="Crankcase Running Exhaust"/> <pollutantprocessassociation pollutantkey="122" pollutantname="Non-carbon Organic Matter (NCOM)" processkey="16" processname="Crankcase Start Exhaust"/> <pollutantprocessassociation pollutantkey="122" pollutantname="Non-carbon Organic Matter (NCOM)" processkey="17" processname="Crankcase Extended Idle Exhaust"/> <pollutantprocessassociation pollutantkey="122" pollutantname="Non-carbon Organic Matter (NCOM)" processkey="90" processname="Extended Idle Exhaust"/> <pollutantprocessassociation pollutantkey="122" pollutantname="Non-carbon Organic Matter (NCOM)" processkey="91" processname="Auxiliary Power Exhaust"/> <pollutantprocessassociation pollutantkey="111" pollutantname="Organic Carbon" processkey="1" processname="Running Exhaust"/> <pollutantprocessassociation pollutantkey="111" pollutantname="Organic Carbon" processkey="2" processname="Start Exhaust"/>
Boston-Logan International Airport 2016 EDR
Appendix I, Air Quality/Emissions Reduction I-25
<pollutantprocessassociation pollutantkey="111" pollutantname="Organic Carbon" processkey="15" processname="Crankcase Running Exhaust"/> <pollutantprocessassociation pollutantkey="111" pollutantname="Organic Carbon" processkey="16" processname="Crankcase Start Exhaust"/> <pollutantprocessassociation pollutantkey="111" pollutantname="Organic Carbon" processkey="17" processname="Crankcase Extended Idle Exhaust"/> <pollutantprocessassociation pollutantkey="111" pollutantname="Organic Carbon" processkey="90" processname="Extended Idle Exhaust"/> <pollutantprocessassociation pollutantkey="111" pollutantname="Organic Carbon" processkey="91" processname="Auxiliary Power Exhaust"/> <pollutantprocessassociation pollutantkey="3" pollutantname="Oxides of Nitrogen (NOx)" processkey="1" processname="Running Exhaust"/> <pollutantprocessassociation pollutantkey="3" pollutantname="Oxides of Nitrogen (NOx)" processkey="2" processname="Start Exhaust"/> <pollutantprocessassociation pollutantkey="3" pollutantname="Oxides of Nitrogen (NOx)" processkey="15" processname="Crankcase Running Exhaust"/> <pollutantprocessassociation pollutantkey="3" pollutantname="Oxides of Nitrogen (NOx)" processkey="16" processname="Crankcase Start Exhaust"/> <pollutantprocessassociation pollutantkey="3" pollutantname="Oxides of Nitrogen (NOx)" processkey="17" processname="Crankcase Extended Idle Exhaust"/> <pollutantprocessassociation pollutantkey="3" pollutantname="Oxides of Nitrogen (NOx)" processkey="90" processname="Extended Idle Exhaust"/> <pollutantprocessassociation pollutantkey="3" pollutantname="Oxides of Nitrogen (NOx)" processkey="91" processname="Auxiliary Power Exhaust"/> <pollutantprocessassociation pollutantkey="53" pollutantname="Potassium" processkey="1" processname="Running Exhaust"/> <pollutantprocessassociation pollutantkey="53" pollutantname="Potassium" processkey="2" processname="Start Exhaust"/> <pollutantprocessassociation pollutantkey="53" pollutantname="Potassium" processkey="15" processname="Crankcase Running Exhaust"/> <pollutantprocessassociation pollutantkey="53" pollutantname="Potassium" processkey="16" processname="Crankcase Start Exhaust"/> <pollutantprocessassociation pollutantkey="53" pollutantname="Potassium" processkey="17" processname="Crankcase Extended Idle Exhaust"/> <pollutantprocessassociation pollutantkey="53" pollutantname="Potassium" processkey="90" processname="Extended Idle Exhaust"/> <pollutantprocessassociation pollutantkey="53" pollutantname="Potassium" processkey="91" processname="Auxiliary Power Exhaust"/> <pollutantprocessassociation pollutantkey="100" pollutantname="Primary Exhaust PM10 - Total" processkey="1" processname="Running Exhaust"/> <pollutantprocessassociation pollutantkey="100" pollutantname="Primary Exhaust PM10 - Total" processkey="2" processname="Start Exhaust"/> <pollutantprocessassociation pollutantkey="100" pollutantname="Primary Exhaust PM10 - Total" processkey="15" processname="Crankcase Running Exhaust"/> <pollutantprocessassociation pollutantkey="100" pollutantname="Primary Exhaust PM10 - Total" processkey="16" processname="Crankcase Start Exhaust"/> <pollutantprocessassociation pollutantkey="100" pollutantname="Primary Exhaust PM10 - Total" processkey="17" processname="Crankcase Extended Idle Exhaust"/> <pollutantprocessassociation pollutantkey="100" pollutantname="Primary Exhaust PM10 - Total" processkey="90" processname="Extended Idle Exhaust"/> <pollutantprocessassociation pollutantkey="100" pollutantname="Primary Exhaust PM10 - Total" processkey="91" processname="Auxiliary Power Exhaust"/> <pollutantprocessassociation pollutantkey="110" pollutantname="Primary Exhaust PM2.5 - Total" processkey="1" processname="Running Exhaust"/>
Boston-Logan International Airport 2016 EDR
Appendix I, Air Quality/Emissions Reduction I-26
<pollutantprocessassociation pollutantkey="110" pollutantname="Primary Exhaust PM2.5 - Total" processkey="2" processname="Start Exhaust"/> <pollutantprocessassociation pollutantkey="110" pollutantname="Primary Exhaust PM2.5 - Total" processkey="15" processname="Crankcase Running Exhaust"/> <pollutantprocessassociation pollutantkey="110" pollutantname="Primary Exhaust PM2.5 - Total" processkey="16" processname="Crankcase Start Exhaust"/> <pollutantprocessassociation pollutantkey="110" pollutantname="Primary Exhaust PM2.5 - Total" processkey="17" processname="Crankcase Extended Idle Exhaust"/> <pollutantprocessassociation pollutantkey="110" pollutantname="Primary Exhaust PM2.5 - Total" processkey="90" processname="Extended Idle Exhaust"/> <pollutantprocessassociation pollutantkey="110" pollutantname="Primary Exhaust PM2.5 - Total" processkey="91" processname="Auxiliary Power Exhaust"/> <pollutantprocessassociation pollutantkey="106" pollutantname="Primary PM10 - Brakewear Particulate" processkey="9" processname="Brakewear"/> <pollutantprocessassociation pollutantkey="107" pollutantname="Primary PM10 - Tirewear Particulate" processkey="10" processname="Tirewear"/> <pollutantprocessassociation pollutantkey="116" pollutantname="Primary PM2.5 - Brakewear Particulate" processkey="9" processname="Brakewear"/> <pollutantprocessassociation pollutantkey="117" pollutantname="Primary PM2.5 - Tirewear Particulate" processkey="10" processname="Tirewear"/> <pollutantprocessassociation pollutantkey="57" pollutantname="Silicon" processkey="1" processname="Running Exhaust"/> <pollutantprocessassociation pollutantkey="57" pollutantname="Silicon" processkey="2" processname="Start Exhaust"/> <pollutantprocessassociation pollutantkey="57" pollutantname="Silicon" processkey="15" processname="Crankcase Running Exhaust"/> <pollutantprocessassociation pollutantkey="57" pollutantname="Silicon" processkey="16" processname="Crankcase Start Exhaust"/> <pollutantprocessassociation pollutantkey="57" pollutantname="Silicon" processkey="17" processname="Crankcase Extended Idle Exhaust"/> <pollutantprocessassociation pollutantkey="57" pollutantname="Silicon" processkey="90" processname="Extended Idle Exhaust"/> <pollutantprocessassociation pollutantkey="57" pollutantname="Silicon" processkey="91" processname="Auxiliary Power Exhaust"/> <pollutantprocessassociation pollutantkey="52" pollutantname="Sodium" processkey="1" processname="Running Exhaust"/> <pollutantprocessassociation pollutantkey="52" pollutantname="Sodium" processkey="2" processname="Start Exhaust"/> <pollutantprocessassociation pollutantkey="52" pollutantname="Sodium" processkey="15" processname="Crankcase Running Exhaust"/> <pollutantprocessassociation pollutantkey="52" pollutantname="Sodium" processkey="16" processname="Crankcase Start Exhaust"/> <pollutantprocessassociation pollutantkey="52" pollutantname="Sodium" processkey="17" processname="Crankcase Extended Idle Exhaust"/> <pollutantprocessassociation pollutantkey="52" pollutantname="Sodium" processkey="90" processname="Extended Idle Exhaust"/> <pollutantprocessassociation pollutantkey="52" pollutantname="Sodium" processkey="91" processname="Auxiliary Power Exhaust"/> <pollutantprocessassociation pollutantkey="115" pollutantname="Sulfate Particulate" processkey="1" processname="Running Exhaust"/> <pollutantprocessassociation pollutantkey="115" pollutantname="Sulfate Particulate" processkey="2" processname="Start Exhaust"/> <pollutantprocessassociation pollutantkey="115" pollutantname="Sulfate Particulate" processkey="15" processname="Crankcase Running Exhaust"/> <pollutantprocessassociation pollutantkey="115" pollutantname="Sulfate Particulate" processkey="16" processname="Crankcase Start Exhaust"/> <pollutantprocessassociation pollutantkey="115" pollutantname="Sulfate Particulate" processkey="17" processname="Crankcase Extended Idle Exhaust"/>
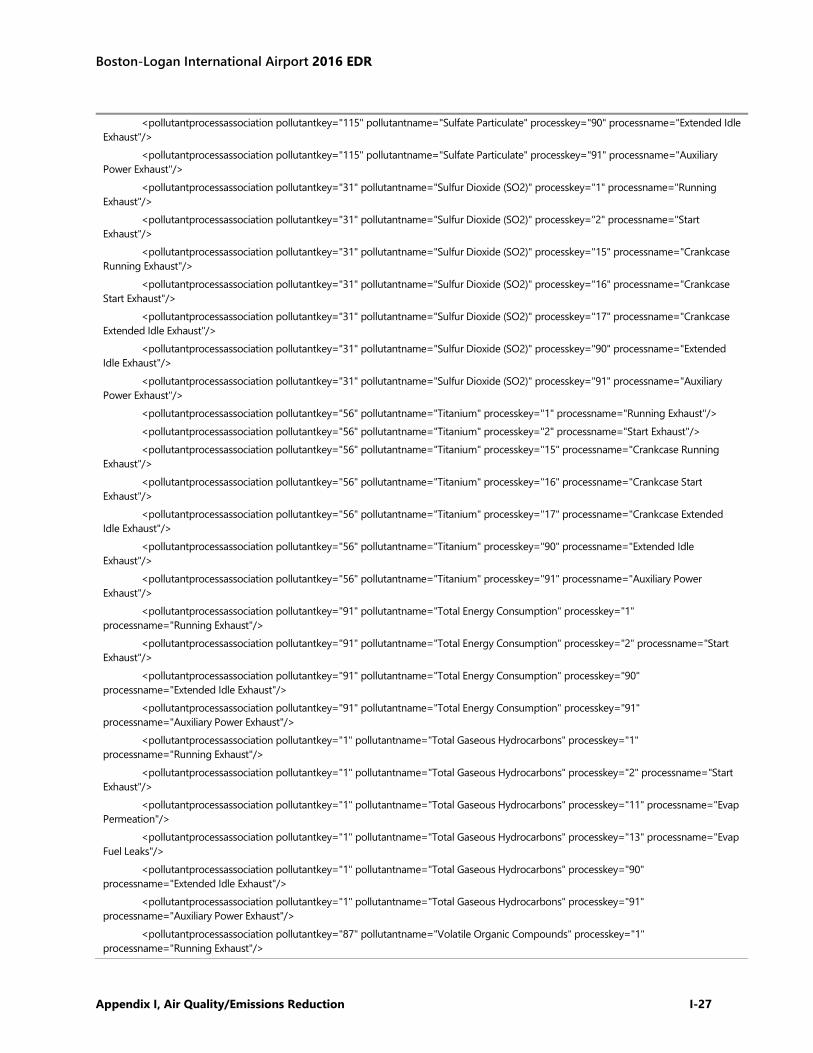
Boston-Logan International Airport 2016 EDR
Appendix I, Air Quality/Emissions Reduction I-27
<pollutantprocessassociation pollutantkey="115" pollutantname="Sulfate Particulate" processkey="90" processname="Extended Idle Exhaust"/> <pollutantprocessassociation pollutantkey="115" pollutantname="Sulfate Particulate" processkey="91" processname="Auxiliary Power Exhaust"/> <pollutantprocessassociation pollutantkey="31" pollutantname="Sulfur Dioxide (SO2)" processkey="1" processname="Running Exhaust"/> <pollutantprocessassociation pollutantkey="31" pollutantname="Sulfur Dioxide (SO2)" processkey="2" processname="Start Exhaust"/> <pollutantprocessassociation pollutantkey="31" pollutantname="Sulfur Dioxide (SO2)" processkey="15" processname="Crankcase Running Exhaust"/> <pollutantprocessassociation pollutantkey="31" pollutantname="Sulfur Dioxide (SO2)" processkey="16" processname="Crankcase Start Exhaust"/> <pollutantprocessassociation pollutantkey="31" pollutantname="Sulfur Dioxide (SO2)" processkey="17" processname="Crankcase Extended Idle Exhaust"/> <pollutantprocessassociation pollutantkey="31" pollutantname="Sulfur Dioxide (SO2)" processkey="90" processname="Extended Idle Exhaust"/> <pollutantprocessassociation pollutantkey="31" pollutantname="Sulfur Dioxide (SO2)" processkey="91" processname="Auxiliary Power Exhaust"/> <pollutantprocessassociation pollutantkey="56" pollutantname="Titanium" processkey="1" processname="Running Exhaust"/> <pollutantprocessassociation pollutantkey="56" pollutantname="Titanium" processkey="2" processname="Start Exhaust"/> <pollutantprocessassociation pollutantkey="56" pollutantname="Titanium" processkey="15" processname="Crankcase Running Exhaust"/> <pollutantprocessassociation pollutantkey="56" pollutantname="Titanium" processkey="16" processname="Crankcase Start Exhaust"/> <pollutantprocessassociation pollutantkey="56" pollutantname="Titanium" processkey="17" processname="Crankcase Extended Idle Exhaust"/> <pollutantprocessassociation pollutantkey="56" pollutantname="Titanium" processkey="90" processname="Extended Idle Exhaust"/> <pollutantprocessassociation pollutantkey="56" pollutantname="Titanium" processkey="91" processname="Auxiliary Power Exhaust"/> <pollutantprocessassociation pollutantkey="91" pollutantname="Total Energy Consumption" processkey="1" processname="Running Exhaust"/> <pollutantprocessassociation pollutantkey="91" pollutantname="Total Energy Consumption" processkey="2" processname="Start Exhaust"/> <pollutantprocessassociation pollutantkey="91" pollutantname="Total Energy Consumption" processkey="90" processname="Extended Idle Exhaust"/> <pollutantprocessassociation pollutantkey="91" pollutantname="Total Energy Consumption" processkey="91" processname="Auxiliary Power Exhaust"/> <pollutantprocessassociation pollutantkey="1" pollutantname="Total Gaseous Hydrocarbons" processkey="1" processname="Running Exhaust"/> <pollutantprocessassociation pollutantkey="1" pollutantname="Total Gaseous Hydrocarbons" processkey="2" processname="Start Exhaust"/> <pollutantprocessassociation pollutantkey="1" pollutantname="Total Gaseous Hydrocarbons" processkey="11" processname="Evap Permeation"/> <pollutantprocessassociation pollutantkey="1" pollutantname="Total Gaseous Hydrocarbons" processkey="13" processname="Evap Fuel Leaks"/> <pollutantprocessassociation pollutantkey="1" pollutantname="Total Gaseous Hydrocarbons" processkey="90" processname="Extended Idle Exhaust"/> <pollutantprocessassociation pollutantkey="1" pollutantname="Total Gaseous Hydrocarbons" processkey="91" processname="Auxiliary Power Exhaust"/> <pollutantprocessassociation pollutantkey="87" pollutantname="Volatile Organic Compounds" processkey="1" processname="Running Exhaust"/>
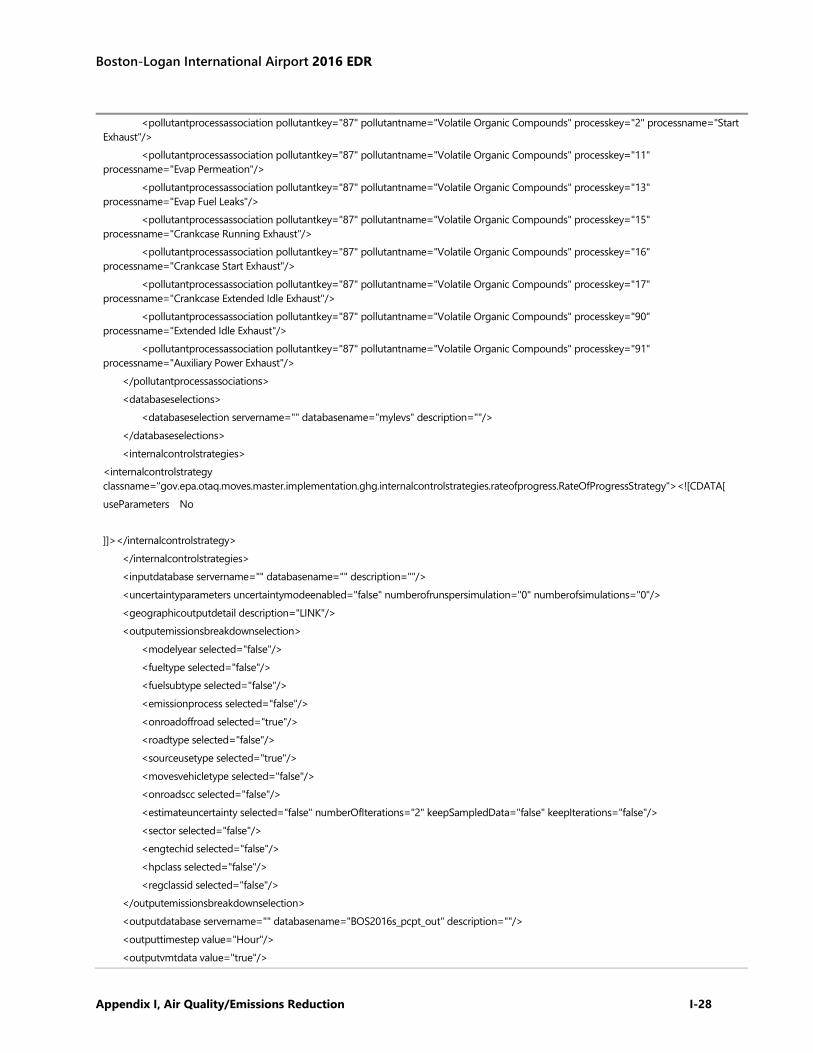
Boston-Logan International Airport 2016 EDR
Appendix I, Air Quality/Emissions Reduction I-28
<pollutantprocessassociation pollutantkey="87" pollutantname="Volatile Organic Compounds" processkey="2" processname="Start Exhaust"/> <pollutantprocessassociation pollutantkey="87" pollutantname="Volatile Organic Compounds" processkey="11" processname="Evap Permeation"/> <pollutantprocessassociation pollutantkey="87" pollutantname="Volatile Organic Compounds" processkey="13" processname="Evap Fuel Leaks"/> <pollutantprocessassociation pollutantkey="87" pollutantname="Volatile Organic Compounds" processkey="15" processname="Crankcase Running Exhaust"/> <pollutantprocessassociation pollutantkey="87" pollutantname="Volatile Organic Compounds" processkey="16" processname="Crankcase Start Exhaust"/> <pollutantprocessassociation pollutantkey="87" pollutantname="Volatile Organic Compounds" processkey="17" processname="Crankcase Extended Idle Exhaust"/> <pollutantprocessassociation pollutantkey="87" pollutantname="Volatile Organic Compounds" processkey="90" processname="Extended Idle Exhaust"/> <pollutantprocessassociation pollutantkey="87" pollutantname="Volatile Organic Compounds" processkey="91" processname="Auxiliary Power Exhaust"/> </pollutantprocessassociations> <databaseselections> <databaseselection servername="" databasename="mylevs" description=""/> </databaseselections> <internalcontrolstrategies> <internalcontrolstrategy classname="gov.epa.otaq.moves.master.implementation.ghg.internalcontrolstrategies.rateofprogress.RateOfProgressStrategy"><![CDATA[ useParameters No ]]></internalcontrolstrategy> </internalcontrolstrategies> <inputdatabase servername="" databasename="" description=""/> <uncertaintyparameters uncertaintymodeenabled="false" numberofrunspersimulation="0" numberofsimulations="0"/> <geographicoutputdetail description="LINK"/> <outputemissionsbreakdownselection> <modelyear selected="false"/> <fueltype selected="false"/> <fuelsubtype selected="false"/> <emissionprocess selected="false"/> <onroadoffroad selected="true"/> <roadtype selected="false"/> <sourceusetype selected="true"/> <movesvehicletype selected="false"/> <onroadscc selected="false"/> <estimateuncertainty selected="false" numberOfIterations="2" keepSampledData="false" keepIterations="false"/> <sector selected="false"/> <engtechid selected="false"/> <hpclass selected="false"/> <regclassid selected="false"/> </outputemissionsbreakdownselection> <outputdatabase servername="" databasename="BOS2016s_pcpt_out" description=""/> <outputtimestep value="Hour"/> <outputvmtdata value="true"/>
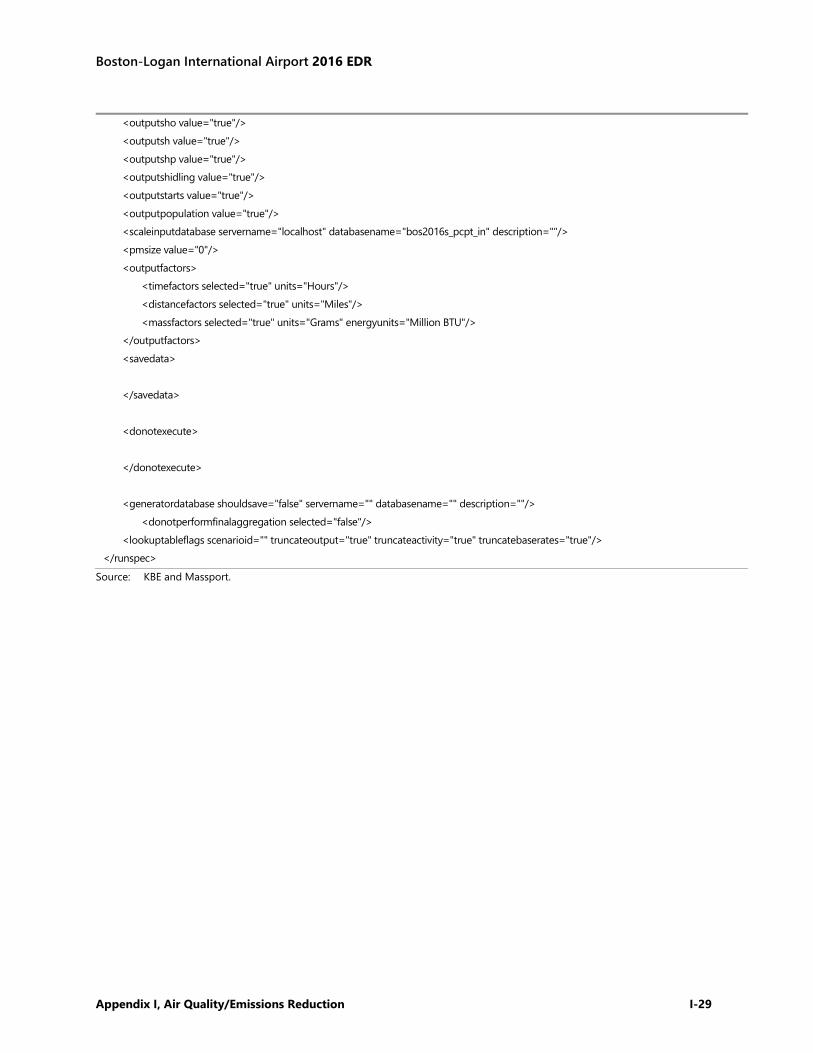
Boston-Logan International Airport 2016 EDR
Appendix I, Air Quality/Emissions Reduction I-29
Source: KBE and Massport.
<outputsho value="true"/> <outputsh value="true"/> <outputshp value="true"/> <outputshidling value="true"/> <outputstarts value="true"/> <outputpopulation value="true"/> <scaleinputdatabase servername="localhost" databasename="bos2016s_pcpt_in" description=""/> <pmsize value="0"/> <outputfactors> <timefactors selected="true" units="Hours"/> <distancefactors selected="true" units="Miles"/> <massfactors selected="true" units="Grams" energyunits="Million BTU"/> </outputfactors> <savedata> </savedata> <donotexecute> </donotexecute> <generatordatabase shouldsave="false" servername="" databasename="" description=""/> <donotperformfinalaggregation selected="false"/> <lookuptableflags scenarioid="" truncateoutput="true" truncateactivity="true" truncatebaserates="true"/> </runspec>
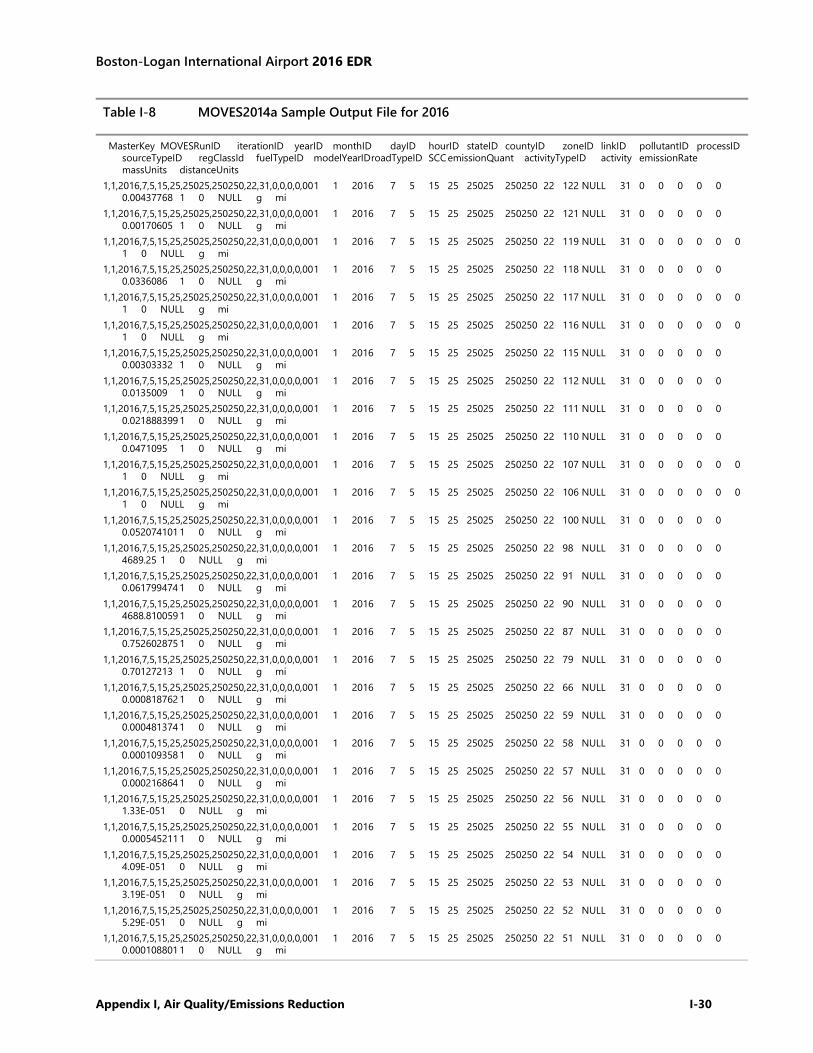
Boston-Logan International Airport 2016 EDR
Appendix I, Air Quality/Emissions Reduction I-30
Table I-8 MOVES2014a Sample Output File for 2016
MasterKey MOVESRunID iterationID yearID monthID dayID hourID stateID countyID zoneID linkID pollutantID processID sourceTypeID regClassId fuelTypeID modelYearID roadTypeID SCC emissionQuant activityTypeID activity emissionRate massUnits distanceUnits 1,1,2016,7,5,15,25,25025,250250,22,31,0,0,0,0,00 1 1 2016 7 5 15 25 25025 250250 22 122 NULL 31 0 0 0 0 0 0.00437768 1 0 NULL g mi 1,1,2016,7,5,15,25,25025,250250,22,31,0,0,0,0,00 1 1 2016 7 5 15 25 25025 250250 22 121 NULL 31 0 0 0 0 0 0.00170605 1 0 NULL g mi 1,1,2016,7,5,15,25,25025,250250,22,31,0,0,0,0,00 1 1 2016 7 5 15 25 25025 250250 22 119 NULL 31 0 0 0 0 0 0 1 0 NULL g mi 1,1,2016,7,5,15,25,25025,250250,22,31,0,0,0,0,00 1 1 2016 7 5 15 25 25025 250250 22 118 NULL 31 0 0 0 0 0 0.0336086 1 0 NULL g mi 1,1,2016,7,5,15,25,25025,250250,22,31,0,0,0,0,00 1 1 2016 7 5 15 25 25025 250250 22 117 NULL 31 0 0 0 0 0 0 1 0 NULL g mi 1,1,2016,7,5,15,25,25025,250250,22,31,0,0,0,0,00 1 1 2016 7 5 15 25 25025 250250 22 116 NULL 31 0 0 0 0 0 0 1 0 NULL g mi 1,1,2016,7,5,15,25,25025,250250,22,31,0,0,0,0,00 1 1 2016 7 5 15 25 25025 250250 22 115 NULL 31 0 0 0 0 0 0.00303332 1 0 NULL g mi 1,1,2016,7,5,15,25,25025,250250,22,31,0,0,0,0,00 1 1 2016 7 5 15 25 25025 250250 22 112 NULL 31 0 0 0 0 0 0.0135009 1 0 NULL g mi 1,1,2016,7,5,15,25,25025,250250,22,31,0,0,0,0,00 1 1 2016 7 5 15 25 25025 250250 22 111 NULL 31 0 0 0 0 0 0.021888399 1 0 NULL g mi 1,1,2016,7,5,15,25,25025,250250,22,31,0,0,0,0,00 1 1 2016 7 5 15 25 25025 250250 22 110 NULL 31 0 0 0 0 0 0.0471095 1 0 NULL g mi 1,1,2016,7,5,15,25,25025,250250,22,31,0,0,0,0,00 1 1 2016 7 5 15 25 25025 250250 22 107 NULL 31 0 0 0 0 0 0 1 0 NULL g mi 1,1,2016,7,5,15,25,25025,250250,22,31,0,0,0,0,00 1 1 2016 7 5 15 25 25025 250250 22 106 NULL 31 0 0 0 0 0 0 1 0 NULL g mi 1,1,2016,7,5,15,25,25025,250250,22,31,0,0,0,0,00 1 1 2016 7 5 15 25 25025 250250 22 100 NULL 31 0 0 0 0 0 0.052074101 1 0 NULL g mi 1,1,2016,7,5,15,25,25025,250250,22,31,0,0,0,0,00 1 1 2016 7 5 15 25 25025 250250 22 98 NULL 31 0 0 0 0 0 4689.25 1 0 NULL g mi 1,1,2016,7,5,15,25,25025,250250,22,31,0,0,0,0,00 1 1 2016 7 5 15 25 25025 250250 22 91 NULL 31 0 0 0 0 0 0.061799474 1 0 NULL g mi 1,1,2016,7,5,15,25,25025,250250,22,31,0,0,0,0,00 1 1 2016 7 5 15 25 25025 250250 22 90 NULL 31 0 0 0 0 0 4688.810059 1 0 NULL g mi 1,1,2016,7,5,15,25,25025,250250,22,31,0,0,0,0,00 1 1 2016 7 5 15 25 25025 250250 22 87 NULL 31 0 0 0 0 0 0.752602875 1 0 NULL g mi 1,1,2016,7,5,15,25,25025,250250,22,31,0,0,0,0,00 1 1 2016 7 5 15 25 25025 250250 22 79 NULL 31 0 0 0 0 0 0.70127213 1 0 NULL g mi 1,1,2016,7,5,15,25,25025,250250,22,31,0,0,0,0,00 1 1 2016 7 5 15 25 25025 250250 22 66 NULL 31 0 0 0 0 0 0.000818762 1 0 NULL g mi 1,1,2016,7,5,15,25,25025,250250,22,31,0,0,0,0,00 1 1 2016 7 5 15 25 25025 250250 22 59 NULL 31 0 0 0 0 0 0.000481374 1 0 NULL g mi 1,1,2016,7,5,15,25,25025,250250,22,31,0,0,0,0,00 1 1 2016 7 5 15 25 25025 250250 22 58 NULL 31 0 0 0 0 0 0.000109358 1 0 NULL g mi 1,1,2016,7,5,15,25,25025,250250,22,31,0,0,0,0,00 1 1 2016 7 5 15 25 25025 250250 22 57 NULL 31 0 0 0 0 0 0.000216864 1 0 NULL g mi 1,1,2016,7,5,15,25,25025,250250,22,31,0,0,0,0,00 1 1 2016 7 5 15 25 25025 250250 22 56 NULL 31 0 0 0 0 0 1.33E-05 1 0 NULL g mi 1,1,2016,7,5,15,25,25025,250250,22,31,0,0,0,0,00 1 1 2016 7 5 15 25 25025 250250 22 55 NULL 31 0 0 0 0 0 0.000545211 1 0 NULL g mi 1,1,2016,7,5,15,25,25025,250250,22,31,0,0,0,0,00 1 1 2016 7 5 15 25 25025 250250 22 54 NULL 31 0 0 0 0 0 4.09E-05 1 0 NULL g mi 1,1,2016,7,5,15,25,25025,250250,22,31,0,0,0,0,00 1 1 2016 7 5 15 25 25025 250250 22 53 NULL 31 0 0 0 0 0 3.19E-05 1 0 NULL g mi 1,1,2016,7,5,15,25,25025,250250,22,31,0,0,0,0,00 1 1 2016 7 5 15 25 25025 250250 22 52 NULL 31 0 0 0 0 0 5.29E-05 1 0 NULL g mi 1,1,2016,7,5,15,25,25025,250250,22,31,0,0,0,0,00 1 1 2016 7 5 15 25 25025 250250 22 51 NULL 31 0 0 0 0 0 0.000108801 1 0 NULL g mi
Boston-Logan International Airport 2016 EDR
Appendix I, Air Quality/Emissions Reduction I-31
1,1,2016,7,5,15,25,25025,250250,22,31,0,0,0,0,00 1 1 2016 7 5 15 25 25025 250250 22 36 NULL 31 0 0 0 0 0 0.000821018 1 0 NULL g mi 1,1,2016,7,5,15,25,25025,250250,22,31,0,0,0,0,00 1 1 2016 7 5 15 25 25025 250250 22 35 NULL 31 0 0 0 0 0 0.000181631 1 0 NULL g mi 1,1,2016,7,5,15,25,25025,250250,22,31,0,0,0,0,00 1 1 2016 7 5 15 25 25025 250250 22 31 NULL 31 0 0 0 0 0 0.0918229 1 0 NULL g mi 1,1,2016,7,5,15,25,25025,250250,22,31,0,0,0,0,00 1 1 2016 7 5 15 25 25025 250250 22 5 NULL 31 0 0 0 0 0 0.017741052 1 0 NULL g mi 1,1,2016,7,5,15,25,25025,250250,22,31,0,0,0,0,00 1 1 2016 7 5 15 25 25025 250250 22 3 NULL 31 0 0 0 0 0 1.661653042 1 0 NULL g mi 1,1,2016,7,5,15,25,25025,250250,22,31,0,0,0,0,00 1 1 2016 7 5 15 25 25025 250250 22 2 NULL 31 0 0 0 0 0 13.89191437 1 0 NULL g mi 1,1,2016,7,5,15,25,25025,250250,22,31,0,0,0,0,00 1 1 2016 7 5 15 25 25025 250250 22 1 NULL 31 0 0 0 0 0 0.718864202 1 0 NULL g mi 1,1,2016,7,5,15,25,25025,250250,21,21,0,0,0,0,00 1 1 2016 7 5 15 25 25025 250250 21 122 NULL 21 0 0 0 0 0 0.0045505 1 0 NULL g mi 1,1,2016,7,5,15,25,25025,250250,21,21,0,0,0,0,00 1 1 2016 7 5 15 25 25025 250250 21 121 NULL 21 0 0 0 0 0 0.00186946 1 0 NULL g mi 1,1,2016,7,5,15,25,25025,250250,21,21,0,0,0,0,00 1 1 2016 7 5 15 25 25025 250250 21 119 NULL 21 0 0 0 0 0 0 1 0 NULL g mi 1,1,2016,7,5,15,25,25025,250250,21,21,0,0,0,0,00 1 1 2016 7 5 15 25 25025 250250 21 118 NULL 21 0 0 0 0 0 0.033500101 1 0 NULL g mi 1,1,2016,7,5,15,25,25025,250250,21,21,0,0,0,0,00 1 1 2016 7 5 15 25 25025 250250 21 117 NULL 21 0 0 0 0 0 0 1 0 NULL g mi 1,1,2016,7,5,15,25,25025,250250,21,21,0,0,0,0,00 1 1 2016 7 5 15 25 25025 250250 21 116 NULL 21 0 0 0 0 0 0 1 0 NULL g mi 1,1,2016,7,5,15,25,25025,250250,21,21,0,0,0,0,00 1 1 2016 7 5 15 25 25025 250250 21 115 NULL 21 0 0 0 0 0 0.00130928 1 0 NULL g mi 1,1,2016,7,5,15,25,25025,250250,21,21,0,0,0,0,00 1 1 2016 7 5 15 25 25025 250250 21 112 NULL 21 0 0 0 0 0 0.00571219 1 0 NULL g mi 1,1,2016,7,5,15,25,25025,250250,21,21,0,0,0,0,00 1 1 2016 7 5 15 25 25025 250250 21 111 NULL 21 0 0 0 0 0 0.022752499 1 0 NULL g mi 1,1,2016,7,5,15,25,25025,250250,21,21,0,0,0,0,00 1 1 2016 7 5 15 25 25025 250250 21 110 NULL 21 0 0 0 0 0 0.039212301 1 0 NULL g mi 1,1,2016,7,5,15,25,25025,250250,21,21,0,0,0,0,00 1 1 2016 7 5 15 25 25025 250250 21 107 NULL 21 0 0 0 0 0 0 1 0 NULL g mi 1,1,2016,7,5,15,25,25025,250250,21,21,0,0,0,0,00 1 1 2016 7 5 15 25 25025 250250 21 106 NULL 21 0 0 0 0 0 0 1 0 NULL g mi 1,1,2016,7,5,15,25,25025,250250,21,21,0,0,0,0,00 1 1 2016 7 5 15 25 25025 250250 21 100 NULL 21 0 0 0 0 0 0.044315699 1 0 NULL g mi 1,1,2016,7,5,15,25,25025,250250,21,21,0,0,0,0,00 1 1 2016 7 5 15 25 25025 250250 21 98 NULL 21 0 0 0 0 0 3604.77002 1 0 NULL g mi 1,1,2016,7,5,15,25,25025,250250,21,21,0,0,0,0,00 1 1 2016 7 5 15 25 25025 250250 21 91 NULL 21 0 0 0 0 0 0.047527436 1 0 NULL g mi 1,1,2016,7,5,15,25,25025,250250,21,21,0,0,0,0,00 1 1 2016 7 5 15 25 25025 250250 21 90 NULL 21 0 0 0 0 0 3604.280029 1 0 NULL g mi 1,1,2016,7,5,15,25,25025,250250,21,21,0,0,0,0,00 1 1 2016 7 5 15 25 25025 250250 21 87 NULL 21 0 0 0 0 0 0.955521941 1 0 NULL g mi 1,1,2016,7,5,15,25,25025,250250,21,21,0,0,0,0,00 1 1 2016 7 5 15 25 25025 250250 21 79 NULL 21 0 0 0 0 0 0.89418292 1 0 NULL g mi 1,1,2016,7,5,15,25,25025,250250,21,21,0,0,0,0,00 1 1 2016 7 5 15 25 25025 250250 21 66 NULL 21 0 0 0 0 0 0.000803656 1 0 NULL g mi 1,1,2016,7,5,15,25,25025,250250,21,21,0,0,0,0,00 1 1 2016 7 5 15 25 25025 250250 21 59 NULL 21 0 0 0 0 0 0.000745486 1 0 NULL g mi 1,1,2016,7,5,15,25,25025,250250,21,21,0,0,0,0,00 1 1 2016 7 5 15 25 25025 250250 21 58 NULL 21 0 0 0 0 0 0.000132223 1 0 NULL g mi 1,1,2016,7,5,15,25,25025,250250,21,21,0,0,0,0,00 1 1 2016 7 5 15 25 25025 250250 21 57 NULL 21 0 0 0 0 0 0.000132695 1 0 NULL g mi 1,1,2016,7,5,15,25,25025,250250,21,21,0,0,0,0,00 1 1 2016 7 5 15 25 25025 250250 21 56 NULL 21 0 0 0 0 0 1.39E-05 1 0 NULL g mi 1,1,2016,7,5,15,25,25025,250250,21,21,0,0,0,0,00 1 1 2016 7 5 15 25 25025 250250 21 55 NULL 21 0 0 0 0 0 0.000589248 1 0 NULL g mi
Boston-Logan International Airport 2016 EDR
Appendix I, Air Quality/Emissions Reduction I-32
1,1,2016,7,5,15,25,25025,250250,21,21,0,0,0,0,00 1 1 2016 7 5 15 25 25025 250250 21 54 NULL 21 0 0 0 0 0 5.91E-05 1 0 NULL g mi 1,1,2016,7,5,15,25,25025,250250,21,21,0,0,0,0,00 1 1 2016 7 5 15 25 25025 250250 21 53 NULL 21 0 0 0 0 0 3.48E-05 1 0 NULL g mi 1,1,2016,7,5,15,25,25025,250250,21,21,0,0,0,0,00 1 1 2016 7 5 15 25 25025 250250 21 52 NULL 21 0 0 0 0 0 1.72E-05 1 0 NULL g mi 1,1,2016,7,5,15,25,25025,250250,21,21,0,0,0,0,00 1 1 2016 7 5 15 25 25025 250250 21 51 NULL 21 0 0 0 0 0 4.30E-05 1 0 NULL g mi 1,1,2016,7,5,15,25,25025,250250,21,21,0,0,0,0,00 1 1 2016 7 5 15 25 25025 250250 21 36 NULL 21 0 0 0 0 0 0.00113269 1 0 NULL g mi 1,1,2016,7,5,15,25,25025,250250,21,21,0,0,0,0,00 1 1 2016 7 5 15 25 25025 250250 21 35 NULL 21 0 0 0 0 0 0.000118113 1 0 NULL g mi 1,1,2016,7,5,15,25,25025,250250,21,21,0,0,0,0,00 1 1 2016 7 5 15 25 25025 250250 21 31 NULL 21 0 0 0 0 0 0.071520001 1 0 NULL g mi 1,1,2016,7,5,15,25,25025,250250,21,21,0,0,0,0,00 1 1 2016 7 5 15 25 25025 250250 21 5 NULL 21 0 0 0 0 0 0.020013457 1 0 NULL g mi 1,1,2016,7,5,15,25,25025,250250,21,21,0,0,0,0,00 1 1 2016 7 5 15 25 25025 250250 21 3 NULL 21 0 0 0 0 0 1.276604533 1 0 NULL g mi 1,1,2016,7,5,15,25,25025,250250,21,21,0,0,0,0,00 1 1 2016 7 5 15 25 25025 250250 21 2 NULL 21 0 0 0 0 0 5.052342415 1 0 NULL g mi 1,1,2016,7,5,15,25,25025,250250,21,21,0,0,0,0,00 1 1 2016 7 5 15 25 25025 250250 21 1 NULL 21 0 0 0 0 0 0.913937926 1 0 NULL g mi 1,1,2016,7,5,15,25,25025,250250,20,31,0,0,0,0,00 1 1 2016 7 5 15 25 25025 250250 20 122 NULL 31 0 0 0 0 0 0.000439167 1 1 0.000439167 g mi 1,1,2016,7,5,15,25,25025,250250,20,31,0,0,0,0,00 1 1 2016 7 5 15 25 25025 250250 20 121 NULL 31 0 0 0 0 0 0.000179187 1 1 0.000179187 g mi 1,1,2016,7,5,15,25,25025,250250,20,31,0,0,0,0,00 1 1 2016 7 5 15 25 25025 250250 20 119 NULL 31 0 0 0 0 0 0 1 1 0 g mi 1,1,2016,7,5,15,25,25025,250250,20,31,0,0,0,0,00 1 1 2016 7 5 15 25 25025 250250 20 118 NULL 31 0 0 0 0 0 0.00327079 1 1 0.00327079 g mi 1,1,2016,7,5,15,25,25025,250250,20,31,0,0,0,0,00 1 1 2016 7 5 15 25 25025 250250 20 117 NULL 31 0 0 0 0 0 0.0012442 1 1 0.0012442 g mi 1,1,2016,7,5,15,25,25025,250250,20,31,0,0,0,0,00 1 1 2016 7 5 15 25 25025 250250 20 116 NULL 31 0 0 0 0 0 0.0014 1 1 0.0014 g mi 1,1,2016,7,5,15,25,25025,250250,20,31,0,0,0,0,00 1 1 2016 7 5 15 25 25025 250250 20 115 NULL 31 0 0 0 0 0 0.000168601 1 1 0.000168601 g mi 1,1,2016,7,5,15,25,25025,250250,20,31,0,0,0,0,00 1 1 2016 7 5 15 25 25025 250250 20 112 NULL 31 0 0 0 0 0 0.00121482 1 1 0.00121482 g mi 1,1,2016,7,5,15,25,25025,250250,20,31,0,0,0,0,00 1 1 2016 7 5 15 25 25025 250250 20 111 NULL 31 0 0 0 0 0 0.00219583 1 1 0.00219583 g mi 1,1,2016,7,5,15,25,25025,250250,20,31,0,0,0,0,00 1 1 2016 7 5 15 25 25025 250250 20 110 NULL 31 0 0 0 0 0 0.00448561 1 1 0.00448561 g mi 1,1,2016,7,5,15,25,25025,250250,20,31,0,0,0,0,00 1 1 2016 7 5 15 25 25025 250250 20 107 NULL 31 0 0 0 0 0 0.00829473 1 1 0.00829473 g mi 1,1,2016,7,5,15,25,25025,250250,20,31,0,0,0,0,00 1 1 2016 7 5 15 25 25025 250250 20 106 NULL 31 0 0 0 0 0 0.0112 1 1 0.0112 g mi 1,1,2016,7,5,15,25,25025,250250,20,31,0,0,0,0,00 1 1 2016 7 5 15 25 25025 250250 20 100 NULL 31 0 0 0 0 0 0.00503061 1 1 0.00503061 g mi 1,1,2016,7,5,15,25,25025,250250,20,31,0,0,0,0,00 1 1 2016 7 5 15 25 25025 250250 20 98 NULL 31 0 0 0 0 0 418.3670044 1 1 418.3670044 g mi 1,1,2016,7,5,15,25,25025,250250,20,31,0,0,0,0,00 1 1 2016 7 5 15 25 25025 250250 20 91 NULL 31 0 0 0 0 0 0.005512874 1 1 0.005512874 g mi 1,1,2016,7,5,15,25,25025,250250,20,31,0,0,0,0,00 1 1 2016 7 5 15 25 25025 250250 20 90 NULL 31 0 0 0 0 0 418.2780151 1 1 418.2780151 g mi 1,1,2016,7,5,15,25,25025,250250,20,31,0,0,0,0,00 1 1 2016 7 5 15 25 25025 250250 20 87 NULL 31 0 0 0 0 0 0.106420197 1 1 0.106420197 g mi 1,1,2016,7,5,15,25,25025,250250,20,31,0,0,0,0,00 1 1 2016 7 5 15 25 25025 250250 20 79 NULL 31 0 0 0 0 0 0.099057898 1 1 0.099057898 g mi 1,1,2016,7,5,15,25,25025,250250,20,31,0,0,0,0,00 1 1 2016 7 5 15 25 25025 250250 20 66 NULL 31 0 0 0 0 0 1.64E-05 1 1 1.64E-05 g mi 1,1,2016,7,5,15,25,25025,250250,20,31,0,0,0,0,00 1 1 2016 7 5 15 25 25025 250250 20 59 NULL 31 0 0 0 0 0 6.94E-05 1 1 6.94E-05 g mi

Boston-Logan International Airport 2016 EDR
Appendix I, Air Quality/Emissions Reduction I-33
1,1,2016,7,5,15,25,25025,250250,20,31,0,0,0,0,00 1 1 2016 7 5 15 25 25025 250250 20 58 NULL 31 0 0 0 0 0 1.26E-05 1 1 1.26E-05 g mi 1,1,2016,7,5,15,25,25025,250250,20,31,0,0,0,0,00 1 1 2016 7 5 15 25 25025 250250 20 57 NULL 31 0 0 0 0 0 1.37E-05 1 1 1.37E-05 g mi 1,1,2016,7,5,15,25,25025,250250,20,31,0,0,0,0,00 1 1 2016 7 5 15 25 25025 250250 20 56 NULL 31 0 0 0 0 0 1.34E-06 1 1 1.34E-06 g mi 1,1,2016,7,5,15,25,25025,250250,20,31,0,0,0,0,00 1 1 2016 7 5 15 25 25025 250250 20 55 NULL 31 0 0 0 0 0 5.66E-05 1 1 5.66E-05 g mi 1,1,2016,7,5,15,25,25025,250250,20,31,0,0,0,0,00 1 1 2016 7 5 15 25 25025 250250 20 54 NULL 31 0 0 0 0 0 5.55E-06 1 1 5.55E-06 g mi 1,1,2016,7,5,15,25,25025,250250,20,31,0,0,0,0,00 1 1 2016 7 5 15 25 25025 250250 20 53 NULL 31 0 0 0 0 0 3.34E-06 1 1 3.34E-06 g mi 1,1,2016,7,5,15,25,25025,250250,20,31,0,0,0,0,00 1 1 2016 7 5 15 25 25025 250250 20 52 NULL 31 0 0 0 0 0 2.28E-06 1 1 2.28E-06 g mi 1,1,2016,7,5,15,25,25025,250250,20,31,0,0,0,0,00 1 1 2016 7 5 15 25 25025 250250 20 51 NULL 31 0 0 0 0 0 4.86E-06 1 1 4.86E-06 g mi 1,1,2016,7,5,15,25,25025,250250,20,31,0,0,0,0,00 1 1 2016 7 5 15 25 25025 250250 20 36 NULL 31 0 0 0 0 0 0.000106192 1 1 0.000106192 g mi 1,1,2016,7,5,15,25,25025,250250,20,31,0,0,0,0,00 1 1 2016 7 5 15 25 25025 250250 20 35 NULL 31 0 0 0 0 0 1.21E-05 1 1 1.21E-05 g mi 1,1,2016,7,5,15,25,25025,250250,20,31,0,0,0,0,00 1 1 2016 7 5 15 25 25025 250250 20 31 NULL 31 0 0 0 0 0 0.00818743 1 1 0.00818743 g mi 1,1,2016,7,5,15,25,25025,250250,20,31,0,0,0,0,00 1 1 2016 7 5 15 25 25025 250250 20 5 NULL 31 0 0 0 0 0 0.003596358 1 1 0.003596358 g mi 1,1,2016,7,5,15,25,25025,250250,20,31,0,0,0,0,00 1 1 2016 7 5 15 25 25025 250250 20 3 NULL 31 0 0 0 0 0 0.260831296 1 1 0.260831296 g mi 1,1,2016,7,5,15,25,25025,250250,20,31,0,0,0,0,00 1 1 2016 7 5 15 25 25025 250250 20 2 NULL 31 0 0 0 0 0 2.533923388 1 1 2.533923388 g mi 1,1,2016,7,5,15,25,25025,250250,20,31,0,0,0,0,00 1 1 2016 7 5 15 25 25025 250250 20 1 NULL 31 0 0 0 0 0 0.102611698 1 1 0.102611698 g mi 1,1,2016,7,5,15,25,25025,250250,19,31,0,0,0,0,00 1 1 2016 7 5 15 25 25025 250250 19 122 NULL 31 0 0 0 0 0 0.000445066 1 1 0.000445066 g mi 1,1,2016,7,5,15,25,25025,250250,19,31,0,0,0,0,00 1 1 2016 7 5 15 25 25025 250250 19 121 NULL 31 0 0 0 0 0 0.000181432 1 1 0.000181432 g mi 1,1,2016,7,5,15,25,25025,250250,19,31,0,0,0,0,00 1 1 2016 7 5 15 25 25025 250250 19 119 NULL 31 0 0 0 0 0 0 1 1 0 g mi 1,1,2016,7,5,15,25,25025,250250,19,31,0,0,0,0,00 1 1 2016 7 5 15 25 25025 250250 19 118 NULL 31 0 0 0 0 0 0.00331308 1 1 0.00331308 g mi 1,1,2016,7,5,15,25,25025,250250,19,31,0,0,0,0,00 1 1 2016 7 5 15 25 25025 250250 19 117 NULL 31 0 0 0 0 0 0.0013404 1 1 0.0013404 g mi 1,1,2016,7,5,15,25,25025,250250,19,31,0,0,0,0,00 1 1 2016 7 5 15 25 25025 250250 19 116 NULL 31 0 0 0 0 0 0.00219603 1 1 0.00219603 g mi 1,1,2016,7,5,15,25,25025,250250,19,31,0,0,0,0,00 1 1 2016 7 5 15 25 25025 250250 19 115 NULL 31 0 0 0 0 0 0.000170062 1 1 0.000170062 g mi 1,1,2016,7,5,15,25,25025,250250,19,31,0,0,0,0,00 1 1 2016 7 5 15 25 25025 250250 19 112 NULL 31 0 0 0 0 0 0.00119351 1 1 0.00119351 g mi 1,1,2016,7,5,15,25,25025,250250,19,31,0,0,0,0,00 1 1 2016 7 5 15 25 25025 250250 19 111 NULL 31 0 0 0 0 0 0.00222533 1 1 0.00222533 g mi 1,1,2016,7,5,15,25,25025,250250,19,31,0,0,0,0,00 1 1 2016 7 5 15 25 25025 250250 19 110 NULL 31 0 0 0 0 0 0.00450659 1 1 0.00450659 g mi 1,1,2016,7,5,15,25,25025,250250,19,31,0,0,0,0,00 1 1 2016 7 5 15 25 25025 250250 19 107 NULL 31 0 0 0 0 0 0.00893608 1 1 0.00893608 g mi 1,1,2016,7,5,15,25,25025,250250,19,31,0,0,0,0,00 1 1 2016 7 5 15 25 25025 250250 19 106 NULL 31 0 0 0 0 0 0.017568201 1 1 0.017568201 g mi 1,1,2016,7,5,15,25,25025,250250,19,31,0,0,0,0,00 1 1 2016 7 5 15 25 25025 250250 19 100 NULL 31 0 0 0 0 0 0.00505381 1 1 0.00505381 g mi 1,1,2016,7,5,15,25,25025,250250,19,31,0,0,0,0,00 1 1 2016 7 5 15 25 25025 250250 19 98 NULL 31 0 0 0 0 0 427.2330017 1 1 427.2330017 g mi 1,1,2016,7,5,15,25,25025,250250,19,31,0,0,0,0,00 1 1 2016 7 5 15 25 25025 250250 19 91 NULL 31 0 0 0 0 0 0.005629692 1 1 0.005629692 g mi 1,1,2016,7,5,15,25,25025,250250,19,31,0,0,0,0,00 1 1 2016 7 5 15 25 25025 250250 19 90 NULL 31 0 0 0 0 0 427.1409912 1 1 427.1409912 g mi
Boston-Logan International Airport 2016 EDR
Appendix I, Air Quality/Emissions Reduction I-34
1,1,2016,7,5,15,25,25025,250250,19,31,0,0,0,0,00 1 1 2016 7 5 15 25 25025 250250 19 87 NULL 31 0 0 0 0 0 0.108525284 1 1 0.108525284 g mi 1,1,2016,7,5,15,25,25025,250250,19,31,0,0,0,0,00 1 1 2016 7 5 15 25 25025 250250 19 79 NULL 31 0 0 0 0 0 0.101111598 1 1 0.101111598 g mi 1,1,2016,7,5,15,25,25025,250250,19,31,0,0,0,0,00 1 1 2016 7 5 15 25 25025 250250 19 66 NULL 31 0 0 0 0 0 1.82E-05 1 1 1.82E-05 g mi 1,1,2016,7,5,15,25,25025,250250,19,31,0,0,0,0,00 1 1 2016 7 5 15 25 25025 250250 19 59 NULL 31 0 0 0 0 0 6.98E-05 1 1 6.98E-05 g mi 1,1,2016,7,5,15,25,25025,250250,19,31,0,0,0,0,00 1 1 2016 7 5 15 25 25025 250250 19 58 NULL 31 0 0 0 0 0 1.27E-05 1 1 1.27E-05 g mi 1,1,2016,7,5,15,25,25025,250250,19,31,0,0,0,0,00 1 1 2016 7 5 15 25 25025 250250 19 57 NULL 31 0 0 0 0 0 1.41E-05 1 1 1.41E-05 g mi 1,1,2016,7,5,15,25,25025,250250,19,31,0,0,0,0,00 1 1 2016 7 5 15 25 25025 250250 19 56 NULL 31 0 0 0 0 0 1.36E-06 1 1 1.36E-06 g mi 1,1,2016,7,5,15,25,25025,250250,19,31,0,0,0,0,00 1 1 2016 7 5 15 25 25025 250250 19 55 NULL 31 0 0 0 0 0 5.73E-05 1 1 5.73E-05 g mi 1,1,2016,7,5,15,25,25025,250250,19,31,0,0,0,0,00 1 1 2016 7 5 15 25 25025 250250 19 54 NULL 31 0 0 0 0 0 5.58E-06 1 1 5.58E-06 g mi 1,1,2016,7,5,15,25,25025,250250,19,31,0,0,0,0,00 1 1 2016 7 5 15 25 25025 250250 19 53 NULL 31 0 0 0 0 0 3.38E-06 1 1 3.38E-06 g mi 1,1,2016,7,5,15,25,25025,250250,19,31,0,0,0,0,00 1 1 2016 7 5 15 25 25025 250250 19 52 NULL 31 0 0 0 0 0 2.35E-06 1 1 2.35E-06 g mi 1,1,2016,7,5,15,25,25025,250250,19,31,0,0,0,0,00 1 1 2016 7 5 15 25 25025 250250 19 51 NULL 31 0 0 0 0 0 5.09E-06 1 1 5.09E-06 g mi 1,1,2016,7,5,15,25,25025,250250,19,31,0,0,0,0,00 1 1 2016 7 5 15 25 25025 250250 19 36 NULL 31 0 0 0 0 0 0.00010705 1 1 0.00010705 g mi 1,1,2016,7,5,15,25,25025,250250,19,31,0,0,0,0,00 1 1 2016 7 5 15 25 25025 250250 19 35 NULL 31 0 0 0 0 0 1.24E-05 1 1 1.24E-05 g mi 1,1,2016,7,5,15,25,25025,250250,19,31,0,0,0,0,00 1 1 2016 7 5 15 25 25025 250250 19 31 NULL 31 0 0 0 0 0 0.00836078 1 1 0.00836078 g mi 1,1,2016,7,5,15,25,25025,250250,19,31,0,0,0,0,00 1 1 2016 7 5 15 25 25025 250250 19 5 NULL 31 0 0 0 0 0 0.003693645 1 1 0.003693645 g mi 1,1,2016,7,5,15,25,25025,250250,19,31,0,0,0,0,00 1 1 2016 7 5 15 25 25025 250250 19 3 NULL 31 0 0 0 0 0 0.25458011 1 1 0.25458011 g mi 1,1,2016,7,5,15,25,25025,250250,19,31,0,0,0,0,00 1 1 2016 7 5 15 25 25025 250250 19 2 NULL 31 0 0 0 0 0 2.517087221 1 1 2.517087221 g mi 1,1,2016,7,5,15,25,25025,250250,19,31,0,0,0,0,00 1 1 2016 7 5 15 25 25025 250250 19 1 NULL 31 0 0 0 0 0 0.1047616 1 1 0.1047616 g mi 1,1,2016,7,5,15,25,25025,250250,18,31,0,0,0,0,00 1 1 2016 7 5 15 25 25025 250250 18 122 NULL 31 0 0 0 0 0 0.00046558 1 1 0.00046558 g mi 1,1,2016,7,5,15,25,25025,250250,18,31,0,0,0,0,00 1 1 2016 7 5 15 25 25025 250250 18 121 NULL 31 0 0 0 0 0 0.000189645 1 1 0.000189645 g mi 1,1,2016,7,5,15,25,25025,250250,18,31,0,0,0,0,00 1 1 2016 7 5 15 25 25025 250250 18 119 NULL 31 0 0 0 0 0 0 1 1 0 g mi 1,1,2016,7,5,15,25,25025,250250,18,31,0,0,0,0,00 1 1 2016 7 5 15 25 25025 250250 18 118 NULL 31 0 0 0 0 0 0.00346393 1 1 0.00346393 g mi 1,1,2016,7,5,15,25,25025,250250,18,31,0,0,0,0,00 1 1 2016 7 5 15 25 25025 250250 18 117 NULL 31 0 0 0 0 0 0.00144464 1 1 0.00144464 g mi 1,1,2016,7,5,15,25,25025,250250,18,31,0,0,0,0,00 1 1 2016 7 5 15 25 25025 250250 18 116 NULL 31 0 0 0 0 0 0.00307423 1 1 0.00307423 g mi 1,1,2016,7,5,15,25,25025,250250,18,31,0,0,0,0,00 1 1 2016 7 5 15 25 25025 250250 18 115 NULL 31 0 0 0 0 0 0.000176824 1 1 0.000176824 g mi 1,1,2016,7,5,15,25,25025,250250,18,31,0,0,0,0,00 1 1 2016 7 5 15 25 25025 250250 18 112 NULL 31 0 0 0 0 0 0.00119599 1 1 0.00119599 g mi 1,1,2016,7,5,15,25,25025,250250,18,31,0,0,0,0,00 1 1 2016 7 5 15 25 25025 250250 18 111 NULL 31 0 0 0 0 0 0.0023279 1 1 0.0023279 g mi 1,1,2016,7,5,15,25,25025,250250,18,31,0,0,0,0,00 1 1 2016 7 5 15 25 25025 250250 18 110 NULL 31 0 0 0 0 0 0.00465992 1 1 0.00465992 g mi 1,1,2016,7,5,15,25,25025,250250,18,31,0,0,0,0,00 1 1 2016 7 5 15 25 25025 250250 18 107 NULL 31 0 0 0 0 0 0.00963098 1 1 0.00963098 g mi 1,1,2016,7,5,15,25,25025,250250,18,31,0,0,0,0,00 1 1 2016 7 5 15 25 25025 250250 18 106 NULL 31 0 0 0 0 0 0.0245938 1 1 0.0245938 g mi
Boston-Logan International Airport 2016 EDR
Appendix I, Air Quality/Emissions Reduction I-35
1,1,2016,7,5,15,25,25025,250250,18,31,0,0,0,0,00 1 1 2016 7 5 15 25 25025 250250 18 100 NULL 31 0 0 0 0 0 0.00522606 1 1 0.00522606 g mi 1,1,2016,7,5,15,25,25025,250250,18,31,0,0,0,0,00 1 1 2016 7 5 15 25 25025 250250 18 98 NULL 31 0 0 0 0 0 438.7279968 1 1 438.7279968 g mi 1,1,2016,7,5,15,25,25025,250250,18,31,0,0,0,0,00 1 1 2016 7 5 15 25 25025 250250 18 91 NULL 31 0 0 0 0 0 0.005781106 1 1 0.005781106 g mi 1,1,2016,7,5,15,25,25025,250250,18,31,0,0,0,0,00 1 1 2016 7 5 15 25 25025 250250 18 90 NULL 31 0 0 0 0 0 438.631012 1 1 438.631012 g mi 1,1,2016,7,5,15,25,25025,250250,18,31,0,0,0,0,00 1 1 2016 7 5 15 25 25025 250250 18 87 NULL 31 0 0 0 0 0 0.11164511 1 1 0.11164511 g mi 1,1,2016,7,5,15,25,25025,250250,18,31,0,0,0,0,00 1 1 2016 7 5 15 25 25025 250250 18 79 NULL 31 0 0 0 0 0 0.104209997 1 1 0.104209997 g mi 1,1,2016,7,5,15,25,25025,250250,18,31,0,0,0,0,00 1 1 2016 7 5 15 25 25025 250250 18 66 NULL 31 0 0 0 0 0 2.05E-05 1 1 2.05E-05 g mi 1,1,2016,7,5,15,25,25025,250250,18,31,0,0,0,0,00 1 1 2016 7 5 15 25 25025 250250 18 59 NULL 31 0 0 0 0 0 7.25E-05 1 1 7.25E-05 g mi 1,1,2016,7,5,15,25,25025,250250,18,31,0,0,0,0,00 1 1 2016 7 5 15 25 25025 250250 18 58 NULL 31 0 0 0 0 0 1.32E-05 1 1 1.32E-05 g mi 1,1,2016,7,5,15,25,25025,250250,18,31,0,0,0,0,00 1 1 2016 7 5 15 25 25025 250250 18 57 NULL 31 0 0 0 0 0 1.50E-05 1 1 1.50E-05 g mi 1,1,2016,7,5,15,25,25025,250250,18,31,0,0,0,0,00 1 1 2016 7 5 15 25 25025 250250 18 56 NULL 31 0 0 0 0 0 1.42E-06 1 1 1.42E-06 g mi 1,1,2016,7,5,15,25,25025,250250,18,31,0,0,0,0,00 1 1 2016 7 5 15 25 25025 250250 18 55 NULL 31 0 0 0 0 0 5.99E-05 1 1 5.99E-05 g mi 1,1,2016,7,5,15,25,25025,250250,18,31,0,0,0,0,00 1 1 2016 7 5 15 25 25025 250250 18 54 NULL 31 0 0 0 0 0 5.80E-06 1 1 5.80E-06 g mi 1,1,2016,7,5,15,25,25025,250250,18,31,0,0,0,0,00 1 1 2016 7 5 15 25 25025 250250 18 53 NULL 31 0 0 0 0 0 3.54E-06 1 1 3.54E-06 g mi 1,1,2016,7,5,15,25,25025,250250,18,31,0,0,0,0,00 1 1 2016 7 5 15 25 25025 250250 18 52 NULL 31 0 0 0 0 0 2.48E-06 1 1 2.48E-06 g mi 1,1,2016,7,5,15,25,25025,250250,18,31,0,0,0,0,00 1 1 2016 7 5 15 25 25025 250250 18 51 NULL 31 0 0 0 0 0 5.47E-06 1 1 5.47E-06 g mi 1,1,2016,7,5,15,25,25025,250250,18,31,0,0,0,0,00 1 1 2016 7 5 15 25 25025 250250 18 36 NULL 31 0 0 0 0 0 0.000111454 1 1 0.000111454 g mi 1,1,2016,7,5,15,25,25025,250250,18,31,0,0,0,0,00 1 1 2016 7 5 15 25 25025 250250 18 35 NULL 31 0 0 0 0 0 1.31E-05 1 1 1.31E-05 g mi 1,1,2016,7,5,15,25,25025,250250,18,31,0,0,0,0,00 1 1 2016 7 5 15 25 25025 250250 18 31 NULL 31 0 0 0 0 0 0.00858492 1 1 0.00858492 g mi 1,1,2016,7,5,15,25,25025,250250,18,31,0,0,0,0,00 1 1 2016 7 5 15 25 25025 250250 18 5 NULL 31 0 0 0 0 0 0.003913358 1 1 0.003913358 g mi 1,1,2016,7,5,15,25,25025,250250,18,31,0,0,0,0,00 1 1 2016 7 5 15 25 25025 250250 18 3 NULL 31 0 0 0 0 0 0.249039963 1 1 0.249039963 g mi 1,1,2016,7,5,15,25,25025,250250,18,31,0,0,0,0,00 1 1 2016 7 5 15 25 25025 250250 18 2 NULL 31 0 0 0 0 0 2.586617231 1 1 2.586617231 g mi 1,1,2016,7,5,15,25,25025,250250,18,31,0,0,0,0,00 1 1 2016 7 5 15 25 25025 250250 18 1 NULL 31 0 0 0 0 0 0.108077303 1 1 0.108077303 g mi 1,1,2016,7,5,15,25,25025,250250,17,31,0,0,0,0,00 1 1 2016 7 5 15 25 25025 250250 17 122 NULL 31 0 0 0 0 0 0.000499927 1 1 0.000499927 g mi 1,1,2016,7,5,15,25,25025,250250,17,31,0,0,0,0,00 1 1 2016 7 5 15 25 25025 250250 17 121 NULL 31 0 0 0 0 0 0.000203487 1 1 0.000203487 g mi 1,1,2016,7,5,15,25,25025,250250,17,31,0,0,0,0,00 1 1 2016 7 5 15 25 25025 250250 17 119 NULL 31 0 0 0 0 0 0 1 1 0 g mi 1,1,2016,7,5,15,25,25025,250250,17,31,0,0,0,0,00 1 1 2016 7 5 15 25 25025 250250 17 118 NULL 31 0 0 0 0 0 0.00371732 1 1 0.00371732 g mi 1,1,2016,7,5,15,25,25025,250250,17,31,0,0,0,0,00 1 1 2016 7 5 15 25 25025 250250 17 117 NULL 31 0 0 0 0 0 0.001556 1 1 0.001556 g mi 1,1,2016,7,5,15,25,25025,250250,17,31,0,0,0,0,00 1 1 2016 7 5 15 25 25025 250250 17 116 NULL 31 0 0 0 0 0 0.00413246 1 1 0.00413246 g mi 1,1,2016,7,5,15,25,25025,250250,17,31,0,0,0,0,00 1 1 2016 7 5 15 25 25025 250250 17 115 NULL 31 0 0 0 0 0 0.000188512 1 1 0.000188512 g mi 1,1,2016,7,5,15,25,25025,250250,17,31,0,0,0,0,00 1 1 2016 7 5 15 25 25025 250250 17 112 NULL 31 0 0 0 0 0 0.00121684 1 1 0.00121684 g mi

Boston-Logan International Airport 2016 EDR
Appendix I, Air Quality/Emissions Reduction I-36
1,1,2016,7,5,15,25,25025,250250,17,31,0,0,0,0,00 1 1 2016 7 5 15 25 25025 250250 17 111 NULL 31 0 0 0 0 0 0.00249963 1 1 0.00249963 g mi 1,1,2016,7,5,15,25,25025,250250,17,31,0,0,0,0,00 1 1 2016 7 5 15 25 25025 250250 17 110 NULL 31 0 0 0 0 0 0.00493416 1 1 0.00493416 g mi 1,1,2016,7,5,15,25,25025,250250,17,31,0,0,0,0,00 1 1 2016 7 5 15 25 25025 250250 17 107 NULL 31 0 0 0 0 0 0.0103734 1 1 0.0103734 g mi 1,1,2016,7,5,15,25,25025,250250,17,31,0,0,0,0,00 1 1 2016 7 5 15 25 25025 250250 17 106 NULL 31 0 0 0 0 0 0.033059601 1 1 0.033059601 g mi 1,1,2016,7,5,15,25,25025,250250,17,31,0,0,0,0,00 1 1 2016 7 5 15 25 25025 250250 17 100 NULL 31 0 0 0 0 0 0.00553441 1 1 0.00553441 g mi 1,1,2016,7,5,15,25,25025,250250,17,31,0,0,0,0,00 1 1 2016 7 5 15 25 25025 250250 17 98 NULL 31 0 0 0 0 0 453.7569885 1 1 453.7569885 g mi 1,1,2016,7,5,15,25,25025,250250,17,31,0,0,0,0,00 1 1 2016 7 5 15 25 25025 250250 17 91 NULL 31 0 0 0 0 0 0.005979039 1 1 0.005979039 g mi 1,1,2016,7,5,15,25,25025,250250,17,31,0,0,0,0,00 1 1 2016 7 5 15 25 25025 250250 17 90 NULL 31 0 0 0 0 0 453.651001 1 1 453.651001 g mi 1,1,2016,7,5,15,25,25025,250250,17,31,0,0,0,0,00 1 1 2016 7 5 15 25 25025 250250 17 87 NULL 31 0 0 0 0 0 0.115952313 1 1 0.115952313 g mi 1,1,2016,7,5,15,25,25025,250250,17,31,0,0,0,0,00 1 1 2016 7 5 15 25 25025 250250 17 79 NULL 31 0 0 0 0 0 0.108516097 1 1 0.108516097 g mi 1,1,2016,7,5,15,25,25025,250250,17,31,0,0,0,0,00 1 1 2016 7 5 15 25 25025 250250 17 66 NULL 31 0 0 0 0 0 2.34E-05 1 1 2.34E-05 g mi 1,1,2016,7,5,15,25,25025,250250,17,31,0,0,0,0,00 1 1 2016 7 5 15 25 25025 250250 17 59 NULL 31 0 0 0 0 0 7.73E-05 1 1 7.73E-05 g mi 1,1,2016,7,5,15,25,25025,250250,17,31,0,0,0,0,00 1 1 2016 7 5 15 25 25025 250250 17 58 NULL 31 0 0 0 0 0 1.42E-05 1 1 1.42E-05 g mi 1,1,2016,7,5,15,25,25025,250250,17,31,0,0,0,0,00 1 1 2016 7 5 15 25 25025 250250 17 57 NULL 31 0 0 0 0 0 1.63E-05 1 1 1.63E-05 g mi 1,1,2016,7,5,15,25,25025,250250,17,31,0,0,0,0,00 1 1 2016 7 5 15 25 25025 250250 17 56 NULL 31 0 0 0 0 0 1.53E-06 1 1 1.53E-06 g mi 1,1,2016,7,5,15,25,25025,250250,17,31,0,0,0,0,00 1 1 2016 7 5 15 25 25025 250250 17 55 NULL 31 0 0 0 0 0 6.43E-05 1 1 6.43E-05 g mi 1,1,2016,7,5,15,25,25025,250250,17,31,0,0,0,0,00 1 1 2016 7 5 15 25 25025 250250 17 54 NULL 31 0 0 0 0 0 6.19E-06 1 1 6.19E-06 g mi 1,1,2016,7,5,15,25,25025,250250,17,31,0,0,0,0,00 1 1 2016 7 5 15 25 25025 250250 17 53 NULL 31 0 0 0 0 0 3.79E-06 1 1 3.79E-06 g mi 1,1,2016,7,5,15,25,25025,250250,17,31,0,0,0,0,00 1 1 2016 7 5 15 25 25025 250250 17 52 NULL 31 0 0 0 0 0 2.70E-06 1 1 2.70E-06 g mi 1,1,2016,7,5,15,25,25025,250250,17,31,0,0,0,0,00 1 1 2016 7 5 15 25 25025 250250 17 51 NULL 31 0 0 0 0 0 6.02E-06 1 1 6.02E-06 g mi 1,1,2016,7,5,15,25,25025,250250,17,31,0,0,0,0,00 1 1 2016 7 5 15 25 25025 250250 17 36 NULL 31 0 0 0 0 0 0.000119138 1 1 0.000119138 g mi 1,1,2016,7,5,15,25,25025,250250,17,31,0,0,0,0,00 1 1 2016 7 5 15 25 25025 250250 17 35 NULL 31 0 0 0 0 0 1.43E-05 1 1 1.43E-05 g mi 1,1,2016,7,5,15,25,25025,250250,17,31,0,0,0,0,00 1 1 2016 7 5 15 25 25025 250250 17 31 NULL 31 0 0 0 0 0 0.00887758 1 1 0.00887758 g mi 1,1,2016,7,5,15,25,25025,250250,17,31,0,0,0,0,00 1 1 2016 7 5 15 25 25025 250250 17 5 NULL 31 0 0 0 0 0 0.004255366 1 1 0.004255366 g mi 1,1,2016,7,5,15,25,25025,250250,17,31,0,0,0,0,00 1 1 2016 7 5 15 25 25025 250250 17 3 NULL 31 0 0 0 0 0 0.243295908 1 1 0.243295908 g mi 1,1,2016,7,5,15,25,25025,250250,17,31,0,0,0,0,00 1 1 2016 7 5 15 25 25025 250250 17 2 NULL 31 0 0 0 0 0 2.730957508 1 1 2.730957508 g mi 1,1,2016,7,5,15,25,25025,250250,17,31,0,0,0,0,00 1 1 2016 7 5 15 25 25025 250250 17 1 NULL 31 0 0 0 0 0 0.1127211 1 1 0.1127211 g mi 1,1,2016,7,5,15,25,25025,250250,16,31,0,0,0,0,00 1 1 2016 7 5 15 25 25025 250250 16 122 NULL 31 0 0 0 0 0 0.000545325 1 1 0.000545325 g mi 1,1,2016,7,5,15,25,25025,250250,16,31,0,0,0,0,00 1 1 2016 7 5 15 25 25025 250250 16 121 NULL 31 0 0 0 0 0 0.000221774 1 1 0.000221774 g mi 1,1,2016,7,5,15,25,25025,250250,16,31,0,0,0,0,00 1 1 2016 7 5 15 25 25025 250250 16 119 NULL 31 0 0 0 0 0 0 1 1 0 g mi 1,1,2016,7,5,15,25,25025,250250,16,31,0,0,0,0,00 1 1 2016 7 5 15 25 25025 250250 16 118 NULL 31 0 0 0 0 0 0.0040537 1 1 0.0040537 g mi
Boston-Logan International Airport 2016 EDR
Appendix I, Air Quality/Emissions Reduction I-37
1,1,2016,7,5,15,25,25025,250250,16,31,0,0,0,0,00 1 1 2016 7 5 15 25 25025 250250 16 117 NULL 31 0 0 0 0 0 0.0016765 1 1 0.0016765 g mi 1,1,2016,7,5,15,25,25025,250250,16,31,0,0,0,0,00 1 1 2016 7 5 15 25 25025 250250 16 116 NULL 31 0 0 0 0 0 0.00553236 1 1 0.00553236 g mi 1,1,2016,7,5,15,25,25025,250250,16,31,0,0,0,0,00 1 1 2016 7 5 15 25 25025 250250 16 115 NULL 31 0 0 0 0 0 0.0002054 1 1 0.0002054 g mi 1,1,2016,7,5,15,25,25025,250250,16,31,0,0,0,0,00 1 1 2016 7 5 15 25 25025 250250 16 112 NULL 31 0 0 0 0 0 0.00126867 1 1 0.00126867 g mi 1,1,2016,7,5,15,25,25025,250250,16,31,0,0,0,0,00 1 1 2016 7 5 15 25 25025 250250 16 111 NULL 31 0 0 0 0 0 0.00272662 1 1 0.00272662 g mi 1,1,2016,7,5,15,25,25025,250250,16,31,0,0,0,0,00 1 1 2016 7 5 15 25 25025 250250 16 110 NULL 31 0 0 0 0 0 0.00532236 1 1 0.00532236 g mi 1,1,2016,7,5,15,25,25025,250250,16,31,0,0,0,0,00 1 1 2016 7 5 15 25 25025 250250 16 107 NULL 31 0 0 0 0 0 0.0111767 1 1 0.0111767 g mi 1,1,2016,7,5,15,25,25025,250250,16,31,0,0,0,0,00 1 1 2016 7 5 15 25 25025 250250 16 106 NULL 31 0 0 0 0 0 0.0442589 1 1 0.0442589 g mi 1,1,2016,7,5,15,25,25025,250250,16,31,0,0,0,0,00 1 1 2016 7 5 15 25 25025 250250 16 100 NULL 31 0 0 0 0 0 0.00597 1 1 0.00597 g mi 1,1,2016,7,5,15,25,25025,250250,16,31,0,0,0,0,00 1 1 2016 7 5 15 25 25025 250250 16 98 NULL 31 0 0 0 0 0 479.0830078 1 1 479.0830078 g mi 1,1,2016,7,5,15,25,25025,250250,16,31,0,0,0,0,00 1 1 2016 7 5 15 25 25025 250250 16 91 NULL 31 0 0 0 0 0 0.006312671 1 1 0.006312671 g mi 1,1,2016,7,5,15,25,25025,250250,16,31,0,0,0,0,00 1 1 2016 7 5 15 25 25025 250250 16 90 NULL 31 0 0 0 0 0 478.9689941 1 1 478.9689941 g mi 1,1,2016,7,5,15,25,25025,250250,16,31,0,0,0,0,00 1 1 2016 7 5 15 25 25025 250250 16 87 NULL 31 0 0 0 0 0 0.121400006 1 1 0.121400006 g mi 1,1,2016,7,5,15,25,25025,250250,16,31,0,0,0,0,00 1 1 2016 7 5 15 25 25025 250250 16 79 NULL 31 0 0 0 0 0 0.113921002 1 1 0.113921002 g mi 1,1,2016,7,5,15,25,25025,250250,16,31,0,0,0,0,00 1 1 2016 7 5 15 25 25025 250250 16 66 NULL 31 0 0 0 0 0 2.73E-05 1 1 2.73E-05 g mi 1,1,2016,7,5,15,25,25025,250250,16,31,0,0,0,0,00 1 1 2016 7 5 15 25 25025 250250 16 59 NULL 31 0 0 0 0 0 8.37E-05 1 1 8.37E-05 g mi 1,1,2016,7,5,15,25,25025,250250,16,31,0,0,0,0,00 1 1 2016 7 5 15 25 25025 250250 16 58 NULL 31 0 0 0 0 0 1.54E-05 1 1 1.54E-05 g mi 1,1,2016,7,5,15,25,25025,250250,16,31,0,0,0,0,00 1 1 2016 7 5 15 25 25025 250250 16 57 NULL 31 0 0 0 0 0 1.80E-05 1 1 1.80E-05 g mi 1,1,2016,7,5,15,25,25025,250250,16,31,0,0,0,0,00 1 1 2016 7 5 15 25 25025 250250 16 56 NULL 31 0 0 0 0 0 1.67E-06 1 1 1.67E-06 g mi 1,1,2016,7,5,15,25,25025,250250,16,31,0,0,0,0,00 1 1 2016 7 5 15 25 25025 250250 16 55 NULL 31 0 0 0 0 0 7.01E-05 1 1 7.01E-05 g mi 1,1,2016,7,5,15,25,25025,250250,16,31,0,0,0,0,00 1 1 2016 7 5 15 25 25025 250250 16 54 NULL 31 0 0 0 0 0 6.71E-06 1 1 6.71E-06 g mi 1,1,2016,7,5,15,25,25025,250250,16,31,0,0,0,0,00 1 1 2016 7 5 15 25 25025 250250 16 53 NULL 31 0 0 0 0 0 4.13E-06 1 1 4.13E-06 g mi 1,1,2016,7,5,15,25,25025,250250,16,31,0,0,0,0,00 1 1 2016 7 5 15 25 25025 250250 16 52 NULL 31 0 0 0 0 0 2.99E-06 1 1 2.99E-06 g mi 1,1,2016,7,5,15,25,25025,250250,16,31,0,0,0,0,00 1 1 2016 7 5 15 25 25025 250250 16 51 NULL 31 0 0 0 0 0 6.75E-06 1 1 6.75E-06 g mi 1,1,2016,7,5,15,25,25025,250250,16,31,0,0,0,0,00 1 1 2016 7 5 15 25 25025 250250 16 36 NULL 31 0 0 0 0 0 0.000129304 1 1 0.000129304 g mi 1,1,2016,7,5,15,25,25025,250250,16,31,0,0,0,0,00 1 1 2016 7 5 15 25 25025 250250 16 35 NULL 31 0 0 0 0 0 1.58E-05 1 1 1.58E-05 g mi 1,1,2016,7,5,15,25,25025,250250,16,31,0,0,0,0,00 1 1 2016 7 5 15 25 25025 250250 16 31 NULL 31 0 0 0 0 0 0.00937161 1 1 0.00937161 g mi 1,1,2016,7,5,15,25,25025,250250,16,31,0,0,0,0,00 1 1 2016 7 5 15 25 25025 250250 16 5 NULL 31 0 0 0 0 0 0.004640481 1 1 0.004640481 g mi 1,1,2016,7,5,15,25,25025,250250,16,31,0,0,0,0,00 1 1 2016 7 5 15 25 25025 250250 16 3 NULL 31 0 0 0 0 0 0.240565047 1 1 0.240565047 g mi 1,1,2016,7,5,15,25,25025,250250,16,31,0,0,0,0,00 1 1 2016 7 5 15 25 25025 250250 16 2 NULL 31 0 0 0 0 0 2.887135744 1 1 2.887135744 g mi 1,1,2016,7,5,15,25,25025,250250,16,31,0,0,0,0,00 1 1 2016 7 5 15 25 25025 250250 16 1 NULL 31 0 0 0 0 0 0.118506595 1 1 0.118506595 g mi
Boston-Logan International Airport 2016 EDR
Appendix I, Air Quality/Emissions Reduction I-38
1,1,2016,7,5,15,25,25025,250250,15,31,0,0,0,0,00 1 1 2016 7 5 15 25 25025 250250 15 122 NULL 31 0 0 0 0 0 0.000610181 1 1 0.000610181 g mi 1,1,2016,7,5,15,25,25025,250250,15,31,0,0,0,0,00 1 1 2016 7 5 15 25 25025 250250 15 121 NULL 31 0 0 0 0 0 0.00024788 1 1 0.00024788 g mi 1,1,2016,7,5,15,25,25025,250250,15,31,0,0,0,0,00 1 1 2016 7 5 15 25 25025 250250 15 119 NULL 31 0 0 0 0 0 0 1 1 0 g mi 1,1,2016,7,5,15,25,25025,250250,15,31,0,0,0,0,00 1 1 2016 7 5 15 25 25025 250250 15 118 NULL 31 0 0 0 0 0 0.00454062 1 1 0.00454062 g mi 1,1,2016,7,5,15,25,25025,250250,15,31,0,0,0,0,00 1 1 2016 7 5 15 25 25025 250250 15 117 NULL 31 0 0 0 0 0 0.00180606 1 1 0.00180606 g mi 1,1,2016,7,5,15,25,25025,250250,15,31,0,0,0,0,00 1 1 2016 7 5 15 25 25025 250250 15 116 NULL 31 0 0 0 0 0 0.00732576 1 1 0.00732576 g mi 1,1,2016,7,5,15,25,25025,250250,15,31,0,0,0,0,00 1 1 2016 7 5 15 25 25025 250250 15 115 NULL 31 0 0 0 0 0 0.00023576 1 1 0.00023576 g mi 1,1,2016,7,5,15,25,25025,250250,15,31,0,0,0,0,00 1 1 2016 7 5 15 25 25025 250250 15 112 NULL 31 0 0 0 0 0 0.00145322 1 1 0.00145322 g mi 1,1,2016,7,5,15,25,25025,250250,15,31,0,0,0,0,00 1 1 2016 7 5 15 25 25025 250250 15 111 NULL 31 0 0 0 0 0 0.0030509 1 1 0.0030509 g mi 1,1,2016,7,5,15,25,25025,250250,15,31,0,0,0,0,00 1 1 2016 7 5 15 25 25025 250250 15 110 NULL 31 0 0 0 0 0 0.00599383 1 1 0.00599383 g mi 1,1,2016,7,5,15,25,25025,250250,15,31,0,0,0,0,00 1 1 2016 7 5 15 25 25025 250250 15 107 NULL 31 0 0 0 0 0 0.0120404 1 1 0.0120404 g mi 1,1,2016,7,5,15,25,25025,250250,15,31,0,0,0,0,00 1 1 2016 7 5 15 25 25025 250250 15 106 NULL 31 0 0 0 0 0 0.058606099 1 1 0.058606099 g mi 1,1,2016,7,5,15,25,25025,250250,15,31,0,0,0,0,00 1 1 2016 7 5 15 25 25025 250250 15 100 NULL 31 0 0 0 0 0 0.00671969 1 1 0.00671969 g mi 1,1,2016,7,5,15,25,25025,250250,15,31,0,0,0,0,00 1 1 2016 7 5 15 25 25025 250250 15 98 NULL 31 0 0 0 0 0 537.6270142 1 1 537.6270142 g mi 1,1,2016,7,5,15,25,25025,250250,15,31,0,0,0,0,00 1 1 2016 7 5 15 25 25025 250250 15 91 NULL 31 0 0 0 0 0 0.007084184 1 1 0.007084184 g mi 1,1,2016,7,5,15,25,25025,250250,15,31,0,0,0,0,00 1 1 2016 7 5 15 25 25025 250250 15 90 NULL 31 0 0 0 0 0 537.507019 1 1 537.507019 g mi 1,1,2016,7,5,15,25,25025,250250,15,31,0,0,0,0,00 1 1 2016 7 5 15 25 25025 250250 15 87 NULL 31 0 0 0 0 0 0.127673104 1 1 0.127673104 g mi 1,1,2016,7,5,15,25,25025,250250,15,31,0,0,0,0,00 1 1 2016 7 5 15 25 25025 250250 15 79 NULL 31 0 0 0 0 0 0.119943202 1 1 0.119943202 g mi 1,1,2016,7,5,15,25,25025,250250,15,31,0,0,0,0,00 1 1 2016 7 5 15 25 25025 250250 15 66 NULL 31 0 0 0 0 0 3.28E-05 1 1 3.28E-05 g mi 1,1,2016,7,5,15,25,25025,250250,15,31,0,0,0,0,00 1 1 2016 7 5 15 25 25025 250250 15 59 NULL 31 0 0 0 0 0 9.30E-05 1 1 9.30E-05 g mi 1,1,2016,7,5,15,25,25025,250250,15,31,0,0,0,0,00 1 1 2016 7 5 15 25 25025 250250 15 58 NULL 31 0 0 0 0 0 1.72E-05 1 1 1.72E-05 g mi 1,1,2016,7,5,15,25,25025,250250,15,31,0,0,0,0,00 1 1 2016 7 5 15 25 25025 250250 15 57 NULL 31 0 0 0 0 0 2.04E-05 1 1 2.04E-05 g mi 1,1,2016,7,5,15,25,25025,250250,15,31,0,0,0,0,00 1 1 2016 7 5 15 25 25025 250250 15 56 NULL 31 0 0 0 0 0 1.86E-06 1 1 1.86E-06 g mi 1,1,2016,7,5,15,25,25025,250250,15,31,0,0,0,0,00 1 1 2016 7 5 15 25 25025 250250 15 55 NULL 31 0 0 0 0 0 7.84E-05 1 1 7.84E-05 g mi 1,1,2016,7,5,15,25,25025,250250,15,31,0,0,0,0,00 1 1 2016 7 5 15 25 25025 250250 15 54 NULL 31 0 0 0 0 0 7.46E-06 1 1 7.46E-06 g mi 1,1,2016,7,5,15,25,25025,250250,15,31,0,0,0,0,00 1 1 2016 7 5 15 25 25025 250250 15 53 NULL 31 0 0 0 0 0 4.62E-06 1 1 4.62E-06 g mi 1,1,2016,7,5,15,25,25025,250250,15,31,0,0,0,0,00 1 1 2016 7 5 15 25 25025 250250 15 52 NULL 31 0 0 0 0 0 3.46E-06 1 1 3.46E-06 g mi 1,1,2016,7,5,15,25,25025,250250,15,31,0,0,0,0,00 1 1 2016 7 5 15 25 25025 250250 15 51 NULL 31 0 0 0 0 0 7.74E-06 1 1 7.74E-06 g mi 1,1,2016,7,5,15,25,25025,250250,15,31,0,0,0,0,00 1 1 2016 7 5 15 25 25025 250250 15 36 NULL 31 0 0 0 0 0 0.000143917 1 1 0.000143917 g mi 1,1,2016,7,5,15,25,25025,250250,15,31,0,0,0,0,00 1 1 2016 7 5 15 25 25025 250250 15 35 NULL 31 0 0 0 0 0 1.78E-05 1 1 1.78E-05 g mi 1,1,2016,7,5,15,25,25025,250250,15,31,0,0,0,0,00 1 1 2016 7 5 15 25 25025 250250 15 31 NULL 31 0 0 0 0 0 0.0105167 1 1 0.0105167 g mi
Boston-Logan International Airport 2016 EDR
Appendix I, Air Quality/Emissions Reduction I-39
1,1,2016,7,5,15,25,25025,250250,15,31,0,0,0,0,00 1 1 2016 7 5 15 25 25025 250250 15 5 NULL 31 0 0 0 0 0 0.00485863 1 1 0.00485863 g mi 1,1,2016,7,5,15,25,25025,250250,15,31,0,0,0,0,00 1 1 2016 7 5 15 25 25025 250250 15 3 NULL 31 0 0 0 0 0 0.258709222 1 1 0.258709222 g mi 1,1,2016,7,5,15,25,25025,250250,15,31,0,0,0,0,00 1 1 2016 7 5 15 25 25025 250250 15 2 NULL 31 0 0 0 0 0 2.965916395 1 1 2.965916395 g mi 1,1,2016,7,5,15,25,25025,250250,15,31,0,0,0,0,00 1 1 2016 7 5 15 25 25025 250250 15 1 NULL 31 0 0 0 0 0 0.124744698 1 1 0.124744698 g mi 1,1,2016,7,5,15,25,25025,250250,14,31,0,0,0,0,00 1 1 2016 7 5 15 25 25025 250250 14 122 NULL 31 0 0 0 0 0 0.000755474 1 1 0.000755474 g mi 1,1,2016,7,5,15,25,25025,250250,14,31,0,0,0,0,00 1 1 2016 7 5 15 25 25025 250250 14 121 NULL 31 0 0 0 0 0 0.000306653 1 1 0.000306653 g mi 1,1,2016,7,5,15,25,25025,250250,14,31,0,0,0,0,00 1 1 2016 7 5 15 25 25025 250250 14 119 NULL 31 0 0 0 0 0 0 1 1 0 g mi 1,1,2016,7,5,15,25,25025,250250,14,31,0,0,0,0,00 1 1 2016 7 5 15 25 25025 250250 14 118 NULL 31 0 0 0 0 0 0.00561965 1 1 0.00561965 g mi 1,1,2016,7,5,15,25,25025,250250,14,31,0,0,0,0,00 1 1 2016 7 5 15 25 25025 250250 14 117 NULL 31 0 0 0 0 0 0.00194578 1 1 0.00194578 g mi 1,1,2016,7,5,15,25,25025,250250,14,31,0,0,0,0,00 1 1 2016 7 5 15 25 25025 250250 14 116 NULL 31 0 0 0 0 0 0.00826578 1 1 0.00826578 g mi 1,1,2016,7,5,15,25,25025,250250,14,31,0,0,0,0,00 1 1 2016 7 5 15 25 25025 250250 14 115 NULL 31 0 0 0 0 0 0.000291024 1 1 0.000291024 g mi 1,1,2016,7,5,15,25,25025,250250,14,31,0,0,0,0,00 1 1 2016 7 5 15 25 25025 250250 14 112 NULL 31 0 0 0 0 0 0.00172933 1 1 0.00172933 g mi 1,1,2016,7,5,15,25,25025,250250,14,31,0,0,0,0,00 1 1 2016 7 5 15 25 25025 250250 14 111 NULL 31 0 0 0 0 0 0.00377736 1 1 0.00377736 g mi 1,1,2016,7,5,15,25,25025,250250,14,31,0,0,0,0,00 1 1 2016 7 5 15 25 25025 250250 14 110 NULL 31 0 0 0 0 0 0.00734897 1 1 0.00734897 g mi 1,1,2016,7,5,15,25,25025,250250,14,31,0,0,0,0,00 1 1 2016 7 5 15 25 25025 250250 14 107 NULL 31 0 0 0 0 0 0.0129719 1 1 0.0129719 g mi 1,1,2016,7,5,15,25,25025,250250,14,31,0,0,0,0,00 1 1 2016 7 5 15 25 25025 250250 14 106 NULL 31 0 0 0 0 0 0.066126198 1 1 0.066126198 g mi 1,1,2016,7,5,15,25,25025,250250,14,31,0,0,0,0,00 1 1 2016 7 5 15 25 25025 250250 14 100 NULL 31 0 0 0 0 0 0.00823882 1 1 0.00823882 g mi 1,1,2016,7,5,15,25,25025,250250,14,31,0,0,0,0,00 1 1 2016 7 5 15 25 25025 250250 14 98 NULL 31 0 0 0 0 0 601.4290161 1 1 601.4290161 g mi 1,1,2016,7,5,15,25,25025,250250,14,31,0,0,0,0,00 1 1 2016 7 5 15 25 25025 250250 14 91 NULL 31 0 0 0 0 0 0.007924982 1 1 0.007924982 g mi 1,1,2016,7,5,15,25,25025,250250,14,31,0,0,0,0,00 1 1 2016 7 5 15 25 25025 250250 14 90 NULL 31 0 0 0 0 0 601.2979736 1 1 601.2979736 g mi 1,1,2016,7,5,15,25,25025,250250,14,31,0,0,0,0,00 1 1 2016 7 5 15 25 25025 250250 14 87 NULL 31 0 0 0 0 0 0.137463138 1 1 0.137463138 g mi 1,1,2016,7,5,15,25,25025,250250,14,31,0,0,0,0,00 1 1 2016 7 5 15 25 25025 250250 14 79 NULL 31 0 0 0 0 0 0.129362106 1 1 0.129362106 g mi 1,1,2016,7,5,15,25,25025,250250,14,31,0,0,0,0,00 1 1 2016 7 5 15 25 25025 250250 14 66 NULL 31 0 0 0 0 0 4.09E-05 1 1 4.09E-05 g mi 1,1,2016,7,5,15,25,25025,250250,14,31,0,0,0,0,00 1 1 2016 7 5 15 25 25025 250250 14 59 NULL 31 0 0 0 0 0 0.00011437 1 1 0.00011437 g mi 1,1,2016,7,5,15,25,25025,250250,14,31,0,0,0,0,00 1 1 2016 7 5 15 25 25025 250250 14 58 NULL 31 0 0 0 0 0 2.12E-05 1 1 2.12E-05 g mi 1,1,2016,7,5,15,25,25025,250250,14,31,0,0,0,0,00 1 1 2016 7 5 15 25 25025 250250 14 57 NULL 31 0 0 0 0 0 2.56E-05 1 1 2.56E-05 g mi 1,1,2016,7,5,15,25,25025,250250,14,31,0,0,0,0,00 1 1 2016 7 5 15 25 25025 250250 14 56 NULL 31 0 0 0 0 0 2.31E-06 1 1 2.31E-06 g mi 1,1,2016,7,5,15,25,25025,250250,14,31,0,0,0,0,00 1 1 2016 7 5 15 25 25025 250250 14 55 NULL 31 0 0 0 0 0 9.70E-05 1 1 9.70E-05 g mi 1,1,2016,7,5,15,25,25025,250250,14,31,0,0,0,0,00 1 1 2016 7 5 15 25 25025 250250 14 54 NULL 31 0 0 0 0 0 9.17E-06 1 1 9.17E-06 g mi 1,1,2016,7,5,15,25,25025,250250,14,31,0,0,0,0,00 1 1 2016 7 5 15 25 25025 250250 14 53 NULL 31 0 0 0 0 0 5.71E-06 1 1 5.71E-06 g mi 1,1,2016,7,5,15,25,25025,250250,14,31,0,0,0,0,00 1 1 2016 7 5 15 25 25025 250250 14 52 NULL 31 0 0 0 0 0 4.34E-06 1 1 4.34E-06 g mi
Boston-Logan International Airport 2016 EDR
Appendix I, Air Quality/Emissions Reduction I-40
1,1,2016,7,5,15,25,25025,250250,14,31,0,0,0,0,00 1 1 2016 7 5 15 25 25025 250250 14 51 NULL 31 0 0 0 0 0 9.82E-06 1 1 9.82E-06 g mi 1,1,2016,7,5,15,25,25025,250250,14,31,0,0,0,0,00 1 1 2016 7 5 15 25 25025 250250 14 36 NULL 31 0 0 0 0 0 0.000177314 1 1 0.000177314 g mi 1,1,2016,7,5,15,25,25025,250250,14,31,0,0,0,0,00 1 1 2016 7 5 15 25 25025 250250 14 35 NULL 31 0 0 0 0 0 2.23E-05 1 1 2.23E-05 g mi 1,1,2016,7,5,15,25,25025,250250,14,31,0,0,0,0,00 1 1 2016 7 5 15 25 25025 250250 14 31 NULL 31 0 0 0 0 0 0.0117668 1 1 0.0117668 g mi 1,1,2016,7,5,15,25,25025,250250,14,31,0,0,0,0,00 1 1 2016 7 5 15 25 25025 250250 14 5 NULL 31 0 0 0 0 0 0.00533265 1 1 0.00533265 g mi 1,1,2016,7,5,15,25,25025,250250,14,31,0,0,0,0,00 1 1 2016 7 5 15 25 25025 250250 14 3 NULL 31 0 0 0 0 0 0.27053839 1 1 0.27053839 g mi 1,1,2016,7,5,15,25,25025,250250,14,31,0,0,0,0,00 1 1 2016 7 5 15 25 25025 250250 14 2 NULL 31 0 0 0 0 0 3.530572891 1 1 3.530572891 g mi 1,1,2016,7,5,15,25,25025,250250,14,31,0,0,0,0,00 1 1 2016 7 5 15 25 25025 250250 14 1 NULL 31 0 0 0 0 0 0.134632707 1 1 0.134632707 g mi 1,1,2016,7,5,15,25,25025,250250,13,31,0,0,0,0,00 1 1 2016 7 5 15 25 25025 250250 13 122 NULL 31 0 0 0 0 0 0.000852588 1 1 0.000852588 g mi 1,1,2016,7,5,15,25,25025,250250,13,31,0,0,0,0,00 1 1 2016 7 5 15 25 25025 250250 13 121 NULL 31 0 0 0 0 0 0.000345102 1 1 0.000345102 g mi 1,1,2016,7,5,15,25,25025,250250,13,31,0,0,0,0,00 1 1 2016 7 5 15 25 25025 250250 13 119 NULL 31 0 0 0 0 0 0 1 1 0 g mi 1,1,2016,7,5,15,25,25025,250250,13,31,0,0,0,0,00 1 1 2016 7 5 15 25 25025 250250 13 118 NULL 31 0 0 0 0 0 0.00634918 1 1 0.00634918 g mi 1,1,2016,7,5,15,25,25025,250250,13,31,0,0,0,0,00 1 1 2016 7 5 15 25 25025 250250 13 117 NULL 31 0 0 0 0 0 0.0020966 1 1 0.0020966 g mi 1,1,2016,7,5,15,25,25025,250250,13,31,0,0,0,0,00 1 1 2016 7 5 15 25 25025 250250 13 116 NULL 31 0 0 0 0 0 0.00985681 1 1 0.00985681 g mi 1,1,2016,7,5,15,25,25025,250250,13,31,0,0,0,0,00 1 1 2016 7 5 15 25 25025 250250 13 115 NULL 31 0 0 0 0 0 0.000339974 1 1 0.000339974 g mi 1,1,2016,7,5,15,25,25025,250250,13,31,0,0,0,0,00 1 1 2016 7 5 15 25 25025 250250 13 112 NULL 31 0 0 0 0 0 0.0019461 1 1 0.0019461 g mi 1,1,2016,7,5,15,25,25025,250250,13,31,0,0,0,0,00 1 1 2016 7 5 15 25 25025 250250 13 111 NULL 31 0 0 0 0 0 0.00426293 1 1 0.00426293 g mi 1,1,2016,7,5,15,25,25025,250250,13,31,0,0,0,0,00 1 1 2016 7 5 15 25 25025 250250 13 110 NULL 31 0 0 0 0 0 0.00829528 1 1 0.00829528 g mi 1,1,2016,7,5,15,25,25025,250250,13,31,0,0,0,0,00 1 1 2016 7 5 15 25 25025 250250 13 107 NULL 31 0 0 0 0 0 0.0139774 1 1 0.0139774 g mi 1,1,2016,7,5,15,25,25025,250250,13,31,0,0,0,0,00 1 1 2016 7 5 15 25 25025 250250 13 106 NULL 31 0 0 0 0 0 0.078854501 1 1 0.078854501 g mi 1,1,2016,7,5,15,25,25025,250250,13,31,0,0,0,0,00 1 1 2016 7 5 15 25 25025 250250 13 100 NULL 31 0 0 0 0 0 0.00929102 1 1 0.00929102 g mi 1,1,2016,7,5,15,25,25025,250250,13,31,0,0,0,0,00 1 1 2016 7 5 15 25 25025 250250 13 98 NULL 31 0 0 0 0 0 699.65802 1 1 699.65802 g mi 1,1,2016,7,5,15,25,25025,250250,13,31,0,0,0,0,00 1 1 2016 7 5 15 25 25025 250250 13 91 NULL 31 0 0 0 0 0 0.009219578 1 1 0.009219578 g mi 1,1,2016,7,5,15,25,25025,250250,13,31,0,0,0,0,00 1 1 2016 7 5 15 25 25025 250250 13 90 NULL 31 0 0 0 0 0 699.5159912 1 1 699.5159912 g mi 1,1,2016,7,5,15,25,25025,250250,13,31,0,0,0,0,00 1 1 2016 7 5 15 25 25025 250250 13 87 NULL 31 0 0 0 0 0 0.150854617 1 1 0.150854617 g mi 1,1,2016,7,5,15,25,25025,250250,13,31,0,0,0,0,00 1 1 2016 7 5 15 25 25025 250250 13 79 NULL 31 0 0 0 0 0 0.142016098 1 1 0.142016098 g mi 1,1,2016,7,5,15,25,25025,250250,13,31,0,0,0,0,00 1 1 2016 7 5 15 25 25025 250250 13 66 NULL 31 0 0 0 0 0 5.46E-05 1 1 5.46E-05 g mi 1,1,2016,7,5,15,25,25025,250250,13,31,0,0,0,0,00 1 1 2016 7 5 15 25 25025 250250 13 59 NULL 31 0 0 0 0 0 0.000126362 1 1 0.000126362 g mi 1,1,2016,7,5,15,25,25025,250250,13,31,0,0,0,0,00 1 1 2016 7 5 15 25 25025 250250 13 58 NULL 31 0 0 0 0 0 2.38E-05 1 1 2.38E-05 g mi 1,1,2016,7,5,15,25,25025,250250,13,31,0,0,0,0,00 1 1 2016 7 5 15 25 25025 250250 13 57 NULL 31 0 0 0 0 0 2.99E-05 1 1 2.99E-05 g mi 1,1,2016,7,5,15,25,25025,250250,13,31,0,0,0,0,00 1 1 2016 7 5 15 25 25025 250250 13 56 NULL 31 0 0 0 0 0 2.60E-06 1 1 2.60E-06 g mi
Boston-Logan International Airport 2016 EDR
Appendix I, Air Quality/Emissions Reduction I-41
1,1,2016,7,5,15,25,25025,250250,13,31,0,0,0,0,00 1 1 2016 7 5 15 25 25025 250250 13 55 NULL 31 0 0 0 0 0 0.000109185 1 1 0.000109185 g mi 1,1,2016,7,5,15,25,25025,250250,13,31,0,0,0,0,00 1 1 2016 7 5 15 25 25025 250250 13 54 NULL 31 0 0 0 0 0 1.02E-05 1 1 1.02E-05 g mi 1,1,2016,7,5,15,25,25025,250250,13,31,0,0,0,0,00 1 1 2016 7 5 15 25 25025 250250 13 53 NULL 31 0 0 0 0 0 6.43E-06 1 1 6.43E-06 g mi 1,1,2016,7,5,15,25,25025,250250,13,31,0,0,0,0,00 1 1 2016 7 5 15 25 25025 250250 13 52 NULL 31 0 0 0 0 0 5.22E-06 1 1 5.22E-06 g mi 1,1,2016,7,5,15,25,25025,250250,13,31,0,0,0,0,00 1 1 2016 7 5 15 25 25025 250250 13 51 NULL 31 0 0 0 0 0 1.19E-05 1 1 1.19E-05 g mi 1,1,2016,7,5,15,25,25025,250250,13,31,0,0,0,0,00 1 1 2016 7 5 15 25 25025 250250 13 36 NULL 31 0 0 0 0 0 0.00019711 1 1 0.00019711 g mi 1,1,2016,7,5,15,25,25025,250250,13,31,0,0,0,0,00 1 1 2016 7 5 15 25 25025 250250 13 35 NULL 31 0 0 0 0 0 2.60E-05 1 1 2.60E-05 g mi 1,1,2016,7,5,15,25,25025,250250,13,31,0,0,0,0,00 1 1 2016 7 5 15 25 25025 250250 13 31 NULL 31 0 0 0 0 0 0.0136925 1 1 0.0136925 g mi 1,1,2016,7,5,15,25,25025,250250,13,31,0,0,0,0,00 1 1 2016 7 5 15 25 25025 250250 13 5 NULL 31 0 0 0 0 0 0.005771743 1 1 0.005771743 g mi 1,1,2016,7,5,15,25,25025,250250,13,31,0,0,0,0,00 1 1 2016 7 5 15 25 25025 250250 13 3 NULL 31 0 0 0 0 0 0.290587336 1 1 0.290587336 g mi 1,1,2016,7,5,15,25,25025,250250,13,31,0,0,0,0,00 1 1 2016 7 5 15 25 25025 250250 13 2 NULL 31 0 0 0 0 0 3.886432409 1 1 3.886432409 g mi 1,1,2016,7,5,15,25,25025,250250,13,31,0,0,0,0,00 1 1 2016 7 5 15 25 25025 250250 13 1 NULL 31 0 0 0 0 0 0.147721902 1 1 0.147721902 g mi 1,1,2016,7,5,15,25,25025,250250,12,31,0,0,0,0,00 1 1 2016 7 5 15 25 25025 250250 12 122 NULL 31 0 0 0 0 0 0.000960362 1 1 0.000960362 g mi 1,1,2016,7,5,15,25,25025,250250,12,31,0,0,0,0,00 1 1 2016 7 5 15 25 25025 250250 12 121 NULL 31 0 0 0 0 0 0.00038653 1 1 0.00038653 g mi 1,1,2016,7,5,15,25,25025,250250,12,31,0,0,0,0,00 1 1 2016 7 5 15 25 25025 250250 12 119 NULL 31 0 0 0 0 0 0 1 1 0 g mi 1,1,2016,7,5,15,25,25025,250250,12,31,0,0,0,0,00 1 1 2016 7 5 15 25 25025 250250 12 118 NULL 31 0 0 0 0 0 0.00717113 1 1 0.00717113 g mi 1,1,2016,7,5,15,25,25025,250250,12,31,0,0,0,0,00 1 1 2016 7 5 15 25 25025 250250 12 117 NULL 31 0 0 0 0 0 0.00225858 1 1 0.00225858 g mi 1,1,2016,7,5,15,25,25025,250250,12,31,0,0,0,0,00 1 1 2016 7 5 15 25 25025 250250 12 116 NULL 31 0 0 0 0 0 0.0130533 1 1 0.0130533 g mi 1,1,2016,7,5,15,25,25025,250250,12,31,0,0,0,0,00 1 1 2016 7 5 15 25 25025 250250 12 115 NULL 31 0 0 0 0 0 0.000412149 1 1 0.000412149 g mi 1,1,2016,7,5,15,25,25025,250250,12,31,0,0,0,0,00 1 1 2016 7 5 15 25 25025 250250 12 112 NULL 31 0 0 0 0 0 0.00223454 1 1 0.00223454 g mi 1,1,2016,7,5,15,25,25025,250250,12,31,0,0,0,0,00 1 1 2016 7 5 15 25 25025 250250 12 111 NULL 31 0 0 0 0 0 0.0048018 1 1 0.0048018 g mi 1,1,2016,7,5,15,25,25025,250250,12,31,0,0,0,0,00 1 1 2016 7 5 15 25 25025 250250 12 110 NULL 31 0 0 0 0 0 0.00940568 1 1 0.00940568 g mi 1,1,2016,7,5,15,25,25025,250250,12,31,0,0,0,0,00 1 1 2016 7 5 15 25 25025 250250 12 107 NULL 31 0 0 0 0 0 0.0150573 1 1 0.0150573 g mi 1,1,2016,7,5,15,25,25025,250250,12,31,0,0,0,0,00 1 1 2016 7 5 15 25 25025 250250 12 106 NULL 31 0 0 0 0 0 0.104427002 1 1 0.104427002 g mi 1,1,2016,7,5,15,25,25025,250250,12,31,0,0,0,0,00 1 1 2016 7 5 15 25 25025 250250 12 100 NULL 31 0 0 0 0 0 0.0105134 1 1 0.0105134 g mi 1,1,2016,7,5,15,25,25025,250250,12,31,0,0,0,0,00 1 1 2016 7 5 15 25 25025 250250 12 98 NULL 31 0 0 0 0 0 891.2810059 1 1 891.2810059 g mi 1,1,2016,7,5,15,25,25025,250250,12,31,0,0,0,0,00 1 1 2016 7 5 15 25 25025 250250 12 91 NULL 31 0 0 0 0 0 0.01174516 1 1 0.01174516 g mi 1,1,2016,7,5,15,25,25025,250250,12,31,0,0,0,0,00 1 1 2016 7 5 15 25 25025 250250 12 90 NULL 31 0 0 0 0 0 891.1220093 1 1 891.1220093 g mi 1,1,2016,7,5,15,25,25025,250250,12,31,0,0,0,0,00 1 1 2016 7 5 15 25 25025 250250 12 87 NULL 31 0 0 0 0 0 0.175893709 1 1 0.175893709 g mi 1,1,2016,7,5,15,25,25025,250250,12,31,0,0,0,0,00 1 1 2016 7 5 15 25 25025 250250 12 79 NULL 31 0 0 0 0 0 0.165509611 1 1 0.165509611 g mi 1,1,2016,7,5,15,25,25025,250250,12,31,0,0,0,0,00 1 1 2016 7 5 15 25 25025 250250 12 66 NULL 31 0 0 0 0 0 8.19E-05 1 1 8.19E-05 g mi
Boston-Logan International Airport 2016 EDR
Appendix I, Air Quality/Emissions Reduction I-42
1,1,2016,7,5,15,25,25025,250250,12,31,0,0,0,0,00 1 1 2016 7 5 15 25 25025 250250 12 59 NULL 31 0 0 0 0 0 0.000136307 1 1 0.000136307 g mi 1,1,2016,7,5,15,25,25025,250250,12,31,0,0,0,0,00 1 1 2016 7 5 15 25 25025 250250 12 58 NULL 31 0 0 0 0 0 2.63E-05 1 1 2.63E-05 g mi 1,1,2016,7,5,15,25,25025,250250,12,31,0,0,0,0,00 1 1 2016 7 5 15 25 25025 250250 12 57 NULL 31 0 0 0 0 0 3.60E-05 1 1 3.60E-05 g mi 1,1,2016,7,5,15,25,25025,250250,12,31,0,0,0,0,00 1 1 2016 7 5 15 25 25025 250250 12 56 NULL 31 0 0 0 0 0 2.93E-06 1 1 2.93E-06 g mi 1,1,2016,7,5,15,25,25025,250250,12,31,0,0,0,0,00 1 1 2016 7 5 15 25 25025 250250 12 55 NULL 31 0 0 0 0 0 0.00012245 1 1 0.00012245 g mi 1,1,2016,7,5,15,25,25025,250250,12,31,0,0,0,0,00 1 1 2016 7 5 15 25 25025 250250 12 54 NULL 31 0 0 0 0 0 1.10E-05 1 1 1.10E-05 g mi 1,1,2016,7,5,15,25,25025,250250,12,31,0,0,0,0,00 1 1 2016 7 5 15 25 25025 250250 12 53 NULL 31 0 0 0 0 0 7.20E-06 1 1 7.20E-06 g mi 1,1,2016,7,5,15,25,25025,250250,12,31,0,0,0,0,00 1 1 2016 7 5 15 25 25025 250250 12 52 NULL 31 0 0 0 0 0 6.66E-06 1 1 6.66E-06 g mi 1,1,2016,7,5,15,25,25025,250250,12,31,0,0,0,0,00 1 1 2016 7 5 15 25 25025 250250 12 51 NULL 31 0 0 0 0 0 1.51E-05 1 1 1.51E-05 g mi 1,1,2016,7,5,15,25,25025,250250,12,31,0,0,0,0,00 1 1 2016 7 5 15 25 25025 250250 12 36 NULL 31 0 0 0 0 0 0.000215323 1 1 0.000215323 g mi 1,1,2016,7,5,15,25,25025,250250,12,31,0,0,0,0,00 1 1 2016 7 5 15 25 25025 250250 12 35 NULL 31 0 0 0 0 0 3.10E-05 1 1 3.10E-05 g mi 1,1,2016,7,5,15,25,25025,250250,12,31,0,0,0,0,00 1 1 2016 7 5 15 25 25025 250250 12 31 NULL 31 0 0 0 0 0 0.017449699 1 1 0.017449699 g mi 1,1,2016,7,5,15,25,25025,250250,12,31,0,0,0,0,00 1 1 2016 7 5 15 25 25025 250250 12 5 NULL 31 0 0 0 0 0 0.006440759 1 1 0.006440759 g mi 1,1,2016,7,5,15,25,25025,250250,12,31,0,0,0,0,00 1 1 2016 7 5 15 25 25025 250250 12 3 NULL 31 0 0 0 0 0 0.330884218 1 1 0.330884218 g mi 1,1,2016,7,5,15,25,25025,250250,12,31,0,0,0,0,00 1 1 2016 7 5 15 25 25025 250250 12 2 NULL 31 0 0 0 0 0 4.24930191 1 1 4.24930191 g mi 1,1,2016,7,5,15,25,25025,250250,12,31,0,0,0,0,00 1 1 2016 7 5 15 25 25025 250250 12 1 NULL 31 0 0 0 0 0 0.171878904 1 1 0.171878904 g mi 1,1,2016,7,5,15,25,25025,250250,11,31,0,0,0,0,00 1 1 2016 7 5 15 25 25025 250250 11 122 NULL 31 0 0 0 0 0 0.00128368 1 1 0.00128368 g mi 1,1,2016,7,5,15,25,25025,250250,11,31,0,0,0,0,00 1 1 2016 7 5 15 25 25025 250250 11 121 NULL 31 0 0 0 0 0 0.000510813 1 1 0.000510813 g mi 1,1,2016,7,5,15,25,25025,250250,11,31,0,0,0,0,00 1 1 2016 7 5 15 25 25025 250250 11 119 NULL 31 0 0 0 0 0 0 1 1 0 g mi 1,1,2016,7,5,15,25,25025,250250,11,31,0,0,0,0,00 1 1 2016 7 5 15 25 25025 250250 11 118 NULL 31 0 0 0 0 0 0.00963698 1 1 0.00963698 g mi 1,1,2016,7,5,15,25,25025,250250,11,31,0,0,0,0,00 1 1 2016 7 5 15 25 25025 250250 11 117 NULL 31 0 0 0 0 0 0.00243372 1 1 0.00243372 g mi 1,1,2016,7,5,15,25,25025,250250,11,31,0,0,0,0,00 1 1 2016 7 5 15 25 25025 250250 11 116 NULL 31 0 0 0 0 0 0.022643 1 1 0.022643 g mi 1,1,2016,7,5,15,25,25025,250250,11,31,0,0,0,0,00 1 1 2016 7 5 15 25 25025 250250 11 115 NULL 31 0 0 0 0 0 0.000628671 1 1 0.000628671 g mi 1,1,2016,7,5,15,25,25025,250250,11,31,0,0,0,0,00 1 1 2016 7 5 15 25 25025 250250 11 112 NULL 31 0 0 0 0 0 0.00309987 1 1 0.00309987 g mi 1,1,2016,7,5,15,25,25025,250250,11,31,0,0,0,0,00 1 1 2016 7 5 15 25 25025 250250 11 111 NULL 31 0 0 0 0 0 0.00641839 1 1 0.00641839 g mi 1,1,2016,7,5,15,25,25025,250250,11,31,0,0,0,0,00 1 1 2016 7 5 15 25 25025 250250 11 110 NULL 31 0 0 0 0 0 0.0127369 1 1 0.0127369 g mi 1,1,2016,7,5,15,25,25025,250250,11,31,0,0,0,0,00 1 1 2016 7 5 15 25 25025 250250 11 107 NULL 31 0 0 0 0 0 0.0162249 1 1 0.0162249 g mi 1,1,2016,7,5,15,25,25025,250250,11,31,0,0,0,0,00 1 1 2016 7 5 15 25 25025 250250 11 106 NULL 31 0 0 0 0 0 0.181143999 1 1 0.181143999 g mi 1,1,2016,7,5,15,25,25025,250250,11,31,0,0,0,0,00 1 1 2016 7 5 15 25 25025 250250 11 100 NULL 31 0 0 0 0 0 0.0141806 1 1 0.0141806 g mi 1,1,2016,7,5,15,25,25025,250250,11,31,0,0,0,0,00 1 1 2016 7 5 15 25 25025 250250 11 98 NULL 31 0 0 0 0 0 1466.150024 1 1 1466.150024 g mi 1,1,2016,7,5,15,25,25025,250250,11,31,0,0,0,0,00 1 1 2016 7 5 15 25 25025 250250 11 91 NULL 31 0 0 0 0 0 0.01932182 1 1 0.01932182 g mi
Boston-Logan International Airport 2016 EDR
Appendix I, Air Quality/Emissions Reduction I-43
1,1,2016,7,5,15,25,25025,250250,11,31,0,0,0,0,00 1 1 2016 7 5 15 25 25025 250250 11 90 NULL 31 0 0 0 0 0 1465.939941 1 1 1465.939941 g mi 1,1,2016,7,5,15,25,25025,250250,11,31,0,0,0,0,00 1 1 2016 7 5 15 25 25025 250250 11 87 NULL 31 0 0 0 0 0 0.251010656 1 1 0.251010656 g mi 1,1,2016,7,5,15,25,25025,250250,11,31,0,0,0,0,00 1 1 2016 7 5 15 25 25025 250250 11 79 NULL 31 0 0 0 0 0 0.235990405 1 1 0.235990405 g mi 1,1,2016,7,5,15,25,25025,250250,11,31,0,0,0,0,00 1 1 2016 7 5 15 25 25025 250250 11 66 NULL 31 0 0 0 0 0 0.000163752 1 1 0.000163752 g mi 1,1,2016,7,5,15,25,25025,250250,11,31,0,0,0,0,00 1 1 2016 7 5 15 25 25025 250250 11 59 NULL 31 0 0 0 0 0 0.000166143 1 1 0.000166143 g mi 1,1,2016,7,5,15,25,25025,250250,11,31,0,0,0,0,00 1 1 2016 7 5 15 25 25025 250250 11 58 NULL 31 0 0 0 0 0 3.40E-05 1 1 3.40E-05 g mi 1,1,2016,7,5,15,25,25025,250250,11,31,0,0,0,0,00 1 1 2016 7 5 15 25 25025 250250 11 57 NULL 31 0 0 0 0 0 5.42E-05 1 1 5.42E-05 g mi 1,1,2016,7,5,15,25,25025,250250,11,31,0,0,0,0,00 1 1 2016 7 5 15 25 25025 250250 11 56 NULL 31 0 0 0 0 0 3.91E-06 1 1 3.91E-06 g mi 1,1,2016,7,5,15,25,25025,250250,11,31,0,0,0,0,00 1 1 2016 7 5 15 25 25025 250250 11 55 NULL 31 0 0 0 0 0 0.000162243 1 1 0.000162243 g mi 1,1,2016,7,5,15,25,25025,250250,11,31,0,0,0,0,00 1 1 2016 7 5 15 25 25025 250250 11 54 NULL 31 0 0 0 0 0 1.36E-05 1 1 1.36E-05 g mi 1,1,2016,7,5,15,25,25025,250250,11,31,0,0,0,0,00 1 1 2016 7 5 15 25 25025 250250 11 53 NULL 31 0 0 0 0 0 9.51E-06 1 1 9.51E-06 g mi 1,1,2016,7,5,15,25,25025,250250,11,31,0,0,0,0,00 1 1 2016 7 5 15 25 25025 250250 11 52 NULL 31 0 0 0 0 0 1.10E-05 1 1 1.10E-05 g mi 1,1,2016,7,5,15,25,25025,250250,11,31,0,0,0,0,00 1 1 2016 7 5 15 25 25025 250250 11 51 NULL 31 0 0 0 0 0 2.48E-05 1 1 2.48E-05 g mi 1,1,2016,7,5,15,25,25025,250250,11,31,0,0,0,0,00 1 1 2016 7 5 15 25 25025 250250 11 36 NULL 31 0 0 0 0 0 0.000269963 1 1 0.000269963 g mi 1,1,2016,7,5,15,25,25025,250250,11,31,0,0,0,0,00 1 1 2016 7 5 15 25 25025 250250 11 35 NULL 31 0 0 0 0 0 4.62E-05 1 1 4.62E-05 g mi 1,1,2016,7,5,15,25,25025,250250,11,31,0,0,0,0,00 1 1 2016 7 5 15 25 25025 250250 11 31 NULL 31 0 0 0 0 0 0.028721301 1 1 0.028721301 g mi 1,1,2016,7,5,15,25,25025,250250,11,31,0,0,0,0,00 1 1 2016 7 5 15 25 25025 250250 11 5 NULL 31 0 0 0 0 0 0.008447787 1 1 0.008447787 g mi 1,1,2016,7,5,15,25,25025,250250,11,31,0,0,0,0,00 1 1 2016 7 5 15 25 25025 250250 11 3 NULL 31 0 0 0 0 0 0.451777756 1 1 0.451777756 g mi 1,1,2016,7,5,15,25,25025,250250,11,31,0,0,0,0,00 1 1 2016 7 5 15 25 25025 250250 11 2 NULL 31 0 0 0 0 0 5.337890148 1 1 5.337890148 g mi 1,1,2016,7,5,15,25,25025,250250,11,31,0,0,0,0,00 1 1 2016 7 5 15 25 25025 250250 11 1 NULL 31 0 0 0 0 0 0.244350404 1 1 0.244350404 g mi 1,1,2016,7,5,15,25,25025,250250,10,21,0,0,0,0,00 1 1 2016 7 5 15 25 25025 250250 10 122 NULL 21 0 0 0 0 0 0.000385359 1 1 0.000385359 g mi 1,1,2016,7,5,15,25,25025,250250,10,21,0,0,0,0,00 1 1 2016 7 5 15 25 25025 250250 10 121 NULL 21 0 0 0 0 0 0.000158324 1 1 0.000158324 g mi 1,1,2016,7,5,15,25,25025,250250,10,21,0,0,0,0,00 1 1 2016 7 5 15 25 25025 250250 10 119 NULL 21 0 0 0 0 0 0 1 1 0 g mi 1,1,2016,7,5,15,25,25025,250250,10,21,0,0,0,0,00 1 1 2016 7 5 15 25 25025 250250 10 118 NULL 21 0 0 0 0 0 0.00283591 1 1 0.00283591 g mi 1,1,2016,7,5,15,25,25025,250250,10,21,0,0,0,0,00 1 1 2016 7 5 15 25 25025 250250 10 117 NULL 21 0 0 0 0 0 0.001229 1 1 0.001229 g mi 1,1,2016,7,5,15,25,25025,250250,10,21,0,0,0,0,00 1 1 2016 7 5 15 25 25025 250250 10 116 NULL 21 0 0 0 0 0 0.00128294 1 1 0.00128294 g mi 1,1,2016,7,5,15,25,25025,250250,10,21,0,0,0,0,00 1 1 2016 7 5 15 25 25025 250250 10 115 NULL 21 0 0 0 0 0 0.000109844 1 1 0.000109844 g mi 1,1,2016,7,5,15,25,25025,250250,10,21,0,0,0,0,00 1 1 2016 7 5 15 25 25025 250250 10 112 NULL 21 0 0 0 0 0 0.000483508 1 1 0.000483508 g mi 1,1,2016,7,5,15,25,25025,250250,10,21,0,0,0,0,00 1 1 2016 7 5 15 25 25025 250250 10 111 NULL 21 0 0 0 0 0 0.00192679 1 1 0.00192679 g mi 1,1,2016,7,5,15,25,25025,250250,10,21,0,0,0,0,00 1 1 2016 7 5 15 25 25025 250250 10 110 NULL 21 0 0 0 0 0 0.00331942 1 1 0.00331942 g mi 1,1,2016,7,5,15,25,25025,250250,10,21,0,0,0,0,00 1 1 2016 7 5 15 25 25025 250250 10 107 NULL 21 0 0 0 0 0 0.00819337 1 1 0.00819337 g mi
Boston-Logan International Airport 2016 EDR
Appendix I, Air Quality/Emissions Reduction I-44
1,1,2016,7,5,15,25,25025,250250,10,21,0,0,0,0,00 1 1 2016 7 5 15 25 25025 250250 10 106 NULL 21 0 0 0 0 0 0.0102635 1 1 0.0102635 g mi 1,1,2016,7,5,15,25,25025,250250,10,21,0,0,0,0,00 1 1 2016 7 5 15 25 25025 250250 10 100 NULL 21 0 0 0 0 0 0.00375146 1 1 0.00375146 g mi 1,1,2016,7,5,15,25,25025,250250,10,21,0,0,0,0,00 1 1 2016 7 5 15 25 25025 250250 10 98 NULL 21 0 0 0 0 0 309.4840088 1 1 309.4840088 g mi 1,1,2016,7,5,15,25,25025,250250,10,21,0,0,0,0,00 1 1 2016 7 5 15 25 25025 250250 10 91 NULL 21 0 0 0 0 0 0.004079897 1 1 0.004079897 g mi 1,1,2016,7,5,15,25,25025,250250,10,21,0,0,0,0,00 1 1 2016 7 5 15 25 25025 250250 10 90 NULL 21 0 0 0 0 0 309.4060059 1 1 309.4060059 g mi 1,1,2016,7,5,15,25,25025,250250,10,21,0,0,0,0,00 1 1 2016 7 5 15 25 25025 250250 10 87 NULL 21 0 0 0 0 0 0.125556514 1 1 0.125556514 g mi 1,1,2016,7,5,15,25,25025,250250,10,21,0,0,0,0,00 1 1 2016 7 5 15 25 25025 250250 10 79 NULL 21 0 0 0 0 0 0.115660302 1 1 0.115660302 g mi 1,1,2016,7,5,15,25,25025,250250,10,21,0,0,0,0,00 1 1 2016 7 5 15 25 25025 250250 10 66 NULL 21 0 0 0 0 0 1.61E-05 1 1 1.61E-05 g mi 1,1,2016,7,5,15,25,25025,250250,10,21,0,0,0,0,00 1 1 2016 7 5 15 25 25025 250250 10 59 NULL 21 0 0 0 0 0 6.31E-05 1 1 6.31E-05 g mi 1,1,2016,7,5,15,25,25025,250250,10,21,0,0,0,0,00 1 1 2016 7 5 15 25 25025 250250 10 58 NULL 21 0 0 0 0 0 1.12E-05 1 1 1.12E-05 g mi 1,1,2016,7,5,15,25,25025,250250,10,21,0,0,0,0,00 1 1 2016 7 5 15 25 25025 250250 10 57 NULL 21 0 0 0 0 0 1.12E-05 1 1 1.12E-05 g mi 1,1,2016,7,5,15,25,25025,250250,10,21,0,0,0,0,00 1 1 2016 7 5 15 25 25025 250250 10 56 NULL 21 0 0 0 0 0 1.18E-06 1 1 1.18E-06 g mi 1,1,2016,7,5,15,25,25025,250250,10,21,0,0,0,0,00 1 1 2016 7 5 15 25 25025 250250 10 55 NULL 21 0 0 0 0 0 4.99E-05 1 1 4.99E-05 g mi 1,1,2016,7,5,15,25,25025,250250,10,21,0,0,0,0,00 1 1 2016 7 5 15 25 25025 250250 10 54 NULL 21 0 0 0 0 0 5.00E-06 1 1 5.00E-06 g mi 1,1,2016,7,5,15,25,25025,250250,10,21,0,0,0,0,00 1 1 2016 7 5 15 25 25025 250250 10 53 NULL 21 0 0 0 0 0 2.95E-06 1 1 2.95E-06 g mi 1,1,2016,7,5,15,25,25025,250250,10,21,0,0,0,0,00 1 1 2016 7 5 15 25 25025 250250 10 52 NULL 21 0 0 0 0 0 1.45E-06 1 1 1.45E-06 g mi 1,1,2016,7,5,15,25,25025,250250,10,21,0,0,0,0,00 1 1 2016 7 5 15 25 25025 250250 10 51 NULL 21 0 0 0 0 0 3.65E-06 1 1 3.65E-06 g mi 1,1,2016,7,5,15,25,25025,250250,10,21,0,0,0,0,00 1 1 2016 7 5 15 25 25025 250250 10 36 NULL 21 0 0 0 0 0 9.59E-05 1 1 9.59E-05 g mi 1,1,2016,7,5,15,25,25025,250250,10,21,0,0,0,0,00 1 1 2016 7 5 15 25 25025 250250 10 35 NULL 21 0 0 0 0 0 1.00E-05 1 1 1.00E-05 g mi 1,1,2016,7,5,15,25,25025,250250,10,21,0,0,0,0,00 1 1 2016 7 5 15 25 25025 250250 10 31 NULL 21 0 0 0 0 0 0.00613782 1 1 0.00613782 g mi 1,1,2016,7,5,15,25,25025,250250,10,21,0,0,0,0,00 1 1 2016 7 5 15 25 25025 250250 10 5 NULL 21 0 0 0 0 0 0.00319101 1 1 0.00319101 g mi 1,1,2016,7,5,15,25,25025,250250,10,21,0,0,0,0,00 1 1 2016 7 5 15 25 25025 250250 10 3 NULL 21 0 0 0 0 0 0.197913229 1 1 0.197913229 g mi 1,1,2016,7,5,15,25,25025,250250,10,21,0,0,0,0,00 1 1 2016 7 5 15 25 25025 250250 10 2 NULL 21 0 0 0 0 0 2.003333807 1 1 2.003333807 g mi 1,1,2016,7,5,15,25,25025,250250,10,21,0,0,0,0,00 1 1 2016 7 5 15 25 25025 250250 10 1 NULL 21 0 0 0 0 0 0.118810304 1 1 0.118810304 g mi 1,1,2016,7,5,15,25,25025,250250,9,21,0,0,0,0,00 1 1 2016 7 5 15 25 25025 250250 9 122 NULL 21 0 0 0 0 0 0.000383303 1 1 0.000383303 g mi 1,1,2016,7,5,15,25,25025,250250,9,21,0,0,0,0,00 1 1 2016 7 5 15 25 25025 250250 9 121 NULL 21 0 0 0 0 0 0.000157479 1 1 0.000157479 g mi 1,1,2016,7,5,15,25,25025,250250,9,21,0,0,0,0,00 1 1 2016 7 5 15 25 25025 250250 9 119 NULL 21 0 0 0 0 0 0 1 1 0 g mi 1,1,2016,7,5,15,25,25025,250250,9,21,0,0,0,0,00 1 1 2016 7 5 15 25 25025 250250 9 118 NULL 21 0 0 0 0 0 0.0028208 1 1 0.0028208 g mi 1,1,2016,7,5,15,25,25025,250250,9,21,0,0,0,0,00 1 1 2016 7 5 15 25 25025 250250 9 117 NULL 21 0 0 0 0 0 0.001324 1 1 0.001324 g mi 1,1,2016,7,5,15,25,25025,250250,9,21,0,0,0,0,00 1 1 2016 7 5 15 25 25025 250250 9 116 NULL 21 0 0 0 0 0 0.00198081 1 1 0.00198081 g mi 1,1,2016,7,5,15,25,25025,250250,9,21,0,0,0,0,00 1 1 2016 7 5 15 25 25025 250250 9 115 NULL 21 0 0 0 0 0 0.000109279 1 1 0.000109279 g mi

Boston-Logan International Airport 2016 EDR
Appendix I, Air Quality/Emissions Reduction I-45
1,1,2016,7,5,15,25,25025,250250,9,21,0,0,0,0,00 1 1 2016 7 5 15 25 25025 250250 9 112 NULL 21 0 0 0 0 0 0.000480934 1 1 0.000480934 g mi 1,1,2016,7,5,15,25,25025,250250,9,21,0,0,0,0,00 1 1 2016 7 5 15 25 25025 250250 9 111 NULL 21 0 0 0 0 0 0.00191651 1 1 0.00191651 g mi 1,1,2016,7,5,15,25,25025,250250,9,21,0,0,0,0,00 1 1 2016 7 5 15 25 25025 250250 9 110 NULL 21 0 0 0 0 0 0.00330173 1 1 0.00330173 g mi 1,1,2016,7,5,15,25,25025,250250,9,21,0,0,0,0,00 1 1 2016 7 5 15 25 25025 250250 9 107 NULL 21 0 0 0 0 0 0.00882671 1 1 0.00882671 g mi 1,1,2016,7,5,15,25,25025,250250,9,21,0,0,0,0,00 1 1 2016 7 5 15 25 25025 250250 9 106 NULL 21 0 0 0 0 0 0.0158465 1 1 0.0158465 g mi 1,1,2016,7,5,15,25,25025,250250,9,21,0,0,0,0,00 1 1 2016 7 5 15 25 25025 250250 9 100 NULL 21 0 0 0 0 0 0.00373148 1 1 0.00373148 g mi 1,1,2016,7,5,15,25,25025,250250,9,21,0,0,0,0,00 1 1 2016 7 5 15 25 25025 250250 9 98 NULL 21 0 0 0 0 0 317.0320129 1 1 317.0320129 g mi 1,1,2016,7,5,15,25,25025,250250,9,21,0,0,0,0,00 1 1 2016 7 5 15 25 25025 250250 9 91 NULL 21 0 0 0 0 0 0.004179437 1 1 0.004179437 g mi 1,1,2016,7,5,15,25,25025,250250,9,21,0,0,0,0,00 1 1 2016 7 5 15 25 25025 250250 9 90 NULL 21 0 0 0 0 0 316.9549866 1 1 316.9549866 g mi 1,1,2016,7,5,15,25,25025,250250,9,21,0,0,0,0,00 1 1 2016 7 5 15 25 25025 250250 9 87 NULL 21 0 0 0 0 0 0.12703304 1 1 0.12703304 g mi 1,1,2016,7,5,15,25,25025,250250,9,21,0,0,0,0,00 1 1 2016 7 5 15 25 25025 250250 9 79 NULL 21 0 0 0 0 0 0.117001198 1 1 0.117001198 g mi 1,1,2016,7,5,15,25,25025,250250,9,21,0,0,0,0,00 1 1 2016 7 5 15 25 25025 250250 9 66 NULL 21 0 0 0 0 0 1.79E-05 1 1 1.79E-05 g mi 1,1,2016,7,5,15,25,25025,250250,9,21,0,0,0,0,00 1 1 2016 7 5 15 25 25025 250250 9 59 NULL 21 0 0 0 0 0 6.28E-05 1 1 6.28E-05 g mi 1,1,2016,7,5,15,25,25025,250250,9,21,0,0,0,0,00 1 1 2016 7 5 15 25 25025 250250 9 58 NULL 21 0 0 0 0 0 1.11E-05 1 1 1.11E-05 g mi 1,1,2016,7,5,15,25,25025,250250,9,21,0,0,0,0,00 1 1 2016 7 5 15 25 25025 250250 9 57 NULL 21 0 0 0 0 0 1.12E-05 1 1 1.12E-05 g mi 1,1,2016,7,5,15,25,25025,250250,9,21,0,0,0,0,00 1 1 2016 7 5 15 25 25025 250250 9 56 NULL 21 0 0 0 0 0 1.17E-06 1 1 1.17E-06 g mi 1,1,2016,7,5,15,25,25025,250250,9,21,0,0,0,0,00 1 1 2016 7 5 15 25 25025 250250 9 55 NULL 21 0 0 0 0 0 4.96E-05 1 1 4.96E-05 g mi 1,1,2016,7,5,15,25,25025,250250,9,21,0,0,0,0,00 1 1 2016 7 5 15 25 25025 250250 9 54 NULL 21 0 0 0 0 0 4.97E-06 1 1 4.97E-06 g mi 1,1,2016,7,5,15,25,25025,250250,9,21,0,0,0,0,00 1 1 2016 7 5 15 25 25025 250250 9 53 NULL 21 0 0 0 0 0 2.93E-06 1 1 2.93E-06 g mi 1,1,2016,7,5,15,25,25025,250250,9,21,0,0,0,0,00 1 1 2016 7 5 15 25 25025 250250 9 52 NULL 21 0 0 0 0 0 1.44E-06 1 1 1.44E-06 g mi 1,1,2016,7,5,15,25,25025,250250,9,21,0,0,0,0,00 1 1 2016 7 5 15 25 25025 250250 9 51 NULL 21 0 0 0 0 0 3.63E-06 1 1 3.63E-06 g mi 1,1,2016,7,5,15,25,25025,250250,9,21,0,0,0,0,00 1 1 2016 7 5 15 25 25025 250250 9 36 NULL 21 0 0 0 0 0 9.54E-05 1 1 9.54E-05 g mi 1,1,2016,7,5,15,25,25025,250250,9,21,0,0,0,0,00 1 1 2016 7 5 15 25 25025 250250 9 35 NULL 21 0 0 0 0 0 9.96E-06 1 1 9.96E-06 g mi 1,1,2016,7,5,15,25,25025,250250,9,21,0,0,0,0,00 1 1 2016 7 5 15 25 25025 250250 9 31 NULL 21 0 0 0 0 0 0.00628758 1 1 0.00628758 g mi 1,1,2016,7,5,15,25,25025,250250,9,21,0,0,0,0,00 1 1 2016 7 5 15 25 25025 250250 9 5 NULL 21 0 0 0 0 0 0.003139933 1 1 0.003139933 g mi 1,1,2016,7,5,15,25,25025,250250,9,21,0,0,0,0,00 1 1 2016 7 5 15 25 25025 250250 9 3 NULL 21 0 0 0 0 0 0.192997023 1 1 0.192997023 g mi 1,1,2016,7,5,15,25,25025,250250,9,21,0,0,0,0,00 1 1 2016 7 5 15 25 25025 250250 9 2 NULL 21 0 0 0 0 0 2.018112183 1 1 2.018112183 g mi 1,1,2016,7,5,15,25,25025,250250,9,21,0,0,0,0,00 1 1 2016 7 5 15 25 25025 250250 9 1 NULL 21 0 0 0 0 0 0.120100796 1 1 0.120100796 g mi 1,1,2016,7,5,15,25,25025,250250,8,21,0,0,0,0,00 1 1 2016 7 5 15 25 25025 250250 8 122 NULL 21 0 0 0 0 0 0.000394183 1 1 0.000394183 g mi 1,1,2016,7,5,15,25,25025,250250,8,21,0,0,0,0,00 1 1 2016 7 5 15 25 25025 250250 8 121 NULL 21 0 0 0 0 0 0.00016195 1 1 0.00016195 g mi 1,1,2016,7,5,15,25,25025,250250,8,21,0,0,0,0,00 1 1 2016 7 5 15 25 25025 250250 8 119 NULL 21 0 0 0 0 0 0 1 1 0 g mi
Boston-Logan International Airport 2016 EDR
Appendix I, Air Quality/Emissions Reduction I-46
1,1,2016,7,5,15,25,25025,250250,8,21,0,0,0,0,00 1 1 2016 7 5 15 25 25025 250250 8 118 NULL 21 0 0 0 0 0 0.00290085 1 1 0.00290085 g mi 1,1,2016,7,5,15,25,25025,250250,8,21,0,0,0,0,00 1 1 2016 7 5 15 25 25025 250250 8 117 NULL 21 0 0 0 0 0 0.001427 1 1 0.001427 g mi 1,1,2016,7,5,15,25,25025,250250,8,21,0,0,0,0,00 1 1 2016 7 5 15 25 25025 250250 8 116 NULL 21 0 0 0 0 0 0.00275537 1 1 0.00275537 g mi 1,1,2016,7,5,15,25,25025,250250,8,21,0,0,0,0,00 1 1 2016 7 5 15 25 25025 250250 8 115 NULL 21 0 0 0 0 0 0.00011236 1 1 0.00011236 g mi 1,1,2016,7,5,15,25,25025,250250,8,21,0,0,0,0,00 1 1 2016 7 5 15 25 25025 250250 8 112 NULL 21 0 0 0 0 0 0.000494587 1 1 0.000494587 g mi 1,1,2016,7,5,15,25,25025,250250,8,21,0,0,0,0,00 1 1 2016 7 5 15 25 25025 250250 8 111 NULL 21 0 0 0 0 0 0.00197091 1 1 0.00197091 g mi 1,1,2016,7,5,15,25,25025,250250,8,21,0,0,0,0,00 1 1 2016 7 5 15 25 25025 250250 8 110 NULL 21 0 0 0 0 0 0.00339544 1 1 0.00339544 g mi 1,1,2016,7,5,15,25,25025,250250,8,21,0,0,0,0,00 1 1 2016 7 5 15 25 25025 250250 8 107 NULL 21 0 0 0 0 0 0.00951338 1 1 0.00951338 g mi 1,1,2016,7,5,15,25,25025,250250,8,21,0,0,0,0,00 1 1 2016 7 5 15 25 25025 250250 8 106 NULL 21 0 0 0 0 0 0.022043001 1 1 0.022043001 g mi 1,1,2016,7,5,15,25,25025,250250,8,21,0,0,0,0,00 1 1 2016 7 5 15 25 25025 250250 8 100 NULL 21 0 0 0 0 0 0.00383739 1 1 0.00383739 g mi 1,1,2016,7,5,15,25,25025,250250,8,21,0,0,0,0,00 1 1 2016 7 5 15 25 25025 250250 8 98 NULL 21 0 0 0 0 0 327.5499878 1 1 327.5499878 g mi 1,1,2016,7,5,15,25,25025,250250,8,21,0,0,0,0,00 1 1 2016 7 5 15 25 25025 250250 8 91 NULL 21 0 0 0 0 0 0.004318093 1 1 0.004318093 g mi 1,1,2016,7,5,15,25,25025,250250,8,21,0,0,0,0,00 1 1 2016 7 5 15 25 25025 250250 8 90 NULL 21 0 0 0 0 0 327.4700012 1 1 327.4700012 g mi 1,1,2016,7,5,15,25,25025,250250,8,21,0,0,0,0,00 1 1 2016 7 5 15 25 25025 250250 8 87 NULL 21 0 0 0 0 0 0.129978836 1 1 0.129978836 g mi 1,1,2016,7,5,15,25,25025,250250,8,21,0,0,0,0,00 1 1 2016 7 5 15 25 25025 250250 8 79 NULL 21 0 0 0 0 0 0.119802296 1 1 0.119802296 g mi 1,1,2016,7,5,15,25,25025,250250,8,21,0,0,0,0,00 1 1 2016 7 5 15 25 25025 250250 8 66 NULL 21 0 0 0 0 0 2.01E-05 1 1 2.01E-05 g mi 1,1,2016,7,5,15,25,25025,250250,8,21,0,0,0,0,00 1 1 2016 7 5 15 25 25025 250250 8 59 NULL 21 0 0 0 0 0 6.46E-05 1 1 6.46E-05 g mi 1,1,2016,7,5,15,25,25025,250250,8,21,0,0,0,0,00 1 1 2016 7 5 15 25 25025 250250 8 58 NULL 21 0 0 0 0 0 1.15E-05 1 1 1.15E-05 g mi 1,1,2016,7,5,15,25,25025,250250,8,21,0,0,0,0,00 1 1 2016 7 5 15 25 25025 250250 8 57 NULL 21 0 0 0 0 0 1.15E-05 1 1 1.15E-05 g mi 1,1,2016,7,5,15,25,25025,250250,8,21,0,0,0,0,00 1 1 2016 7 5 15 25 25025 250250 8 56 NULL 21 0 0 0 0 0 1.21E-06 1 1 1.21E-06 g mi 1,1,2016,7,5,15,25,25025,250250,8,21,0,0,0,0,00 1 1 2016 7 5 15 25 25025 250250 8 55 NULL 21 0 0 0 0 0 5.10E-05 1 1 5.10E-05 g mi 1,1,2016,7,5,15,25,25025,250250,8,21,0,0,0,0,00 1 1 2016 7 5 15 25 25025 250250 8 54 NULL 21 0 0 0 0 0 5.11E-06 1 1 5.11E-06 g mi 1,1,2016,7,5,15,25,25025,250250,8,21,0,0,0,0,00 1 1 2016 7 5 15 25 25025 250250 8 53 NULL 21 0 0 0 0 0 3.01E-06 1 1 3.01E-06 g mi 1,1,2016,7,5,15,25,25025,250250,8,21,0,0,0,0,00 1 1 2016 7 5 15 25 25025 250250 8 52 NULL 21 0 0 0 0 0 1.48E-06 1 1 1.48E-06 g mi 1,1,2016,7,5,15,25,25025,250250,8,21,0,0,0,0,00 1 1 2016 7 5 15 25 25025 250250 8 51 NULL 21 0 0 0 0 0 3.73E-06 1 1 3.73E-06 g mi 1,1,2016,7,5,15,25,25025,250250,8,21,0,0,0,0,00 1 1 2016 7 5 15 25 25025 250250 8 36 NULL 21 0 0 0 0 0 9.81E-05 1 1 9.81E-05 g mi 1,1,2016,7,5,15,25,25025,250250,8,21,0,0,0,0,00 1 1 2016 7 5 15 25 25025 250250 8 35 NULL 21 0 0 0 0 0 1.02E-05 1 1 1.02E-05 g mi 1,1,2016,7,5,15,25,25025,250250,8,21,0,0,0,0,00 1 1 2016 7 5 15 25 25025 250250 8 31 NULL 21 0 0 0 0 0 0.00649621 1 1 0.00649621 g mi 1,1,2016,7,5,15,25,25025,250250,8,21,0,0,0,0,00 1 1 2016 7 5 15 25 25025 250250 8 5 NULL 21 0 0 0 0 0 0.003245141 1 1 0.003245141 g mi 1,1,2016,7,5,15,25,25025,250250,8,21,0,0,0,0,00 1 1 2016 7 5 15 25 25025 250250 8 3 NULL 21 0 0 0 0 0 0.192626998 1 1 0.192626998 g mi 1,1,2016,7,5,15,25,25025,250250,8,21,0,0,0,0,00 1 1 2016 7 5 15 25 25025 250250 8 2 NULL 21 0 0 0 0 0 2.134444714 1 1 2.134444714 g mi
Boston-Logan International Airport 2016 EDR
Appendix I, Air Quality/Emissions Reduction I-47
1,1,2016,7,5,15,25,25025,250250,8,21,0,0,0,0,00 1 1 2016 7 5 15 25 25025 250250 8 1 NULL 21 0 0 0 0 0 0.123005599 1 1 0.123005599 g mi 1,1,2016,7,5,15,25,25025,250250,7,21,0,0,0,0,00 1 1 2016 7 5 15 25 25025 250250 7 122 NULL 21 0 0 0 0 0 0.000416333 1 1 0.000416333 g mi 1,1,2016,7,5,15,25,25025,250250,7,21,0,0,0,0,00 1 1 2016 7 5 15 25 25025 250250 7 121 NULL 21 0 0 0 0 0 0.000171052 1 1 0.000171052 g mi 1,1,2016,7,5,15,25,25025,250250,7,21,0,0,0,0,00 1 1 2016 7 5 15 25 25025 250250 7 119 NULL 21 0 0 0 0 0 0 1 1 0 g mi 1,1,2016,7,5,15,25,25025,250250,7,21,0,0,0,0,00 1 1 2016 7 5 15 25 25025 250250 7 118 NULL 21 0 0 0 0 0 0.00306381 1 1 0.00306381 g mi 1,1,2016,7,5,15,25,25025,250250,7,21,0,0,0,0,00 1 1 2016 7 5 15 25 25025 250250 7 117 NULL 21 0 0 0 0 0 0.001537 1 1 0.001537 g mi 1,1,2016,7,5,15,25,25025,250250,7,21,0,0,0,0,00 1 1 2016 7 5 15 25 25025 250250 7 116 NULL 21 0 0 0 0 0 0.00369191 1 1 0.00369191 g mi 1,1,2016,7,5,15,25,25025,250250,7,21,0,0,0,0,00 1 1 2016 7 5 15 25 25025 250250 7 115 NULL 21 0 0 0 0 0 0.00011862 1 1 0.00011862 g mi 1,1,2016,7,5,15,25,25025,250250,7,21,0,0,0,0,00 1 1 2016 7 5 15 25 25025 250250 7 112 NULL 21 0 0 0 0 0 0.000522374 1 1 0.000522374 g mi 1,1,2016,7,5,15,25,25025,250250,7,21,0,0,0,0,00 1 1 2016 7 5 15 25 25025 250250 7 111 NULL 21 0 0 0 0 0 0.00208166 1 1 0.00208166 g mi 1,1,2016,7,5,15,25,25025,250250,7,21,0,0,0,0,00 1 1 2016 7 5 15 25 25025 250250 7 110 NULL 21 0 0 0 0 0 0.00358618 1 1 0.00358618 g mi 1,1,2016,7,5,15,25,25025,250250,7,21,0,0,0,0,00 1 1 2016 7 5 15 25 25025 250250 7 107 NULL 21 0 0 0 0 0 0.0102467 1 1 0.0102467 g mi 1,1,2016,7,5,15,25,25025,250250,7,21,0,0,0,0,00 1 1 2016 7 5 15 25 25025 250250 7 106 NULL 21 0 0 0 0 0 0.029535299 1 1 0.029535299 g mi 1,1,2016,7,5,15,25,25025,250250,7,21,0,0,0,0,00 1 1 2016 7 5 15 25 25025 250250 7 100 NULL 21 0 0 0 0 0 0.00405297 1 1 0.00405297 g mi 1,1,2016,7,5,15,25,25025,250250,7,21,0,0,0,0,00 1 1 2016 7 5 15 25 25025 250250 7 98 NULL 21 0 0 0 0 0 341.7309875 1 1 341.7309875 g mi 1,1,2016,7,5,15,25,25025,250250,7,21,0,0,0,0,00 1 1 2016 7 5 15 25 25025 250250 7 91 NULL 21 0 0 0 0 0 0.004505022 1 1 0.004505022 g mi 1,1,2016,7,5,15,25,25025,250250,7,21,0,0,0,0,00 1 1 2016 7 5 15 25 25025 250250 7 90 NULL 21 0 0 0 0 0 341.644989 1 1 341.644989 g mi 1,1,2016,7,5,15,25,25025,250250,7,21,0,0,0,0,00 1 1 2016 7 5 15 25 25025 250250 7 87 NULL 21 0 0 0 0 0 0.134433419 1 1 0.134433419 g mi 1,1,2016,7,5,15,25,25025,250250,7,21,0,0,0,0,00 1 1 2016 7 5 15 25 25025 250250 7 79 NULL 21 0 0 0 0 0 0.124085799 1 1 0.124085799 g mi 1,1,2016,7,5,15,25,25025,250250,7,21,0,0,0,0,00 1 1 2016 7 5 15 25 25025 250250 7 66 NULL 21 0 0 0 0 0 2.30E-05 1 1 2.30E-05 g mi 1,1,2016,7,5,15,25,25025,250250,7,21,0,0,0,0,00 1 1 2016 7 5 15 25 25025 250250 7 59 NULL 21 0 0 0 0 0 6.82E-05 1 1 6.82E-05 g mi 1,1,2016,7,5,15,25,25025,250250,7,21,0,0,0,0,00 1 1 2016 7 5 15 25 25025 250250 7 58 NULL 21 0 0 0 0 0 1.21E-05 1 1 1.21E-05 g mi 1,1,2016,7,5,15,25,25025,250250,7,21,0,0,0,0,00 1 1 2016 7 5 15 25 25025 250250 7 57 NULL 21 0 0 0 0 0 1.21E-05 1 1 1.21E-05 g mi 1,1,2016,7,5,15,25,25025,250250,7,21,0,0,0,0,00 1 1 2016 7 5 15 25 25025 250250 7 56 NULL 21 0 0 0 0 0 1.27E-06 1 1 1.27E-06 g mi 1,1,2016,7,5,15,25,25025,250250,7,21,0,0,0,0,00 1 1 2016 7 5 15 25 25025 250250 7 55 NULL 21 0 0 0 0 0 5.39E-05 1 1 5.39E-05 g mi 1,1,2016,7,5,15,25,25025,250250,7,21,0,0,0,0,00 1 1 2016 7 5 15 25 25025 250250 7 54 NULL 21 0 0 0 0 0 5.40E-06 1 1 5.40E-06 g mi 1,1,2016,7,5,15,25,25025,250250,7,21,0,0,0,0,00 1 1 2016 7 5 15 25 25025 250250 7 53 NULL 21 0 0 0 0 0 3.18E-06 1 1 3.18E-06 g mi 1,1,2016,7,5,15,25,25025,250250,7,21,0,0,0,0,00 1 1 2016 7 5 15 25 25025 250250 7 52 NULL 21 0 0 0 0 0 1.56E-06 1 1 1.56E-06 g mi 1,1,2016,7,5,15,25,25025,250250,7,21,0,0,0,0,00 1 1 2016 7 5 15 25 25025 250250 7 51 NULL 21 0 0 0 0 0 3.94E-06 1 1 3.94E-06 g mi 1,1,2016,7,5,15,25,25025,250250,7,21,0,0,0,0,00 1 1 2016 7 5 15 25 25025 250250 7 36 NULL 21 0 0 0 0 0 0.00010363 1 1 0.00010363 g mi 1,1,2016,7,5,15,25,25025,250250,7,21,0,0,0,0,00 1 1 2016 7 5 15 25 25025 250250 7 35 NULL 21 0 0 0 0 0 1.08E-05 1 1 1.08E-05 g mi

Boston-Logan International Airport 2016 EDR
Appendix I, Air Quality/Emissions Reduction I-48
1,1,2016,7,5,15,25,25025,250250,7,21,0,0,0,0,00 1 1 2016 7 5 15 25 25025 250250 7 31 NULL 21 0 0 0 0 0 0.00677748 1 1 0.00677748 g mi 1,1,2016,7,5,15,25,25025,250250,7,21,0,0,0,0,00 1 1 2016 7 5 15 25 25025 250250 7 5 NULL 21 0 0 0 0 0 0.003482968 1 1 0.003482968 g mi 1,1,2016,7,5,15,25,25025,250250,7,21,0,0,0,0,00 1 1 2016 7 5 15 25 25025 250250 7 3 NULL 21 0 0 0 0 0 0.195656136 1 1 0.195656136 g mi 1,1,2016,7,5,15,25,25025,250250,7,21,0,0,0,0,00 1 1 2016 7 5 15 25 25025 250250 7 2 NULL 21 0 0 0 0 0 2.343386173 1 1 2.343386173 g mi 1,1,2016,7,5,15,25,25025,250250,7,21,0,0,0,0,00 1 1 2016 7 5 15 25 25025 250250 7 1 NULL 21 0 0 0 0 0 0.127523899 1 1 0.127523899 g mi 1,1,2016,7,5,15,25,25025,250250,6,21,0,0,0,0,00 1 1 2016 7 5 15 25 25025 250250 6 122 NULL 21 0 0 0 0 0 0.00044439 1 1 0.00044439 g mi 1,1,2016,7,5,15,25,25025,250250,6,21,0,0,0,0,00 1 1 2016 7 5 15 25 25025 250250 6 121 NULL 21 0 0 0 0 0 0.000182581 1 1 0.000182581 g mi 1,1,2016,7,5,15,25,25025,250250,6,21,0,0,0,0,00 1 1 2016 7 5 15 25 25025 250250 6 119 NULL 21 0 0 0 0 0 0 1 1 0 g mi 1,1,2016,7,5,15,25,25025,250250,6,21,0,0,0,0,00 1 1 2016 7 5 15 25 25025 250250 6 118 NULL 21 0 0 0 0 0 0.00327026 1 1 0.00327026 g mi 1,1,2016,7,5,15,25,25025,250250,6,21,0,0,0,0,00 1 1 2016 7 5 15 25 25025 250250 6 117 NULL 21 0 0 0 0 0 0.001656 1 1 0.001656 g mi 1,1,2016,7,5,15,25,25025,250250,6,21,0,0,0,0,00 1 1 2016 7 5 15 25 25025 250250 6 116 NULL 21 0 0 0 0 0 0.00493551 1 1 0.00493551 g mi 1,1,2016,7,5,15,25,25025,250250,6,21,0,0,0,0,00 1 1 2016 7 5 15 25 25025 250250 6 115 NULL 21 0 0 0 0 0 0.000126585 1 1 0.000126585 g mi 1,1,2016,7,5,15,25,25025,250250,6,21,0,0,0,0,00 1 1 2016 7 5 15 25 25025 250250 6 112 NULL 21 0 0 0 0 0 0.000557579 1 1 0.000557579 g mi 1,1,2016,7,5,15,25,25025,250250,6,21,0,0,0,0,00 1 1 2016 7 5 15 25 25025 250250 6 111 NULL 21 0 0 0 0 0 0.00222195 1 1 0.00222195 g mi 1,1,2016,7,5,15,25,25025,250250,6,21,0,0,0,0,00 1 1 2016 7 5 15 25 25025 250250 6 110 NULL 21 0 0 0 0 0 0.00382784 1 1 0.00382784 g mi 1,1,2016,7,5,15,25,25025,250250,6,21,0,0,0,0,00 1 1 2016 7 5 15 25 25025 250250 6 107 NULL 21 0 0 0 0 0 0.0110401 1 1 0.0110401 g mi 1,1,2016,7,5,15,25,25025,250250,6,21,0,0,0,0,00 1 1 2016 7 5 15 25 25025 250250 6 106 NULL 21 0 0 0 0 0 0.039484099 1 1 0.039484099 g mi 1,1,2016,7,5,15,25,25025,250250,6,21,0,0,0,0,00 1 1 2016 7 5 15 25 25025 250250 6 100 NULL 21 0 0 0 0 0 0.0043261 1 1 0.0043261 g mi 1,1,2016,7,5,15,25,25025,250250,6,21,0,0,0,0,00 1 1 2016 7 5 15 25 25025 250250 6 98 NULL 21 0 0 0 0 0 363.631012 1 1 363.631012 g mi 1,1,2016,7,5,15,25,25025,250250,6,21,0,0,0,0,00 1 1 2016 7 5 15 25 25025 250250 6 91 NULL 21 0 0 0 0 0 0.004793718 1 1 0.004793718 g mi 1,1,2016,7,5,15,25,25025,250250,6,21,0,0,0,0,00 1 1 2016 7 5 15 25 25025 250250 6 90 NULL 21 0 0 0 0 0 363.5390015 1 1 363.5390015 g mi 1,1,2016,7,5,15,25,25025,250250,6,21,0,0,0,0,00 1 1 2016 7 5 15 25 25025 250250 6 87 NULL 21 0 0 0 0 0 0.140103295 1 1 0.140103295 g mi 1,1,2016,7,5,15,25,25025,250250,6,21,0,0,0,0,00 1 1 2016 7 5 15 25 25025 250250 6 79 NULL 21 0 0 0 0 0 0.129515499 1 1 0.129515499 g mi 1,1,2016,7,5,15,25,25025,250250,6,21,0,0,0,0,00 1 1 2016 7 5 15 25 25025 250250 6 66 NULL 21 0 0 0 0 0 2.68E-05 1 1 2.68E-05 g mi 1,1,2016,7,5,15,25,25025,250250,6,21,0,0,0,0,00 1 1 2016 7 5 15 25 25025 250250 6 59 NULL 21 0 0 0 0 0 7.28E-05 1 1 7.28E-05 g mi 1,1,2016,7,5,15,25,25025,250250,6,21,0,0,0,0,00 1 1 2016 7 5 15 25 25025 250250 6 58 NULL 21 0 0 0 0 0 1.29E-05 1 1 1.29E-05 g mi 1,1,2016,7,5,15,25,25025,250250,6,21,0,0,0,0,00 1 1 2016 7 5 15 25 25025 250250 6 57 NULL 21 0 0 0 0 0 1.30E-05 1 1 1.30E-05 g mi 1,1,2016,7,5,15,25,25025,250250,6,21,0,0,0,0,00 1 1 2016 7 5 15 25 25025 250250 6 56 NULL 21 0 0 0 0 0 1.36E-06 1 1 1.36E-06 g mi 1,1,2016,7,5,15,25,25025,250250,6,21,0,0,0,0,00 1 1 2016 7 5 15 25 25025 250250 6 55 NULL 21 0 0 0 0 0 5.75E-05 1 1 5.75E-05 g mi 1,1,2016,7,5,15,25,25025,250250,6,21,0,0,0,0,00 1 1 2016 7 5 15 25 25025 250250 6 54 NULL 21 0 0 0 0 0 5.77E-06 1 1 5.77E-06 g mi 1,1,2016,7,5,15,25,25025,250250,6,21,0,0,0,0,00 1 1 2016 7 5 15 25 25025 250250 6 53 NULL 21 0 0 0 0 0 3.40E-06 1 1 3.40E-06 g mi
Boston-Logan International Airport 2016 EDR
Appendix I, Air Quality/Emissions Reduction I-49
1,1,2016,7,5,15,25,25025,250250,6,21,0,0,0,0,00 1 1 2016 7 5 15 25 25025 250250 6 52 NULL 21 0 0 0 0 0 1.67E-06 1 1 1.67E-06 g mi 1,1,2016,7,5,15,25,25025,250250,6,21,0,0,0,0,00 1 1 2016 7 5 15 25 25025 250250 6 51 NULL 21 0 0 0 0 0 4.20E-06 1 1 4.20E-06 g mi 1,1,2016,7,5,15,25,25025,250250,6,21,0,0,0,0,00 1 1 2016 7 5 15 25 25025 250250 6 36 NULL 21 0 0 0 0 0 0.000110619 1 1 0.000110619 g mi 1,1,2016,7,5,15,25,25025,250250,6,21,0,0,0,0,00 1 1 2016 7 5 15 25 25025 250250 6 35 NULL 21 0 0 0 0 0 1.15E-05 1 1 1.15E-05 g mi 1,1,2016,7,5,15,25,25025,250250,6,21,0,0,0,0,00 1 1 2016 7 5 15 25 25025 250250 6 31 NULL 21 0 0 0 0 0 0.00721187 1 1 0.00721187 g mi 1,1,2016,7,5,15,25,25025,250250,6,21,0,0,0,0,00 1 1 2016 7 5 15 25 25025 250250 6 5 NULL 21 0 0 0 0 0 0.003747167 1 1 0.003747167 g mi 1,1,2016,7,5,15,25,25025,250250,6,21,0,0,0,0,00 1 1 2016 7 5 15 25 25025 250250 6 3 NULL 21 0 0 0 0 0 0.202133402 1 1 0.202133402 g mi 1,1,2016,7,5,15,25,25025,250250,6,21,0,0,0,0,00 1 1 2016 7 5 15 25 25025 250250 6 2 NULL 21 0 0 0 0 0 2.564254761 1 1 2.564254761 g mi 1,1,2016,7,5,15,25,25025,250250,6,21,0,0,0,0,00 1 1 2016 7 5 15 25 25025 250250 6 1 NULL 21 0 0 0 0 0 0.133214399 1 1 0.133214399 g mi 1,1,2016,7,5,15,25,25025,250250,5,21,0,0,0,0,00 1 1 2016 7 5 15 25 25025 250250 5 122 NULL 21 0 0 0 0 0 0.000481429 1 1 0.000481429 g mi 1,1,2016,7,5,15,25,25025,250250,5,21,0,0,0,0,00 1 1 2016 7 5 15 25 25025 250250 5 121 NULL 21 0 0 0 0 0 0.000197798 1 1 0.000197798 g mi 1,1,2016,7,5,15,25,25025,250250,5,21,0,0,0,0,00 1 1 2016 7 5 15 25 25025 250250 5 119 NULL 21 0 0 0 0 0 0 1 1 0 g mi 1,1,2016,7,5,15,25,25025,250250,5,21,0,0,0,0,00 1 1 2016 7 5 15 25 25025 250250 5 118 NULL 21 0 0 0 0 0 0.00354292 1 1 0.00354292 g mi 1,1,2016,7,5,15,25,25025,250250,5,21,0,0,0,0,00 1 1 2016 7 5 15 25 25025 250250 5 117 NULL 21 0 0 0 0 0 0.001784 1 1 0.001784 g mi 1,1,2016,7,5,15,25,25025,250250,5,21,0,0,0,0,00 1 1 2016 7 5 15 25 25025 250250 5 116 NULL 21 0 0 0 0 0 0.00655266 1 1 0.00655266 g mi 1,1,2016,7,5,15,25,25025,250250,5,21,0,0,0,0,00 1 1 2016 7 5 15 25 25025 250250 5 115 NULL 21 0 0 0 0 0 0.000137223 1 1 0.000137223 g mi 1,1,2016,7,5,15,25,25025,250250,5,21,0,0,0,0,00 1 1 2016 7 5 15 25 25025 250250 5 112 NULL 21 0 0 0 0 0 0.000604072 1 1 0.000604072 g mi 1,1,2016,7,5,15,25,25025,250250,5,21,0,0,0,0,00 1 1 2016 7 5 15 25 25025 250250 5 111 NULL 21 0 0 0 0 0 0.00240714 1 1 0.00240714 g mi 1,1,2016,7,5,15,25,25025,250250,5,21,0,0,0,0,00 1 1 2016 7 5 15 25 25025 250250 5 110 NULL 21 0 0 0 0 0 0.00414699 1 1 0.00414699 g mi 1,1,2016,7,5,15,25,25025,250250,5,21,0,0,0,0,00 1 1 2016 7 5 15 25 25025 250250 5 107 NULL 21 0 0 0 0 0 0.0118934 1 1 0.0118934 g mi 1,1,2016,7,5,15,25,25025,250250,5,21,0,0,0,0,00 1 1 2016 7 5 15 25 25025 250250 5 106 NULL 21 0 0 0 0 0 0.052421201 1 1 0.052421201 g mi 1,1,2016,7,5,15,25,25025,250250,5,21,0,0,0,0,00 1 1 2016 7 5 15 25 25025 250250 5 100 NULL 21 0 0 0 0 0 0.0046868 1 1 0.0046868 g mi 1,1,2016,7,5,15,25,25025,250250,5,21,0,0,0,0,00 1 1 2016 7 5 15 25 25025 250250 5 98 NULL 21 0 0 0 0 0 407.3989868 1 1 407.3989868 g mi 1,1,2016,7,5,15,25,25025,250250,5,21,0,0,0,0,00 1 1 2016 7 5 15 25 25025 250250 5 91 NULL 21 0 0 0 0 0 0.005370806 1 1 0.005370806 g mi 1,1,2016,7,5,15,25,25025,250250,5,21,0,0,0,0,00 1 1 2016 7 5 15 25 25025 250250 5 90 NULL 21 0 0 0 0 0 407.303009 1 1 407.303009 g mi 1,1,2016,7,5,15,25,25025,250250,5,21,0,0,0,0,00 1 1 2016 7 5 15 25 25025 250250 5 87 NULL 21 0 0 0 0 0 0.146872103 1 1 0.146872103 g mi 1,1,2016,7,5,15,25,25025,250250,5,21,0,0,0,0,00 1 1 2016 7 5 15 25 25025 250250 5 79 NULL 21 0 0 0 0 0 0.135898501 1 1 0.135898501 g mi 1,1,2016,7,5,15,25,25025,250250,5,21,0,0,0,0,00 1 1 2016 7 5 15 25 25025 250250 5 66 NULL 21 0 0 0 0 0 3.21E-05 1 1 3.21E-05 g mi 1,1,2016,7,5,15,25,25025,250250,5,21,0,0,0,0,00 1 1 2016 7 5 15 25 25025 250250 5 59 NULL 21 0 0 0 0 0 7.89E-05 1 1 7.89E-05 g mi 1,1,2016,7,5,15,25,25025,250250,5,21,0,0,0,0,00 1 1 2016 7 5 15 25 25025 250250 5 58 NULL 21 0 0 0 0 0 1.40E-05 1 1 1.40E-05 g mi 1,1,2016,7,5,15,25,25025,250250,5,21,0,0,0,0,00 1 1 2016 7 5 15 25 25025 250250 5 57 NULL 21 0 0 0 0 0 1.40E-05 1 1 1.40E-05 g mi
Boston-Logan International Airport 2016 EDR
Appendix I, Air Quality/Emissions Reduction I-50
1,1,2016,7,5,15,25,25025,250250,5,21,0,0,0,0,00 1 1 2016 7 5 15 25 25025 250250 5 56 NULL 21 0 0 0 0 0 1.47E-06 1 1 1.47E-06 g mi 1,1,2016,7,5,15,25,25025,250250,5,21,0,0,0,0,00 1 1 2016 7 5 15 25 25025 250250 5 55 NULL 21 0 0 0 0 0 6.23E-05 1 1 6.23E-05 g mi 1,1,2016,7,5,15,25,25025,250250,5,21,0,0,0,0,00 1 1 2016 7 5 15 25 25025 250250 5 54 NULL 21 0 0 0 0 0 6.25E-06 1 1 6.25E-06 g mi 1,1,2016,7,5,15,25,25025,250250,5,21,0,0,0,0,00 1 1 2016 7 5 15 25 25025 250250 5 53 NULL 21 0 0 0 0 0 3.68E-06 1 1 3.68E-06 g mi 1,1,2016,7,5,15,25,25025,250250,5,21,0,0,0,0,00 1 1 2016 7 5 15 25 25025 250250 5 52 NULL 21 0 0 0 0 0 1.81E-06 1 1 1.81E-06 g mi 1,1,2016,7,5,15,25,25025,250250,5,21,0,0,0,0,00 1 1 2016 7 5 15 25 25025 250250 5 51 NULL 21 0 0 0 0 0 4.55E-06 1 1 4.55E-06 g mi 1,1,2016,7,5,15,25,25025,250250,5,21,0,0,0,0,00 1 1 2016 7 5 15 25 25025 250250 5 36 NULL 21 0 0 0 0 0 0.000119841 1 1 0.000119841 g mi 1,1,2016,7,5,15,25,25025,250250,5,21,0,0,0,0,00 1 1 2016 7 5 15 25 25025 250250 5 35 NULL 21 0 0 0 0 0 1.25E-05 1 1 1.25E-05 g mi 1,1,2016,7,5,15,25,25025,250250,5,21,0,0,0,0,00 1 1 2016 7 5 15 25 25025 250250 5 31 NULL 21 0 0 0 0 0 0.00808013 1 1 0.00808013 g mi 1,1,2016,7,5,15,25,25025,250250,5,21,0,0,0,0,00 1 1 2016 7 5 15 25 25025 250250 5 5 NULL 21 0 0 0 0 0 0.003894251 1 1 0.003894251 g mi 1,1,2016,7,5,15,25,25025,250250,5,21,0,0,0,0,00 1 1 2016 7 5 15 25 25025 250250 5 3 NULL 21 0 0 0 0 0 0.221521229 1 1 0.221521229 g mi 1,1,2016,7,5,15,25,25025,250250,5,21,0,0,0,0,00 1 1 2016 7 5 15 25 25025 250250 5 2 NULL 21 0 0 0 0 0 2.637727022 1 1 2.637727022 g mi 1,1,2016,7,5,15,25,25025,250250,5,21,0,0,0,0,00 1 1 2016 7 5 15 25 25025 250250 5 1 NULL 21 0 0 0 0 0 0.139742494 1 1 0.139742494 g mi 1,1,2016,7,5,15,25,25025,250250,4,21,0,0,0,0,00 1 1 2016 7 5 15 25 25025 250250 4 122 NULL 21 0 0 0 0 0 0.000607645 1 1 0.000607645 g mi 1,1,2016,7,5,15,25,25025,250250,4,21,0,0,0,0,00 1 1 2016 7 5 15 25 25025 250250 4 121 NULL 21 0 0 0 0 0 0.000249663 1 1 0.000249663 g mi 1,1,2016,7,5,15,25,25025,250250,4,21,0,0,0,0,00 1 1 2016 7 5 15 25 25025 250250 4 119 NULL 21 0 0 0 0 0 0 1 1 0 g mi 1,1,2016,7,5,15,25,25025,250250,4,21,0,0,0,0,00 1 1 2016 7 5 15 25 25025 250250 4 118 NULL 21 0 0 0 0 0 0.0044711 1 1 0.0044711 g mi 1,1,2016,7,5,15,25,25025,250250,4,21,0,0,0,0,00 1 1 2016 7 5 15 25 25025 250250 4 117 NULL 21 0 0 0 0 0 0.001922 1 1 0.001922 g mi 1,1,2016,7,5,15,25,25025,250250,4,21,0,0,0,0,00 1 1 2016 7 5 15 25 25025 250250 4 116 NULL 21 0 0 0 0 0 0.00745541 1 1 0.00745541 g mi 1,1,2016,7,5,15,25,25025,250250,4,21,0,0,0,0,00 1 1 2016 7 5 15 25 25025 250250 4 115 NULL 21 0 0 0 0 0 0.000172525 1 1 0.000172525 g mi 1,1,2016,7,5,15,25,25025,250250,4,21,0,0,0,0,00 1 1 2016 7 5 15 25 25025 250250 4 112 NULL 21 0 0 0 0 0 0.000762326 1 1 0.000762326 g mi 1,1,2016,7,5,15,25,25025,250250,4,21,0,0,0,0,00 1 1 2016 7 5 15 25 25025 250250 4 111 NULL 21 0 0 0 0 0 0.00303822 1 1 0.00303822 g mi 1,1,2016,7,5,15,25,25025,250250,4,21,0,0,0,0,00 1 1 2016 7 5 15 25 25025 250250 4 110 NULL 21 0 0 0 0 0 0.00523342 1 1 0.00523342 g mi 1,1,2016,7,5,15,25,25025,250250,4,21,0,0,0,0,00 1 1 2016 7 5 15 25 25025 250250 4 107 NULL 21 0 0 0 0 0 0.0128134 1 1 0.0128134 g mi 1,1,2016,7,5,15,25,25025,250250,4,21,0,0,0,0,00 1 1 2016 7 5 15 25 25025 250250 4 106 NULL 21 0 0 0 0 0 0.059643298 1 1 0.059643298 g mi 1,1,2016,7,5,15,25,25025,250250,4,21,0,0,0,0,00 1 1 2016 7 5 15 25 25025 250250 4 100 NULL 21 0 0 0 0 0 0.00591469 1 1 0.00591469 g mi 1,1,2016,7,5,15,25,25025,250250,4,21,0,0,0,0,00 1 1 2016 7 5 15 25 25025 250250 4 98 NULL 21 0 0 0 0 0 460.1749878 1 1 460.1749878 g mi 1,1,2016,7,5,15,25,25025,250250,4,21,0,0,0,0,00 1 1 2016 7 5 15 25 25025 250250 4 91 NULL 21 0 0 0 0 0 0.006066531 1 1 0.006066531 g mi 1,1,2016,7,5,15,25,25025,250250,4,21,0,0,0,0,00 1 1 2016 7 5 15 25 25025 250250 4 90 NULL 21 0 0 0 0 0 460.0639954 1 1 460.0639954 g mi 1,1,2016,7,5,15,25,25025,250250,4,21,0,0,0,0,00 1 1 2016 7 5 15 25 25025 250250 4 87 NULL 21 0 0 0 0 0 0.158370227 1 1 0.158370227 g mi 1,1,2016,7,5,15,25,25025,250250,4,21,0,0,0,0,00 1 1 2016 7 5 15 25 25025 250250 4 79 NULL 21 0 0 0 0 0 0.146915898 1 1 0.146915898 g mi

Boston-Logan International Airport 2016 EDR
Appendix I, Air Quality/Emissions Reduction I-51
1,1,2016,7,5,15,25,25025,250250,4,21,0,0,0,0,00 1 1 2016 7 5 15 25 25025 250250 4 66 NULL 21 0 0 0 0 0 4.02E-05 1 1 4.02E-05 g mi 1,1,2016,7,5,15,25,25025,250250,4,21,0,0,0,0,00 1 1 2016 7 5 15 25 25025 250250 4 59 NULL 21 0 0 0 0 0 9.95E-05 1 1 9.95E-05 g mi 1,1,2016,7,5,15,25,25025,250250,4,21,0,0,0,0,00 1 1 2016 7 5 15 25 25025 250250 4 58 NULL 21 0 0 0 0 0 1.77E-05 1 1 1.77E-05 g mi 1,1,2016,7,5,15,25,25025,250250,4,21,0,0,0,0,00 1 1 2016 7 5 15 25 25025 250250 4 57 NULL 21 0 0 0 0 0 1.77E-05 1 1 1.77E-05 g mi 1,1,2016,7,5,15,25,25025,250250,4,21,0,0,0,0,00 1 1 2016 7 5 15 25 25025 250250 4 56 NULL 21 0 0 0 0 0 1.86E-06 1 1 1.86E-06 g mi 1,1,2016,7,5,15,25,25025,250250,4,21,0,0,0,0,00 1 1 2016 7 5 15 25 25025 250250 4 55 NULL 21 0 0 0 0 0 7.87E-05 1 1 7.87E-05 g mi 1,1,2016,7,5,15,25,25025,250250,4,21,0,0,0,0,00 1 1 2016 7 5 15 25 25025 250250 4 54 NULL 21 0 0 0 0 0 7.88E-06 1 1 7.88E-06 g mi 1,1,2016,7,5,15,25,25025,250250,4,21,0,0,0,0,00 1 1 2016 7 5 15 25 25025 250250 4 53 NULL 21 0 0 0 0 0 4.64E-06 1 1 4.64E-06 g mi 1,1,2016,7,5,15,25,25025,250250,4,21,0,0,0,0,00 1 1 2016 7 5 15 25 25025 250250 4 52 NULL 21 0 0 0 0 0 2.27E-06 1 1 2.27E-06 g mi 1,1,2016,7,5,15,25,25025,250250,4,21,0,0,0,0,00 1 1 2016 7 5 15 25 25025 250250 4 51 NULL 21 0 0 0 0 0 5.74E-06 1 1 5.74E-06 g mi 1,1,2016,7,5,15,25,25025,250250,4,21,0,0,0,0,00 1 1 2016 7 5 15 25 25025 250250 4 36 NULL 21 0 0 0 0 0 0.000151264 1 1 0.000151264 g mi 1,1,2016,7,5,15,25,25025,250250,4,21,0,0,0,0,00 1 1 2016 7 5 15 25 25025 250250 4 35 NULL 21 0 0 0 0 0 1.58E-05 1 1 1.58E-05 g mi 1,1,2016,7,5,15,25,25025,250250,4,21,0,0,0,0,00 1 1 2016 7 5 15 25 25025 250250 4 31 NULL 21 0 0 0 0 0 0.00912692 1 1 0.00912692 g mi 1,1,2016,7,5,15,25,25025,250250,4,21,0,0,0,0,00 1 1 2016 7 5 15 25 25025 250250 4 5 NULL 21 0 0 0 0 0 0.004480024 1 1 0.004480024 g mi 1,1,2016,7,5,15,25,25025,250250,4,21,0,0,0,0,00 1 1 2016 7 5 15 25 25025 250250 4 3 NULL 21 0 0 0 0 0 0.234676778 1 1 0.234676778 g mi 1,1,2016,7,5,15,25,25025,250250,4,21,0,0,0,0,00 1 1 2016 7 5 15 25 25025 250250 4 2 NULL 21 0 0 0 0 0 3.257755756 1 1 3.257755756 g mi 1,1,2016,7,5,15,25,25025,250250,4,21,0,0,0,0,00 1 1 2016 7 5 15 25 25025 250250 4 1 NULL 21 0 0 0 0 0 0.151338309 1 1 0.151338309 g mi 1,1,2016,7,5,15,25,25025,250250,3,21,0,0,0,0,00 1 1 2016 7 5 15 25 25025 250250 3 122 NULL 21 0 0 0 0 0 0.000702602 1 1 0.000702602 g mi 1,1,2016,7,5,15,25,25025,250250,3,21,0,0,0,0,00 1 1 2016 7 5 15 25 25025 250250 3 121 NULL 21 0 0 0 0 0 0.000288677 1 1 0.000288677 g mi 1,1,2016,7,5,15,25,25025,250250,3,21,0,0,0,0,00 1 1 2016 7 5 15 25 25025 250250 3 119 NULL 21 0 0 0 0 0 0 1 1 0 g mi 1,1,2016,7,5,15,25,25025,250250,3,21,0,0,0,0,00 1 1 2016 7 5 15 25 25025 250250 3 118 NULL 21 0 0 0 0 0 0.00516983 1 1 0.00516983 g mi 1,1,2016,7,5,15,25,25025,250250,3,21,0,0,0,0,00 1 1 2016 7 5 15 25 25025 250250 3 117 NULL 21 0 0 0 0 0 0.002071 1 1 0.002071 g mi 1,1,2016,7,5,15,25,25025,250250,3,21,0,0,0,0,00 1 1 2016 7 5 15 25 25025 250250 3 116 NULL 21 0 0 0 0 0 0.00888722 1 1 0.00888722 g mi 1,1,2016,7,5,15,25,25025,250250,3,21,0,0,0,0,00 1 1 2016 7 5 15 25 25025 250250 3 115 NULL 21 0 0 0 0 0 0.000199518 1 1 0.000199518 g mi 1,1,2016,7,5,15,25,25025,250250,3,21,0,0,0,0,00 1 1 2016 7 5 15 25 25025 250250 3 112 NULL 21 0 0 0 0 0 0.000881464 1 1 0.000881464 g mi 1,1,2016,7,5,15,25,25025,250250,3,21,0,0,0,0,00 1 1 2016 7 5 15 25 25025 250250 3 111 NULL 21 0 0 0 0 0 0.003513 1 1 0.003513 g mi 1,1,2016,7,5,15,25,25025,250250,3,21,0,0,0,0,00 1 1 2016 7 5 15 25 25025 250250 3 110 NULL 21 0 0 0 0 0 0.00605129 1 1 0.00605129 g mi 1,1,2016,7,5,15,25,25025,250250,3,21,0,0,0,0,00 1 1 2016 7 5 15 25 25025 250250 3 107 NULL 21 0 0 0 0 0 0.0138067 1 1 0.0138067 g mi 1,1,2016,7,5,15,25,25025,250250,3,21,0,0,0,0,00 1 1 2016 7 5 15 25 25025 250250 3 106 NULL 21 0 0 0 0 0 0.071097799 1 1 0.071097799 g mi 1,1,2016,7,5,15,25,25025,250250,3,21,0,0,0,0,00 1 1 2016 7 5 15 25 25025 250250 3 100 NULL 21 0 0 0 0 0 0.00683902 1 1 0.00683902 g mi 1,1,2016,7,5,15,25,25025,250250,3,21,0,0,0,0,00 1 1 2016 7 5 15 25 25025 250250 3 98 NULL 21 0 0 0 0 0 539.059021 1 1 539.059021 g mi
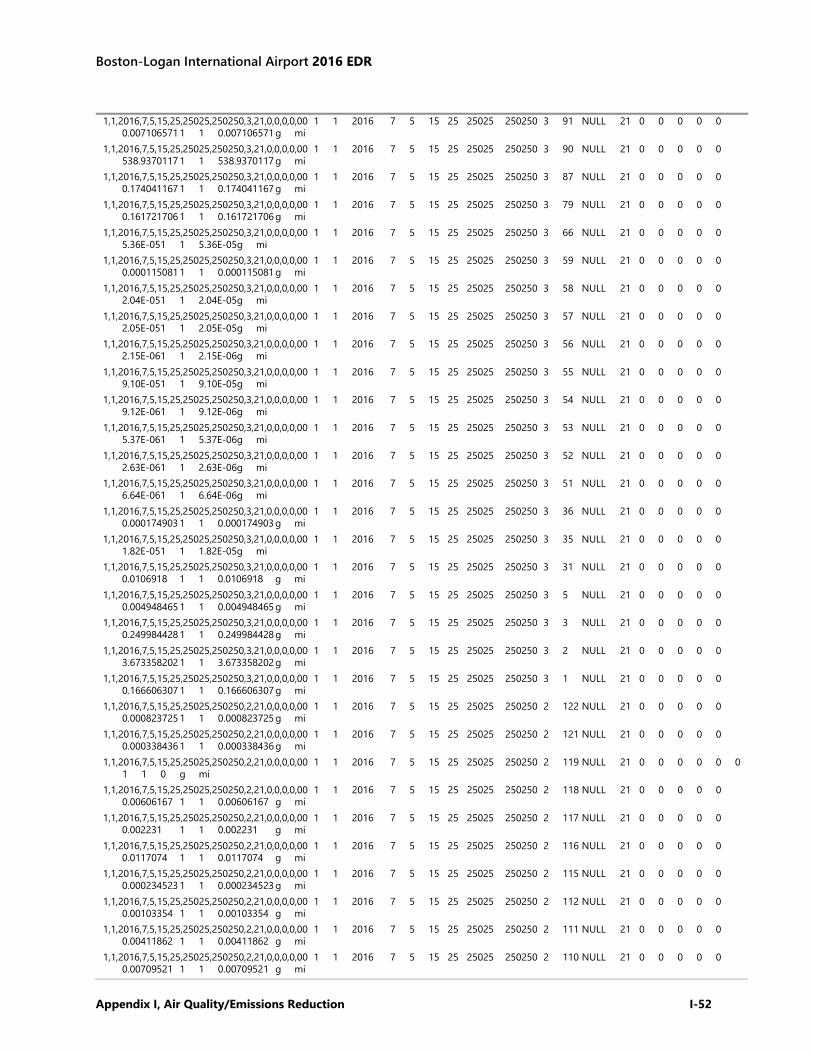
Boston-Logan International Airport 2016 EDR
Appendix I, Air Quality/Emissions Reduction I-52
1,1,2016,7,5,15,25,25025,250250,3,21,0,0,0,0,00 1 1 2016 7 5 15 25 25025 250250 3 91 NULL 21 0 0 0 0 0 0.007106571 1 1 0.007106571 g mi 1,1,2016,7,5,15,25,25025,250250,3,21,0,0,0,0,00 1 1 2016 7 5 15 25 25025 250250 3 90 NULL 21 0 0 0 0 0 538.9370117 1 1 538.9370117 g mi 1,1,2016,7,5,15,25,25025,250250,3,21,0,0,0,0,00 1 1 2016 7 5 15 25 25025 250250 3 87 NULL 21 0 0 0 0 0 0.174041167 1 1 0.174041167 g mi 1,1,2016,7,5,15,25,25025,250250,3,21,0,0,0,0,00 1 1 2016 7 5 15 25 25025 250250 3 79 NULL 21 0 0 0 0 0 0.161721706 1 1 0.161721706 g mi 1,1,2016,7,5,15,25,25025,250250,3,21,0,0,0,0,00 1 1 2016 7 5 15 25 25025 250250 3 66 NULL 21 0 0 0 0 0 5.36E-05 1 1 5.36E-05 g mi 1,1,2016,7,5,15,25,25025,250250,3,21,0,0,0,0,00 1 1 2016 7 5 15 25 25025 250250 3 59 NULL 21 0 0 0 0 0 0.000115081 1 1 0.000115081 g mi 1,1,2016,7,5,15,25,25025,250250,3,21,0,0,0,0,00 1 1 2016 7 5 15 25 25025 250250 3 58 NULL 21 0 0 0 0 0 2.04E-05 1 1 2.04E-05 g mi 1,1,2016,7,5,15,25,25025,250250,3,21,0,0,0,0,00 1 1 2016 7 5 15 25 25025 250250 3 57 NULL 21 0 0 0 0 0 2.05E-05 1 1 2.05E-05 g mi 1,1,2016,7,5,15,25,25025,250250,3,21,0,0,0,0,00 1 1 2016 7 5 15 25 25025 250250 3 56 NULL 21 0 0 0 0 0 2.15E-06 1 1 2.15E-06 g mi 1,1,2016,7,5,15,25,25025,250250,3,21,0,0,0,0,00 1 1 2016 7 5 15 25 25025 250250 3 55 NULL 21 0 0 0 0 0 9.10E-05 1 1 9.10E-05 g mi 1,1,2016,7,5,15,25,25025,250250,3,21,0,0,0,0,00 1 1 2016 7 5 15 25 25025 250250 3 54 NULL 21 0 0 0 0 0 9.12E-06 1 1 9.12E-06 g mi 1,1,2016,7,5,15,25,25025,250250,3,21,0,0,0,0,00 1 1 2016 7 5 15 25 25025 250250 3 53 NULL 21 0 0 0 0 0 5.37E-06 1 1 5.37E-06 g mi 1,1,2016,7,5,15,25,25025,250250,3,21,0,0,0,0,00 1 1 2016 7 5 15 25 25025 250250 3 52 NULL 21 0 0 0 0 0 2.63E-06 1 1 2.63E-06 g mi 1,1,2016,7,5,15,25,25025,250250,3,21,0,0,0,0,00 1 1 2016 7 5 15 25 25025 250250 3 51 NULL 21 0 0 0 0 0 6.64E-06 1 1 6.64E-06 g mi 1,1,2016,7,5,15,25,25025,250250,3,21,0,0,0,0,00 1 1 2016 7 5 15 25 25025 250250 3 36 NULL 21 0 0 0 0 0 0.000174903 1 1 0.000174903 g mi 1,1,2016,7,5,15,25,25025,250250,3,21,0,0,0,0,00 1 1 2016 7 5 15 25 25025 250250 3 35 NULL 21 0 0 0 0 0 1.82E-05 1 1 1.82E-05 g mi 1,1,2016,7,5,15,25,25025,250250,3,21,0,0,0,0,00 1 1 2016 7 5 15 25 25025 250250 3 31 NULL 21 0 0 0 0 0 0.0106918 1 1 0.0106918 g mi 1,1,2016,7,5,15,25,25025,250250,3,21,0,0,0,0,00 1 1 2016 7 5 15 25 25025 250250 3 5 NULL 21 0 0 0 0 0 0.004948465 1 1 0.004948465 g mi 1,1,2016,7,5,15,25,25025,250250,3,21,0,0,0,0,00 1 1 2016 7 5 15 25 25025 250250 3 3 NULL 21 0 0 0 0 0 0.249984428 1 1 0.249984428 g mi 1,1,2016,7,5,15,25,25025,250250,3,21,0,0,0,0,00 1 1 2016 7 5 15 25 25025 250250 3 2 NULL 21 0 0 0 0 0 3.673358202 1 1 3.673358202 g mi 1,1,2016,7,5,15,25,25025,250250,3,21,0,0,0,0,00 1 1 2016 7 5 15 25 25025 250250 3 1 NULL 21 0 0 0 0 0 0.166606307 1 1 0.166606307 g mi 1,1,2016,7,5,15,25,25025,250250,2,21,0,0,0,0,00 1 1 2016 7 5 15 25 25025 250250 2 122 NULL 21 0 0 0 0 0 0.000823725 1 1 0.000823725 g mi 1,1,2016,7,5,15,25,25025,250250,2,21,0,0,0,0,00 1 1 2016 7 5 15 25 25025 250250 2 121 NULL 21 0 0 0 0 0 0.000338436 1 1 0.000338436 g mi 1,1,2016,7,5,15,25,25025,250250,2,21,0,0,0,0,00 1 1 2016 7 5 15 25 25025 250250 2 119 NULL 21 0 0 0 0 0 0 1 1 0 g mi 1,1,2016,7,5,15,25,25025,250250,2,21,0,0,0,0,00 1 1 2016 7 5 15 25 25025 250250 2 118 NULL 21 0 0 0 0 0 0.00606167 1 1 0.00606167 g mi 1,1,2016,7,5,15,25,25025,250250,2,21,0,0,0,0,00 1 1 2016 7 5 15 25 25025 250250 2 117 NULL 21 0 0 0 0 0 0.002231 1 1 0.002231 g mi 1,1,2016,7,5,15,25,25025,250250,2,21,0,0,0,0,00 1 1 2016 7 5 15 25 25025 250250 2 116 NULL 21 0 0 0 0 0 0.0117074 1 1 0.0117074 g mi 1,1,2016,7,5,15,25,25025,250250,2,21,0,0,0,0,00 1 1 2016 7 5 15 25 25025 250250 2 115 NULL 21 0 0 0 0 0 0.000234523 1 1 0.000234523 g mi 1,1,2016,7,5,15,25,25025,250250,2,21,0,0,0,0,00 1 1 2016 7 5 15 25 25025 250250 2 112 NULL 21 0 0 0 0 0 0.00103354 1 1 0.00103354 g mi 1,1,2016,7,5,15,25,25025,250250,2,21,0,0,0,0,00 1 1 2016 7 5 15 25 25025 250250 2 111 NULL 21 0 0 0 0 0 0.00411862 1 1 0.00411862 g mi 1,1,2016,7,5,15,25,25025,250250,2,21,0,0,0,0,00 1 1 2016 7 5 15 25 25025 250250 2 110 NULL 21 0 0 0 0 0 0.00709521 1 1 0.00709521 g mi
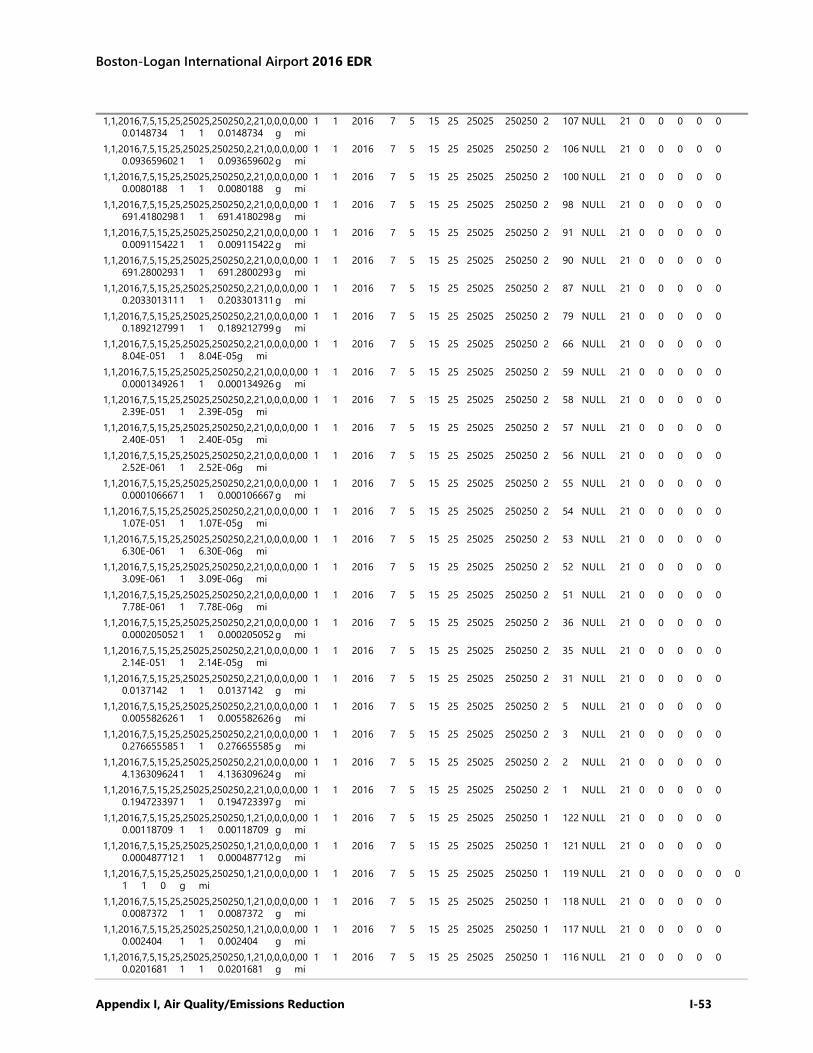
Boston-Logan International Airport 2016 EDR
Appendix I, Air Quality/Emissions Reduction I-53
1,1,2016,7,5,15,25,25025,250250,2,21,0,0,0,0,00 1 1 2016 7 5 15 25 25025 250250 2 107 NULL 21 0 0 0 0 0 0.0148734 1 1 0.0148734 g mi 1,1,2016,7,5,15,25,25025,250250,2,21,0,0,0,0,00 1 1 2016 7 5 15 25 25025 250250 2 106 NULL 21 0 0 0 0 0 0.093659602 1 1 0.093659602 g mi 1,1,2016,7,5,15,25,25025,250250,2,21,0,0,0,0,00 1 1 2016 7 5 15 25 25025 250250 2 100 NULL 21 0 0 0 0 0 0.0080188 1 1 0.0080188 g mi 1,1,2016,7,5,15,25,25025,250250,2,21,0,0,0,0,00 1 1 2016 7 5 15 25 25025 250250 2 98 NULL 21 0 0 0 0 0 691.4180298 1 1 691.4180298 g mi 1,1,2016,7,5,15,25,25025,250250,2,21,0,0,0,0,00 1 1 2016 7 5 15 25 25025 250250 2 91 NULL 21 0 0 0 0 0 0.009115422 1 1 0.009115422 g mi 1,1,2016,7,5,15,25,25025,250250,2,21,0,0,0,0,00 1 1 2016 7 5 15 25 25025 250250 2 90 NULL 21 0 0 0 0 0 691.2800293 1 1 691.2800293 g mi 1,1,2016,7,5,15,25,25025,250250,2,21,0,0,0,0,00 1 1 2016 7 5 15 25 25025 250250 2 87 NULL 21 0 0 0 0 0 0.203301311 1 1 0.203301311 g mi 1,1,2016,7,5,15,25,25025,250250,2,21,0,0,0,0,00 1 1 2016 7 5 15 25 25025 250250 2 79 NULL 21 0 0 0 0 0 0.189212799 1 1 0.189212799 g mi 1,1,2016,7,5,15,25,25025,250250,2,21,0,0,0,0,00 1 1 2016 7 5 15 25 25025 250250 2 66 NULL 21 0 0 0 0 0 8.04E-05 1 1 8.04E-05 g mi 1,1,2016,7,5,15,25,25025,250250,2,21,0,0,0,0,00 1 1 2016 7 5 15 25 25025 250250 2 59 NULL 21 0 0 0 0 0 0.000134926 1 1 0.000134926 g mi 1,1,2016,7,5,15,25,25025,250250,2,21,0,0,0,0,00 1 1 2016 7 5 15 25 25025 250250 2 58 NULL 21 0 0 0 0 0 2.39E-05 1 1 2.39E-05 g mi 1,1,2016,7,5,15,25,25025,250250,2,21,0,0,0,0,00 1 1 2016 7 5 15 25 25025 250250 2 57 NULL 21 0 0 0 0 0 2.40E-05 1 1 2.40E-05 g mi 1,1,2016,7,5,15,25,25025,250250,2,21,0,0,0,0,00 1 1 2016 7 5 15 25 25025 250250 2 56 NULL 21 0 0 0 0 0 2.52E-06 1 1 2.52E-06 g mi 1,1,2016,7,5,15,25,25025,250250,2,21,0,0,0,0,00 1 1 2016 7 5 15 25 25025 250250 2 55 NULL 21 0 0 0 0 0 0.000106667 1 1 0.000106667 g mi 1,1,2016,7,5,15,25,25025,250250,2,21,0,0,0,0,00 1 1 2016 7 5 15 25 25025 250250 2 54 NULL 21 0 0 0 0 0 1.07E-05 1 1 1.07E-05 g mi 1,1,2016,7,5,15,25,25025,250250,2,21,0,0,0,0,00 1 1 2016 7 5 15 25 25025 250250 2 53 NULL 21 0 0 0 0 0 6.30E-06 1 1 6.30E-06 g mi 1,1,2016,7,5,15,25,25025,250250,2,21,0,0,0,0,00 1 1 2016 7 5 15 25 25025 250250 2 52 NULL 21 0 0 0 0 0 3.09E-06 1 1 3.09E-06 g mi 1,1,2016,7,5,15,25,25025,250250,2,21,0,0,0,0,00 1 1 2016 7 5 15 25 25025 250250 2 51 NULL 21 0 0 0 0 0 7.78E-06 1 1 7.78E-06 g mi 1,1,2016,7,5,15,25,25025,250250,2,21,0,0,0,0,00 1 1 2016 7 5 15 25 25025 250250 2 36 NULL 21 0 0 0 0 0 0.000205052 1 1 0.000205052 g mi 1,1,2016,7,5,15,25,25025,250250,2,21,0,0,0,0,00 1 1 2016 7 5 15 25 25025 250250 2 35 NULL 21 0 0 0 0 0 2.14E-05 1 1 2.14E-05 g mi 1,1,2016,7,5,15,25,25025,250250,2,21,0,0,0,0,00 1 1 2016 7 5 15 25 25025 250250 2 31 NULL 21 0 0 0 0 0 0.0137142 1 1 0.0137142 g mi 1,1,2016,7,5,15,25,25025,250250,2,21,0,0,0,0,00 1 1 2016 7 5 15 25 25025 250250 2 5 NULL 21 0 0 0 0 0 0.005582626 1 1 0.005582626 g mi 1,1,2016,7,5,15,25,25025,250250,2,21,0,0,0,0,00 1 1 2016 7 5 15 25 25025 250250 2 3 NULL 21 0 0 0 0 0 0.276655585 1 1 0.276655585 g mi 1,1,2016,7,5,15,25,25025,250250,2,21,0,0,0,0,00 1 1 2016 7 5 15 25 25025 250250 2 2 NULL 21 0 0 0 0 0 4.136309624 1 1 4.136309624 g mi 1,1,2016,7,5,15,25,25025,250250,2,21,0,0,0,0,00 1 1 2016 7 5 15 25 25025 250250 2 1 NULL 21 0 0 0 0 0 0.194723397 1 1 0.194723397 g mi 1,1,2016,7,5,15,25,25025,250250,1,21,0,0,0,0,00 1 1 2016 7 5 15 25 25025 250250 1 122 NULL 21 0 0 0 0 0 0.00118709 1 1 0.00118709 g mi 1,1,2016,7,5,15,25,25025,250250,1,21,0,0,0,0,00 1 1 2016 7 5 15 25 25025 250250 1 121 NULL 21 0 0 0 0 0 0.000487712 1 1 0.000487712 g mi 1,1,2016,7,5,15,25,25025,250250,1,21,0,0,0,0,00 1 1 2016 7 5 15 25 25025 250250 1 119 NULL 21 0 0 0 0 0 0 1 1 0 g mi 1,1,2016,7,5,15,25,25025,250250,1,21,0,0,0,0,00 1 1 2016 7 5 15 25 25025 250250 1 118 NULL 21 0 0 0 0 0 0.0087372 1 1 0.0087372 g mi 1,1,2016,7,5,15,25,25025,250250,1,21,0,0,0,0,00 1 1 2016 7 5 15 25 25025 250250 1 117 NULL 21 0 0 0 0 0 0.002404 1 1 0.002404 g mi 1,1,2016,7,5,15,25,25025,250250,1,21,0,0,0,0,00 1 1 2016 7 5 15 25 25025 250250 1 116 NULL 21 0 0 0 0 0 0.0201681 1 1 0.0201681 g mi
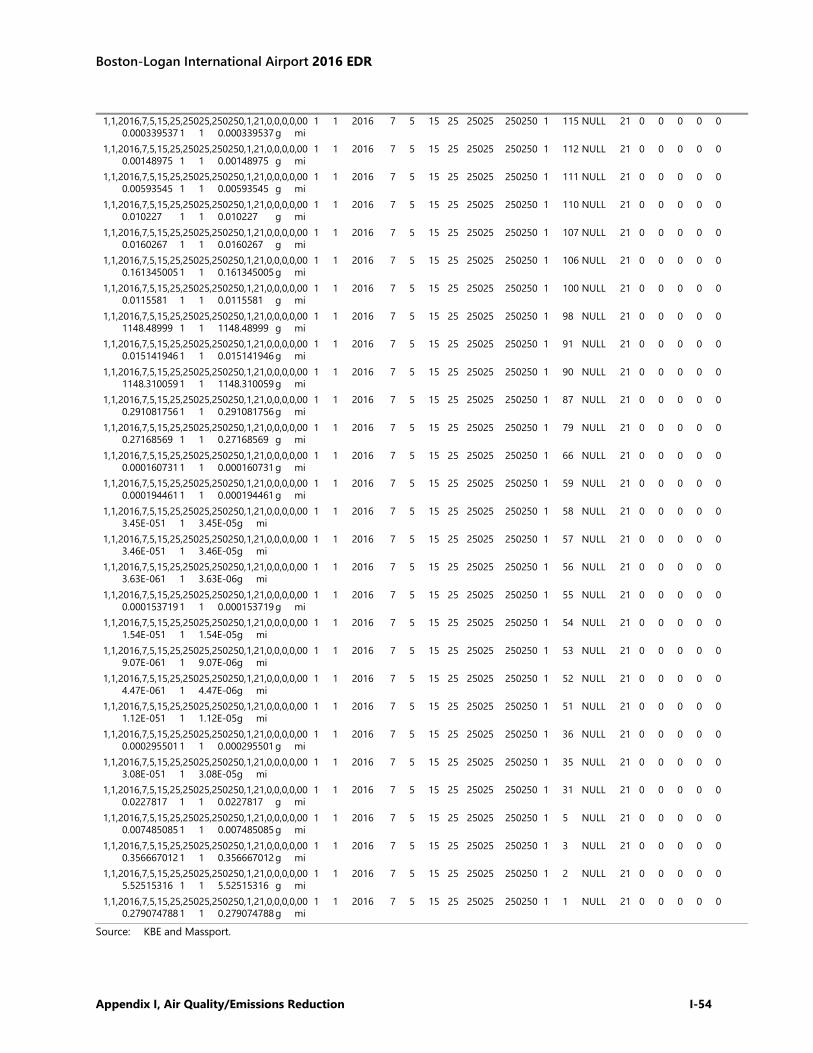
Boston-Logan International Airport 2016 EDR
Appendix I, Air Quality/Emissions Reduction I-54
Source: KBE and Massport.
1,1,2016,7,5,15,25,25025,250250,1,21,0,0,0,0,00 1 1 2016 7 5 15 25 25025 250250 1 115 NULL 21 0 0 0 0 0 0.000339537 1 1 0.000339537 g mi 1,1,2016,7,5,15,25,25025,250250,1,21,0,0,0,0,00 1 1 2016 7 5 15 25 25025 250250 1 112 NULL 21 0 0 0 0 0 0.00148975 1 1 0.00148975 g mi 1,1,2016,7,5,15,25,25025,250250,1,21,0,0,0,0,00 1 1 2016 7 5 15 25 25025 250250 1 111 NULL 21 0 0 0 0 0 0.00593545 1 1 0.00593545 g mi 1,1,2016,7,5,15,25,25025,250250,1,21,0,0,0,0,00 1 1 2016 7 5 15 25 25025 250250 1 110 NULL 21 0 0 0 0 0 0.010227 1 1 0.010227 g mi 1,1,2016,7,5,15,25,25025,250250,1,21,0,0,0,0,00 1 1 2016 7 5 15 25 25025 250250 1 107 NULL 21 0 0 0 0 0 0.0160267 1 1 0.0160267 g mi 1,1,2016,7,5,15,25,25025,250250,1,21,0,0,0,0,00 1 1 2016 7 5 15 25 25025 250250 1 106 NULL 21 0 0 0 0 0 0.161345005 1 1 0.161345005 g mi 1,1,2016,7,5,15,25,25025,250250,1,21,0,0,0,0,00 1 1 2016 7 5 15 25 25025 250250 1 100 NULL 21 0 0 0 0 0 0.0115581 1 1 0.0115581 g mi 1,1,2016,7,5,15,25,25025,250250,1,21,0,0,0,0,00 1 1 2016 7 5 15 25 25025 250250 1 98 NULL 21 0 0 0 0 0 1148.48999 1 1 1148.48999 g mi 1,1,2016,7,5,15,25,25025,250250,1,21,0,0,0,0,00 1 1 2016 7 5 15 25 25025 250250 1 91 NULL 21 0 0 0 0 0 0.015141946 1 1 0.015141946 g mi 1,1,2016,7,5,15,25,25025,250250,1,21,0,0,0,0,00 1 1 2016 7 5 15 25 25025 250250 1 90 NULL 21 0 0 0 0 0 1148.310059 1 1 1148.310059 g mi 1,1,2016,7,5,15,25,25025,250250,1,21,0,0,0,0,00 1 1 2016 7 5 15 25 25025 250250 1 87 NULL 21 0 0 0 0 0 0.291081756 1 1 0.291081756 g mi 1,1,2016,7,5,15,25,25025,250250,1,21,0,0,0,0,00 1 1 2016 7 5 15 25 25025 250250 1 79 NULL 21 0 0 0 0 0 0.27168569 1 1 0.27168569 g mi 1,1,2016,7,5,15,25,25025,250250,1,21,0,0,0,0,00 1 1 2016 7 5 15 25 25025 250250 1 66 NULL 21 0 0 0 0 0 0.000160731 1 1 0.000160731 g mi 1,1,2016,7,5,15,25,25025,250250,1,21,0,0,0,0,00 1 1 2016 7 5 15 25 25025 250250 1 59 NULL 21 0 0 0 0 0 0.000194461 1 1 0.000194461 g mi 1,1,2016,7,5,15,25,25025,250250,1,21,0,0,0,0,00 1 1 2016 7 5 15 25 25025 250250 1 58 NULL 21 0 0 0 0 0 3.45E-05 1 1 3.45E-05 g mi 1,1,2016,7,5,15,25,25025,250250,1,21,0,0,0,0,00 1 1 2016 7 5 15 25 25025 250250 1 57 NULL 21 0 0 0 0 0 3.46E-05 1 1 3.46E-05 g mi 1,1,2016,7,5,15,25,25025,250250,1,21,0,0,0,0,00 1 1 2016 7 5 15 25 25025 250250 1 56 NULL 21 0 0 0 0 0 3.63E-06 1 1 3.63E-06 g mi 1,1,2016,7,5,15,25,25025,250250,1,21,0,0,0,0,00 1 1 2016 7 5 15 25 25025 250250 1 55 NULL 21 0 0 0 0 0 0.000153719 1 1 0.000153719 g mi 1,1,2016,7,5,15,25,25025,250250,1,21,0,0,0,0,00 1 1 2016 7 5 15 25 25025 250250 1 54 NULL 21 0 0 0 0 0 1.54E-05 1 1 1.54E-05 g mi 1,1,2016,7,5,15,25,25025,250250,1,21,0,0,0,0,00 1 1 2016 7 5 15 25 25025 250250 1 53 NULL 21 0 0 0 0 0 9.07E-06 1 1 9.07E-06 g mi 1,1,2016,7,5,15,25,25025,250250,1,21,0,0,0,0,00 1 1 2016 7 5 15 25 25025 250250 1 52 NULL 21 0 0 0 0 0 4.47E-06 1 1 4.47E-06 g mi 1,1,2016,7,5,15,25,25025,250250,1,21,0,0,0,0,00 1 1 2016 7 5 15 25 25025 250250 1 51 NULL 21 0 0 0 0 0 1.12E-05 1 1 1.12E-05 g mi 1,1,2016,7,5,15,25,25025,250250,1,21,0,0,0,0,00 1 1 2016 7 5 15 25 25025 250250 1 36 NULL 21 0 0 0 0 0 0.000295501 1 1 0.000295501 g mi 1,1,2016,7,5,15,25,25025,250250,1,21,0,0,0,0,00 1 1 2016 7 5 15 25 25025 250250 1 35 NULL 21 0 0 0 0 0 3.08E-05 1 1 3.08E-05 g mi 1,1,2016,7,5,15,25,25025,250250,1,21,0,0,0,0,00 1 1 2016 7 5 15 25 25025 250250 1 31 NULL 21 0 0 0 0 0 0.0227817 1 1 0.0227817 g mi 1,1,2016,7,5,15,25,25025,250250,1,21,0,0,0,0,00 1 1 2016 7 5 15 25 25025 250250 1 5 NULL 21 0 0 0 0 0 0.007485085 1 1 0.007485085 g mi 1,1,2016,7,5,15,25,25025,250250,1,21,0,0,0,0,00 1 1 2016 7 5 15 25 25025 250250 1 3 NULL 21 0 0 0 0 0 0.356667012 1 1 0.356667012 g mi 1,1,2016,7,5,15,25,25025,250250,1,21,0,0,0,0,00 1 1 2016 7 5 15 25 25025 250250 1 2 NULL 21 0 0 0 0 0 5.52515316 1 1 5.52515316 g mi 1,1,2016,7,5,15,25,25025,250250,1,21,0,0,0,0,00 1 1 2016 7 5 15 25 25025 250250 1 1 NULL 21 0 0 0 0 0 0.279074788 1 1 0.279074788 g mi
Boston-Logan International Airport 2016 EDR
Appendix I, Air Quality/Emissions Reduction I-55
Fuel Storage and Handling
As in previous years, VOC emissions from fuel storage and handling were calculated using methods based on EPA's AP-421 document. Calculations account for evaporative emissions from breathing losses, working losses, and spillage from aboveground storage tanks, underground storage tanks, and aircraft refueling. In 2003, additional information became available on the fire training fuel, Tek-Flame®. Emissions of VOCs from this fuel were estimated by AEDT. Table I-9 presents Logan Airport’s fuel throughput by category.
Stationary Sources
Stationary sources include the Central Heating and Cooling Plant, emergency generators, snow melters, space heaters, and boilers. Emission factors from EPA's AP-42 or NOx Reasonably Available Control Technology (RACT) compliance testing were combined with the actual 2016 fuel throughput of the stationary sources to obtain emissions of VOCs, NOX, CO, and PM with a diameter of less than or equal to 10 micrograms or 2.5 micrograms (PM10/PM2.5). Title V of the 1990 Clean Air Act (CAA) Amendments requires facilities with air emissions to document their emissions and obtain a single permit combining all sources. The permitting program ensures that all emission sources are accounted for, the proper permits have been received, and permit conditions are being followed. A Title V Air Operating Permit covers all of the stationary sources at Logan Airport including boilers, emergency generators, snow melters, fire training, cooling towers, paint booths, deicing facilities, and storage tanks. Table I-10 presents Logan Airport’s stationary source fuel throughput by fuel category.
–––––––––––––––– 1 Compilation of Air Pollutant Emission Factors, AP-42, Office of Air Quality Planning and Standards, EPA, Fifth Edition, 1995.
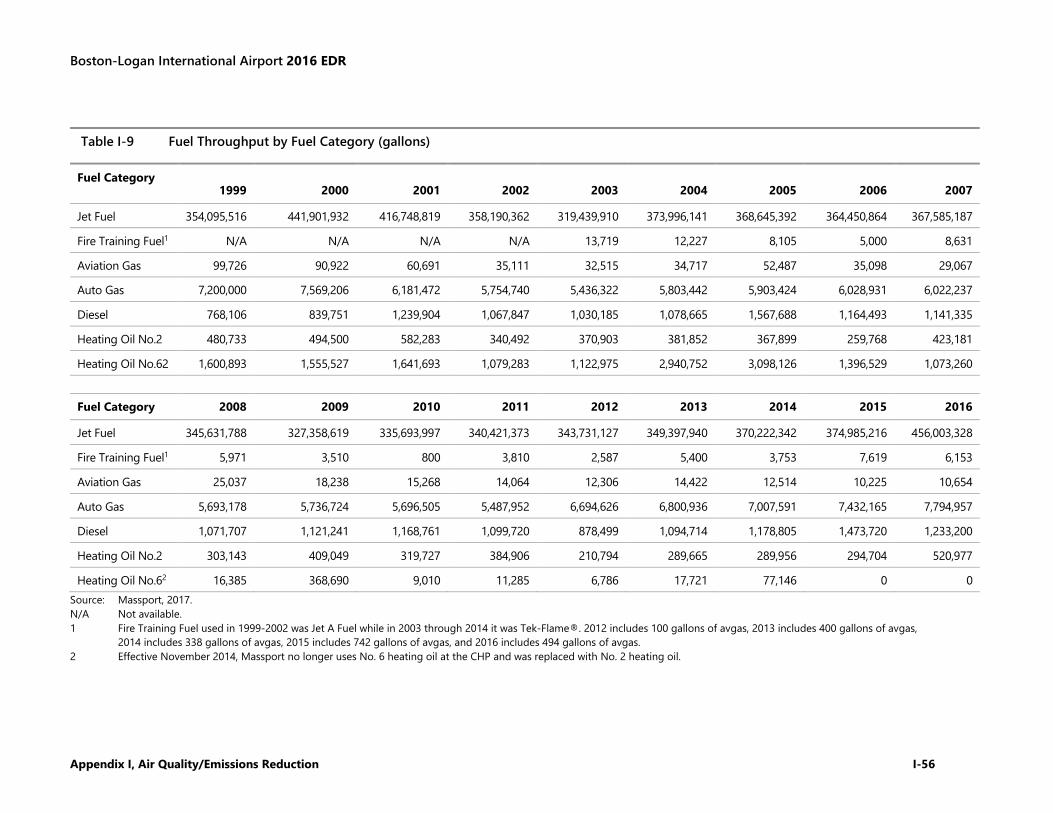
Boston-Logan International Airport 2016 EDR
Appendix I, Air Quality/Emissions Reduction I-56
Source: Massport, 2017. N/A Not available. 1 Fire Training Fuel used in 1999-2002 was Jet A Fuel while in 2003 through 2014 it was Tek-Flame®. 2012 includes 100 gallons of avgas, 2013 includes 400 gallons of avgas,
2014 includes 338 gallons of avgas, 2015 includes 742 gallons of avgas, and 2016 includes 494 gallons of avgas. 2 Effective November 2014, Massport no longer uses No. 6 heating oil at the CHP and was replaced with No. 2 heating oil.
Table I-9 Fuel Throughput by Fuel Category (gallons)
Fuel Category 1999 2000 2001 2002 2003 2004 2005 2006 2007
Jet Fuel 354,095,516 441,901,932 416,748,819 358,190,362 319,439,910 373,996,141 368,645,392 364,450,864 367,585,187 Fire Training Fuel1 N/A N/A N/A N/A 13,719 12,227 8,105 5,000 8,631 Aviation Gas 99,726 90,922 60,691 35,111 32,515 34,717 52,487 35,098 29,067 Auto Gas 7,200,000 7,569,206 6,181,472 5,754,740 5,436,322 5,803,442 5,903,424 6,028,931 6,022,237 Diesel 768,106 839,751 1,239,904 1,067,847 1,030,185 1,078,665 1,567,688 1,164,493 1,141,335 Heating Oil No.2 480,733 494,500 582,283 340,492 370,903 381,852 367,899 259,768 423,181 Heating Oil No.62 1,600,893 1,555,527 1,641,693 1,079,283 1,122,975 2,940,752 3,098,126 1,396,529 1,073,260
Fuel Category 2008 2009 2010 2011 2012 2013 2014 2015 2016
Jet Fuel 345,631,788 327,358,619 335,693,997 340,421,373 343,731,127 349,397,940 370,222,342 374,985,216 456,003,328 Fire Training Fuel1 5,971 3,510 800 3,810 2,587 5,400 3,753 7,619 6,153 Aviation Gas 25,037 18,238 15,268 14,064 12,306 14,422 12,514 10,225 10,654 Auto Gas 5,693,178 5,736,724 5,696,505 5,487,952 6,694,626 6,800,936 7,007,591 7,432,165 7,794,957 Diesel 1,071,707 1,121,241 1,168,761 1,099,720 878,499 1,094,714 1,178,805 1,473,720 1,233,200 Heating Oil No.2 303,143 409,049 319,727 384,906 210,794 289,665 289,956 294,704 520,977 Heating Oil No.62 16,385 368,690 9,010 11,285 6,786 17,721 77,146 0 0

Boston-Logan International Airport 2016 EDR
Appendix I, Air Quality/Emissions Reduction I-57
Source: Massport, 2017. N/A Not available. 1 Effective November 2014, Massport no longer uses No. 6 heating oil at the CHP and was replaced with No. 2 heating oil. 2 Diesel fuel was from the stationary snow melter usage. Starting in 2007, portable snow melter usage was also included. 3 Fire Training Fuel used in 1999-2002 was Jet A Fuel while in 2003 through 2015 it was Tek-Flame®. 2012 includes 100 gallons of avgas, 2013 includes 400 gallons of avgas,
2014 includes 338 gallons of avgas, 2015 includes 742 gallons of avgas, and 2016 includes 494 gallons of avgas.
Table I-10 Stationary Source Fuel Throughput by Fuel Category (gallons)
Fuel Category 1999 2000 2001 2002 2003 2004 2005 2006 2007
Natural Gas (ft3) 183,943,000 283,720,049 199,500,000 268,359,282 201,714,114 62,610,000 92,460,000 112,390,000 338,430,000 Heating Oil No. 2 480,733 494,500 582,283 340,492 370,903 381,852 367,899 259,768 423,181 Heating Oil No. 61 1,600,893 1,555,527 1,641,693 1,079,283 1,122,975 2,940,752 3,098,126 1,396,529 1,073,260 Diesel Fuel2 57,441 N/A N/A N/A N/A 67,198 77,848 77,848 258,606 Fire Training Fuel3 23,000 N/A N/A N/A 13,719 12,227 8,105 5,000 8,631
Fuel Category 2008 2009 2010 2011 2012 2013 2014 2015 2016
Natural Gas (ft3) 458,680,000 430,810,000 449,640,000 479,830,000 360,523,000 402,496,000 418,805,000 463,170,000 429,502,000 Heating Oil No. 2 303,143 409,050 319,727 384,906 210,794 289,665 289,956 294,704 520,977 Heating Oil No. 61 16,385 368,690 9,010 11,285 6,786 17,721 77,146 0 0 Diesel Fuel2 146,718 145,778 116,511 218,081 42,109 231,130 124,480 381,581 90,850 Fire Training Fuel3 5,971 3,510 800 3,810 2,587 5,400 3,753 7,619 6,153
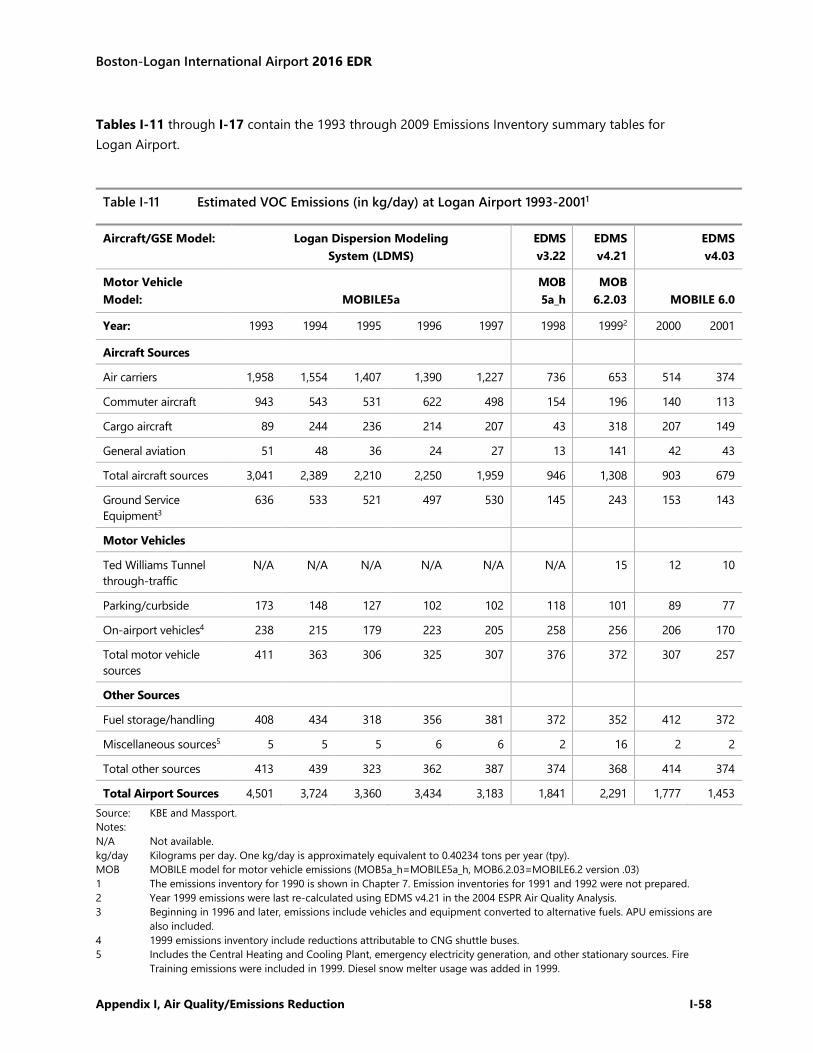
Boston-Logan International Airport 2016 EDR
Appendix I, Air Quality/Emissions Reduction I-58
Tables I-11 through I-17 contain the 1993 through 2009 Emissions Inventory summary tables for Logan Airport.
Source: KBE and Massport. Notes: N/A Not available. kg/day Kilograms per day. One kg/day is approximately equivalent to 0.40234 tons per year (tpy). MOB MOBILE model for motor vehicle emissions (MOB5a_h=MOBILE5a_h, MOB6.2.03=MOBILE6.2 version .03) 1 The emissions inventory for 1990 is shown in Chapter 7. Emission inventories for 1991 and 1992 were not prepared. 2 Year 1999 emissions were last re-calculated using EDMS v4.21 in the 2004 ESPR Air Quality Analysis. 3 Beginning in 1996 and later, emissions include vehicles and equipment converted to alternative fuels. APU emissions are
also included. 4 1999 emissions inventory include reductions attributable to CNG shuttle buses. 5 Includes the Central Heating and Cooling Plant, emergency electricity generation, and other stationary sources. Fire
Training emissions were included in 1999. Diesel snow melter usage was added in 1999.
Table I-11 Estimated VOC Emissions (in kg/day) at Logan Airport 1993-20011
Aircraft/GSE Model: Logan Dispersion Modeling System (LDMS)
EDMS v3.22
EDMS v4.21
EDMS v4.03
Motor Vehicle Model: MOBILE5a
MOB 5a_h
MOB 6.2.03 MOBILE 6.0
Year: 1993 1994 1995 1996 1997 1998 19992 2000 2001 Aircraft Sources Air carriers 1,958 1,554 1,407 1,390 1,227 736 653 514 374 Commuter aircraft 943 543 531 622 498 154 196 140 113 Cargo aircraft 89 244 236 214 207 43 318 207 149 General aviation 51 48 36 24 27 13 141 42 43 Total aircraft sources 3,041 2,389 2,210 2,250 1,959 946 1,308 903 679 Ground Service Equipment3
636 533 521 497 530 145 243 153 143
Motor Vehicles Ted Williams Tunnel through-traffic
N/A N/A N/A N/A N/A N/A 15 12 10
Parking/curbside 173 148 127 102 102 118 101 89 77 On-airport vehicles4 238 215 179 223 205 258 256 206 170 Total motor vehicle sources
411 363 306 325 307 376 372 307 257
Other Sources Fuel storage/handling 408 434 318 356 381 372 352 412 372 Miscellaneous sources5 5 5 5 6 6 2 16 2 2 Total other sources 413 439 323 362 387 374 368 414 374 Total Airport Sources 4,501 3,724 3,360 3,434 3,183 1,841 2,291 1,777 1,453
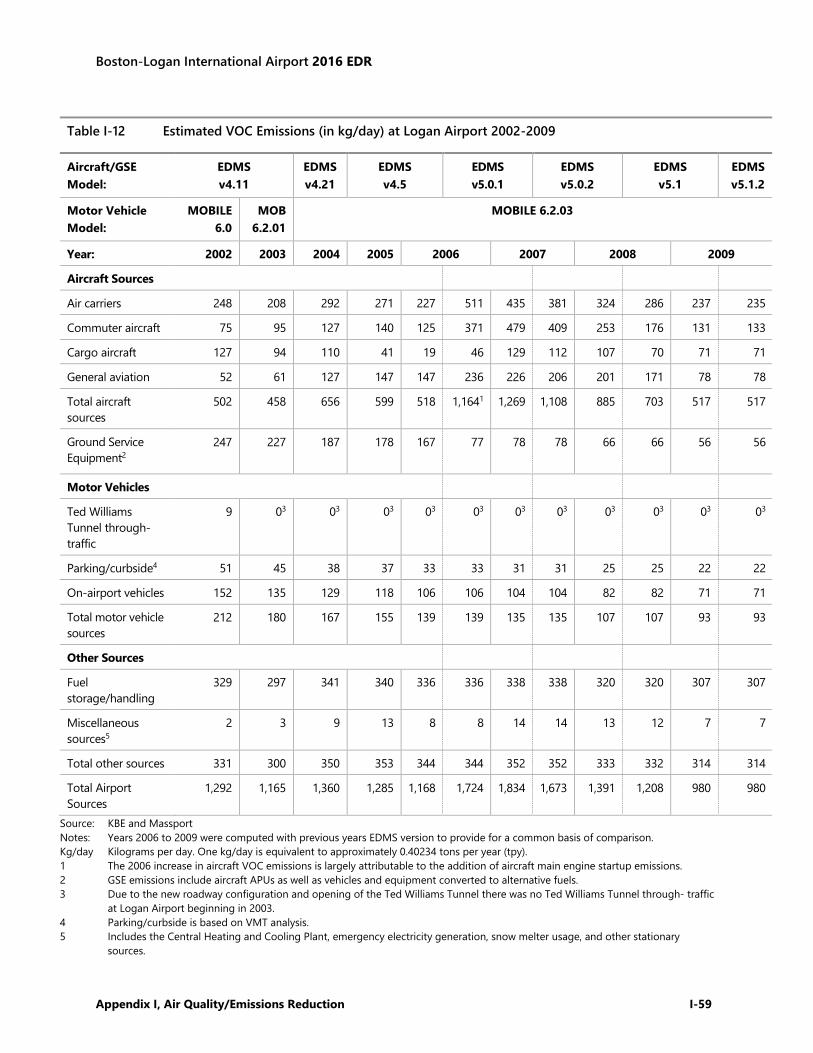
Boston-Logan International Airport 2016 EDR
Appendix I, Air Quality/Emissions Reduction I-59
Source: KBE and Massport Notes: Years 2006 to 2009 were computed with previous years EDMS version to provide for a common basis of comparison. Kg/day Kilograms per day. One kg/day is equivalent to approximately 0.40234 tons per year (tpy). 1 The 2006 increase in aircraft VOC emissions is largely attributable to the addition of aircraft main engine startup emissions. 2 GSE emissions include aircraft APUs as well as vehicles and equipment converted to alternative fuels. 3 Due to the new roadway configuration and opening of the Ted Williams Tunnel there was no Ted Williams Tunnel through- traffic
at Logan Airport beginning in 2003. 4 Parking/curbside is based on VMT analysis. 5 Includes the Central Heating and Cooling Plant, emergency electricity generation, snow melter usage, and other stationary
sources.
Table I-12 Estimated VOC Emissions (in kg/day) at Logan Airport 2002-2009
Aircraft/GSE Model:
EDMS v4.11
EDMS v4.21
EDMS v4.5
EDMS v5.0.1
EDMS v5.0.2
EDMS v5.1
EDMS v5.1.2
Motor Vehicle Model:
MOBILE 6.0
MOB 6.2.01
MOBILE 6.2.03
Year: 2002 2003 2004 2005 2006 2007 2008 2009
Aircraft Sources Air carriers 248 208 292 271 227 511 435 381 324 286 237 235 Commuter aircraft 75 95 127 140 125 371 479 409 253 176 131 133 Cargo aircraft 127 94 110 41 19 46 129 112 107 70 71 71 General aviation 52 61 127 147 147 236 226 206 201 171 78 78 Total aircraft sources
502 458 656 599 518 1,1641 1,269 1,108 885 703 517 517
Ground Service Equipment2
247 227 187 178 167 77 78 78 66 66 56 56
Motor Vehicles Ted Williams Tunnel through-traffic
9 03 03 03 03 03 03 03 03 03 03 03
Parking/curbside4 51 45 38 37 33 33 31 31 25 25 22 22 On-airport vehicles 152 135 129 118 106 106 104 104 82 82 71 71 Total motor vehicle sources
212 180 167 155 139 139 135 135 107 107 93 93
Other Sources Fuel storage/handling
329 297 341 340 336 336 338 338 320 320 307 307
Miscellaneous sources5
2 3 9 13 8 8 14 14 13 12 7 7
Total other sources 331 300 350 353 344 344 352 352 333 332 314 314 Total Airport Sources
1,292 1,165 1,360 1,285 1,168 1,724 1,834 1,673 1,391 1,208 980 980
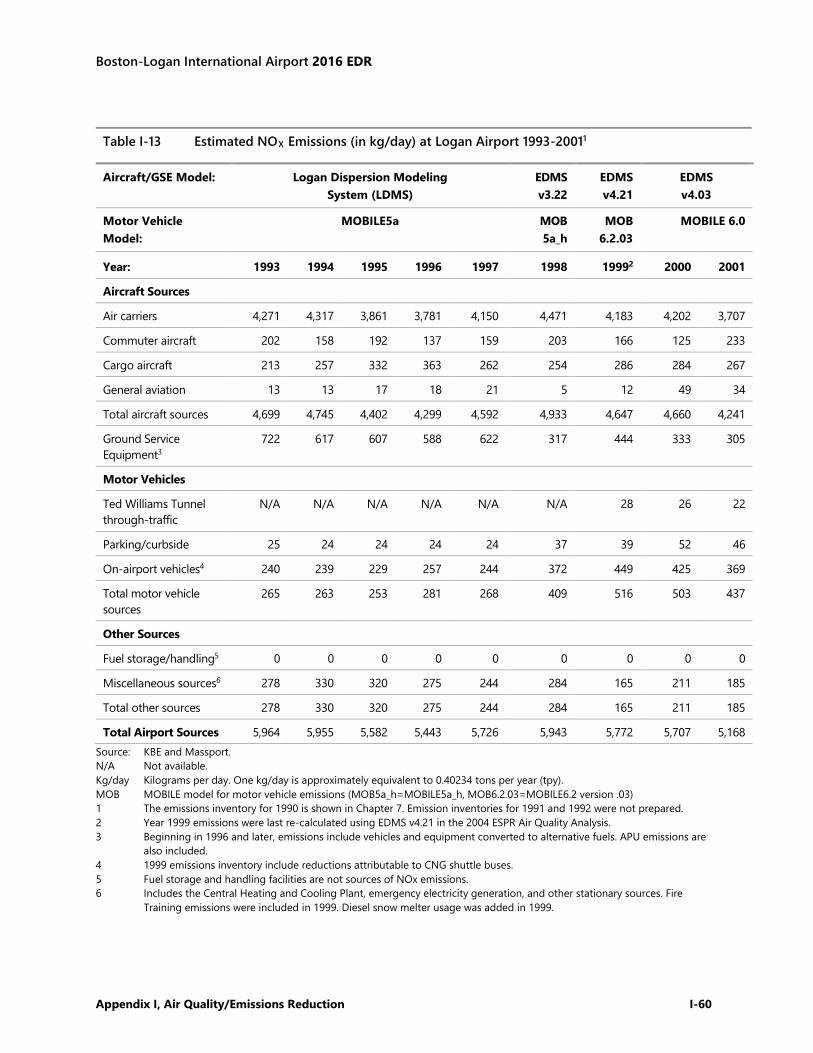
Boston-Logan International Airport 2016 EDR
Appendix I, Air Quality/Emissions Reduction I-60
Table I-13 Estimated NOX Emissions (in kg/day) at Logan Airport 1993-20011
Aircraft/GSE Model: Logan Dispersion Modeling System (LDMS)
EDMS v3.22
EDMS v4.21
EDMS v4.03
Motor Vehicle Model:
MOBILE5a MOB 5a_h
MOB 6.2.03
MOBILE 6.0
Year: 1993 1994 1995 1996 1997 1998 19992 2000 2001
Aircraft Sources Air carriers 4,271 4,317 3,861 3,781 4,150 4,471 4,183 4,202 3,707 Commuter aircraft 202 158 192 137 159 203 166 125 233 Cargo aircraft 213 257 332 363 262 254 286 284 267 General aviation 13 13 17 18 21 5 12 49 34 Total aircraft sources 4,699 4,745 4,402 4,299 4,592 4,933 4,647 4,660 4,241 Ground Service Equipment3
722 617 607 588 622 317 444 333 305
Motor Vehicles Ted Williams Tunnel through-traffic
N/A N/A N/A N/A N/A N/A 28 26 22
Parking/curbside 25 24 24 24 24 37 39 52 46 On-airport vehicles4 240 239 229 257 244 372 449 425 369 Total motor vehicle sources
265 263 253 281 268 409 516 503 437
Other Sources Fuel storage/handling5 0 0 0 0 0 0 0 0 0 Miscellaneous sources6 278 330 320 275 244 284 165 211 185 Total other sources 278 330 320 275 244 284 165 211 185 Total Airport Sources 5,964 5,955 5,582 5,443 5,726 5,943 5,772 5,707 5,168
Source: KBE and Massport. N/A Not available. Kg/day Kilograms per day. One kg/day is approximately equivalent to 0.40234 tons per year (tpy). MOB MOBILE model for motor vehicle emissions (MOB5a_h=MOBILE5a_h, MOB6.2.03=MOBILE6.2 version .03) 1 The emissions inventory for 1990 is shown in Chapter 7. Emission inventories for 1991 and 1992 were not prepared. 2 Year 1999 emissions were last re-calculated using EDMS v4.21 in the 2004 ESPR Air Quality Analysis. 3 Beginning in 1996 and later, emissions include vehicles and equipment converted to alternative fuels. APU emissions are
also included. 4 1999 emissions inventory include reductions attributable to CNG shuttle buses. 5 Fuel storage and handling facilities are not sources of NOx emissions. 6 Includes the Central Heating and Cooling Plant, emergency electricity generation, and other stationary sources. Fire
Training emissions were included in 1999. Diesel snow melter usage was added in 1999.
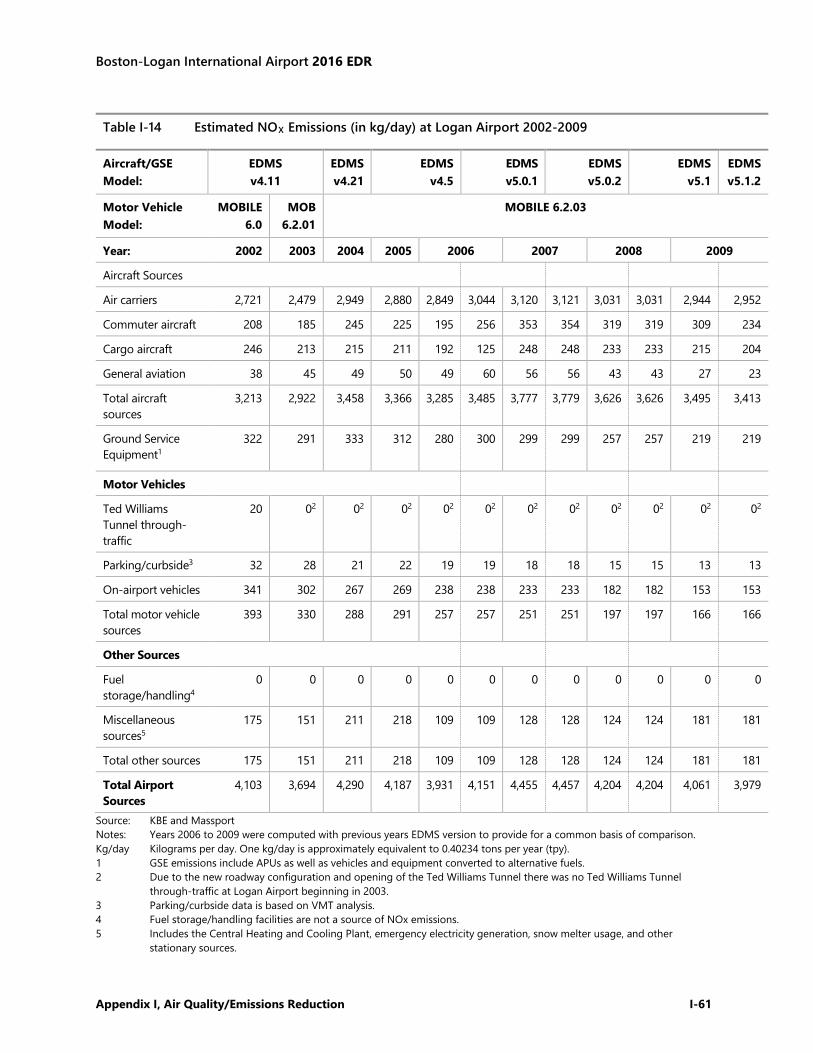
Boston-Logan International Airport 2016 EDR
Appendix I, Air Quality/Emissions Reduction I-61
Table I-14 Estimated NOX Emissions (in kg/day) at Logan Airport 2002-2009
Aircraft/GSE Model:
EDMS v4.11
EDMS v4.21
EDMS v4.5
EDMS v5.0.1
EDMS v5.0.2
EDMS v5.1
EDMS v5.1.2
Motor Vehicle Model:
MOBILE 6.0
MOB 6.2.01
MOBILE 6.2.03
Year: 2002 2003 2004 2005 2006 2007 2008 2009
Aircraft Sources Air carriers 2,721 2,479 2,949 2,880 2,849 3,044 3,120 3,121 3,031 3,031 2,944 2,952 Commuter aircraft 208 185 245 225 195 256 353 354 319 319 309 234 Cargo aircraft 246 213 215 211 192 125 248 248 233 233 215 204 General aviation 38 45 49 50 49 60 56 56 43 43 27 23 Total aircraft sources
3,213 2,922 3,458 3,366 3,285 3,485 3,777 3,779 3,626 3,626 3,495 3,413
Ground Service Equipment1
322 291 333 312 280 300 299 299 257 257 219 219
Motor Vehicles Ted Williams Tunnel through-traffic
20 02 02 02 02 02 02 02 02 02 02 02
Parking/curbside3 32 28 21 22 19 19 18 18 15 15 13 13 On-airport vehicles 341 302 267 269 238 238 233 233 182 182 153 153 Total motor vehicle sources
393 330 288 291 257 257 251 251 197 197 166 166
Other Sources Fuel storage/handling4
0 0 0 0 0 0 0 0 0 0 0 0
Miscellaneous sources5
175 151 211 218 109 109 128 128 124 124 181 181
Total other sources 175 151 211 218 109 109 128 128 124 124 181 181 Total Airport Sources
4,103 3,694 4,290 4,187 3,931 4,151 4,455 4,457 4,204 4,204 4,061 3,979
Source: KBE and Massport Notes: Years 2006 to 2009 were computed with previous years EDMS version to provide for a common basis of comparison. Kg/day Kilograms per day. One kg/day is approximately equivalent to 0.40234 tons per year (tpy). 1 GSE emissions include APUs as well as vehicles and equipment converted to alternative fuels. 2 Due to the new roadway configuration and opening of the Ted Williams Tunnel there was no Ted Williams Tunnel
through-traffic at Logan Airport beginning in 2003. 3 Parking/curbside data is based on VMT analysis. 4 Fuel storage/handling facilities are not a source of NOx emissions. 5 Includes the Central Heating and Cooling Plant, emergency electricity generation, snow melter usage, and other
stationary sources.
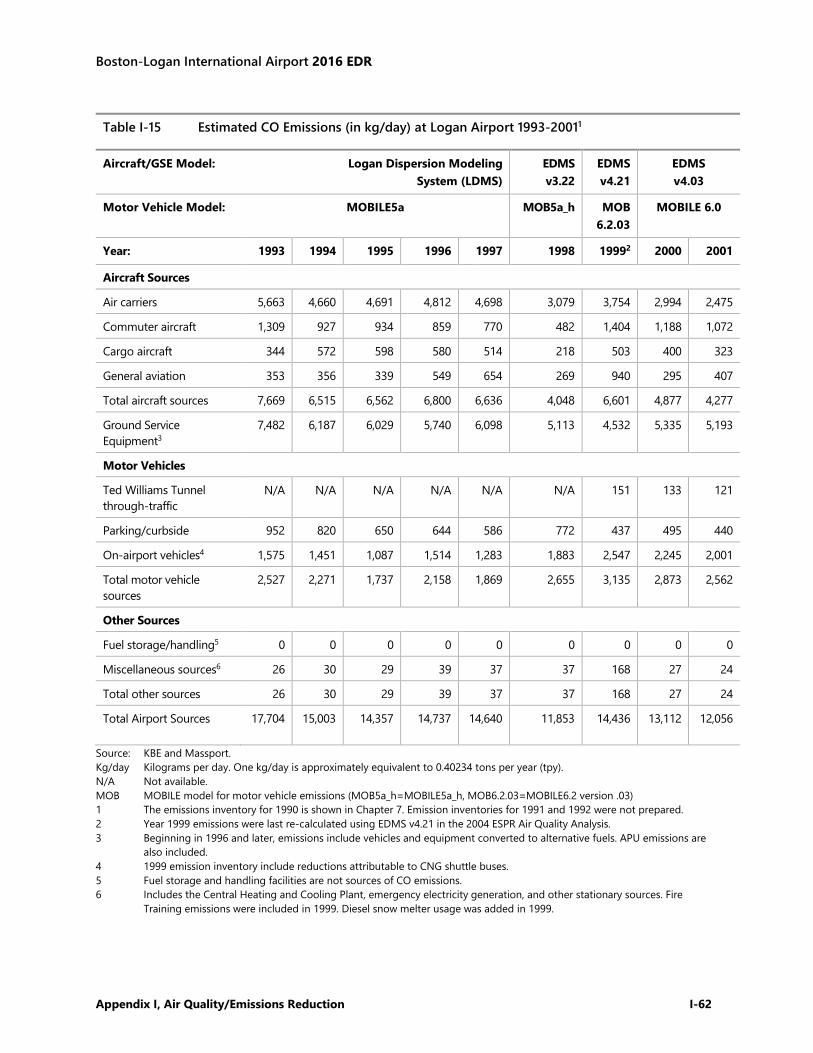
Boston-Logan International Airport 2016 EDR
Appendix I, Air Quality/Emissions Reduction I-62
Table I-15 Estimated CO Emissions (in kg/day) at Logan Airport 1993-20011
Aircraft/GSE Model: Logan Dispersion Modeling System (LDMS)
EDMS v3.22
EDMS v4.21
EDMS v4.03
Motor Vehicle Model: MOBILE5a MOB5a_h MOB 6.2.03
MOBILE 6.0
Year: 1993 1994 1995 1996 1997 1998 19992 2000 2001
Aircraft Sources Air carriers 5,663 4,660 4,691 4,812 4,698 3,079 3,754 2,994 2,475 Commuter aircraft 1,309 927 934 859 770 482 1,404 1,188 1,072 Cargo aircraft 344 572 598 580 514 218 503 400 323 General aviation 353 356 339 549 654 269 940 295 407 Total aircraft sources 7,669 6,515 6,562 6,800 6,636 4,048 6,601 4,877 4,277 Ground Service Equipment3
7,482 6,187 6,029 5,740 6,098 5,113 4,532 5,335 5,193
Motor Vehicles Ted Williams Tunnel through-traffic
N/A N/A N/A N/A N/A N/A 151 133 121
Parking/curbside 952 820 650 644 586 772 437 495 440 On-airport vehicles4 1,575 1,451 1,087 1,514 1,283 1,883 2,547 2,245 2,001 Total motor vehicle sources
2,527 2,271 1,737 2,158 1,869 2,655 3,135 2,873 2,562
Other Sources Fuel storage/handling5 0 0 0 0 0 0 0 0 0 Miscellaneous sources6 26 30 29 39 37 37 168 27 24 Total other sources 26 30 29 39 37 37 168 27 24 Total Airport Sources 17,704 15,003 14,357 14,737 14,640 11,853 14,436 13,112 12,056
Source: KBE and Massport. Kg/day Kilograms per day. One kg/day is approximately equivalent to 0.40234 tons per year (tpy). N/A Not available. MOB MOBILE model for motor vehicle emissions (MOB5a_h=MOBILE5a_h, MOB6.2.03=MOBILE6.2 version .03) 1 The emissions inventory for 1990 is shown in Chapter 7. Emission inventories for 1991 and 1992 were not prepared. 2 Year 1999 emissions were last re-calculated using EDMS v4.21 in the 2004 ESPR Air Quality Analysis. 3 Beginning in 1996 and later, emissions include vehicles and equipment converted to alternative fuels. APU emissions are
also included. 4 1999 emission inventory include reductions attributable to CNG shuttle buses. 5 Fuel storage and handling facilities are not sources of CO emissions. 6 Includes the Central Heating and Cooling Plant, emergency electricity generation, and other stationary sources. Fire
Training emissions were included in 1999. Diesel snow melter usage was added in 1999.

Boston-Logan International Airport 2016 EDR
Appendix I, Air Quality/Emissions Reduction I-63
Table I-16 Estimated CO Emissions (in kg/day) at Logan Airport 2002-2009
Aircraft/GSE Model:
EDMS v4.11
EDMS v4.21
EDMS v4.5
EDMS v5.0.1
EDMS v5.0.2
EDMS v5.1
EDMS v5.1.2
Motor Vehicle Model:
MOBILE 6.0
MOB 6.2.01
MOBILE 6.2.03
Year: 2002 2003 2004 2005 2006 2007 2008 2009
Aircraft Sources Air carriers 2,156 2,128 2,985 2,895 2,828 3,167 2,973 2,973 2,710 2,710 2,460 2,448 Commuter aircraft 783 846 1,010 1,010 950 1,587 2,484 2,484 2,436 2,436 2,364 2,795 Cargo aircraft 285 209 229 174 138 158 241 241 255 255 256 266 General aviation 256 276 416 437 398 442 401 403 345 345 145 150 Total aircraft sources
3,480 3,459 4,640 4,516 4,314 5,354 6,099 6,101 5,746 5,746 5,225 5,659
Ground Service Equipment1
5,170 4,758 3,586 3,531 3,409 1,586 1,904 1,904 1,609 1,609 1,364 1,364
Motor Vehicles Ted Williams Tunnel through-traffic
112 02 02 02 02 02 02 02 02 02 02 02
Parking/curbside3 295 253 180 179 144 144 139 139 117 117 107 107 On-airport vehicles
1,872 1,685 1,412 1,290 1,036 1,036 1,038 1,038 834 834 740 740
Total motor vehicle sources
2,279 1,938 1,592 1,469 1,180 1,180 1,177 1,177 951 951 847 847
Other Sources Fuel storage/handling4
0 0 0 0 0 0 0 0 0 0 0 0
Miscellaneous sources5
23 22 33 40 24 24 51 51 55 55 55 55
Total other sources
23 22 33 40 24 24 51 51 55 55 55 55
Total Airport Sources
10,952 10,177 9,851 9,556 8,927 8,144 9,231 9,233 8,361 8,361 7,491 7,925
Source: KBE and Massport Notes: Years 2006 to 2009 were computed with previous years EDMS version to provide for a common basis of comparison. Kg/day Kilograms per day. One kg/day is approximately equivalent to 0.40234 tons per year (tpy). 1 GSE emissions include APUs as well as vehicles and equipment converted to alternative fuels. 2 Due to the new roadway configuration and opening of the Ted Williams Tunnel there was no Ted Williams Tunnel through-
traffic at Logan Airport beginning in 2003. 3 Parking/curbside information is based on VMT analysis. 4 Fuel storage/handling facilities are not a source of CO emissions. 5 Includes the Central Heating and Cooling Plant, emergency electricity generation, snow melter usage, and other stationary
sources.
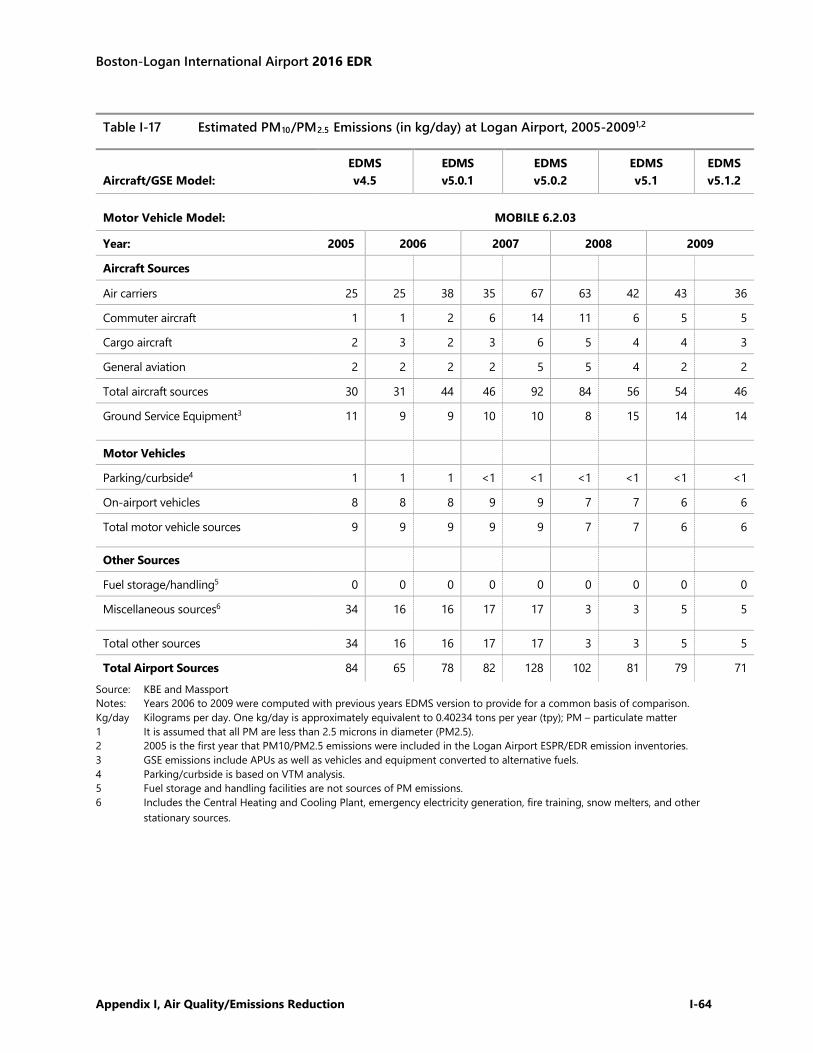
Boston-Logan International Airport 2016 EDR
Appendix I, Air Quality/Emissions Reduction I-64
Table I-17 Estimated PM10/PM2.5 Emissions (in kg/day) at Logan Airport, 2005-20091,2
Aircraft/GSE Model: EDMS v4.5
EDMS v5.0.1
EDMS v5.0.2
EDMS v5.1
EDMS v5.1.2
Motor Vehicle Model: MOBILE 6.2.03
Year: 2005 2006 2007 2008 2009
Aircraft Sources Air carriers 25 25 38 35 67 63 42 43 36 Commuter aircraft 1 1 2 6 14 11 6 5 5 Cargo aircraft 2 3 2 3 6 5 4 4 3 General aviation 2 2 2 2 5 5 4 2 2 Total aircraft sources 30 31 44 46 92 84 56 54 46 Ground Service Equipment3 11 9 9 10 10 8 15 14 14
Motor Vehicles Parking/curbside4 1 1 1 <1 <1 <1 <1 <1 <1 On-airport vehicles 8 8 8 9 9 7 7 6 6 Total motor vehicle sources 9 9 9 9 9 7 7 6 6
Other Sources Fuel storage/handling5 0 0 0 0 0 0 0 0 0 Miscellaneous sources6 34 16 16 17 17 3 3 5 5
Total other sources 34 16 16 17 17 3 3 5 5 Total Airport Sources 84 65 78 82 128 102 81 79 71
Source: KBE and Massport Notes: Years 2006 to 2009 were computed with previous years EDMS version to provide for a common basis of comparison. Kg/day Kilograms per day. One kg/day is approximately equivalent to 0.40234 tons per year (tpy); PM – particulate matter 1 It is assumed that all PM are less than 2.5 microns in diameter (PM2.5). 2 2005 is the first year that PM10/PM2.5 emissions were included in the Logan Airport ESPR/EDR emission inventories. 3 GSE emissions include APUs as well as vehicles and equipment converted to alternative fuels. 4 Parking/curbside is based on VTM analysis. 5 Fuel storage and handling facilities are not sources of PM emissions. 6 Includes the Central Heating and Cooling Plant, emergency electricity generation, fire training, snow melters, and other
stationary sources.
Boston-Logan International Airport 2016 EDR
Appendix I, Air Quality/Emissions Reduction I-65
Greenhouse Gas Emissions Inventory for 2016
The Massachusetts Executive Office of Energy and Environmental Affairs (EEA) has published the MEPA Greenhouse Gas Emissions Policy and Protocol.2 These guidelines require that certain projects undergoing review under the Massachusetts Environmental Policy Act (MEPA) quantify the greenhouse gas (GHG) emissions generated by proposed projects, and identify measures to avoid, minimize, or mitigate such emissions.3 Even though the 2016 EDR does not assess any proposed projects and is therefore not subject to the GHG policy, Massport has voluntarily prepared an emission inventory of GHG emissions directly and indirectly associated with Logan Airport.
In April 2009, the Transportation Research Board Airport Cooperative Research Program (ACRP); published the Guidebook on Preparing Airport Greenhouse Gas Emission Inventories (ACRP Report 11), which provides recommended instructions to airport operators on how to prepare an airport-specific GHG emissions inventory.4 The 2016 GHG emissions estimates include aircraft (within the ground taxi/delay and up to 3,000 feet), GSE, APU, motor vehicles, a variety of stationary sources, and electricity usage. Aircraft cruise emissions over the 3,000-foot level were not included. This work was accomplished following the EEA guidelines and uses widely-accepted emission factors that are considered appropriate for this application, including International Organization for Standardization New England electricity-based values.
Methodology
Airport GHG emissions are calculated in much the same way as criteria pollutants,5 through the use of input data such as activity levels or material throughput rates (i.e., fuel usage, VMT, electrical consumption) that are applied to appropriate emission factors (i.e., in units of GHG emissions per gallon of fuel).
In this case, the input data were either based on Massport records, or data and information derived from the latest version of the FAA AEDT (AEDT 2c SP2). Table I-18 summarizes the data and information used in the 2016 GHG inventory.
Massport will update the GHG Emissions Inventory for Logan Airport annually.
–––––––––––––––– 2 Revised MEPA Greenhouse Gas Emissions Policy and Protocol, Massachusetts Executive Office of Energy and
Environmental Affairs, effective May 10, 2010. 3 These GHGs are comprised primarily of carbon dioxide (CO2), methane (CH4), nitrous oxides (N2O), and three groups of
fluorinated gases (i.e., sulfur hexafluoride [SF6], hydrofluorocarbons [HFCs], and perfluorocarbons [PFCs]). GHG emission sources associated with airports are generally limited to CO2, CH4, and N2O.
4 Transportation Research Board, Airport Cooperative Research Panel, ACRP Report 11, Project 02-06, Guidebook on Preparing Airport Greenhouse Gas Emissions Inventories (in production). See http://onlinepubs.trb.org/onlinepubs/acrp/acrp_rpt_011.pdf for the full report.
5 Criteria pollutants are pollutants for which there are National Ambient Air Quality Standards (i.e., carbon monoxide, sulfur dioxide, nitrogen dioxide, etc.).
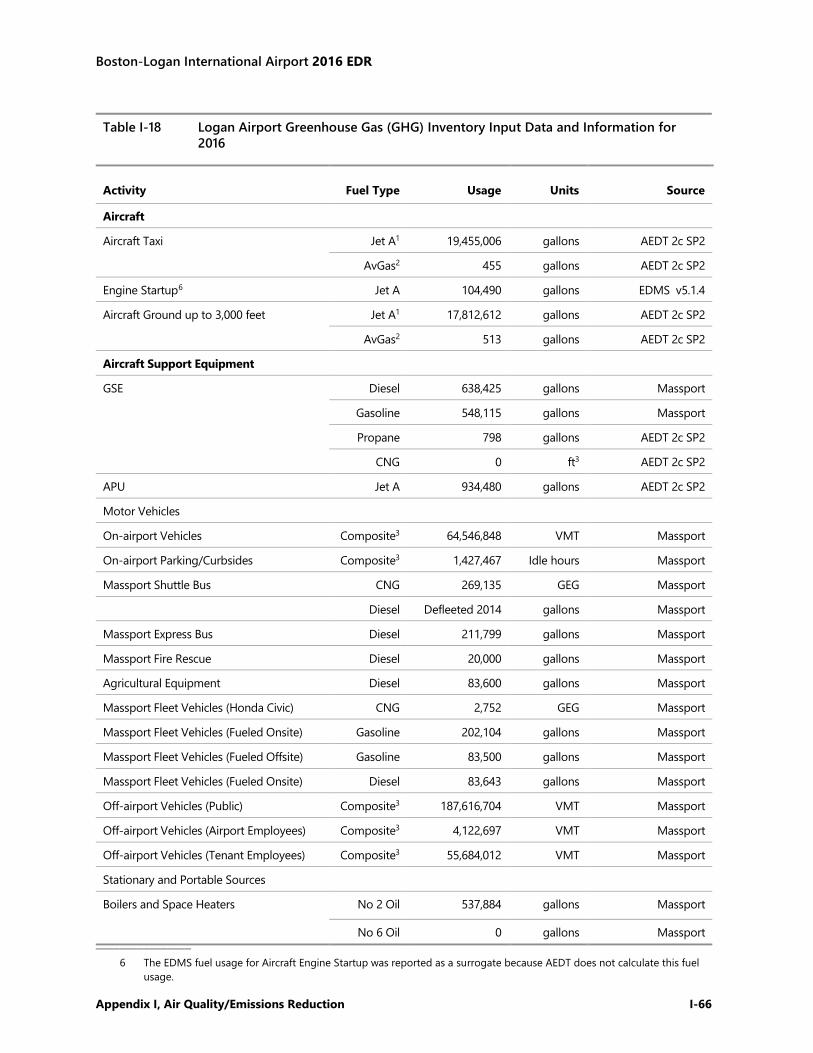
Boston-Logan International Airport 2016 EDR
Appendix I, Air Quality/Emissions Reduction I-66
Table I-18 Logan Airport Greenhouse Gas (GHG) Inventory Input Data and Information for 2016
Activity Fuel Type Usage Units Source
Aircraft Aircraft Taxi Jet A1 19,455,006 gallons AEDT 2c SP2
AvGas2 455 gallons AEDT 2c SP2 Engine Startup6 Jet A 104,490 gallons EDMS v5.1.4 Aircraft Ground up to 3,000 feet Jet A1 17,812,612 gallons AEDT 2c SP2
AvGas2 513 gallons AEDT 2c SP2 Aircraft Support Equipment GSE Diesel 638,425 gallons Massport
Gasoline 548,115 gallons Massport Propane 798 gallons AEDT 2c SP2
CNG 0 ft3 AEDT 2c SP2 APU Jet A 934,480 gallons AEDT 2c SP2 Motor Vehicles On-airport Vehicles Composite3 64,546,848 VMT Massport On-airport Parking/Curbsides Composite3 1,427,467 Idle hours Massport Massport Shuttle Bus CNG 269,135 GEG Massport Diesel Defleeted 2014 gallons Massport Massport Express Bus Diesel 211,799 gallons Massport Massport Fire Rescue Diesel 20,000 gallons Massport Agricultural Equipment Diesel 83,600 gallons Massport Massport Fleet Vehicles (Honda Civic) CNG 2,752 GEG Massport Massport Fleet Vehicles (Fueled Onsite) Gasoline 202,104 gallons Massport Massport Fleet Vehicles (Fueled Offsite) Gasoline 83,500 gallons Massport Massport Fleet Vehicles (Fueled Onsite) Diesel 83,643 gallons Massport Off-airport Vehicles (Public) Composite3 187,616,704 VMT Massport Off-airport Vehicles (Airport Employees) Composite3 4,122,697 VMT Massport Off-airport Vehicles (Tenant Employees) Composite3 55,684,012 VMT Massport Stationary and Portable Sources Boilers and Space Heaters No 2 Oil 537,884 gallons Massport
No 6 Oil 0 gallons Massport ––––––––––––––––
6 The EDMS fuel usage for Aircraft Engine Startup was reported as a surrogate because AEDT does not calculate this fuel usage.
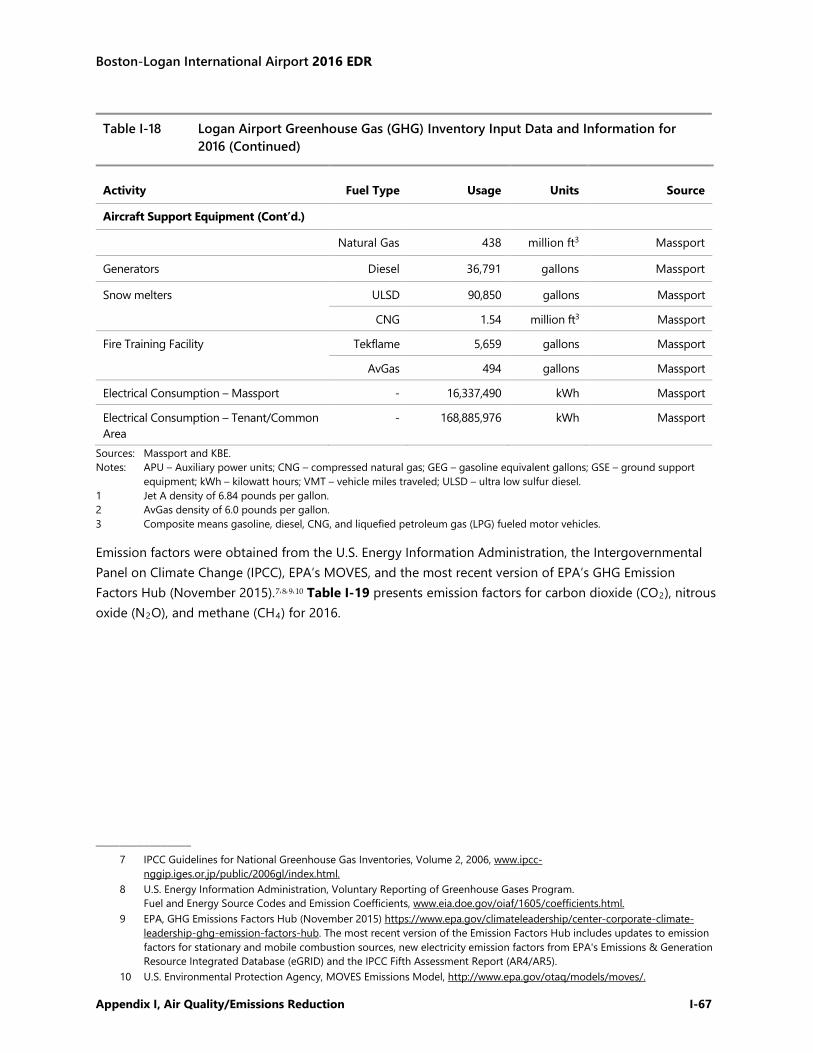
Boston-Logan International Airport 2016 EDR
Appendix I, Air Quality/Emissions Reduction I-67
Table I-18 Logan Airport Greenhouse Gas (GHG) Inventory Input Data and Information for 2016 (Continued)
Activity Fuel Type Usage Units Source
Aircraft Support Equipment (Cont’d.)
Natural Gas 438 million ft3 Massport Generators Diesel 36,791 gallons Massport Snow melters ULSD 90,850 gallons Massport
CNG 1.54 million ft3 Massport Fire Training Facility Tekflame 5,659 gallons Massport
AvGas 494 gallons Massport Electrical Consumption – Massport - 16,337,490 kWh Massport Electrical Consumption – Tenant/Common Area
- 168,885,976 kWh Massport
Sources: Massport and KBE. Notes: APU – Auxiliary power units; CNG – compressed natural gas; GEG – gasoline equivalent gallons; GSE – ground support
equipment; kWh – kilowatt hours; VMT – vehicle miles traveled; ULSD – ultra low sulfur diesel. 1 Jet A density of 6.84 pounds per gallon. 2 AvGas density of 6.0 pounds per gallon. 3 Composite means gasoline, diesel, CNG, and liquefied petroleum gas (LPG) fueled motor vehicles.
Emission factors were obtained from the U.S. Energy Information Administration, the Intergovernmental Panel on Climate Change (IPCC), EPA’s MOVES, and the most recent version of EPA’s GHG Emission Factors Hub (November 2015).7,8,9,10 Table I-19 presents emission factors for carbon dioxide (CO2), nitrous oxide (N2O), and methane (CH4) for 2016.
–––––––––––––––– 7 IPCC Guidelines for National Greenhouse Gas Inventories, Volume 2, 2006, www.ipcc-
nggip.iges.or.jp/public/2006gl/index.html. 8 U.S. Energy Information Administration, Voluntary Reporting of Greenhouse Gases Program.
Fuel and Energy Source Codes and Emission Coefficients, www.eia.doe.gov/oiaf/1605/coefficients.html. 9 EPA, GHG Emissions Factors Hub (November 2015) https://www.epa.gov/climateleadership/center-corporate-climate-
leadership-ghg-emission-factors-hub. The most recent version of the Emission Factors Hub includes updates to emission factors for stationary and mobile combustion sources, new electricity emission factors from EPA's Emissions & Generation Resource Integrated Database (eGRID) and the IPCC Fifth Assessment Report (AR4/AR5).
10 U.S. Environmental Protection Agency, MOVES Emissions Model, http://www.epa.gov/otaq/models/moves/.
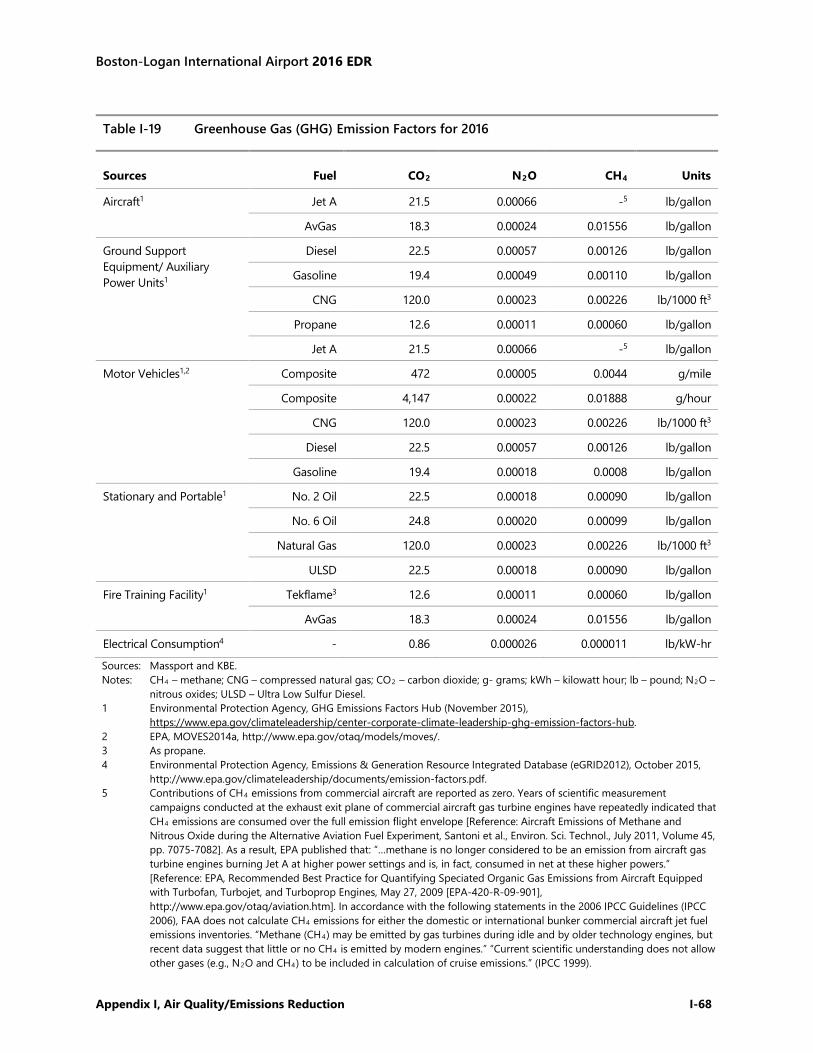
Boston-Logan International Airport 2016 EDR
Appendix I, Air Quality/Emissions Reduction I-68
Sources: Massport and KBE. Notes: CH4 – methane; CNG – compressed natural gas; CO2 – carbon dioxide; g- grams; kWh – kilowatt hour; lb – pound; N2O –
nitrous oxides; ULSD – Ultra Low Sulfur Diesel. 1 Environmental Protection Agency, GHG Emissions Factors Hub (November 2015),
https://www.epa.gov/climateleadership/center-corporate-climate-leadership-ghg-emission-factors-hub. 2 EPA, MOVES2014a, http://www.epa.gov/otaq/models/moves/. 3 As propane. 4 Environmental Protection Agency, Emissions & Generation Resource Integrated Database (eGRID2012), October 2015,
http://www.epa.gov/climateleadership/documents/emission-factors.pdf. 5 Contributions of CH4 emissions from commercial aircraft are reported as zero. Years of scientific measurement
campaigns conducted at the exhaust exit plane of commercial aircraft gas turbine engines have repeatedly indicated that CH4 emissions are consumed over the full emission flight envelope [Reference: Aircraft Emissions of Methane and Nitrous Oxide during the Alternative Aviation Fuel Experiment, Santoni et al., Environ. Sci. Technol., July 2011, Volume 45, pp. 7075-7082]. As a result, EPA published that: “…methane is no longer considered to be an emission from aircraft gas turbine engines burning Jet A at higher power settings and is, in fact, consumed in net at these higher powers.” [Reference: EPA, Recommended Best Practice for Quantifying Speciated Organic Gas Emissions from Aircraft Equipped with Turbofan, Turbojet, and Turboprop Engines, May 27, 2009 [EPA-420-R-09-901], http://www.epa.gov/otaq/aviation.htm]. In accordance with the following statements in the 2006 IPCC Guidelines (IPCC 2006), FAA does not calculate CH4 emissions for either the domestic or international bunker commercial aircraft jet fuel emissions inventories. “Methane (CH4) may be emitted by gas turbines during idle and by older technology engines, but recent data suggest that little or no CH4 is emitted by modern engines.” “Current scientific understanding does not allow other gases (e.g., N2O and CH4) to be included in calculation of cruise emissions.” (IPCC 1999).
Table I-19 Greenhouse Gas (GHG) Emission Factors for 2016
Sources Fuel CO2 N2O CH4 Units
Aircraft1 Jet A 21.5 0.00066 -5 lb/gallon AvGas 18.3 0.00024 0.01556 lb/gallon
Ground Support Equipment/ Auxiliary Power Units1
Diesel 22.5 0.00057 0.00126 lb/gallon Gasoline 19.4 0.00049 0.00110 lb/gallon
CNG 120.0 0.00023 0.00226 lb/1000 ft3 Propane 12.6 0.00011 0.00060 lb/gallon
Jet A 21.5 0.00066 -5 lb/gallon Motor Vehicles1,2 Composite 472 0.00005 0.0044 g/mile
Composite 4,147 0.00022 0.01888 g/hour CNG 120.0 0.00023 0.00226 lb/1000 ft3
Diesel 22.5 0.00057 0.00126 lb/gallon Gasoline 19.4 0.00018 0.0008 lb/gallon
Stationary and Portable1 No. 2 Oil 22.5 0.00018 0.00090 lb/gallon No. 6 Oil 24.8 0.00020 0.00099 lb/gallon
Natural Gas 120.0 0.00023 0.00226 lb/1000 ft3 ULSD 22.5 0.00018 0.00090 lb/gallon
Fire Training Facility1 Tekflame3 12.6 0.00011 0.00060 lb/gallon AvGas 18.3 0.00024 0.01556 lb/gallon
Electrical Consumption4 - 0.86 0.000026 0.000011 lb/kW-hr
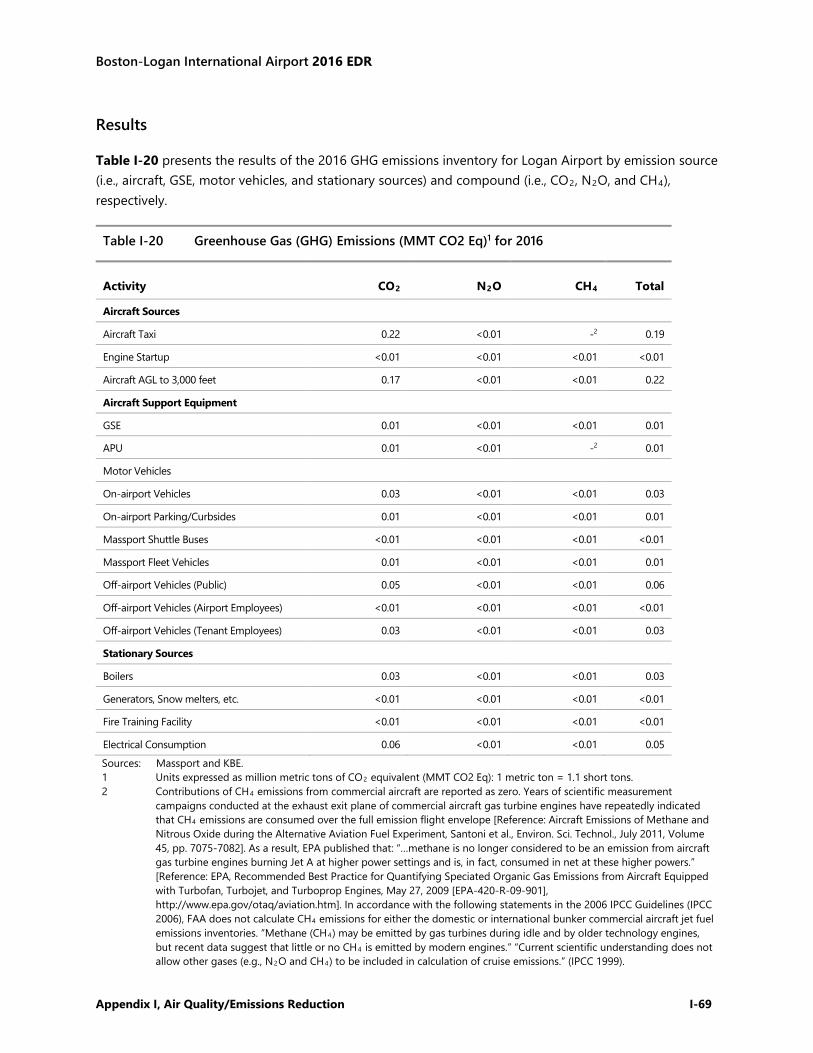
Boston-Logan International Airport 2016 EDR
Appendix I, Air Quality/Emissions Reduction I-69
Results
Table I-20 presents the results of the 2016 GHG emissions inventory for Logan Airport by emission source (i.e., aircraft, GSE, motor vehicles, and stationary sources) and compound (i.e., CO2, N2O, and CH4), respectively.
Table I-20 Greenhouse Gas (GHG) Emissions (MMT CO2 Eq)1 for 2016
Activity CO2 N2O CH4 Total
Aircraft Sources Aircraft Taxi 0.22 <0.01 -2 0.19 Engine Startup <0.01 <0.01 <0.01 <0.01 Aircraft AGL to 3,000 feet 0.17 <0.01 <0.01 0.22 Aircraft Support Equipment GSE 0.01 <0.01 <0.01 0.01 APU 0.01 <0.01 -2 0.01 Motor Vehicles On-airport Vehicles 0.03 <0.01 <0.01 0.03 On-airport Parking/Curbsides 0.01 <0.01 <0.01 0.01 Massport Shuttle Buses <0.01 <0.01 <0.01 <0.01 Massport Fleet Vehicles 0.01 <0.01 <0.01 0.01 Off-airport Vehicles (Public) 0.05 <0.01 <0.01 0.06 Off-airport Vehicles (Airport Employees) <0.01 <0.01 <0.01 <0.01 Off-airport Vehicles (Tenant Employees) 0.03 <0.01 <0.01 0.03 Stationary Sources Boilers 0.03 <0.01 <0.01 0.03 Generators, Snow melters, etc. <0.01 <0.01 <0.01 <0.01 Fire Training Facility <0.01 <0.01 <0.01 <0.01 Electrical Consumption 0.06 <0.01 <0.01 0.05 Sources: Massport and KBE. 1 Units expressed as million metric tons of CO2 equivalent (MMT CO2 Eq): 1 metric ton = 1.1 short tons. 2 Contributions of CH4 emissions from commercial aircraft are reported as zero. Years of scientific measurement
campaigns conducted at the exhaust exit plane of commercial aircraft gas turbine engines have repeatedly indicated that CH4 emissions are consumed over the full emission flight envelope [Reference: Aircraft Emissions of Methane and Nitrous Oxide during the Alternative Aviation Fuel Experiment, Santoni et al., Environ. Sci. Technol., July 2011, Volume 45, pp. 7075-7082]. As a result, EPA published that: “…methane is no longer considered to be an emission from aircraft gas turbine engines burning Jet A at higher power settings and is, in fact, consumed in net at these higher powers.” [Reference: EPA, Recommended Best Practice for Quantifying Speciated Organic Gas Emissions from Aircraft Equipped with Turbofan, Turbojet, and Turboprop Engines, May 27, 2009 [EPA-420-R-09-901], http://www.epa.gov/otaq/aviation.htm]. In accordance with the following statements in the 2006 IPCC Guidelines (IPCC 2006), FAA does not calculate CH4 emissions for either the domestic or international bunker commercial aircraft jet fuel emissions inventories. “Methane (CH4) may be emitted by gas turbines during idle and by older technology engines, but recent data suggest that little or no CH4 is emitted by modern engines.” “Current scientific understanding does not allow other gases (e.g., N2O and CH4) to be included in calculation of cruise emissions.” (IPCC 1999).
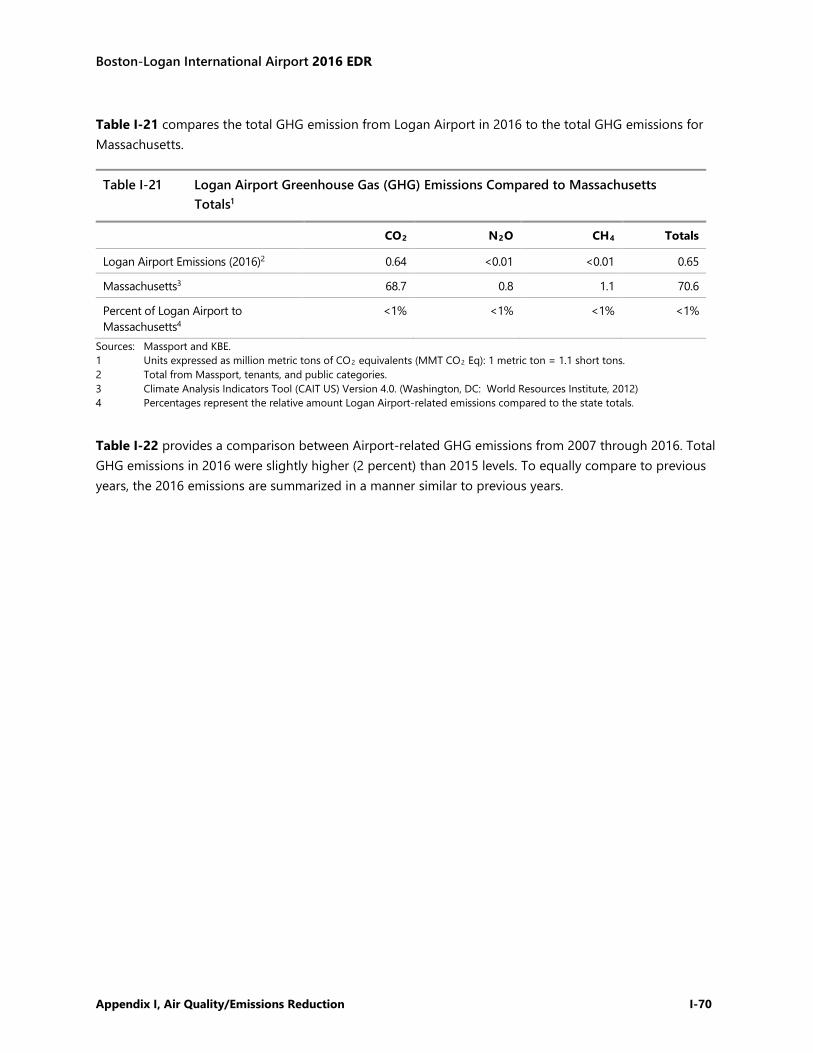
Boston-Logan International Airport 2016 EDR
Appendix I, Air Quality/Emissions Reduction I-70
Table I-21 compares the total GHG emission from Logan Airport in 2016 to the total GHG emissions for Massachusetts.
Table I-21 Logan Airport Greenhouse Gas (GHG) Emissions Compared to Massachusetts Totals1
CO2 N2O CH4 Totals
Logan Airport Emissions (2016)2 0.64 <0.01 <0.01 0.65 Massachusetts3 68.7 0.8 1.1 70.6 Percent of Logan Airport to Massachusetts4
<1% <1% <1% <1%
Sources: Massport and KBE. 1 Units expressed as million metric tons of CO2 equivalents (MMT CO2 Eq): 1 metric ton = 1.1 short tons. 2 Total from Massport, tenants, and public categories. 3 Climate Analysis Indicators Tool (CAIT US) Version 4.0. (Washington, DC: World Resources Institute, 2012) 4 Percentages represent the relative amount Logan Airport-related emissions compared to the state totals.
Table I-22 provides a comparison between Airport-related GHG emissions from 2007 through 2016. Total GHG emissions in 2016 were slightly higher (2 percent) than 2015 levels. To equally compare to previous years, the 2016 emissions are summarized in a manner similar to previous years.
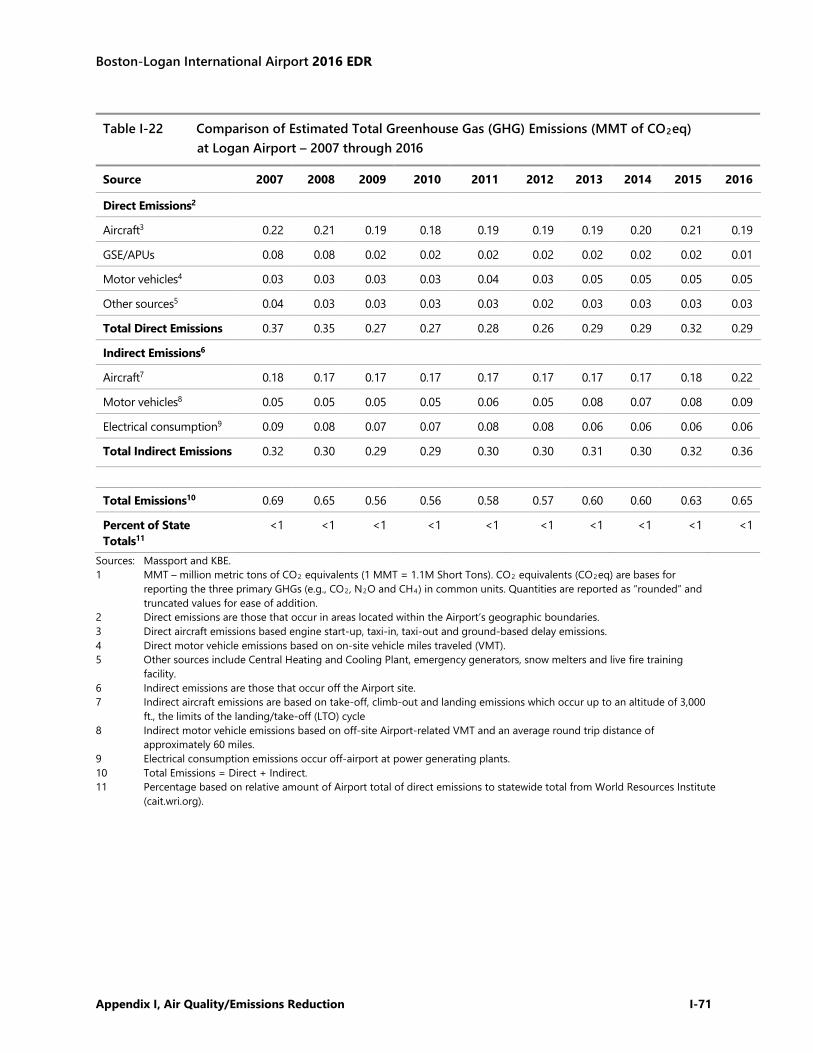
Boston-Logan International Airport 2016 EDR
Appendix I, Air Quality/Emissions Reduction I-71
Table I-22 Comparison of Estimated Total Greenhouse Gas (GHG) Emissions (MMT of CO2eq) at Logan Airport – 2007 through 2016
Source 2007 2008 2009 2010 2011 2012 2013 2014 2015 2016
Direct Emissions2
Aircraft3 0.22 0.21 0.19 0.18 0.19 0.19 0.19 0.20 0.21 0.19 GSE/APUs 0.08 0.08 0.02 0.02 0.02 0.02 0.02 0.02 0.02 0.01 Motor vehicles4 0.03 0.03 0.03 0.03 0.04 0.03 0.05 0.05 0.05 0.05 Other sources5 0.04 0.03 0.03 0.03 0.03 0.02 0.03 0.03 0.03 0.03 Total Direct Emissions 0.37 0.35 0.27 0.27 0.28 0.26 0.29 0.29 0.32 0.29 Indirect Emissions6 Aircraft7 0.18 0.17 0.17 0.17 0.17 0.17 0.17 0.17 0.18 0.22 Motor vehicles8 0.05 0.05 0.05 0.05 0.06 0.05 0.08 0.07 0.08 0.09 Electrical consumption9 0.09 0.08 0.07 0.07 0.08 0.08 0.06 0.06 0.06 0.06 Total Indirect Emissions 0.32 0.30 0.29 0.29 0.30 0.30 0.31 0.30 0.32 0.36 Total Emissions10 0.69 0.65 0.56 0.56 0.58 0.57 0.60 0.60 0.63 0.65 Percent of State Totals11
<1 <1 <1 <1 <1 <1 <1 <1 <1 <1
Sources: Massport and KBE. 1 MMT – million metric tons of CO2 equivalents (1 MMT = 1.1M Short Tons). CO2 equivalents (CO2eq) are bases for
reporting the three primary GHGs (e.g., CO2, N2O and CH4) in common units. Quantities are reported as “rounded” and truncated values for ease of addition.
2 Direct emissions are those that occur in areas located within the Airport’s geographic boundaries. 3 Direct aircraft emissions based engine start-up, taxi-in, taxi-out and ground-based delay emissions. 4 Direct motor vehicle emissions based on on-site vehicle miles traveled (VMT). 5 Other sources include Central Heating and Cooling Plant, emergency generators, snow melters and live fire training
facility. 6 Indirect emissions are those that occur off the Airport site. 7 Indirect aircraft emissions are based on take-off, climb-out and landing emissions which occur up to an altitude of 3,000
ft., the limits of the landing/take-off (LTO) cycle 8 Indirect motor vehicle emissions based on off-site Airport-related VMT and an average round trip distance of
approximately 60 miles. 9 Electrical consumption emissions occur off-airport at power generating plants. 10 Total Emissions = Direct + Indirect. 11 Percentage based on relative amount of Airport total of direct emissions to statewide total from World Resources Institute
(cait.wri.org).
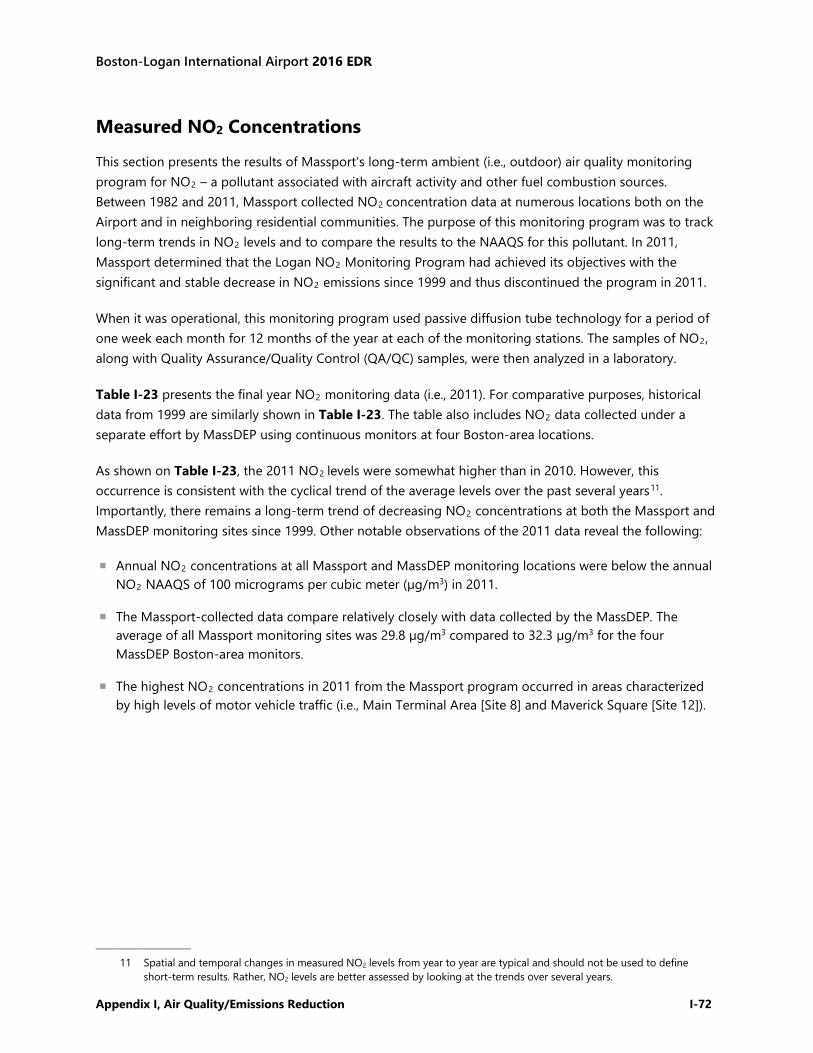
Boston-Logan International Airport 2016 EDR
Appendix I, Air Quality/Emissions Reduction I-72
Measured NO2 Concentrations
This section presents the results of Massport’s long-term ambient (i.e., outdoor) air quality monitoring program for NO2 – a pollutant associated with aircraft activity and other fuel combustion sources. Between 1982 and 2011, Massport collected NO2 concentration data at numerous locations both on the Airport and in neighboring residential communities. The purpose of this monitoring program was to track long-term trends in NO2 levels and to compare the results to the NAAQS for this pollutant. In 2011, Massport determined that the Logan NO2 Monitoring Program had achieved its objectives with the significant and stable decrease in NO2 emissions since 1999 and thus discontinued the program in 2011.
When it was operational, this monitoring program used passive diffusion tube technology for a period of one week each month for 12 months of the year at each of the monitoring stations. The samples of NO2, along with Quality Assurance/Quality Control (QA/QC) samples, were then analyzed in a laboratory.
Table I-23 presents the final year NO2 monitoring data (i.e., 2011). For comparative purposes, historical data from 1999 are similarly shown in Table I-23. The table also includes NO2 data collected under a separate effort by MassDEP using continuous monitors at four Boston-area locations.
As shown on Table I-23, the 2011 NO2 levels were somewhat higher than in 2010. However, this occurrence is consistent with the cyclical trend of the average levels over the past several years11. Importantly, there remains a long-term trend of decreasing NO2 concentrations at both the Massport and MassDEP monitoring sites since 1999. Other notable observations of the 2011 data reveal the following:
Annual NO2 concentrations at all Massport and MassDEP monitoring locations were below the annual NO2 NAAQS of 100 micrograms per cubic meter (µg/m3) in 2011.
The Massport-collected data compare relatively closely with data collected by the MassDEP. The average of all Massport monitoring sites was 29.8 µg/m3 compared to 32.3 µg/m3 for the four MassDEP Boston-area monitors.
The highest NO2 concentrations in 2011 from the Massport program occurred in areas characterized by high levels of motor vehicle traffic (i.e., Main Terminal Area [Site 8] and Maverick Square [Site 12]).
––––––––––––––––
11 Spatial and temporal changes in measured NO2 levels from year to year are typical and should not be used to define short-term results. Rather, NO2 levels are better assessed by looking at the trends over several years.
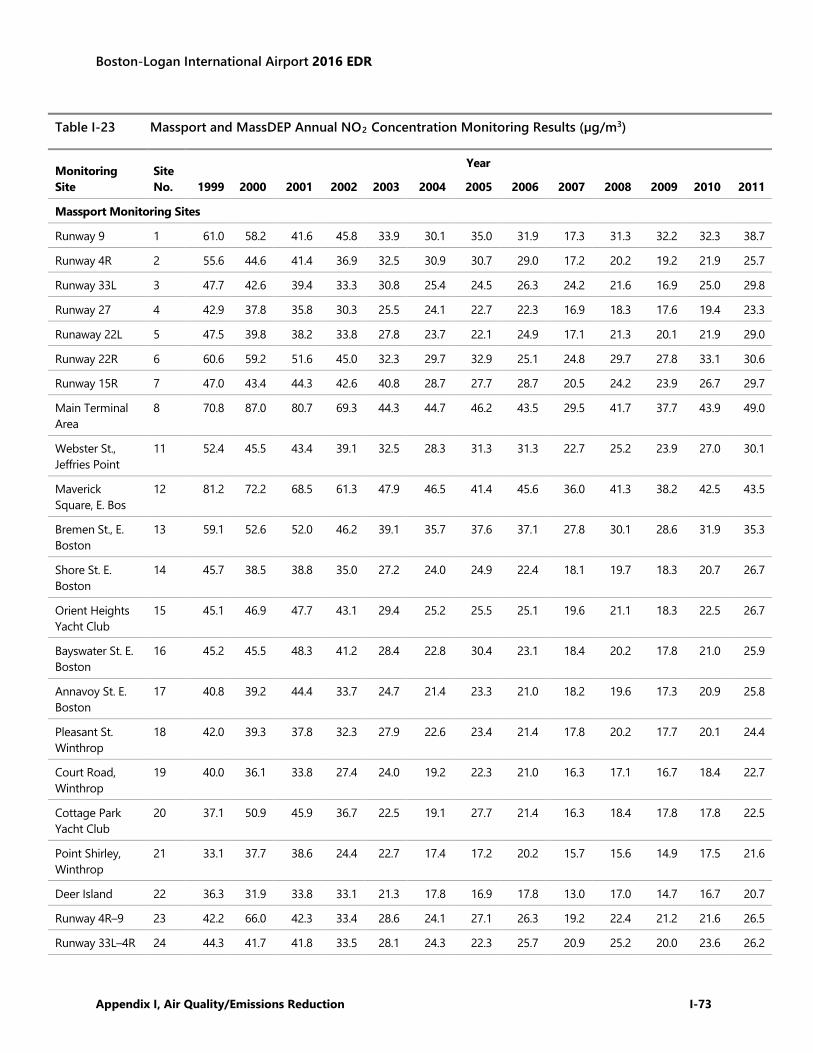
Boston-Logan International Airport 2016 EDR
Appendix I, Air Quality/Emissions Reduction I-73
Table I-23 Massport and MassDEP Annual NO2 Concentration Monitoring Results (µg/m3)
Monitoring Site
Site No.
Year 1999 2000 2001 2002 2003 2004 2005 2006 2007 2008 2009 2010 2011
Massport Monitoring Sites Runway 9 1 61.0 58.2 41.6 45.8 33.9 30.1 35.0 31.9 17.3 31.3 32.2 32.3 38.7 Runway 4R 2 55.6 44.6 41.4 36.9 32.5 30.9 30.7 29.0 17.2 20.2 19.2 21.9 25.7 Runway 33L 3 47.7 42.6 39.4 33.3 30.8 25.4 24.5 26.3 24.2 21.6 16.9 25.0 29.8 Runway 27 4 42.9 37.8 35.8 30.3 25.5 24.1 22.7 22.3 16.9 18.3 17.6 19.4 23.3 Runaway 22L 5 47.5 39.8 38.2 33.8 27.8 23.7 22.1 24.9 17.1 21.3 20.1 21.9 29.0 Runway 22R 6 60.6 59.2 51.6 45.0 32.3 29.7 32.9 25.1 24.8 29.7 27.8 33.1 30.6 Runway 15R 7 47.0 43.4 44.3 42.6 40.8 28.7 27.7 28.7 20.5 24.2 23.9 26.7 29.7 Main Terminal Area
8 70.8 87.0 80.7 69.3 44.3 44.7 46.2 43.5 29.5 41.7 37.7 43.9 49.0
Webster St., Jeffries Point
11 52.4 45.5 43.4 39.1 32.5 28.3 31.3 31.3 22.7 25.2 23.9 27.0 30.1
Maverick Square, E. Bos
12 81.2 72.2 68.5 61.3 47.9 46.5 41.4 45.6 36.0 41.3 38.2 42.5 43.5
Bremen St., E. Boston
13 59.1 52.6 52.0 46.2 39.1 35.7 37.6 37.1 27.8 30.1 28.6 31.9 35.3
Shore St. E. Boston
14 45.7 38.5 38.8 35.0 27.2 24.0 24.9 22.4 18.1 19.7 18.3 20.7 26.7
Orient Heights Yacht Club
15 45.1 46.9 47.7 43.1 29.4 25.2 25.5 25.1 19.6 21.1 18.3 22.5 26.7
Bayswater St. E. Boston
16 45.2 45.5 48.3 41.2 28.4 22.8 30.4 23.1 18.4 20.2 17.8 21.0 25.9
Annavoy St. E. Boston
17 40.8 39.2 44.4 33.7 24.7 21.4 23.3 21.0 18.2 19.6 17.3 20.9 25.8
Pleasant St. Winthrop
18 42.0 39.3 37.8 32.3 27.9 22.6 23.4 21.4 17.8 20.2 17.7 20.1 24.4
Court Road, Winthrop
19 40.0 36.1 33.8 27.4 24.0 19.2 22.3 21.0 16.3 17.1 16.7 18.4 22.7
Cottage Park Yacht Club
20 37.1 50.9 45.9 36.7 22.5 19.1 27.7 21.4 16.3 18.4 17.8 17.8 22.5
Point Shirley, Winthrop
21 33.1 37.7 38.6 24.4 22.7 17.4 17.2 20.2 15.7 15.6 14.9 17.5 21.6
Deer Island 22 36.3 31.9 33.8 33.1 21.3 17.8 16.9 17.8 13.0 17.0 14.7 16.7 20.7 Runway 4R–9 23 42.2 66.0 42.3 33.4 28.6 24.1 27.1 26.3 19.2 22.4 21.2 21.6 26.5 Runway 33L–4R 24 44.3 41.7 41.8 33.5 28.1 24.3 22.3 25.7 20.9 25.2 20.0 23.6 26.2
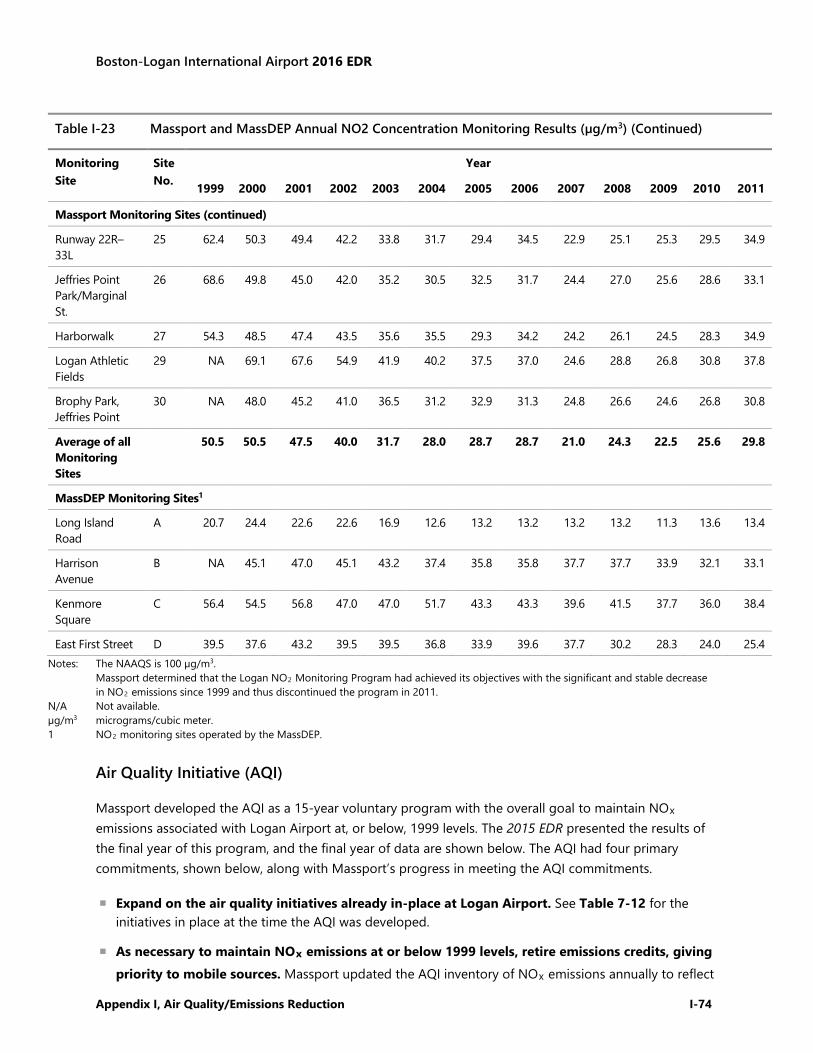
Boston-Logan International Airport 2016 EDR
Appendix I, Air Quality/Emissions Reduction I-74
Table I-23 Massport and MassDEP Annual NO2 Concentration Monitoring Results (µg/m3) (Continued)
Monitoring Site
Site No.
Year
1999 2000 2001 2002 2003 2004 2005 2006 2007 2008 2009 2010 2011
Massport Monitoring Sites (continued)
Runway 22R–33L
25 62.4 50.3 49.4 42.2 33.8 31.7 29.4 34.5 22.9 25.1 25.3 29.5 34.9
Jeffries Point Park/Marginal St.
26 68.6 49.8 45.0 42.0 35.2 30.5 32.5 31.7 24.4 27.0 25.6 28.6 33.1
Harborwalk 27 54.3 48.5 47.4 43.5 35.6 35.5 29.3 34.2 24.2 26.1 24.5 28.3 34.9 Logan Athletic Fields
29 NA 69.1 67.6 54.9 41.9 40.2 37.5 37.0 24.6 28.8 26.8 30.8 37.8
Brophy Park, Jeffries Point
30 NA 48.0 45.2 41.0 36.5 31.2 32.9 31.3 24.8 26.6 24.6 26.8 30.8
Average of all Monitoring Sites
50.5 50.5 47.5 40.0 31.7 28.0 28.7 28.7 21.0 24.3 22.5 25.6 29.8
MassDEP Monitoring Sites1 Long Island Road
A 20.7 24.4 22.6 22.6 16.9 12.6 13.2 13.2 13.2 13.2 11.3 13.6 13.4
Harrison Avenue
B NA 45.1 47.0 45.1 43.2 37.4 35.8 35.8 37.7 37.7 33.9 32.1 33.1
Kenmore Square
C 56.4 54.5 56.8 47.0 47.0 51.7 43.3 43.3 39.6 41.5 37.7 36.0 38.4
East First Street D 39.5 37.6 43.2 39.5 39.5 36.8 33.9 39.6 37.7 30.2 28.3 24.0 25.4 Notes: The NAAQS is 100 µg/m3.
Massport determined that the Logan NO2 Monitoring Program had achieved its objectives with the significant and stable decrease in NO2 emissions since 1999 and thus discontinued the program in 2011.
N/A Not available. µg/m3 micrograms/cubic meter. 1 NO2 monitoring sites operated by the MassDEP.
Air Quality Initiative (AQI)
Massport developed the AQI as a 15-year voluntary program with the overall goal to maintain NOx emissions associated with Logan Airport at, or below, 1999 levels. The 2015 EDR presented the results of the final year of this program, and the final year of data are shown below. The AQI had four primary commitments, shown below, along with Massport’s progress in meeting the AQI commitments.
Expand on the air quality initiatives already in-place at Logan Airport. See Table 7-12 for the initiatives in place at the time the AQI was developed.
As necessary to maintain NOx emissions at or below 1999 levels, retire emissions credits, giving priority to mobile sources. Massport updated the AQI inventory of NOx emissions annually to reflect

Boston-Logan International Airport 2016 EDR
Appendix I, Air Quality/Emissions Reduction I-75
new information and changing conditions associated with the Airport’s operations. Table I-24 presents the updated NOx emissions inventory and shows that, in 2015, again it was not necessary to purchase and retire mobile source emission credits to maintain NOx emissions at, or below, 1999 levels.
Report the status and progress of the AQI in the ESPR or EDR. Massport reported on the status of the AQI in the Logan Airport EDRs and ESPRs since 2001 (Table I-24).
Continue to work at international and national levels to decrease air emissions from aviation sources. Massport maintains memberships and active participation in a number of organizations involved in addressing aviation-related environmental issues, including air quality. These include serving on Environmental Committees of the American Association of Airport Executives (AAAE) and Airports Council International–North America (ACI-NA).
As shown in Table I-24, NOx emissions at Logan Airport in 2015 (net total with reductions) were approximately 632 tpy lower than the 1999 AQI benchmark. Since 1999, this trend represents a 27 percent decrease by 2015. Between 1999 and 2015, the greatest reductions of NOx emissions were associated with aircraft, GSE, and on-Airport motor vehicles at 17 percent, 71 percent, and 87 percent reductions, respectively.
For ease of review, Figure I-1 also compares the 1999 AQI threshold level of 2,347 tpy of NOx emissions to NOx emissions for 2001 through 2015. Cumulatively, and as of December 31, 2015, NOx emissions at Logan Airport were approximately 10,049 tons below the benchmark set by the AQI.
Based upon these results, the 1999 threshold of NOx emissions at Logan Airport was never surpassed and thus full compliance with the AQI was achieved. However, NOx will continue to be reported in future EDRs/ESPRs as part of the Logan Airport emissions inventory.
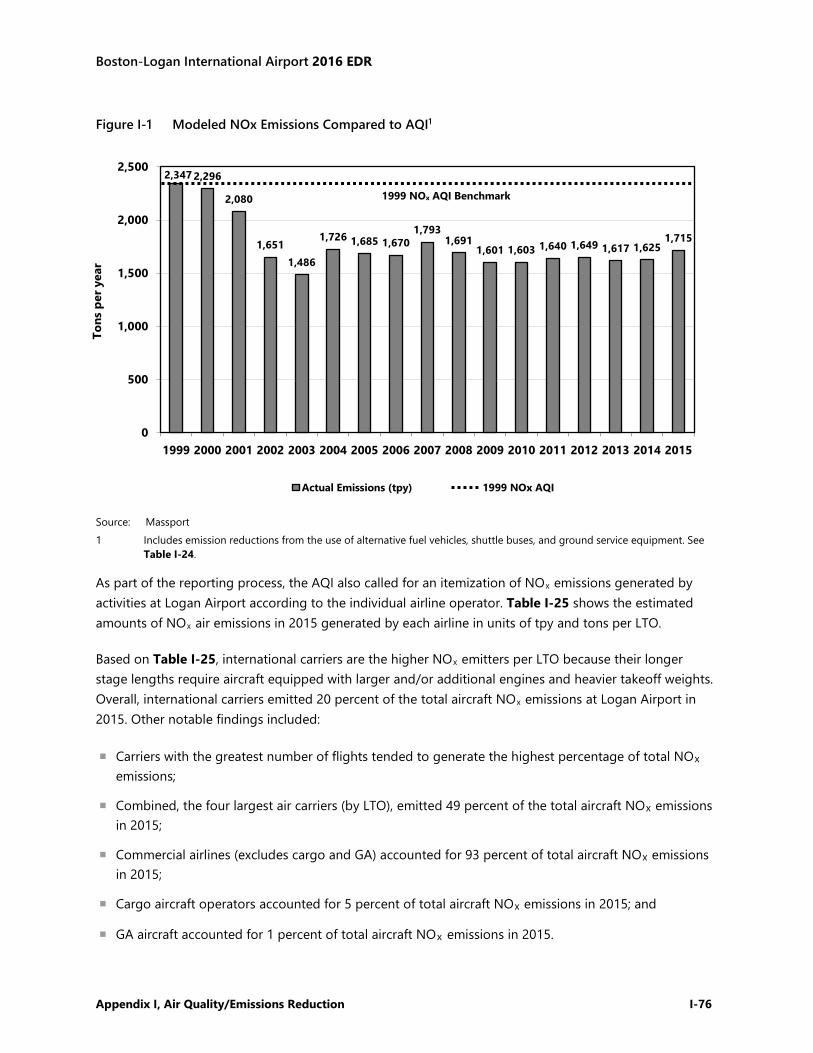
Boston-Logan International Airport 2016 EDR
Appendix I, Air Quality/Emissions Reduction I-76
Figure I-1 Modeled NOx Emissions Compared to AQI1
Source: Massport 1 Includes emission reductions from the use of alternative fuel vehicles, shuttle buses, and ground service equipment. See
Table I-24.
As part of the reporting process, the AQI also called for an itemization of NOx emissions generated by activities at Logan Airport according to the individual airline operator. Table I-25 shows the estimated amounts of NOx air emissions in 2015 generated by each airline in units of tpy and tons per LTO.
Based on Table I-25, international carriers are the higher NOx emitters per LTO because their longer stage lengths require aircraft equipped with larger and/or additional engines and heavier takeoff weights. Overall, international carriers emitted 20 percent of the total aircraft NOx emissions at Logan Airport in 2015. Other notable findings included:
Carriers with the greatest number of flights tended to generate the highest percentage of total NOx emissions;
Combined, the four largest air carriers (by LTO), emitted 49 percent of the total aircraft NOx emissions in 2015;
Commercial airlines (excludes cargo and GA) accounted for 93 percent of total aircraft NOx emissions in 2015;
Cargo aircraft operators accounted for 5 percent of total aircraft NOx emissions in 2015; and
GA aircraft accounted for 1 percent of total aircraft NOx emissions in 2015.
2,347 2,296
2,080
1,6511,486
1,726 1,685 1,6701,793
1,6911,601 1,603 1,640 1,649 1,617 1,625
1,715
0
500
1,000
1,500
2,000
2,500
1999 2000 2001 2002 2003 2004 2005 2006 2007 2008 2009 2010 2011 2012 2013 2014 2015
Tons
per
yea
r
Actual Emissions (tpy) 1999 NOx AQI
1999 NOx AQI Benchmark
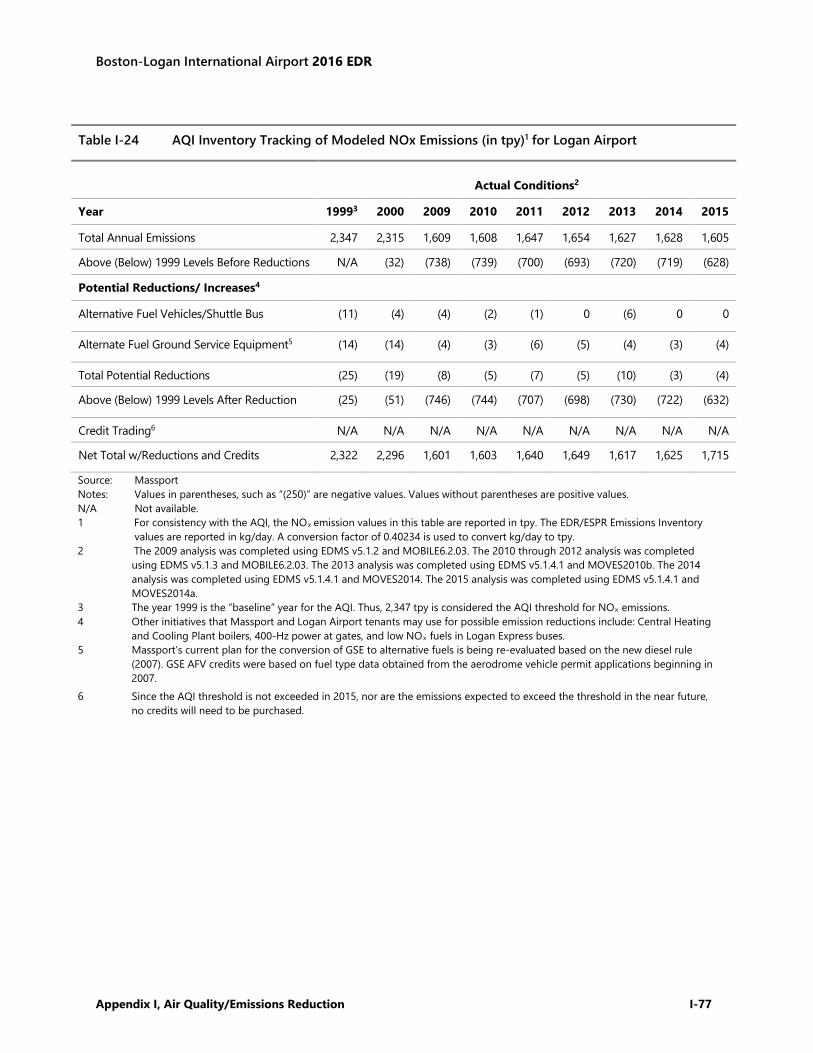
Boston-Logan International Airport 2016 EDR
Appendix I, Air Quality/Emissions Reduction I-77
Source: Massport Notes: Values in parentheses, such as “(250)” are negative values. Values without parentheses are positive values. N/A Not available. 1 For consistency with the AQI, the NOx emission values in this table are reported in tpy. The EDR/ESPR Emissions Inventory
values are reported in kg/day. A conversion factor of 0.40234 is used to convert kg/day to tpy. 2 The 2009 analysis was completed using EDMS v5.1.2 and MOBILE6.2.03. The 2010 through 2012 analysis was completed
using EDMS v5.1.3 and MOBILE6.2.03. The 2013 analysis was completed using EDMS v5.1.4.1 and MOVES2010b. The 2014 analysis was completed using EDMS v5.1.4.1 and MOVES2014. The 2015 analysis was completed using EDMS v5.1.4.1 and MOVES2014a.
3 The year 1999 is the “baseline” year for the AQI. Thus, 2,347 tpy is considered the AQI threshold for NOx emissions. 4 Other initiatives that Massport and Logan Airport tenants may use for possible emission reductions include: Central Heating
and Cooling Plant boilers, 400-Hz power at gates, and low NOx fuels in Logan Express buses. 5 Massport’s current plan for the conversion of GSE to alternative fuels is being re-evaluated based on the new diesel rule
(2007). GSE AFV credits were based on fuel type data obtained from the aerodrome vehicle permit applications beginning in 2007.
6 Since the AQI threshold is not exceeded in 2015, nor are the emissions expected to exceed the threshold in the near future, no credits will need to be purchased.
Table I-24 AQI Inventory Tracking of Modeled NOx Emissions (in tpy)1 for Logan Airport
Actual Conditions2
Year 19993 2000 2009 2010 2011 2012 2013 2014 2015
Total Annual Emissions 2,347 2,315 1,609 1,608 1,647 1,654 1,627 1,628 1,605 Above (Below) 1999 Levels Before Reductions N/A (32) (738) (739) (700) (693) (720) (719) (628) Potential Reductions/ Increases4 Alternative Fuel Vehicles/Shuttle Bus (11) (4) (4) (2) (1) 0 (6) 0 0
Alternate Fuel Ground Service Equipment5 (14) (14) (4) (3) (6) (5) (4) (3) (4)
Total Potential Reductions (25) (19) (8) (5) (7) (5) (10) (3) (4) Above (Below) 1999 Levels After Reduction (25) (51) (746) (744) (707) (698) (730) (722) (632)
Credit Trading6 N/A N/A N/A N/A N/A N/A N/A N/A N/A Net Total w/Reductions and Credits 2,322 2,296 1,601 1,603 1,640 1,649 1,617 1,625 1,715
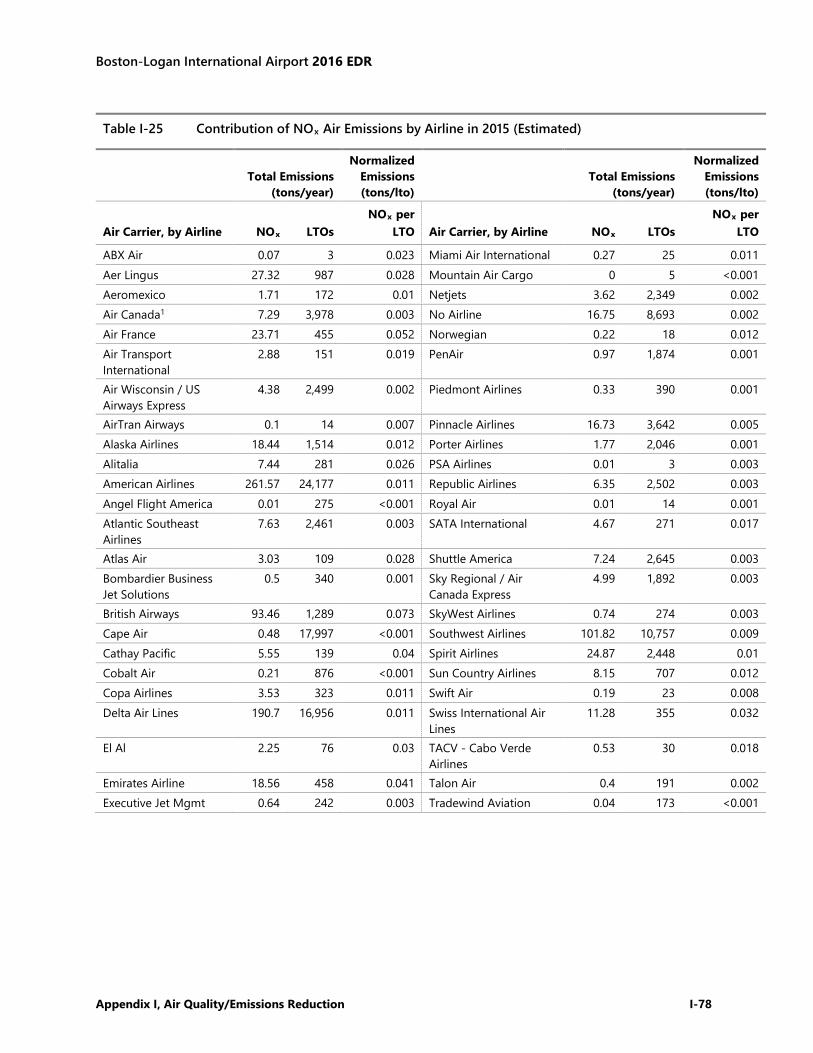
Boston-Logan International Airport 2016 EDR
Appendix I, Air Quality/Emissions Reduction I-78
Table I-25 Contribution of NOx Air Emissions by Airline in 2015 (Estimated)
Total Emissions
(tons/year)
Normalized Emissions (tons/lto)
Total Emissions (tons/year)
Normalized Emissions (tons/lto)
Air Carrier, by Airline NOx LTOs NOx per
LTO Air Carrier, by Airline NOx LTOs NOx per
LTO
ABX Air 0.07 3 0.023 Miami Air International 0.27 25 0.011 Aer Lingus 27.32 987 0.028 Mountain Air Cargo 0 5 <0.001 Aeromexico 1.71 172 0.01 Netjets 3.62 2,349 0.002 Air Canada1 7.29 3,978 0.003 No Airline 16.75 8,693 0.002 Air France 23.71 455 0.052 Norwegian 0.22 18 0.012 Air Transport International
2.88 151 0.019 PenAir 0.97 1,874 0.001
Air Wisconsin / US Airways Express
4.38 2,499 0.002 Piedmont Airlines 0.33 390 0.001
AirTran Airways 0.1 14 0.007 Pinnacle Airlines 16.73 3,642 0.005 Alaska Airlines 18.44 1,514 0.012 Porter Airlines 1.77 2,046 0.001 Alitalia 7.44 281 0.026 PSA Airlines 0.01 3 0.003 American Airlines 261.57 24,177 0.011 Republic Airlines 6.35 2,502 0.003 Angel Flight America 0.01 275 <0.001 Royal Air 0.01 14 0.001 Atlantic Southeast Airlines
7.63 2,461 0.003 SATA International 4.67 271 0.017
Atlas Air 3.03 109 0.028 Shuttle America 7.24 2,645 0.003 Bombardier Business Jet Solutions
0.5 340 0.001 Sky Regional / Air Canada Express
4.99 1,892 0.003
British Airways 93.46 1,289 0.073 SkyWest Airlines 0.74 274 0.003 Cape Air 0.48 17,997 <0.001 Southwest Airlines 101.82 10,757 0.009 Cathay Pacific 5.55 139 0.04 Spirit Airlines 24.87 2,448 0.01 Cobalt Air 0.21 876 <0.001 Sun Country Airlines 8.15 707 0.012 Copa Airlines 3.53 323 0.011 Swift Air 0.19 23 0.008 Delta Air Lines 190.7 16,956 0.011 Swiss International Air
Lines 11.28 355 0.032
El Al 2.25 76 0.03 TACV - Cabo Verde Airlines
0.53 30 0.018
Emirates Airline 18.56 458 0.041 Talon Air 0.4 191 0.002 Executive Jet Mgmt 0.64 242 0.003 Tradewind Aviation 0.04 173 <0.001
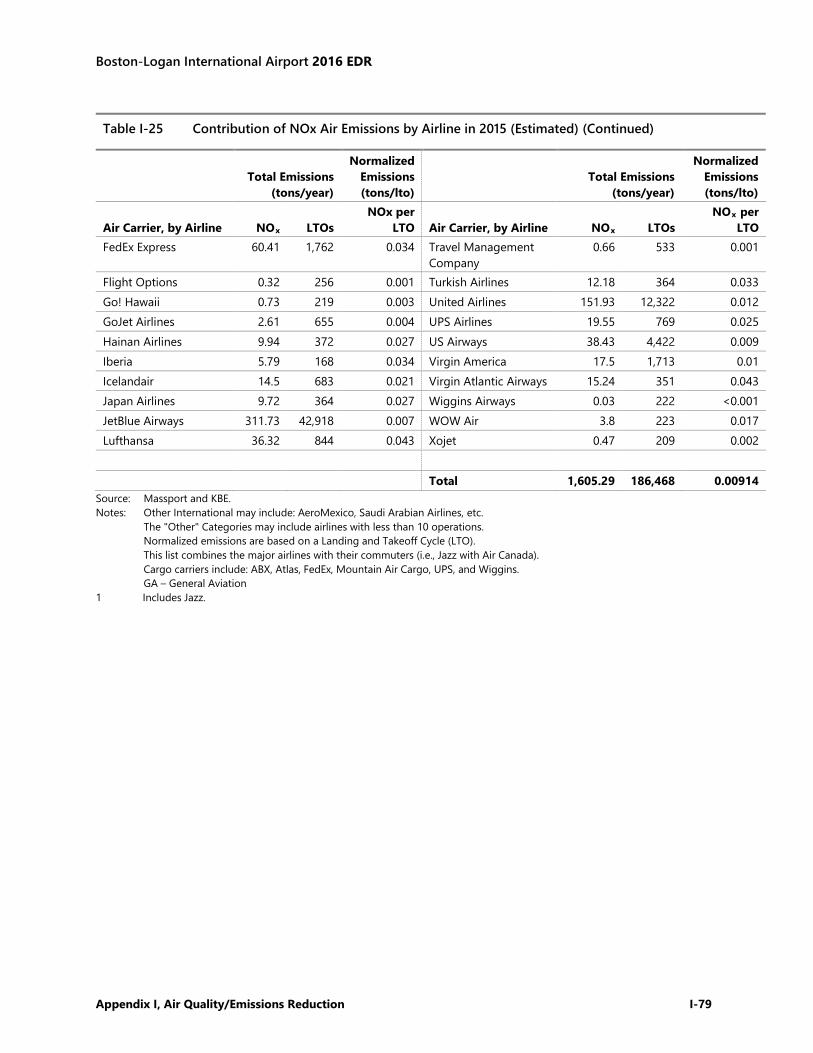
Boston-Logan International Airport 2016 EDR
Appendix I, Air Quality/Emissions Reduction I-79
Table I-25 Contribution of NOx Air Emissions by Airline in 2015 (Estimated) (Continued)
Total Emissions
(tons/year)
Normalized Emissions (tons/lto)
Total Emissions (tons/year)
Normalized Emissions (tons/lto)
Air Carrier, by Airline NOx LTOs NOx per
LTO Air Carrier, by Airline NOx LTOs NOx per
LTO FedEx Express 60.41 1,762 0.034 Travel Management
Company 0.66 533 0.001
Flight Options 0.32 256 0.001 Turkish Airlines 12.18 364 0.033 Go! Hawaii 0.73 219 0.003 United Airlines 151.93 12,322 0.012 GoJet Airlines 2.61 655 0.004 UPS Airlines 19.55 769 0.025 Hainan Airlines 9.94 372 0.027 US Airways 38.43 4,422 0.009 Iberia 5.79 168 0.034 Virgin America 17.5 1,713 0.01 Icelandair 14.5 683 0.021 Virgin Atlantic Airways 15.24 351 0.043 Japan Airlines 9.72 364 0.027 Wiggins Airways 0.03 222 <0.001 JetBlue Airways 311.73 42,918 0.007 WOW Air 3.8 223 0.017 Lufthansa 36.32 844 0.043 Xojet 0.47 209 0.002
Total 1,605.29 186,468 0.00914 Source: Massport and KBE. Notes: Other International may include: AeroMexico, Saudi Arabian Airlines, etc. The "Other" Categories may include airlines with less than 10 operations. Normalized emissions are based on a Landing and Takeoff Cycle (LTO). This list combines the major airlines with their commuters (i.e., Jazz with Air Canada).
Cargo carriers include: ABX, Atlas, FedEx, Mountain Air Cargo, UPS, and Wiggins. GA – General Aviation
1 Includes Jazz.

Boston-Logan International Airport 2016 EDR
Appendix I, Air Quality/Emissions Reduction I-80
This Page Intentionally Left Blank.
Boston-Logan International Airport 2016 EDR
Appendix J, Water Quality J-1
J Water Quality/Environmental Compliance and Management
This appendix provides detailed information in support of Chapter 8, Water Quality/Environmental
Compliance and Management:
▪ Table J-1 Logan Airport National Pollutant Discharge Elimination System (NPDES) Permit
(No. MA0000787) Stormwater Outfall Monitoring Requirements (2007)
▪ Table J-2 Fire Training Facility NPDES Permit (No. MA0032751) Stormwater Outfall Monitoring
Requirements (2006)
▪ Table J-3 Logan Airport 2016 Monthly Monitoring Results for First Quarter — North, West, and
Maverick Street Stormwater Outfalls
▪ Table J-4 Logan Airport 2016 Monthly Monitoring Results for First Quarter — Porter Street
Stormwater Outfall
▪ Table J-5 Logan Airport 2016 Monthly Monitoring Results for Second Quarter — North, West, and
Maverick Street Stormwater Outfalls
▪ Table J-6 Logan Airport 2016 Monthly Monitoring Results for Second Quarter — Porter Street
Stormwater Outfall
▪ Table J-7 Logan Airport 2016 Monthly Monitoring Results for Third Quarter — North, West, and
Maverick Street Stormwater Outfalls
▪ Table J-8 Logan Airport 2016 Monthly Monitoring Results for Third Quarter — Porter Street
Stormwater Outfall
▪ Table J-9 Logan Airport 2016 Monthly Monitoring Results for Fourth Quarter — North, West, and
Maverick Street Stormwater Outfalls
▪ Table J-10 Logan Airport 2016 Monthly Monitoring Results for Fourth Quarter — Porter Street
Stormwater Outfall
▪ Table J-11 Logan Airport 2016 Quarterly Wet Weather Monitoring Results — North, West, Maverick
Street, and Porter Street Stormwater Outfalls
▪ Table J-12 Logan Airport 2016 Quarterly Wet Weather Monitoring Results – Northwest and
Runway/Perimeter Stormwater Outfalls
Boston-Logan International Airport 2016 EDR
Appendix J, Water Quality J-2
▪ Table J-13 Logan Airport February 2016 Wet Weather Deicing Monitoring Results – North, West,
Porter Street, and Runway/Perimeter Stormwater Outfalls
▪ Table J-14 Logan Airport March 2016 Wet Weather Deicing Monitoring Results – North, West Porter
Street, and Runway/Perimeter Stormwater Outfalls
▪ Table J-15 Logan Airport Stormwater Outfall NPDES Water Quality Monitoring Results – 1993 to
2016
▪ Table J-16 Logan Airport Oil and Hazardous Material Spills and Jet Fuel Handling – 1990 to 2016
▪ Table J-17 Type and Quantity of Oil and Hazardous Material Spills at Logan Airport – 1999 to 2016
▪ Table J-18 MCP Activities Status of Massport Sites at Logan Airport
▪ EnviroNews/Sustainable Massport
Vol. 42, Issue 1 – January 2016
Vol. 42, Issue 2 – May 2016
Vol. 42, Issue 3 – August 2016
Vol. 42, Issue 4 – December 2016
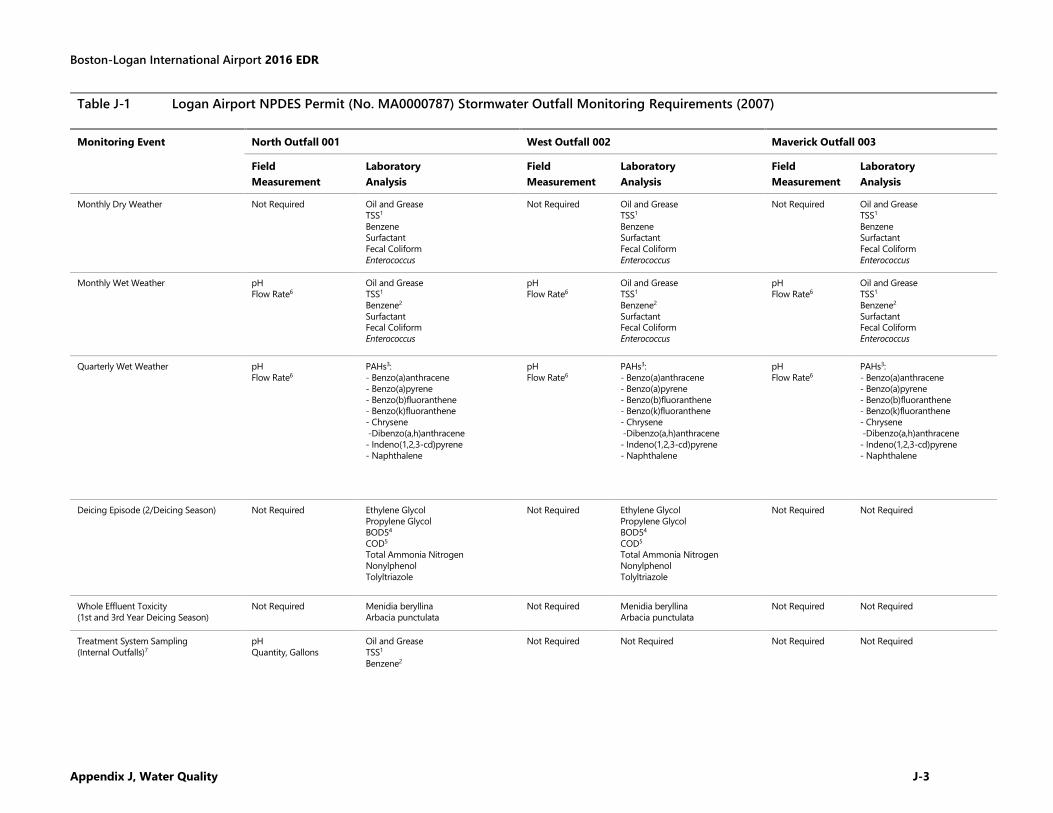
Boston-Logan International Airport 2016 EDR
Appendix J, Water Quality J-3
Table J-1 Logan Airport NPDES Permit (No. MA0000787) Stormwater Outfall Monitoring Requirements (2007)
Monitoring Event North Outfall 001 West Outfall 002 Maverick Outfall 003
Field
Measurement
Laboratory
Analysis
Field
Measurement
Laboratory
Analysis
Field
Measurement
Laboratory
Analysis
Monthly Dry Weather Not Required Oil and Grease
TSS1
Benzene
Surfactant
Fecal Coliform
Enterococcus
Not Required Oil and Grease
TSS1
Benzene
Surfactant
Fecal Coliform
Enterococcus
Not Required Oil and Grease
TSS1
Benzene
Surfactant
Fecal Coliform
Enterococcus
Monthly Wet Weather pH
Flow Rate6
Oil and Grease
TSS1
Benzene2
Surfactant
Fecal Coliform
Enterococcus
pH
Flow Rate6
Oil and Grease
TSS1
Benzene2
Surfactant
Fecal Coliform
Enterococcus
pH
Flow Rate6
Oil and Grease
TSS1
Benzene2
Surfactant
Fecal Coliform
Enterococcus
Quarterly Wet Weather pH
Flow Rate6
PAHs3:
- Benzo(a)anthracene
- Benzo(a)pyrene
- Benzo(b)fluoranthene
- Benzo(k)fluoranthene
- Chrysene
-Dibenzo(a,h)anthracene
- Indeno(1,2,3-cd)pyrene
- Naphthalene
pH
Flow Rate6
PAHs3:
- Benzo(a)anthracene
- Benzo(a)pyrene
- Benzo(b)fluoranthene
- Benzo(k)fluoranthene
- Chrysene
-Dibenzo(a,h)anthracene
- Indeno(1,2,3-cd)pyrene
- Naphthalene
pH
Flow Rate6
PAHs3:
- Benzo(a)anthracene
- Benzo(a)pyrene
- Benzo(b)fluoranthene
- Benzo(k)fluoranthene
- Chrysene
-Dibenzo(a,h)anthracene
- Indeno(1,2,3-cd)pyrene
- Naphthalene
Deicing Episode (2/Deicing Season) Not Required Ethylene Glycol
Propylene Glycol
BOD54
COD5
Total Ammonia Nitrogen
Nonylphenol
Tolyltriazole
Not Required Ethylene Glycol
Propylene Glycol
BOD54
COD5
Total Ammonia Nitrogen
Nonylphenol
Tolyltriazole
Not Required Not Required
Whole Effluent Toxicity
(1st and 3rd Year Deicing Season)
Not Required Menidia beryllina
Arbacia punctulata
Not Required Menidia beryllina
Arbacia punctulata
Not Required Not Required
Treatment System Sampling
(Internal Outfalls)7
pH
Quantity, Gallons
Oil and Grease
TSS1
Benzene2
Not Required Not Required Not Required Not Required
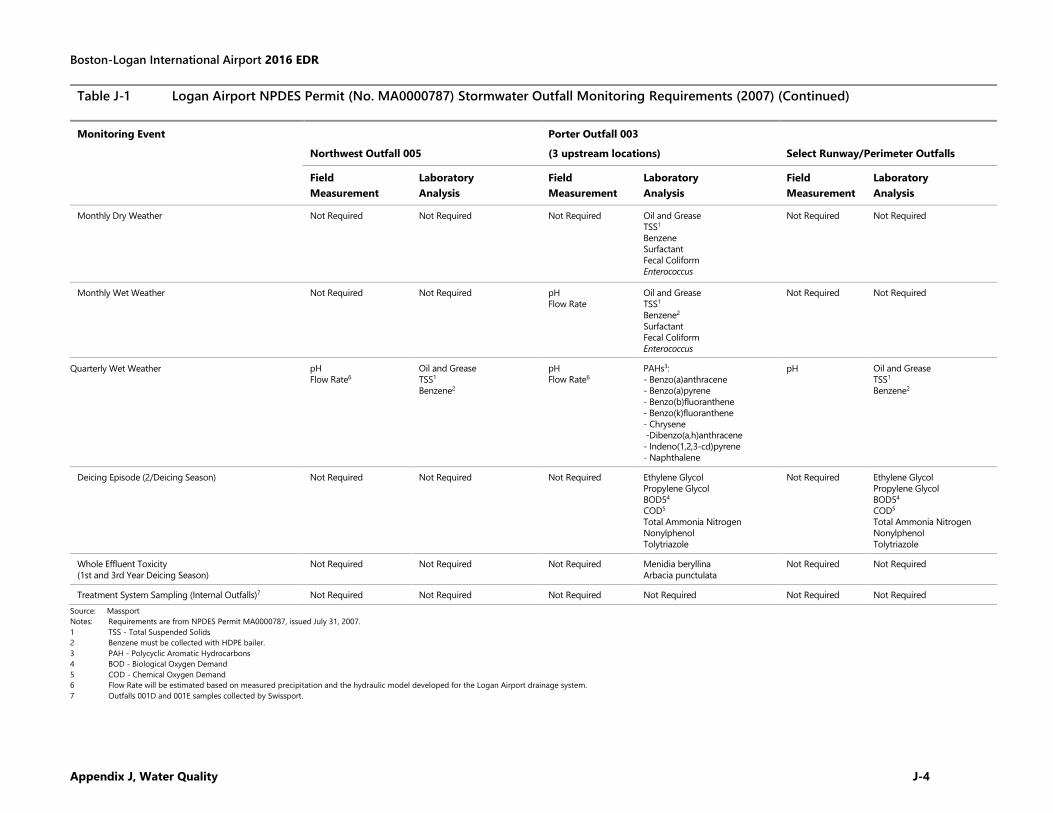
Boston-Logan International Airport 2016 EDR
Appendix J, Water Quality J-4
Source: Massport
Notes: Requirements are from NPDES Permit MA0000787, issued July 31, 2007.
1 TSS - Total Suspended Solids
2 Benzene must be collected with HDPE bailer.
3 PAH - Polycyclic Aromatic Hydrocarbons
4 BOD - Biological Oxygen Demand
5 COD - Chemical Oxygen Demand
6 Flow Rate will be estimated based on measured precipitation and the hydraulic model developed for the Logan Airport drainage system.
7 Outfalls 001D and 001E samples collected by Swissport.
Table J-1 Logan Airport NPDES Permit (No. MA0000787) Stormwater Outfall Monitoring Requirements (2007) (Continued)
Monitoring Event
Northwest Outfall 005
Porter Outfall 003
(3 upstream locations) Select Runway/Perimeter Outfalls
Field
Measurement
Laboratory
Analysis
Field
Measurement
Laboratory
Analysis
Field
Measurement
Laboratory
Analysis
Monthly Dry Weather Not Required Not Required Not Required Oil and Grease
TSS1
Benzene
Surfactant
Fecal Coliform
Enterococcus
Not Required Not Required
Monthly Wet Weather Not Required Not Required pH
Flow Rate
Oil and Grease
TSS1
Benzene2
Surfactant
Fecal Coliform
Enterococcus
Not Required Not Required
Quarterly Wet Weather pH
Flow Rate6
Oil and Grease
TSS1
Benzene2
pH
Flow Rate6
PAHs3:
- Benzo(a)anthracene
- Benzo(a)pyrene
- Benzo(b)fluoranthene
- Benzo(k)fluoranthene
- Chrysene
-Dibenzo(a,h)anthracene
- Indeno(1,2,3-cd)pyrene
- Naphthalene
pH Oil and Grease
TSS1
Benzene2
Deicing Episode (2/Deicing Season) Not Required Not Required Not Required Ethylene Glycol
Propylene Glycol
BOD54
COD5
Total Ammonia Nitrogen
Nonylphenol
Tolytriazole
Not Required Ethylene Glycol
Propylene Glycol
BOD54
COD5
Total Ammonia Nitrogen
Nonylphenol
Tolytriazole
Whole Effluent Toxicity
(1st and 3rd Year Deicing Season)
Not Required Not Required Not Required Menidia beryllina
Arbacia punctulata
Not Required Not Required
Treatment System Sampling (Internal Outfalls)7 Not Required Not Required Not Required Not Required Not Required Not Required
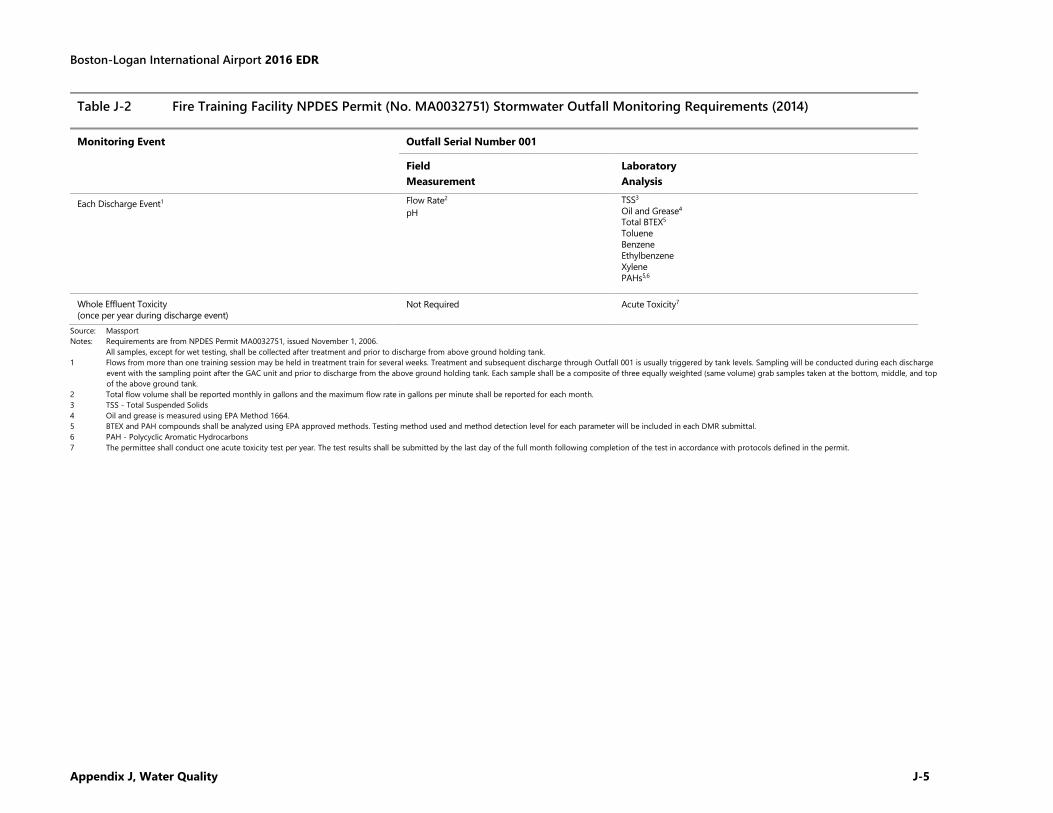
Boston-Logan International Airport 2016 EDR
Appendix J, Water Quality J-5
Source: Massport
Notes: Requirements are from NPDES Permit MA0032751, issued November 1, 2006.
All samples, except for wet testing, shall be collected after treatment and prior to discharge from above ground holding tank.
1 Flows from more than one training session may be held in treatment train for several weeks. Treatment and subsequent discharge through Outfall 001 is usually triggered by tank levels. Sampling will be conducted during each discharge
event with the sampling point after the GAC unit and prior to discharge from the above ground holding tank. Each sample shall be a composite of three equally weighted (same volume) grab samples taken at the bottom, middle, and top
of the above ground tank.
2 Total flow volume shall be reported monthly in gallons and the maximum flow rate in gallons per minute shall be reported for each month.
3 TSS - Total Suspended Solids
4 Oil and grease is measured using EPA Method 1664.
5 BTEX and PAH compounds shall be analyzed using EPA approved methods. Testing method used and method detection level for each parameter will be included in each DMR submittal.
6 PAH - Polycyclic Aromatic Hydrocarbons
7 The permittee shall conduct one acute toxicity test per year. The test results shall be submitted by the last day of the full month following completion of the test in accordance with protocols defined in the permit.
Table J-2 Fire Training Facility NPDES Permit (No. MA0032751) Stormwater Outfall Monitoring Requirements (2014)
Monitoring Event Outfall Serial Number 001
Field
Measurement
Laboratory
Analysis
Each Discharge Event1 Flow Rate2
pH
TSS3
Oil and Grease4
Total BTEX5
Toluene
Benzene
Ethylbenzene
Xylene
PAHs5,6
Whole Effluent Toxicity
(once per year during discharge event)
Not Required Acute Toxicity7

Boston-Logan International Airport 2016 EDR
Appendix J, Water Quality J-6
Table J-3 Logan Airport 2016 Monthly Monitoring Results for First Quarter — North, West, and Maverick Street
Stormwater Outfalls
Date Event
Maximum
Daily Flow
(MGD)
Average
Monthly
Flow
(MGD)
pH
(S.U.)
Oil and
Grease
(mg/L)
TSS
(mg/L)
Benzene
(µg/L)
Surfactant
(mg/L)
Fecal
Coliform
(cfu/100mL)
Enterococcus
(cfu/100mL)
Klebsiella
(cfu/100mL)
001A – North Outfall --- Wet Weather 5.2 0.7 NS NS NS NS NS NS NS NS
002A – West Outfall --- Wet Weather 17.34 1.51 NS NS NS NS NS NS NS NS
004A – Maverick Street Outfall --- Wet Weather 1.19 0.08 NS NS NS NS NS NS NS NS
001C – North Outfall 1/6/2016 Dry Weather <4.0 15 <1.0 0.120 20 440 NA
002C – West Outfall 1/6/2016 Dry Weather <4.0 18 <1.0 0.230 140 20 NA
004C – Maverick Street Outfall 1/6/2016 Dry Weather <4.0 9.9 <1.0 0.230 260 50 NA
001A – North Outfall 2/3/2016 Wet Weather 3.3 0.9 6.71 <4.0 9.0 <1.0 0.110 3,200 480 NA
002A – West Outfall 2/3/2016 Wet Weather 12.4 1.9 6.71 <4.0 5.0 <1.0 0.150 400 20 NA
004A – Maverick Street Outfall 2/3/2016 Wet Weather 0.8 0.1 6.21 <4.0 5.7 <1.0 0.120 55 60 NA
001C – North Outfall 2/15/2016 Dry Weather <4.0 16 <1.0 0.080 2.0 1,100 NA
002C – West Outfall 2/15/2016 Dry Weather <4.0 5.6 <1.0 0.050 3.0 <2.0 NA
004C – Maverick Street Outfall 2/15/2016 Dry Weather <4.0 <5.0 <1.0 <0.050 140 150 NA
001A – North Outfall 3/2/2016 Wet Weather 4.1 0.4 6.04 <4.0 10 <1.0 0.050 160 390 NA
002A – West Outfall 3/2/2016 Wet Weather 15.1 1.1 6.52 <4.0 15 <1.0 0.200 100 200 NA
004A – Maverick Street Outfall 3/2/2016 Wet Weather 1.0 0.1 5.59 <4.0 5.2 <1.0 0.180 790 220 NA
001C – North Outfall 3/8/2016 Dry Weather <4.0 11 <1.0 0.130 140 460 NA
002C – West Outfall 3/8/2016 Dry Weather <4.0 5.3 <1.0 0.070 180 10 NA
004C – Maverick Street Outfall 3/8/2016 Dry Weather <4.0 <5.0 <1.0 0.050 4,500 260 NA
Requirements are from NPDES Permit MA0000787, issued July 31, 2007.
Discharge Limitations
Maximum Daily Report Report 6.0 to 8.5 15 mg/L 100 mg/L Report Report Report Report
Average Monthly Report Report 6.0 to 8.5 ─ Report Report Report Report Report
Source: Massport.
Notes: Bold values exceed maximum daily discharge limitation.
Flow rates were estimated for outfalls 001, 002, and 004 by using the SWMM model developed for Logan Airport.
For averaging calculations, a value of zero was employed for those results measured below the laboratory detection limit. For geometric mean calculations (fecal coliform and Enterococcus) a value of 1 was employed for those results
measured below the laboratory detection limit.
1 Klebsiella is an indication of non-fecal coliform bacteria and is tested for at the North Outfall when fecal coliform concentration exceeds 5,000 cfu/100ml.
NA Not Analyzed.
TSS Total Suspended Solids.
NS Not Sampled. A wet weather sampling event was not conducted during the month of January 2016 due to lack of precipitation.
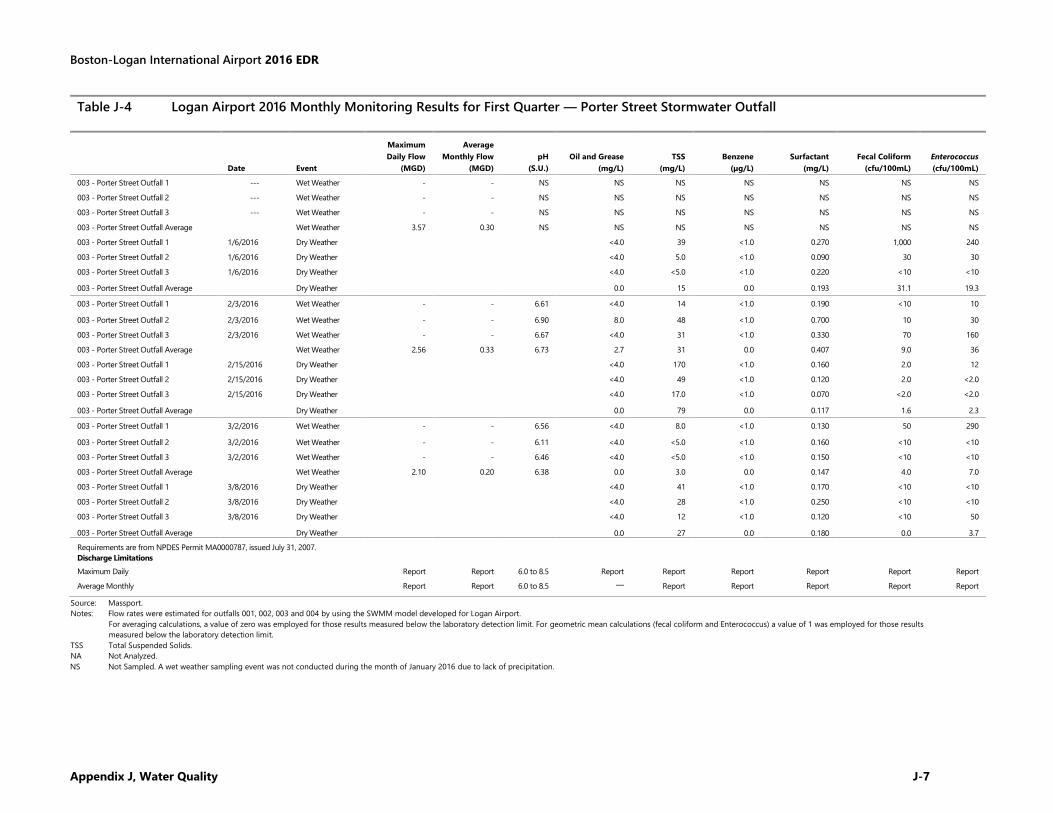
Boston-Logan International Airport 2016 EDR
Appendix J, Water Quality J-7
Table J-4 Logan Airport 2016 Monthly Monitoring Results for First Quarter — Porter Street Stormwater Outfall
Date Event
Maximum
Daily Flow
(MGD)
Average
Monthly Flow
(MGD)
pH
(S.U.)
Oil and Grease
(mg/L)
TSS
(mg/L)
Benzene
(µg/L)
Surfactant
(mg/L)
Fecal Coliform
(cfu/100mL)
Enterococcus
(cfu/100mL)
003 - Porter Street Outfall 1 --- Wet Weather - - NS NS NS NS NS NS NS
003 - Porter Street Outfall 2 --- Wet Weather - - NS NS NS NS NS NS NS
003 - Porter Street Outfall 3 --- Wet Weather - - NS NS NS NS NS NS NS
003 - Porter Street Outfall Average Wet Weather 3.57 0.30 NS NS NS NS NS NS NS
003 - Porter Street Outfall 1 1/6/2016 Dry Weather <4.0 39 <1.0 0.270 1,000 240
003 - Porter Street Outfall 2 1/6/2016 Dry Weather <4.0 5.0 <1.0 0.090 30 30
003 - Porter Street Outfall 3 1/6/2016 Dry Weather <4.0 <5.0 <1.0 0.220 <10 <10
003 - Porter Street Outfall Average Dry Weather 0.0 15 0.0 0.193 31.1 19.3
003 - Porter Street Outfall 1 2/3/2016 Wet Weather - - 6.61 <4.0 14 <1.0 0.190 <10 10
003 - Porter Street Outfall 2 2/3/2016 Wet Weather - - 6.90 8.0 48 <1.0 0.700 10 30
003 - Porter Street Outfall 3 2/3/2016 Wet Weather - - 6.67 <4.0 31 <1.0 0.330 70 160
003 - Porter Street Outfall Average Wet Weather 2.56 0.33 6.73 2.7 31 0.0 0.407 9.0 36
003 - Porter Street Outfall 1 2/15/2016 Dry Weather <4.0 170 <1.0 0.160 2.0 12
003 - Porter Street Outfall 2 2/15/2016 Dry Weather <4.0 49 <1.0 0.120 2.0 <2.0
003 - Porter Street Outfall 3 2/15/2016 Dry Weather <4.0 17.0 <1.0 0.070 <2.0 <2.0
003 - Porter Street Outfall Average Dry Weather 0.0 79 0.0 0.117 1.6 2.3
003 - Porter Street Outfall 1 3/2/2016 Wet Weather - - 6.56 <4.0 8.0 <1.0 0.130 50 290
003 - Porter Street Outfall 2 3/2/2016 Wet Weather - - 6.11 <4.0 <5.0 <1.0 0.160 <10 <10
003 - Porter Street Outfall 3 3/2/2016 Wet Weather - - 6.46 <4.0 <5.0 <1.0 0.150 <10 <10
003 - Porter Street Outfall Average Wet Weather 2.10 0.20 6.38 0.0 3.0 0.0 0.147 4.0 7.0
003 - Porter Street Outfall 1 3/8/2016 Dry Weather <4.0 41 <1.0 0.170 <10 <10
003 - Porter Street Outfall 2 3/8/2016 Dry Weather <4.0 28 <1.0 0.250 <10 <10
003 - Porter Street Outfall 3 3/8/2016 Dry Weather <4.0 12 <1.0 0.120 <10 50
003 - Porter Street Outfall Average Dry Weather 0.0 27 0.0 0.180 0.0 3.7
Requirements are from NPDES Permit MA0000787, issued July 31, 2007.
Discharge Limitations
Maximum Daily Report Report 6.0 to 8.5 Report Report Report Report Report Report
Average Monthly Report Report 6.0 to 8.5 ─ Report Report Report Report Report
Source: Massport.
Notes: Flow rates were estimated for outfalls 001, 002, 003 and 004 by using the SWMM model developed for Logan Airport.
For averaging calculations, a value of zero was employed for those results measured below the laboratory detection limit. For geometric mean calculations (fecal coliform and Enterococcus) a value of 1 was employed for those results
measured below the laboratory detection limit.
TSS Total Suspended Solids.
NA Not Analyzed.
NS Not Sampled. A wet weather sampling event was not conducted during the month of January 2016 due to lack of precipitation.
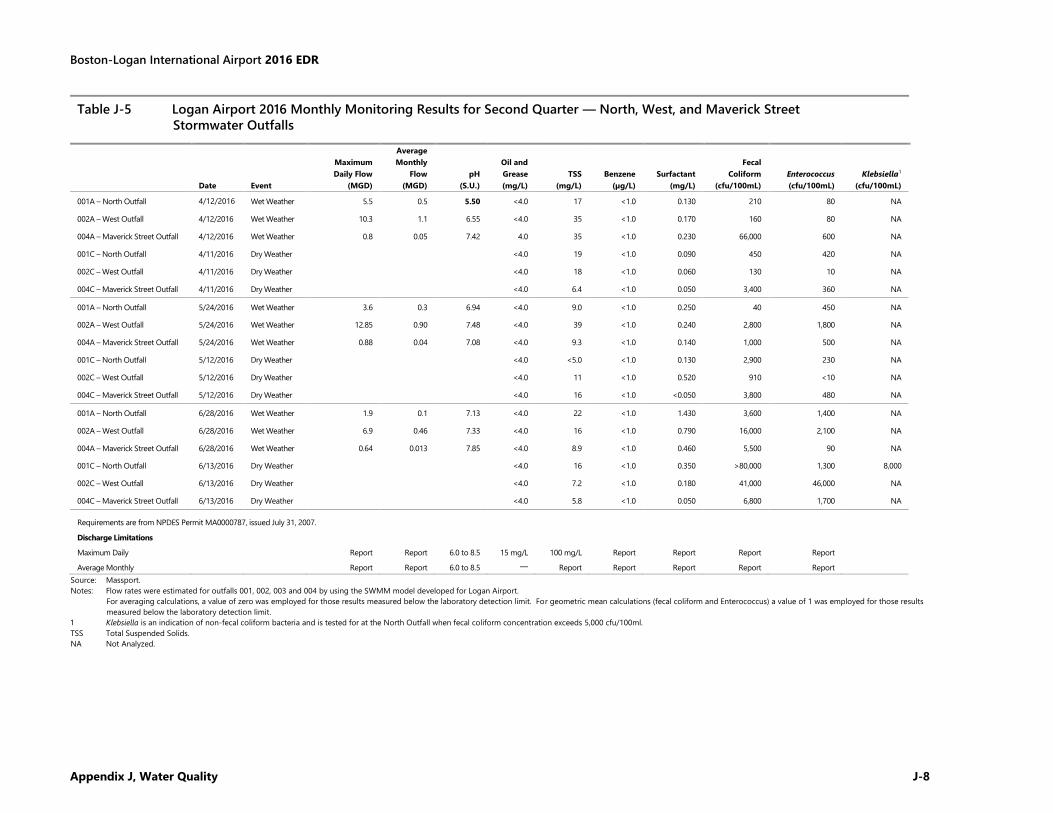
Boston-Logan International Airport 2016 EDR
Appendix J, Water Quality J-8
Table J-5 Logan Airport 2016 Monthly Monitoring Results for Second Quarter — North, West, and Maverick Street
Stormwater Outfalls
Date Event
Maximum
Daily Flow
(MGD)
Average
Monthly
Flow
(MGD)
pH
(S.U.)
Oil and
Grease
(mg/L)
TSS
(mg/L)
Benzene
(µg/L)
Surfactant
(mg/L)
Fecal
Coliform
(cfu/100mL)
Enterococcus
(cfu/100mL)
Klebsiella1
(cfu/100mL)
001A – North Outfall 4/12/2016 Wet Weather 5.5 0.5 5.50 <4.0 17 <1.0 0.130 210 80 NA
002A – West Outfall 4/12/2016 Wet Weather 10.3 1.1 6.55 <4.0 35 <1.0 0.170 160 80 NA
004A – Maverick Street Outfall 4/12/2016 Wet Weather 0.8 0.05 7.42 4.0 35 <1.0 0.230 66,000 600 NA
001C – North Outfall 4/11/2016 Dry Weather <4.0 19 <1.0 0.090 450 420 NA
002C – West Outfall 4/11/2016 Dry Weather <4.0 18 <1.0 0.060 130 10 NA
004C – Maverick Street Outfall 4/11/2016 Dry Weather <4.0 6.4 <1.0 0.050 3,400 360 NA
001A – North Outfall 5/24/2016 Wet Weather 3.6 0.3 6.94 <4.0 9.0 <1.0 0.250 40 450 NA
002A – West Outfall 5/24/2016 Wet Weather 12.85 0.90 7.48 <4.0 39 <1.0 0.240 2,800 1,800 NA
004A – Maverick Street Outfall 5/24/2016 Wet Weather 0.88 0.04 7.08 <4.0 9.3 <1.0 0.140 1,000 500 NA
001C – North Outfall 5/12/2016 Dry Weather <4.0 <5.0 <1.0 0.130 2,900 230 NA
002C – West Outfall 5/12/2016 Dry Weather <4.0 11 <1.0 0.520 910 <10 NA
004C – Maverick Street Outfall 5/12/2016 Dry Weather <4.0 16 <1.0 <0.050 3,800 480 NA
001A – North Outfall 6/28/2016 Wet Weather 1.9 0.1 7.13 <4.0 22 <1.0 1.430 3,600 1,400 NA
002A – West Outfall 6/28/2016 Wet Weather 6.9 0.46 7.33 <4.0 16 <1.0 0.790 16,000 2,100 NA
004A – Maverick Street Outfall 6/28/2016 Wet Weather 0.64 0.013 7.85 <4.0 8.9 <1.0 0.460 5,500 90 NA
001C – North Outfall 6/13/2016 Dry Weather <4.0 16 <1.0 0.350 >80,000 1,300 8,000
002C – West Outfall 6/13/2016 Dry Weather <4.0 7.2 <1.0 0.180 41,000 46,000 NA
004C – Maverick Street Outfall 6/13/2016 Dry Weather <4.0 5.8 <1.0 0.050 6,800 1,700 NA
Requirements are from NPDES Permit MA0000787, issued July 31, 2007.
Discharge Limitations
Maximum Daily Report Report 6.0 to 8.5 15 mg/L 100 mg/L Report Report Report Report
Average Monthly Report Report 6.0 to 8.5 ─ Report Report Report Report Report
Source: Massport.
Notes: Flow rates were estimated for outfalls 001, 002, 003 and 004 by using the SWMM model developed for Logan Airport.
For averaging calculations, a value of zero was employed for those results measured below the laboratory detection limit. For geometric mean calculations (fecal coliform and Enterococcus) a value of 1 was employed for those results
measured below the laboratory detection limit.
1 Klebsiella is an indication of non-fecal coliform bacteria and is tested for at the North Outfall when fecal coliform concentration exceeds 5,000 cfu/100ml.
TSS Total Suspended Solids.
NA Not Analyzed.
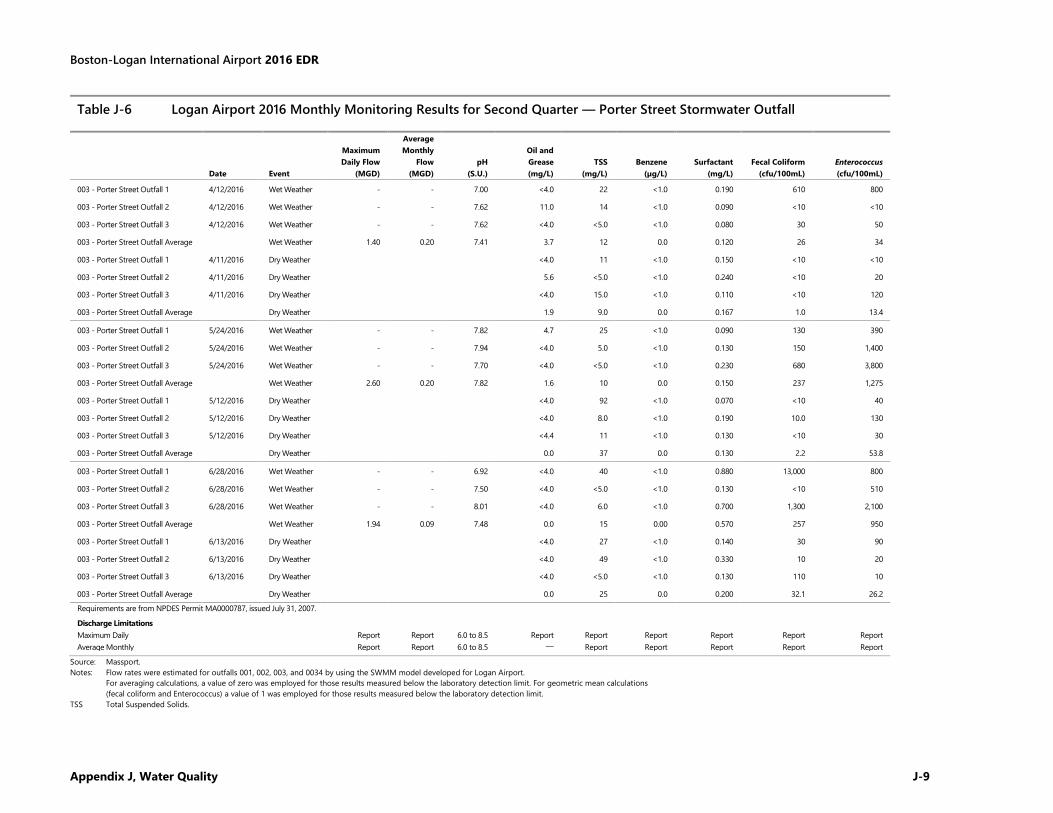
Boston-Logan International Airport 2016 EDR
Appendix J, Water Quality J-9
Table J-6 Logan Airport 2016 Monthly Monitoring Results for Second Quarter — Porter Street Stormwater Outfall
Date Event
Maximum
Daily Flow
(MGD)
Average
Monthly
Flow
(MGD)
pH
(S.U.)
Oil and
Grease
(mg/L)
TSS
(mg/L)
Benzene
(µg/L)
Surfactant
(mg/L)
Fecal Coliform
(cfu/100mL)
Enterococcus
(cfu/100mL)
003 - Porter Street Outfall 1 4/12/2016 Wet Weather - - 7.00 <4.0 22 <1.0 0.190 610 800
003 - Porter Street Outfall 2 4/12/2016 Wet Weather - - 7.62 11.0 14 <1.0 0.090 <10 <10
003 - Porter Street Outfall 3 4/12/2016 Wet Weather - - 7.62 <4.0 <5.0 <1.0 0.080 30 50
003 - Porter Street Outfall Average Wet Weather 1.40 0.20 7.41 3.7 12 0.0 0.120 26 34
003 - Porter Street Outfall 1 4/11/2016 Dry Weather <4.0 11 <1.0 0.150 <10 <10
003 - Porter Street Outfall 2 4/11/2016 Dry Weather 5.6 <5.0 <1.0 0.240 <10 20
003 - Porter Street Outfall 3 4/11/2016 Dry Weather <4.0 15.0 <1.0 0.110 <10 120
003 - Porter Street Outfall Average Dry Weather 1.9 9.0 0.0 0.167 1.0 13.4
003 - Porter Street Outfall 1 5/24/2016 Wet Weather - - 7.82 4.7 25 <1.0 0.090 130 390
003 - Porter Street Outfall 2 5/24/2016 Wet Weather - - 7.94 <4.0 5.0 <1.0 0.130 150 1,400
003 - Porter Street Outfall 3 5/24/2016 Wet Weather - - 7.70 <4.0 <5.0 <1.0 0.230 680 3,800
003 - Porter Street Outfall Average Wet Weather 2.60 0.20 7.82 1.6 10 0.0 0.150 237 1,275
003 - Porter Street Outfall 1 5/12/2016 Dry Weather <4.0 92 <1.0 0.070 <10 40
003 - Porter Street Outfall 2 5/12/2016 Dry Weather <4.0 8.0 <1.0 0.190 10.0 130
003 - Porter Street Outfall 3 5/12/2016 Dry Weather <4.4 11 <1.0 0.130 <10 30
003 - Porter Street Outfall Average Dry Weather 0.0 37 0.0 0.130 2.2 53.8
003 - Porter Street Outfall 1 6/28/2016 Wet Weather - - 6.92 <4.0 40 <1.0 0.880 13,000 800
003 - Porter Street Outfall 2 6/28/2016 Wet Weather - - 7.50 <4.0 <5.0 <1.0 0.130 <10 510
003 - Porter Street Outfall 3 6/28/2016 Wet Weather - - 8.01 <4.0 6.0 <1.0 0.700 1,300 2,100
003 - Porter Street Outfall Average Wet Weather 1.94 0.09 7.48 0.0 15 0.00 0.570 257 950
003 - Porter Street Outfall 1 6/13/2016 Dry Weather <4.0 27 <1.0 0.140 30 90
003 - Porter Street Outfall 2 6/13/2016 Dry Weather <4.0 49 <1.0 0.330 10 20
003 - Porter Street Outfall 3 6/13/2016 Dry Weather <4.0 <5.0 <1.0 0.130 110 10
003 - Porter Street Outfall Average Dry Weather 0.0 25 0.0 0.200 32.1 26.2
Requirements are from NPDES Permit MA0000787, issued July 31, 2007.
Discharge Limitations
Maximum Daily Report Report 6.0 to 8.5 Report Report Report Report Report Report
Average Monthly Report Report 6.0 to 8.5 ─ Report Report Report Report Report
Source: Massport.
Notes: Flow rates were estimated for outfalls 001, 002, 003, and 0034 by using the SWMM model developed for Logan Airport.
For averaging calculations, a value of zero was employed for those results measured below the laboratory detection limit. For geometric mean calculations
(fecal coliform and Enterococcus) a value of 1 was employed for those results measured below the laboratory detection limit.
TSS Total Suspended Solids.
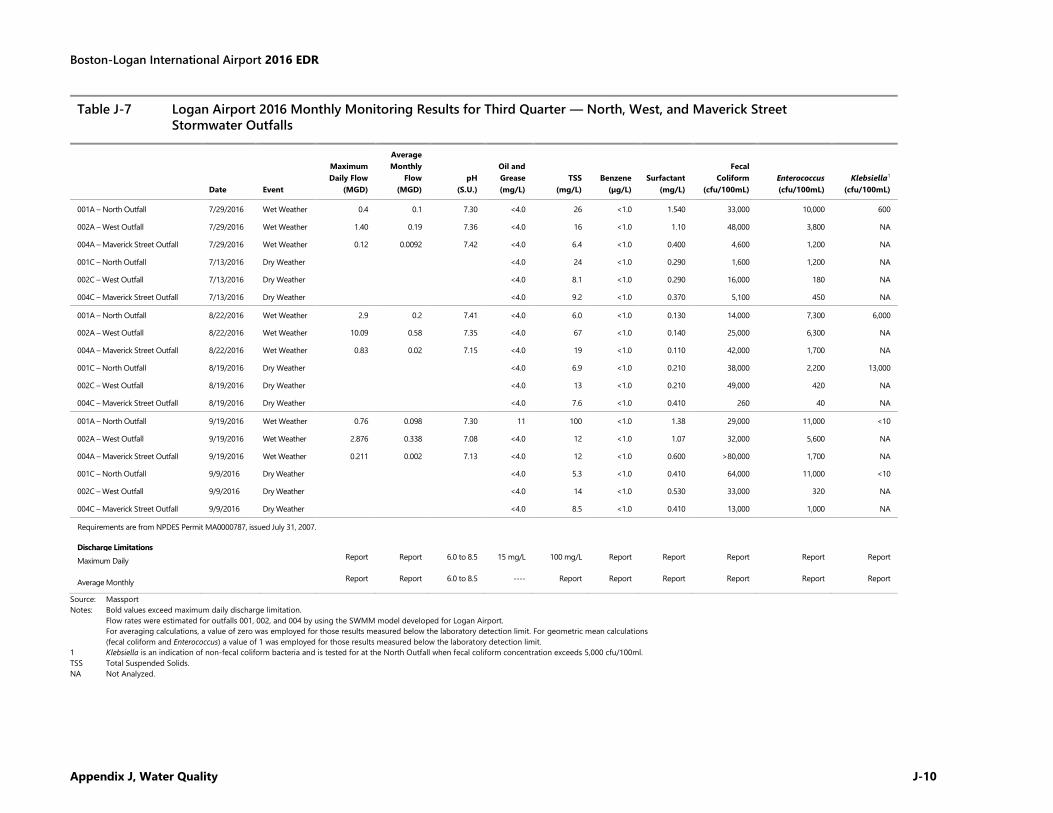
Boston-Logan International Airport 2016 EDR
Appendix J, Water Quality J-10
Table J-7 Logan Airport 2016 Monthly Monitoring Results for Third Quarter — North, West, and Maverick Street
Stormwater Outfalls
Date Event
Maximum
Daily Flow
(MGD)
Average
Monthly
Flow
(MGD)
pH
(S.U.)
Oil and
Grease
(mg/L)
TSS
(mg/L)
Benzene
(µg/L)
Surfactant
(mg/L)
Fecal
Coliform
(cfu/100mL)
Enterococcus
(cfu/100mL)
Klebsiella1
(cfu/100mL)
001A – North Outfall 7/29/2016 Wet Weather 0.4 0.1 7.30 <4.0 26 <1.0 1.540 33,000 10,000 600
002A – West Outfall 7/29/2016 Wet Weather 1.40 0.19 7.36 <4.0 16 <1.0 1.10 48,000 3,800 NA
004A – Maverick Street Outfall 7/29/2016 Wet Weather 0.12 0.0092 7.42 <4.0 6.4 <1.0 0.400 4,600 1,200 NA
001C – North Outfall 7/13/2016 Dry Weather <4.0 24 <1.0 0.290 1,600 1,200 NA
002C – West Outfall 7/13/2016 Dry Weather <4.0 8.1 <1.0 0.290 16,000 180 NA
004C – Maverick Street Outfall 7/13/2016 Dry Weather <4.0 9.2 <1.0 0.370 5,100 450 NA
001A – North Outfall 8/22/2016 Wet Weather 2.9 0.2 7.41 <4.0 6.0 <1.0 0.130 14,000 7,300 6,000
002A – West Outfall 8/22/2016 Wet Weather 10.09 0.58 7.35 <4.0 67 <1.0 0.140 25,000 6,300 NA
004A – Maverick Street Outfall 8/22/2016 Wet Weather 0.83 0.02 7.15 <4.0 19 <1.0 0.110 42,000 1,700 NA
001C – North Outfall 8/19/2016 Dry Weather <4.0 6.9 <1.0 0.210 38,000 2,200 13,000
002C – West Outfall 8/19/2016 Dry Weather <4.0 13 <1.0 0.210 49,000 420 NA
004C – Maverick Street Outfall 8/19/2016 Dry Weather <4.0 7.6 <1.0 0.410 260 40 NA
001A – North Outfall 9/19/2016 Wet Weather 0.76 0.098 7.30 11 100 <1.0 1.38 29,000 11,000 <10
002A – West Outfall 9/19/2016 Wet Weather 2.876 0.338 7.08 <4.0 12 <1.0 1.07 32,000 5,600 NA
004A – Maverick Street Outfall 9/19/2016 Wet Weather 0.211 0.002 7.13 <4.0 12 <1.0 0.600 >80,000 1,700 NA
001C – North Outfall 9/9/2016 Dry Weather <4.0 5.3 <1.0 0.410 64,000 11,000 <10
002C – West Outfall 9/9/2016 Dry Weather <4.0 14 <1.0 0.530 33,000 320 NA
004C – Maverick Street Outfall 9/9/2016 Dry Weather <4.0 8.5 <1.0 0.410 13,000 1,000 NA
Requirements are from NPDES Permit MA0000787, issued July 31, 2007.
Discharge Limitations
Maximum Daily Report Report 6.0 to 8.5 15 mg/L 100 mg/L Report Report Report Report Report
Average Monthly Report Report 6.0 to 8.5 ---- Report Report Report Report Report Report
Source: Massport
Notes: Bold values exceed maximum daily discharge limitation.
Flow rates were estimated for outfalls 001, 002, and 004 by using the SWMM model developed for Logan Airport.
For averaging calculations, a value of zero was employed for those results measured below the laboratory detection limit. For geometric mean calculations
(fecal coliform and Enterococcus) a value of 1 was employed for those results measured below the laboratory detection limit.
1 Klebsiella is an indication of non-fecal coliform bacteria and is tested for at the North Outfall when fecal coliform concentration exceeds 5,000 cfu/100ml.
TSS Total Suspended Solids.
NA Not Analyzed.
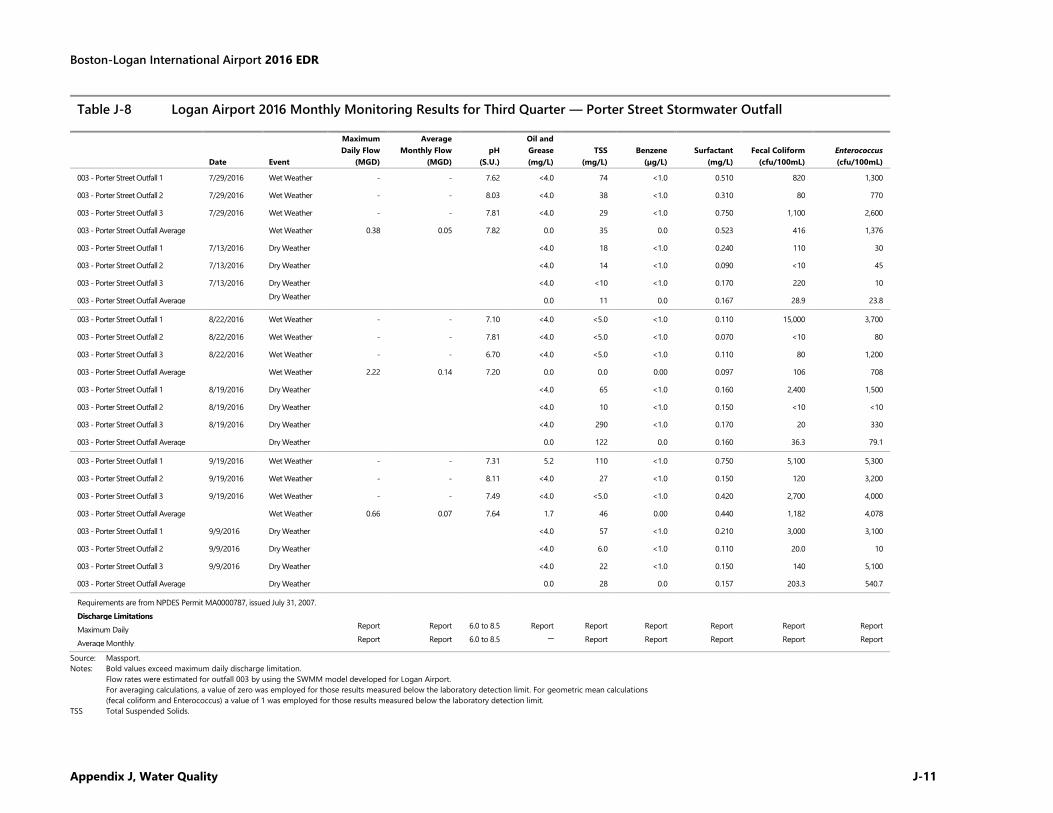
Boston-Logan International Airport 2016 EDR
Appendix J, Water Quality J-11
Table J-8 Logan Airport 2016 Monthly Monitoring Results for Third Quarter — Porter Street Stormwater Outfall
Date Event
Maximum
Daily Flow
(MGD)
Average
Monthly Flow
(MGD)
pH
(S.U.)
Oil and
Grease
(mg/L)
TSS
(mg/L)
Benzene
(µg/L)
Surfactant
(mg/L)
Fecal Coliform
(cfu/100mL)
Enterococcus
(cfu/100mL)
003 - Porter Street Outfall 1 7/29/2016 Wet Weather - - 7.62 <4.0 74 <1.0 0.510 820 1,300
003 - Porter Street Outfall 2 7/29/2016 Wet Weather - - 8.03 <4.0 38 <1.0 0.310 80 770
003 - Porter Street Outfall 3 7/29/2016 Wet Weather - - 7.81 <4.0 29 <1.0 0.750 1,100 2,600
003 - Porter Street Outfall Average Wet Weather 0.38 0.05 7.82 0.0 35 0.0 0.523 416 1,376
003 - Porter Street Outfall 1 7/13/2016 Dry Weather <4.0 18 <1.0 0.240 110 30
003 - Porter Street Outfall 2 7/13/2016 Dry Weather <4.0 14 <1.0 0.090 <10 45
003 - Porter Street Outfall 3 7/13/2016 Dry Weather <4.0 <10 <1.0 0.170 220 10
003 - Porter Street Outfall Average Dry Weather
0.0 11 0.0 0.167 28.9 23.8
003 - Porter Street Outfall 1 8/22/2016 Wet Weather - - 7.10 <4.0 <5.0 <1.0 0.110 15,000 3,700
003 - Porter Street Outfall 2 8/22/2016 Wet Weather - - 7.81 <4.0 <5.0 <1.0 0.070 <10 80
003 - Porter Street Outfall 3 8/22/2016 Wet Weather - - 6.70 <4.0 <5.0 <1.0 0.110 80 1,200
003 - Porter Street Outfall Average Wet Weather 2.22 0.14 7.20 0.0 0.0 0.00 0.097 106 708
003 - Porter Street Outfall 1 8/19/2016 Dry Weather <4.0 65 <1.0 0.160 2,400 1,500
003 - Porter Street Outfall 2 8/19/2016 Dry Weather <4.0 10 <1.0 0.150 <10 <10
003 - Porter Street Outfall 3 8/19/2016 Dry Weather <4.0 290 <1.0 0.170 20 330
003 - Porter Street Outfall Average Dry Weather 0.0 122 0.0 0.160 36.3 79.1
003 - Porter Street Outfall 1 9/19/2016 Wet Weather - - 7.31 5.2 110 <1.0 0.750 5,100 5,300
003 - Porter Street Outfall 2 9/19/2016 Wet Weather - - 8.11 <4.0 27 <1.0 0.150 120 3,200
003 - Porter Street Outfall 3 9/19/2016 Wet Weather - - 7.49 <4.0 <5.0 <1.0 0.420 2,700 4,000
003 - Porter Street Outfall Average Wet Weather 0.66 0.07 7.64 1.7 46 0.00 0.440 1,182 4,078
003 - Porter Street Outfall 1 9/9/2016 Dry Weather <4.0 57 <1.0 0.210 3,000 3,100
003 - Porter Street Outfall 2 9/9/2016 Dry Weather <4.0 6.0 <1.0 0.110 20.0 10
003 - Porter Street Outfall 3 9/9/2016 Dry Weather <4.0 22 <1.0 0.150 140 5,100
003 - Porter Street Outfall Average Dry Weather 0.0 28 0.0 0.157 203.3 540.7
Requirements are from NPDES Permit MA0000787, issued July 31, 2007.
Discharge Limitations
Maximum Daily Report Report 6.0 to 8.5 Report Report Report Report Report Report
Average Monthly Report Report 6.0 to 8.5 ─ Report Report Report Report Report
Source: Massport.
Notes: Bold values exceed maximum daily discharge limitation.
Flow rates were estimated for outfall 003 by using the SWMM model developed for Logan Airport.
For averaging calculations, a value of zero was employed for those results measured below the laboratory detection limit. For geometric mean calculations
(fecal coliform and Enterococcus) a value of 1 was employed for those results measured below the laboratory detection limit.
TSS Total Suspended Solids.
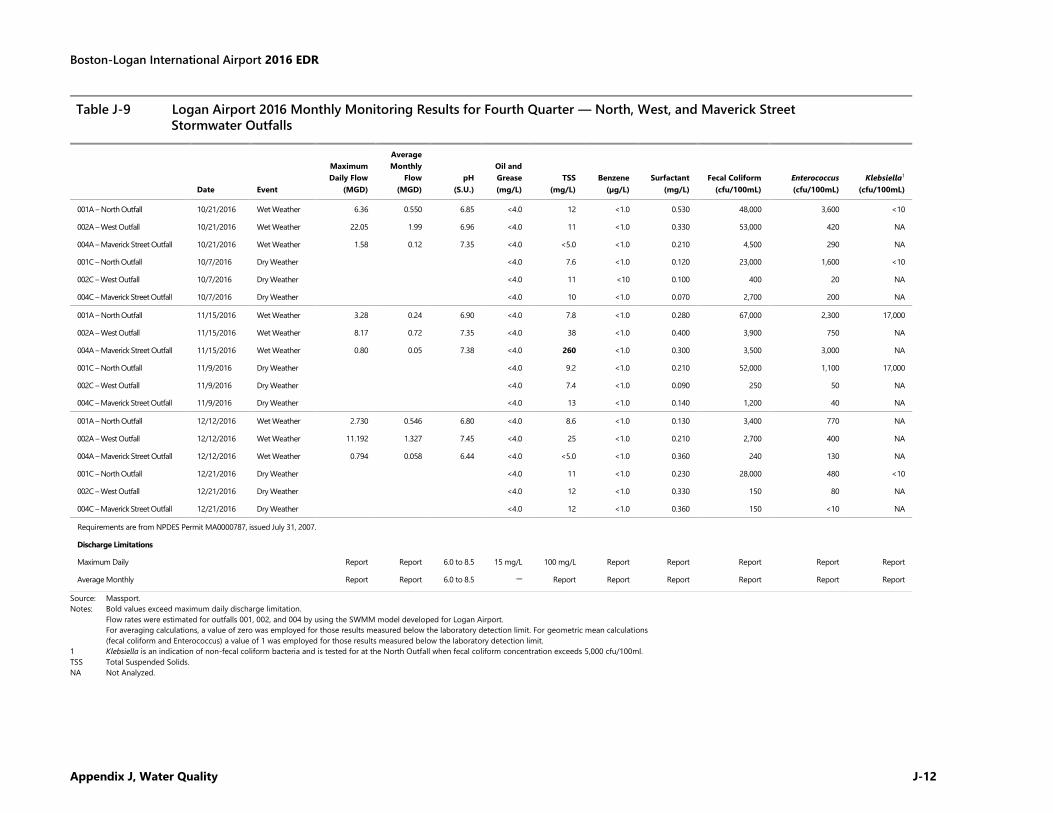
Boston-Logan International Airport 2016 EDR
Appendix J, Water Quality J-12
Source: Massport.
Notes: Bold values exceed maximum daily discharge limitation.
Flow rates were estimated for outfalls 001, 002, and 004 by using the SWMM model developed for Logan Airport.
For averaging calculations, a value of zero was employed for those results measured below the laboratory detection limit. For geometric mean calculations
(fecal coliform and Enterococcus) a value of 1 was employed for those results measured below the laboratory detection limit.
1 Klebsiella is an indication of non-fecal coliform bacteria and is tested for at the North Outfall when fecal coliform concentration exceeds 5,000 cfu/100ml.
TSS Total Suspended Solids.
NA Not Analyzed.
Table J-9 Logan Airport 2016 Monthly Monitoring Results for Fourth Quarter — North, West, and Maverick Street
Stormwater Outfalls
Date Event
Maximum
Daily Flow
(MGD)
Average
Monthly
Flow
(MGD)
pH
(S.U.)
Oil and
Grease
(mg/L)
TSS
(mg/L)
Benzene
(µg/L)
Surfactant
(mg/L)
Fecal Coliform
(cfu/100mL)
Enterococcus
(cfu/100mL)
Klebsiella1
(cfu/100mL)
001A – North Outfall 10/21/2016 Wet Weather 6.36 0.550 6.85 <4.0 12 <1.0 0.530 48,000 3,600 <10
002A – West Outfall 10/21/2016 Wet Weather 22.05 1.99 6.96 <4.0 11 <1.0 0.330 53,000 420 NA
004A – Maverick Street Outfall 10/21/2016 Wet Weather 1.58 0.12 7.35 <4.0 <5.0 <1.0 0.210 4,500 290 NA
001C – North Outfall 10/7/2016 Dry Weather <4.0 7.6 <1.0 0.120 23,000 1,600 <10
002C – West Outfall 10/7/2016 Dry Weather <4.0 11 <10 0.100 400 20 NA
004C – Maverick Street Outfall 10/7/2016 Dry Weather <4.0 10 <1.0 0.070 2,700 200 NA
001A – North Outfall 11/15/2016 Wet Weather 3.28 0.24 6.90 <4.0 7.8 <1.0 0.280 67,000 2,300 17,000
002A – West Outfall 11/15/2016 Wet Weather 8.17 0.72 7.35 <4.0 38 <1.0 0.400 3,900 750 NA
004A – Maverick Street Outfall 11/15/2016 Wet Weather 0.80 0.05 7.38 <4.0 260 <1.0 0.300 3,500 3,000 NA
001C – North Outfall 11/9/2016 Dry Weather <4.0 9.2 <1.0 0.210 52,000 1,100 17,000
002C – West Outfall 11/9/2016 Dry Weather <4.0 7.4 <1.0 0.090 250 50 NA
004C – Maverick Street Outfall 11/9/2016 Dry Weather <4.0 13 <1.0 0.140 1,200 40 NA
001A – North Outfall 12/12/2016 Wet Weather 2.730 0.546 6.80 <4.0 8.6 <1.0 0.130 3,400 770 NA
002A – West Outfall 12/12/2016 Wet Weather 11.192 1.327 7.45 <4.0 25 <1.0 0.210 2,700 400 NA
004A – Maverick Street Outfall 12/12/2016 Wet Weather 0.794 0.058 6.44 <4.0 <5.0 <1.0 0.360 240 130 NA
001C – North Outfall 12/21/2016 Dry Weather <4.0 11 <1.0 0.230 28,000 480 <10
002C – West Outfall 12/21/2016 Dry Weather <4.0 12 <1.0 0.330 150 80 NA
004C – Maverick Street Outfall 12/21/2016 Dry Weather <4.0 12 <1.0 0.360 150 <10 NA
Requirements are from NPDES Permit MA0000787, issued July 31, 2007.
Discharge Limitations
Maximum Daily Report Report 6.0 to 8.5 15 mg/L 100 mg/L Report Report Report Report Report
Average Monthly Report Report 6.0 to 8.5 ─ Report Report Report Report Report Report
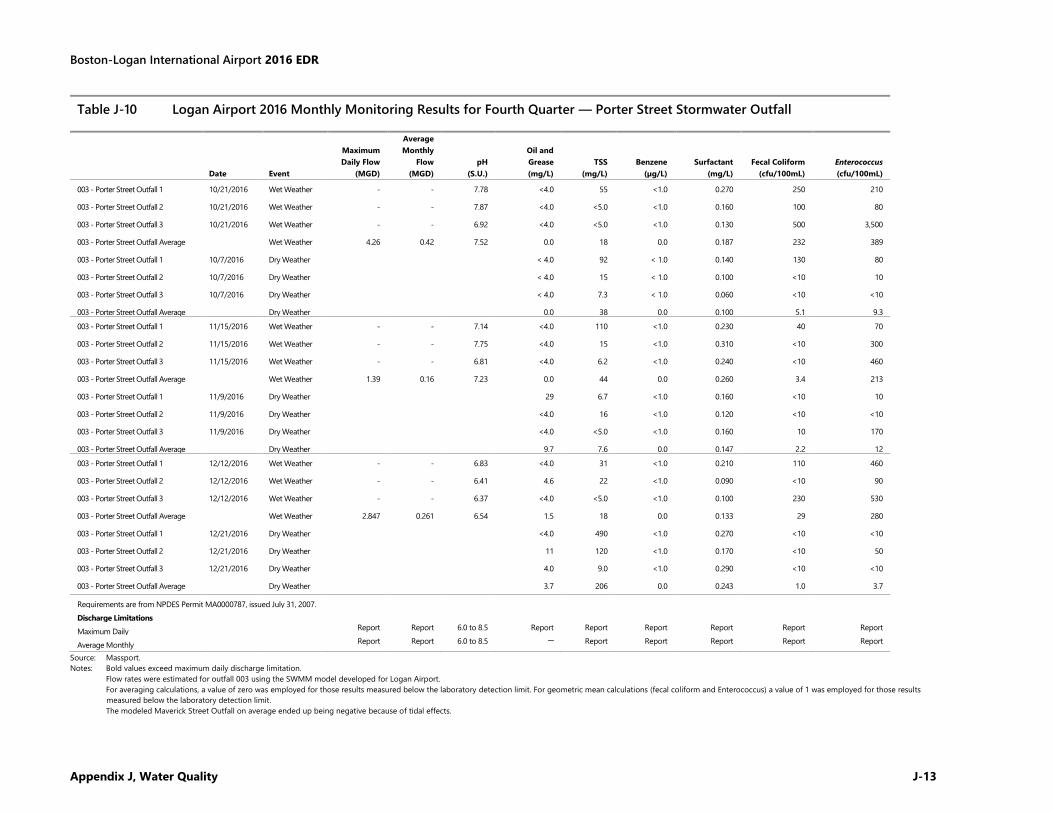
Boston-Logan International Airport 2016 EDR
Appendix J, Water Quality J-13
Table J-10 Logan Airport 2016 Monthly Monitoring Results for Fourth Quarter — Porter Street Stormwater Outfall
Date Event
Maximum
Daily Flow
(MGD)
Average
Monthly
Flow
(MGD)
pH
(S.U.)
Oil and
Grease
(mg/L)
TSS
(mg/L)
Benzene
(µg/L)
Surfactant
(mg/L)
Fecal Coliform
(cfu/100mL)
Enterococcus
(cfu/100mL)
003 - Porter Street Outfall 1 10/21/2016 Wet Weather - - 7.78 <4.0 55 <1.0 0.270 250 210
003 - Porter Street Outfall 2 10/21/2016 Wet Weather - - 7.87 <4.0 <5.0 <1.0 0.160 100 80
003 - Porter Street Outfall 3 10/21/2016 Wet Weather - - 6.92 <4.0 <5.0 <1.0 0.130 500 3,500
003 - Porter Street Outfall Average Wet Weather 4.26 0.42 7.52 0.0 18 0.0 0.187 232 389
003 - Porter Street Outfall 1 10/7/2016 Dry Weather < 4.0 92 < 1.0 0.140 130 80
003 - Porter Street Outfall 2 10/7/2016 Dry Weather < 4.0 15 < 1.0 0.100 <10 10
003 - Porter Street Outfall 3 10/7/2016 Dry Weather < 4.0 7.3 < 1.0 0.060 <10 <10
003 - Porter Street Outfall Average Dry Weather 0.0 38 0.0 0.100 5.1 9.3
003 - Porter Street Outfall 1 11/15/2016 Wet Weather - - 7.14 <4.0 110 <1.0 0.230 40 70
003 - Porter Street Outfall 2 11/15/2016 Wet Weather - - 7.75 <4.0 15 <1.0 0.310 <10 300
003 - Porter Street Outfall 3 11/15/2016 Wet Weather - - 6.81 <4.0 6.2 <1.0 0.240 <10 460
003 - Porter Street Outfall Average Wet Weather 1.39 0.16 7.23 0.0 44 0.0 0.260 3.4 213
003 - Porter Street Outfall 1 11/9/2016 Dry Weather 29 6.7 <1.0 0.160 <10 10
003 - Porter Street Outfall 2 11/9/2016 Dry Weather <4.0 16 <1.0 0.120 <10 <10
003 - Porter Street Outfall 3 11/9/2016 Dry Weather <4.0 <5.0 <1.0 0.160 10 170
003 - Porter Street Outfall Average Dry Weather 9.7 7.6 0.0 0.147 2.2 12
003 - Porter Street Outfall 1 12/12/2016 Wet Weather - - 6.83 <4.0 31 <1.0 0.210 110 460
003 - Porter Street Outfall 2 12/12/2016 Wet Weather - - 6.41 4.6 22 <1.0 0.090 <10 90
003 - Porter Street Outfall 3 12/12/2016 Wet Weather - - 6.37 <4.0 <5.0 <1.0 0.100 230 530
003 - Porter Street Outfall Average Wet Weather 2.847 0.261 6.54 1.5 18 0.0 0.133 29 280
003 - Porter Street Outfall 1 12/21/2016 Dry Weather <4.0 490 <1.0 0.270 <10 <10
003 - Porter Street Outfall 2 12/21/2016 Dry Weather 11 120 <1.0 0.170 <10 50
003 - Porter Street Outfall 3 12/21/2016 Dry Weather 4.0 9.0 <1.0 0.290 <10 <10
003 - Porter Street Outfall Average Dry Weather 3.7 206 0.0 0.243 1.0 3.7
Requirements are from NPDES Permit MA0000787, issued July 31, 2007.
Discharge Limitations
Maximum Daily Report Report 6.0 to 8.5 Report Report Report Report Report Report
Average Monthly Report Report 6.0 to 8.5 ─ Report Report Report Report Report
Source: Massport.
Notes: Bold values exceed maximum daily discharge limitation.
Flow rates were estimated for outfall 003 using the SWMM model developed for Logan Airport.
For averaging calculations, a value of zero was employed for those results measured below the laboratory detection limit. For geometric mean calculations (fecal coliform and Enterococcus) a value of 1 was employed for those results
measured below the laboratory detection limit.
The modeled Maverick Street Outfall on average ended up being negative because of tidal effects.
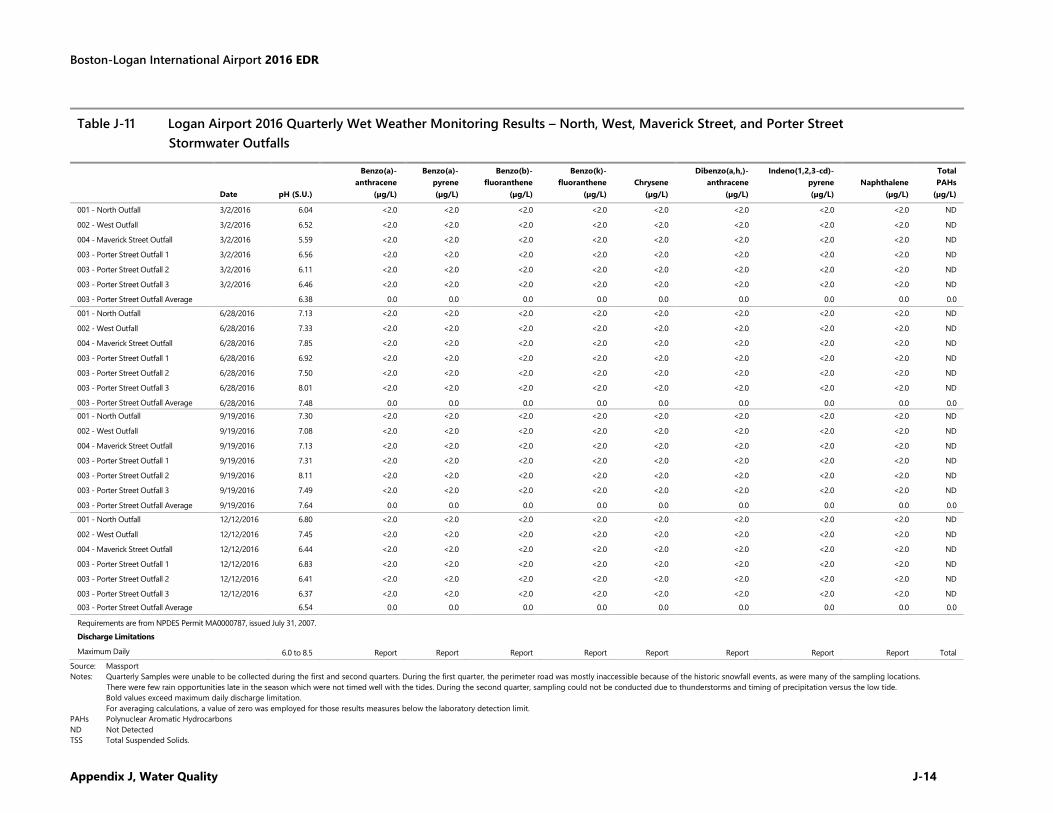
Boston-Logan International Airport 2016 EDR
Appendix J, Water Quality J-14
Source: Massport
Notes: Quarterly Samples were unable to be collected during the first and second quarters. During the first quarter, the perimeter road was mostly inaccessible because of the historic snowfall events, as were many of the sampling locations.
There were few rain opportunities late in the season which were not timed well with the tides. During the second quarter, sampling could not be conducted due to thunderstorms and timing of precipitation versus the low tide.
Bold values exceed maximum daily discharge limitation.
For averaging calculations, a value of zero was employed for those results measures below the laboratory detection limit.
PAHs Polynuclear Aromatic Hydrocarbons
ND Not Detected
TSS Total Suspended Solids.
Table J-11 Logan Airport 2016 Quarterly Wet Weather Monitoring Results – North, West, Maverick Street, and Porter Street
Stormwater Outfalls
Date
pH (S.U.)
Benzo(a)-
anthracene
(µg/L)
Benzo(a)-
pyrene
(µg/L)
Benzo(b)-
fluoranthene
(µg/L)
Benzo(k)-
fluoranthene
(µg/L)
Chrysene
(µg/L)
Dibenzo(a,h,)-
anthracene
(µg/L)
Indeno(1,2,3-cd)-
pyrene
(µg/L)
Naphthalene
(µg/L)
Total
PAHs
(µg/L)
001 - North Outfall 3/2/2016 6.04 <2.0 <2.0 <2.0 <2.0 <2.0 <2.0 <2.0 <2.0 ND
002 - West Outfall 3/2/2016 6.52 <2.0 <2.0 <2.0 <2.0 <2.0 <2.0 <2.0 <2.0 ND
004 - Maverick Street Outfall 3/2/2016 5.59 <2.0 <2.0 <2.0 <2.0 <2.0 <2.0 <2.0 <2.0 ND
003 - Porter Street Outfall 1 3/2/2016 6.56 <2.0 <2.0 <2.0 <2.0 <2.0 <2.0 <2.0 <2.0 ND
003 - Porter Street Outfall 2 3/2/2016 6.11 <2.0 <2.0 <2.0 <2.0 <2.0 <2.0 <2.0 <2.0 ND
003 - Porter Street Outfall 3 3/2/2016 6.46 <2.0 <2.0 <2.0 <2.0 <2.0 <2.0 <2.0 <2.0 ND
003 - Porter Street Outfall Average
6.38 0.0 0.0 0.0 0.0 0.0 0.0 0.0 0.0 0.0
001 - North Outfall 6/28/2016 7.13 <2.0 <2.0 <2.0 <2.0 <2.0 <2.0 <2.0 <2.0 ND
002 - West Outfall 6/28/2016 7.33 <2.0 <2.0 <2.0 <2.0 <2.0 <2.0 <2.0 <2.0 ND
004 - Maverick Street Outfall 6/28/2016 7.85 <2.0 <2.0 <2.0 <2.0 <2.0 <2.0 <2.0 <2.0 ND
003 - Porter Street Outfall 1 6/28/2016 6.92 <2.0 <2.0 <2.0 <2.0 <2.0 <2.0 <2.0 <2.0 ND
003 - Porter Street Outfall 2 6/28/2016 7.50 <2.0 <2.0 <2.0 <2.0 <2.0 <2.0 <2.0 <2.0 ND
003 - Porter Street Outfall 3 6/28/2016 8.01 <2.0 <2.0 <2.0 <2.0 <2.0 <2.0 <2.0 <2.0 ND
003 - Porter Street Outfall Average 6/28/2016 7.48 0.0 0.0 0.0 0.0 0.0 0.0 0.0 0.0 0.0
001 - North Outfall 9/19/2016 7.30 <2.0 <2.0 <2.0 <2.0 <2.0 <2.0 <2.0 <2.0 ND
002 - West Outfall 9/19/2016 7.08 <2.0 <2.0 <2.0 <2.0 <2.0 <2.0 <2.0 <2.0 ND
004 - Maverick Street Outfall 9/19/2016 7.13 <2.0 <2.0 <2.0 <2.0 <2.0 <2.0 <2.0 <2.0 ND
003 - Porter Street Outfall 1 9/19/2016 7.31 <2.0 <2.0 <2.0 <2.0 <2.0 <2.0 <2.0 <2.0 ND
003 - Porter Street Outfall 2 9/19/2016 8.11 <2.0 <2.0 <2.0 <2.0 <2.0 <2.0 <2.0 <2.0 ND
003 - Porter Street Outfall 3 9/19/2016 7.49 <2.0 <2.0 <2.0 <2.0 <2.0 <2.0 <2.0 <2.0 ND
003 - Porter Street Outfall Average 9/19/2016 7.64 0.0 0.0 0.0 0.0 0.0 0.0 0.0 0.0 0.0
001 - North Outfall 12/12/2016 6.80 <2.0 <2.0 <2.0 <2.0 <2.0 <2.0 <2.0 <2.0 ND
002 - West Outfall 12/12/2016 7.45 <2.0 <2.0 <2.0 <2.0 <2.0 <2.0 <2.0 <2.0 ND
004 - Maverick Street Outfall 12/12/2016 6.44 <2.0 <2.0 <2.0 <2.0 <2.0 <2.0 <2.0 <2.0 ND
003 - Porter Street Outfall 1 12/12/2016 6.83 <2.0 <2.0 <2.0 <2.0 <2.0 <2.0 <2.0 <2.0 ND
003 - Porter Street Outfall 2 12/12/2016 6.41 <2.0 <2.0 <2.0 <2.0 <2.0 <2.0 <2.0 <2.0 ND
003 - Porter Street Outfall 3 12/12/2016 6.37 <2.0 <2.0 <2.0 <2.0 <2.0 <2.0 <2.0 <2.0 ND
003 - Porter Street Outfall Average
6.54 0.0 0.0 0.0 0.0 0.0 0.0 0.0 0.0 0.0
Requirements are from NPDES Permit MA0000787, issued July 31, 2007.
Discharge Limitations
Maximum Daily
6.0 to 8.5 Report Report Report Report Report Report Report Report Total
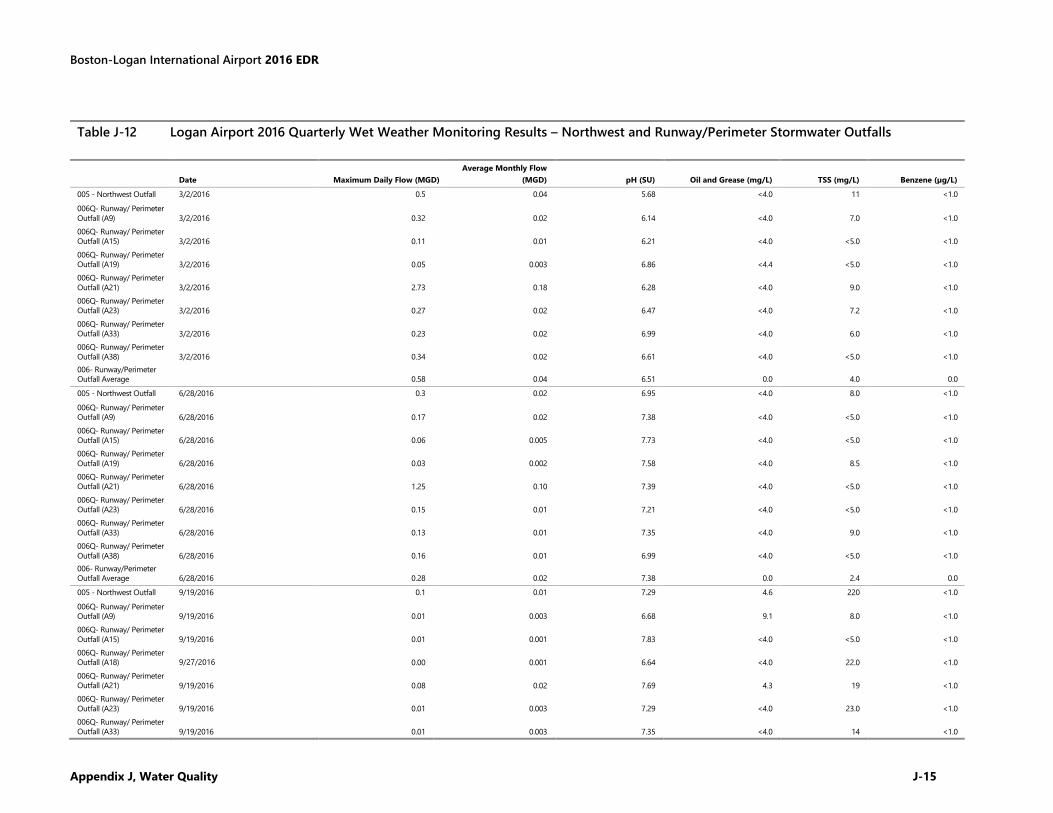
Boston-Logan International Airport 2016 EDR
Appendix J, Water Quality J-15
Table J-12 Logan Airport 2016 Quarterly Wet Weather Monitoring Results – Northwest and Runway/Perimeter Stormwater Outfalls
Date Maximum Daily Flow (MGD)
Average Monthly Flow
(MGD) pH (SU) Oil and Grease (mg/L) TSS (mg/L) Benzene (µg/L)
005 - Northwest Outfall 3/2/2016 0.5 0.04 5.68 <4.0 11 <1.0
006Q- Runway/ Perimeter
Outfall (A9) 3/2/2016 0.32 0.02 6.14 <4.0 7.0 <1.0
006Q- Runway/ Perimeter
Outfall (A15) 3/2/2016 0.11 0.01 6.21 <4.0 <5.0 <1.0
006Q- Runway/ Perimeter
Outfall (A19) 3/2/2016 0.05 0.003 6.86 <4.4 <5.0 <1.0
006Q- Runway/ Perimeter
Outfall (A21) 3/2/2016 2.73 0.18 6.28 <4.0 9.0 <1.0
006Q- Runway/ Perimeter
Outfall (A23) 3/2/2016 0.27 0.02 6.47 <4.0 7.2 <1.0
006Q- Runway/ Perimeter
Outfall (A33) 3/2/2016 0.23 0.02 6.99 <4.0 6.0 <1.0
006Q- Runway/ Perimeter
Outfall (A38) 3/2/2016 0.34 0.02 6.61 <4.0 <5.0 <1.0
006- Runway/Perimeter
Outfall Average 0.58 0.04 6.51 0.0 4.0 0.0
005 - Northwest Outfall 6/28/2016 0.3 0.02 6.95 <4.0 8.0 <1.0
006Q- Runway/ Perimeter
Outfall (A9) 6/28/2016 0.17 0.02 7.38 <4.0 <5.0 <1.0
006Q- Runway/ Perimeter
Outfall (A15) 6/28/2016 0.06 0.005 7.73 <4.0 <5.0 <1.0
006Q- Runway/ Perimeter
Outfall (A19) 6/28/2016 0.03 0.002 7.58 <4.0 8.5 <1.0
006Q- Runway/ Perimeter
Outfall (A21) 6/28/2016 1.25 0.10 7.39 <4.0 <5.0 <1.0
006Q- Runway/ Perimeter
Outfall (A23) 6/28/2016 0.15 0.01 7.21 <4.0 <5.0 <1.0
006Q- Runway/ Perimeter
Outfall (A33) 6/28/2016 0.13 0.01 7.35 <4.0 9.0 <1.0
006Q- Runway/ Perimeter
Outfall (A38) 6/28/2016 0.16 0.01 6.99 <4.0 <5.0 <1.0
006- Runway/Perimeter
Outfall Average 6/28/2016 0.28 0.02 7.38 0.0 2.4 0.0
005 - Northwest Outfall 9/19/2016 0.1 0.01 7.29 4.6 220 <1.0
006Q- Runway/ Perimeter
Outfall (A9) 9/19/2016 0.01 0.003 6.68 9.1 8.0 <1.0
006Q- Runway/ Perimeter
Outfall (A15) 9/19/2016 0.01 0.001 7.83 <4.0 <5.0 <1.0
006Q- Runway/ Perimeter
Outfall (A18) 9/27/2016 0.00 0.001 6.64 <4.0 22.0 <1.0
006Q- Runway/ Perimeter
Outfall (A21) 9/19/2016 0.08 0.02 7.69 4.3 19 <1.0
006Q- Runway/ Perimeter
Outfall (A23) 9/19/2016 0.01 0.003 7.29 <4.0 23.0 <1.0
006Q- Runway/ Perimeter
Outfall (A33) 9/19/2016 0.01 0.003 7.35 <4.0 14 <1.0
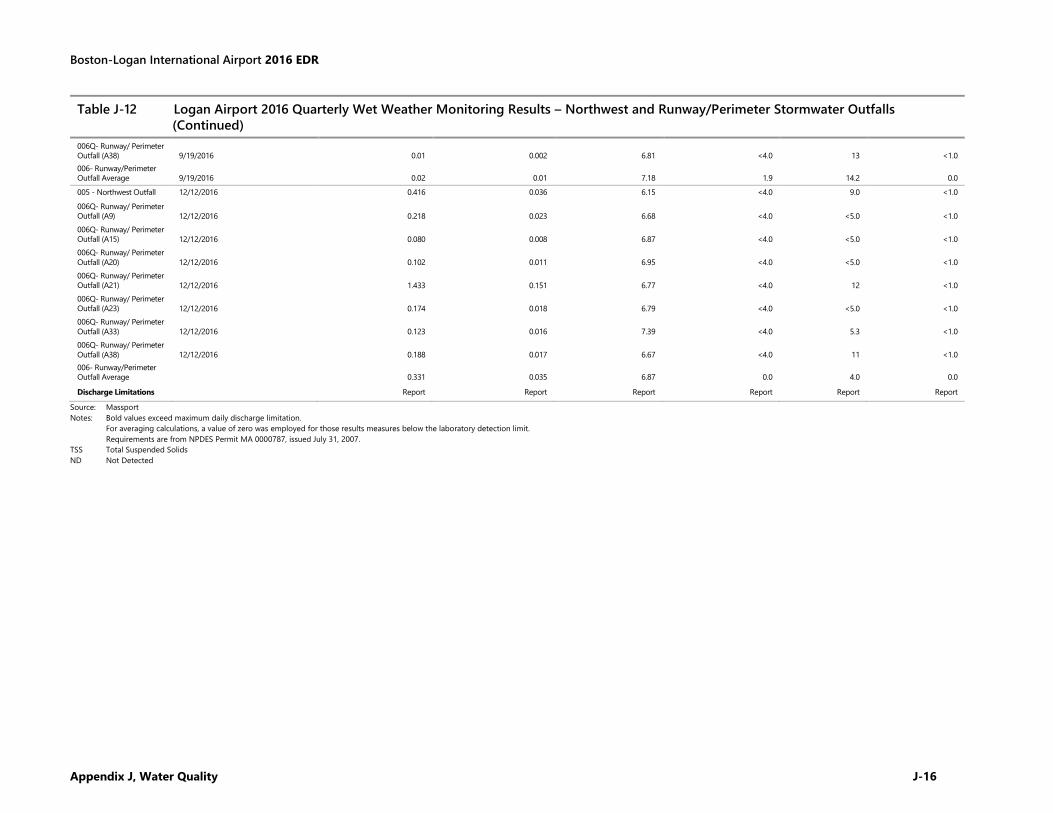
Boston-Logan International Airport 2016 EDR
Appendix J, Water Quality J-16
Table J-12 Logan Airport 2016 Quarterly Wet Weather Monitoring Results – Northwest and Runway/Perimeter Stormwater Outfalls
(Continued)
006Q- Runway/ Perimeter
Outfall (A38) 9/19/2016 0.01 0.002 6.81 <4.0 13 <1.0
006- Runway/Perimeter
Outfall Average 9/19/2016 0.02 0.01 7.18 1.9 14.2 0.0
005 - Northwest Outfall 12/12/2016 0.416 0.036 6.15 <4.0 9.0 <1.0
006Q- Runway/ Perimeter
Outfall (A9) 12/12/2016 0.218 0.023 6.68 <4.0 <5.0 <1.0
006Q- Runway/ Perimeter
Outfall (A15) 12/12/2016 0.080 0.008 6.87 <4.0 <5.0 <1.0
006Q- Runway/ Perimeter
Outfall (A20) 12/12/2016 0.102 0.011 6.95 <4.0 <5.0 <1.0
006Q- Runway/ Perimeter
Outfall (A21) 12/12/2016 1.433 0.151 6.77 <4.0 12 <1.0
006Q- Runway/ Perimeter
Outfall (A23) 12/12/2016 0.174 0.018 6.79 <4.0 <5.0 <1.0
006Q- Runway/ Perimeter
Outfall (A33) 12/12/2016 0.123 0.016 7.39 <4.0 5.3 <1.0
006Q- Runway/ Perimeter
Outfall (A38) 12/12/2016 0.188 0.017 6.67 <4.0 11 <1.0
006- Runway/Perimeter
Outfall Average 0.331 0.035 6.87 0.0 4.0 0.0
Discharge Limitations Report Report Report Report Report Report
Source: Massport
Notes: Bold values exceed maximum daily discharge limitation.
For averaging calculations, a value of zero was employed for those results measures below the laboratory detection limit.
Requirements are from NPDES Permit MA 0000787, issued July 31, 2007.
TSS Total Suspended Solids
ND Not Detected
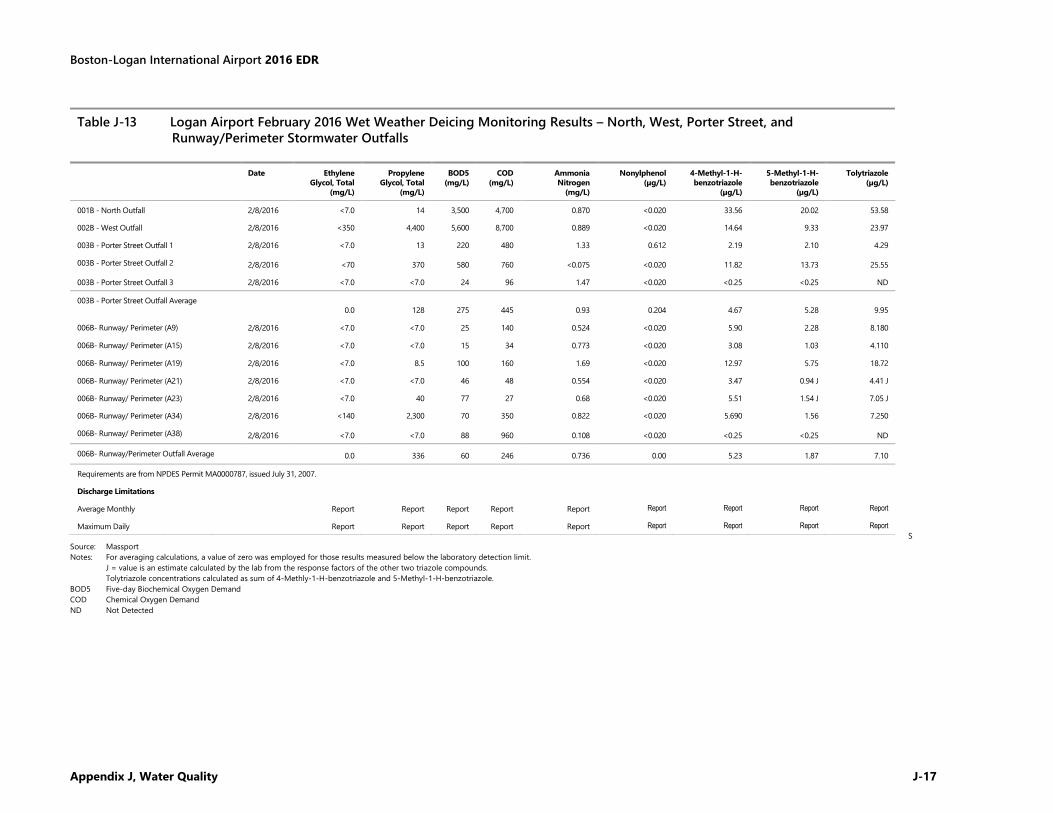
Boston-Logan International Airport 2016 EDR
Appendix J, Water Quality J-17
S
Source: Massport
Notes: For averaging calculations, a value of zero was employed for those results measured below the laboratory detection limit.
J = value is an estimate calculated by the lab from the response factors of the other two triazole compounds.
Tolytriazole concentrations calculated as sum of 4-Methly-1-H-benzotriazole and 5-Methyl-1-H-benzotriazole.
BOD5 Five-day Biochemical Oxygen Demand
COD Chemical Oxygen Demand
ND Not Detected
Table J-13 Logan Airport February 2016 Wet Weather Deicing Monitoring Results – North, West, Porter Street, and
Runway/Perimeter Stormwater Outfalls
Date Ethylene
Glycol, Total
(mg/L)
Propylene
Glycol, Total
(mg/L)
BOD5
(mg/L)
COD
(mg/L)
Ammonia
Nitrogen
(mg/L)
Nonylphenol
(µg/L)
4-Methyl-1-H-
benzotriazole
(µg/L)
5-Methyl-1-H-
benzotriazole
(µg/L)
Tolytriazole
(µg/L)
001B - North Outfall 2/8/2016 <7.0 14 3,500 4,700 0.870 <0.020 33.56 20.02 53.58
002B - West Outfall 2/8/2016 <350 4,400 5,600 8,700 0.889 <0.020 14.64 9.33 23.97
003B - Porter Street Outfall 1 2/8/2016 <7.0 13 220 480 1.33 0.612 2.19 2.10 4.29
003B - Porter Street Outfall 2 2/8/2016 <70 370 580 760 <0.075 <0.020 11.82 13.73 25.55
003B - Porter Street Outfall 3 2/8/2016 <7.0 <7.0 24 96 1.47 <0.020 <0.25 <0.25 ND
003B - Porter Street Outfall Average
0.0 128 275 445 0.93 0.204 4.67 5.28 9.95
006B- Runway/ Perimeter (A9) 2/8/2016 <7.0 <7.0 25 140 0.524 <0.020 5.90 2.28 8.180
006B- Runway/ Perimeter (A15) 2/8/2016 <7.0 <7.0 15 34 0.773 <0.020 3.08 1.03 4.110
006B- Runway/ Perimeter (A19) 2/8/2016 <7.0 8.5 100 160 1.69 <0.020 12.97 5.75 18.72
006B- Runway/ Perimeter (A21) 2/8/2016 <7.0 <7.0 46 48 0.554 <0.020 3.47 0.94 J 4.41 J
006B- Runway/ Perimeter (A23) 2/8/2016 <7.0 40 77 27 0.68 <0.020 5.51 1.54 J 7.05 J
006B- Runway/ Perimeter (A34) 2/8/2016 <140 2,300 70 350 0.822 <0.020 5.690 1.56 7.250
006B- Runway/ Perimeter (A38) 2/8/2016 <7.0 <7.0 88 960 0.108 <0.020 <0.25 <0.25 ND
006B- Runway/Perimeter Outfall Average 0.0 336 60 246 0.736 0.00 5.23 1.87 7.10
Requirements are from NPDES Permit MA0000787, issued July 31, 2007.
Discharge Limitations
Average Monthly Report Report Report Report Report Report Report Report Report
Maximum Daily Report Report Report Report Report Report Report Report Report
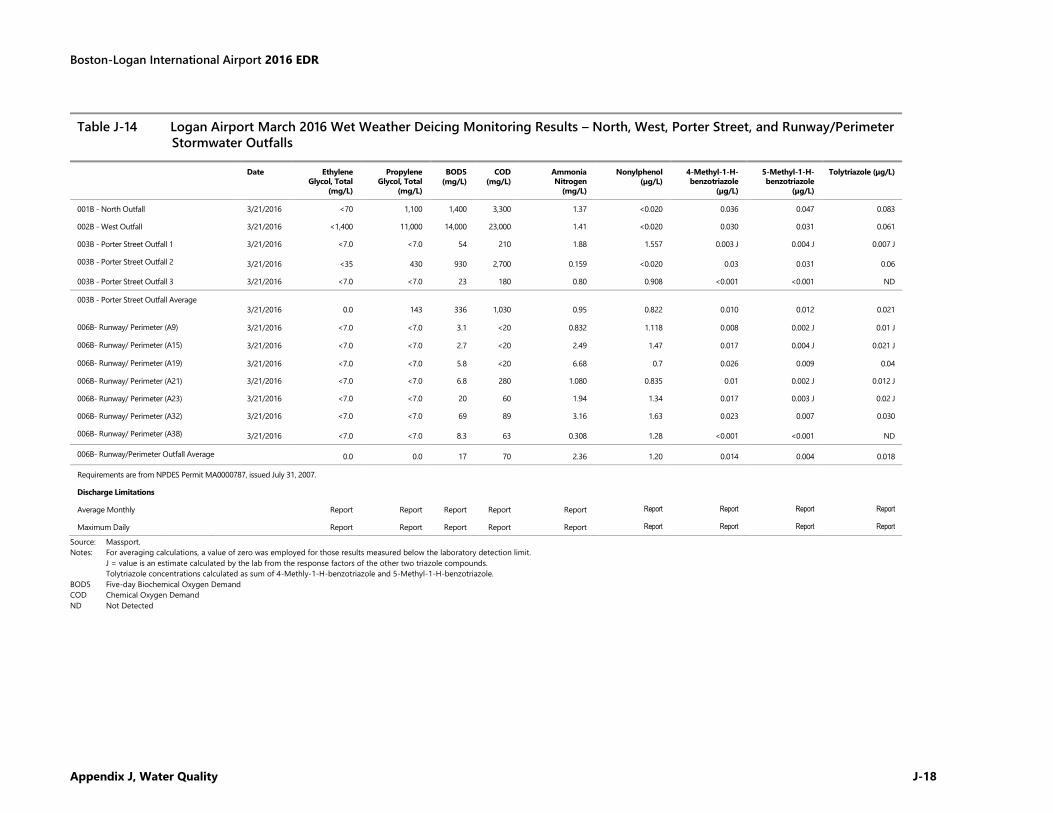
Boston-Logan International Airport 2016 EDR
Appendix J, Water Quality J-18
Source: Massport.
Notes: For averaging calculations, a value of zero was employed for those results measured below the laboratory detection limit.
J = value is an estimate calculated by the lab from the response factors of the other two triazole compounds.
Tolytriazole concentrations calculated as sum of 4-Methly-1-H-benzotriazole and 5-Methyl-1-H-benzotriazole.
BOD5 Five-day Biochemical Oxygen Demand
COD Chemical Oxygen Demand
ND Not Detected
Table J-14 Logan Airport March 2016 Wet Weather Deicing Monitoring Results – North, West, Porter Street, and Runway/Perimeter
Stormwater Outfalls
Date Ethylene
Glycol, Total
(mg/L)
Propylene
Glycol, Total
(mg/L)
BOD5
(mg/L)
COD
(mg/L)
Ammonia
Nitrogen
(mg/L)
Nonylphenol
(µg/L)
4-Methyl-1-H-
benzotriazole
(µg/L)
5-Methyl-1-H-
benzotriazole
(µg/L)
Tolytriazole (µg/L)
001B - North Outfall 3/21/2016 <70 1,100 1,400 3,300 1.37 <0.020 0.036 0.047 0.083
002B - West Outfall 3/21/2016 <1,400 11,000 14,000 23,000 1.41 <0.020 0.030 0.031 0.061
003B - Porter Street Outfall 1 3/21/2016 <7.0 <7.0 54 210 1.88 1.557 0.003 J 0.004 J 0.007 J
003B - Porter Street Outfall 2 3/21/2016 <35 430 930 2,700 0.159 <0.020 0.03 0.031 0.06
003B - Porter Street Outfall 3 3/21/2016 <7.0 <7.0 23 180 0.80 0.908 <0.001 <0.001 ND
003B - Porter Street Outfall Average
3/21/2016 0.0 143 336 1,030 0.95 0.822 0.010 0.012 0.021
006B- Runway/ Perimeter (A9) 3/21/2016 <7.0 <7.0 3.1 <20 0.832 1.118 0.008 0.002 J 0.01 J
006B- Runway/ Perimeter (A15) 3/21/2016 <7.0 <7.0 2.7 <20 2.49 1.47 0.017 0.004 J 0.021 J
006B- Runway/ Perimeter (A19) 3/21/2016 <7.0 <7.0 5.8 <20 6.68 0.7 0.026 0.009 0.04
006B- Runway/ Perimeter (A21) 3/21/2016 <7.0 <7.0 6.8 280 1.080 0.835 0.01 0.002 J 0.012 J
006B- Runway/ Perimeter (A23) 3/21/2016 <7.0 <7.0 20 60 1.94 1.34 0.017 0.003 J 0.02 J
006B- Runway/ Perimeter (A32) 3/21/2016 <7.0 <7.0 69 89 3.16 1.63 0.023 0.007 0.030
006B- Runway/ Perimeter (A38) 3/21/2016 <7.0 <7.0 8.3 63 0.308 1.28 <0.001 <0.001 ND
006B- Runway/Perimeter Outfall Average 0.0 0.0 17 70 2.36 1.20 0.014 0.004 0.018
Requirements are from NPDES Permit MA0000787, issued July 31, 2007.
Discharge Limitations
Average Monthly Report Report Report Report Report Report Report Report Report
Maximum Daily Report Report Report Report Report Report Report Report Report
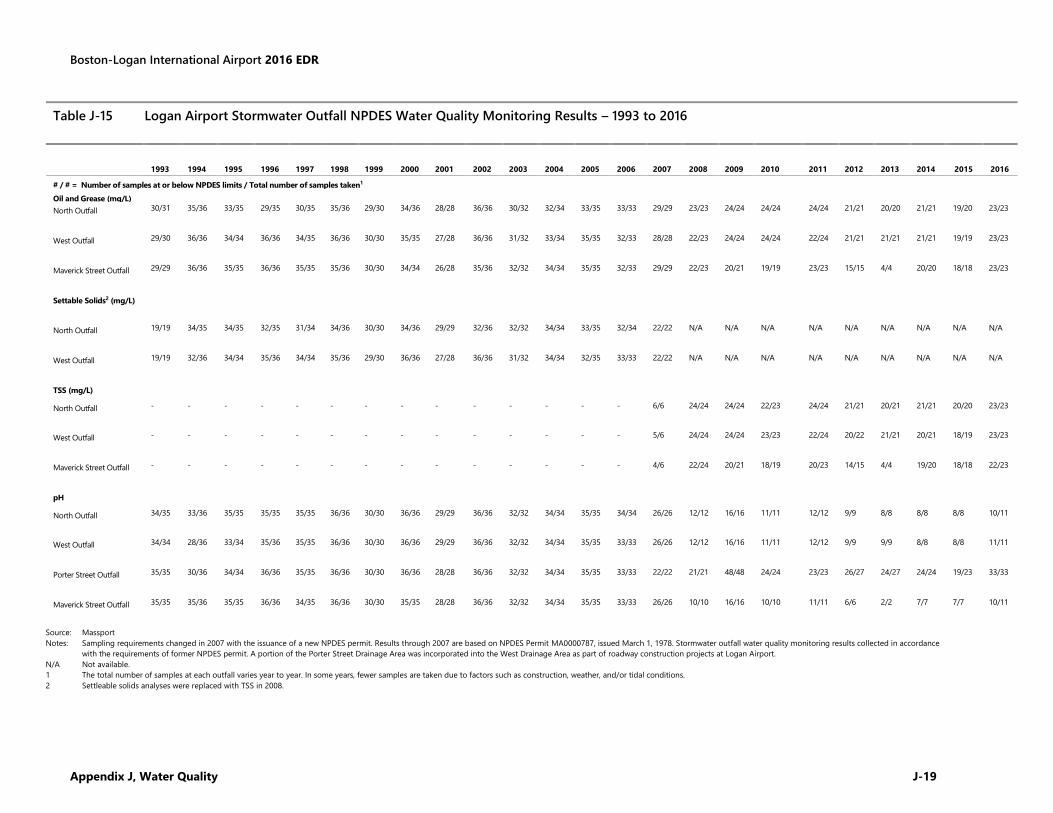
Boston-Logan International Airport 2016 EDR
Appendix J, Water Quality J-19
Source: Massport
Notes: Sampling requirements changed in 2007 with the issuance of a new NPDES permit. Results through 2007 are based on NPDES Permit MA0000787, issued March 1, 1978. Stormwater outfall water quality monitoring results collected in accordance
with the requirements of former NPDES permit. A portion of the Porter Street Drainage Area was incorporated into the West Drainage Area as part of roadway construction projects at Logan Airport.
N/A Not available.
1 The total number of samples at each outfall varies year to year. In some years, fewer samples are taken due to factors such as construction, weather, and/or tidal conditions.
2 Settleable solids analyses were replaced with TSS in 2008.
Table J-15 Logan Airport Stormwater Outfall NPDES Water Quality Monitoring Results – 1993 to 2016
1993 1994 1995 1996 1997 1998 1999 2000 2001 2002 2003 2004 2005 2006 2007 2008 2009 2010 2011 2012 2013 2014 2015 2016
# / # = Number of samples at or below NPDES limits / Total number of samples taken1
Oil and Grease (mg/L)
North Outfall 30/31 35/36 33/35 29/35 30/35 35/36 29/30 34/36 28/28 36/36 30/32 32/34 33/35 33/33 29/29 23/23 24/24 24/24 24/24 21/21 20/20 21/21 19/20 23/23
West Outfall 29/30 36/36 34/34 36/36 34/35 36/36 30/30 35/35 27/28 36/36 31/32 33/34 35/35 32/33 28/28 22/23 24/24 24/24 22/24 21/21 21/21 21/21 19/19 23/23
Maverick Street Outfall 29/29 36/36 35/35 36/36 35/35 35/36 30/30 34/34 26/28 35/36 32/32 34/34 35/35 32/33 29/29 22/23 20/21 19/19 23/23 15/15 4/4 20/20 18/18 23/23
Settable Solids2 (mg/L)
North Outfall 19/19 34/35 34/35 32/35 31/34 34/36 30/30 34/36 29/29 32/36 32/32 34/34 33/35 32/34 22/22 N/A N/A N/A N/A N/A N/A N/A N/A N/A
West Outfall 19/19 32/36 34/34 35/36 34/34 35/36 29/30 36/36 27/28 36/36 31/32 34/34 32/35 33/33 22/22 N/A N/A N/A N/A N/A N/A N/A N/A N/A
TSS (mg/L)
North Outfall - - - - - - - - - - - - - - 6/6 24/24 24/24 22/23 24/24 21/21 20/21 21/21 20/20 23/23
West Outfall - - - - - - - - - - - - - - 5/6 24/24 24/24 23/23 22/24 20/22 21/21 20/21 18/19 23/23
Maverick Street Outfall - - - - - - - - - - - - - - 4/6 22/24 20/21 18/19 20/23 14/15 4/4 19/20 18/18 22/23
pH
North Outfall 34/35 33/36 35/35 35/35 35/35 36/36 30/30 36/36 29/29 36/36 32/32 34/34 35/35 34/34 26/26 12/12 16/16 11/11 12/12 9/9 8/8 8/8 8/8 10/11
West Outfall 34/34 28/36 33/34 35/36 35/35 36/36 30/30 36/36 29/29 36/36 32/32 34/34 35/35 33/33 26/26 12/12 16/16 11/11 12/12 9/9 9/9 8/8 8/8 11/11
Porter Street Outfall 35/35 30/36 34/34 36/36 35/35 36/36 30/30 36/36 28/28 36/36 32/32 34/34 35/35 33/33 22/22 21/21 48/48 24/24 23/23 26/27 24/27 24/24 19/23 33/33
Maverick Street Outfall 35/35 35/36 35/35 36/36 34/35 36/36 30/30 35/35 28/28 36/36 32/32 34/34 35/35 33/33 26/26 10/10 16/16 10/10 11/11 6/6 2/2 7/7 7/7 10/11
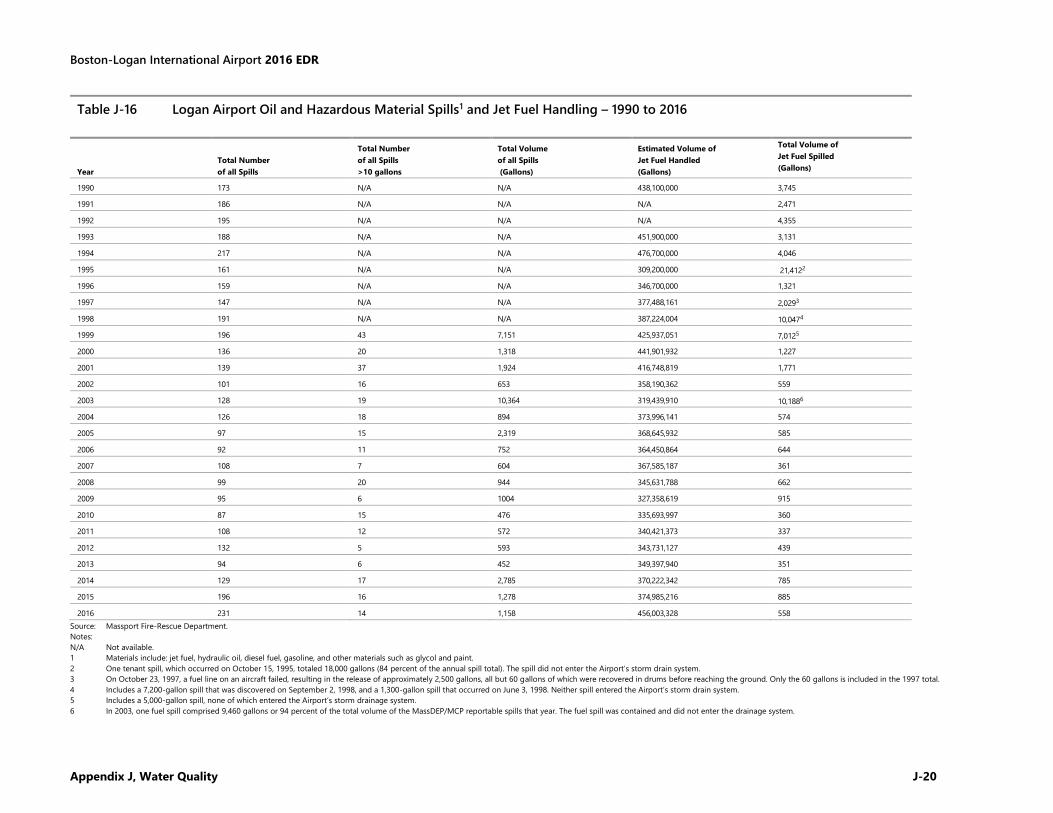
Boston-Logan International Airport 2016 EDR
Appendix J, Water Quality J-20
Table J-16 Logan Airport Oil and Hazardous Material Spills1 and Jet Fuel Handling – 1990 to 2016
Year
Total Number
of all Spills
Total Number
of all Spills
>10 gallons
Total Volume
of all Spills
(Gallons)
Estimated Volume of
Jet Fuel Handled
(Gallons)
Total Volume of
Jet Fuel Spilled
(Gallons)
1990 173 N/A N/A 438,100,000 3,745
1991 186 N/A N/A N/A 2,471
1992 195 N/A N/A N/A 4,355
1993 188 N/A N/A 451,900,000 3,131
1994 217 N/A N/A 476,700,000 4,046
1995 161 N/A N/A 309,200,000 21,4122
1996 159 N/A N/A 346,700,000 1,321
1997 147 N/A N/A 377,488,161 2,0293
1998 191 N/A N/A 387,224,004 10,0474
1999 196 43 7,151 425,937,051 7,0125
2000 136 20 1,318 441,901,932 1,227
2001 139 37 1,924 416,748,819 1,771
2002 101 16 653 358,190,362 559
2003 128 19 10,364 319,439,910 10,1886
2004 126 18 894 373,996,141 574
2005 97 15 2,319 368,645,932 585
2006 92 11 752 364,450,864 644
2007 108 7 604 367,585,187 361
2008 99 20 944 345,631,788 662
2009 95 6 1004 327,358,619 915
2010 87 15 476 335,693,997 360
2011 108 12 572 340,421,373 337
2012 132 5 593 343,731,127 439
2013 94 6 452 349,397,940 351
2014 129 17 2,785 370,222,342 785
2015 196 16 1,278 374,985,216 885
2016 231 14 1,158 456,003,328 558
Source: Massport Fire-Rescue Department.
Notes:
N/A Not available.
1 Materials include: jet fuel, hydraulic oil, diesel fuel, gasoline, and other materials such as glycol and paint.
2 One tenant spill, which occurred on October 15, 1995, totaled 18,000 gallons (84 percent of the annual spill total). The spill did not enter the Airport’s storm drain system.
3 On October 23, 1997, a fuel line on an aircraft failed, resulting in the release of approximately 2,500 gallons, all but 60 gallons of which were recovered in drums before reaching the ground. Only the 60 gallons is included in the 1997 total.
4 Includes a 7,200-gallon spill that was discovered on September 2, 1998, and a 1,300-gallon spill that occurred on June 3, 1998. Neither spill entered the Airport’s storm drain system.
5 Includes a 5,000-gallon spill, none of which entered the Airport’s storm drainage system.
6 In 2003, one fuel spill comprised 9,460 gallons or 94 percent of the total volume of the MassDEP/MCP reportable spills that year. The fuel spill was contained and did not enter the drainage system.
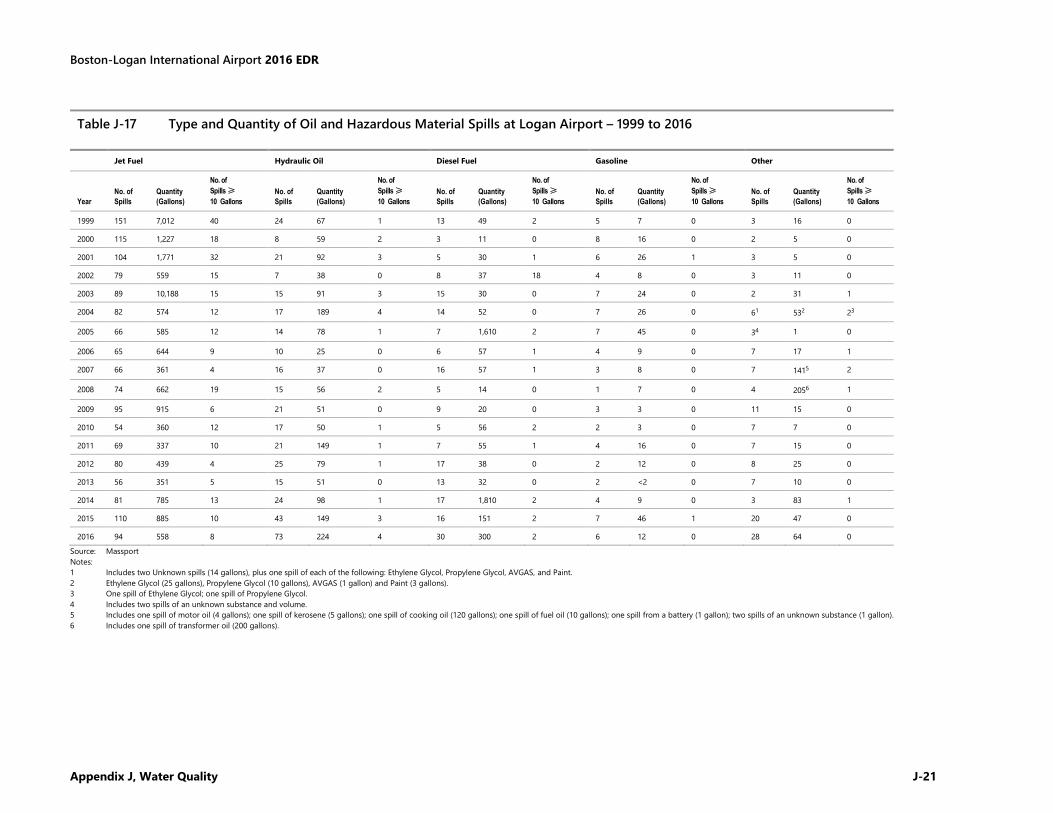
Boston-Logan International Airport 2016 EDR
Appendix J, Water Quality J-21
Table J-17 Type and Quantity of Oil and Hazardous Material Spills at Logan Airport – 1999 to 2016
Jet Fuel Hydraulic Oil Diesel Fuel Gasoline Other
Year
No. of
Spills
Quantity
(Gallons)
No. of
Spills ≥
10 Gallons
No. of
Spills
Quantity
(Gallons)
No. of
Spills ≥
10 Gallons
No. of
Spills
Quantity
(Gallons)
No. of
Spills ≥
10 Gallons
No. of
Spills
Quantity
(Gallons)
No. of
Spills ≥
10 Gallons
No. of
Spills
Quantity
(Gallons)
No. of
Spills ≥
10 Gallons
1999 151 7,012 40 24 67 1 13 49 2 5 7 0 3 16 0
2000 115 1,227 18 8 59 2 3 11 0 8 16 0 2 5 0
2001 104 1,771 32 21 92 3 5 30 1 6 26 1 3 5 0
2002 79 559 15 7 38 0 8 37 18 4 8 0 3 11 0
2003 89 10,188 15 15 91 3 15 30 0 7 24 0 2 31 1
2004 82 574 12 17 189 4 14 52 0 7 26 0 61 532 23
2005 66 585 12 14 78 1 7 1,610 2 7 45 0 34 1 0
2006 65 644 9 10 25 0 6 57 1 4 9 0 7 17 1
2007 66 361 4 16 37 0 16 57 1 3 8 0 7 1415 2
2008 74 662 19 15 56 2 5 14 0 1 7 0 4 2056 1
2009 95 915 6 21 51 0 9 20 0 3 3 0 11 15 0
2010 54 360 12 17 50 1 5 56 2 2 3 0 7 7 0
2011 69 337 10 21 149 1 7 55 1 4 16 0 7 15 0
2012 80 439 4 25 79 1 17 38 0 2 12 0 8 25 0
2013 56 351 5 15 51 0 13 32 0 2 <2 0 7 10 0
2014 81 785 13 24 98 1 17 1,810 2 4 9 0 3 83 1
2015 110 885 10 43 149 3 16 151 2 7 46 1 20 47 0
2016 94 558 8 73 224 4 30 300 2 6 12 0 28 64 0
Source: Massport
Notes:
1 Includes two Unknown spills (14 gallons), plus one spill of each of the following: Ethylene Glycol, Propylene Glycol, AVGAS, and Paint.
2 Ethylene Glycol (25 gallons), Propylene Glycol (10 gallons), AVGAS (1 gallon) and Paint (3 gallons).
3 One spill of Ethylene Glycol; one spill of Propylene Glycol.
4 Includes two spills of an unknown substance and volume.
5 Includes one spill of motor oil (4 gallons); one spill of kerosene (5 gallons); one spill of cooking oil (120 gallons); one spill of fuel oil (10 gallons); one spill from a battery (1 gallon); two spills of an unknown substance (1 gallon).
6 Includes one spill of transformer oil (200 gallons).
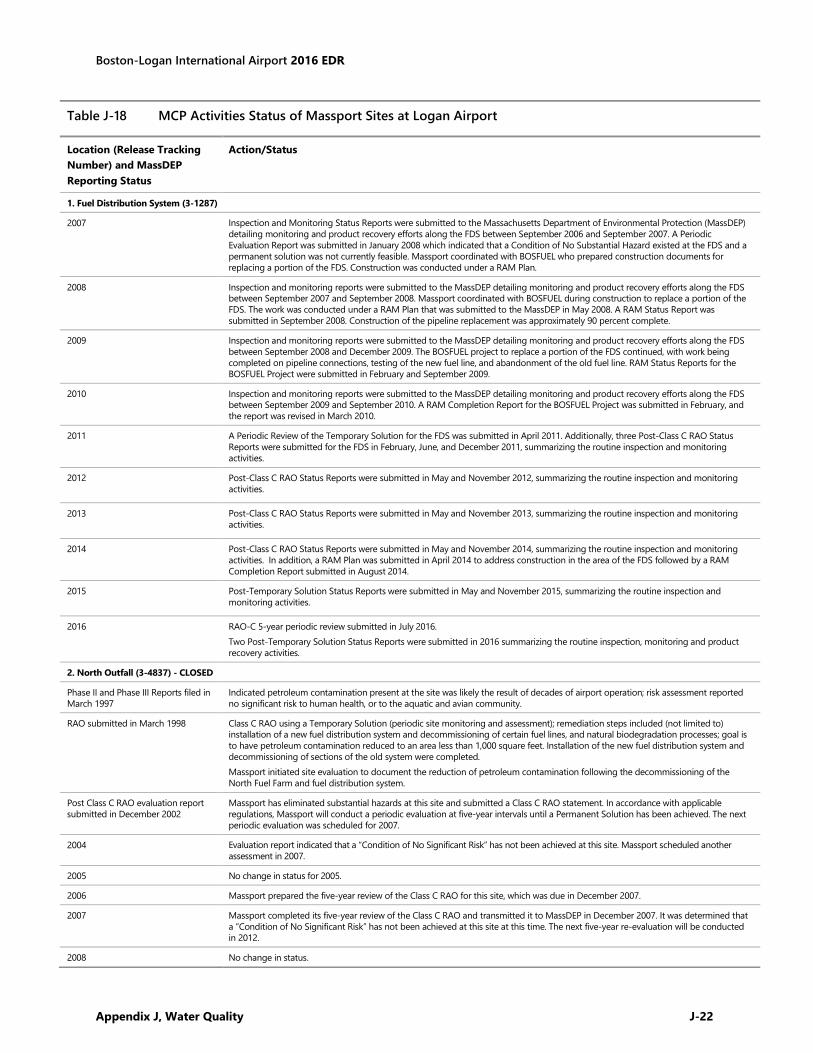
Boston-Logan International Airport 2016 EDR
Appendix J, Water Quality J-22
Table J-18 MCP Activities Status of Massport Sites at Logan Airport
Location (Release Tracking
Number) and MassDEP
Reporting Status
Action/Status
1. Fuel Distribution System (3-1287)
2007 Inspection and Monitoring Status Reports were submitted to the Massachusetts Department of Environmental Protection (MassDEP)
detailing monitoring and product recovery efforts along the FDS between September 2006 and September 2007. A Periodic
Evaluation Report was submitted in January 2008 which indicated that a Condition of No Substantial Hazard existed at the FDS and a
permanent solution was not currently feasible. Massport coordinated with BOSFUEL who prepared construction documents for
replacing a portion of the FDS. Construction was conducted under a RAM Plan.
2008 Inspection and monitoring reports were submitted to the MassDEP detailing monitoring and product recovery efforts along the FDS
between September 2007 and September 2008. Massport coordinated with BOSFUEL during construction to replace a portion of the
FDS. The work was conducted under a RAM Plan that was submitted to the MassDEP in May 2008. A RAM Status Report was
submitted in September 2008. Construction of the pipeline replacement was approximately 90 percent complete.
2009 Inspection and monitoring reports were submitted to the MassDEP detailing monitoring and product recovery efforts along the FDS
between September 2008 and December 2009. The BOSFUEL project to replace a portion of the FDS continued, with work being
completed on pipeline connections, testing of the new fuel line, and abandonment of the old fuel line. RAM Status Reports for the
BOSFUEL Project were submitted in February and September 2009.
2010 Inspection and monitoring reports were submitted to the MassDEP detailing monitoring and product recovery efforts along the FDS
between September 2009 and September 2010. A RAM Completion Report for the BOSFUEL Project was submitted in February, and
the report was revised in March 2010.
2011 A Periodic Review of the Temporary Solution for the FDS was submitted in April 2011. Additionally, three Post-Class C RAO Status
Reports were submitted for the FDS in February, June, and December 2011, summarizing the routine inspection and monitoring
activities.
2012 Post-Class C RAO Status Reports were submitted in May and November 2012, summarizing the routine inspection and monitoring
activities.
2013 Post-Class C RAO Status Reports were submitted in May and November 2013, summarizing the routine inspection and monitoring
activities.
2014 Post-Class C RAO Status Reports were submitted in May and November 2014, summarizing the routine inspection and monitoring
activities. In addition, a RAM Plan was submitted in April 2014 to address construction in the area of the FDS followed by a RAM
Completion Report submitted in August 2014.
2015 Post-Temporary Solution Status Reports were submitted in May and November 2015, summarizing the routine inspection and
monitoring activities.
2016 RAO-C 5-year periodic review submitted in July 2016.
Two Post-Temporary Solution Status Reports were submitted in 2016 summarizing the routine inspection, monitoring and product
recovery activities.
2. North Outfall (3-4837) - CLOSED
Phase II and Phase III Reports filed in
March 1997
Indicated petroleum contamination present at the site was likely the result of decades of airport operation; risk assessment reported
no significant risk to human health, or to the aquatic and avian community.
RAO submitted in March 1998 Class C RAO using a Temporary Solution (periodic site monitoring and assessment); remediation steps included (not limited to)
installation of a new fuel distribution system and decommissioning of certain fuel lines, and natural biodegradation processes; goal is
to have petroleum contamination reduced to an area less than 1,000 square feet. Installation of the new fuel distribution system and
decommissioning of sections of the old system were completed.
Massport initiated site evaluation to document the reduction of petroleum contamination following the decommissioning of the
North Fuel Farm and fuel distribution system.
Post Class C RAO evaluation report
submitted in December 2002
Massport has eliminated substantial hazards at this site and submitted a Class C RAO statement. In accordance with applicable
regulations, Massport will conduct a periodic evaluation at five-year intervals until a Permanent Solution has been achieved. The next
periodic evaluation was scheduled for 2007.
2004 Evaluation report indicated that a “Condition of No Significant Risk” has not been achieved at this site. Massport scheduled another
assessment in 2007.
2005 No change in status for 2005.
2006 Massport prepared the five-year review of the Class C RAO for this site, which was due in December 2007.
2007 Massport completed its five-year review of the Class C RAO and transmitted it to MassDEP in December 2007. It was determined that
a “Condition of No Significant Risk” has not been achieved at this site at this time. The next five-year re-evaluation will be conducted
in 2012.
2008 No change in status.
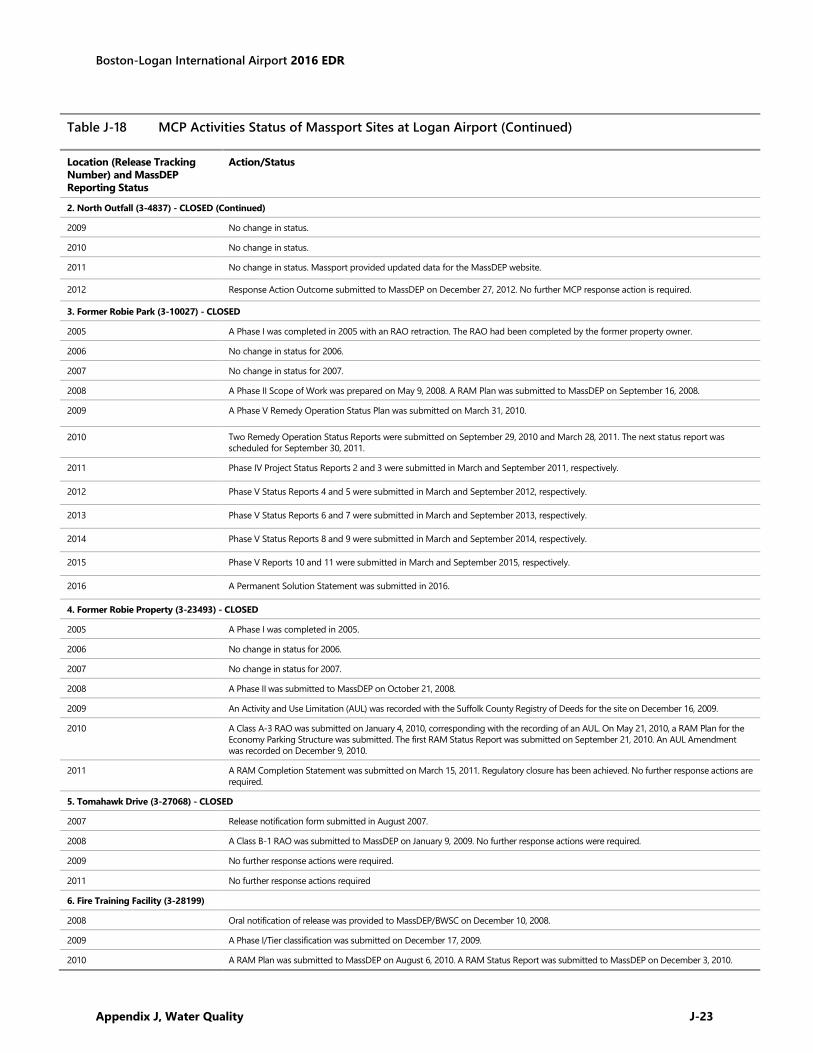
Boston-Logan International Airport 2016 EDR
Appendix J, Water Quality J-23
Table J-18 MCP Activities Status of Massport Sites at Logan Airport (Continued)
Location (Release Tracking
Number) and MassDEP
Reporting Status
Action/Status
2. North Outfall (3-4837) - CLOSED (Continued)
2009 No change in status.
2010 No change in status.
2011 No change in status. Massport provided updated data for the MassDEP website.
2012 Response Action Outcome submitted to MassDEP on December 27, 2012. No further MCP response action is required.
3. Former Robie Park (3-10027) - CLOSED
2005 A Phase I was completed in 2005 with an RAO retraction. The RAO had been completed by the former property owner.
2006 No change in status for 2006.
2007 No change in status for 2007.
2008 A Phase II Scope of Work was prepared on May 9, 2008. A RAM Plan was submitted to MassDEP on September 16, 2008.
2009 A Phase V Remedy Operation Status Plan was submitted on March 31, 2010.
2010 Two Remedy Operation Status Reports were submitted on September 29, 2010 and March 28, 2011. The next status report was
scheduled for September 30, 2011.
2011 Phase IV Project Status Reports 2 and 3 were submitted in March and September 2011, respectively.
2012 Phase V Status Reports 4 and 5 were submitted in March and September 2012, respectively.
2013 Phase V Status Reports 6 and 7 were submitted in March and September 2013, respectively.
2014 Phase V Status Reports 8 and 9 were submitted in March and September 2014, respectively.
2015 Phase V Reports 10 and 11 were submitted in March and September 2015, respectively.
2016 A Permanent Solution Statement was submitted in 2016.
4. Former Robie Property (3-23493) - CLOSED
2005 A Phase I was completed in 2005.
2006 No change in status for 2006.
2007 No change in status for 2007.
2008 A Phase II was submitted to MassDEP on October 21, 2008.
2009 An Activity and Use Limitation (AUL) was recorded with the Suffolk County Registry of Deeds for the site on December 16, 2009.
2010 A Class A-3 RAO was submitted on January 4, 2010, corresponding with the recording of an AUL. On May 21, 2010, a RAM Plan for the
Economy Parking Structure was submitted. The first RAM Status Report was submitted on September 21, 2010. An AUL Amendment
was recorded on December 9, 2010.
2011 A RAM Completion Statement was submitted on March 15, 2011. Regulatory closure has been achieved. No further response actions are
required.
5. Tomahawk Drive (3-27068) - CLOSED
2007 Release notification form submitted in August 2007.
2008 A Class B-1 RAO was submitted to MassDEP on January 9, 2009. No further response actions were required.
2009 No further response actions were required.
2011 No further response actions required
6. Fire Training Facility (3-28199)
2008 Oral notification of release was provided to MassDEP/BWSC on December 10, 2008.
2009 A Phase I/Tier classification was submitted on December 17, 2009.
2010 A RAM Plan was submitted to MassDEP on August 6, 2010. A RAM Status Report was submitted to MassDEP on December 3, 2010.
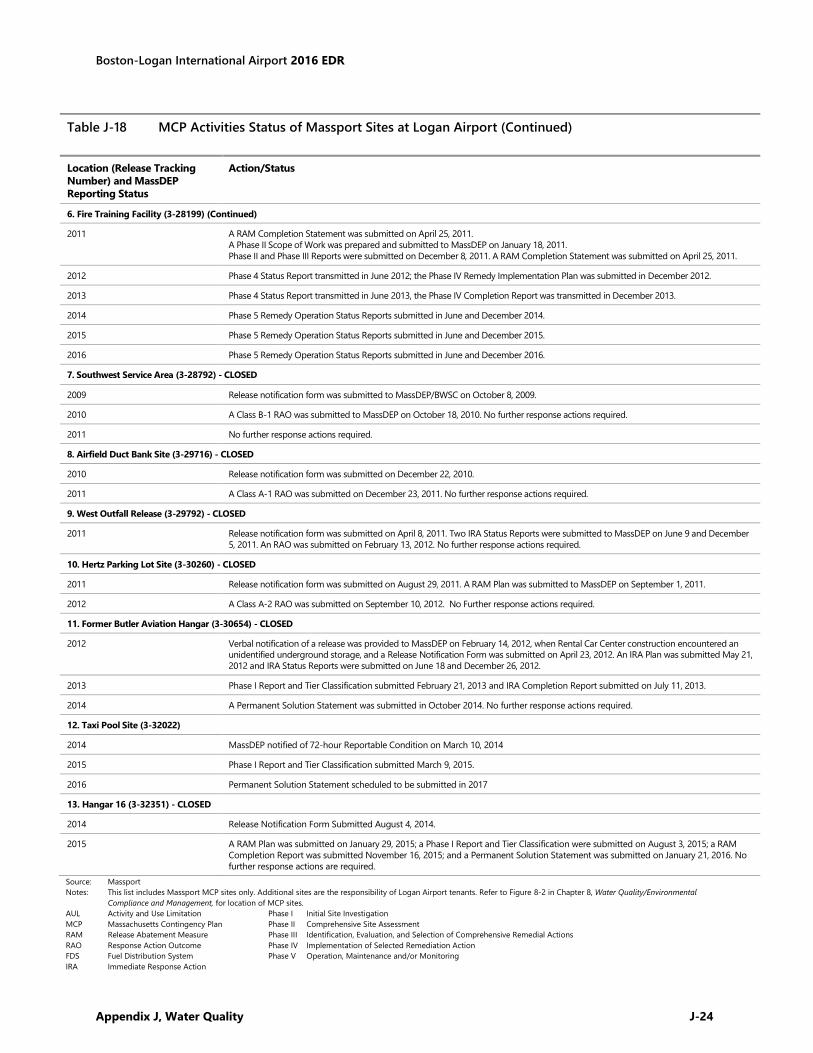
Boston-Logan International Airport 2016 EDR
Appendix J, Water Quality J-24
Source: Massport
Notes: This list includes Massport MCP sites only. Additional sites are the responsibility of Logan Airport tenants. Refer to Figure 8-2 in Chapter 8, Water Quality/Environmental
Compliance and Management, for location of MCP sites.
AUL Activity and Use Limitation Phase I Initial Site Investigation
MCP Massachusetts Contingency Plan Phase II Comprehensive Site Assessment
RAM Release Abatement Measure Phase III Identification, Evaluation, and Selection of Comprehensive Remedial Actions
RAO Response Action Outcome Phase IV Implementation of Selected Remediation Action
FDS Fuel Distribution System Phase V Operation, Maintenance and/or Monitoring
IRA Immediate Response Action
Table J-18 MCP Activities Status of Massport Sites at Logan Airport (Continued)
Location (Release Tracking
Number) and MassDEP
Reporting Status
Action/Status
6. Fire Training Facility (3-28199) (Continued)
2011 A RAM Completion Statement was submitted on April 25, 2011.
A Phase II Scope of Work was prepared and submitted to MassDEP on January 18, 2011.
Phase II and Phase III Reports were submitted on December 8, 2011. A RAM Completion Statement was submitted on April 25, 2011.
2012 Phase 4 Status Report transmitted in June 2012; the Phase IV Remedy Implementation Plan was submitted in December 2012.
2013 Phase 4 Status Report transmitted in June 2013, the Phase IV Completion Report was transmitted in December 2013.
2014 Phase 5 Remedy Operation Status Reports submitted in June and December 2014.
2015 Phase 5 Remedy Operation Status Reports submitted in June and December 2015.
2016 Phase 5 Remedy Operation Status Reports submitted in June and December 2016.
7. Southwest Service Area (3-28792) - CLOSED
2009 Release notification form was submitted to MassDEP/BWSC on October 8, 2009.
2010 A Class B-1 RAO was submitted to MassDEP on October 18, 2010. No further response actions required.
2011 No further response actions required.
8. Airfield Duct Bank Site (3-29716) - CLOSED
2010 Release notification form was submitted on December 22, 2010.
2011 A Class A-1 RAO was submitted on December 23, 2011. No further response actions required.
9. West Outfall Release (3-29792) - CLOSED
2011 Release notification form was submitted on April 8, 2011. Two IRA Status Reports were submitted to MassDEP on June 9 and December
5, 2011. An RAO was submitted on February 13, 2012. No further response actions required.
10. Hertz Parking Lot Site (3-30260) - CLOSED
2011 Release notification form was submitted on August 29, 2011. A RAM Plan was submitted to MassDEP on September 1, 2011.
2012 A Class A-2 RAO was submitted on September 10, 2012. No Further response actions required.
11. Former Butler Aviation Hangar (3-30654) - CLOSED
2012 Verbal notification of a release was provided to MassDEP on February 14, 2012, when Rental Car Center construction encountered an
unidentified underground storage, and a Release Notification Form was submitted on April 23, 2012. An IRA Plan was submitted May 21,
2012 and IRA Status Reports were submitted on June 18 and December 26, 2012.
2013 Phase I Report and Tier Classification submitted February 21, 2013 and IRA Completion Report submitted on July 11, 2013.
2014 A Permanent Solution Statement was submitted in October 2014. No further response actions required.
12. Taxi Pool Site (3-32022)
2014 MassDEP notified of 72-hour Reportable Condition on March 10, 2014
2015 Phase I Report and Tier Classification submitted March 9, 2015.
2016 Permanent Solution Statement scheduled to be submitted in 2017
13. Hangar 16 (3-32351) - CLOSED
2014 Release Notification Form Submitted August 4, 2014.
2015 A RAM Plan was submitted on January 29, 2015; a Phase I Report and Tier Classification were submitted on August 3, 2015; a RAM
Completion Report was submitted November 16, 2015; and a Permanent Solution Statement was submitted on January 21, 2016. No
further response actions are required.
Capita l Programs and Environmental Affa i rs
Volume 42, Issue 1 January 2016 E N
A Massport Newsletter
I N S I D E T H I S I S S U E :
2016 SustainableMassport Calendar
1
Recycling EmptyBarrels ofFirefighting Foam
1
Safe Winter Driving 2
2015 DERA GrantAward, Conley
3
Questions aboutEnvironmental/Safety Issues
5
Compliance Corner 4
EnviroNews is a newsle er published quarterly for
Massport and its tenants. Your comments and
sugges ons are welcome. Please contact Brenda Enos
([email protected]) at 617‐568‐5963.
2016 Sustainable Massport Calendar The 2016 Sustainable Massport Calendar is now available for all Mass-port employees and tenants. The 2016 calendar expanded to showcasesustainability efforts across all Massport facilities, including: HanscomField, Worcester Regional Airport, Parks, Real Estate Holdings, and thePort of Boston.
The annual Sustainable Massport Calendar is part of the engagementstrategies laid out in the first ever Logan Airport Sustainable Manage-ment Plan (SMP), published in 2015. The Logan SMP serves as aroadmap to advance Massport’s leadership and commitment to sustainabil-
ity, by prioritizing and implementing initiatives that emphasize economic viability, operationalefficiency, natural resource conservation, and social responsibility. The Sustainable Massport Calen-dar is one tool to share Massport’s sustainability successes, and raise awareness about the organi-zation’s commitment to sustainability. Each month within the calendar will highlight a different sus-tainability-related topic, associated activities which Massport has undertaken and its progress, aswell as ideas of programs and actions which individuals can participate in to improve personalsustainability at work and home.
Topics for the year are as follows:
If you haven’t received a 2016 Calendar or would like additional copies to distribute, please con-tact Jacob Glickel at [email protected].
January 2016 Sustainability Awareness
February 2016 Buildings and Facilities
March 2016 Air Quality
April 2016 Parks and Open Space
May 2016 Sustainable Transportation
June 2016 Natural Resources
July 2016 Community-Schools
August 2016 Climate Change Adaptation and Resiliency
September 2016 Energy Efficiency and Greenhouse Gas (GHG) Reduction
October 2016 Community - Health and Wellness
November 2016 Waste Management and Recycling
December 2016 Tenants
Recycling Empty Barrels of Firefighting Foam Massport Facilities and Fire Rescue have given a second life toempty barrels of firefighting foam. Ten barrels are being re-purpose at the Mass Audubon's Blue Hills Trailside MuseumCenter in Milton. The barrels are now being used to hold sand tokeep the trails open during the winter months.
Great Job to all involved!
Appendix J, Water Quality J-25

Page 2 Volume 42, Issue 1
Safe Winter Driving
The three P’s of Safe Winter Driving: PREPARE for the trip; PROTECT yourself; and PREVENT crashes on the road
PREPARE
Check tire tread, headlights, brake lights, windshield wipers and windshield washer fluid pri-or to driving.
Completely clear snow and ice off your car – including windows, mirrors, lights, reflectors,hood, roof and trunk.
Have a snow brush and ice scraper in your vehicle.
PROTECT YOURSELF
Always use your seat belt while driving or when you are a passenger in a moving vehicle. Watch for ice when stepping in and out of the vehicle. Most falls happen when getting in
and out of vehicles during the winter months. Use three points of contact while getting inand out and use caution.
Always wear high visibility clothing when working around vehicles at roadways, garages,container yards and ramp areas.
Make sure your exhaust pipe is clear of snow. There is danger of carbon monoxide poison-ing if snow blocks the pipe while idling. Remember- do not idle more than 5 minutes perMassDEP regulation.
PREVENT CRASHES
Stopping distances are longer on snow and ice. Slow down and increase distances betweenvehicles.
Keep your eyes open for pedestrians walking in the road. Visibility can be low during snowstorms. Use caution around terminal and ramp areas where pedestrians could be in or nearthe road.
Drive with your headlights on and be sure to keep them clean to improve visibility. Use caution when snow banks limit your view of oncoming traffic. Be cautious on bridges and overpasses as they are commonly the first areas to become icy. Remember that speed limits are meant for dry roads, not roads covered in snow and ice.
You should reduce your speed and increase your following distance as road conditions andvisibility worsen.
Appendix J, Water Quality J-26
Page 3 Volume 42, Issue 1
2015 DERA Grant Award, Conley Terminal
The Massport Maritime Department and the Environmental Management Unit worked collaboratively to secure an EPAgrant that will allow for the replacement of diesel generators in five (5) Rubber Tire Gantry Cranes (RTGs) at ConleyTerminal in South Boston. This grant was made possible under the Diesel Emissions Reduction Act (DERA) and willcontribute $333,185 toward the cost of the project. This was the only project in New England to be selected forFY2015 DERA funding.
This grant will allow Massport to replace five older, Tier III diesel powered generators with current EPA Tier-4F certifiedunits. Along with extending the service life of this critical equipment, Conley Terminal and surrounding communitiesin South Boston will benefit from reduced air emissions. The new generators represent a significant improvementover the existing units because they emit less emissions while operating and will be equipped with a fuel saver sys-tem which will reduce fuel use during standby time. Annually, the new Tier-4F engines are expected to conserve ap-proximately 2,800 gallons of diesel fuel and reduce emissions of nitrogen oxides, particulate matter and carbon diox-ide by an estimated 8 tons, 0.5 tons and 155 tons, respectively. The grant funding was formally presented to Massportby the U.S. EPA during a press conference on Friday, December 4th, 2015 at Conley Terminal.
The retrofit of RTGs at Conley Terminal follows on the success of the Massport Clean Truck program. In 2007,Massport and the EPA established a "Clean Truck" program giving owners of older trucks servicing Conley Termi-nal an incentive to replace the vehicles with ones that are 2007 emission compliant or newer. A total of $1.5 mil-lion, including a $500,000 EPA DERA grant provides truck owners with 50 percent of the replacement cost up to$25,000 of older trucks. So far 55 trucks, some up to 25 years old, have been replaced with new models that dra-
Appendix J, Water Quality J-27
Page 4 Volume 42, Issue 1
Compliance Corner Universal Waste Compliance
Do you know the difference between Hazardous Waste and UniversalWaste?
Many Massport tenants generate regulated universal waste and don’teven realize it! Generation of universal waste can come from businessesthat utilize administrative office space, storage, restaurants and retailstores. In fact, it is called universal waste because it is generated bynearly every type of business entity and many homeowners as well.
Universal waste is a type of hazardous waste and its storage, handling,transportation and disposal are regulated. However, because of the rela-
tively low hazard associated with these wastes and the large number of entities generating this material,universal waste is regulated differently with reduced compliance requirements compared to those for haz-ardous waste.
Examples of Universal Waste are:
Used light bulbs (fluorescent tubes, compact fluorescent, halogen, metal halide, high/low pressure sodi-um and mercury vapor)
Used Batteries (most rechargeable batteries and lead acid batteries)
Mercury Containing Equipment (thermostats, thermometers, barometers, mercury switches, etc.)
Pesticides (unused or recalled pesticides which are collected as waste)
Much like hazardous waste, the level of regulation is defined by the volume generated. Entities storing inexcess of 11,000 lbs at any one time are considered Large Quantity Handlers, while those storing less areconsidered Small Quantity Handlers. In both cases universal waste can only be stored on site for oneyear or less and must be collected, labeled and disposed of through a licensed handler or disposal facility.Records should be kept to document proper disposal. Regulated universal wastes should NEVER be disposed of in trash cans, solid waste dumpsters or single stream recycling containers.
More information is available at the MassDEP web site at:
http://www.mass.gov/eea/docs/dep/recycle/hazardous/univrule.pdf
If you have any questions or concerns about hazardous waste compliance, contact the Massport Environ-mental Department.
Appendix J, Water Quality J-28
Questions about Environmental/Safety Issues
Who should you contact?
Contact Phone Number Email Address
Auditing/General
Brenda Enos (617) 568-5963 [email protected]
Universal Waste
Glenn Adams (617) 568-3542 [email protected]
Safety
Brian Dinneen (617) 568-7427 [email protected]
Michael McAveeney (617) 561-3390 [email protected]
Karisa Hanson (617) 568-7434 [email protected]
Spill Follow-Up
James Stolecki (617) 568-3552 [email protected]
NPDES Permitting
Rosanne Joyce (617) 568-3516 [email protected]
Underground/Aboveground Storage Tanks
Erik Bankey (617) 568-3514 [email protected]
Air Quality/Hazardous Waste
Ian Campbell (617) 568-3508 [email protected]
Jacob Glickel (617) 568-3558 [email protected]
EMS/Sustainability/Recycling
Page 5 Volume 42, Issue 1
Appendix J, Water Quality J-29

Capita l Programs and Environmental Affa i rs
Volume 42, Issue 2 May 2016 E N
A Massport Newsletter
I N S I D E T H I S I S S U E :
Logan AnnualSustainability Report
1
Massport SafetyManual Revised
2
HouseholdHazardous WasteCollection Days
3
Compliance Corner 4
Questions aboutEnvironmental/Safety Issues
5
EnviroNews is a newsle er published quarterly for
Massport and its tenants. Your comments and
sugges ons are welcome. Please contact Brenda Enos
([email protected]) at 617‐568‐5963.
Logan Annual Sustainability Report The 2016 Logan Airport Annual Sustain-ability Report was released on EarthDay, April 22. This report provides aprogress summary of sustainability ef-forts at Boston-Logan International Air-port. It highlights notable actions andachievements since the 2015 Sustaina-bility Management Plan was publishedand characterizes Massport’s plans for aSustainable Massport. As we celebrateour successes this year, we hope thatthe excitement for sustainability efforts
continues to grow throughout the year. Massport strives to be a good neighborand environmental steward in everything that we do.
The report focuses on progress towards each of Massport’s sustainability goalsin the following ten resource areas:
• Energy and Greenhouse Gas Emissions• Water Conservation• Community, Employee, and Passenger Well-being• Materials, Waste Management, and Recycling• Resiliency• Noise Abatement• Air Quality Improvement• Ground Access and Connectivity• Water Quality/Stormwater• Natural Resources
Visit www.massport.com/environment to download a copy of the Logan AnnualSustainability Report. If you would like a hard copy please contact Jacob Glickelat [email protected].
Appendix J, Water Quality J-30
Page 2 Volume 42, Issue 2
Compliance Corner Spills of Hazardous Waste and Hazardous Materials
Despite extensive planning, preventive measures and implementation of Best Management Practices (BMPs), spills of hazardous substances sometimes occur at active commercial and industrial facilities. All Massport owned properties have plans in place to respond to and address these incidents. When in doubt over whether or not to clean up a spill, you can ask yourself the following questions:
Is this spill inside of a building and on an impervious surface? Do I know the cause of this spill? Am I familiar with the material that was spilled and hazards associated with it? Is the spill below reportable spill quantities (RQ)? Am I equipped with proper spill supplies , Personal Protective Equipment (PPE) and training to
clean up this spill (only if below RQ)
If you answered no to any of these questions, you must report this spill to Massport. Notification should be made as soon as possible after discovery of the spill.
Any spill entering the storm drainage system or a surface water body must be promptly reported to Massport to ensure that cleanup is completed and any required regulatory reporting is made. Spills at Massport owned facilities should be called in to the following numbers:
• Logan Airport: Logan Fire Alarm 617-567-2020 • Worcester Airport: Worcester ARFF, 508-849-5519 • Hanscom Field: Hanscom Emergency, 781-869-8080 • Maritime Properties: Massport Port Office, 617-464-8250
In most cases, spent cleanup supplies, contaminated packaging and recovered spilled material(s) will become regulated hazardous waste at the conclusion of the cleanup activities. Proper handling and disposal of this waste is always the responsibility of the company responsible for the spill. Massport and their spill response contractors can assist with coordination of proper or ownership transportation and disposal of regulated hazardous waste(s) but Massport cannot take responsibility for this waste. It is up to the company responsible for the spill to make proper arrangements for storage, transporta-tion and disposal of spill related waste(s).
More information is available at the MassDEP web site at http://www.mass.gov/eea/agencies/massdep/about/programs/emergency-response-program.html
If you have any questions or concerns about hazardous waste compliance, contact the Massport Envi-ronmental Department.
Appendix J, Water Quality J-31
Page 3 Volume 42, Issue 2
Massport Safety Manual Revised
Safety and Security at all facilities is one of the Massport Top10 Goals. Massport’s Safety and Health Manual supports thisgoal to eliminate unsafe conditions and minimize the impact ofhazardous situations. This Manual can benefit Massport by re-ducing illness and injury to personnel, preventing property dam-age, and preserving the environment.
Over the past several months, the Safety Unit has been work-ing with many Departmental Units to update the policies andprocedures that comprise the Massport Safety and Health Man-ual. Since the last version of the Manual was distributed,Massport has grown, some regulations have changed, and newtechnologies have emerged to minimize incidents.
The latest version of the Safety and Health Manual was distributed this April. In order to minimizepaper waste, the manual is available to everyone on the Safety Department’s tab of the MassportPortal (http://sharepoint/CapitalPrograms/Safety/default.aspx). A limited number of paper manu-als will be made available at select locations for those who do not have access to the MassportPortal.
To support the Manual roll out, we will be covering a topic eachmonth for the next year to review the Policy and Procedure Sec-tion. It will be supported with Safety Focus (Tool Box) flyers, train-ing and inspections of Safety Equipment related to the subject.
The manual is a living and fluid document. As we review and im-plement each Policy and Procedure Section, we encourage com-ments and suggestions to continually improve the Manual for theentire Massport Community.
Appendix J, Water Quality J-32
Questions about Environmental/Safety Issues
Who should you contact?
Contact Phone Number Email Address
Auditing/General
Brenda Enos (617) 568-5963 [email protected]
Universal Waste
Glenn Adams (617) 568-3542 [email protected]
Safety
Brian Dinneen (617) 568-7427 [email protected]
Michael McAveeney (617) 561-3390 [email protected]
Spill Follow-Up
James Stolecki (617) 568-3552 [email protected]
NPDES Permitting
Rosanne Joyce (617) 568-3516 [email protected]
Underground/Aboveground Storage Tanks
Erik Bankey (617) 568-3514 [email protected]
Air Quality/Hazardous Waste
Ian Campbell (617) 568-3508 [email protected]
EMS/Sustainability/Recycling
Jacob Glickel (617) 568-3558 [email protected]
Page 4 Volume 42, Issue 2
Appendix J, Water Quality J-33
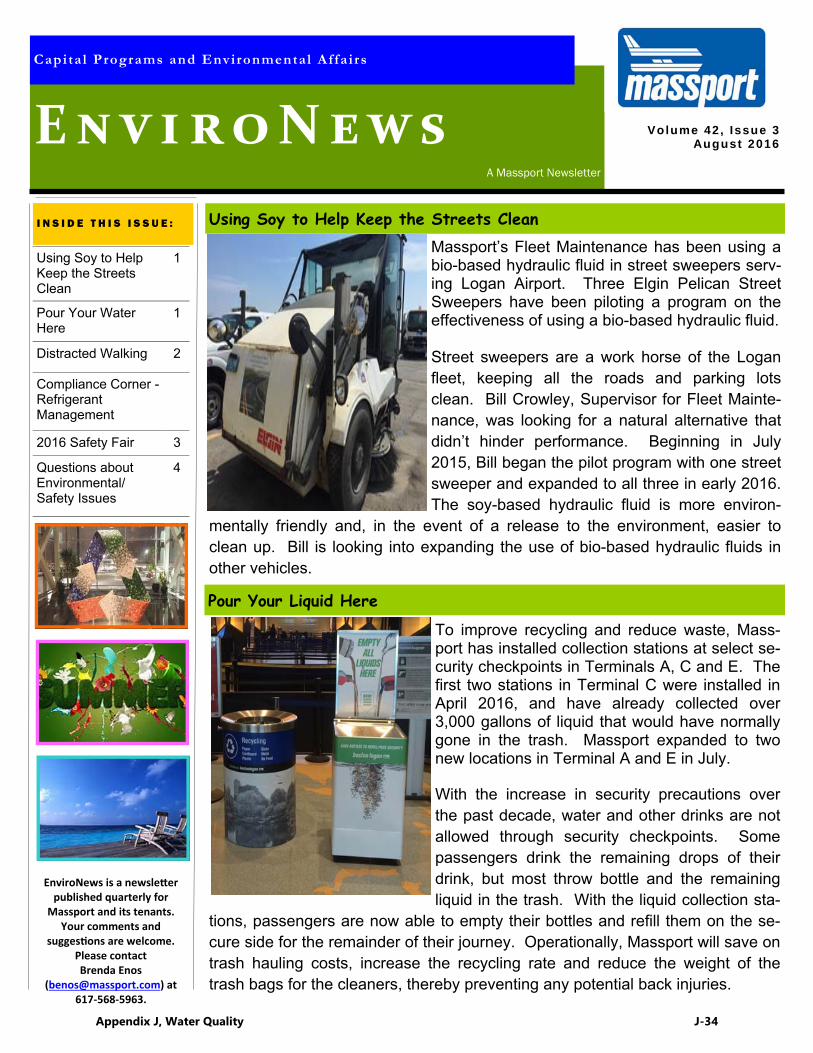
Capita l Programs and Environmental Affa i rs
Volume 42, Issue 3 August 2016 E N
A Massport Newsletter
I N S I D E T H I S I S S U E :
Using Soy to HelpKeep the StreetsClean
1
Pour Your WaterHere
1
Distracted Walking 2
2016 Safety Fair 3
Questions aboutEnvironmental/Safety Issues
4
Compliance Corner -RefrigerantManagement
EnviroNews is a newsle er published quarterly for
Massport and its tenants. Your comments and
sugges ons are welcome. Please contact Brenda Enos
([email protected]) at 617‐568‐5963.
Using Soy to Help Keep the Streets Clean Massport’s Fleet Maintenance has been using abio-based hydraulic fluid in street sweepers serv-ing Logan Airport. Three Elgin Pelican StreetSweepers have been piloting a program on theeffectiveness of using a bio-based hydraulic fluid.
Street sweepers are a work horse of the Loganfleet, keeping all the roads and parking lotsclean. Bill Crowley, Supervisor for Fleet Mainte-nance, was looking for a natural alternative thatdidn’t hinder performance. Beginning in July2015, Bill began the pilot program with one streetsweeper and expanded to all three in early 2016.The soy-based hydraulic fluid is more environ-
mentally friendly and, in the event of a release to the environment, easier toclean up. Bill is looking into expanding the use of bio-based hydraulic fluids inother vehicles.
Pour Your Liquid Here
To improve recycling and reduce waste, Mass-port has installed collection stations at select se-curity checkpoints in Terminals A, C and E. Thefirst two stations in Terminal C were installed inApril 2016, and have already collected over3,000 gallons of liquid that would have normallygone in the trash. Massport expanded to twonew locations in Terminal A and E in July.
With the increase in security precautions overthe past decade, water and other drinks are notallowed through security checkpoints. Somepassengers drink the remaining drops of theirdrink, but most throw bottle and the remainingliquid in the trash. With the liquid collection sta-
tions, passengers are now able to empty their bottles and refill them on the se-cure side for the remainder of their journey. Operationally, Massport will save ontrash hauling costs, increase the recycling rate and reduce the weight of thetrash bags for the cleaners, thereby preventing any potential back injuries.
Appendix J, Water Quality J-34

Page 2 Volume 42, Issue 3
A quick internet search of “Distracted Walking”brings up a number of example videos of peoplefalling and potentially being injured. These videosrange from the humorous (people walking intomall water fountains) to disturbing (people fallingonto train tracks). It has become such a big prob-lem in recent years the National Safety Council,for the first time, has included statistics on cellphone distracted walking.
According to the National Safety Council’s Injury Facts, distracted walking incidents involving cellphones accounted for more than 11,100 injuriesbetween 2000 and 2011.
52% of cell phone distracted walking injuries happen at home 68% of those injured are women 54% are age 40 or younger Nearly 80% of the injuries were due to a fall
This trend will surely continue as more and more of the population begins to use hand held de-vices and games like Pokémon GO become more popular. All of us have seen people usingtheir hand-held devise while walking down the sidewalk, on stairs, and on escalators. Most of ushave probably done this as well. It is important to realize that just because we did somethingyesterday and didn’t get hurt, doesn’t mean we will have the same outcome today. Hand-helddevices are preventing people from seeing potential hazards in front of them. The National Safe-ty Council recommends:
Never use your hand-held device on stairs and escalators Never use a cell phone or other electronic device while walking indoors or outside Only cross at designated crosswalks Look left, right and left again before crossing the street Make eye contact with drivers of oncoming vehicles to make sure they see you Never rely on a car to stop Don't wear headphones while walking Wear bright and/or reflective clothing Walk in groups
Walking is a great way to stay healthy, but only if we are smart about it.
Distracted Walking
Appendix J, Water Quality J-35
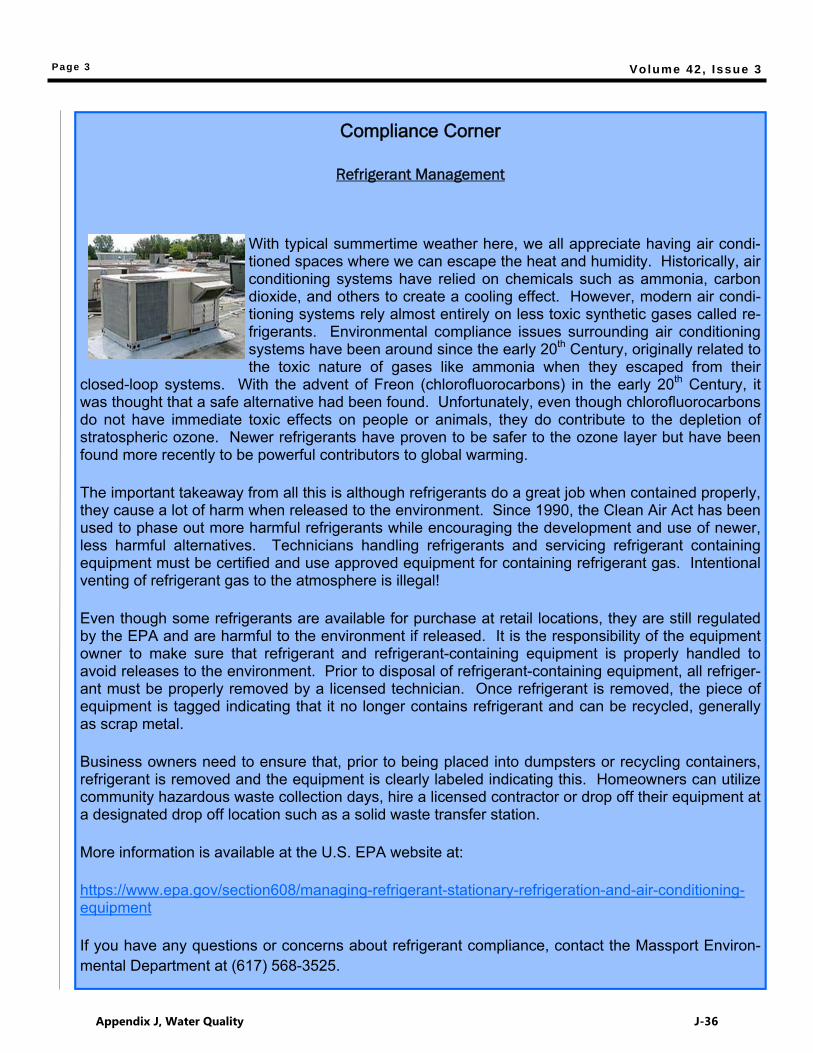
Page 3 Volume 42, Issue 3
Compliance Corner
Refrigerant Management
With typical summertime weather here, we all appreciate having air condi-tioned spaces where we can escape the heat and humidity. Historically, airconditioning systems have relied on chemicals such as ammonia, carbondioxide, and others to create a cooling effect. However, modern air condi-tioning systems rely almost entirely on less toxic synthetic gases called re-frigerants. Environmental compliance issues surrounding air conditioningsystems have been around since the early 20th Century, originally related tothe toxic nature of gases like ammonia when they escaped from their
closed-loop systems. With the advent of Freon (chlorofluorocarbons) in the early 20th Century, itwas thought that a safe alternative had been found. Unfortunately, even though chlorofluorocarbonsdo not have immediate toxic effects on people or animals, they do contribute to the depletion ofstratospheric ozone. Newer refrigerants have proven to be safer to the ozone layer but have beenfound more recently to be powerful contributors to global warming.
The important takeaway from all this is although refrigerants do a great job when contained properly,they cause a lot of harm when released to the environment. Since 1990, the Clean Air Act has beenused to phase out more harmful refrigerants while encouraging the development and use of newer,less harmful alternatives. Technicians handling refrigerants and servicing refrigerant containingequipment must be certified and use approved equipment for containing refrigerant gas. Intentionalventing of refrigerant gas to the atmosphere is illegal!
Even though some refrigerants are available for purchase at retail locations, they are still regulatedby the EPA and are harmful to the environment if released. It is the responsibility of the equipmentowner to make sure that refrigerant and refrigerant-containing equipment is properly handled toavoid releases to the environment. Prior to disposal of refrigerant-containing equipment, all refriger-ant must be properly removed by a licensed technician. Once refrigerant is removed, the piece ofequipment is tagged indicating that it no longer contains refrigerant and can be recycled, generallyas scrap metal.
Business owners need to ensure that, prior to being placed into dumpsters or recycling containers,refrigerant is removed and the equipment is clearly labeled indicating this. Homeowners can utilizecommunity hazardous waste collection days, hire a licensed contractor or drop off their equipment ata designated drop off location such as a solid waste transfer station.
More information is available at the U.S. EPA website at:
https://www.epa.gov/section608/managing-refrigerant-stationary-refrigeration-and-air-conditioning-equipment
If you have any questions or concerns about refrigerant compliance, contact the Massport Environ-mental Department at (617) 568-3525.
Appendix J, Water Quality J-36

Page 4 Volume 42, Issue 3
Appendix J, Water Quality J-37
Questions about Environmental/Safety Issues
Who should you contact?
Contact Phone Number Email Address
Auditing/General
Brenda Enos (617) 568-5963 [email protected]
Universal Waste
Glenn Adams (617) 568-3542 [email protected]
Safety
Brian Dinneen (617) 568-7427 [email protected]
Michael McAveeney (617) 561-3390 [email protected]
Spill Follow-Up
James Stolecki (617) 568-3552 [email protected]
NPDES Permitting
Rosanne Joyce (617) 568-3516 [email protected]
Underground/Aboveground Storage Tanks
Erik Bankey (617) 568-3514 [email protected]
Air Quality/Hazardous Waste
Ian Campbell (617) 568-3508 [email protected]
EMS/Sustainability/Recycling
Jacob Glickel (617) 568-3558 [email protected]
Rachel Pisa (617) 568-7434 [email protected]
Page 5 Volume 42, Issue 3
Appendix J, Water Quality J-38
Boston-Logan International Airport 2016 EDR
Appendix K, 2016 and 2017 Peak Period Pricing Monitoring Report K-1
K 2016 and 2017 Peak Period Pricing Monitoring Report
Boston-Logan International Airport 2016 EDR
Appendix K, 2016 and 2017 Peak Period Pricing Monitoring Report K-2
This Page Intentionally Left Blank.
Report Number: 013
Monitoring Period: Through Sept. 2016
Report Issue Date: May 2016
BOSTON-LOGAN INTERNATIONAL AIRPORT MONITORING REPORT ON SCHEDULED AND
NON-SCHEDULED FLIGHT ACTIVITY Peak Period Surcharge Regulation
740 CMR 27:00: Massachusetts Port Authority
Appendix K, 2016 and 2017 Peak Period Pricing Monitoring Report K-3

Massachusetts Port Authority, May 2016 Page 1
Note: This report reflects the Boston-Logan Airport flight activity monitoring under 740 CMR 27.03 Peak Period Surcharge Regulation on Aircraft Operations at Boston-Logan International Airport.
Findings: This report includes actual and projected activity data through September 2016. Current and projected near-term flight levels at Boston Logan are well below Logan’s good weather (VFR) throughput of approximately 120 flights per hour. As a result, average VFR delays are projected to be minimal and well below the 15 minutes threshold through the analysis period.
In the event demand conditions at the airport change significantly from the current projection, Massport will issue updates to this report.
Attachments
Table 1: Summary Overview of Peak Period Surcharge Program
Table 2: Summary Overview of Forecast Methodology
Table 3: Projected Aircraft Operations at Logan Airport Projected
Table 4: Projected Hourly Operations, Average Weekday
Table 5: Forecast Logan Average Weekday Operations
Massport Contact:
Mr. Flavio Leo Director, Aviation Planning and Strategy 617-568-3528 [email protected]
Appendix K, 2016 and 2017 Peak Period Pricing Monitoring Report K-4
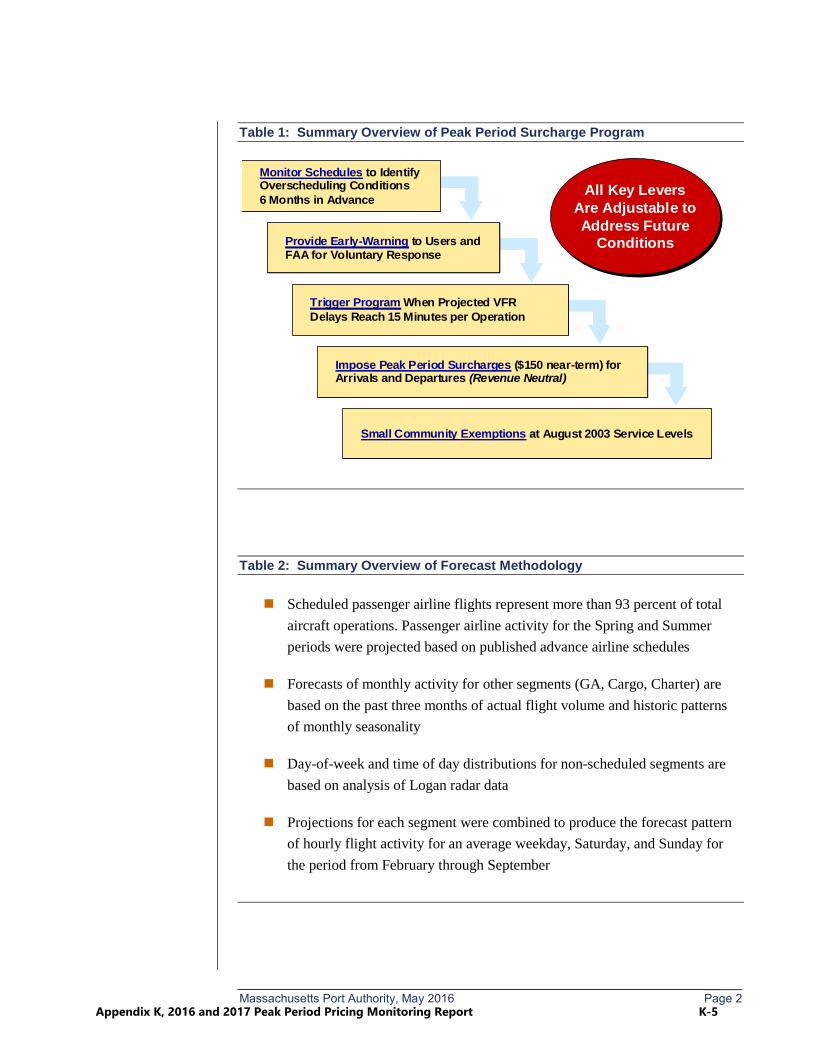
Massachusetts Port Authority, May 2016 Page 2
Table 1: Summary Overview of Peak Period Surcharge Program
Table 2: Summary Overview of Forecast Methodology
Scheduled passenger airline flights represent more than 93 percent of totalaircraft operations. Passenger airline activity for the Spring and Summerperiods were projected based on published advance airline schedules
Forecasts of monthly activity for other segments (GA, Cargo, Charter) arebased on the past three months of actual flight volume and historic patternsof monthly seasonality
Day-of-week and time of day distributions for non-scheduled segments arebased on analysis of Logan radar data
Projections for each segment were combined to produce the forecast patternof hourly flight activity for an average weekday, Saturday, and Sunday forthe period from February through September
All Key LeversAre Adjustable toAddress Future
Conditions
All Key LeversAre Adjustable toAddress Future
Conditions
Monitor Schedules to IdentifyOverscheduling Conditions6 Months in Advance
Monitor Schedules to IdentifyOverscheduling Conditions6 Months in Advance
Provide Early-Warning to Users andFAA for Voluntary ResponseProvide Early-Warning to Users andFAA for Voluntary Response
Trigger Program When Projected VFRDelays Reach 15 Minutes per OperationTrigger Program When Projected VFRDelays Reach 15 Minutes per Operation
Impose Peak Period Surcharges ($150 near-term) forArrivals and Departures (Revenue Neutral)Impose Peak Period Surcharges ($150 near-term) forArrivals and Departures (Revenue Neutral)
Small Community Exemptions at August 2003 Service LevelsSmall Community Exemptions at August 2003 Service Levels
Appendix K, 2016 and 2017 Peak Period Pricing Monitoring Report K-5
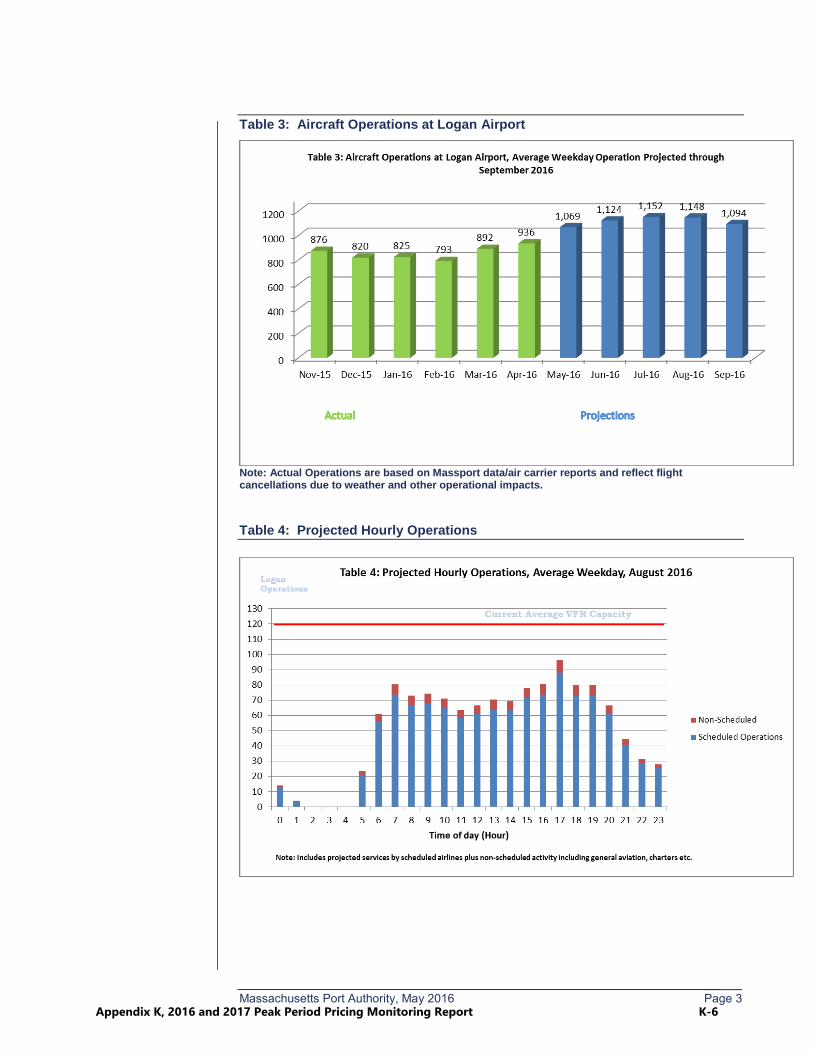
Massachusetts Port Authority, May 2016 Page 3
Table 3: Aircraft Operations at Logan Airport
Note: Actual Operations are based on Massport data/air carrier reports and reflect flight cancellations due to weather and other operational impacts.
Table 4: Projected Hourly Operations
Appendix K, 2016 and 2017 Peak Period Pricing Monitoring Report K-6
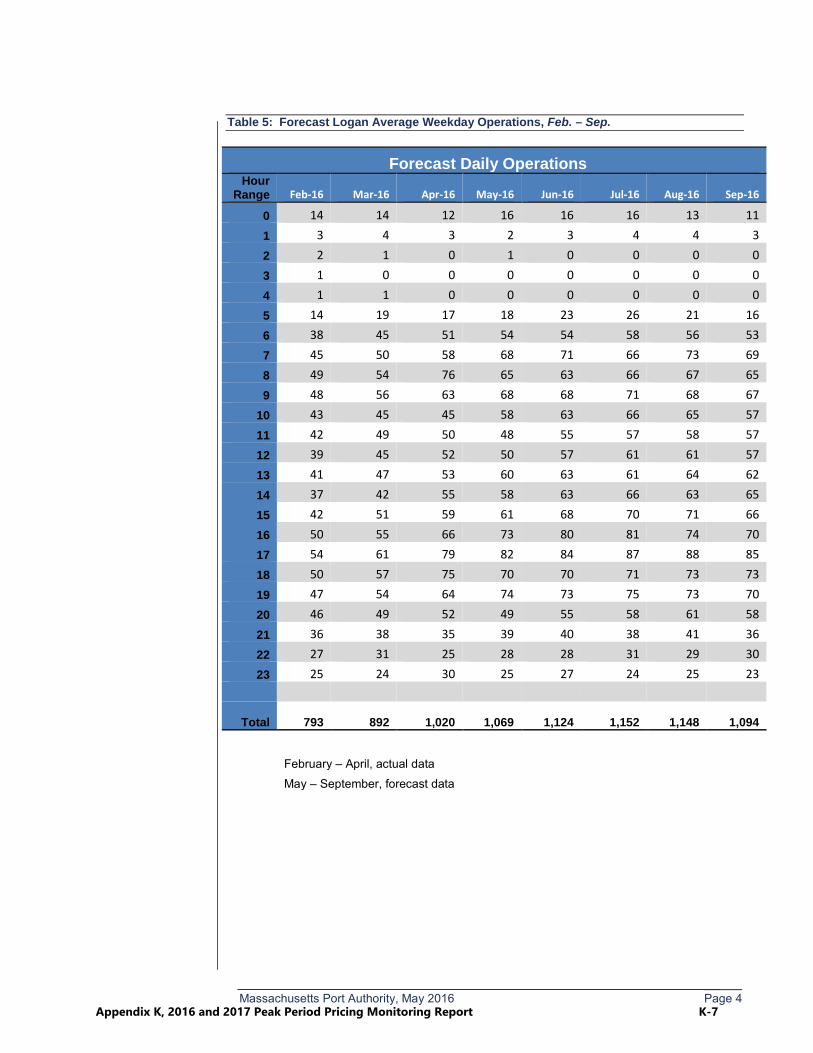
Massachusetts Port Authority, May 2016 Page 4
Table 5: Forecast Logan Average Weekday Operations, Feb. – Sep.
Forecast Daily Operations Hour
Range Feb-16 Mar-16 Apr-16 May-16 Jun-16 Jul-16 Aug-16 Sep-16
0 14 14 12 16 16 16 13 11 1 3 4 3 2 3 4 4 3 2 2 1 0 1 0 0 0 0 3 1 0 0 0 0 0 0 0 4 1 1 0 0 0 0 0 0 5 14 19 17 18 23 26 21 16 6 38 45 51 54 54 58 56 53 7 45 50 58 68 71 66 73 69 8 49 54 76 65 63 66 67 65 9 48 56 63 68 68 71 68 67
10 43 45 45 58 63 66 65 57 11 42 49 50 48 55 57 58 57 12 39 45 52 50 57 61 61 57 13 41 47 53 60 63 61 64 62 14 37 42 55 58 63 66 63 65 15 42 51 59 61 68 70 71 66 16 50 55 66 73 80 81 74 70 17 54 61 79 82 84 87 88 85 18 50 57 75 70 70 71 73 73 19 47 54 64 74 73 75 73 70 20 46 49 52 49 55 58 61 58 21 36 38 35 39 40 38 41 36 22 27 31 25 28 28 31 29 30 23 25 24 30 25 27 24 25 23
Total 793 892 1,020 1,069 1,124 1,152 1,148 1,094
February – April, actual data May – September, forecast data
Appendix K, 2016 and 2017 Peak Period Pricing Monitoring Report K-7

Report Number: 014
Monitoring Period: Through Sept. 2017
Report Issue Date: May 2017
BOSTON-LOGAN INTERNATIONAL AIRPORT MONITORING REPORT ON SCHEDULED AND
NON-SCHEDULED FLIGHT ACTIVITY Peak Period Surcharge Regulation
740 CMR 27:00: Massachusetts Port Authority
Appendix K, 2016 and 2017 Peak Period Pricing Monitoring Report K-8
Massachusetts Port Authority, May 2016 Page 1
Note: This report reflects the Boston-Logan Airport flight activity monitoring under 740 CMR 27.03 Peak Period Surcharge Regulation on Aircraft Operations at Boston-Logan International Airport.
Findings: This report includes actual and projected activity data through September 2017. Current and projected near-term flight levels at Boston Logan are well below Logan’s good weather (VFR) throughput of approximately 120 flights per hour. As a result, average VFR delays are projected to be minimal and well below the 15 minutes threshold through the analysis period.
In the event demand conditions at the airport change significantly from the current projection, Massport will issue updates to this report.
Attachments
Table 1: Summary Overview of Peak Period Surcharge Program
Table 2: Summary Overview of Forecast Methodology
Table 3: Projected Aircraft Operations at Logan Airport Projected
Table 4: Projected Hourly Operations, Average Weekday
Table 5: Forecast Logan Average Weekday Operations
Massport Contact:
Mr. Flavio Leo Director, Aviation Planning and Strategy 617-568-3528 [email protected]
Appendix K, 2016 and 2017 Peak Period Pricing Monitoring Report K-9

Massachusetts Port Authority, May 2017 Page 2
Table 1: Summary Overview of Peak Period Surcharge Program
Table 2: Summary Overview of Forecast Methodology
Scheduled passenger airline flights represent more than 93 percent of totalaircraft operations. Passenger airline activity for the Spring and Summerperiods were projected based on published advance airline schedules
Forecasts of monthly activity for other segments (GA, Cargo, Charter) arebased on the past three months of actual flight volume and historic patternsof monthly seasonality
Day-of-week and time of day distributions for non-scheduled segments arebased on analysis of Logan radar data
Projections for each segment were combined to produce the forecast patternof hourly flight activity for an average weekday, Saturday, and Sunday forthe period from February through September
All Key LeversAre Adjustable toAddress Future
Conditions
All Key LeversAre Adjustable toAddress Future
Conditions
Monitor Schedules to IdentifyOverscheduling Conditions6 Months in Advance
Monitor Schedules to IdentifyOverscheduling Conditions6 Months in Advance
Provide Early-Warning to Users andFAA for Voluntary ResponseProvide Early-Warning to Users andFAA for Voluntary Response
Trigger Program When Projected VFRDelays Reach 15 Minutes per OperationTrigger Program When Projected VFRDelays Reach 15 Minutes per Operation
Impose Peak Period Surcharges ($150 near-term) forArrivals and Departures (Revenue Neutral)Impose Peak Period Surcharges ($150 near-term) forArrivals and Departures (Revenue Neutral)
Small Community Exemptions at August 2003 Service LevelsSmall Community Exemptions at August 2003 Service Levels
Appendix K, 2016 and 2017 Peak Period Pricing Monitoring Report K-10
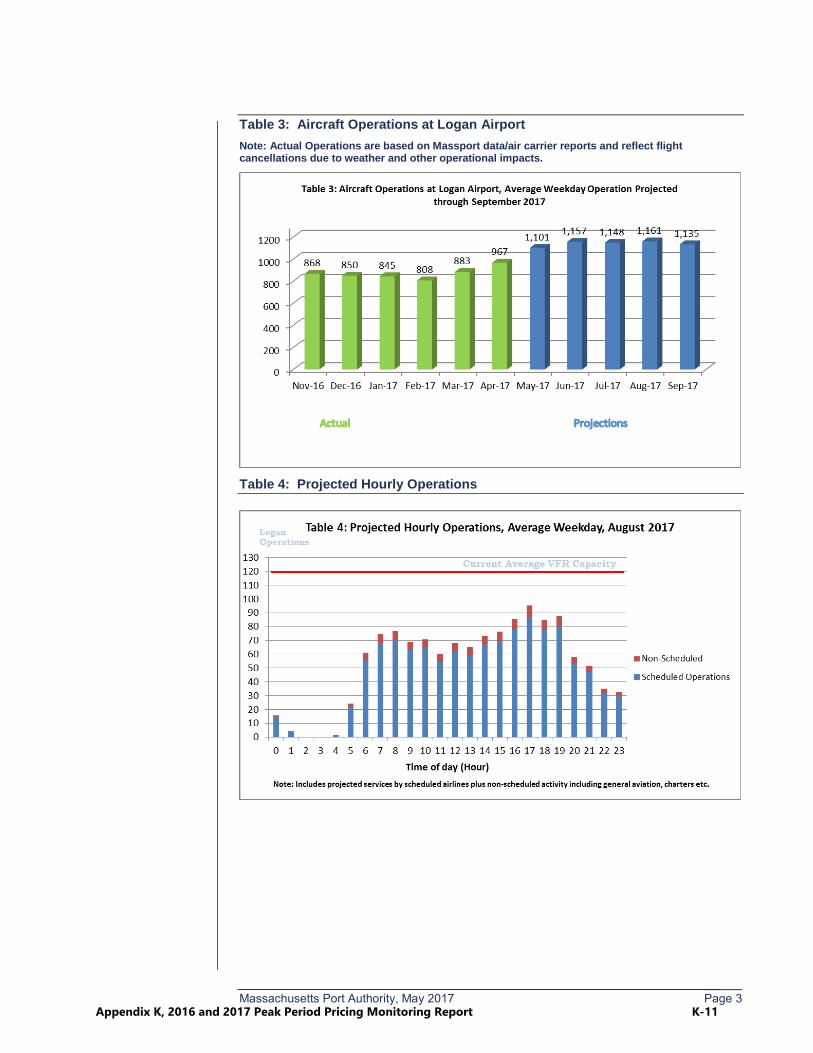
Massachusetts Port Authority, May 2017 Page 3
Table 3: Aircraft Operations at Logan Airport Note: Actual Operations are based on Massport data/air carrier reports and reflect flight cancellations due to weather and other operational impacts.
Table 4: Projected Hourly Operations
Appendix K, 2016 and 2017 Peak Period Pricing Monitoring Report K-11
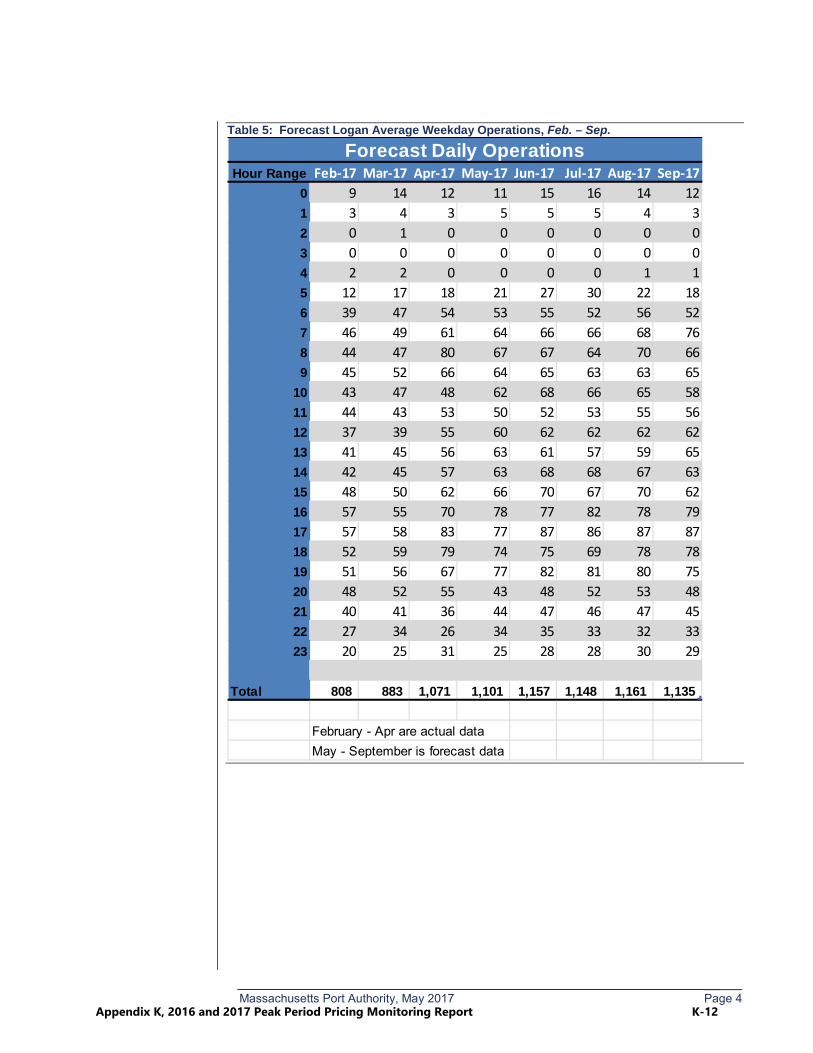
Massachusetts Port Authority, May 2017 Page 4
Table 5: Forecast Logan Average Weekday Operations, Feb. – Sep.
Hour Range Feb-17 aar-17 Apr-17 aay-17 Jun-17 Jul-17 Aug-17 Sep-170 9 14 12 11 15 16 14 121 3 4 3 5 5 5 4 32 0 1 0 0 0 0 0 03 0 0 0 0 0 0 0 04 2 2 0 0 0 0 1 15 12 17 18 21 27 30 22 186 39 47 54 53 55 52 56 527 46 49 61 64 66 66 68 768 44 47 80 67 67 64 70 669 45 52 66 64 65 63 63 65
10 43 47 48 62 68 66 65 5811 44 43 53 50 52 53 55 5612 37 39 55 60 62 62 62 6213 41 45 56 63 61 57 59 6514 42 45 57 63 68 68 67 6315 48 50 62 66 70 67 70 6216 57 55 70 78 77 82 78 7917 57 58 83 77 87 86 87 8718 52 59 79 74 75 69 78 7819 51 56 67 77 82 81 80 7520 48 52 55 43 48 52 53 4821 40 41 36 44 47 46 47 4522 27 34 26 34 35 33 32 3323 20 25 31 25 28 28 30 29
Total 808 883 1,071 1,101 1,157 1,148 1,161 1,135
February - Apr are actual dataMay - September is forecast data
Forecast Daily Operations
Appendix K, 2016 and 2017 Peak Period Pricing Monitoring Report K-12
L Reduced/Single Engine Taxiing at Logan Airport Memoranda This Appendix provides detailed information in support of Chapter 7, Air Quality/ Emissions Reduction:
Memorandum from Edward C. Freni, Massport Director of Aviation, to the Boston Logan Airline Committee,Regarding Single/Reduced-Engine Taxiing and the Use of Idle Reverse Thrust as Strategies to ReduceAircraft-Generated Emissions and Noise at Boston Logan, Dated May 18, 2016
Memorandum from Edward C. Freni, Director of Aviation, To Boston Logan Air Carriers and Chief Pilots,Single/Reduced-Engine Taxiing and Other Strategies to Reduce Aircraft-Generated Emissions and Noise atBoston Logan, Dated May 30, 2017
Simaiakis, I, Khadilkar, H., Balakrishnan, H., Reynolds, T.G., Hansman, R.J., Reilly, B., and Urlass, S.“Demonstration of Reduced Airport Congestion Through Pushback Rate Control.” Ninth USA/Europe AirTraffic Management Research and Development Seminar (ATM2011).
Appendix L. Reduced/Single Engine Taxiing at Logan Airport Memoranda L-1
This Page Intentionally Left Blank.
Appendix L. Reduced/Single Engine Taxiing at Logan Airport Memoranda L-2
Appendix L. Reduced/Single Engine Taxiing at Logan Airport Memoranda L-3
Appendix L. Reduced/Single Engine Taxiing at Logan Airport Memoranda L-4
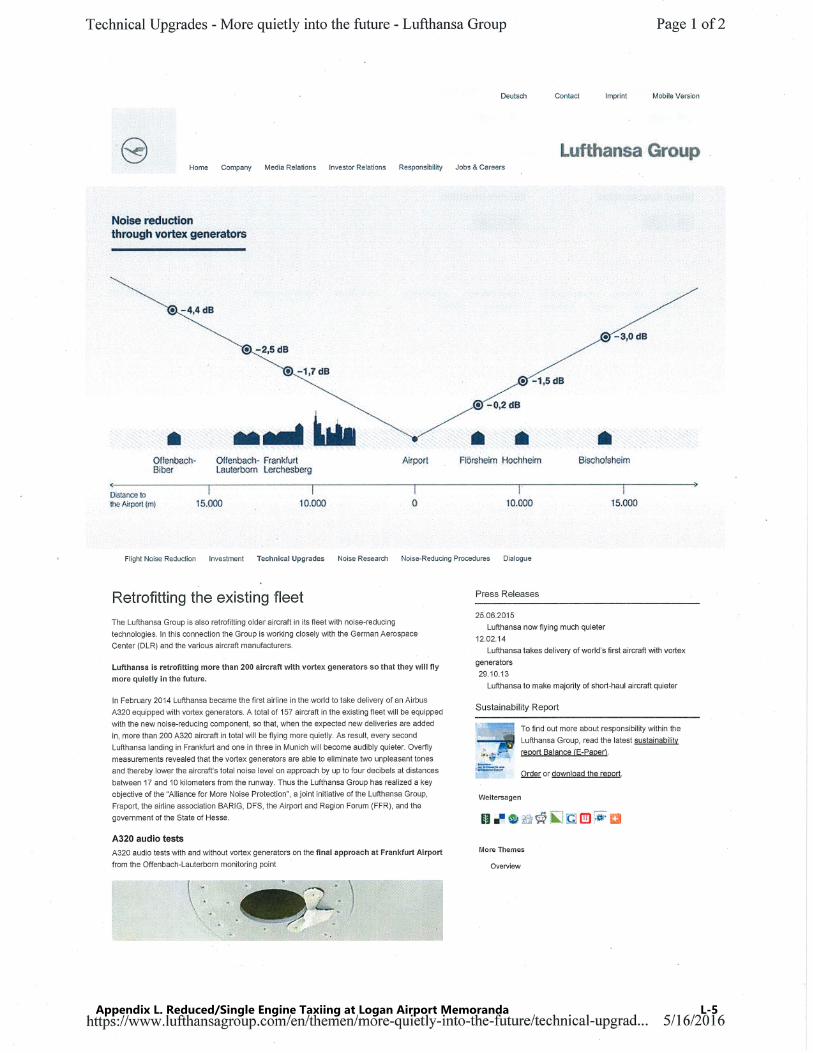
Appendix L. Reduced/Single Engine Taxiing at Logan Airport Memoranda L-5
Appendix L. Reduced/Single Engine Taxiing at Logan Airport Memoranda L-6
Appendix L. Reduced/Single Engine Taxiing at Logan Airport Memoranda L-7
Appendix L. Reduced/Single Engine Taxiing at Logan Airport Memoranda L-8
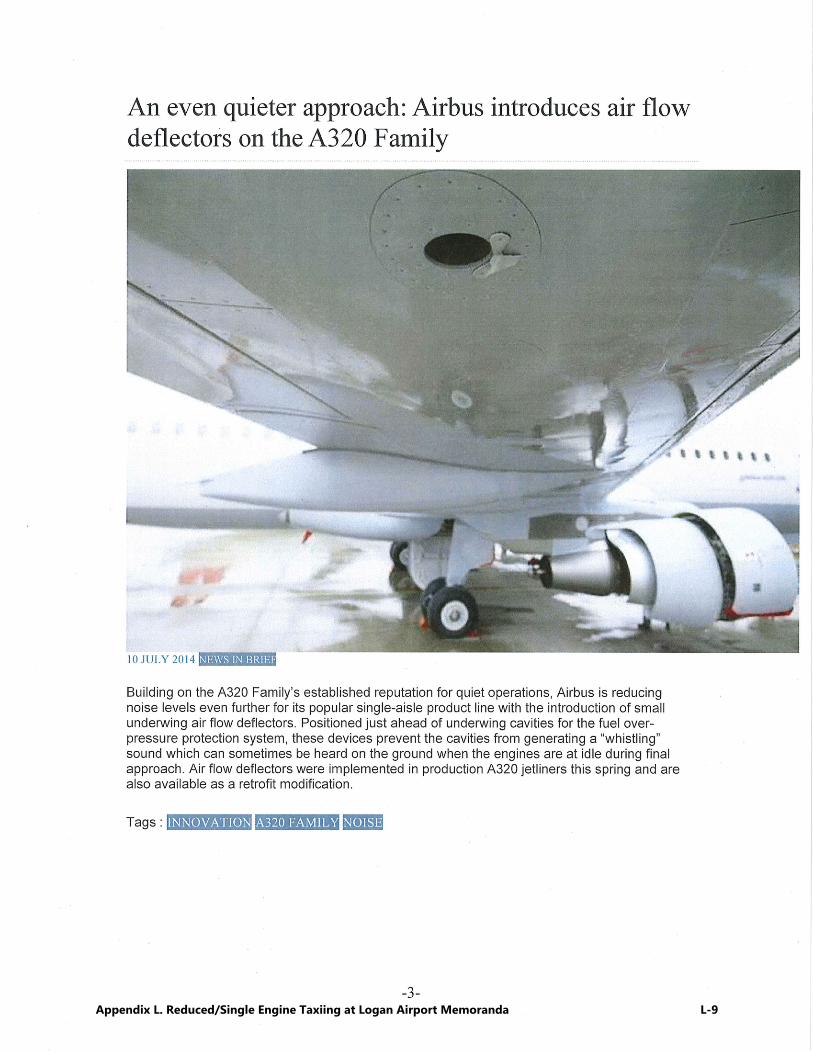
Appendix L. Reduced/Single Engine Taxiing at Logan Airport Memoranda L-9
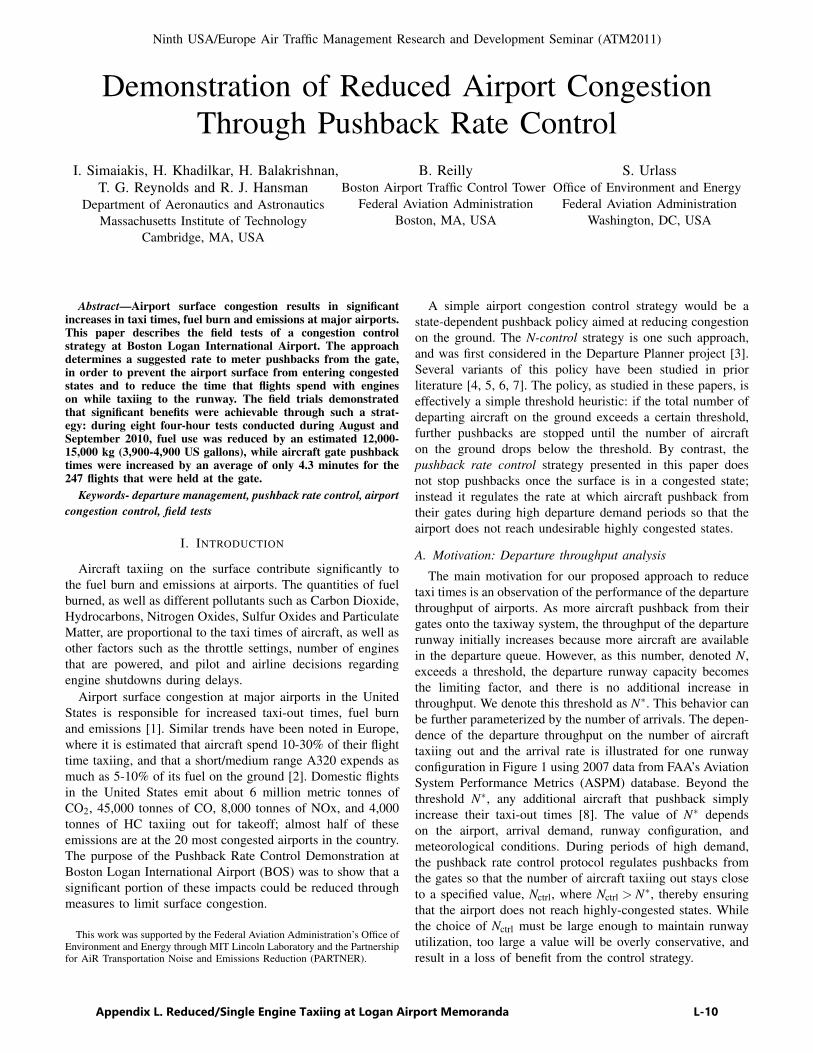
Ninth USA/Europe Air Traffic Management Research and Development Seminar (ATM2011)
Demonstration of Reduced Airport CongestionThrough Pushback Rate Control
I. Simaiakis, H. Khadilkar, H. Balakrishnan,T. G. Reynolds and R. J. Hansman
Department of Aeronautics and AstronauticsMassachusetts Institute of Technology
Cambridge, MA, USA
B. ReillyBoston Airport Traffic Control Tower
Federal Aviation AdministrationBoston, MA, USA
S. UrlassOffice of Environment and Energy
Federal Aviation AdministrationWashington, DC, USA
Abstract—Airport surface congestion results in significantincreases in taxi times, fuel burn and emissions at major airports.This paper describes the field tests of a congestion controlstrategy at Boston Logan International Airport. The approachdetermines a suggested rate to meter pushbacks from the gate,in order to prevent the airport surface from entering congestedstates and to reduce the time that flights spend with engineson while taxiing to the runway. The field trials demonstratedthat significant benefits were achievable through such a strat-egy: during eight four-hour tests conducted during August andSeptember 2010, fuel use was reduced by an estimated 12,000-15,000 kg (3,900-4,900 US gallons), while aircraft gate pushbacktimes were increased by an average of only 4.3 minutes for the247 flights that were held at the gate.
Keywords- departure management, pushback rate control, airportcongestion control, field tests
I. INTRODUCTION
Aircraft taxiing on the surface contribute significantly tothe fuel burn and emissions at airports. The quantities of fuelburned, as well as different pollutants such as Carbon Dioxide,Hydrocarbons, Nitrogen Oxides, Sulfur Oxides and ParticulateMatter, are proportional to the taxi times of aircraft, as well asother factors such as the throttle settings, number of enginesthat are powered, and pilot and airline decisions regardingengine shutdowns during delays.
Airport surface congestion at major airports in the UnitedStates is responsible for increased taxi-out times, fuel burnand emissions [1]. Similar trends have been noted in Europe,where it is estimated that aircraft spend 10-30% of their flighttime taxiing, and that a short/medium range A320 expends asmuch as 5-10% of its fuel on the ground [2]. Domestic flightsin the United States emit about 6 million metric tonnes ofCO2, 45,000 tonnes of CO, 8,000 tonnes of NOx, and 4,000tonnes of HC taxiing out for takeoff; almost half of theseemissions are at the 20 most congested airports in the country.The purpose of the Pushback Rate Control Demonstration atBoston Logan International Airport (BOS) was to show that asignificant portion of these impacts could be reduced throughmeasures to limit surface congestion.
This work was supported by the Federal Aviation Administration’s Office ofEnvironment and Energy through MIT Lincoln Laboratory and the Partnershipfor AiR Transportation Noise and Emissions Reduction (PARTNER).
A simple airport congestion control strategy would be astate-dependent pushback policy aimed at reducing congestionon the ground. The N-control strategy is one such approach,and was first considered in the Departure Planner project [3].Several variants of this policy have been studied in priorliterature [4, 5, 6, 7]. The policy, as studied in these papers, iseffectively a simple threshold heuristic: if the total number ofdeparting aircraft on the ground exceeds a certain threshold,further pushbacks are stopped until the number of aircrafton the ground drops below the threshold. By contrast, thepushback rate control strategy presented in this paper doesnot stop pushbacks once the surface is in a congested state;instead it regulates the rate at which aircraft pushback fromtheir gates during high departure demand periods so that theairport does not reach undesirable highly congested states.
A. Motivation: Departure throughput analysis
The main motivation for our proposed approach to reducetaxi times is an observation of the performance of the departurethroughput of airports. As more aircraft pushback from theirgates onto the taxiway system, the throughput of the departurerunway initially increases because more aircraft are availablein the departure queue. However, as this number, denoted N,exceeds a threshold, the departure runway capacity becomesthe limiting factor, and there is no additional increase inthroughput. We denote this threshold as N∗. This behavior canbe further parameterized by the number of arrivals. The depen-dence of the departure throughput on the number of aircrafttaxiing out and the arrival rate is illustrated for one runwayconfiguration in Figure 1 using 2007 data from FAA’s AviationSystem Performance Metrics (ASPM) database. Beyond thethreshold N∗, any additional aircraft that pushback simplyincrease their taxi-out times [8]. The value of N∗ dependson the airport, arrival demand, runway configuration, andmeteorological conditions. During periods of high demand,the pushback rate control protocol regulates pushbacks fromthe gates so that the number of aircraft taxiing out stays closeto a specified value, Nctrl, where Nctrl > N∗, thereby ensuringthat the airport does not reach highly-congested states. Whilethe choice of Nctrl must be large enough to maintain runwayutilization, too large a value will be overly conservative, andresult in a loss of benefit from the control strategy.
Appendix L. Reduced/Single Engine Taxiing at Logan Airport Memoranda L-10
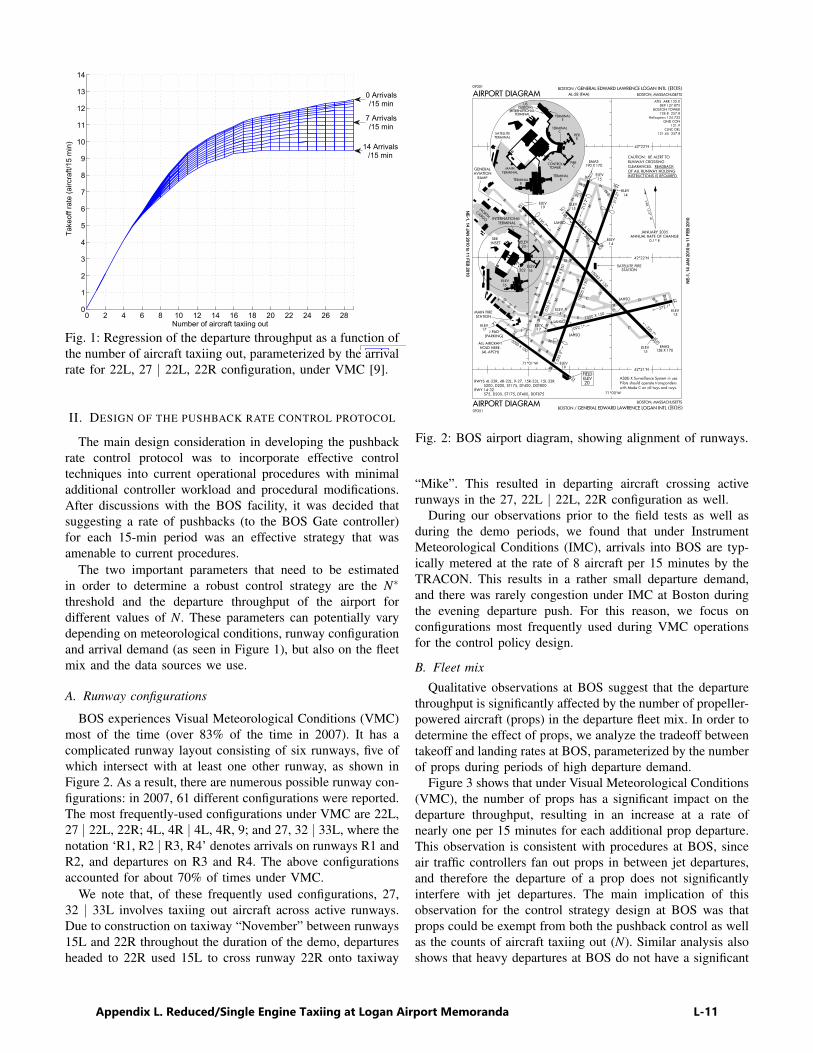
0 2 4 6 8 10 12 14 16 18 20 22 24 26 280
1
2
3
4
5
6
7
8
9
10
11
12
13
14
Number of aircraft taxiing out
Take
off r
ate
(airc
raft/
15 m
in)
14 Arrivals/15 min
7 Arrivals/15 min
0 Arrivals/15 min
Fig. 1: Regression of the departure throughput as a function ofthe number of aircraft taxiing out, parameterized by the arrivalrate for 22L, 27 | 22L, 22R configuration, under VMC [9].
II. DESIGN OF THE PUSHBACK RATE CONTROL PROTOCOL
The main design consideration in developing the pushbackrate control protocol was to incorporate effective controltechniques into current operational procedures with minimaladditional controller workload and procedural modifications.After discussions with the BOS facility, it was decided thatsuggesting a rate of pushbacks (to the BOS Gate controller)for each 15-min period was an effective strategy that wasamenable to current procedures.
The two important parameters that need to be estimatedin order to determine a robust control strategy are the N∗
threshold and the departure throughput of the airport fordifferent values of N. These parameters can potentially varydepending on meteorological conditions, runway configurationand arrival demand (as seen in Figure 1), but also on the fleetmix and the data sources we use.
A. Runway configurations
BOS experiences Visual Meteorological Conditions (VMC)most of the time (over 83% of the time in 2007). It has acomplicated runway layout consisting of six runways, five ofwhich intersect with at least one other runway, as shown inFigure 2. As a result, there are numerous possible runway con-figurations: in 2007, 61 different configurations were reported.The most frequently-used configurations under VMC are 22L,27 | 22L, 22R; 4L, 4R | 4L, 4R, 9; and 27, 32 | 33L, where thenotation ‘R1, R2 | R3, R4’ denotes arrivals on runways R1 andR2, and departures on R3 and R4. The above configurationsaccounted for about 70% of times under VMC.
We note that, of these frequently used configurations, 27,32 | 33L involves taxiing out aircraft across active runways.Due to construction on taxiway “November” between runways15L and 22R throughout the duration of the demo, departuresheaded to 22R used 15L to cross runway 22R onto taxiway
GENERAL EDWARD LAWRENCE LOGAN INTL (BOS)BOSTON /09351
BOSTON, MASSACHUSETTS
4R
BELEV
15
ELEV19
035.2^
FIELDELEV
20
71^01’W
71^00’W
42^21’N
AIRPORT DIAGRAM
M
ALL AIRCRAFTHOLD HERE.
(4L-APCH)
RWYS 4L-22R, 4R-22L, 9-27, 15R-33L, 15L-33R S200, D200, ST175, DT400, DDT800RWY 14-32 S75, D200, ST175, DT400, DDT875
E-2
MAINTERMINAL
SATELLITETERMINAL
09351
NORTHCARGO
GENERALAVIATION
RAMP
SEEINSET
ELEV 16
AIRPORT DIAGRAM
14
ELEV17
J PAD(PARKING)
B
K
MAIN FIRESTATION
33LM-1
EMAS158 X 170
INTERNATIONALTERMINAL
27
9
D-2
D-1D
C
4L
C
E
C
M
EK
B
A-2
A
K
EE-1
7000 X 150
10005 X 150
ELEV15
272.1^
330.7^092.1^
035.2^
LAHSO
LAHSO
LAHSO
B
J
J
J-1
A
B
CONTROLTOWER
PIERC
TERMINALB
TERMINALB
USCUSTOMS
22R
22LN
N-3
R
Y
33R
15L
N-2
N-1
N
N
15R
Q
F
H
B
A Z
L
A-1
F
Q
C
B
10083 X 150
7861 X 150
ELEV15
ELEV14
ELEV15
ELEV14
215.2^
215.2^
150.7^
330.7^
N
150.7^
42^22’N
CAUTION: BE ALERT TORUNWAY CROSSINGCLEARANCES. READBACKOF ALL RUNWAY HOLDINGINSTRUCTIONS IS REQUIRED.
VAR 15 .5^ W
JANUARY 2005ANNUAL RATE OF CHANGE
0.1^ EELEV 20
ELEV 16
A
LAHSO
EMAS190 X 170
ELEV19
302
x
2557 X 100
SATELLITE FIRESTATION
M
M
M
PIERB
TERMINALC
TERMINALE
BOSTON / GENERAL EDWARD LAWRENCE LOGAN INTLAL-58 (FAA) BOSTON, MASSACHUSETTS
(BOS)
42^23’N
ELEV14
MM
ELEV17
P
E
K
M
M
M
DC
D
G
INTERNATIONAL TERMINAL
5000 X 100
ATIS ARR 135.0 DEP 127.875
BOSTON TOWER128.8 257.8
Hel icopters 124.725GND CON
121.9CLNC DEL
121.65 257.8
ASDE-X Survei l lance System in use. P i lo ts should operate t ransponderswi th Mode C on a l l twys and rwys.
32
NE-1, 14 JAN
2010 to 11 FEB 2010
NE-
1, 1
4 JA
N 2
010
to 1
1 FE
B 20
10
Fig. 2: BOS airport diagram, showing alignment of runways.
“Mike”. This resulted in departing aircraft crossing activerunways in the 27, 22L | 22L, 22R configuration as well.
During our observations prior to the field tests as well asduring the demo periods, we found that under InstrumentMeteorological Conditions (IMC), arrivals into BOS are typ-ically metered at the rate of 8 aircraft per 15 minutes by theTRACON. This results in a rather small departure demand,and there was rarely congestion under IMC at Boston duringthe evening departure push. For this reason, we focus onconfigurations most frequently used during VMC operationsfor the control policy design.
B. Fleet mix
Qualitative observations at BOS suggest that the departurethroughput is significantly affected by the number of propeller-powered aircraft (props) in the departure fleet mix. In order todetermine the effect of props, we analyze the tradeoff betweentakeoff and landing rates at BOS, parameterized by the numberof props during periods of high departure demand.
Figure 3 shows that under Visual Meteorological Conditions(VMC), the number of props has a significant impact on thedeparture throughput, resulting in an increase at a rate ofnearly one per 15 minutes for each additional prop departure.This observation is consistent with procedures at BOS, sinceair traffic controllers fan out props in between jet departures,and therefore the departure of a prop does not significantlyinterfere with jet departures. The main implication of thisobservation for the control strategy design at BOS was thatprops could be exempt from both the pushback control as wellas the counts of aircraft taxiing out (N). Similar analysis alsoshows that heavy departures at BOS do not have a significant
Appendix L. Reduced/Single Engine Taxiing at Logan Airport Memoranda L-11

0 1 2 3 4 5 6 7 8 9 10 11 12 13 140
1
2
3
4
5
6
7
8
9
10
11
12
13
14
Landings rate (AC/15 min)
Takeoffrate
(AC/15min)
Average Fleet Mix Throughput
0 Props Fleet Mix Throughput
1 Props Fleet Mix Throughput
2 Props Fleet Mix Throughput
3 Props Fleet Mix Throughput
4 Props Fleet Mix Throughput
5 Props Fleet Mix Throughput
Fig. 3: Regression of the takeoff rate as a function of thelanding rate, parameterized by the number of props in a 15-minute interval for 22L, 27 | 22L, 22R configuration, underVMC [9].
impact on departure throughput, in spite of the increasedwake-vortex separation that is required behind heavy weightcategory aircraft. This can be explained by the observationthat air traffic controllers at BOS use the high wake vortexseparation requirement between a heavy and a subsequentdeparture to conduct runway crossings, thereby mitigating theadverse impact of heavy weight category departures [9].
Motivated by this finding, we can determine the dependenceof the jet (i.e., non-prop) departure throughput as a functionof the number of jet aircraft taxiing out, parameterized bythe number of arrivals, as illustrated in Figure 4. This figureillustrates that during periods in which arrival demand is high,the jet departure throughput saturates when the number of jetstaxiing out exceeds 17 (based on ASPM data).
C. Data sources
It is important to note that Figure 1, Figure 3 and Figure 4are determined using ASPM data. Pushback times in ASPMare determined from the brake release times reported throughthe ACARS system, and are prone to error because about40% of the flights departing from BOS do not automaticallyreport these times [10]. Another potential source of pushbackand takeoff times is the Airport Surface Detection EquipmentModel X (or ASDE-X) system, which combines data fromairport surface radars, multilateration sensors, ADS-B, andaircraft transponders [11]. While the ASDE-X data is likely tobe more accurate than the ASPM data, it is still noisy, due tofactors such as late transponder capture (the ASDE-X tracksonly begin after the pilot has turned on the transponder, whichmay be before or after the actual pushback time), abortedtakeoffs (which have multiple departure times detected), flightscancelled after pushback, etc. A comparison of both ASDE-X and ASPM records with live observations made in thetower on August 26, 2010 revealed that the average differencebetween the number of pushbacks per 15-minutes as recordedby ASDE-X and by visual means is 0.42, while it is -3.25
0 2 4 6 8 10 12 14 16 18 20 22 240
1
2
3
4
5
6
7
8
9
10
11
12
Number of jet aircraft taxiing out
Take
off r
ate
(jets
/15
min
)
0 Arrivals/15 min
14 Arrivals/15 min
7 Arrivals/15 min
Fig. 4: Regression of the jet takeoff rate as a function of thenumber of departing jets on the ground, parameterized by thenumber of arrivals for 22L, 27 | 22L, 22R configuration, underVMC [9].
for ASPM and visual observations, showing that the ASPMrecords differ considerably from ASDE-X and live observa-tions. The above comparison motivates the recalibration ofairport performance curves and parameters using ASDE-Xdata in addition to ASPM data. This is because ASPM data isnot available in real-time and will therefore not be availablefor use in real-time deployments, and the ASDE-X data is inmuch closer agreement to the visual observations than ASPM.
We therefore conduct similar analysis to that shown inFigure 4, using ASDE-X data. The results are shown in Figure5. We note that the qualitative behavior of the system is similarto what was seen with ASPM data, namely, the jet throughputof the departure runway initially increases because more jetaircraft are available in the departure queue, but as this numberexceeds a threshold, the departure runway capacity becomesthe limiting factor, and there is no additional increase inthroughput. By statistically analyzing three months of ASDE-X data from Boston Logan airport using the methodologyoutlined in [9], we determine that the average number of activejet departures on the ground at which the surface saturates is12 jet aircraft for the 22L, 27 | 22L, 22R configuration, duringperiods of moderate arrival demand. This value is close to thatdeduced from Figure 5, using visual means.
D. Estimates of N∗
Table I shows the values of N∗ for the three main runwayconfigurations under VMC, that were used during the fieldtests based on the ASDE-X data analysis. For each runwayconfiguration, we use plots similar to Figure 5 to determine theexpected throughput. For example, if the runway configurationis 22L, 27 | 22L, 22R, 11 jets are taxiing out, and the expectedarrival rate is 9 aircraft in the next 15 minutes, the expecteddeparture throughput is 10 aircraft in the next 15 minutes.
Appendix L. Reduced/Single Engine Taxiing at Logan Airport Memoranda L-12
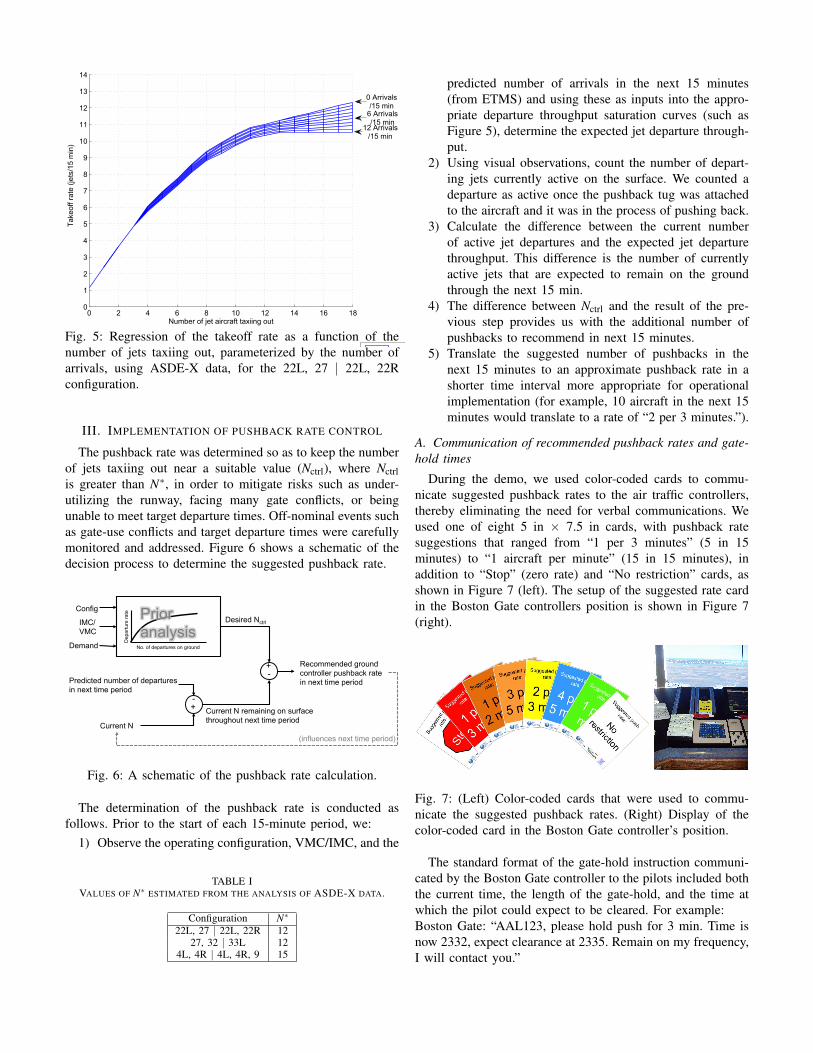
0 2 4 6 8 10 12 14 16 180
1
2
3
4
5
6
7
8
9
10
11
12
13
14
Number of jet aircraft taxiing out
Take
off r
ate
(jets
/15
min
)
0 Arrivals/15 min
6 Arrivals/15 min
12 Arrivals/15 min
Fig. 5: Regression of the takeoff rate as a function of thenumber of jets taxiing out, parameterized by the number ofarrivals, using ASDE-X data, for the 22L, 27 | 22L, 22Rconfiguration.
III. IMPLEMENTATION OF PUSHBACK RATE CONTROL
The pushback rate was determined so as to keep the numberof jets taxiing out near a suitable value (Nctrl), where Nctrlis greater than N∗, in order to mitigate risks such as under-utilizing the runway, facing many gate conflicts, or beingunable to meet target departure times. Off-nominal events suchas gate-use conflicts and target departure times were carefullymonitored and addressed. Figure 6 shows a schematic of thedecision process to determine the suggested pushback rate.
Config
IMC/ VMC
Demand
Desired Nctrl
Current N
Predicted number of departures in next time period
Recommended ground controller pushback rate in next time period
(influences next time period)
+ -
Current N remaining on surface throughout next time period
+ -
No. of departures on ground
Dep
artu
re ra
te
Fig. 6: A schematic of the pushback rate calculation.
The determination of the pushback rate is conducted asfollows. Prior to the start of each 15-minute period, we:
1) Observe the operating configuration, VMC/IMC, and the
TABLE IVALUES OF N∗ ESTIMATED FROM THE ANALYSIS OF ASDE-X DATA.
Configuration N∗
22L, 27 | 22L, 22R 1227, 32 | 33L 12
4L, 4R | 4L, 4R, 9 15
predicted number of arrivals in the next 15 minutes(from ETMS) and using these as inputs into the appro-priate departure throughput saturation curves (such asFigure 5), determine the expected jet departure through-put.
2) Using visual observations, count the number of depart-ing jets currently active on the surface. We counted adeparture as active once the pushback tug was attachedto the aircraft and it was in the process of pushing back.
3) Calculate the difference between the current numberof active jet departures and the expected jet departurethroughput. This difference is the number of currentlyactive jets that are expected to remain on the groundthrough the next 15 min.
4) The difference between Nctrl and the result of the pre-vious step provides us with the additional number ofpushbacks to recommend in next 15 minutes.
5) Translate the suggested number of pushbacks in thenext 15 minutes to an approximate pushback rate in ashorter time interval more appropriate for operationalimplementation (for example, 10 aircraft in the next 15minutes would translate to a rate of “2 per 3 minutes.”).
A. Communication of recommended pushback rates and gate-hold times
During the demo, we used color-coded cards to commu-nicate suggested pushback rates to the air traffic controllers,thereby eliminating the need for verbal communications. Weused one of eight 5 in × 7.5 in cards, with pushback ratesuggestions that ranged from “1 per 3 minutes” (5 in 15minutes) to “1 aircraft per minute” (15 in 15 minutes), inaddition to “Stop” (zero rate) and “No restriction” cards, asshown in Figure 7 (left). The setup of the suggested rate cardin the Boston Gate controllers position is shown in Figure 7(right).
Fig. 7: (Left) Color-coded cards that were used to commu-nicate the suggested pushback rates. (Right) Display of thecolor-coded card in the Boston Gate controller’s position.
The standard format of the gate-hold instruction communi-cated by the Boston Gate controller to the pilots included boththe current time, the length of the gate-hold, and the time atwhich the pilot could expect to be cleared. For example:Boston Gate: “AAL123, please hold push for 3 min. Time isnow 2332, expect clearance at 2335. Remain on my frequency,I will contact you.”
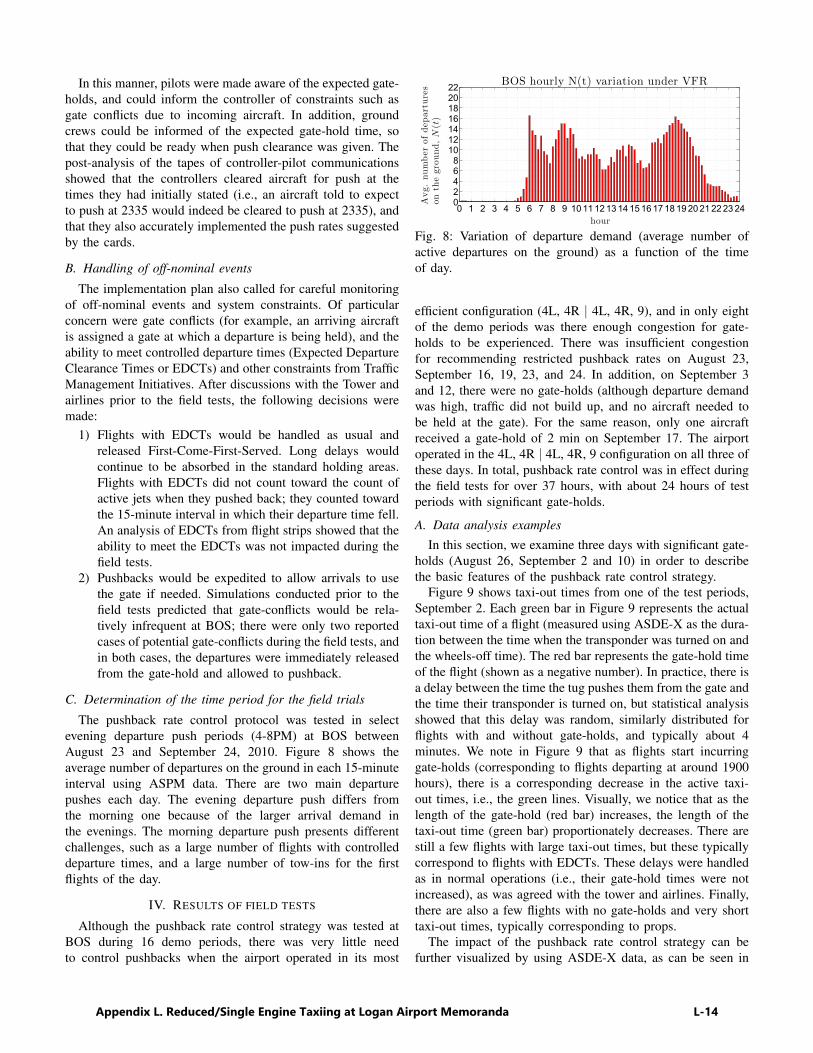
In this manner, pilots were made aware of the expected gate-holds, and could inform the controller of constraints such asgate conflicts due to incoming aircraft. In addition, groundcrews could be informed of the expected gate-hold time, sothat they could be ready when push clearance was given. Thepost-analysis of the tapes of controller-pilot communicationsshowed that the controllers cleared aircraft for push at thetimes they had initially stated (i.e., an aircraft told to expectto push at 2335 would indeed be cleared to push at 2335), andthat they also accurately implemented the push rates suggestedby the cards.
B. Handling of off-nominal events
The implementation plan also called for careful monitoringof off-nominal events and system constraints. Of particularconcern were gate conflicts (for example, an arriving aircraftis assigned a gate at which a departure is being held), and theability to meet controlled departure times (Expected DepartureClearance Times or EDCTs) and other constraints from TrafficManagement Initiatives. After discussions with the Tower andairlines prior to the field tests, the following decisions weremade:
1) Flights with EDCTs would be handled as usual andreleased First-Come-First-Served. Long delays wouldcontinue to be absorbed in the standard holding areas.Flights with EDCTs did not count toward the count ofactive jets when they pushed back; they counted towardthe 15-minute interval in which their departure time fell.An analysis of EDCTs from flight strips showed that theability to meet the EDCTs was not impacted during thefield tests.
2) Pushbacks would be expedited to allow arrivals to usethe gate if needed. Simulations conducted prior to thefield tests predicted that gate-conflicts would be rela-tively infrequent at BOS; there were only two reportedcases of potential gate-conflicts during the field tests, andin both cases, the departures were immediately releasedfrom the gate-hold and allowed to pushback.
C. Determination of the time period for the field trials
The pushback rate control protocol was tested in selectevening departure push periods (4-8PM) at BOS betweenAugust 23 and September 24, 2010. Figure 8 shows theaverage number of departures on the ground in each 15-minuteinterval using ASPM data. There are two main departurepushes each day. The evening departure push differs fromthe morning one because of the larger arrival demand inthe evenings. The morning departure push presents differentchallenges, such as a large number of flights with controlleddeparture times, and a large number of tow-ins for the firstflights of the day.
IV. RESULTS OF FIELD TESTS
Although the pushback rate control strategy was tested atBOS during 16 demo periods, there was very little needto control pushbacks when the airport operated in its most
0 1 2 3 4 5 6 7 8 9 10 11 12 13 14 15 16 17 18 19 20 21 22 23 2402468
10121416182022
hour
Avg.number
ofdep
artures
onth
eground,N(t)
BOS hourly N(t) variation under VFR
Fig. 8: Variation of departure demand (average number ofactive departures on the ground) as a function of the timeof day.
efficient configuration (4L, 4R | 4L, 4R, 9), and in only eightof the demo periods was there enough congestion for gate-holds to be experienced. There was insufficient congestionfor recommending restricted pushback rates on August 23,September 16, 19, 23, and 24. In addition, on September 3and 12, there were no gate-holds (although departure demandwas high, traffic did not build up, and no aircraft needed tobe held at the gate). For the same reason, only one aircraftreceived a gate-hold of 2 min on September 17. The airportoperated in the 4L, 4R | 4L, 4R, 9 configuration on all three ofthese days. In total, pushback rate control was in effect duringthe field tests for over 37 hours, with about 24 hours of testperiods with significant gate-holds.
A. Data analysis examples
In this section, we examine three days with significant gate-holds (August 26, September 2 and 10) in order to describethe basic features of the pushback rate control strategy.
Figure 9 shows taxi-out times from one of the test periods,September 2. Each green bar in Figure 9 represents the actualtaxi-out time of a flight (measured using ASDE-X as the dura-tion between the time when the transponder was turned on andthe wheels-off time). The red bar represents the gate-hold timeof the flight (shown as a negative number). In practice, there isa delay between the time the tug pushes them from the gate andthe time their transponder is turned on, but statistical analysisshowed that this delay was random, similarly distributed forflights with and without gate-holds, and typically about 4minutes. We note in Figure 9 that as flights start incurringgate-holds (corresponding to flights departing at around 1900hours), there is a corresponding decrease in the active taxi-out times, i.e., the green lines. Visually, we notice that as thelength of the gate-hold (red bar) increases, the length of thetaxi-out time (green bar) proportionately decreases. There arestill a few flights with large taxi-out times, but these typicallycorrespond to flights with EDCTs. These delays were handledas in normal operations (i.e., their gate-hold times were notincreased), as was agreed with the tower and airlines. Finally,there are also a few flights with no gate-holds and very shorttaxi-out times, typically corresponding to props.
The impact of the pushback rate control strategy can befurther visualized by using ASDE-X data, as can be seen in
Appendix L. Reduced/Single Engine Taxiing at Logan Airport Memoranda L-14
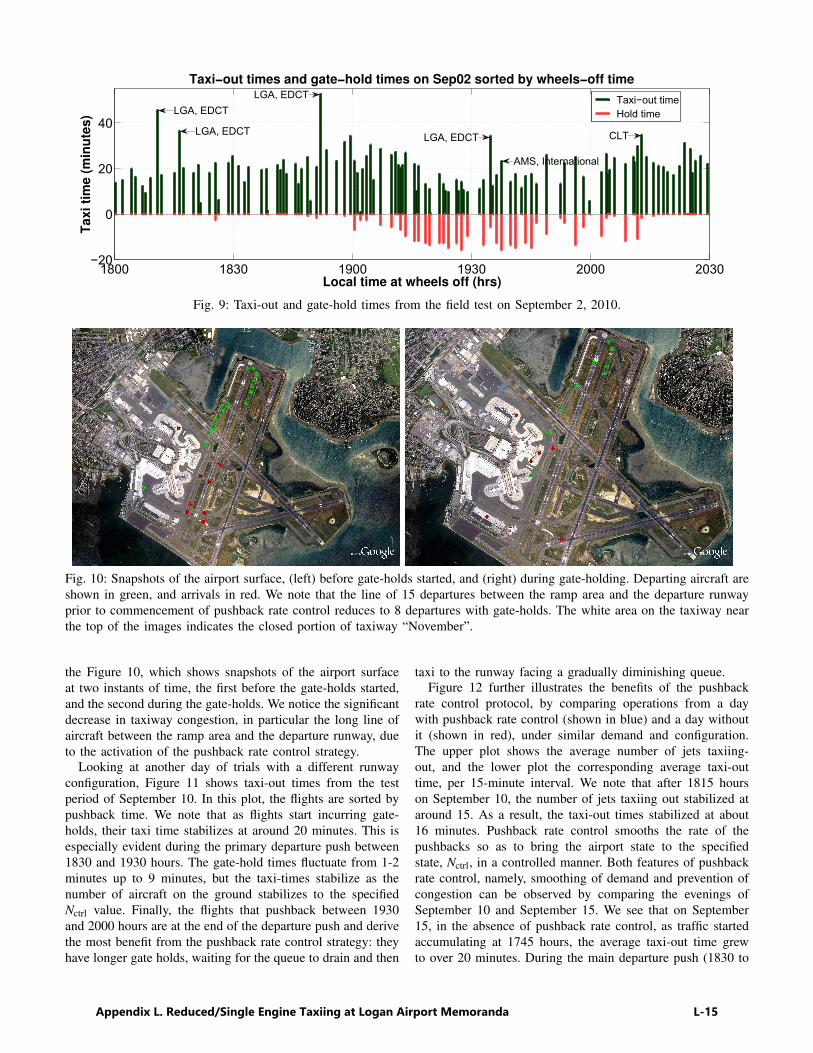
1800 1830 1900 1930 2000 2030−20
0
20
40
Taxi−out times and gate−hold times on Sep02 sorted by wheels−off time
Local time at wheels off (hrs)
Taxi ti
me (
min
ute
s)
Taxi−out timeHold time
LGA, EDCT
LGA, EDCTLGA, EDCT
LGA, EDCT CLT
AMS, International
Fig. 9: Taxi-out and gate-hold times from the field test on September 2, 2010.
Fig. 10: Snapshots of the airport surface, (left) before gate-holds started, and (right) during gate-holding. Departing aircraft areshown in green, and arrivals in red. We note that the line of 15 departures between the ramp area and the departure runwayprior to commencement of pushback rate control reduces to 8 departures with gate-holds. The white area on the taxiway nearthe top of the images indicates the closed portion of taxiway “November”.
the Figure 10, which shows snapshots of the airport surfaceat two instants of time, the first before the gate-holds started,and the second during the gate-holds. We notice the significantdecrease in taxiway congestion, in particular the long line ofaircraft between the ramp area and the departure runway, dueto the activation of the pushback rate control strategy.
Looking at another day of trials with a different runwayconfiguration, Figure 11 shows taxi-out times from the testperiod of September 10. In this plot, the flights are sorted bypushback time. We note that as flights start incurring gate-holds, their taxi time stabilizes at around 20 minutes. This isespecially evident during the primary departure push between1830 and 1930 hours. The gate-hold times fluctuate from 1-2minutes up to 9 minutes, but the taxi-times stabilize as thenumber of aircraft on the ground stabilizes to the specifiedNctrl value. Finally, the flights that pushback between 1930and 2000 hours are at the end of the departure push and derivethe most benefit from the pushback rate control strategy: theyhave longer gate holds, waiting for the queue to drain and then
taxi to the runway facing a gradually diminishing queue.Figure 12 further illustrates the benefits of the pushback
rate control protocol, by comparing operations from a daywith pushback rate control (shown in blue) and a day withoutit (shown in red), under similar demand and configuration.The upper plot shows the average number of jets taxiing-out, and the lower plot the corresponding average taxi-outtime, per 15-minute interval. We note that after 1815 hourson September 10, the number of jets taxiing out stabilized ataround 15. As a result, the taxi-out times stabilized at about16 minutes. Pushback rate control smooths the rate of thepushbacks so as to bring the airport state to the specifiedstate, Nctrl, in a controlled manner. Both features of pushbackrate control, namely, smoothing of demand and prevention ofcongestion can be observed by comparing the evenings ofSeptember 10 and September 15. We see that on September15, in the absence of pushback rate control, as traffic startedaccumulating at 1745 hours, the average taxi-out time grewto over 20 minutes. During the main departure push (1830 to
Appendix L. Reduced/Single Engine Taxiing at Logan Airport Memoranda L-15
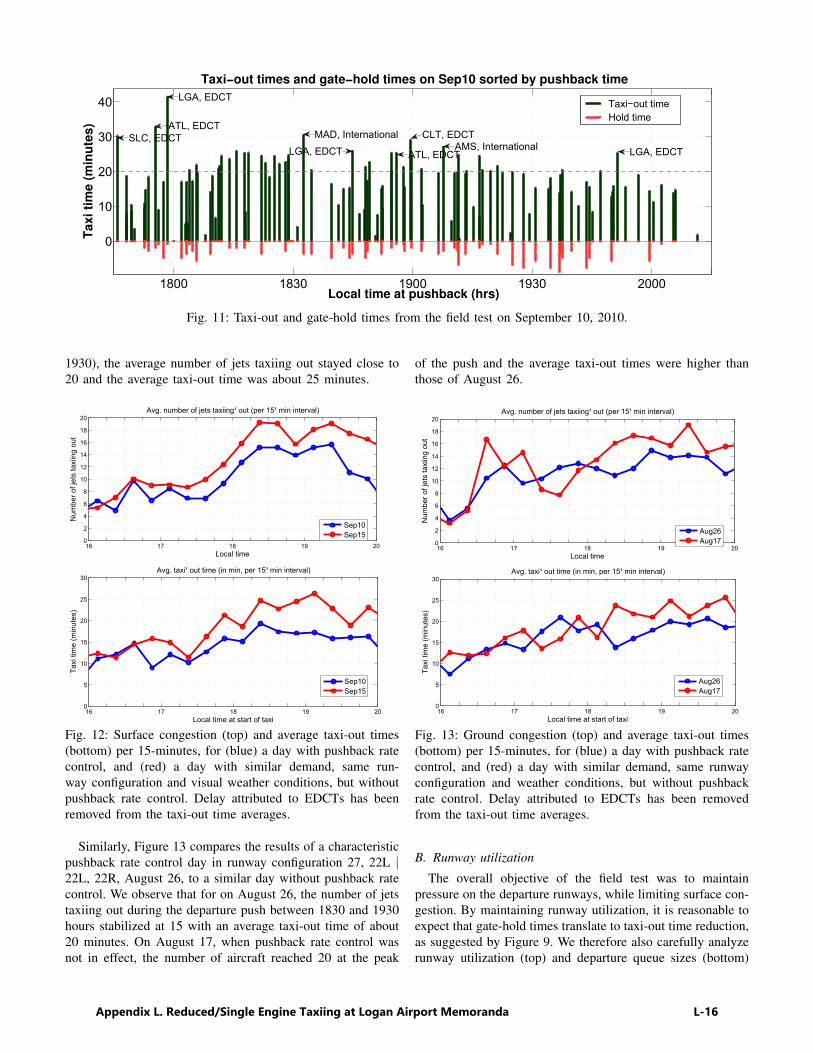
1800 1830 1900 1930 2000
0
10
20
30
40
Taxi−out times and gate−hold times on Sep10 sorted by pushback time
Local time at pushback (hrs)
Taxi ti
me (
min
ute
s)
Taxi−out time Hold time
SLC, EDCT
LGA, EDCT
ATL, EDCT
ATL, EDCT
MAD, International
LGA, EDCTAMS, InternationalLGA, EDCTCLT, EDCT
Fig. 11: Taxi-out and gate-hold times from the field test on September 10, 2010.
1930), the average number of jets taxiing out stayed close to20 and the average taxi-out time was about 25 minutes.
16 17 18 19 200
5
10
15
20
25
30Avg. taxi¹ out time (in min, per 15¹ min interval)
Taxi
tim
e (m
inut
es)
Local time at start of taxi
16 17 18 19 200
2
4
6
8
10
12
14
16
18
20Avg. number of jets taxiing¹ out (per 15¹ min interval)
Local time
Num
ber o
f jet
s ta
xiin
g ou
t
Sep10Sep15
Sep10Sep15
Fig. 12: Surface congestion (top) and average taxi-out times(bottom) per 15-minutes, for (blue) a day with pushback ratecontrol, and (red) a day with similar demand, same run-way configuration and visual weather conditions, but withoutpushback rate control. Delay attributed to EDCTs has beenremoved from the taxi-out time averages.
Similarly, Figure 13 compares the results of a characteristicpushback rate control day in runway configuration 27, 22L |22L, 22R, August 26, to a similar day without pushback ratecontrol. We observe that for on August 26, the number of jetstaxiing out during the departure push between 1830 and 1930hours stabilized at 15 with an average taxi-out time of about20 minutes. On August 17, when pushback rate control wasnot in effect, the number of aircraft reached 20 at the peak
of the push and the average taxi-out times were higher thanthose of August 26.
16 17 18 19 200
5
10
15
20
25
30Avg. taxi¹ out time (in min, per 15¹ min interval)
Taxi
tim
e (m
inut
es)
Local time at start of taxi
Aug26Aug17
16 17 18 19 200
2
4
6
8
10
12
14
16
18
20
Local time
Num
ber o
f jet
s ta
xiin
g ou
t
Avg. number of jets taxiing¹ out (per 15¹ min interval)
Aug26Aug17
Fig. 13: Ground congestion (top) and average taxi-out times(bottom) per 15-minutes, for (blue) a day with pushback ratecontrol, and (red) a day with similar demand, same runwayconfiguration and weather conditions, but without pushbackrate control. Delay attributed to EDCTs has been removedfrom the taxi-out time averages.
B. Runway utilization
The overall objective of the field test was to maintainpressure on the departure runways, while limiting surface con-gestion. By maintaining runway utilization, it is reasonable toexpect that gate-hold times translate to taxi-out time reduction,as suggested by Figure 9. We therefore also carefully analyzerunway utilization (top) and departure queue sizes (bottom)
Appendix L. Reduced/Single Engine Taxiing at Logan Airport Memoranda L-16
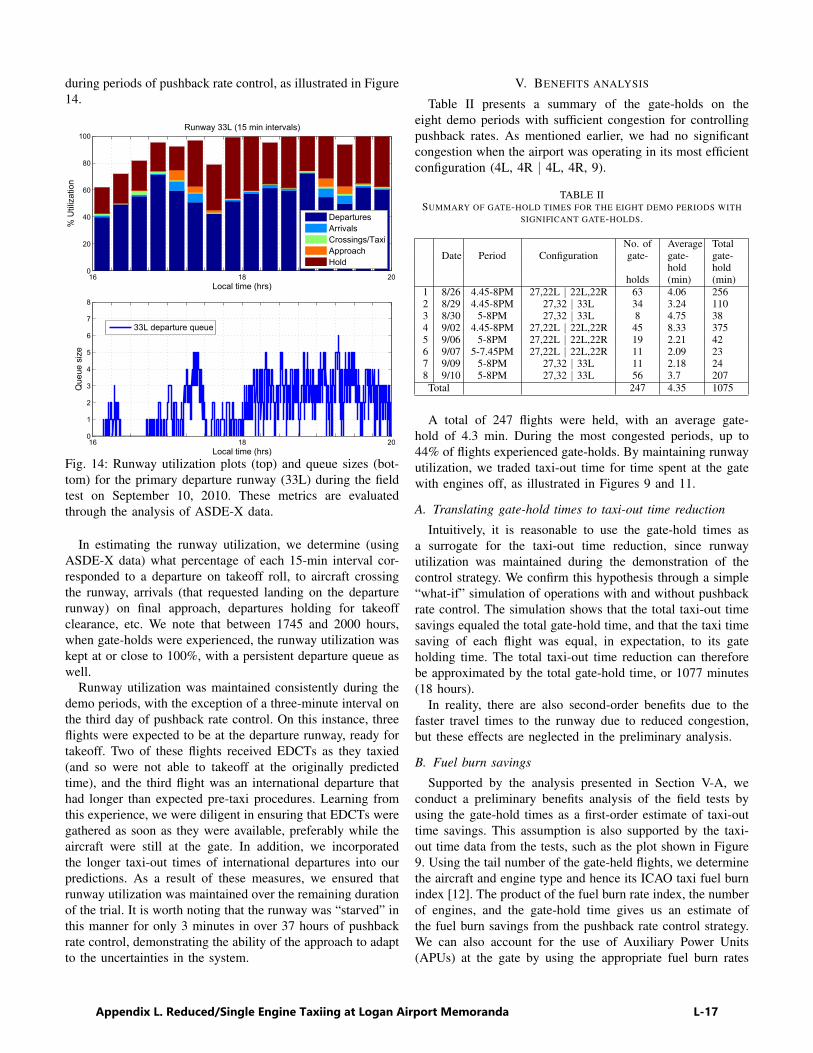
during periods of pushback rate control, as illustrated in Figure14.
16 18 200
20
40
60
80
100Runway 33L (15 min intervals)
Local time (hrs)
% U
tiliz
atio
n
DeparturesArrivalsCrossings/TaxiApproachHold
16 18 200
1
2
3
4
5
6
7
8
Local time (hrs)
Que
ue s
ize
33L departure queue
Fig. 14: Runway utilization plots (top) and queue sizes (bot-tom) for the primary departure runway (33L) during the fieldtest on September 10, 2010. These metrics are evaluatedthrough the analysis of ASDE-X data.
In estimating the runway utilization, we determine (usingASDE-X data) what percentage of each 15-min interval cor-responded to a departure on takeoff roll, to aircraft crossingthe runway, arrivals (that requested landing on the departurerunway) on final approach, departures holding for takeoffclearance, etc. We note that between 1745 and 2000 hours,when gate-holds were experienced, the runway utilization waskept at or close to 100%, with a persistent departure queue aswell.
Runway utilization was maintained consistently during thedemo periods, with the exception of a three-minute interval onthe third day of pushback rate control. On this instance, threeflights were expected to be at the departure runway, ready fortakeoff. Two of these flights received EDCTs as they taxied(and so were not able to takeoff at the originally predictedtime), and the third flight was an international departure thathad longer than expected pre-taxi procedures. Learning fromthis experience, we were diligent in ensuring that EDCTs weregathered as soon as they were available, preferably while theaircraft were still at the gate. In addition, we incorporatedthe longer taxi-out times of international departures into ourpredictions. As a result of these measures, we ensured thatrunway utilization was maintained over the remaining durationof the trial. It is worth noting that the runway was “starved” inthis manner for only 3 minutes in over 37 hours of pushbackrate control, demonstrating the ability of the approach to adaptto the uncertainties in the system.
V. BENEFITS ANALYSIS
Table II presents a summary of the gate-holds on theeight demo periods with sufficient congestion for controllingpushback rates. As mentioned earlier, we had no significantcongestion when the airport was operating in its most efficientconfiguration (4L, 4R | 4L, 4R, 9).
TABLE IISUMMARY OF GATE-HOLD TIMES FOR THE EIGHT DEMO PERIODS WITH
SIGNIFICANT GATE-HOLDS.
Date Period ConfigurationNo. of Average Totalgate- gate-
holdgate-hold
holds (min) (min)1 8/26 4.45-8PM 27,22L | 22L,22R 63 4.06 2562 8/29 4.45-8PM 27,32 | 33L 34 3.24 1103 8/30 5-8PM 27,32 | 33L 8 4.75 384 9/02 4.45-8PM 27,22L | 22L,22R 45 8.33 3755 9/06 5-8PM 27,22L | 22L,22R 19 2.21 426 9/07 5-7.45PM 27,22L | 22L,22R 11 2.09 237 9/09 5-8PM 27,32 | 33L 11 2.18 248 9/10 5-8PM 27,32 | 33L 56 3.7 207
Total 247 4.35 1075
A total of 247 flights were held, with an average gate-hold of 4.3 min. During the most congested periods, up to44% of flights experienced gate-holds. By maintaining runwayutilization, we traded taxi-out time for time spent at the gatewith engines off, as illustrated in Figures 9 and 11.
A. Translating gate-hold times to taxi-out time reduction
Intuitively, it is reasonable to use the gate-hold times asa surrogate for the taxi-out time reduction, since runwayutilization was maintained during the demonstration of thecontrol strategy. We confirm this hypothesis through a simple“what-if” simulation of operations with and without pushbackrate control. The simulation shows that the total taxi-out timesavings equaled the total gate-hold time, and that the taxi timesaving of each flight was equal, in expectation, to its gateholding time. The total taxi-out time reduction can thereforebe approximated by the total gate-hold time, or 1077 minutes(18 hours).
In reality, there are also second-order benefits due to thefaster travel times to the runway due to reduced congestion,but these effects are neglected in the preliminary analysis.
B. Fuel burn savings
Supported by the analysis presented in Section V-A, weconduct a preliminary benefits analysis of the field tests byusing the gate-hold times as a first-order estimate of taxi-outtime savings. This assumption is also supported by the taxi-out time data from the tests, such as the plot shown in Figure9. Using the tail number of the gate-held flights, we determinethe aircraft and engine type and hence its ICAO taxi fuel burnindex [12]. The product of the fuel burn rate index, the numberof engines, and the gate-hold time gives us an estimate ofthe fuel burn savings from the pushback rate control strategy.We can also account for the use of Auxiliary Power Units(APUs) at the gate by using the appropriate fuel burn rates
Appendix L. Reduced/Single Engine Taxiing at Logan Airport Memoranda L-17
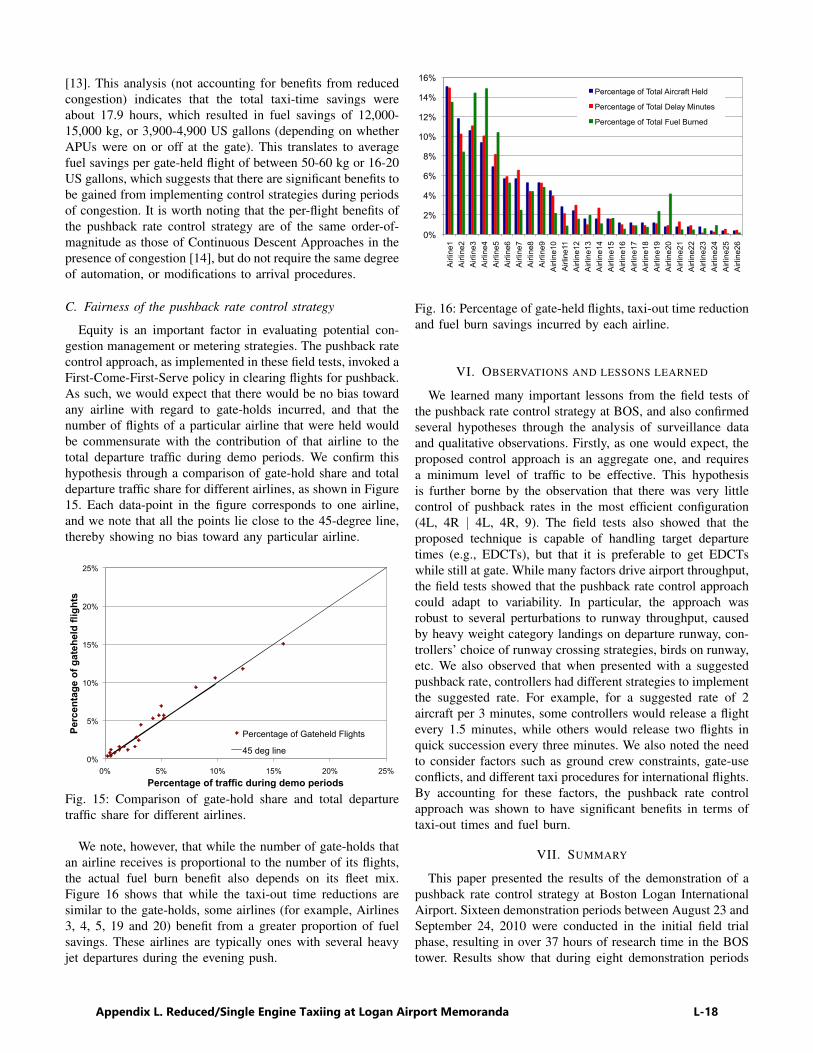
[13]. This analysis (not accounting for benefits from reducedcongestion) indicates that the total taxi-time savings wereabout 17.9 hours, which resulted in fuel savings of 12,000-15,000 kg, or 3,900-4,900 US gallons (depending on whetherAPUs were on or off at the gate). This translates to averagefuel savings per gate-held flight of between 50-60 kg or 16-20US gallons, which suggests that there are significant benefits tobe gained from implementing control strategies during periodsof congestion. It is worth noting that the per-flight benefits ofthe pushback rate control strategy are of the same order-of-magnitude as those of Continuous Descent Approaches in thepresence of congestion [14], but do not require the same degreeof automation, or modifications to arrival procedures.
C. Fairness of the pushback rate control strategy
Equity is an important factor in evaluating potential con-gestion management or metering strategies. The pushback ratecontrol approach, as implemented in these field tests, invoked aFirst-Come-First-Serve policy in clearing flights for pushback.As such, we would expect that there would be no bias towardany airline with regard to gate-holds incurred, and that thenumber of flights of a particular airline that were held wouldbe commensurate with the contribution of that airline to thetotal departure traffic during demo periods. We confirm thishypothesis through a comparison of gate-hold share and totaldeparture traffic share for different airlines, as shown in Figure15. Each data-point in the figure corresponds to one airline,and we note that all the points lie close to the 45-degree line,thereby showing no bias toward any particular airline.
0%
5%
10%
15%
20%
25%
0% 5% 10% 15% 20% 25%
Perc
enta
ge o
f gat
ehel
d fli
ghts
Percentage of traffic during demo periods
Percentage of Gateheld Flights
45 deg line
Fig. 15: Comparison of gate-hold share and total departuretraffic share for different airlines.
We note, however, that while the number of gate-holds thatan airline receives is proportional to the number of its flights,the actual fuel burn benefit also depends on its fleet mix.Figure 16 shows that while the taxi-out time reductions aresimilar to the gate-holds, some airlines (for example, Airlines3, 4, 5, 19 and 20) benefit from a greater proportion of fuelsavings. These airlines are typically ones with several heavyjet departures during the evening push.
0%
2%
4%
6%
8%
10%
12%
14%
16%
Airl
ine1
A
irlin
e2
Airl
ine3
A
irlin
e4
Airl
ine5
A
irlin
e6
Airl
ine7
A
irlin
e8
Airl
ine9
A
irlin
e10
Airl
ine1
1 A
irlin
e12
Airl
ine1
3 A
irlin
e14
Airl
ine1
5 A
irlin
e16
Airl
ine1
7 A
irlin
e18
Airl
ine1
9 A
irlin
e20
Airl
ine2
1 A
irlin
e22
Airl
ine2
3 A
irlin
e24
Airl
ine2
5 A
irlin
e26
Percentage of Total Aircraft Held
Percentage of Total Delay Minutes
Percentage of Total Fuel Burned
Fig. 16: Percentage of gate-held flights, taxi-out time reductionand fuel burn savings incurred by each airline.
VI. OBSERVATIONS AND LESSONS LEARNED
We learned many important lessons from the field tests ofthe pushback rate control strategy at BOS, and also confirmedseveral hypotheses through the analysis of surveillance dataand qualitative observations. Firstly, as one would expect, theproposed control approach is an aggregate one, and requiresa minimum level of traffic to be effective. This hypothesisis further borne by the observation that there was very littlecontrol of pushback rates in the most efficient configuration(4L, 4R | 4L, 4R, 9). The field tests also showed that theproposed technique is capable of handling target departuretimes (e.g., EDCTs), but that it is preferable to get EDCTswhile still at gate. While many factors drive airport throughput,the field tests showed that the pushback rate control approachcould adapt to variability. In particular, the approach wasrobust to several perturbations to runway throughput, causedby heavy weight category landings on departure runway, con-trollers’ choice of runway crossing strategies, birds on runway,etc. We also observed that when presented with a suggestedpushback rate, controllers had different strategies to implementthe suggested rate. For example, for a suggested rate of 2aircraft per 3 minutes, some controllers would release a flightevery 1.5 minutes, while others would release two flights inquick succession every three minutes. We also noted the needto consider factors such as ground crew constraints, gate-useconflicts, and different taxi procedures for international flights.By accounting for these factors, the pushback rate controlapproach was shown to have significant benefits in terms oftaxi-out times and fuel burn.
VII. SUMMARY
This paper presented the results of the demonstration of apushback rate control strategy at Boston Logan InternationalAirport. Sixteen demonstration periods between August 23 andSeptember 24, 2010 were conducted in the initial field trialphase, resulting in over 37 hours of research time in the BOStower. Results show that during eight demonstration periods
Appendix L. Reduced/Single Engine Taxiing at Logan Airport Memoranda L-18
(about 24 hours) of controlling pushback rates, over 1077 min-utes (nearly 18 hours) of gate holds were experienced duringthe demonstration period across 247 flights, at an average of4.3 minutes of gate hold per flight (which correlated well tothe observed decreases in taxi-out time). Preliminary fuel burnsavings from gate-holds with engines off were estimated to bebetween 12,000-15,000 kg (depending on whether APUs wereon or off at the gate).
ACKNOWLEDGMENTS
We would like to acknowledge the cooperation and supportof the following individuals who made the demo at BOSpossible: Deborah James, Pat Hennessy, John Ingaharro, JohnMelecio, Michael Nelson and Chris Quigley at the BOSFacility; Vincent Cardillo, Flavio Leo and Robert Lynch atMassport; and George Ingram and other airline representativesat the ATA. Alex Nakahara provided assistance in computingthe preliminary fuel burn savings from the gate-hold data,and Regina Clewlow, Alex Donaldson and Diana MichalekPfeil helped with tower observations before and during thetrials. We are also grateful to Lourdes Maurice (FAA) andIan Waitz (MIT) for insightful feedback on the research, andJames Kuchar, Jim Eggert and Daniel Herring of MIT LincolnLaboratory for their support and help with the ASDE-X data.
REFERENCES
[1] I. Simaiakis and H. Balakrishnan, “Analysis and controlof airport departure processes to mitigate congestionimpacts,” Transportation Research Record: Journal ofthe Transportation Research Board, pp. 22–30, 2010.
[2] C. Cros and C. Frings, “Alternative taxiing means –Engines stopped,” Presented at the Airbus workshop onAlternative taxiing means – Engines stopped, 2008.
[3] E. R. Feron, R. J. Hansman, A. R. Odoni, R. B. Cots,B. Delcaire, W. D. Hall, H. R. Idris, A. Muharremoglu,and N. Pujet, “The Departure Planner: A conceptualdiscussion,” Massachusetts Institute of Technology, Tech.Rep., 1997.
[4] N. Pujet, B. Delcaire, and E. Feron, “Input-output mod-eling and control of the departure process of congestedairports,” AIAA Guidance, Navigation, and Control Con-ference and Exhibit, Portland, OR, pp. 1835–1852, 1999.
[5] F. Carr, “Stochastic modeling and control of airportsurface traffic,” Master’s thesis, Massachusetts Instituteof Technology, 2001.
[6] P. Burgain, E. Feron, J. Clarke, and A. Darrasse, “Col-laborative Virtual Queue: Fair Management of Con-gested Departure Operations and Benefit Analysis,” Arxivpreprint arXiv:0807.0661, 2008.
[7] P. Burgain, “On the control of airport departure pro-cesses,” Ph.D. dissertation, Georgia Institute of Technol-ogy, 2010.
[8] I. Simaiakis and H. Balakrishnan, “Queuing Models ofAirport Departure Processes for Emissions Reduction,”
in AIAA Guidance, Navigation and Control Conferenceand Exhibit, 2009.
[9] ——, “Departure throughput study for Boston LoganInternational Airport,” Massachusetts Institute of Tech-nology, Tech. Rep., 2011, No. ICAT-2011-1.
[10] I. Simaiakis, “Modeling and control of airport departureprocesses for emissions reduction,” Master’s thesis, Mas-sachusetts Institute of Technology, 2009.
[11] Federal Aviation Administration, “Fact Sheet AirportSurface Detection Equipment, Model X (ASDE-X),”October 2010.
[12] International Civil Aviation Organization, “ICAO EngineEmissions Databank,” July 2010.
[13] Energy and Environmental Analysis, Inc., “Technicaldata to support FAA’s circular on reducing emissions forcommercial aviation,” September 1995.
[14] S. Shresta, D. Neskovic, and S. Williams, “Analysis ofcontinuous descent benefits and impacts during daytimeoperations,” in 8th USA/Europe Air Traffic ManagementResearch and Development Seminar (ATM2009), Napa,CA, June 2009.
AUTHOR BIOGRAPHIES
Ioannis Simaiakis is a PhD candidate in the Department of Aeronautics andAstronautics at MIT. He received his BS in Electrical Engineering from theNational Technical University of Athens, Greece and his MS in Aeronauticsand Astronautics from MIT. His research focuses on modeling and predictingtaxi-out times and airport operations planning under uncertainty.
Harshad Khadilkar is a graduate student in the Department of Aeronauticsand Astronautics at the Massachusetts Institute of Technology. He receivedhis Bachelors degree in Aerospace Engineering from the Indian Institute ofTechnology, Bombay. His research interests include algorithms for optimizingair traffic operations, and stochastic estimation and control.
Hamsa Balakrishnan is an Assistant Professor of Aeronautics and Astro-nautics at the Massachusetts Institute of Technology. She received her PhD inAeronautics and Astronautics from Stanford University. Her research interestsinclude ATM algorithms, techniques for the collection and processing ofair traffic data, and mechanisms for the allocation of airport and airspaceresources.
Tom Reynolds has joint research appointments with MIT’s Department ofAeronautics & Astronautics and Lincoln Laboratory. He obtained his Ph.D.in Aerospace Systems from the Massachusetts Institute of Technology. Hisresearch interests span air transportation systems engineering, with particularfocus on air traffic control system evolution and strategies for reducingenvironmental impacts of aviation.
R. John Hansman is the T. Wilson Professor of Aeronautics and Astronauticsat the Massachusetts Institute of Technology where he is the Director of theMIT International Center for Air Transportation.
Brendan Reilly is currently the Operations Manager at Boston Airport TrafficControl Tower. He is responsible for the day to day operations of the facilityas well as customer service. He has been involved in aviation throughout NewEngland for over twenty years as both an Air Traffic Controller and a Pilot.
Steve Urlass is an environmental specialist and a national resource for airportsin the FAA’s Office of Environment and Energy. He is responsible for researchprojects and developing environmental policy for the Agency. He has beeninvolved with a variety of environmental, airport development, and systemperformance monitoring for the FAA. He received his degree in Air Commercefrom Florida Tech.
Appendix L. Reduced/Single Engine Taxiing at Logan Airport Memoranda L-19