Embed Size (px)
Citation preview

Southern Smoke Simulation System
Modeling smoke impacts from prescribed burning in the South
Scott Goodrick, Gary Achtemeier & Yongqiang Liu
USDA Forest ServiceAthens, GA

Motivation
• The South is a leader in using prescribed fire to accomplish land management objectives
• Air quality community taking an increased interest in prescribed fire

Brief History of Smoke Management
• None –“Its just part of living in the country”
• 1976 - Southern Forestry Smoke Management Guidebook
and incomplete

Brief History of Smoke Managementand incomplete

Brief History of Smoke Managementand incomplete
• Early 1990’s – VSmoke, a gaussian plume model is integrated into the smoke screening process

Brief History of Smoke Managementand incomplete
• 2000 – BlueSky links together models for fuel consumption, emissions source strength and dispersion to provide real-time forecasts of smoke from wildland fires.

Brief History of Smoke Managementand incomplete
Invo
lvem
ent
Time
Land ManagerTechnology
None Graphical Simple Plume BlueSky

Brief History of Smoke Managementand incomplete
• Technology common in the air quality arena has slowly been diffusing into the land management realm

Motivation
• Distinctly different groups interested in wildland fire emissions– Different levels of technical knowledge– Different purposes for the data– Different spatial and temporal scales of
interest

Southern Smoke Simulation System
• 4S• Originally designed as a system similar to
BlueSky, but using CMAQ and DaySmokerather than Calpuff
• Has since evolved to encompass a broader range of space/time scales to better address the needs of a diverse user group

Land Managers
• Assist land managers in both the planning and operational phases of prescribed burning.
• What weather conditions will help minimize the impact of burning on the local community?
• Will my fire produce hazardous roadway conditions?
• How many acres could I burn without causing any problems?
• I had a smoke problem on my burn today, Why?

Air Quality Managers
• Assist air resource managers in assessing impact of smoke emissions and the impact of policy on prescribed fire activities.
• What are the annual emissions from prescribed fires?
• What would the impact of changing PM2.5 NAAQS be on prescribed burning?
• This area had a NAAQS violation, what was the contribution of smoke?
Public
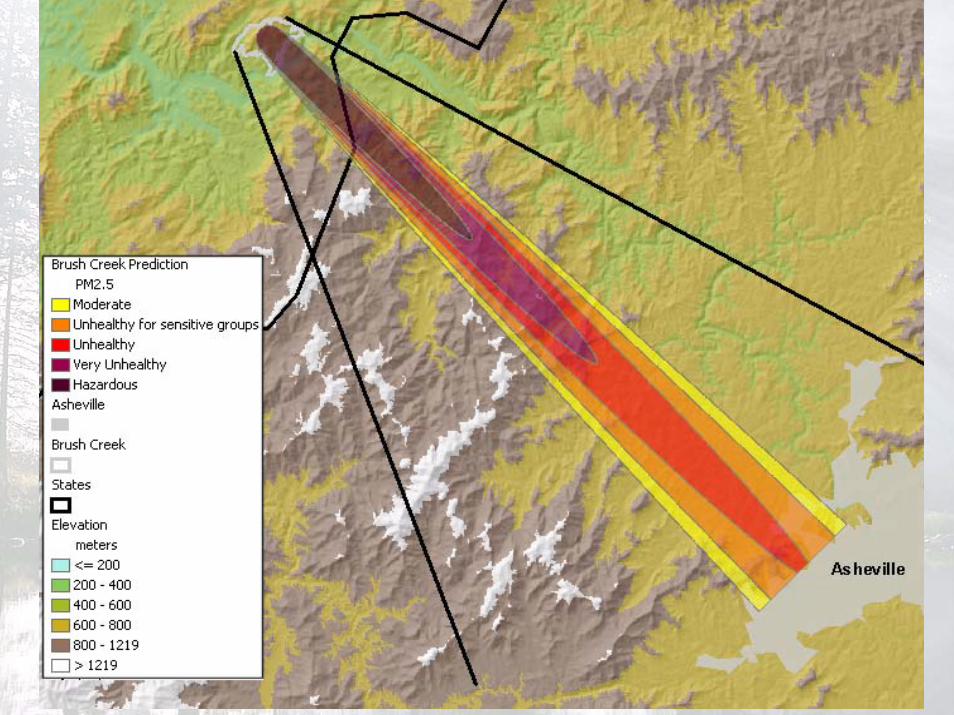
• Assist public health and safety officials in monitoring for potentially hazardous conditions due to emissions from wildland fires.
• Are PM2.5 or ozone levels high enough to impact sensitive populations?
• Is smoke going to be a major issue on any roadways?


Users
External Data
Display
Storage
Computation
WWW
GIS
Data Hub
Archive
MM5 CMAQ BlueSky PB
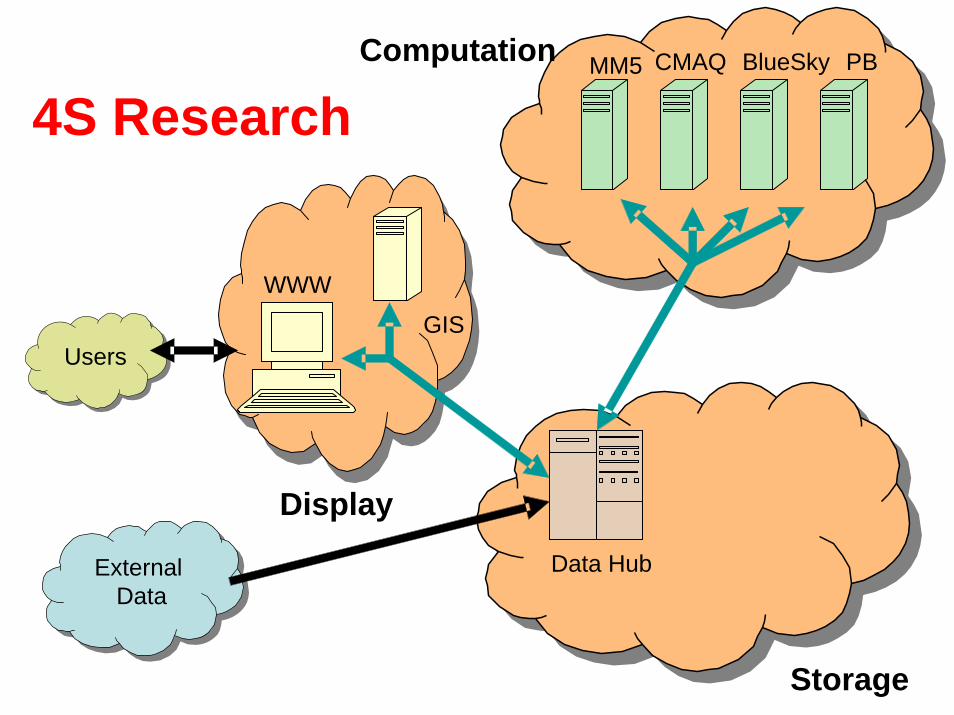
4S Concept
4S - Computation
• Computation component is composed of a suite of models
• Model independent output is supplied through OPeNDAP or XML
• Models range from local to regional scale in scope
• Most models run in both real-time forecast mode and historical analysis mode

4S - Display
• Products are data• User Interface will rely on a collection of
web services that can be chained together to produce user customized products
• Standard Services for mapping and graphing will be provided along with geostatistical and time series analysis tools
User questions can be viewed as queries for data subject to
user defined constraints

Short Digression
• Google– All documents on the Internet comprise a
dataset– How do we find what we need
• Stumble blindly• Exhaustive search• Indexed search

Short Digression
• NEXRAD radar network produces copious amounts of data
• Kruger et al (2006) employed a relational database containing metadata for each NEXRAD image to facilitate finding data that met user needs

4S Structure
• What if metrics were developed for weather, fire activity and emissions data?
• users defined their space and time scale of interest

4S - Storage
• Archive server (OPeNDAP enabled)• Metadata database – allow indexing of
model output and input data to facilitate future queries

Users
External Data
Display
Storage
Computation
WWW
Data Hub
MM5
4S Operational

Users
External Data
Display
Storage
Computation
WWW
GIS
Data Hub
MM5 BlueSky
4S Coming Soon
Users
External Data
Display
Storage
Computation
WWW
GIS
Data Hub
MM5 CMAQ BlueSky PB
4S Research

Users
External Data
Display
Storage
Computation
WWW
GIS
Data Hub
Archive
MM5 CMAQ BlueSky PB
4S Planned
4S - Summary
• Flexible system• Based on linkable web services• User generated products• Query system to allow users to find
desired data


Asheville, North Carolina PM2.5 Concentrations
0
20
40
60
80
100
120
140
0 4 8 12 16 20 0 4 8 12 16 20 0 4 8 12 16 20 0 4 8 12 16 20 0 4 8 12 16 20
Date and Hour
Con
cent
ratio
n (u
g/m
3)
PM2.5
Unhealthy for sensitive groups
Good
Moderate
3/16/2006 3/17/2006 3/18/2006 3/19/2006 3/20/2006


Hourly PM2.5 Concentration at Asheville, NCas a Function of Plume Cores
0
50
100
150
200
250
300
350
200
400
600
800
1000
1200
1400
1600
1800
2000
2200
Time
Conc
entra
tion
(ug/
m3)
1 Core3 Core4 Core5 Core6 Core