Embed Size (px)
Citation preview
Final Report to
University Corporation for Atmospheric Research Covering the Period
1 June 1971 to 28 February 1974
COLORADO-ILLINOIS OPERATIONAL AND ANALYTICAL PROGRAM UTILIZING A DUAL WAVELENGTH RADAR FACILITY
NCAR Subcontract 186/71
Eugene A. Mueller and
Griffith M. Morgan, Jr. Atmospheric Sciences Section Illinois State Water Survey
Urbana, Illinois
June 1974
TABLE OF CONTENTS
Page
INTRODUCTION 1
Goals of the Project 1 Scope of the Report 2 Acknowledgements 3
DESCRIPTION OF RADAR SYSTEM 3
CHILL System Capabilities 3 Maintenance and Operational History 5 The Bearing Problem 6 Considerations of the Design of the Bearing 6 3-cm Radar 7 Processor 8 Radar Configuration Changes 9
STATISTICAL ANALYSIS OF REFLECTIVITY 10
Analytical Approach 10 Results 11
COMPUTER SOFTWARE DEVELOPMENT 18
HAIL SIGNAL RESEARCH 18
CASE STUDIES 19
29 June 1973 21 4 July 1973 26
Synoptic Patterns 26 Meso-scale Motions 26 Thunderstorm Scale Structures 29 Conclusion 33
PUBLICATIONS RELATED TO CONTRACT 33
REFERENCES . 34
This research was performed as part of the National Hail Research Experiment, managed by the National Center for Atmospheric Research and sponsored by the Weather Modification Program, Research Applications Directorate, National Science Foundation.
i
INTRODUCTION
Goals of the Project
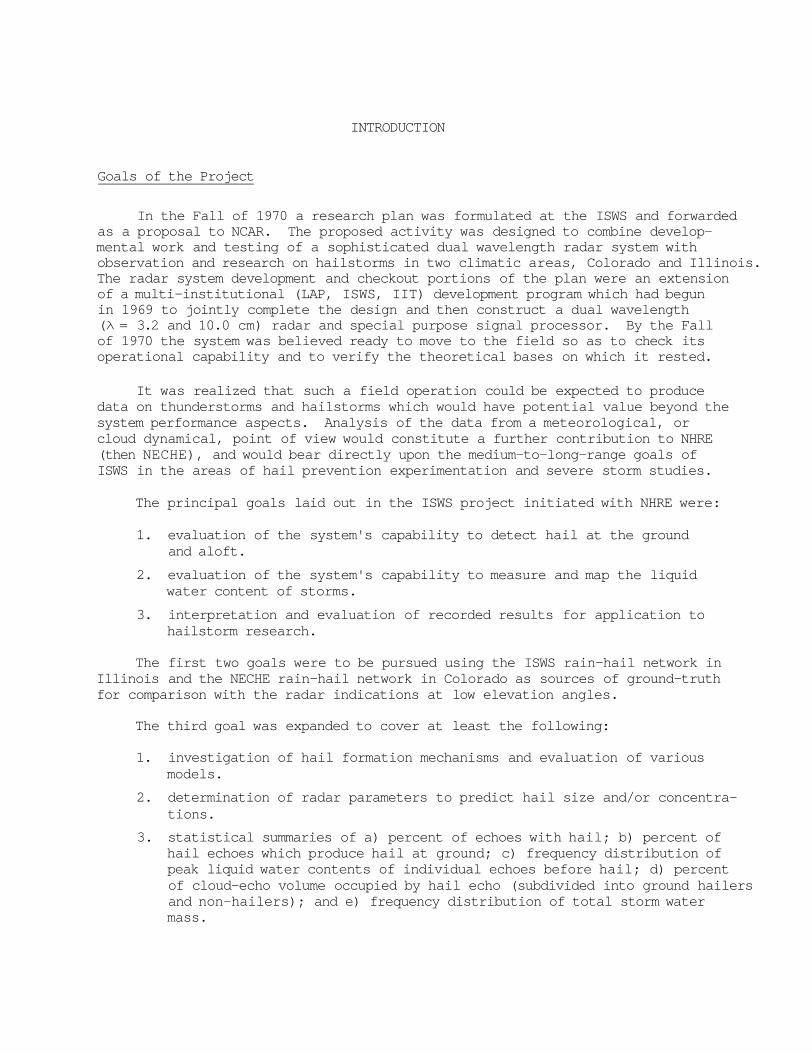
In the Fall of 1970 a research plan was formulated at the ISWS and forwarded as a proposal to NCAR. The proposed activity was designed to combine developmental work and testing of a sophisticated dual wavelength radar system with observation and research on hailstorms in two climatic areas, Colorado and Illinois. The radar system development and checkout portions of the plan were an extension of a multi-institutional (LAP, ISWS, IIT) development program which had begun in 1969 to jointly complete the design and then construct a dual wavelength (λ = 3.2 and 10.0 cm) radar and special purpose signal processor. By the Fall of 1970 the system was believed ready to move to the field so as to check its operational capability and to verify the theoretical bases on which it rested.
It was realized that such a field operation could be expected to produce data on thunderstorms and hailstorms which would have potential value beyond the system performance aspects. Analysis of the data from a meteorological, or cloud dynamical, point of view would constitute a further contribution to NHRE (then NECHE), and would bear directly upon the medium-to-long-range goals of ISWS in the areas of hail prevention experimentation and severe storm studies.
The principal goals laid out in the ISWS project initiated with NHRE were:
1. evaluation of the system's capability to detect hail at the ground and aloft.
2. evaluation of the system's capability to measure and map the liquid water content of storms.
3. interpretation and evaluation of recorded results for application to hailstorm research.
The first two goals were to be pursued using the ISWS rain-hail network in Illinois and the NECHE rain-hail network in Colorado as sources of ground-truth for comparison with the radar indications at low elevation angles.
The third goal was expanded to cover at least the following:
1. investigation of hail formation mechanisms and evaluation of various models.
2. determination of radar parameters to predict hail size and/or concentrations.
3. statistical summaries of a) percent of echoes with hail; b) percent of hail echoes which produce hail at ground; c) frequency distribution of peak liquid water contents of individual echoes before hail; d) percent of cloud-echo volume occupied by hail echo (subdivided into ground hailers and non-hailers); and e) frequency distribution of total storm water mass.
-2-
4. evaluation of hail forecast parameters based on meteorological data, evaluation of data on hail melting and on the "natural hail suppression mechanism".
5. study of spatial relationships of hail centers and zones of maximum liquid water content with prominent echo features (as determined by one or both of the single wavelengths). It would also include evaluation of most common single wavelengths hail detection criteria. This is felt to be a valid and important application of the dual wavelength radar since most forecasters and researchers will always have to work with single wavelength radars.
6. comparison of radar-hail data from two climate areas (Colorado and Illinois) to resolve the classes or types of storms in each.
7. case studies to determine recurrent precursors of hail appearance. 8. studies of the water budget of storms.
The first proposal period supported by NHRE covered the period of June 1, 1971 to May 31, 1972; the second (extension) period was for June 1, 1972 to May 31, 1973; and the third final period of support was from June 1, 1973 to February 28, 1974. In the third proposal period for extension of the subcontract to cover the 1973 operational season, some of the functions and goals in the original proposal (those pertinent to Illinois operations and research aims) were dropped from NHRE support and were assumed by RANN/NSF and the State in a new project to develop the design for a hail suppression experiment in Illinois.
Due to the historical development of the radar system, the planning of research based on the data has entailed communication and coordination with the Laboratory for Atmospheric Probing (LAP). Over the last three years the effectiveness of this coordination has been evaluated periodically at meetings involving LAP and ISWS. Recently a joint statement covering our mutual and compatible interests in the radar system and the degree of coordination deemed suitable has been prepared and circulated. It reflects on a very suitable interaction between our two groups over the past 4 years.
Beginning with the 1973 Colorado operations one of the operational goals was the availability of the CHILL radar to function as the NHRE operational radar.
Scope of the Report
This report covers all work accomplished on the original and related proposals from its inception in June 1971 through 28 February 1974. This includes the 1972 and 1973 NHRE operational periods. Useful Illinois operations occurred primarily under our new RANN contract in the Spring and Fall of 1973 and will be reported on in that context. Radar system development and modification activities during the residence in Illinois periods of September-March are pertinent to this report.
-3-
The radar, to be operational in Colorado from 1 May through 31 July (in 1972 and 1973) had to be removed from operations in Illinois in early April (in both 1972 and 1973) and could not be made ready for Illinois operations until September (in both 1972 and 1973). This commitment to the NHRE operational periods eliminated the use of the system in Illinois during much of the major hail season (March-June).
Acknowledgements
This work was performed under the general supervision of Stanley A. Changnon, Jr., Head of the Atmospheric Sciences Section. The engineering contributions of Mr. Edward Silha were extremely valuable to this project. Mr. Royce Reitz performed most of the maintenance and operation of the FPS-18 radar. Dr. Gary Achtemeier and Mr. Ronald Grosh participated as meteorologist-analysts and were responsible for the case studies in this report. Mr. David Brunkow did most of the computer programming. Other Water Survey personnel contributing to the project were Donald Staggs, Mark Gardner, Joe Coons, Robert C. Beebe, Carl Lonnquist, Robert Sinclair, Ms. Phyllis Stone and Ms. Barbara Ackermann. Student radar operators who participated in the field were Mr. Everett Anderson of Fort Morgan, Colorado and Mr. Gregory Fetter.
The Laboratory for Atmospheric Probing of the University of Chicago was a full partner in the project, participating in the persons of Prof. Ramesh Srivastava and his predecessor Prof. David Atlas, Dr. Richard Fetter (who is to be particularly thanked for the engineering developments relating to the 3-cm radar), Mr. John Eyink (technician), Mr. Richard Carbone, Mr. Walter Marker, Mr. Peter Hildebrand and Mr. Allen Bohne.
Dr. Peter Eccles of NHRE collaborated on various aspects of the project, particularly giving assistance on computer programming and taking part in stimulating discussions on radar calibration.
DESCRIPTION OF RADAR SYSTEM
CHILL System Capabilities
The CHILL (CHicago-ILLinois) system is a dual wavelength system utilizing wavelengths of 10-cm and 3-cm. The two channels are matched with respect to antenna beam widths, pulse lengths, and pulse repetition frequency. The two beams are collimated by mounting both antennas side-by-side on the same pedestal. The 10-cm channel is comprised of an unmodified FPS-18 radar. The 3-cm radar was initially a slaved M-33 system but later the 3-cm transmitter and receiver were mounted on the 10-cm antenna.
Tables 1, 2, and 3 are summaries of some of the pertinent information on the radars and the associated data processor.
-4-
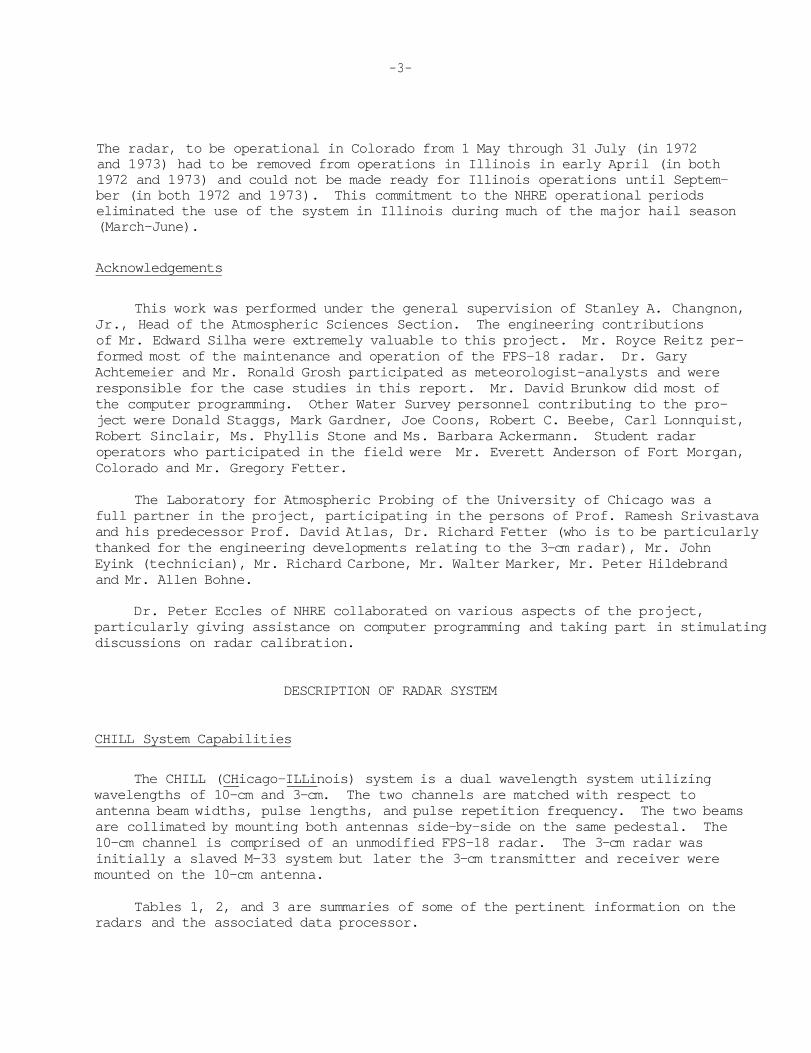
Table 1. Characteristics of the CHILL Radar.
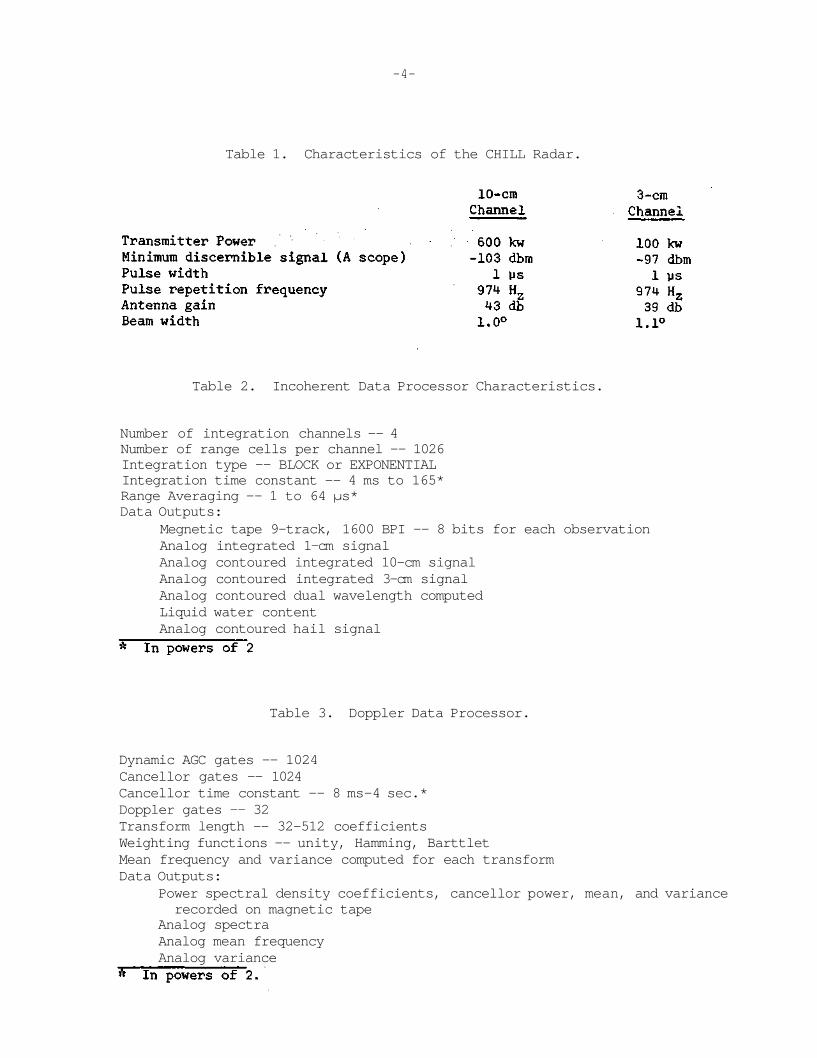
Table 2. Incoherent Data Processor Characteristics.
Number of integration channels -- 4 Number of range cells per channel -- 1026 Integration type -- BLOCK or EXPONENTIAL Integration time constant -- 4 ms to 165* Range Averaging -- 1 to 64 μs* Data Outputs:
Megnetic tape 9-track, 1600 BPI -- 8 bits for each observation Analog integrated 1-cm signal Analog contoured integrated 10-cm signal Analog contoured integrated 3-cm signal Analog contoured dual wavelength computed Liquid water content Analog contoured hail signal
Table 3. Doppler Data Processor.
Dynamic AGC gates -- 1024 Cancellor gates -- 1024 Cancellor time constant -- 8 ms-4 sec.* Doppler gates -- 32 Transform length -- 32-512 coefficients Weighting functions -- unity, Hamming, Barttlet Mean frequency and variance computed for each transform Data Outputs:
Power spectral density coefficients, cancellor power, mean, and variance recorded on magnetic tape
Analog spectra Analog mean frequency Analog variance
-5-
The processor of the system contains two logarithmic receivers which are used for the non-coherent processor. The logarithmic signal is digitized and then an exponentiating circuit is provided so that the averaging of received powers (as opposed to averaging of logarithms of the received power) is performed. The four integration channels are operated in two groups. Each group has a 10-cm and 3-cm channel. The type of integration, and the integration time constants, can be chosen for each group independently. One group is utilized in the hail detector channel while the other group is used in determination of the liquid water content values.
The doppler processor handles the data with a 1/2-second cycle. During the first 1/2 second, data are gathered and stored in a buffer. The full 1/2 second is utilized for this buffer load regardless of the transform length. During the following 1/2 second, the data are weighted and transforms computed. During the computational cycle, 16,384 power densities are computed. If the transform length is 512 points, this represents 32 spectra from the 32 range cells. If the transform length is 32, there will be 16 spectra from each of the 32 range cells computed. Mean doppler frequency and doppler spectrum variance are computed for every spectrum and are available as analog signals as well as for magnetic tape recording.
The prime data recording system is a 9-track, 100-bit-per-inch magnetic tape. On this tape all variables are recorded. The maximum data rate of 24-0 KHZ requires, under some conditions, that some variables must be discarded. The recording priority is (from highest to lowest) 1) the doppler spectra, 2) the 10-cm power data, 3) the 3-cm power data, 4) the liquid water content data, and 5) the hail detector data. A 2400-ft roll of magnetic tape can be used in 8 minutes under some extreme conditions, but under normal operations lasts about 40 minutes. At low data rates (not many storms and no doppler processing), a roll of magnetic tape will last as long as 4 hours.
Additionally, data are recorded by three cameras which photograph contoured PPI scopes and multiple trace A scopes. Future additions should provide a means of displaying the doppler parameters on scopes, and these also will be photographed.
The system was made to be portable so it could be moved to and from Illinois. Disassembly and assembly each involve about 10 days, and the system, when loaded for shipment, includes a trailer containing the FPS-18, a flatbed trailer with the disassembled antenna, and a third trailer containing the control van and data recording system.
Maintenance and Operational History
The maintenance and operational history of the CHILL system up through the spring of 1973 is contained in an Annual Report to NCAR dated June 1973 and will not be repeated in this final report. Since that time the major operational difficulty with the CHILL system has been the failure of the main spindle bearing. Since this is a rather large item and since there is at least one other antenna which the effects may be noted, a rather complete description of this failure is reported.
-6-
The Bearing Problem
After the return from Colorado in 1973 the radar was reinstalled in Illinois. Shortly after the reinstallation the antenna became noisy and recommended amount of grease was put in all bearings. The antenna had been previously greased in May in Colorado, the original greasing schedule recommended by ESSCO was once every 6 months. After this greasing the antenna operated normally for a period of 10 days. It then became noisy and erratic in operation. The noise level is extremely high. One point in the azimuth travel (approximately SW) was particularly rough. The antenna would visibly slow down and pass through this area with small jerks and accompanying noise increase.
A large amount of grease was forced into all bearings and after several rotations the antenna quieted down. The bad spot in the SW still showed some slowing of the antenna motion. One week later the antenna froze in the SW position during operations. The antenna continued to move in a counter clockwise direction with noises but would not move whatsoever in the clockwise direction. The control was checked out and voltages supplied to the motor were correct. A massive amount of grease was forced into the upper bearing grease ports. Again the bearings temporarily recovered allowing reasonably quite operation. After consultation with Messinger Bearing Company it was decided that it would be more appropriate to oil the bearing than to apply grease to it. A drip oiler was made and installed on the antenna so that about 10 drops of oil per minute were applied to the bearing. Since that time operations have continued for in excess of 150 hours and the bearing is still rotating successfully.
At the end of the fall operating season the covers from the bearings were removed and the bearing visually inspected. It was obvious that there had been no attempt to seal the upper bearing cover for water entry. The upper cover was a metal against metal joint and no rubber gasketing or any other form of gasketing were provided. The bearing has rusted considerably on its upper raises and undoubtedly rusted within the ways. It is probable that the immediate failure and most of the noise which was heard was the result of this rust. A new bearing was put on order and is to be delivered during the summer of 1974.
Considerations of the Design of the Bearing .
Consultation with Gene Rhodes of ESSCO confirmed our belief that the upper bearing should be replaced. Rhodes reported that this bearing is in itself sufficient to carry the entire antenna load including overturning moments, radial thrust and axial load. The lower bearing was strictly a safety factor in the design. The upper bearing is made by Messinger Bearing Inc. who rates this bearing for a dynamic capacity of 29,700 pounds. The dynamic load on the bearing can be estimated as
-7-
Where FT = Externally applied thrust load FR = Externally applied radial load M = Externally applied overturn moment V = 1/1.2 depending on loading conditions d = Pitch diameter of rollers = 25 inches m
The externally applied thrust load is the total weight of the rotating portion of the pedestal. These values are not known with high precision, however, we have measured some of the components. The total weight of the system is approximately 32,500. If we assume that the king post and base structure weigh about 4,500 pounds the total thrust loading is 28,000 pounds. The static capacity of the bearing is sufficiently high to carry this load, however, the bearing life is short as will be discussed. The radial load on the bearing is near zero and is of no concern. The overturning moment could be quite large especially if not operated in radome. It is difficult to estimate this since the lower bearing produces a redundant structure. Thus, to be conservative, let the value of M be zero. The dynamic load is then the thrust load and is equal to 28,000 pounds.
Messinger Bearing states that the minimum life of a bearing (that time when 10% of the bearings under test show evidence of failure) is given by:
Where H = the minimum life in hours C = dynamic capacity in pounds N = revolutions per minute
Substituting values above and assuming 3 RPM as an average antenna speed over the 2 years.
H = 6800 hours
The average life (the point where 1/2 the bearings shown evidence of fatigue) is 5 times the minimum life or about 34,000 hours. It is most likely that this bearing failed by virtue of the water and rust on the bearing and not so much from large amount of operating time. The bearing will be replaced with a new identical bearing.
3-cm Radar
During the summer of 1973 various discrepancies with the newly designed 3-cm radar were found. Among these were the high voltage power supply which included a specially wound transformer which failed in the field in Colorado. This was replaced with a 5 Kv power supply from the 5 Kv power supply of the FPS-18. This change required many additional components to be mounted on the antenna as the FPS-18 5 Kv power supply is much larger than the flyback high voltage which was
-8-
originally envisioned for the 3-cm system. The pre-amplifier of the 3-cm system did not produce a high signal to noise ratio and therefore the sensitivity of the 3-cm was quite poor through large portions of the 1973 season. One of the major difficulties involved is that slip rings provided in the antenna were not coaxial and were quite noisy. Since the end of the 1973 season the solution has been to amplify the signal to much higher levels in the preamplier and then send it through the slip rings adding the slip ring noise and then attenuating it. This system permits operation without serious degradation of the signal to noise ratio. However, some sacrifice of total dynamic range is required. This does not appear to be a major problem with the hail detection scheme nor with the liquid water contents in storms which are more than 10 miles distance from the radar. However, nearby storms will produce saturation in the preamplifier and at present will have to be handled in a somewhat different manner.
Processor
Considerable difficulties which related primarily to the recording of data were encountered in the processor during the 1973 season. These difficulties can be separated into two general categories: those involved primarily with the noncoherent processor and those with the doppler processor. The problems with the doppler processor will be discussed first. The recording technique in the doppler processor was to pack the data with bit mapping techniques which required a much smaller portion of tape than to record just the noise levels. However, the timing was incorrect for bit mapping and continual difficulties finally made necessary the eliminating data packing in the doppler fields. This in turn caused the tape usage in operation to rise markedly. A working solution to the problem of high tape consumption has been arrived at over the winter of 1973-1974 which nevertheless permits a spectrum to be completely recorded (including the lower level noise). This scheme requires that the computer power in the spectrum exceed a particular pre-set value or the entire spectrum is discarded. It is hoped that this technique will permit both complete recording of the FFT data and a reasonable usage of tape.
Other difficulties in the processor related to the precise timing in the FFT doppler spectra. There was a logical error in the production of the FFT data dump signal. This error in logic permitted frequent groups of data to be recorded which were not valid. The source of this problem was finally located and corrected during the winter of 1973-1974. Other difficulties with the FFT portion of the processor have been the failure to obtain azimuth and elevation data valid for the individual FFT spectrum and a difficulty related to the cancellation of the DC line spectra which was located in the summer of 1973. These have been problems of general design failure or omissions. We have also experienced a large number of cold solder joints and chip failures in the processor. This is particularly true in the buffer memories for the doppler processor. These memories fortunately have a parity check channel and can be monitored easily. A standard procedure is to monitor the parity on every day of operation and the number of required changes has been rather high. We have expended approximately 20 type 1403 memory chips during the summer of 1973 and spring of 1974 operations.
-9-
There have been no logical difficulties in the incoherent processor during the summer of 1973 and 1974. Most of the effort in 1972 through spring of 1973 with regards to the processor was in cleaning up the incoherent processor, and this has proven successful. The only difficulties that were experienced during the 1973 operational season in the incoherent processor were related to the equipment. Unfortunately, this memory does not have a parity channel and therefore the only way of obtaining information as to the validity of the operation of the channel is to have a data tape run through a computer and the output from the computer verified by hand.
It had originally been intended to build a tape reader interface for the system during the winter of 1973-1974, but this could not be accomplished due to the press of higher priority projects and the general reduction in the staff available to the CHILL system. The construction of such a tape reader interface remains a desirable feature for the system in the future.
A large modification of the timing and end of record decision logic was performed over the winter of 1973-1974. The philosophy that had originally been adopted with respect to the priority of recording had assumed that the doppler data rate would be the smallest data rate of the recording variables. This turned out to be incorrect even before the modification which eliminated data packing in doppler data. After the elimination of data packing, FFT became the highest rate by factors of 4 to 5 times. Thus, the priority recording decisions were being made quite improperly, and on occasion the lack of correct priority had allowed a record to override itself in the tape buffer. When this happened, the record which was eventually written onto the magnetic tape became meaningless by virtue of lost housekeeping information and lack of information as to the position in the record where valid data resided. This correction was made during the winter and checked out successfully.
Radar Configuration Changes
During the summer of 1972 and 1973 operations, the radar data van was loaded upon a lowtoy trailer and carried between its operational locations. During the summer of 1973 a second antenna trailer flatbed was obtained on loan from the National Center for Atmospheric Research. The wheels and undercarriage from the data van were removed and the data van was mounted on the NCAR flatbed trailer. This permits a much more rapid moving from one place to another plus it is now a towaway as were the other trailers and does not require special equipment from the truckers to load and move. It is estimated that this change will permit at least a one-day saving in each erection and dissassembly of the radar system. Additionally, the added space on the flatbed has made the packing of the antenna sidearm and other associated equipment much simpler and faster. It will also be a bit more economical to move the towaway than to rent a lowboy trailer for each move.
-10-
STATISTICAL ANALYSIS OF REFLECTIVITY
One of the desired analytical programs that was to be undertaken using the CHILL radar was an attempt to evaluate the effectiveness of the seeding operation for hail suppression. Ideally, this study should be done using the hail detector capability of the dual wavelength radar, and indeed this study is underway. However, during preliminary analysis of some of the computer tapes it was recognized that a second method of evaluating the efficaciousness of the seeding might be performed. It is generally believed that seeding will alter the detectable particle size and distribution leading to a reduction in the strength of radar return, particularly at the higher altitude levels. So, a study was performed which relates the strength of the radar echo and the heights of the measurements to the number of occurrences in the control area during seeded and non-seeded days, However, there was a total of only 6 hail days declared in the summer of 1973, and in order to present an approximately equivalent sample size, two seeded days were matched with the two nearest unseeded days. The seeded days were 28 June and 8 July, and the unseeded hail days were 21 May and 9 July. Apparently there is little difference in the non-seed sample when two additional non-seed days are added, with the obvious exception that all of the numbers become much larger.
Analytical Approach
For purposes of this analysis, 3 areas were defined as follows: 1) area 1 was the protected area which lies between 26 and 52 miles from the Ft. Morgan radar; 2) area 2 was an area to the southeast of Ft. Morgan of the same size as the protective area (area 2 may be envisioned as a mirror image along the E-W line through Ft. Morgan); and 3) area 3 was the remaining area in the annular ring from 26 to 52 miles after areas 1 and 2 are removed.
The original intent of this division was to use area 2 as a pseudo control area for the purposes of regional echo comparisons as well as for the random day comparisons. This may still be possible if data from other days (non-hail days) are included. However, when only the hail days defined for the protected area are examined, there are few echoes which tracked through area 2, and also since echoes were either in or threatening the protected area, radar sector scanning there tended to preclude data collection and analysis for area 2.
Height intervals of 5,000 feet were chosen over each of the 3 areas in question. For each radar processor power read out, the values in each of statistical cells (5,000 ft layer over each area) were recorded.
The tables headed by "distribution of average Z's" are a count of all measurements of the given Z-level in each cell. Each measurement is basically a 0.8° width and 150 m deep and was taken about every 1.2 minutes. In those tables headed by "distribution of maximum Z values", only the highest Z in a particular power read out is used.
-11-
Numbers in the various cells have been normalized by a number proportional to the maximum number of possible radar elements in each cell. The normalization is such that the actual number of observations ranges from 2 to 4 times the numbers reported in the tables.
Normalization of this type is necessary due to the minimum angle at which the radar was being operated, and due to the extreme aspect ratio of the cells as viewed from the radar (less than one mile high and 26 miles in the horizontal dimensions). Generally, only the base scan provides data in the 0-5000 cell, while there are as many as 14 elevation angles and thus scans, which contribute to the cell of 30,000 - 35,000. However, since of the 14 elevation angles each is less than 3 miles long, the bias introduced by the counting technique is about 2.6 times. This bias has been removed from all the tables.
Results
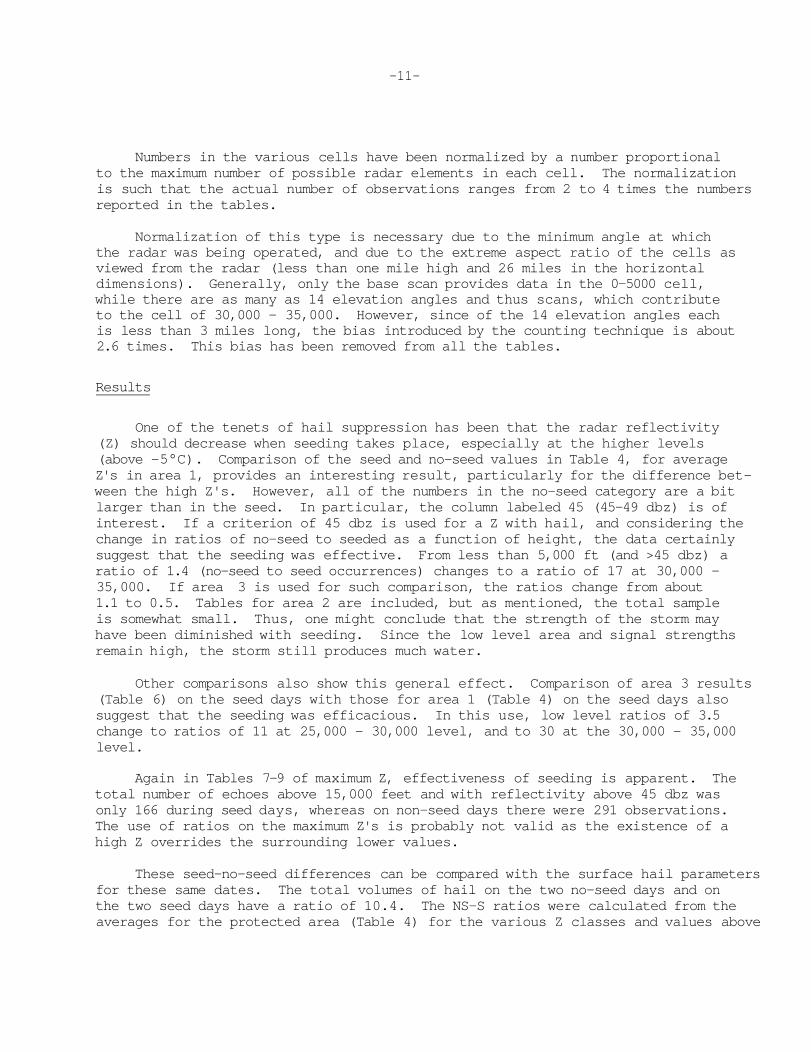
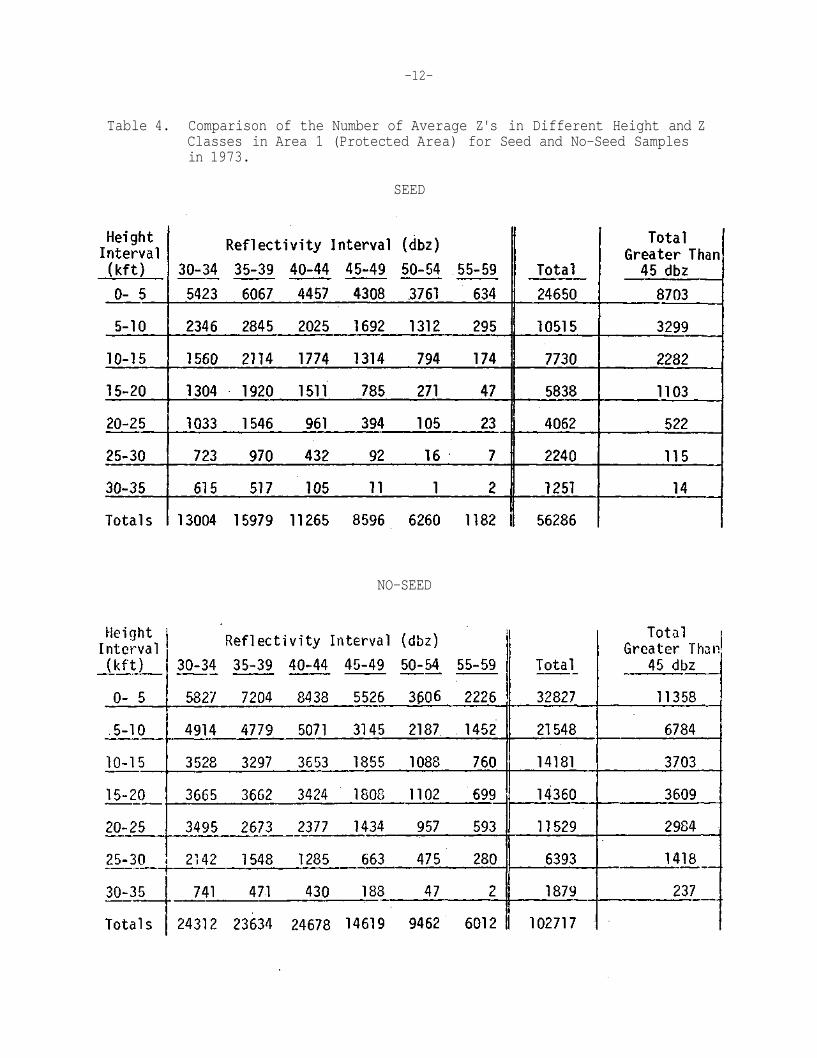
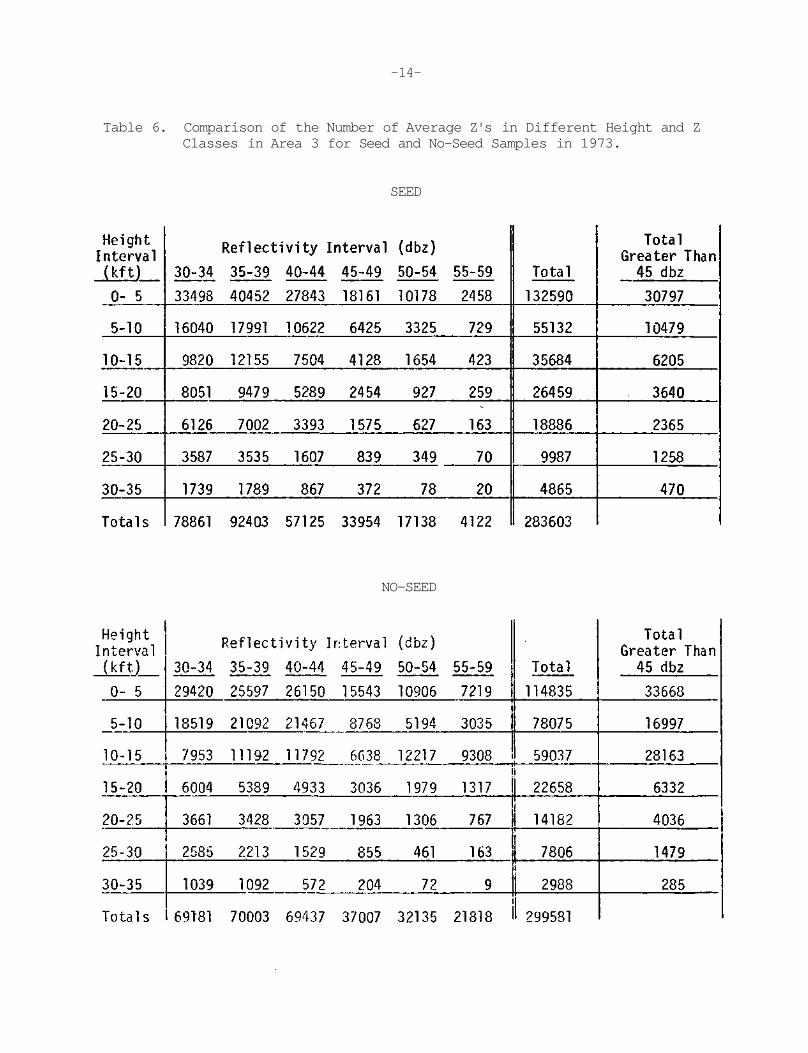
One of the tenets of hail suppression has been that the radar reflectivity (Z) should decrease when seeding takes place, especially at the higher levels (above -5°C). Comparison of the seed and no-seed values in Table 4, for average Z's in area 1, provides an interesting result, particularly for the difference between the high Z's. However, all of the numbers in the no-seed category are a bit larger than in the seed. In particular, the column labeled 45 (45-49 dbz) is of interest. If a criterion of 45 dbz is used for a Z with hail, and considering the change in ratios of no-seed to seeded as a function of height, the data certainly suggest that the seeding was effective. From less than 5,000 ft (and >45 dbz) a ratio of 1.4 (no-seed to seed occurrences) changes to a ratio of 17 at 30,000 -35,000. If area 3 is used for such comparison, the ratios change from about 1.1 to 0.5. Tables for area 2 are included, but as mentioned, the total sample is somewhat small. Thus, one might conclude that the strength of the storm may have been diminished with seeding. Since the low level area and signal strengths remain high, the storm still produces much water.
Other comparisons also show this general effect. Comparison of area 3 results (Table 6) on the seed days with those for area 1 (Table 4) on the seed days also suggest that the seeding was efficacious. In this use, low level ratios of 3.5 change to ratios of 11 at 25,000 - 30,000 level, and to 30 at the 30,000 - 35,000 level.
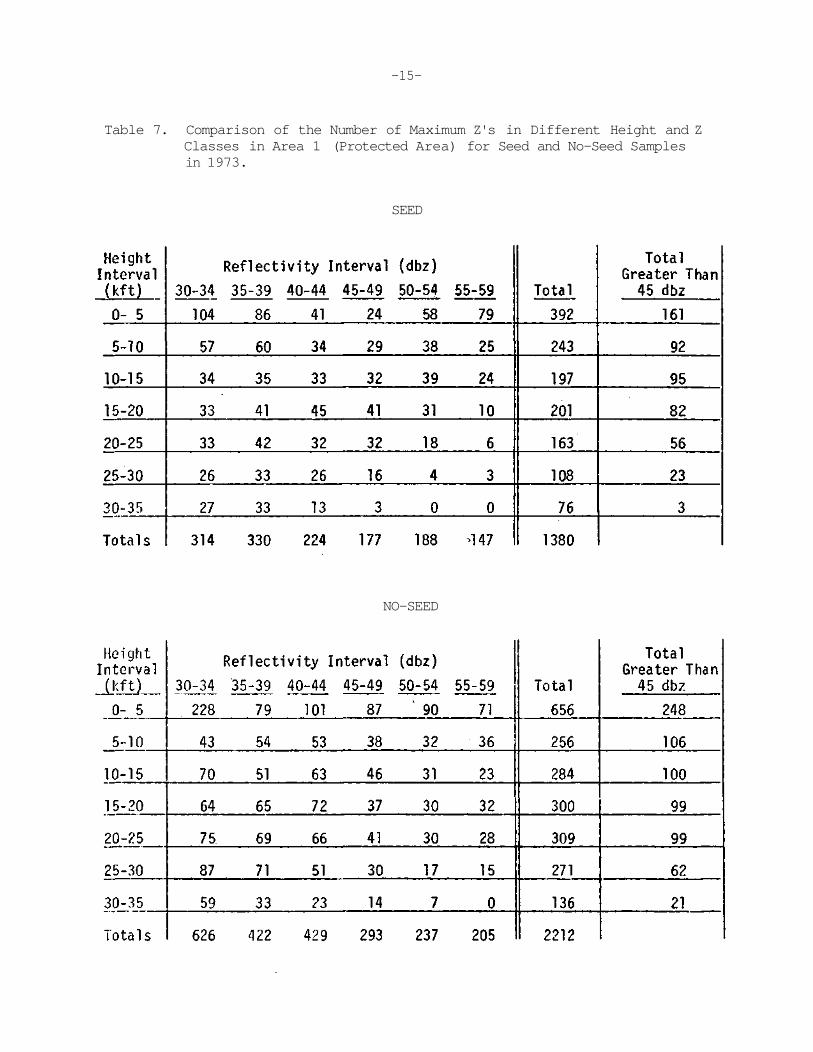
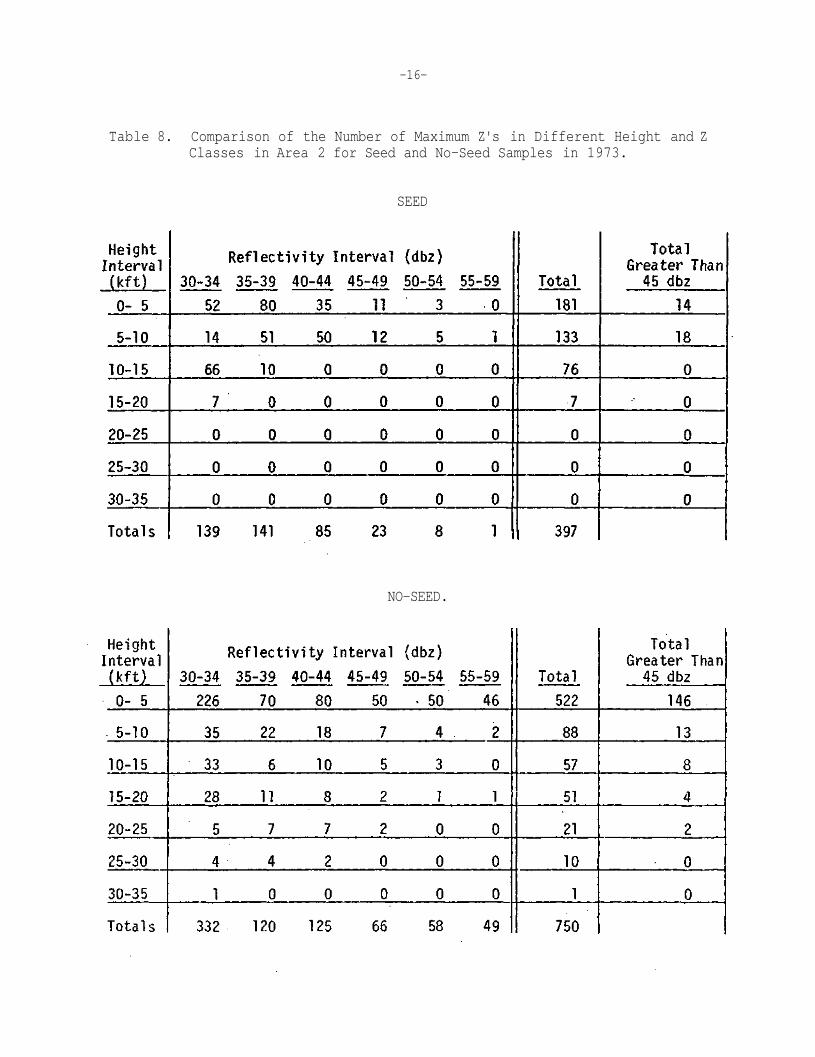
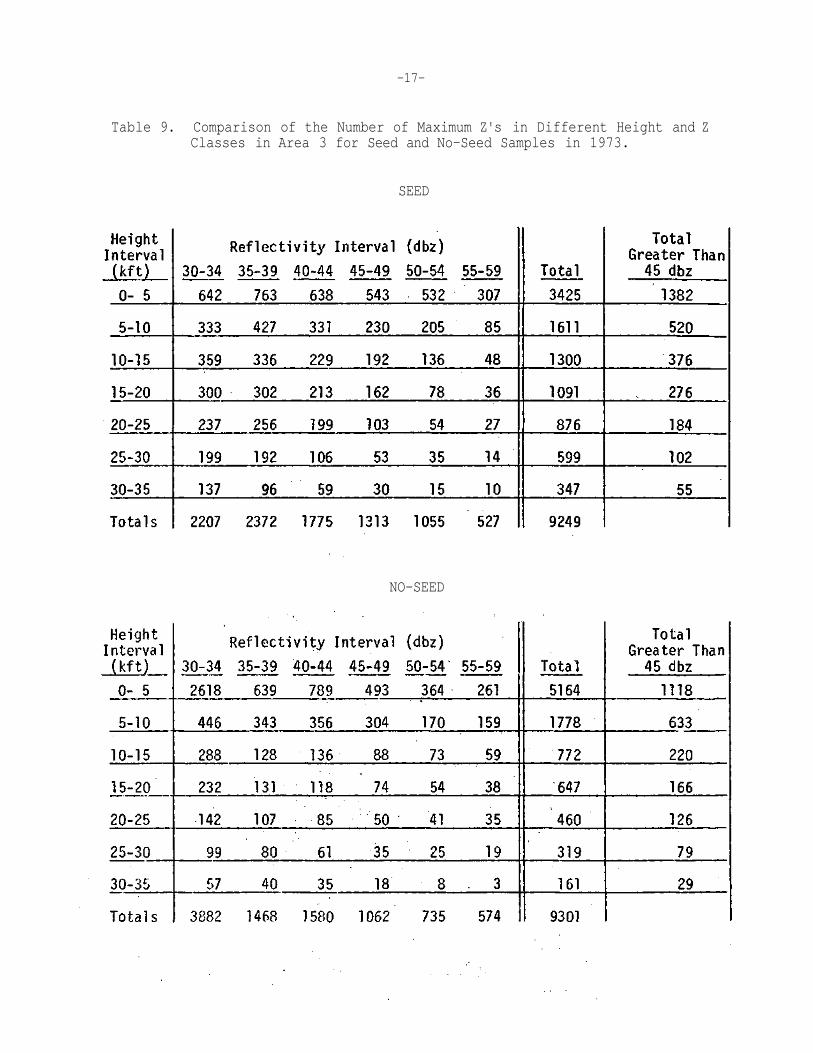
Again in Tables 7-9 of maximum Z, effectiveness of seeding is apparent. The total number of echoes above 15,000 feet and with reflectivity above 45 dbz was only 166 during seed days, whereas on non-seed days there were 291 observations. The use of ratios on the maximum Z's is probably not valid as the existence of a high Z overrides the surrounding lower values.
These seed-no-seed differences can be compared with the surface hail parameters for these same dates. The total volumes of hail on the two no-seed days and on the two seed days have a ratio of 10.4. The NS-S ratios were calculated from the averages for the protected area (Table 4) for the various Z classes and values above
-12-
Table 4. Comparison of the Number of Average Z's in Different Height and Z Classes in Area 1 (Protected Area) for Seed and No-Seed Samples in 1973.
SEED
NO-SEED
-13-
Table 5. Comparison of the Number of Average Z's in Different Height and 1 Classes in Area 2 for ,Seed and No-Seed Samples in 1973.
SEED
NO-SEED
-14-
Table 6. Comparison of the Number of Average Z's in Different Height and Z Classes in Area 3 for Seed and No-Seed Samples in 1973.
SEED
NO-SEED
-15-
Table 7. Comparison of the Number of Maximum Z's in Different Height and Z Classes in Area 1 (Protected Area) for Seed and No-Seed Samples in 1973.
SEED
NO-SEED
-16-
Table 8. Comparison of the Number of Maximum Z's in Different Height and Z Classes in Area 2 for Seed and No-Seed Samples in 1973.
SEED
NO-SEED.
-17-
Table 9. Comparison of the Number of Maximum Z's in Different Height and Z Classes in Area 3 for Seed and No-Seed Samples in 1973.
SEED
NO-SEED
-18-
the 15,000 ft level (generally above the -5°C in-cloud level since the radar elevation was about 5,000 ft MSL). These NS-S ratios were 2.7 for the 30-34 dbz class, 1.8 (for 35-39 dbz), 2.5 (40-44 dbz), 3.2 (45-49 dbz), 6.6 (50-54 dbz), and 20.0 (≥ 55 dbz). Hence, the NS-S differences in Z frequencies above 50 dbz and located above 15,000 ft are comparable to those found in the surface hail volumes.
COMPUTER SOFTWARE DEVELOPMENT
In anticipation of useful data production by the radar system, much work has been expended on developing a set of computer programs which would facilitate its display and analysis. Some of these programs have been adapted from others developed under other projects; some are adaptations of programs available at the University of Illinois Computing Center and the NCAR Computing Facility. At the moment we have programs to accomplish the following:
1) contoured CAPPI display of any field with arbitrary offset from radar and arbitrary lateral boundaries;
2) contoured vertical cross-sections of any field along arbitrarily situated and oriented lines, including RHI as a trivial case;
3) display of mass of water (inferred from Z-M or A-M relationships) as a function of height, by layers of arbitrary thickness. This can also be displayed as mass vs temperature;
4) display of vertically integrated liquid water; and 5) integration of total liquid water mass in arbitrary volumes encompassing
single storm cells or storm systems as desired.
These programs have, in the absence of data from the dual wavelength system, been applied to other data previously available, as shown by Brunkow and Morgan (1973).
In utilizing the data from the tapes produced by the dual wavelength processor, a tape reading program, which unpacks the data and puts it into a Fortran common block, has been written and used.
Programs have been written and used for the display of doppler spectra and spectral summary data.
HAIL SIGNAL RESEARCH
The CHILL radar is being utilized, even as it is being developed and brought up to full operational efficiency, in support of the National Hail Research Experiment in Colorado and in support of DESH in Illinois. Data accumulates from both
-19-
of these efforts. These data, recorded on magnetic tape, are the material with which the hail-detection potential of the CHILL radar will be studied and evaluated. A very preliminary step in this evaluation has been taken and is reported here.
The following discussion will center on data collected in Colorado with NHRE on 29 June 1973 (further examined in a case study below). The main concern here is the radar system and not the particular hail situation. What can be learned about the system with this Colorado data will be an advance for our Illinois work, as well.
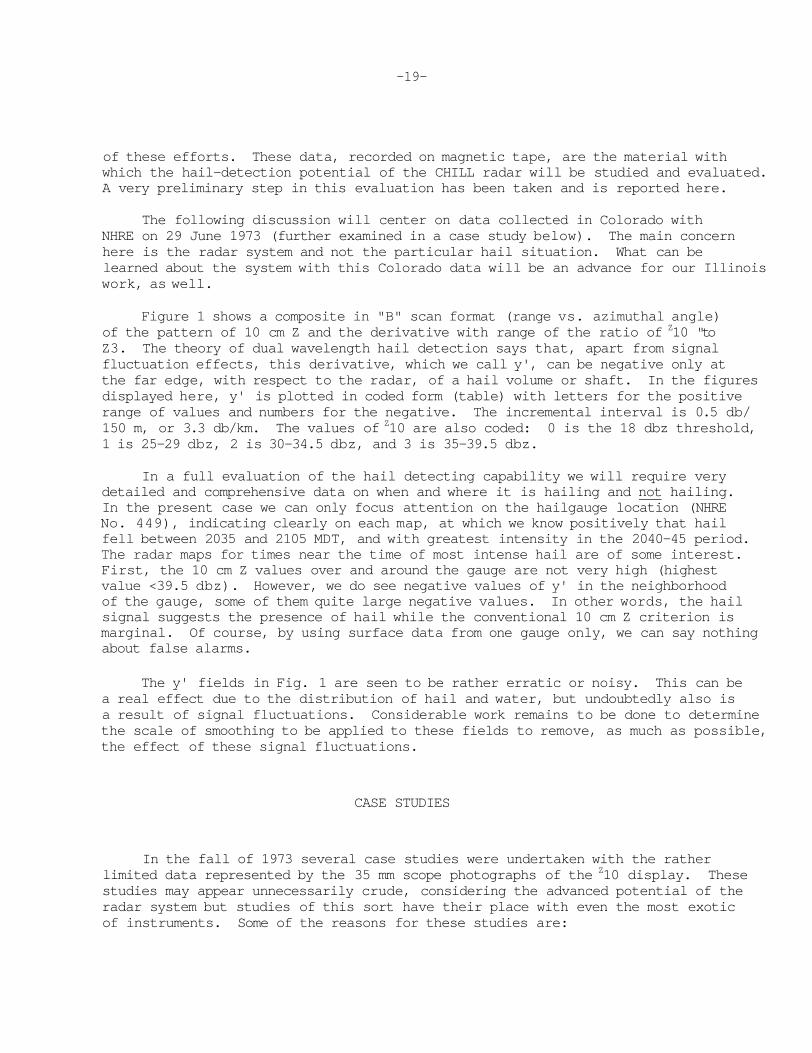
Figure 1 shows a composite in "B" scan format (range vs. azimuthal angle) of the pattern of 10 cm Z and the derivative with range of the ratio of Z10 "to Z3. The theory of dual wavelength hail detection says that, apart from signal fluctuation effects, this derivative, which we call y', can be negative only at the far edge, with respect to the radar, of a hail volume or shaft. In the figures displayed here, y' is plotted in coded form (table) with letters for the positive range of values and numbers for the negative. The incremental interval is 0.5 db/ 150 m, or 3.3 db/km. The values of Z10 are also coded: 0 is the 18 dbz threshold, 1 is 25-29 dbz, 2 is 30-34.5 dbz, and 3 is 35-39.5 dbz.
In a full evaluation of the hail detecting capability we will require very detailed and comprehensive data on when and where it is hailing and not hailing. In the present case we can only focus attention on the hailgauge location (NHRE No. 449), indicating clearly on each map, at which we know positively that hail fell between 2035 and 2105 MDT, and with greatest intensity in the 2040-45 period. The radar maps for times near the time of most intense hail are of some interest. First, the 10 cm Z values over and around the gauge are not very high (highest value <39.5 dbz). However, we do see negative values of y' in the neighborhood of the gauge, some of them quite large negative values. In other words, the hail signal suggests the presence of hail while the conventional 10 cm Z criterion is marginal. Of course, by using surface data from one gauge only, we can say nothing about false alarms.
The y' fields in Fig. 1 are seen to be rather erratic or noisy. This can be a real effect due to the distribution of hail and water, but undoubtedly also is a result of signal fluctuations. Considerable work remains to be done to determine the scale of smoothing to be applied to these fields to remove, as much as possible, the effect of these signal fluctuations.
CASE STUDIES
In the fall of 1973 several case studies were undertaken with the rather limited data represented by the 35 mm scope photographs of the Z10 display. These studies may appear unnecessarily crude, considering the advanced potential of the radar system but studies of this sort have their place with even the most exotic of instruments. Some of the reasons for these studies are:
-20-
Figure 1. Hail signal (characters) and 10 cm reflectivity (contoured) for the period 2040-2045 MDT June 29, 1973. Numbers correspond to negative values of hail signal. The characters J-A and 0-9 correspond to the range +5 to -4.5 db/150 meters, in 1/2 db/150 meters units. Reflectivity contour labels correspond to signals of 18-24.5 dbz = 0, 25-29.5 dbz = 1, 30-34.5 dbz = 2, 35-39.5 dbz = 3, and 50-54.5 dbz = 6. During this 5-minute period approximately 0.1 inch (water equivalent) of hail was recorded at site 339 (the box in the figure).

-21-
1) rapid and inexpensive acquisition by analytical personnel of experience in observing storms. Study of scope photos is not far in value from actually being there.
2) furnishing guidance for the subsequent computer analysis of digitally recorded data. The photo-based case-study becomes a catalogue or inventory of the storm. The 360/75 computer cannot handle all the digital data generated by the system at reasonable cost. It is necessary to identify and block off certain areas of the PPI display for computer analyses in order to reduce the si ze of the arrays to be handled in the computer. This has been done based on the scope photograph results.
3) they are sufficiently sophisticated for many purposes such as studies of gross cell motion, changes in echo shape, and overall morphology of storm systems.
The following two examples contain interesting observations and interpretations which can only come from the rather intimate contact with the data required by scope photograph analysis.
29 June 1973
During the early evening of 29 June a large echo area containing several intense cells passed to the north of the Fort Morgan radar. Light hail fell at about half of the hailpads in the square mile network, and 25 of the automatic hail separators in the NHRE Protected Area indicated hailfalls. Dual wavelength digital data were obtained which will permit calculation of the morphology of the liquid and ice contents of the individual storms during time histories of approximately 3 hours.
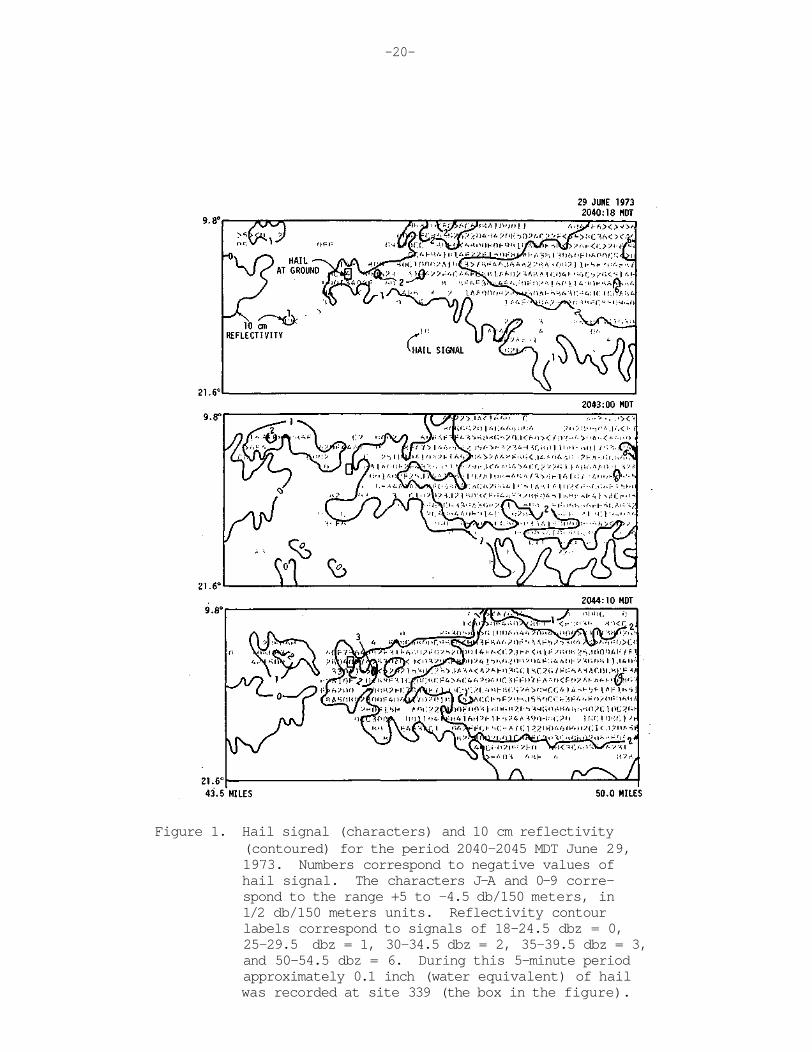
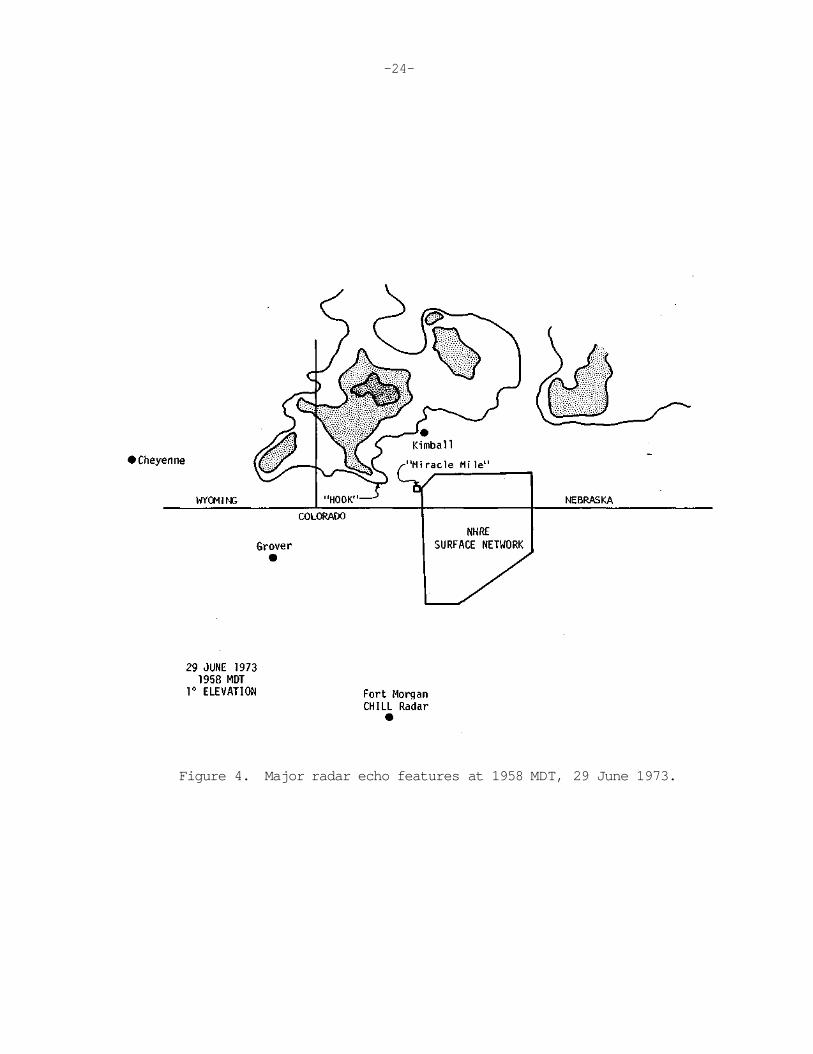
The storms developed in a flow pattern marked by SSE winds at the surface and W winds and cold advection at 500 mb. Figure 2 shows the location of the main echo cores (30 dbz) between 1900 and 2105 MDT at approximately 20-minute intervals. The storms moved onto the scope from the northwest and proceeded southeastward at about 36 knots. Apparently, the storms tended to move or grow to their right. The storms were also rather intense, exhibiting tops up to 44,000 ft and a hook echo (Fig. 4). A tornado funnel was reported about 35 miles NW of Sterling airport at 2035 (NHRE, 1974) and we presume that it was associated with this hook echo.
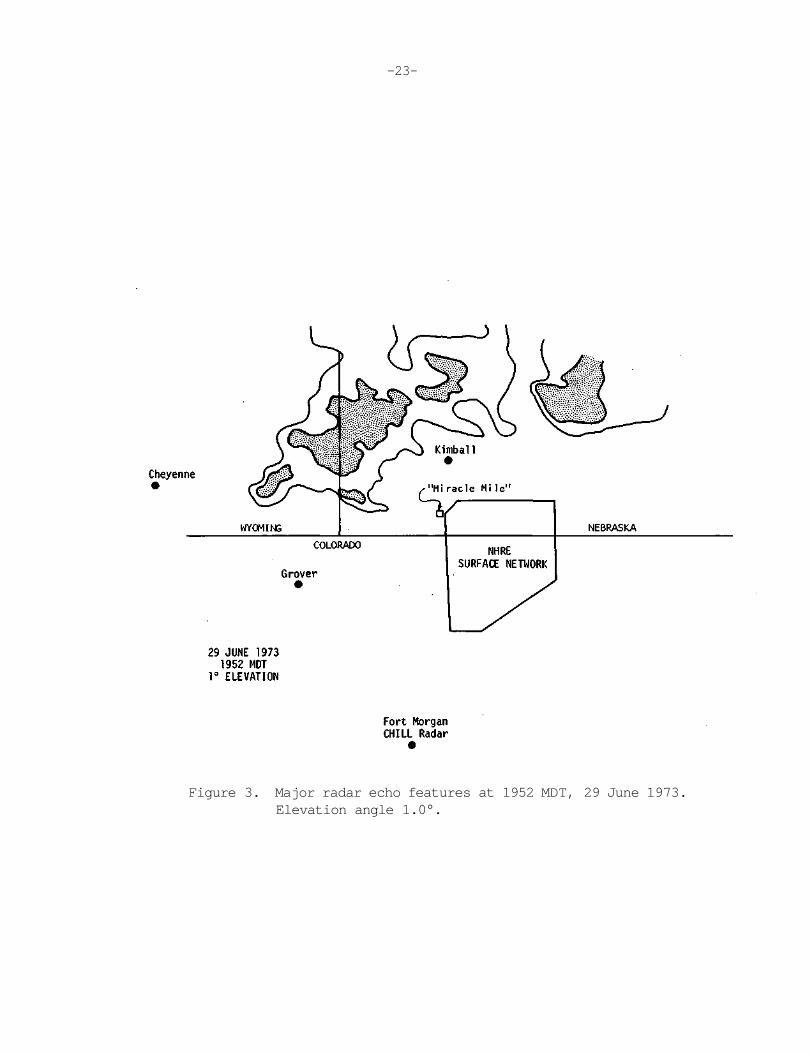
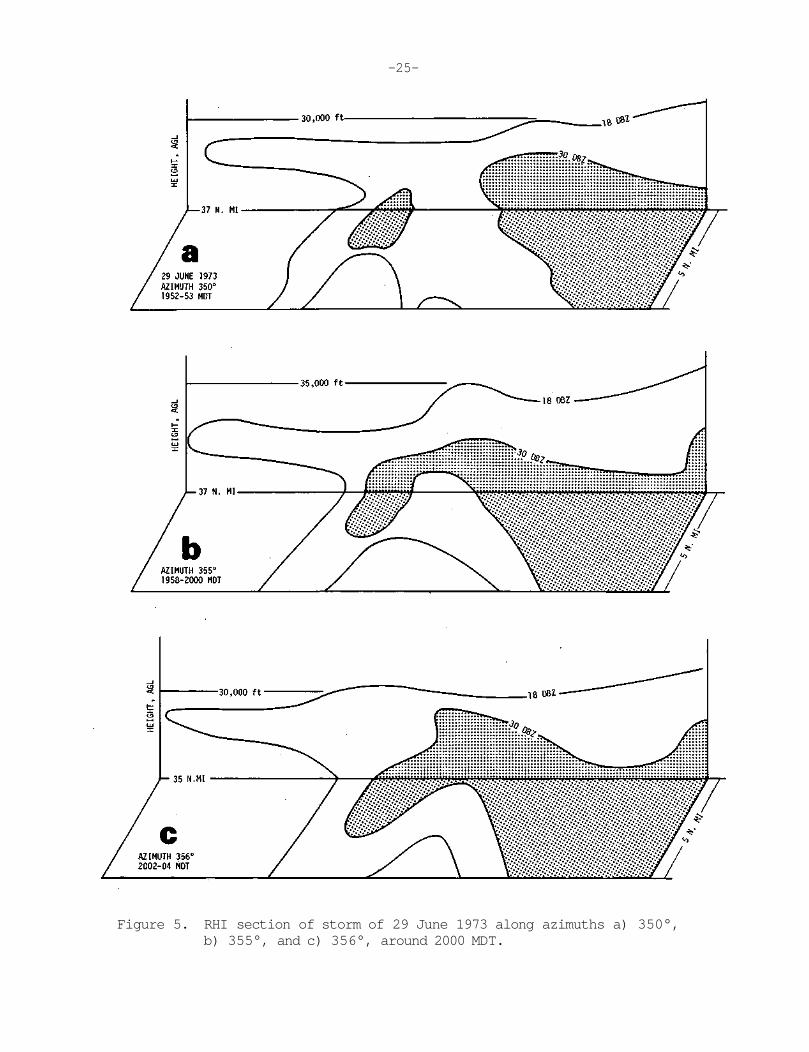
The hook echo formed at about 1958 MDT as the result of the merging of two pre-existing cells which were oriented around a notch in the threshold contour (Fig. 3). Merging of echoes has been associated with subsequent intensification of severe weather systems for sometime (Huff, et al. , 1958). The manner in which the merger took place can be seen in Fig. 5 (a-c). Figure 5a shows the pre-existing cells in cross-section. In Fig. 5b and 5c the cells merge, first aloft and then in the lower layers. The system evidently intensified during the merger as the greater than 42 dbz level became apparent on the microfilm for the first time (Fig. 3). The hook echo was rather short lived, lasting only about 12 minutes.
The relationships between the merger, the formation of the hook echo, and the occurrence of hail at the ground are not clear. However, the apparent intensification at the time of the hook echo formation probably indicates the presence
-22-
Figure 2. General echo motions (30 dbz contour) during period 1900-2105 MDT, 29 June 1973. Elevation angle 2.0°.
-23-
Figure 3. Major radar echo features at 1952 MDT, 29 June 1973. Elevation angle 1.0°.
-24-
Figure 4. Major radar echo features at 1958 MDT, 29 June 1973.
-25-
Figure 5. RHI section of storm of 29 June 1973 along azimuths a) 350°, b) 355°, and c) 356°, around 2000 MDT.
-26-
of a hail fall at that time. Surface hailfall data suggest that the most intense hail fell to the west of the hail sensor area, and probably during the hook stage of the storm. The few significant hail totals are in the northwest part of the network and were recorded within an hour of the time of the hook echo formation. It is plausible, therefore, that the hailfall was most intense during the hook stage and decreased thereafter, while the storm moved eastward.
4 July 1973
A line of organized convective activity developed over southeastern Wyoming and northwestern Colorado just prior to 1230 MDT, 4 July, 1973. The line then propagated rapidly eastward and southeastward into Nebraska. The southern most extension of the line crossed the northern one-half of the NHRE hail network. Although hail was not observed over the network, considerable hail damage was reported to the east, especially in Nebraska.
Two features of this system were analyzed in some detail. During its passage over northeastern Colorado, the line exhibited at least two discrete jumps in motion of a magnitude that could be considered mesoscale. Later, one storm developed an echo configuration characteristic of severe thunderstorms.
Synoptic Patterns. Surface and 500 mb analyses for 0500 MDT, for 4 July 1973 show that the circulation pattern was weakly anticyclonic at all levels with NW flow over the developmental area southeast of Cheyenne. Although the upper flow remained essentially unchanged, the weak low pressure trough over southwestern Canada progressed rapidly eastward and the accompanying lee troughing allowed weak southerly flow to retun to the study area by late in the day. However, mass convergence was slight and probably did not contribute as much to destabilization as did strong insolational heating (temperatures in the mid-upper 90's) coupled with relatively high moisture contents (dew points in mid 40's), both characteristic of conditions suitable for high plains summer thunderstorms. An additional destabilization factor was a weak thermal trough extending from central Wyoming into Colorado in Fig. 2 which was advected southeastward through the study area during the day.
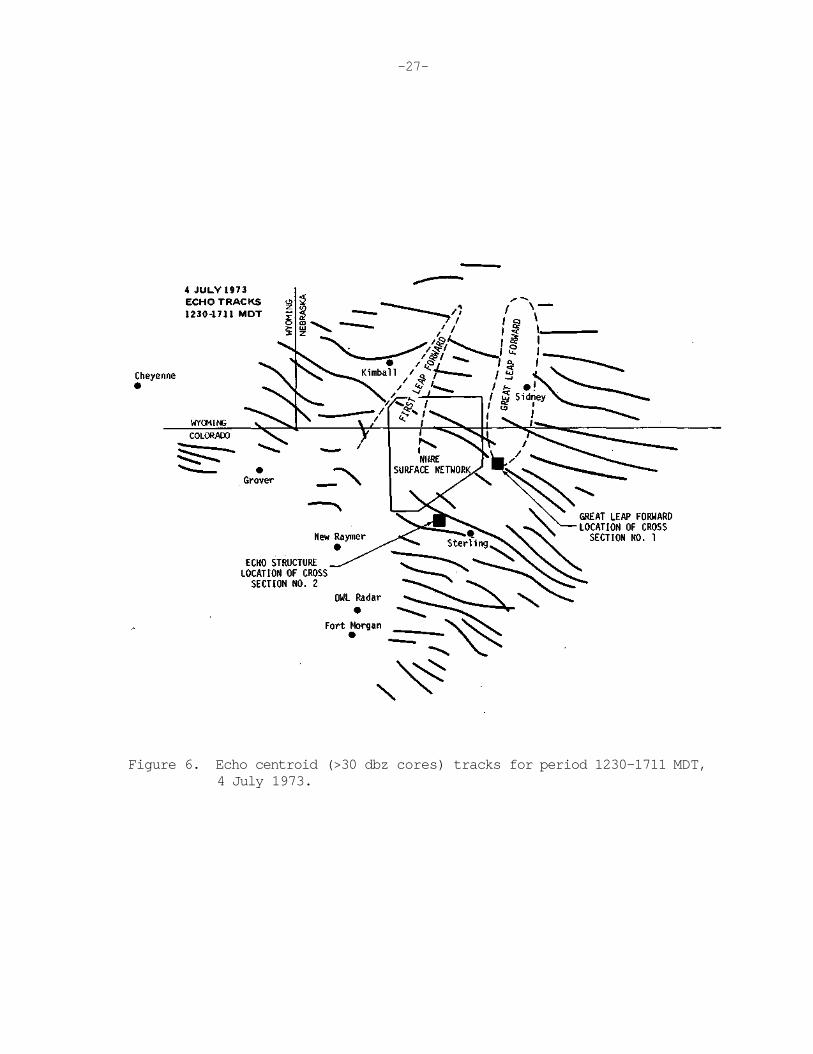
Meso-scale Motions. Cumulative echo tracks from 1230 MDT to 1711 MDT are shown in Figure 6. Movement was generally from the northwest at 35 kt. These trajectories connect centroids of 30 dbz cores as observed by the CHILL dual wavelength radar. The thunderstorm line experienced at least two discontinuous jumps or leaps forward, the first occurring at about 1400 MDT and the second centered about one hour later.
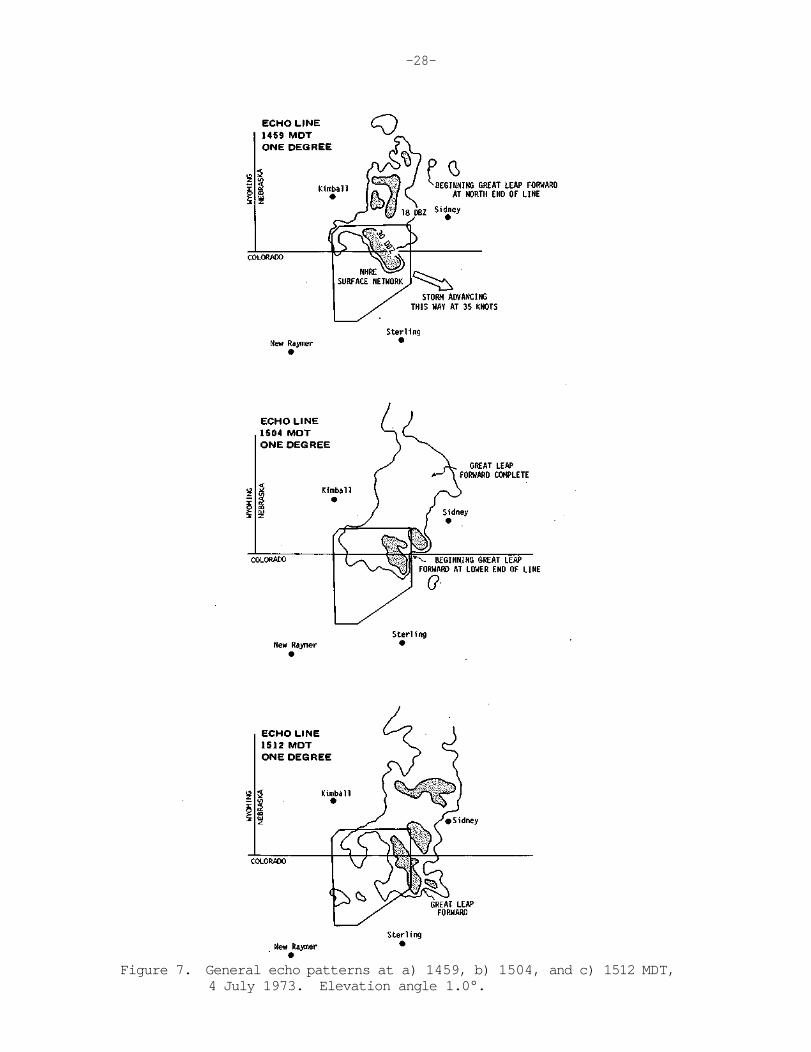
Discrete propagations comprising the "Great Leap Forward" at 1500 MDT occurred at distances up to 15 n mi. A typical developmental sequence is shown in Fig. 7 (a-c). At 1459 MDT, the echo line extended from the NHRE hail network northward into Nebraska at ranges from 40-80 n mi from the Fort Morgan radar. The great leap began when new echoes formed well to the east of the pre-existing line and rapidly increased in areal extent to merge with it. By 1504 MDT this bar
-27-
Figure 6. Echo centroid (>30 dbz cores) tracks for period 1230-1711 MDT, 4 July 1973.
-28-
Figure 7. General echo patterns at a) 1459, b) 1504, and c) 1512 MDT, 4 July 1973. Elevation angle 1.0°.
-29-
occurred on the northern extent of the line. Meanwhile, the newly developed echo midway between Sterling and Sidney marks the initiation of the jump at the southern end of the line.
By 1512 MDT, the great leap forward had occurred at the southern end of the line. Note the rapid southeastward progress of the 30 dbz echo care out of the NHRE network. Yet the new echo, still apparent at 1512 MDT, remained essentially stationary.
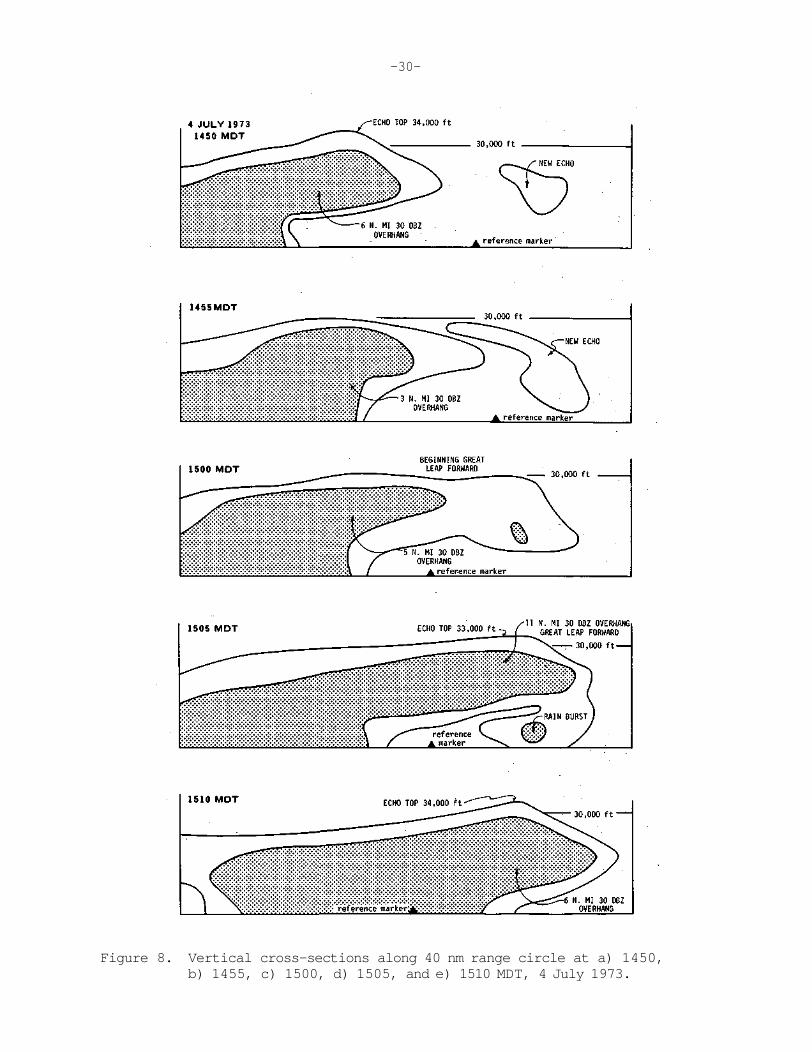
To further reveal the character of the great leap forward, a series of fine cross-sections was constructed about the 40 n mi contour from one degree tilt sequence 10 cm radar film intense echoes located along the southern end of the line. Ranging from 1450 MDT to 1510 MDT, they are shown in Fig. 8. The triangle on the lower boundary is a reference marker fixed with respect to the ground. It gives an indication of the relative motion of the developing storm.
The cross-section at 1450 MDT shows extensive overhang associated with the 4 July storm. Echo tops reach 34 kft and were centered directly above the overhang. A new echo had developed aloft about 12 n mi downwind from the approaching rain curtain. Five minutes later at 1455 MDT, the two echoes were approaching merger. The mainline echo top had descended to 30 kft and the overhang diminished from 6 n mi to 3 n mi by the encroaching rain curtain, both suggestive of temporary weakening.
By 1500 MDT both echoes had merged and the 30 dbz overhang extended over the reference marker, a distance of 5 n mi from the precipitation curtain. A 30+ dbz core developed within the new echo at an altitude of 12 kft.
The cross-section of 1505 MDT shows an immense 11 n mi overhang with radar reflectivities greater than 30 dbz. The echo top had risen to 33 kft and was located directly above the position of the new echo. The 30 dbz isolated core had descended to 4 kft, a relative fall rate of 8 m/sec indicating it to have consisted of large raindrops or small hail. However, it is apparent that the up-draft mechanism driving the squall line had overtaken the isolated echo by this time. In such a case, airflow in the immediate vicinity of the rain burst would be expected to be upward thus requiring a higher particle fall speed and raising the possibility that the rain burst might have consisted of larger hail.
Unfortunately no hail measurements were taken where the burst descended.
By 1510 MDT, the isolated echo had completely merged into the mainline echo and the great leap forward was complete. Overall, echo structure at 1510 MDT was not dissimilar from reflectivity patterns of 1450 MDT prior to the jump.
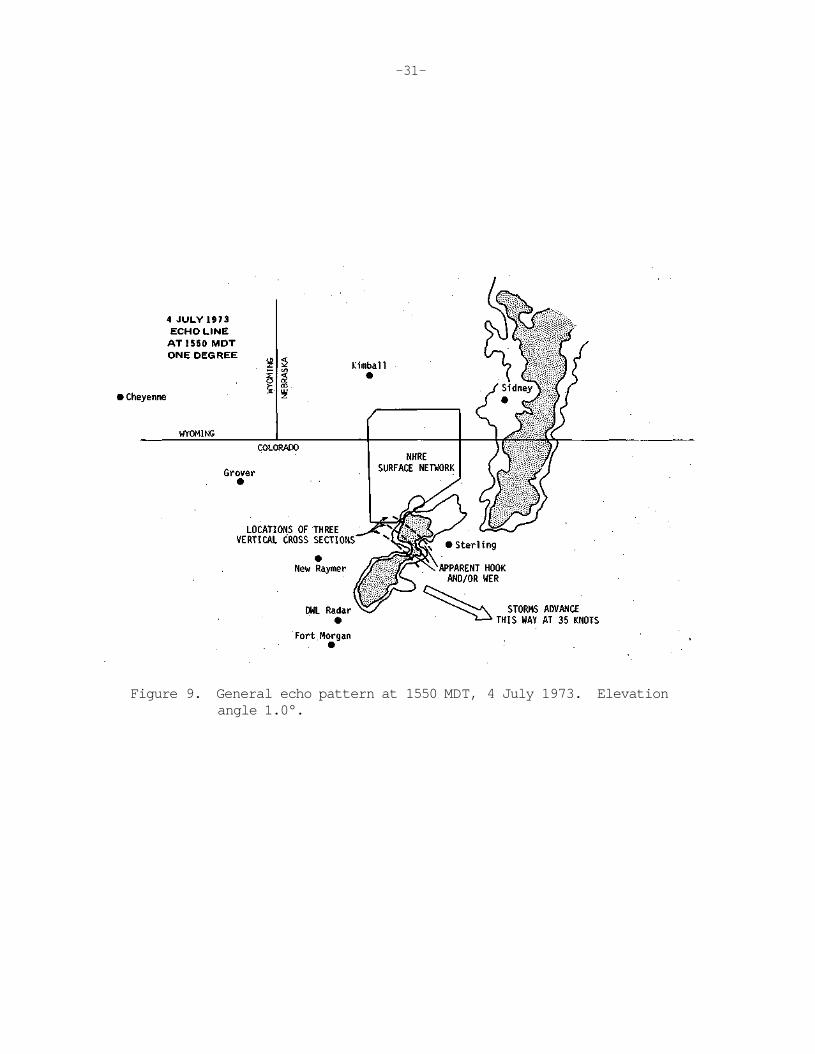
Thunderstorm Scale Structures. A second line of echoes developed prior to 1550 MDT and advanced in a general southeastward direction at 35 kft. Figure 9 shows the northernmost and west of Sterling, to have assumed reflectivity shapes characteristic of severe right moving thunderstorms. Present on the northeast flank was a well defined notch and to its right, a protruding line echo wave pattern (LEWP) suggesting possible cyclonic circulation. Three vertical cross sections at
-30-
Figure 8. Vertical cross-sections along 40 nm range circle at a) 1450, b) 1455, c) 1500, d) 1505, and e) 1510 MDT, 4 July 1973.
-31-
Figure 9. General echo pattern at 1550 MDT, 4 July 1973. Elevation angle 1.0°.
-32-
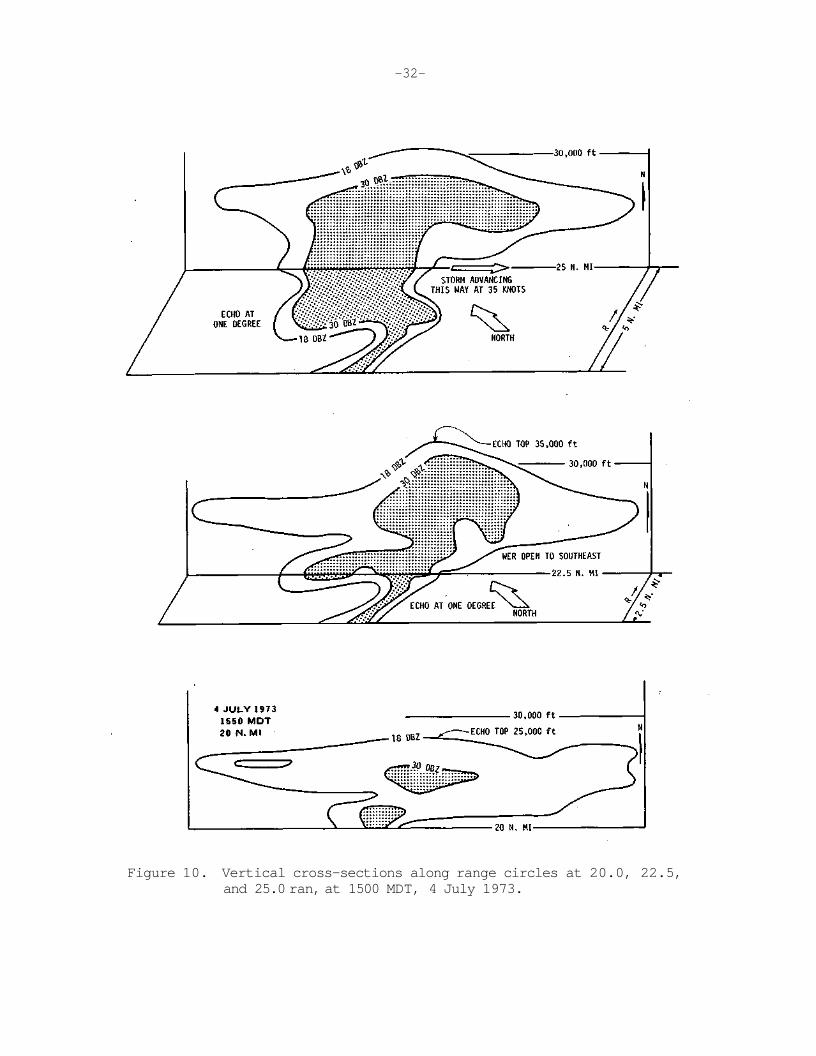
Figure 10. Vertical cross-sections along range circles at 20.0, 22.5, and 25.0 ran, at 1500 MDT, 4 July 1973.
-33-
intervals of 2.5 n mi were constructed along range markers beginning at 20 n mi in order to reveal the character of the vertical reflectivity structure. The cross section portions relation to the suspect echo are given by the dashed lines in Fig. 10.
The first cross section in figure intersects the LEWP below the hook and reveals this echo to consist of light precipitation falling from a cloud shelf topping 25 kft. The second cross section constructed along the 22.5 n mi range marker shows a well developed weak echo region (WER) which was bounded on three sides and open to the southeast. Above this signature echo tops rise to 35 kft. Further out, at 25 n mi, the last cross section shows a less developed WER with an overhang that typifies echo structures of the squall line discussed in the previous section. Echo tops are lower at this range suggesting the WER-maintaining updraft to be quite local.
The intense local updraft was apparently short lived. By 1600 MDT the notch had filled with 30+ dbz echo and by 1611 MDT the entire echo conformed rather uniformly with the remainder of the line. Hail was not reported in the vicinity of this storm.
Conclusion. The lack of severe weather reported with a thunderstorm of apparent good organization suggests that echoes with well developed hooks and/or weak echo regions may not necessarily be indications of severe weather. Rather, moderate updrafts with relatively low moisture content may be expected to provide little incubation time for radar detectable hydrometeors.
PUBLICATIONS RELATED TO CONTRACT
Carbone, R. E., D. Atlas, P. Eccles, R. Fetter, and E. A. Mueller, 1973: Dual wavelength radar hail detection. Bulletin of the AMS, Vol, 54, #9, pp. 921-924.
Eccles, P. and E. A. Mueller, 1971: X-band attenuation and liquid water content estimation by dual-wavelength radar. Journal of Applied Meteoro., Vol. 10, pp. 1252-1259.
Eccles, P. and E. A. Mueller, 1971: X-band attenuation and liquid water content estimation by dual-wavelength radar. NHRE Technical Report No. 71/1, NCAR, Boulder, Colorado, 26 pp.
Gardner, M., 1973: An evaluation of exponential averaging of the backscatter from rain. Submitted for publication in the Journal of Applied Meteoro.
Morgan, G. M., Jr., 1972: On the growth of large hail. Monthly Weather Review, Vol. 100, #3, pp. 196-205.
Morgan, G. M., Jr., and E. A. Mueller, 1972: The total liquid water mass of large convective storms. Preprints 15th Radar Meteorology Conference, AMS, Urbana, Ill.
Mueller, E. A., 1974: Comparison of echo statistics for seeded and non-seeded storms in NHRE 1973. Paper to be presented at the Fourth Conference on Weather Modification, Fort Lauderdale, Florida, November 18-21, 1974.
-34-
Mueller, E. A., and G. M. Morgan, Jr., 1972: Colorado-Illinois operational and analytical program utilizing a dual wavelength radar facility. Annual Report to UCAR, Contract NCAR 186/71. Illinois State Water Survey, Urbana, •Illinois, 13 pp.
Mueller, E. A., and G. M. Morgan, Jr., 1973: Interim Report on Colorado and Illinois Operational and Analytical Program Utilizing a Dual Wavelength Radar Facility, NCAR 186/71, Illinois State Water Survey, Urbana, Illinois, 13 pp.
REFERENCES
Brunkow, D., and G. M. Morgan, Jr., 1973: METROMEX radar studies, Part K of Summary Report of METROMEX Studies, 1971-72, F. A. Huff, editor. Illinois State Water Survey Rept. of Investigation 74. Illinois State Water Survey, Urbana.
Huff, F. A., R. G. Semonin, S. A. Changnon, Jr., and D. M. A. Jones, 1958: Hydrometeorological analysis of severe rainstorms in Illinois 1956-1957 with summary of previous storms. Report of Investigation 35, Illinois State Water Survey, Urbana, 79 pp.
NHRE, 1974: Calendar of events during 1973 Field Operations of the National Hail Research Experiment. Data Report No. 73-1.


![T emperate deciduous forest [Meteorologist]](https://img.pdfslide.us/doc/110x75/56816301550346895dd37963/t-emperate-deciduous-forest-meteorologist.jpg)