Embed Size (px)
Citation preview
SOUTHERN BASINS PWA
GROUNDWATER LEVEL AND SALINITY STATUS REPORT 2009–10
Southern Basins PWA Groundwater Status Report 2009-10| 1 | DEPARTMENT FOR WATER
SUMMARY 2009–10
The Southern Basins Prescribed Wells Area (PWA) is located in southern Eyre Peninsula, approximately 20 km west of Port Lincoln and 270 km west of Adelaide. It is prescribed under South Australia’s Natural Resources Management Act 2004 and a Water Allocation Plan provides for sustainable use of the groundwater resources.
Groundwater extractions in the Southern Basins PWA occur primarily from the Quaternary Limestone Aquifer (Bridgewater Formation). Metered extractions for 2009–10 totalled 6640 ML, which represents a decrease of 9% from the previous water use year. It is the lowest recorded in the past ten years and is primarily a reflection of reduced consumer demand (e.g. due to water restrictions). The vast majority of the extractions (6591 ML) are for public water supply, with the Uley South Basin providing about 90% of this volume.
After several decades of declining groundwater levels, very good winter and spring rainfall in both 2009 and 2010 have increased recharge and led to watertable rises of up to 0.4 m since July 2009. In some areas, the water levels are the highest recorded for the past ten years. Groundwater salinities are stable or decreasing as a result of the increased recharge.
While the status assigned below reflects the positive trends observed during 2009–10, it must be remembered that in the past there was a prolonged period of below-average rainfall that resulted in declining water levels in most basins and a gradual rise in groundwater salinities. The possibility that such periods of low rainfall will occur again in the future must be considered in long term planning.
Lincoln Basin is the most vulnerable to salinity increases due to the close proximity of saline water at the surface (Sleaford Mere and Proper Bay) and saline groundwater beneath the fresh groundwater lenses. The long-term response of this basin to variations in rainfall and groundwater extraction will need to be assessed.
Southern Basins PWA Groundwater Status Report 2009-10| 2 | DEPARTMENT FOR WATER
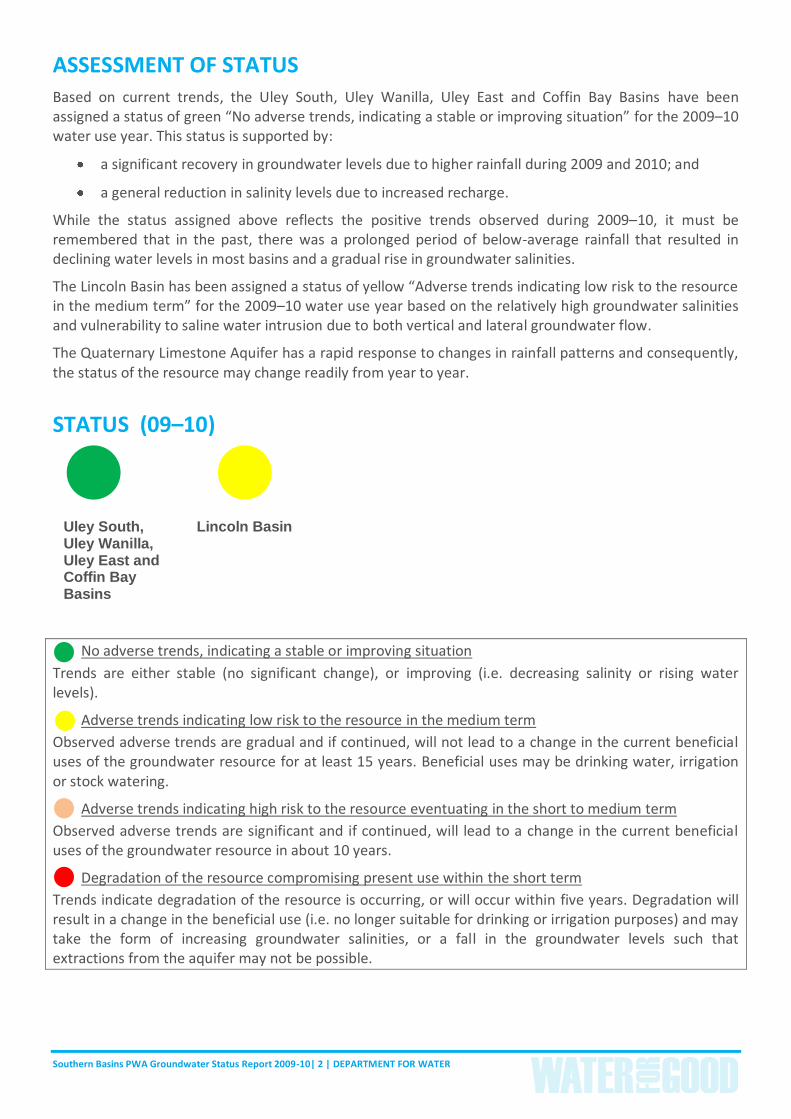
ASSESSMENT OF STATUS Based on current trends, the Uley South, Uley Wanilla, Uley East and Coffin Bay Basins have been assigned a status of green “No adverse trends, indicating a stable or improving situation” for the 2009–10 water use year. This status is supported by:
a significant recovery in groundwater levels due to higher rainfall during 2009 and 2010; and
a general reduction in salinity levels due to increased recharge.
While the status assigned above reflects the positive trends observed during 2009–10, it must be remembered that in the past, there was a prolonged period of below-average rainfall that resulted in declining water levels in most basins and a gradual rise in groundwater salinities.
The Lincoln Basin has been assigned a status of yellow “Adverse trends indicating low risk to the resource in the medium term” for the 2009–10 water use year based on the relatively high groundwater salinities and vulnerability to saline water intrusion due to both vertical and lateral groundwater flow.
The Quaternary Limestone Aquifer has a rapid response to changes in rainfall patterns and consequently, the status of the resource may change readily from year to year.
STATUS (09–10)
No adverse trends, indicating a stable or improving situation
Trends are either stable (no significant change), or improving (i.e. decreasing salinity or rising water levels).
Adverse trends indicating low risk to the resource in the medium term
Observed adverse trends are gradual and if continued, will not lead to a change in the current beneficial uses of the groundwater resource for at least 15 years. Beneficial uses may be drinking water, irrigation or stock watering.
Adverse trends indicating high risk to the resource eventuating in the short to medium term
Observed adverse trends are significant and if continued, will lead to a change in the current beneficial uses of the groundwater resource in about 10 years.
Degradation of the resource compromising present use within the short term
Trends indicate degradation of the resource is occurring, or will occur within five years. Degradation will result in a change in the beneficial use (i.e. no longer suitable for drinking or irrigation purposes) and may take the form of increasing groundwater salinities, or a fall in the groundwater levels such that extractions from the aquifer may not be possible.
Uley South, Uley Wanilla, Uley East and Coffin Bay Basins
Lincoln Basin
Southern Basins PWA Groundwater Status Report 2009-10| 3 | DEPARTMENT FOR WATER
BACKGROUND
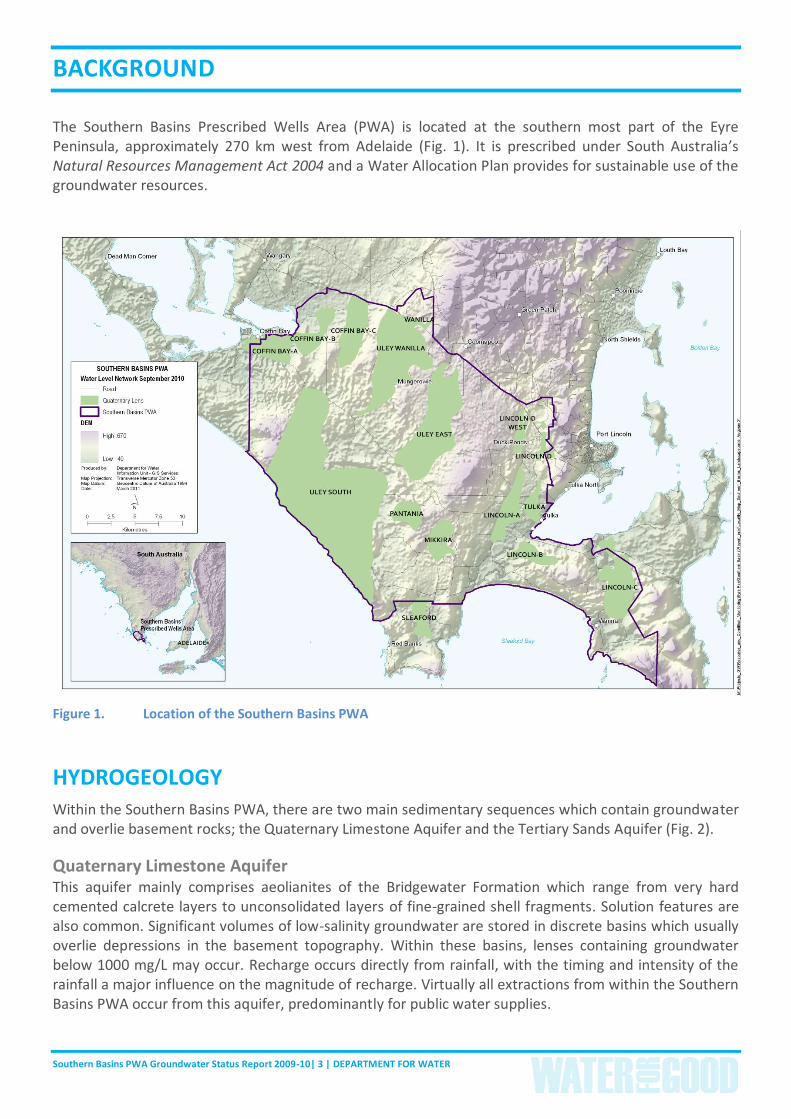
The Southern Basins Prescribed Wells Area (PWA) is located at the southern most part of the Eyre Peninsula, approximately 270 km west from Adelaide (Fig. 1). It is prescribed under South Australia’s Natural Resources Management Act 2004 and a Water Allocation Plan provides for sustainable use of the groundwater resources.
Figure 1. Location of the Southern Basins PWA
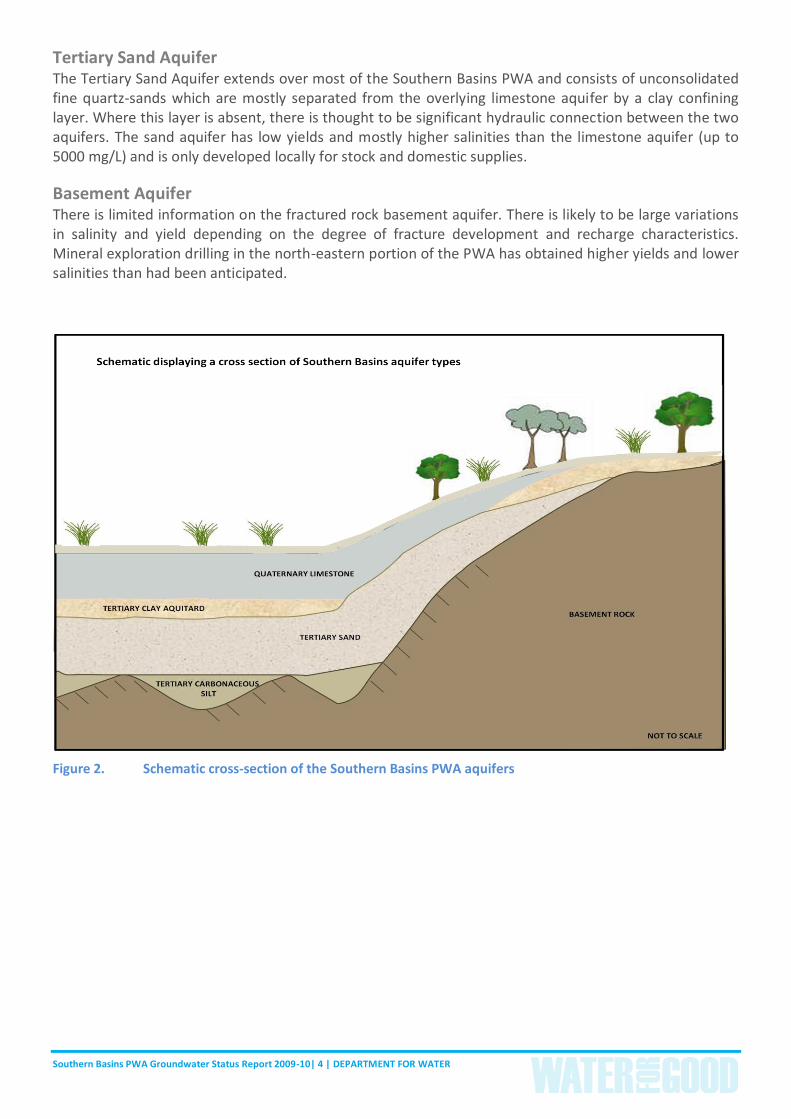
HYDROGEOLOGY Within the Southern Basins PWA, there are two main sedimentary sequences which contain groundwater and overlie basement rocks; the Quaternary Limestone Aquifer and the Tertiary Sands Aquifer (Fig. 2).
Quaternary Limestone Aquifer This aquifer mainly comprises aeolianites of the Bridgewater Formation which range from very hard cemented calcrete layers to unconsolidated layers of fine-grained shell fragments. Solution features are also common. Significant volumes of low-salinity groundwater are stored in discrete basins which usually overlie depressions in the basement topography. Within these basins, lenses containing groundwater below 1000 mg/L may occur. Recharge occurs directly from rainfall, with the timing and intensity of the rainfall a major influence on the magnitude of recharge. Virtually all extractions from within the Southern Basins PWA occur from this aquifer, predominantly for public water supplies.
Southern Basins PWA Groundwater Status Report 2009-10| 4 | DEPARTMENT FOR WATER
Tertiary Sand Aquifer The Tertiary Sand Aquifer extends over most of the Southern Basins PWA and consists of unconsolidated fine quartz-sands which are mostly separated from the overlying limestone aquifer by a clay confining layer. Where this layer is absent, there is thought to be significant hydraulic connection between the two aquifers. The sand aquifer has low yields and mostly higher salinities than the limestone aquifer (up to 5000 mg/L) and is only developed locally for stock and domestic supplies.
Basement Aquifer There is limited information on the fractured rock basement aquifer. There is likely to be large variations in salinity and yield depending on the degree of fracture development and recharge characteristics. Mineral exploration drilling in the north-eastern portion of the PWA has obtained higher yields and lower salinities than had been anticipated.
Figure 2. Schematic cross-section of the Southern Basins PWA aquifers

Southern Basins PWA Groundwater Status Report 2009-10| 5 | DEPARTMENT FOR WATER
GROUNDWATER DEPENDENT ECOSYSTEMS Whilst groundwater dependent ecosystems (GDEs) have not been considered in this assessment of the status of the groundwater resource, it is important to note the presence and ecological characteristics of the GDEs found in the Southern Basins PWA. Groundwater dependent ecosystems can be defined as ecosystems where groundwater provides all or part of the water quantity, chemistry or temperature requirements, either permanently, seasonally or intermittently. It is generally considered that shallow watertables (less than 10 m below the surface) are more likely to support GDEs than deeper watertables.
Water dependent ecosystems that potentially have a dependence on groundwater have been mapped throughout the Southern Basins PWA, and comprise wetlands, terrestrial plants and subsurface biota inhabiting water filled voids (stygofauna).
Groundwater dependent wetlands are located largely around the perimeter of the Southern Basins PWA and are closely aligned with, or located immediately outside, mapped freshwater lenses. Most of the mapped groundwater dependent wetlands are intermittent or seasonal and support bird populations and a range of groundwater dependent aquatic and terrestrial vegetation species. Sleaford Mere is the only mapped permanent groundwater dependent wetland within the PWA.
There is little information on the condition of the GDEs in the Southern Basins PWA; however, the regional decline in groundwater levels over the last 10–15 years has possibly resulted in increased risks to these GDEs. Direct groundwater discharge to the marine environment which may also support marine animals and plants occurs from the Quaternary Limestone Aquifer along the coastal margin of the PWA.
Southern Basins PWA Groundwater Status Report 2009-10| 6 | DEPARTMENT FOR WATER
RAINFALL
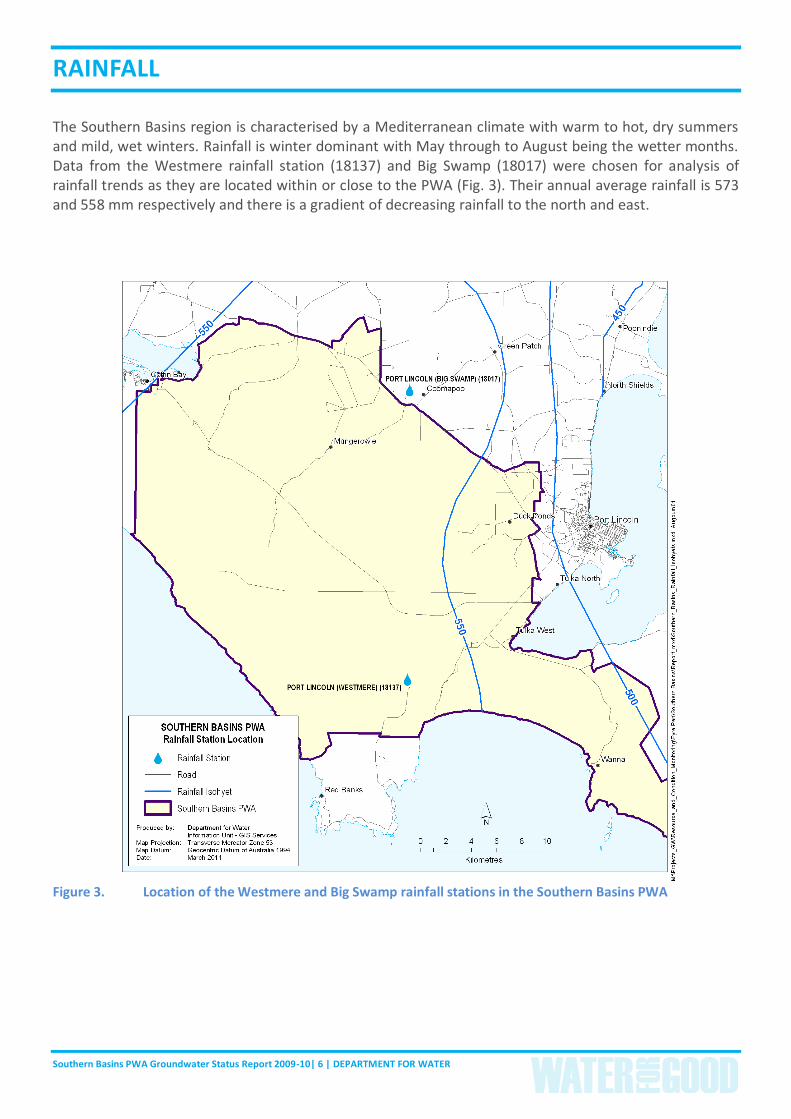
The Southern Basins region is characterised by a Mediterranean climate with warm to hot, dry summers and mild, wet winters. Rainfall is winter dominant with May through to August being the wetter months. Data from the Westmere rainfall station (18137) and Big Swamp (18017) were chosen for analysis of rainfall trends as they are located within or close to the PWA (Fig. 3). Their annual average rainfall is 573 and 558 mm respectively and there is a gradient of decreasing rainfall to the north and east.
Figure 3. Location of the Westmere and Big Swamp rainfall stations in the Southern Basins PWA
Southern Basins PWA Groundwater Status Report 2009-10| 7 | DEPARTMENT FOR WATER
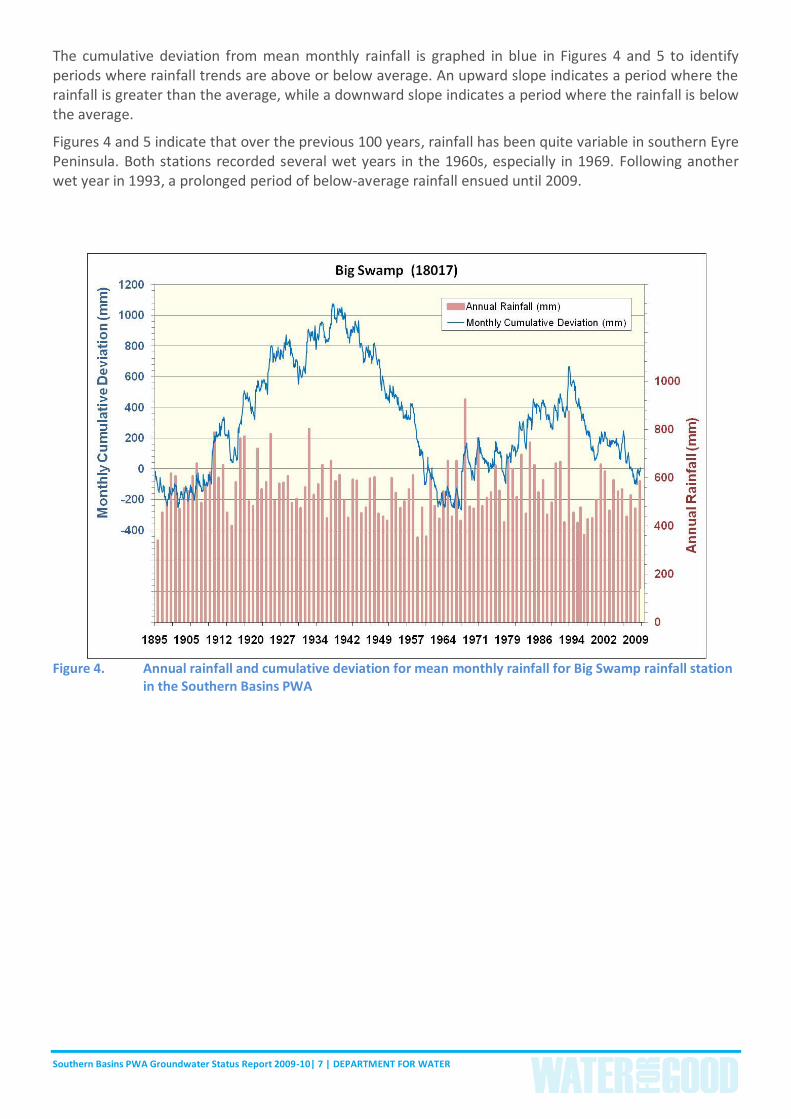
The cumulative deviation from mean monthly rainfall is graphed in blue in Figures 4 and 5 to identify periods where rainfall trends are above or below average. An upward slope indicates a period where the rainfall is greater than the average, while a downward slope indicates a period where the rainfall is below the average.
Figures 4 and 5 indicate that over the previous 100 years, rainfall has been quite variable in southern Eyre Peninsula. Both stations recorded several wet years in the 1960s, especially in 1969. Following another wet year in 1993, a prolonged period of below-average rainfall ensued until 2009.
Figure 4. Annual rainfall and cumulative deviation for mean monthly rainfall for Big Swamp rainfall station
in the Southern Basins PWA
Southern Basins PWA Groundwater Status Report 2009-10| 8 | DEPARTMENT FOR WATER
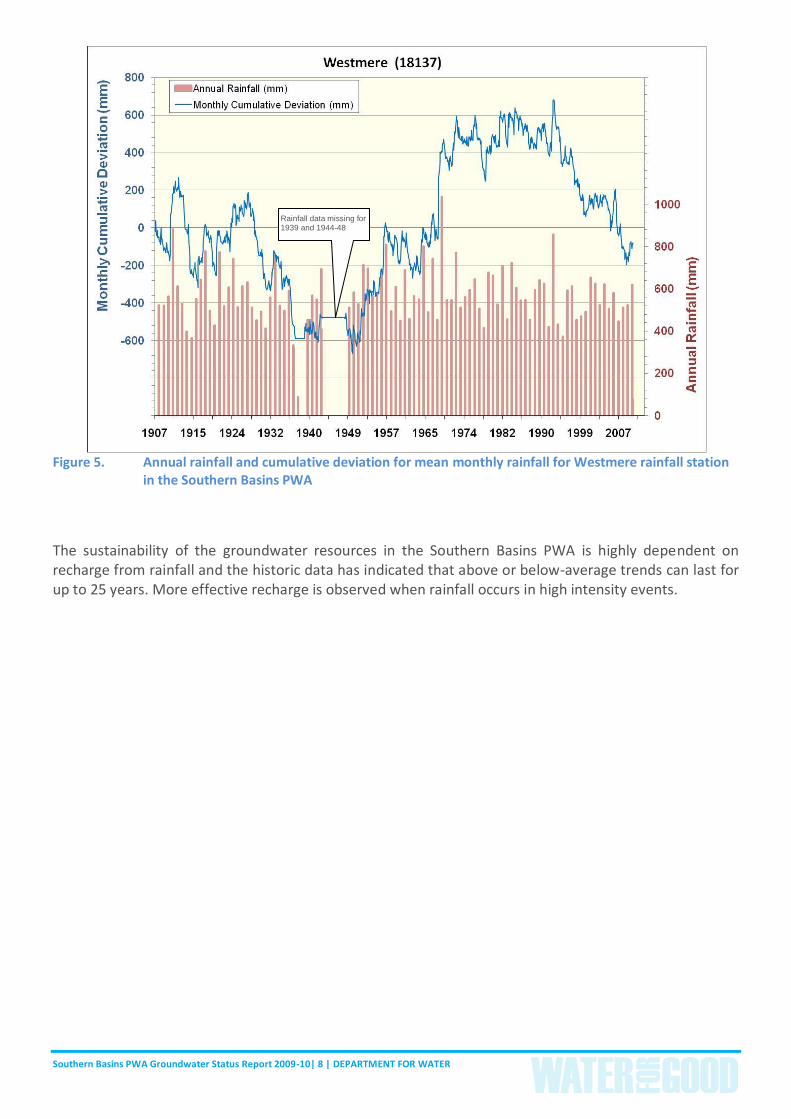
Figure 5. Annual rainfall and cumulative deviation for mean monthly rainfall for Westmere rainfall station
in the Southern Basins PWA
The sustainability of the groundwater resources in the Southern Basins PWA is highly dependent on recharge from rainfall and the historic data has indicated that above or below-average trends can last for up to 25 years. More effective recharge is observed when rainfall occurs in high intensity events.
Rainfall data missing for 1939 and 1944-48
Southern Basins PWA Groundwater Status Report 2009-10| 9 | DEPARTMENT FOR WATER
GROUNDWATER USE
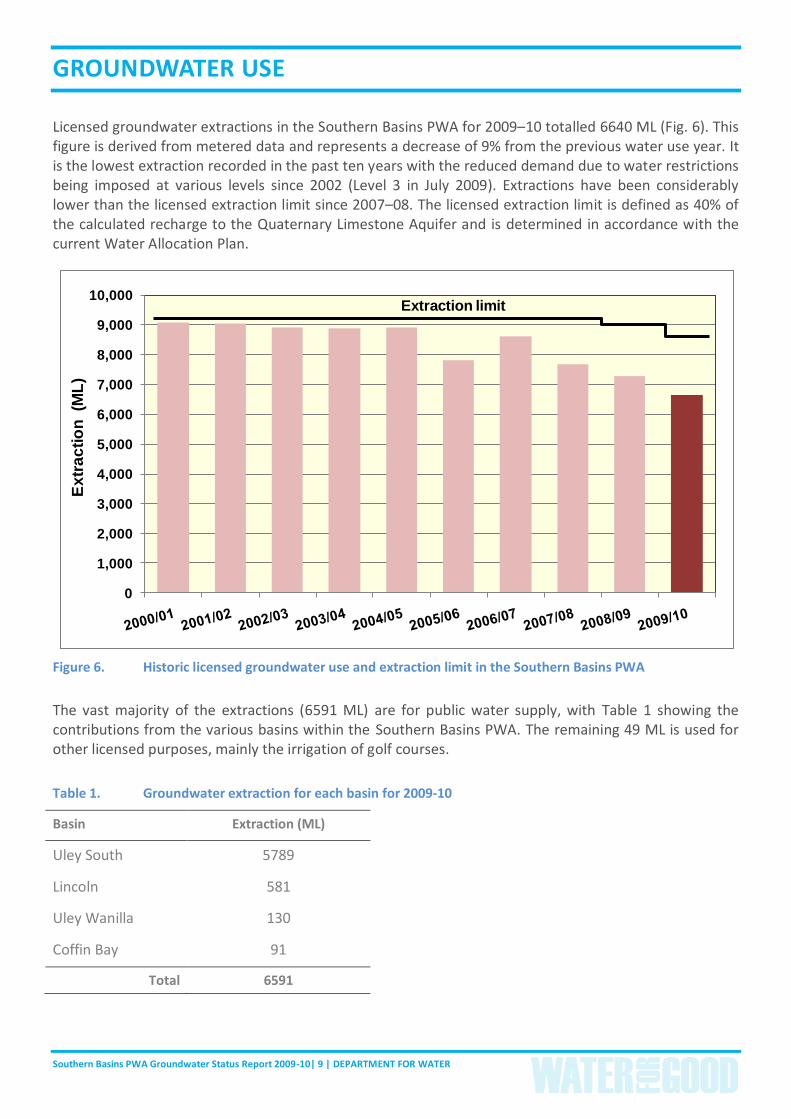
Licensed groundwater extractions in the Southern Basins PWA for 2009–10 totalled 6640 ML (Fig. 6). This figure is derived from metered data and represents a decrease of 9% from the previous water use year. It is the lowest extraction recorded in the past ten years with the reduced demand due to water restrictions being imposed at various levels since 2002 (Level 3 in July 2009). Extractions have been considerably lower than the licensed extraction limit since 2007–08. The licensed extraction limit is defined as 40% of the calculated recharge to the Quaternary Limestone Aquifer and is determined in accordance with the current Water Allocation Plan.
Figure 6. Historic licensed groundwater use and extraction limit in the Southern Basins PWA
The vast majority of the extractions (6591 ML) are for public water supply, with Table 1 showing the contributions from the various basins within the Southern Basins PWA. The remaining 49 ML is used for other licensed purposes, mainly the irrigation of golf courses.
Table 1. Groundwater extraction for each basin for 2009-10
Basin Extraction (ML)
Uley South 5789
Lincoln 581
Uley Wanilla 130
Coffin Bay 91
Total 6591
0
1,000
2,000
3,000
4,000
5,000
6,000
7,000
8,000
9,000
10,000
Ex
tra
cti
on
(M
L)
Extraction limit
Southern Basins PWA Groundwater Status Report 2009-10| 10 | DEPARTMENT FOR WATER
GROUNDWATER OBSERVATION NETWORKS
WATER LEVEL NETWORK
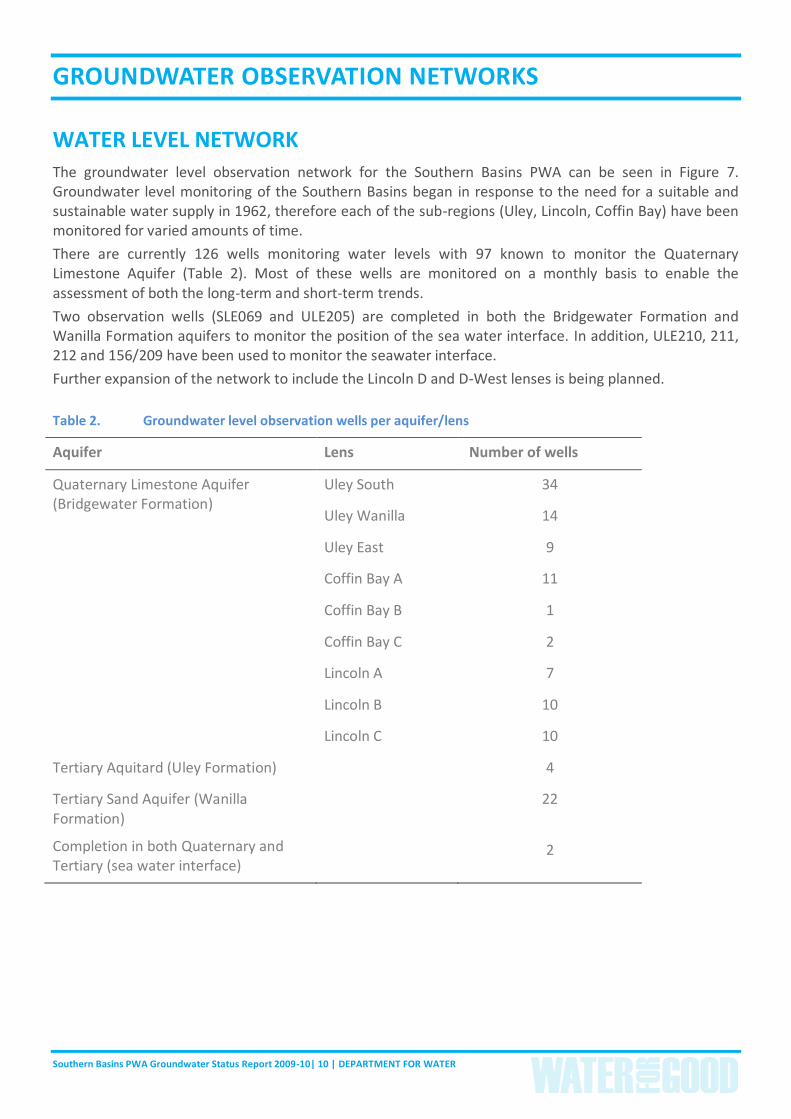
The groundwater level observation network for the Southern Basins PWA can be seen in Figure 7. Groundwater level monitoring of the Southern Basins began in response to the need for a suitable and sustainable water supply in 1962, therefore each of the sub-regions (Uley, Lincoln, Coffin Bay) have been monitored for varied amounts of time.
There are currently 126 wells monitoring water levels with 97 known to monitor the Quaternary Limestone Aquifer (Table 2). Most of these wells are monitored on a monthly basis to enable the assessment of both the long-term and short-term trends.
Two observation wells (SLE069 and ULE205) are completed in both the Bridgewater Formation and Wanilla Formation aquifers to monitor the position of the sea water interface. In addition, ULE210, 211, 212 and 156/209 have been used to monitor the seawater interface.
Further expansion of the network to include the Lincoln D and D-West lenses is being planned.
Table 2. Groundwater level observation wells per aquifer/lens
Aquifer Lens Number of wells
Quaternary Limestone Aquifer (Bridgewater Formation)
Uley South 34
Uley Wanilla 14
Uley East 9
Coffin Bay A 11
Coffin Bay B 1
Coffin Bay C 2
Lincoln A 7
Lincoln B 10
Lincoln C 10
Tertiary Aquitard (Uley Formation) 4
Tertiary Sand Aquifer (Wanilla Formation)
Completion in both Quaternary and Tertiary (sea water interface)
22
2
Southern Basins PWA Groundwater Status Report 2009-10| 11 | DEPARTMENT FOR WATER
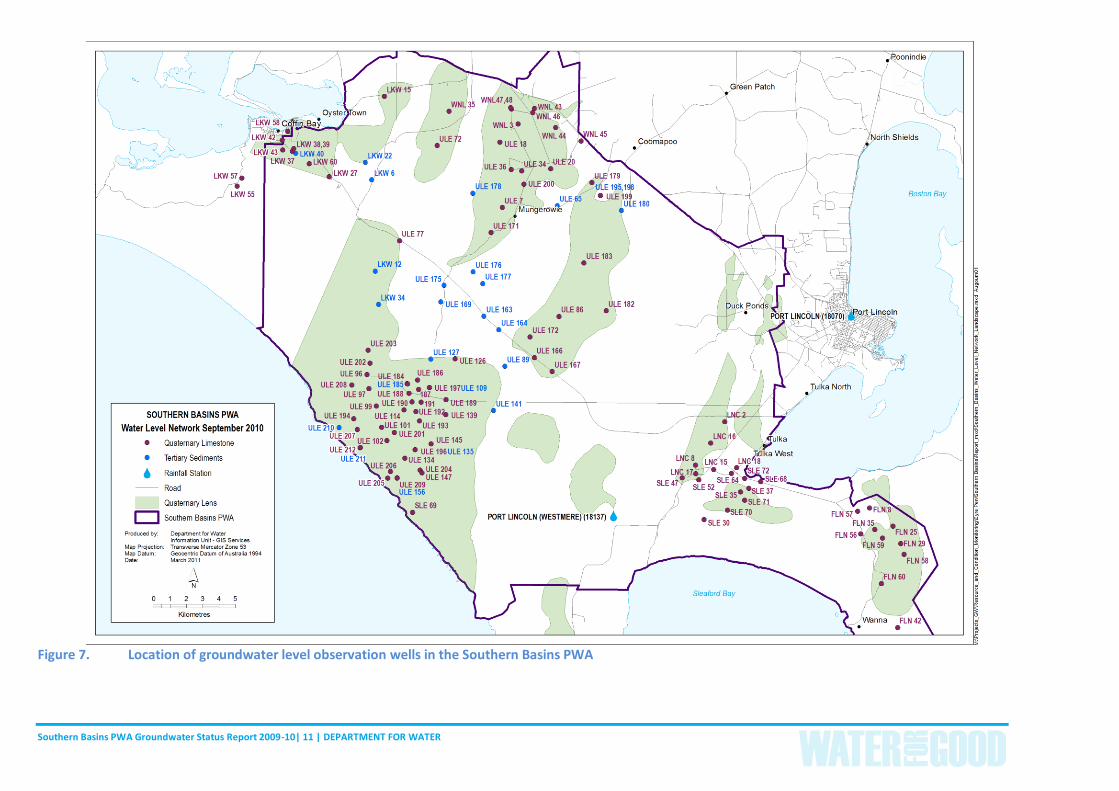
Figure 7. Location of groundwater level observation wells in the Southern Basins PWA
Southern Basins PWA Groundwater Status Report 2009-10| 12 | DEPARTMENT FOR WATER
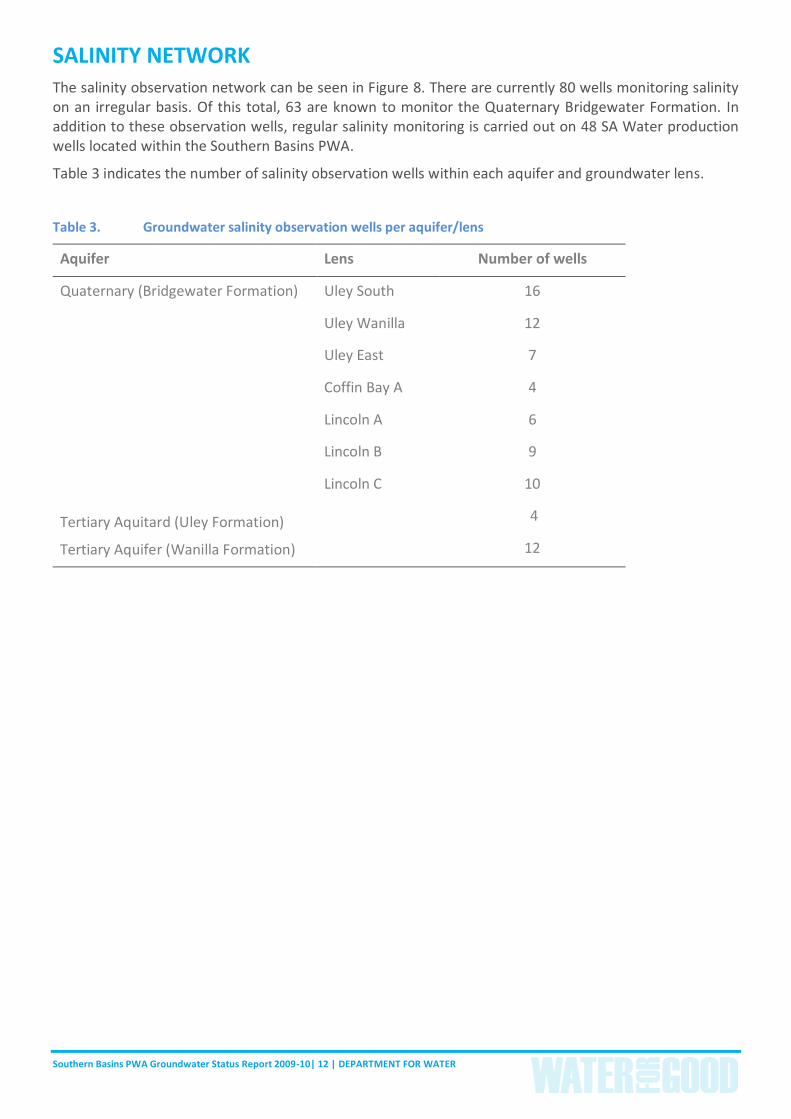
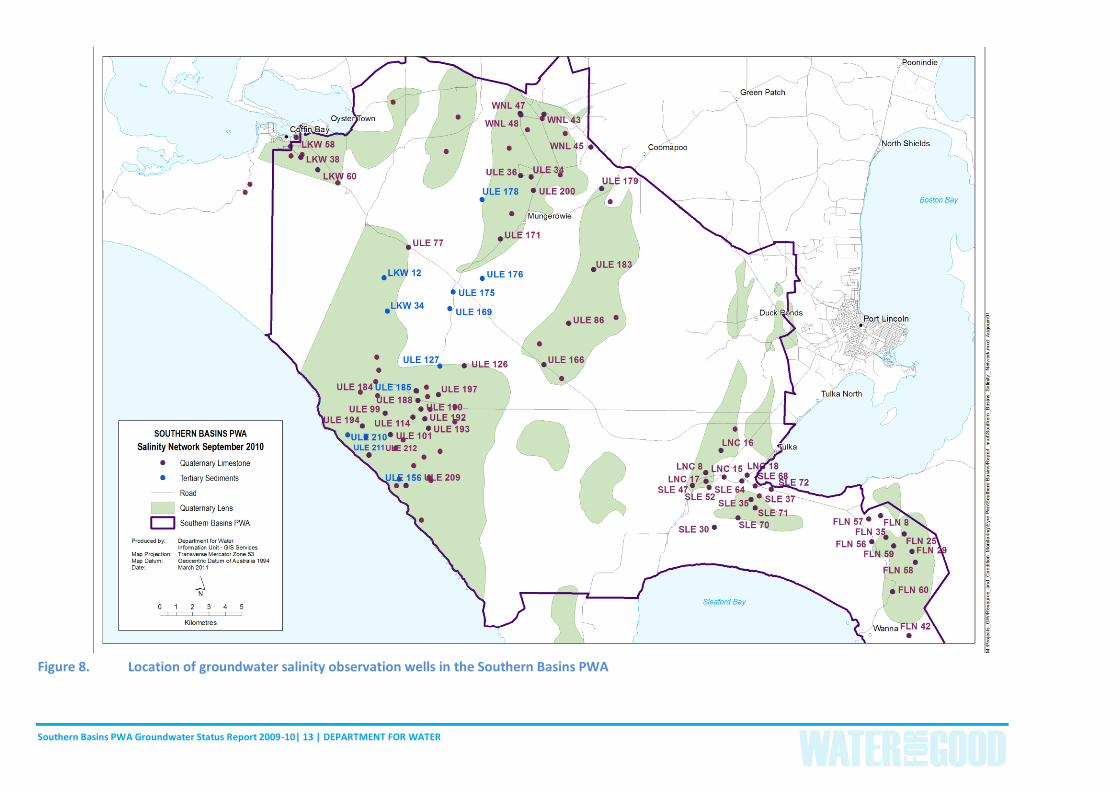
SALINITY NETWORK The salinity observation network can be seen in Figure 8. There are currently 80 wells monitoring salinity on an irregular basis. Of this total, 63 are known to monitor the Quaternary Bridgewater Formation. In addition to these observation wells, regular salinity monitoring is carried out on 48 SA Water production wells located within the Southern Basins PWA.
Table 3 indicates the number of salinity observation wells within each aquifer and groundwater lens.
Table 3. Groundwater salinity observation wells per aquifer/lens
Aquifer Lens Number of wells
Quaternary (Bridgewater Formation)
Tertiary Aquitard (Uley Formation)
Tertiary Aquifer (Wanilla Formation)
Uley South 16
Uley Wanilla 12
Uley East 7
Coffin Bay A 4
Lincoln A 6
Lincoln B 9
Lincoln C 10
4
12
Southern Basins PWA Groundwater Status Report 2009-10| 13 | DEPARTMENT FOR WATER
Figure 8. Location of groundwater salinity observation wells in the Southern Basins PWA
Southern Basins PWA Groundwater Status Report 2009-10| 14 | DEPARTMENT FOR WATER
BASIN TRENDS
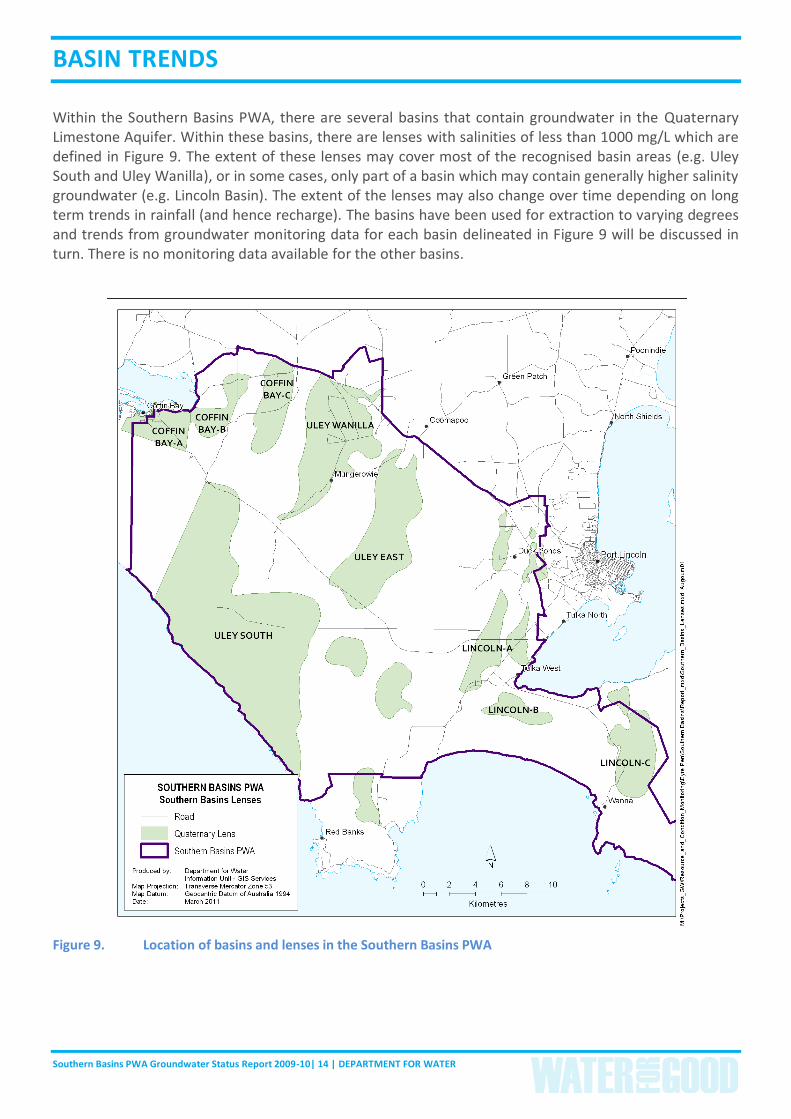
Within the Southern Basins PWA, there are several basins that contain groundwater in the Quaternary Limestone Aquifer. Within these basins, there are lenses with salinities of less than 1000 mg/L which are defined in Figure 9. The extent of these lenses may cover most of the recognised basin areas (e.g. Uley South and Uley Wanilla), or in some cases, only part of a basin which may contain generally higher salinity groundwater (e.g. Lincoln Basin). The extent of the lenses may also change over time depending on long term trends in rainfall (and hence recharge). The basins have been used for extraction to varying degrees and trends from groundwater monitoring data for each basin delineated in Figure 9 will be discussed in turn. There is no monitoring data available for the other basins.
Figure 9. Location of basins and lenses in the Southern Basins PWA
Southern Basins PWA Groundwater Status Report 2009-10| 15 | DEPARTMENT FOR WATER
ULEY SOUTH BASIN
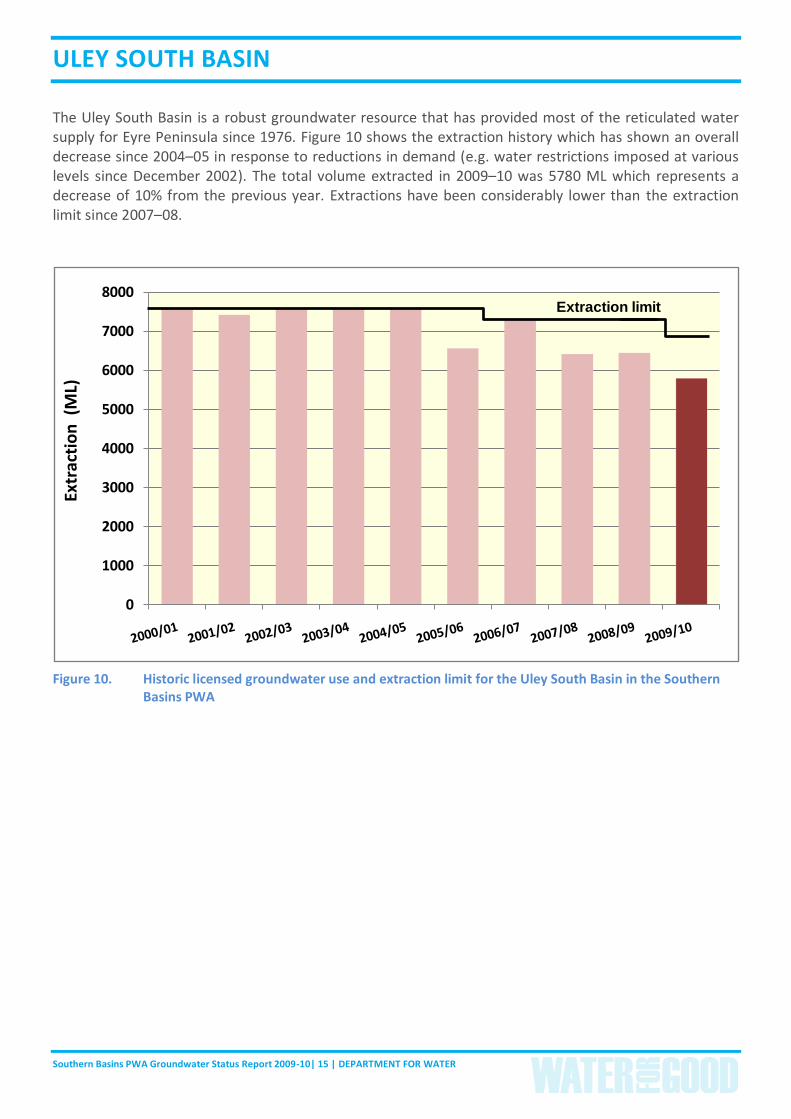
The Uley South Basin is a robust groundwater resource that has provided most of the reticulated water supply for Eyre Peninsula since 1976. Figure 10 shows the extraction history which has shown an overall decrease since 2004–05 in response to reductions in demand (e.g. water restrictions imposed at various levels since December 2002). The total volume extracted in 2009–10 was 5780 ML which represents a decrease of 10% from the previous year. Extractions have been considerably lower than the extraction limit since 2007–08.
Figure 10. Historic licensed groundwater use and extraction limit for the Uley South Basin in the Southern Basins PWA
0
1000
2000
3000
4000
5000
6000
7000
8000
Extr
acti
on
(M
L)
Extraction limit
Southern Basins PWA Groundwater Status Report 2009-10| 16 | DEPARTMENT FOR WATER
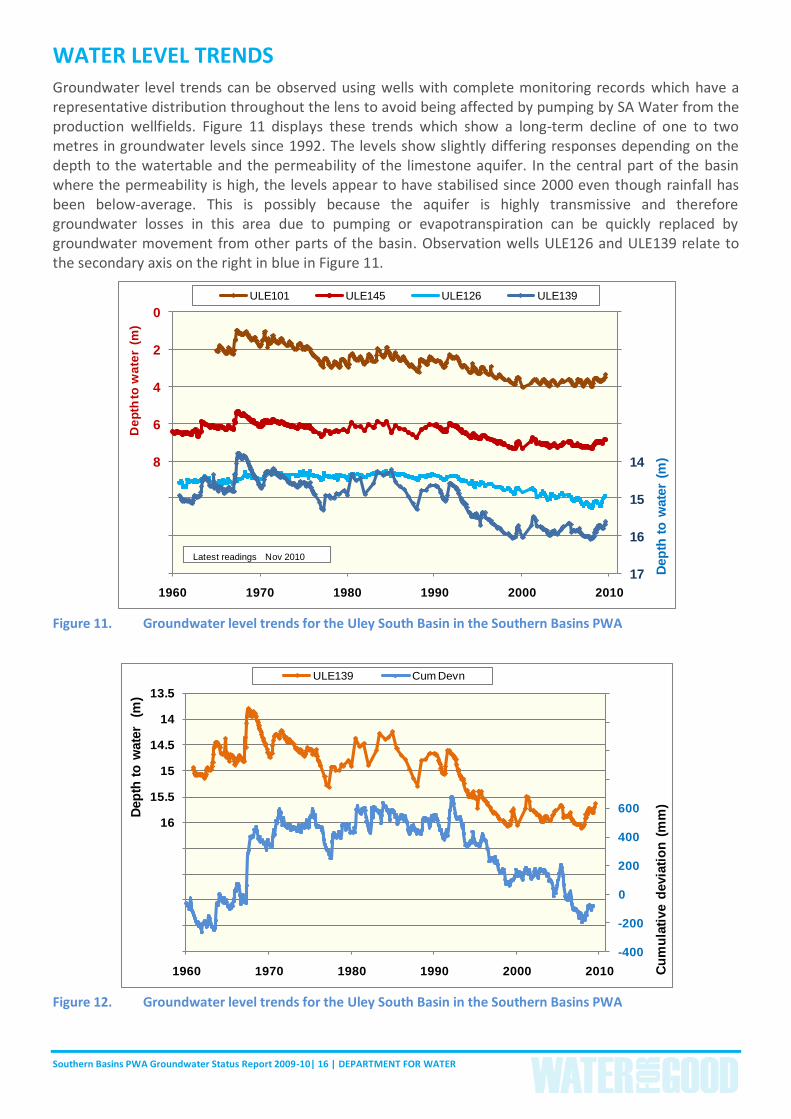
WATER LEVEL TRENDS Groundwater level trends can be observed using wells with complete monitoring records which have a representative distribution throughout the lens to avoid being affected by pumping by SA Water from the production wellfields. Figure 11 displays these trends which show a long-term decline of one to two metres in groundwater levels since 1992. The levels show slightly differing responses depending on the depth to the watertable and the permeability of the limestone aquifer. In the central part of the basin where the permeability is high, the levels appear to have stabilised since 2000 even though rainfall has been below-average. This is possibly because the aquifer is highly transmissive and therefore groundwater losses in this area due to pumping or evapotranspiration can be quickly replaced by groundwater movement from other parts of the basin. Observation wells ULE126 and ULE139 relate to the secondary axis on the right in blue in Figure 11.
Figure 11. Groundwater level trends for the Uley South Basin in the Southern Basins PWA
Figure 12. Groundwater level trends for the Uley South Basin in the Southern Basins PWA
10
11
12
13
14
15
16
17
0
2
4
6
8
10
12
14
1960 1970 1980 1990 2000 2010
Dep
th t
o w
ate
r (m
)
De
pth
to
wa
ter
(m
)
ULE101 ULE145 ULE126 ULE139
Latest readings Nov 2010 Latest readings Nov 2010 Latest readings Nov 2010 Latest readings Nov 2010 Latest readings Nov 2010 Latest readings Nov 2010
-400
-200
0
200
400
600
800
1000
1200
140013.5
14
14.5
15
15.5
16
16.5
17
17.5
18
18.5
1960 1970 1980 1990 2000 2010 Cu
mu
lati
ve d
evia
tio
n (
mm
)
Dep
th t
o w
ate
r (
m)
ULE139 Cum Devn
Southern Basins PWA Groundwater Status Report 2009-10| 17 | DEPARTMENT FOR WATER
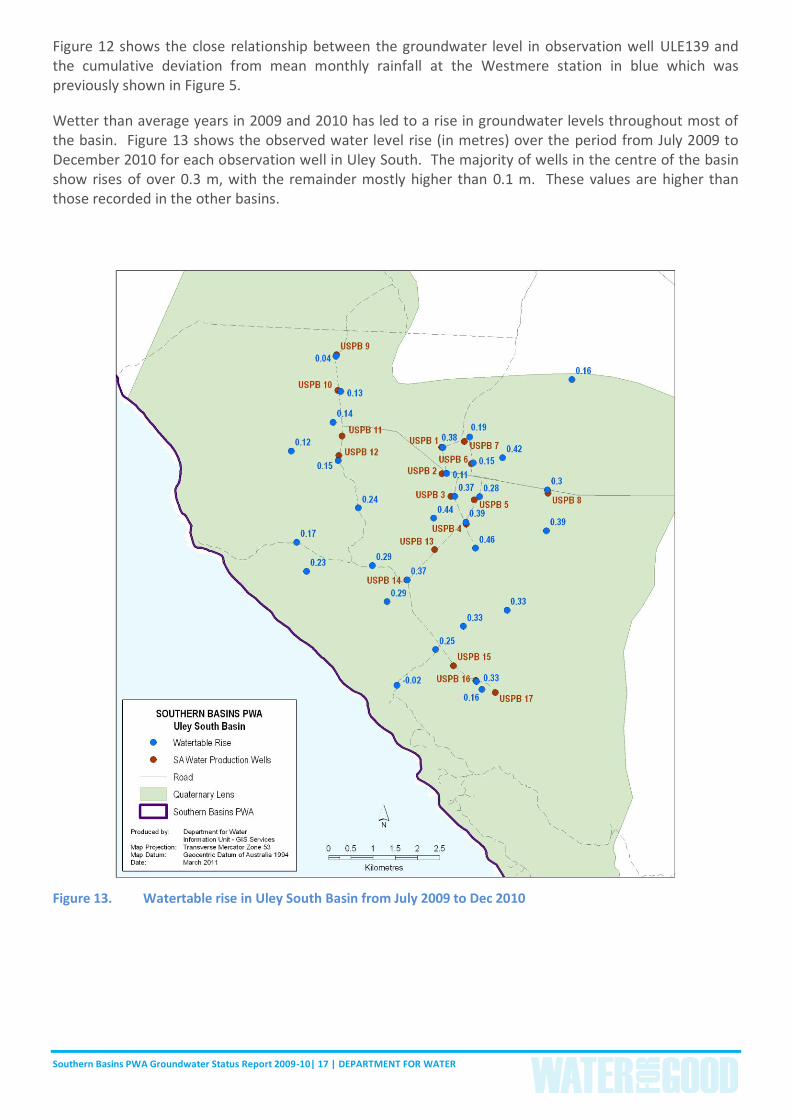
Figure 12 shows the close relationship between the groundwater level in observation well ULE139 and the cumulative deviation from mean monthly rainfall at the Westmere station in blue which was previously shown in Figure 5.
Wetter than average years in 2009 and 2010 has led to a rise in groundwater levels throughout most of the basin. Figure 13 shows the observed water level rise (in metres) over the period from July 2009 to December 2010 for each observation well in Uley South. The majority of wells in the centre of the basin show rises of over 0.3 m, with the remainder mostly higher than 0.1 m. These values are higher than those recorded in the other basins.
Figure 13. Watertable rise in Uley South Basin from July 2009 to Dec 2010
Southern Basins PWA Groundwater Status Report 2009-10| 18 | DEPARTMENT FOR WATER
SALINITY TRENDS
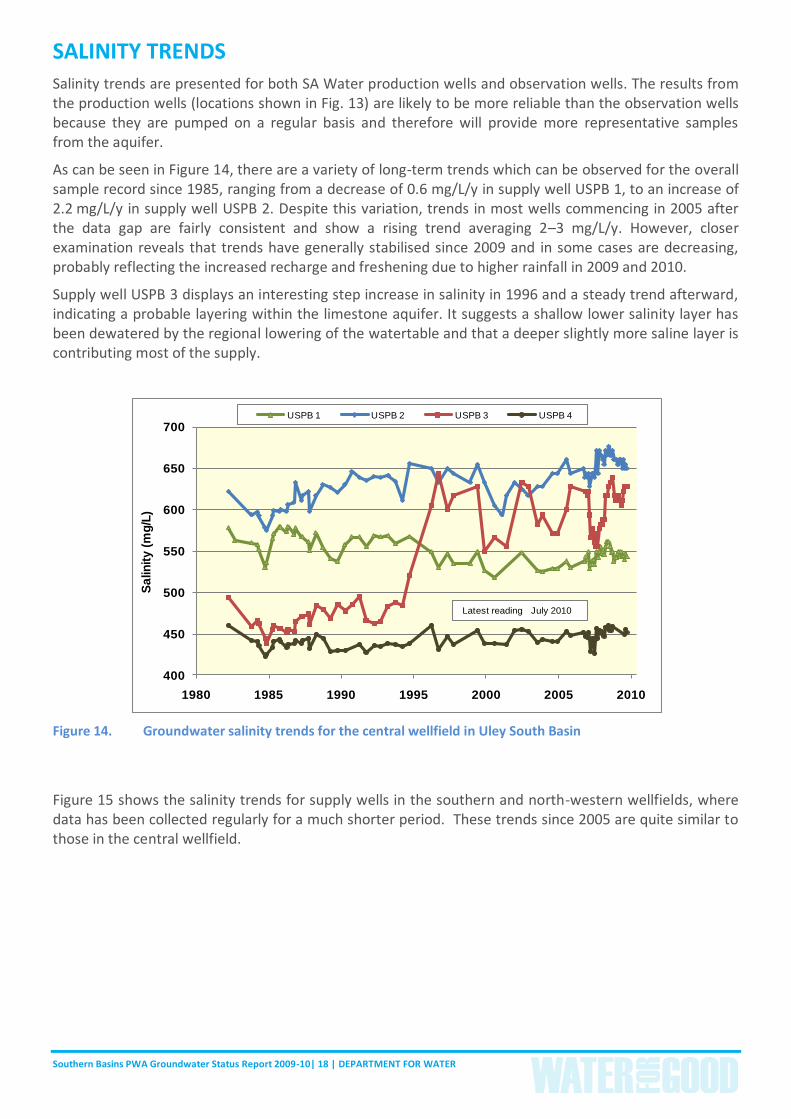
Salinity trends are presented for both SA Water production wells and observation wells. The results from the production wells (locations shown in Fig. 13) are likely to be more reliable than the observation wells because they are pumped on a regular basis and therefore will provide more representative samples from the aquifer.
As can be seen in Figure 14, there are a variety of long-term trends which can be observed for the overall sample record since 1985, ranging from a decrease of 0.6 mg/L/y in supply well USPB 1, to an increase of 2.2 mg/L/y in supply well USPB 2. Despite this variation, trends in most wells commencing in 2005 after the data gap are fairly consistent and show a rising trend averaging 2–3 mg/L/y. However, closer examination reveals that trends have generally stabilised since 2009 and in some cases are decreasing, probably reflecting the increased recharge and freshening due to higher rainfall in 2009 and 2010.
Supply well USPB 3 displays an interesting step increase in salinity in 1996 and a steady trend afterward, indicating a probable layering within the limestone aquifer. It suggests a shallow lower salinity layer has been dewatered by the regional lowering of the watertable and that a deeper slightly more saline layer is contributing most of the supply.
Figure 14. Groundwater salinity trends for the central wellfield in Uley South Basin
Figure 15 shows the salinity trends for supply wells in the southern and north-western wellfields, where data has been collected regularly for a much shorter period. These trends since 2005 are quite similar to those in the central wellfield.
400
450
500
550
600
650
700
1980 1985 1990 1995 2000 2005 2010
Sa
lin
ity (
mg
/L)
USPB 1 USPB 2 USPB 3 USPB 4
Latest reading July 2010
Southern Basins PWA Groundwater Status Report 2009-10| 19 | DEPARTMENT FOR WATER
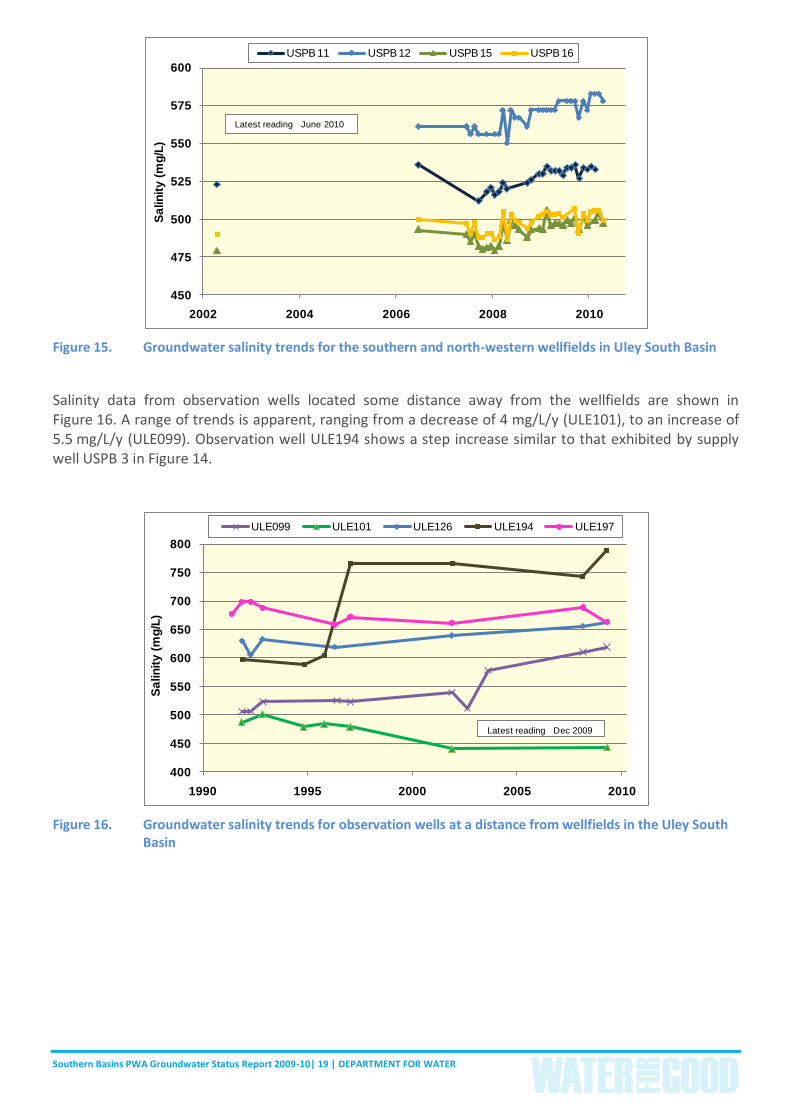
Figure 15. Groundwater salinity trends for the southern and north-western wellfields in Uley South Basin
Salinity data from observation wells located some distance away from the wellfields are shown in Figure 16. A range of trends is apparent, ranging from a decrease of 4 mg/L/y (ULE101), to an increase of 5.5 mg/L/y (ULE099). Observation well ULE194 shows a step increase similar to that exhibited by supply well USPB 3 in Figure 14.
Figure 16. Groundwater salinity trends for observation wells at a distance from wellfields in the Uley South Basin
450
475
500
525
550
575
600
2002 2004 2006 2008 2010
Sa
lin
ity (
mg
/L)
USPB 11 USPB 12 USPB 15 USPB 16
Latest reading June 2010
400
450
500
550
600
650
700
750
800
1990 1995 2000 2005 2010
Sa
lin
ity (
mg
/L)
ULE099 ULE101 ULE126 ULE194 ULE197
Latest reading Dec 2009
Southern Basins PWA Groundwater Status Report 2009-10| 20 | DEPARTMENT FOR WATER
ULEY WANILLA BASIN
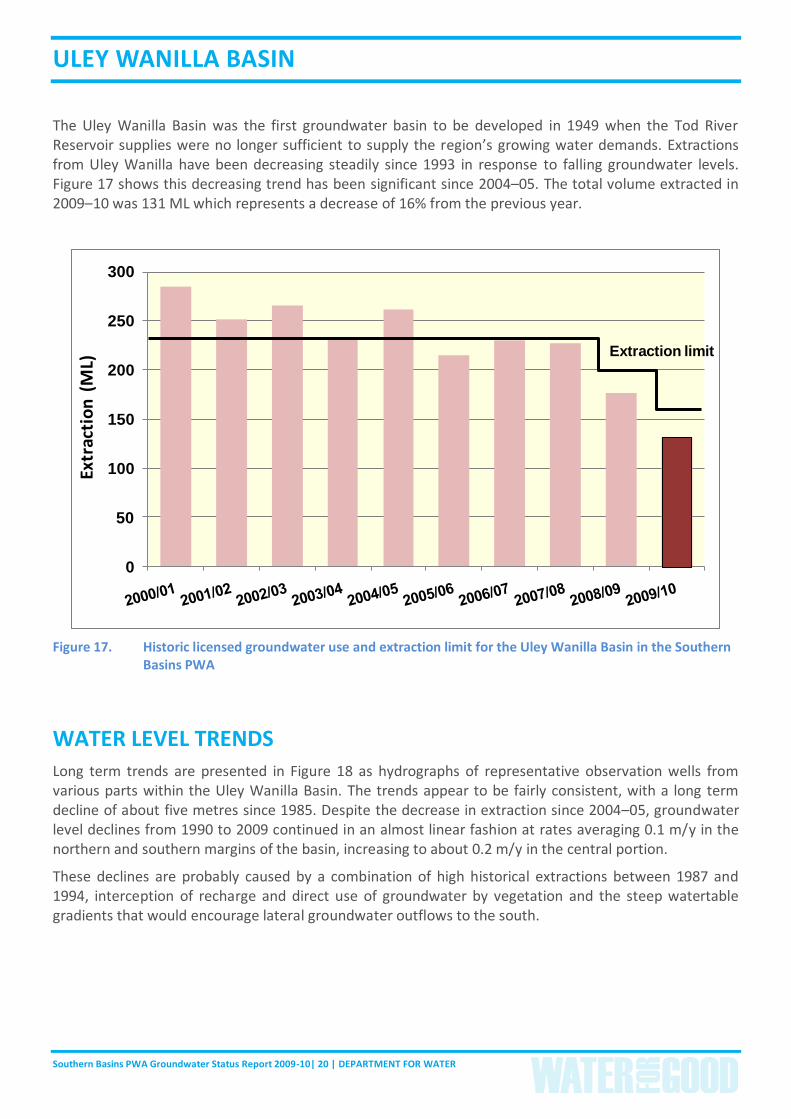
The Uley Wanilla Basin was the first groundwater basin to be developed in 1949 when the Tod River Reservoir supplies were no longer sufficient to supply the region’s growing water demands. Extractions from Uley Wanilla have been decreasing steadily since 1993 in response to falling groundwater levels. Figure 17 shows this decreasing trend has been significant since 2004–05. The total volume extracted in 2009–10 was 131 ML which represents a decrease of 16% from the previous year.
Figure 17. Historic licensed groundwater use and extraction limit for the Uley Wanilla Basin in the Southern Basins PWA
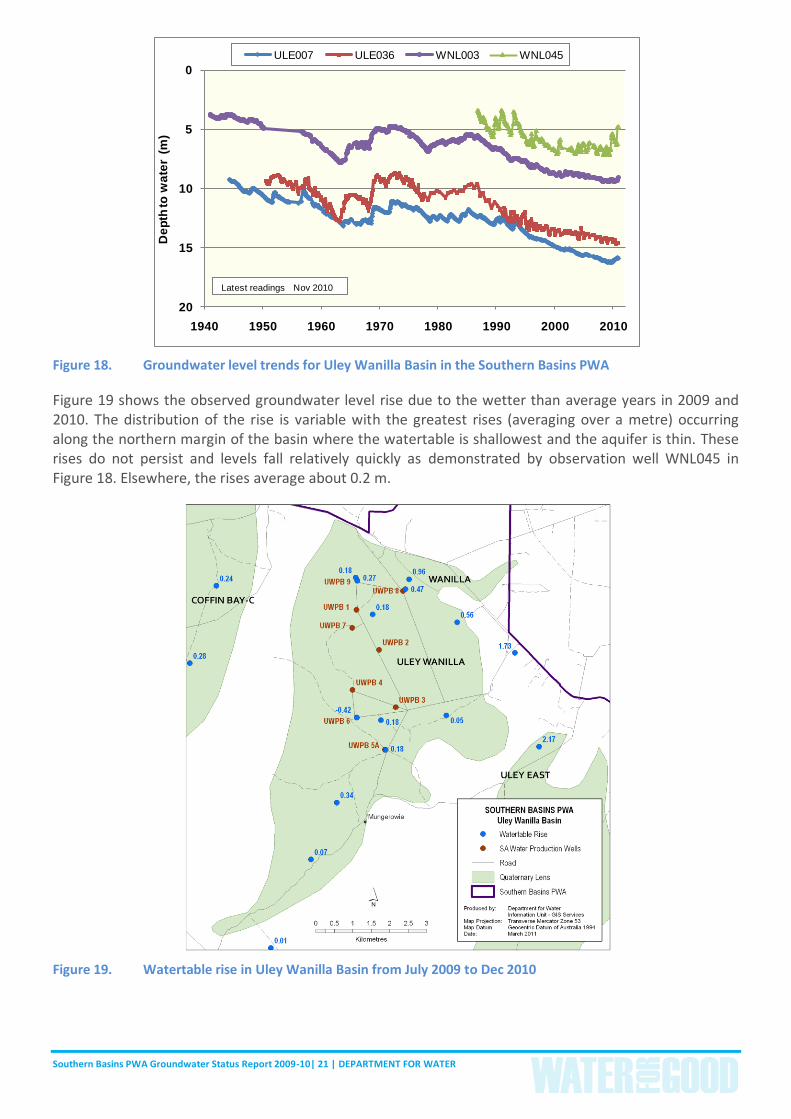
WATER LEVEL TRENDS
Long term trends are presented in Figure 18 as hydrographs of representative observation wells from various parts within the Uley Wanilla Basin. The trends appear to be fairly consistent, with a long term decline of about five metres since 1985. Despite the decrease in extraction since 2004–05, groundwater level declines from 1990 to 2009 continued in an almost linear fashion at rates averaging 0.1 m/y in the northern and southern margins of the basin, increasing to about 0.2 m/y in the central portion.
These declines are probably caused by a combination of high historical extractions between 1987 and 1994, interception of recharge and direct use of groundwater by vegetation and the steep watertable gradients that would encourage lateral groundwater outflows to the south.
0
50
100
150
200
250
300
Extr
acti
on
(M
L)
Extraction limit
Southern Basins PWA Groundwater Status Report 2009-10| 21 | DEPARTMENT FOR WATER
Figure 18. Groundwater level trends for Uley Wanilla Basin in the Southern Basins PWA
Figure 19 shows the observed groundwater level rise due to the wetter than average years in 2009 and 2010. The distribution of the rise is variable with the greatest rises (averaging over a metre) occurring along the northern margin of the basin where the watertable is shallowest and the aquifer is thin. These rises do not persist and levels fall relatively quickly as demonstrated by observation well WNL045 in Figure 18. Elsewhere, the rises average about 0.2 m.
Figure 19. Watertable rise in Uley Wanilla Basin from July 2009 to Dec 2010
0
5
10
15
20
1940 1950 1960 1970 1980 1990 2000 2010
De
pth
to
wa
ter
(m
)
ULE007 ULE036 WNL003 WNL045
Latest readings Nov 2010
Southern Basins PWA Groundwater Status Report 2009-10| 22 | DEPARTMENT FOR WATER
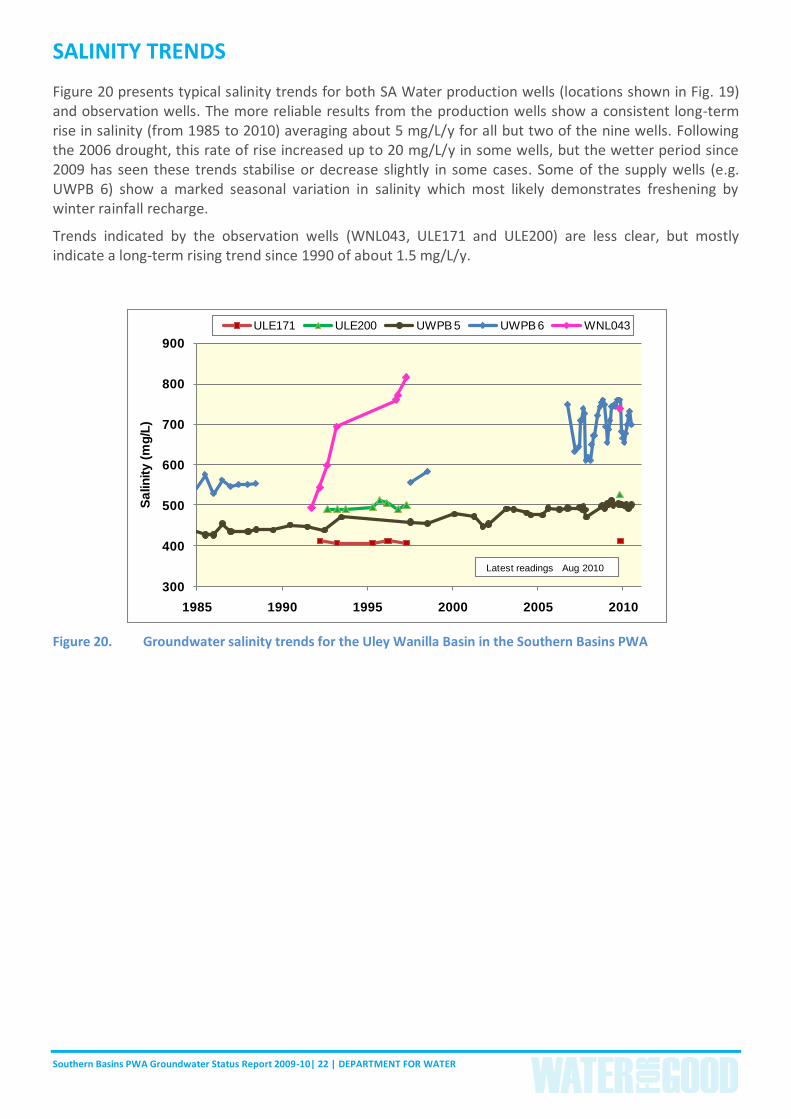
SALINITY TRENDS
Figure 20 presents typical salinity trends for both SA Water production wells (locations shown in Fig. 19) and observation wells. The more reliable results from the production wells show a consistent long-term rise in salinity (from 1985 to 2010) averaging about 5 mg/L/y for all but two of the nine wells. Following the 2006 drought, this rate of rise increased up to 20 mg/L/y in some wells, but the wetter period since 2009 has seen these trends stabilise or decrease slightly in some cases. Some of the supply wells (e.g. UWPB 6) show a marked seasonal variation in salinity which most likely demonstrates freshening by winter rainfall recharge.
Trends indicated by the observation wells (WNL043, ULE171 and ULE200) are less clear, but mostly indicate a long-term rising trend since 1990 of about 1.5 mg/L/y.
Figure 20. Groundwater salinity trends for the Uley Wanilla Basin in the Southern Basins PWA
300
400
500
600
700
800
900
1985 1990 1995 2000 2005 2010
Sa
lin
ity (
mg
/L)
ULE171 ULE200 UWPB 5 UWPB 6 WNL043
Latest readings Aug 2010
Southern Basins PWA Groundwater Status Report 2009-10| 23 | DEPARTMENT FOR WATER
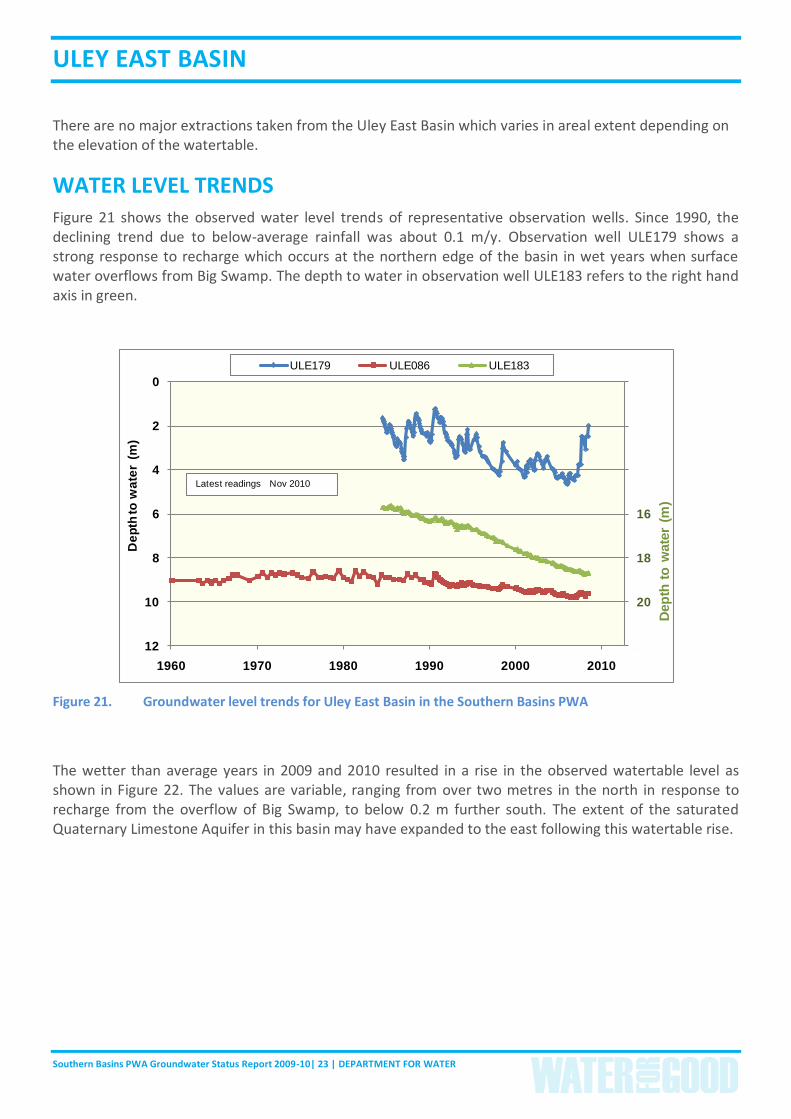
ULEY EAST BASIN
There are no major extractions taken from the Uley East Basin which varies in areal extent depending on the elevation of the watertable.
WATER LEVEL TRENDS Figure 21 shows the observed water level trends of representative observation wells. Since 1990, the declining trend due to below-average rainfall was about 0.1 m/y. Observation well ULE179 shows a strong response to recharge which occurs at the northern edge of the basin in wet years when surface water overflows from Big Swamp. The depth to water in observation well ULE183 refers to the right hand axis in green.
Figure 21. Groundwater level trends for Uley East Basin in the Southern Basins PWA
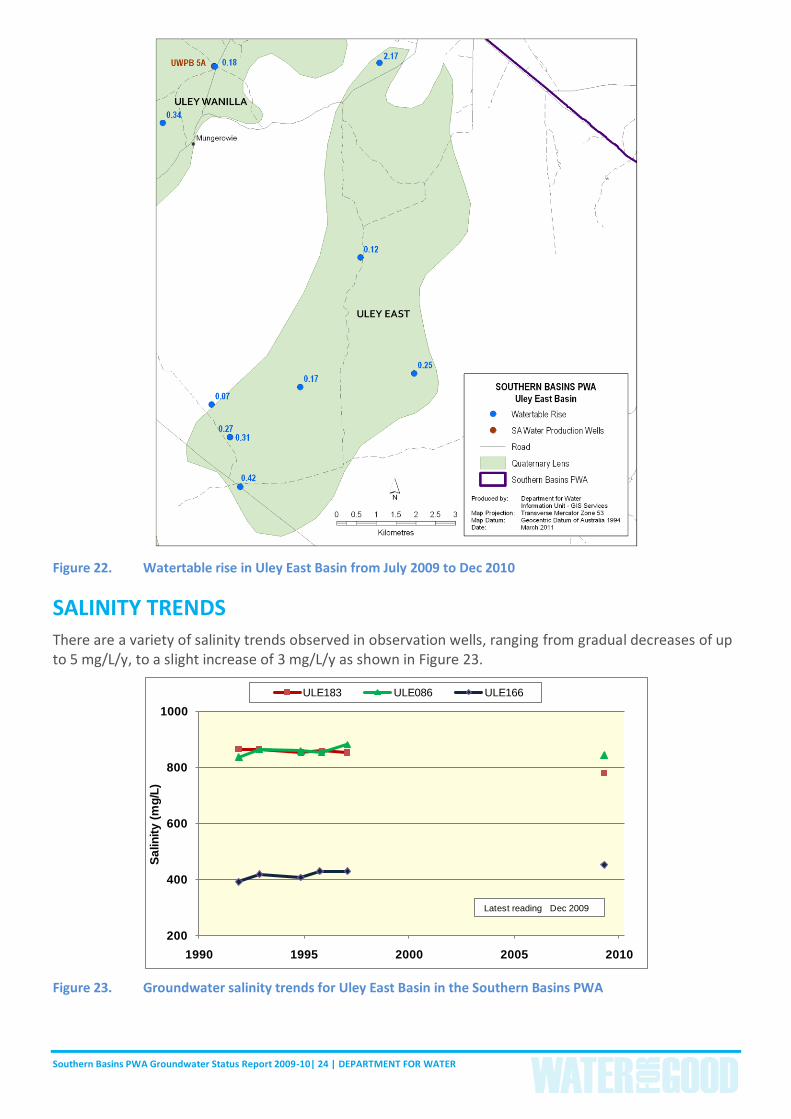
The wetter than average years in 2009 and 2010 resulted in a rise in the observed watertable level as shown in Figure 22. The values are variable, ranging from over two metres in the north in response to recharge from the overflow of Big Swamp, to below 0.2 m further south. The extent of the saturated Quaternary Limestone Aquifer in this basin may have expanded to the east following this watertable rise.
10
12
14
16
18
20
22
0
2
4
6
8
10
12
1960 1970 1980 1990 2000 2010D
ep
th t
o w
ate
r (m
)
De
pth
to
wa
ter
(m
)
ULE179 ULE086 ULE183
Latest readings Nov 2010
Southern Basins PWA Groundwater Status Report 2009-10| 24 | DEPARTMENT FOR WATER
Figure 22. Watertable rise in Uley East Basin from July 2009 to Dec 2010
SALINITY TRENDS
There are a variety of salinity trends observed in observation wells, ranging from gradual decreases of up to 5 mg/L/y, to a slight increase of 3 mg/L/y as shown in Figure 23.
Figure 23. Groundwater salinity trends for Uley East Basin in the Southern Basins PWA
200
400
600
800
1000
1990 1995 2000 2005 2010
Sa
lin
ity (
mg
/L)
ULE183 ULE086 ULE166
Latest reading Dec 2009
Southern Basins PWA Groundwater Status Report 2009-10| 25 | DEPARTMENT FOR WATER
LINCOLN BASIN
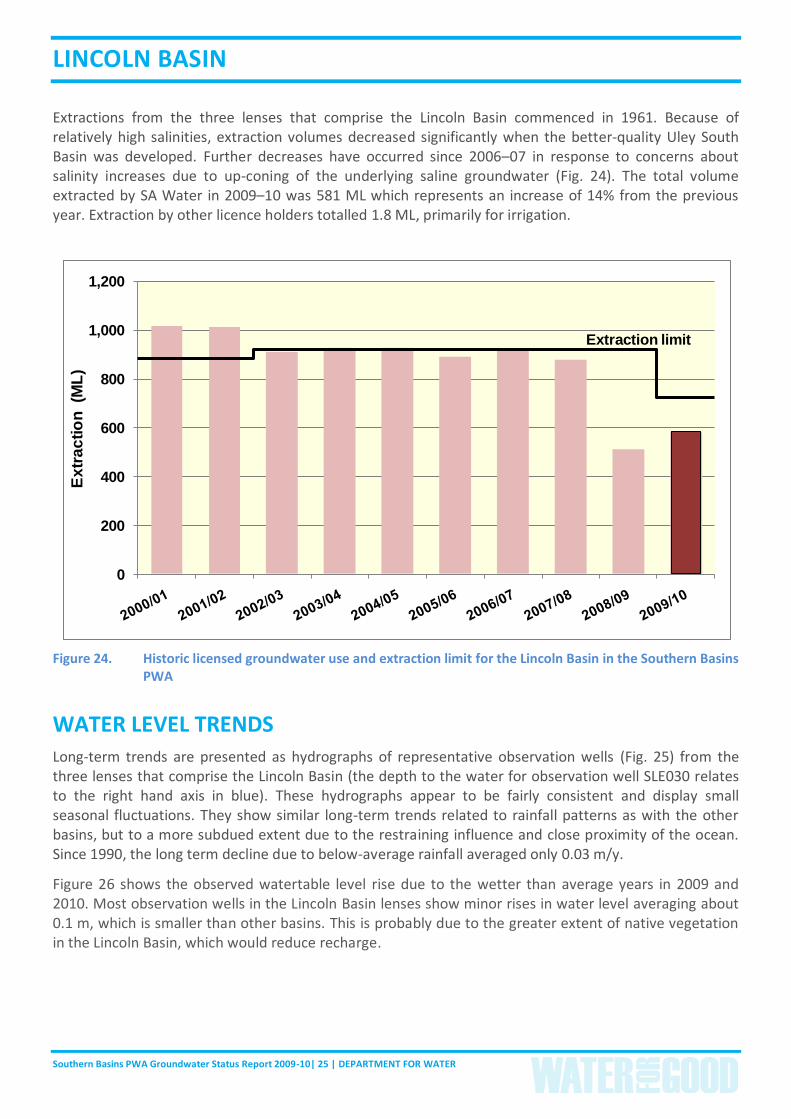
Extractions from the three lenses that comprise the Lincoln Basin commenced in 1961. Because of relatively high salinities, extraction volumes decreased significantly when the better-quality Uley South Basin was developed. Further decreases have occurred since 2006–07 in response to concerns about salinity increases due to up-coning of the underlying saline groundwater (Fig. 24). The total volume extracted by SA Water in 2009–10 was 581 ML which represents an increase of 14% from the previous year. Extraction by other licence holders totalled 1.8 ML, primarily for irrigation.
Figure 24. Historic licensed groundwater use and extraction limit for the Lincoln Basin in the Southern Basins PWA
WATER LEVEL TRENDS
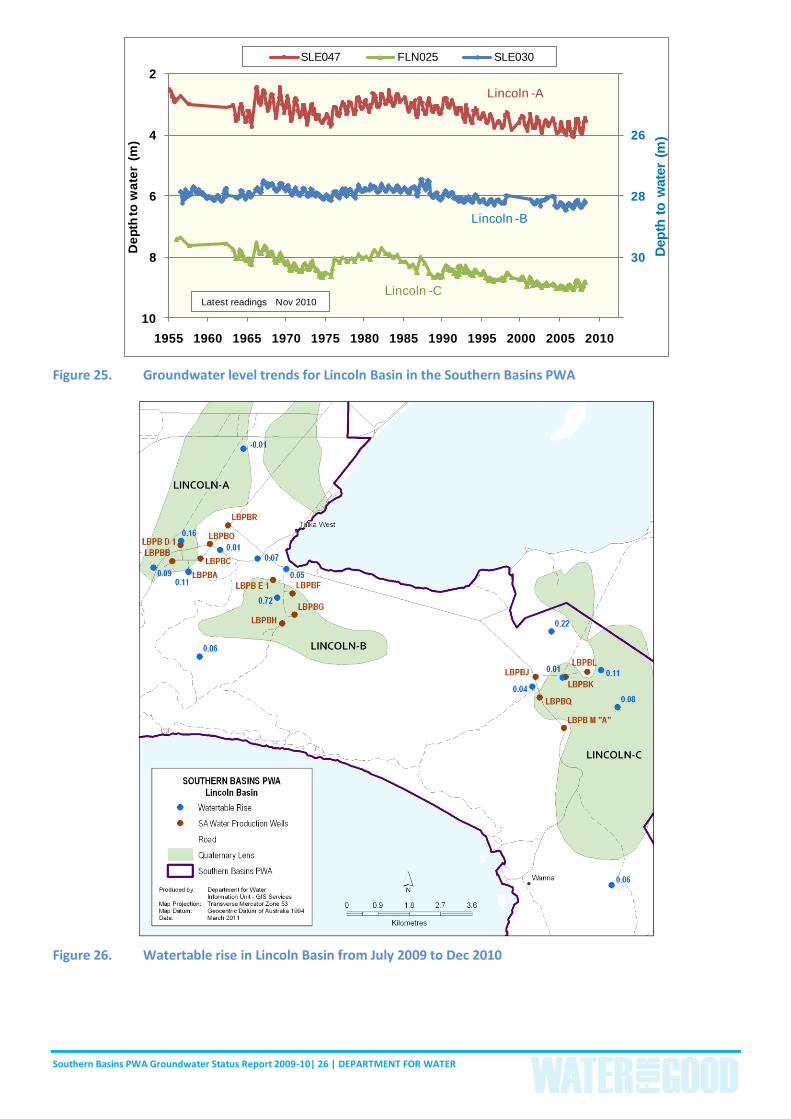
Long-term trends are presented as hydrographs of representative observation wells (Fig. 25) from the three lenses that comprise the Lincoln Basin (the depth to the water for observation well SLE030 relates to the right hand axis in blue). These hydrographs appear to be fairly consistent and display small seasonal fluctuations. They show similar long-term trends related to rainfall patterns as with the other basins, but to a more subdued extent due to the restraining influence and close proximity of the ocean. Since 1990, the long term decline due to below-average rainfall averaged only 0.03 m/y.
Figure 26 shows the observed watertable level rise due to the wetter than average years in 2009 and 2010. Most observation wells in the Lincoln Basin lenses show minor rises in water level averaging about 0.1 m, which is smaller than other basins. This is probably due to the greater extent of native vegetation in the Lincoln Basin, which would reduce recharge.
0
200
400
600
800
1,000
1,200
Ex
tra
cti
on
(M
L)
Extraction limit
Southern Basins PWA Groundwater Status Report 2009-10| 26 | DEPARTMENT FOR WATER
Figure 25. Groundwater level trends for Lincoln Basin in the Southern Basins PWA
Figure 26. Watertable rise in Lincoln Basin from July 2009 to Dec 2010
24
26
28
30
32
2
4
6
8
10
1955 1960 1965 1970 1975 1980 1985 1990 1995 2000 2005 2010
Dep
th t
o w
ate
r (m
)
De
pth
to
wa
ter
(m
)
SLE047 FLN025 SLE030
Lincoln -C
Lincoln -B
Lincoln -A
Latest readings Nov 2010
Southern Basins PWA Groundwater Status Report 2009-10| 27 | DEPARTMENT FOR WATER
SALINITY TRENDS
Salinity trends will be discussed for each of the three distinct lenses within the Lincoln Basin.
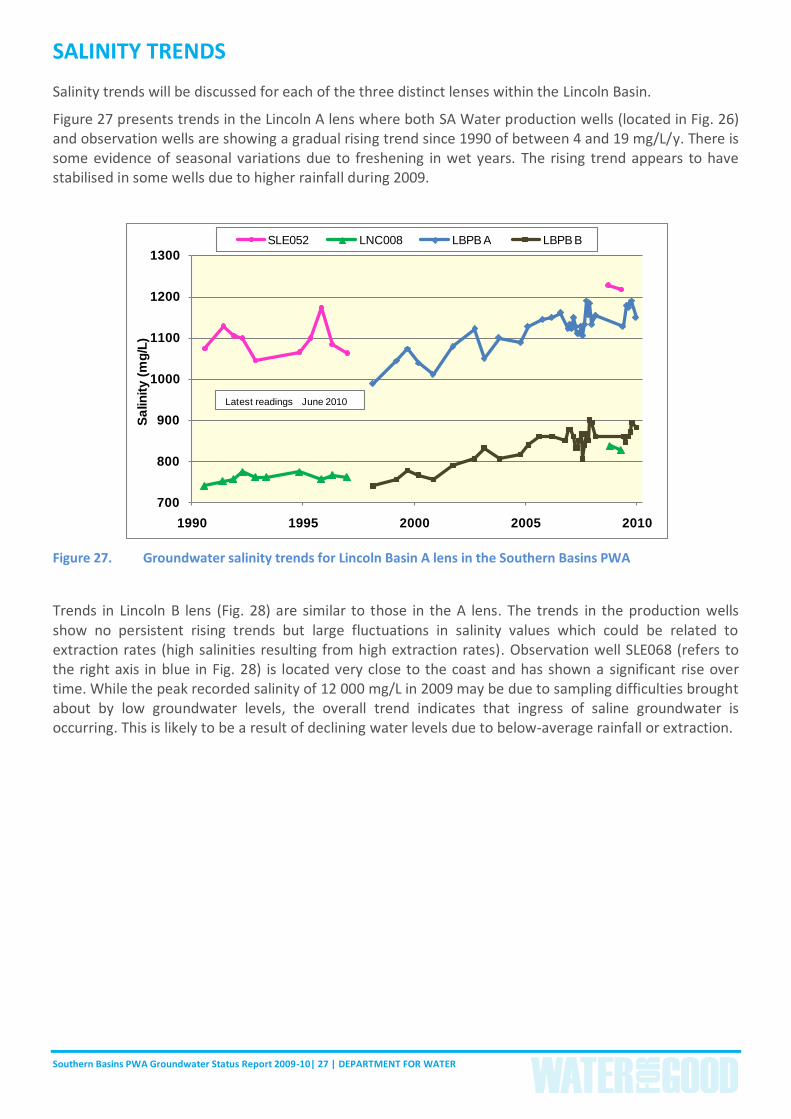
Figure 27 presents trends in the Lincoln A lens where both SA Water production wells (located in Fig. 26) and observation wells are showing a gradual rising trend since 1990 of between 4 and 19 mg/L/y. There is some evidence of seasonal variations due to freshening in wet years. The rising trend appears to have stabilised in some wells due to higher rainfall during 2009.
Figure 27. Groundwater salinity trends for Lincoln Basin A lens in the Southern Basins PWA
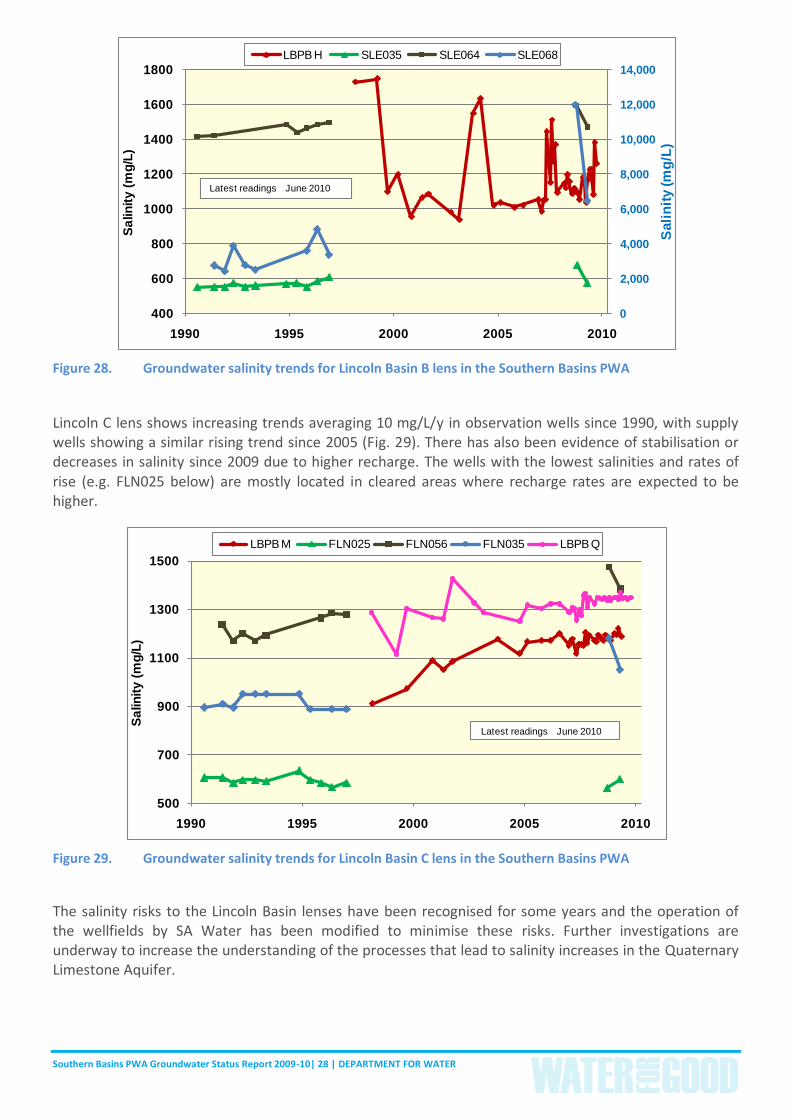
Trends in Lincoln B lens (Fig. 28) are similar to those in the A lens. The trends in the production wells show no persistent rising trends but large fluctuations in salinity values which could be related to extraction rates (high salinities resulting from high extraction rates). Observation well SLE068 (refers to the right axis in blue in Fig. 28) is located very close to the coast and has shown a significant rise over time. While the peak recorded salinity of 12 000 mg/L in 2009 may be due to sampling difficulties brought about by low groundwater levels, the overall trend indicates that ingress of saline groundwater is occurring. This is likely to be a result of declining water levels due to below-average rainfall or extraction.
700
800
900
1000
1100
1200
1300
1990 1995 2000 2005 2010
Sa
lin
ity (
mg
/L)
SLE052 LNC008 LBPB A LBPB B
Latest readings June 2010
Southern Basins PWA Groundwater Status Report 2009-10| 28 | DEPARTMENT FOR WATER
Figure 28. Groundwater salinity trends for Lincoln Basin B lens in the Southern Basins PWA
Lincoln C lens shows increasing trends averaging 10 mg/L/y in observation wells since 1990, with supply wells showing a similar rising trend since 2005 (Fig. 29). There has also been evidence of stabilisation or decreases in salinity since 2009 due to higher recharge. The wells with the lowest salinities and rates of rise (e.g. FLN025 below) are mostly located in cleared areas where recharge rates are expected to be higher.
Figure 29. Groundwater salinity trends for Lincoln Basin C lens in the Southern Basins PWA
The salinity risks to the Lincoln Basin lenses have been recognised for some years and the operation of the wellfields by SA Water has been modified to minimise these risks. Further investigations are underway to increase the understanding of the processes that lead to salinity increases in the Quaternary Limestone Aquifer.
0
2,000
4,000
6,000
8,000
10,000
12,000
14,000
400
600
800
1000
1200
1400
1600
1800
1990 1995 2000 2005 2010
Sali
nit
y (m
g/L
)
Sa
lin
ity (
mg
/L)
LBPB H SLE035 SLE064 SLE068
Latest readings June 2010
500
700
900
1100
1300
1500
1990 1995 2000 2005 2010
Sa
lin
ity (
mg
/L)
LBPB M FLN025 FLN056 FLN035 LBPB Q
Latest readings June 2010
Southern Basins PWA Groundwater Status Report 2009-10| 29 | DEPARTMENT FOR WATER
COFFIN BAY BASINS
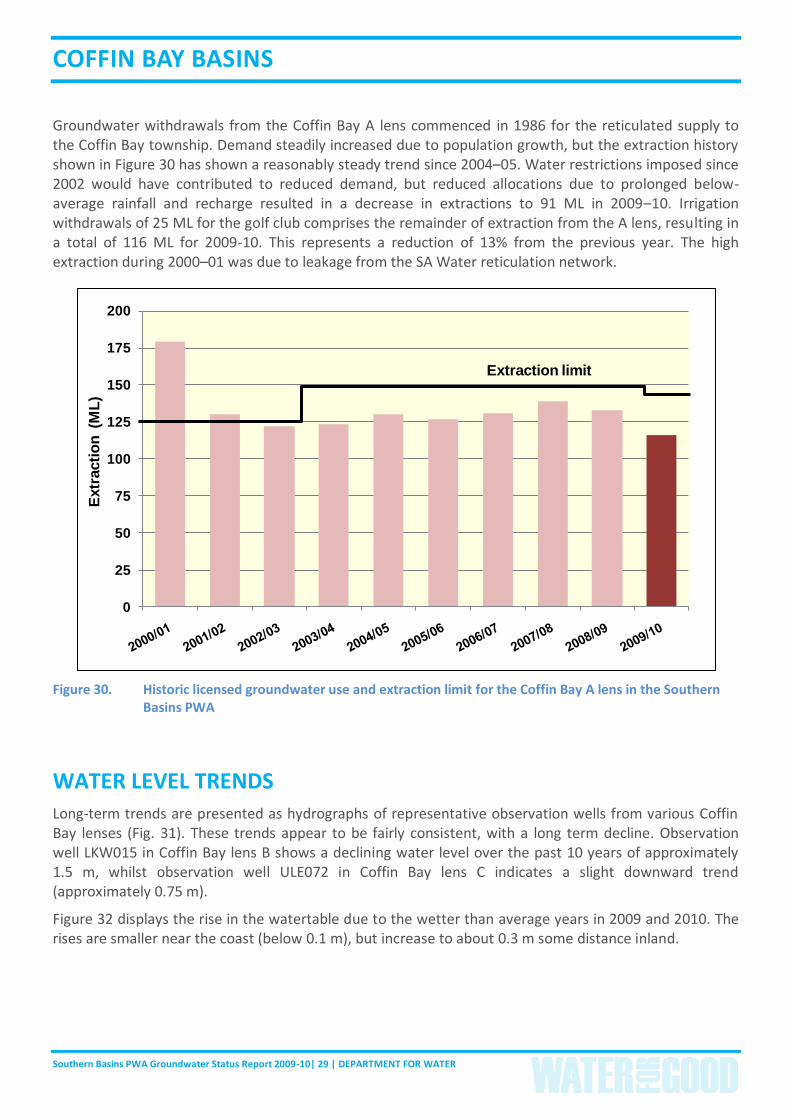
Groundwater withdrawals from the Coffin Bay A lens commenced in 1986 for the reticulated supply to the Coffin Bay township. Demand steadily increased due to population growth, but the extraction history shown in Figure 30 has shown a reasonably steady trend since 2004–05. Water restrictions imposed since 2002 would have contributed to reduced demand, but reduced allocations due to prolonged below-average rainfall and recharge resulted in a decrease in extractions to 91 ML in 2009–10. Irrigation withdrawals of 25 ML for the golf club comprises the remainder of extraction from the A lens, resulting in a total of 116 ML for 2009-10. This represents a reduction of 13% from the previous year. The high extraction during 2000–01 was due to leakage from the SA Water reticulation network.
Figure 30. Historic licensed groundwater use and extraction limit for the Coffin Bay A lens in the Southern Basins PWA
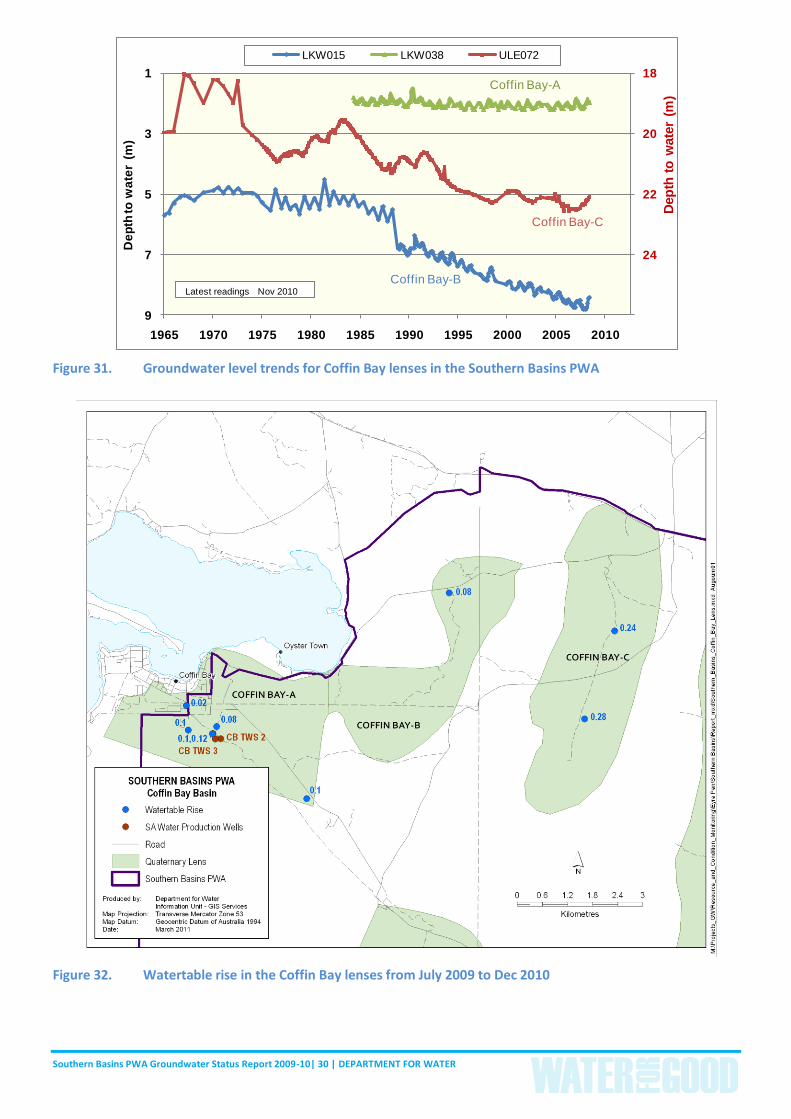
WATER LEVEL TRENDS
Long-term trends are presented as hydrographs of representative observation wells from various Coffin Bay lenses (Fig. 31). These trends appear to be fairly consistent, with a long term decline. Observation well LKW015 in Coffin Bay lens B shows a declining water level over the past 10 years of approximately 1.5 m, whilst observation well ULE072 in Coffin Bay lens C indicates a slight downward trend (approximately 0.75 m).
Figure 32 displays the rise in the watertable due to the wetter than average years in 2009 and 2010. The rises are smaller near the coast (below 0.1 m), but increase to about 0.3 m some distance inland.
0
25
50
75
100
125
150
175
200
Extr
acti
on
(M
L)
Extraction limit
Southern Basins PWA Groundwater Status Report 2009-10| 30 | DEPARTMENT FOR WATER
Figure 31. Groundwater level trends for Coffin Bay lenses in the Southern Basins PWA
Figure 32. Watertable rise in the Coffin Bay lenses from July 2009 to Dec 2010
18
20
22
24
26
1
3
5
7
9
1965 1970 1975 1980 1985 1990 1995 2000 2005 2010
Dep
th t
o w
ate
r (m
)
De
pth
to
wa
ter
(m
)
LKW015 LKW038 ULE072
Coffin Bay-A
Coffin Bay-B
Coffin Bay-C
Latest readings Nov 2010
Southern Basins PWA Groundwater Status Report 2009-10| 31 | DEPARTMENT FOR WATER
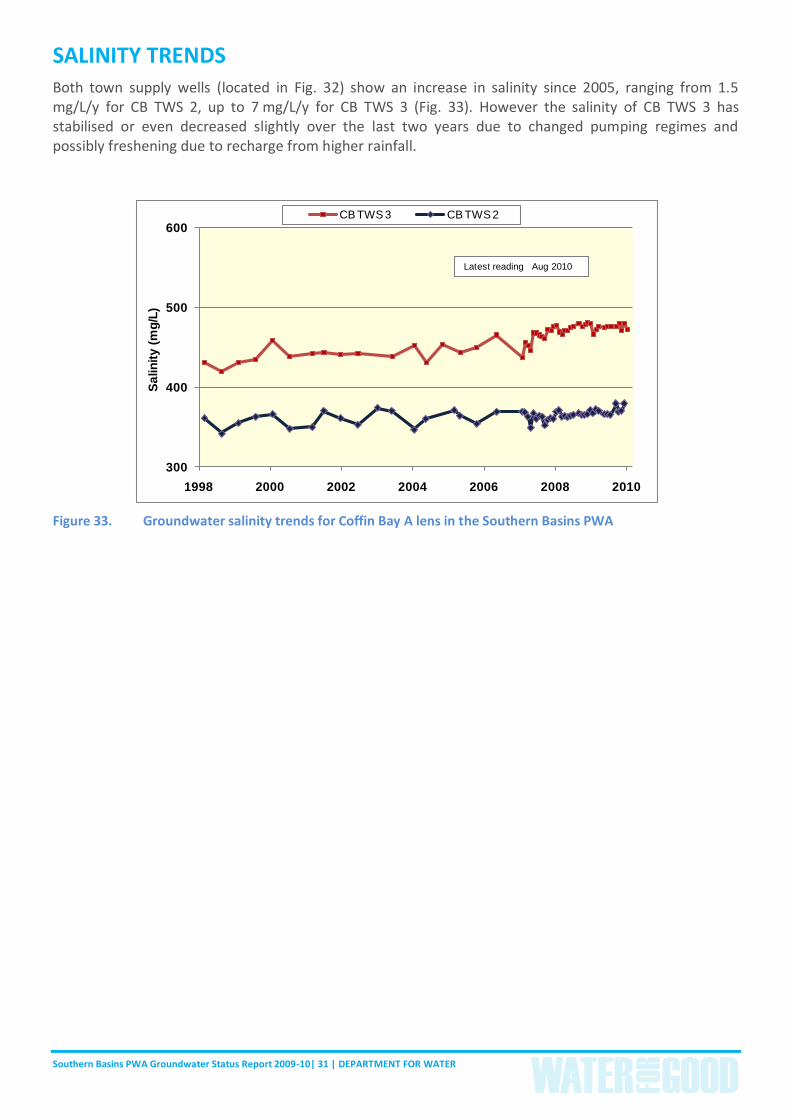
SALINITY TRENDS Both town supply wells (located in Fig. 32) show an increase in salinity since 2005, ranging from 1.5 mg/L/y for CB TWS 2, up to 7 mg/L/y for CB TWS 3 (Fig. 33). However the salinity of CB TWS 3 has stabilised or even decreased slightly over the last two years due to changed pumping regimes and possibly freshening due to recharge from higher rainfall.
Figure 33. Groundwater salinity trends for Coffin Bay A lens in the Southern Basins PWA
300
400
500
600
1998 2000 2002 2004 2006 2008 2010
Sa
lin
ity (
mg
/L)
CB TWS 3 CB TWS 2
Latest reading Aug 2010
Southern Basins PWA Groundwater Status Report 2009-10| 32 | DEPARTMENT FOR WATER
TERTIARY SAND AQUIFER
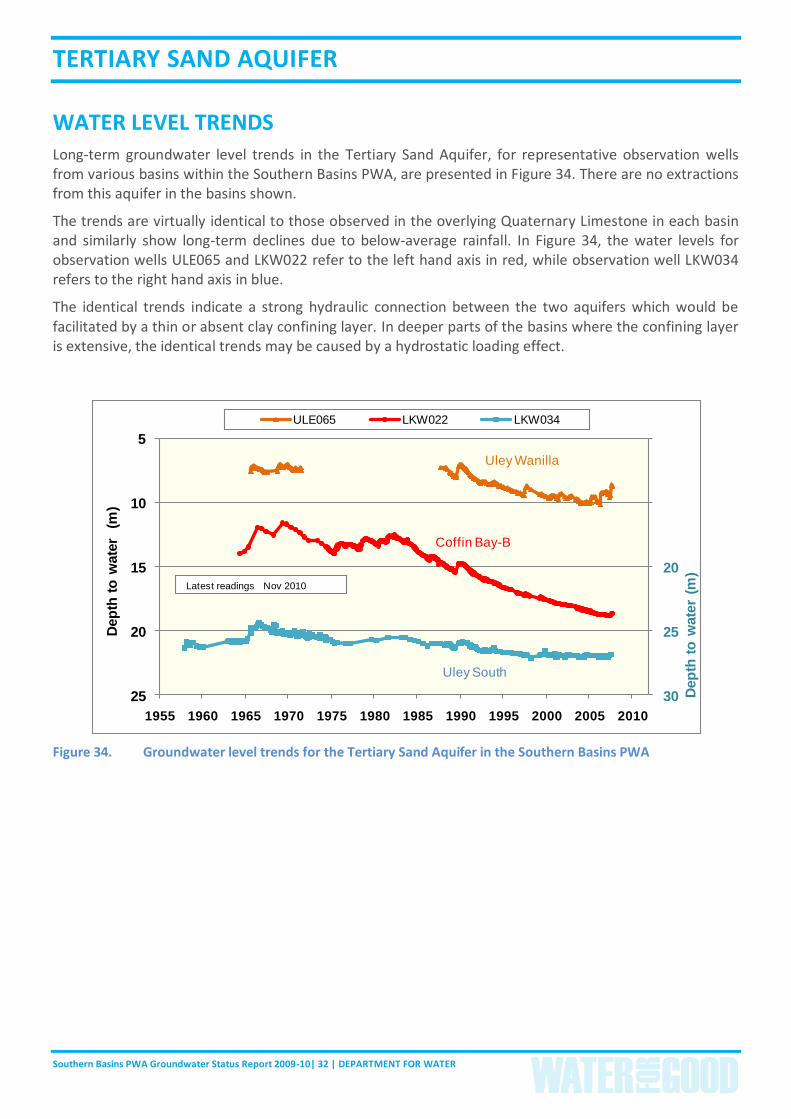
WATER LEVEL TRENDS Long-term groundwater level trends in the Tertiary Sand Aquifer, for representative observation wells from various basins within the Southern Basins PWA, are presented in Figure 34. There are no extractions from this aquifer in the basins shown.
The trends are virtually identical to those observed in the overlying Quaternary Limestone in each basin and similarly show long-term declines due to below-average rainfall. In Figure 34, the water levels for observation wells ULE065 and LKW022 refer to the left hand axis in red, while observation well LKW034 refers to the right hand axis in blue.
The identical trends indicate a strong hydraulic connection between the two aquifers which would be facilitated by a thin or absent clay confining layer. In deeper parts of the basins where the confining layer is extensive, the identical trends may be caused by a hydrostatic loading effect.
Figure 34. Groundwater level trends for the Tertiary Sand Aquifer in the Southern Basins PWA
10
15
20
25
30
5
10
15
20
25
1955 1960 1965 1970 1975 1980 1985 1990 1995 2000 2005 2010
Dep
th t
o w
ate
r (m
)
Dep
th t
o w
ate
r (
m)
ULE065 LKW022 LKW034
Coffin Bay-B
Uley Wanilla
Uley South
Latest readings Nov 2010
Southern Basins PWA Groundwater Status Report 2009-10| 33 | DEPARTMENT FOR WATER
SALINITY TRENDS
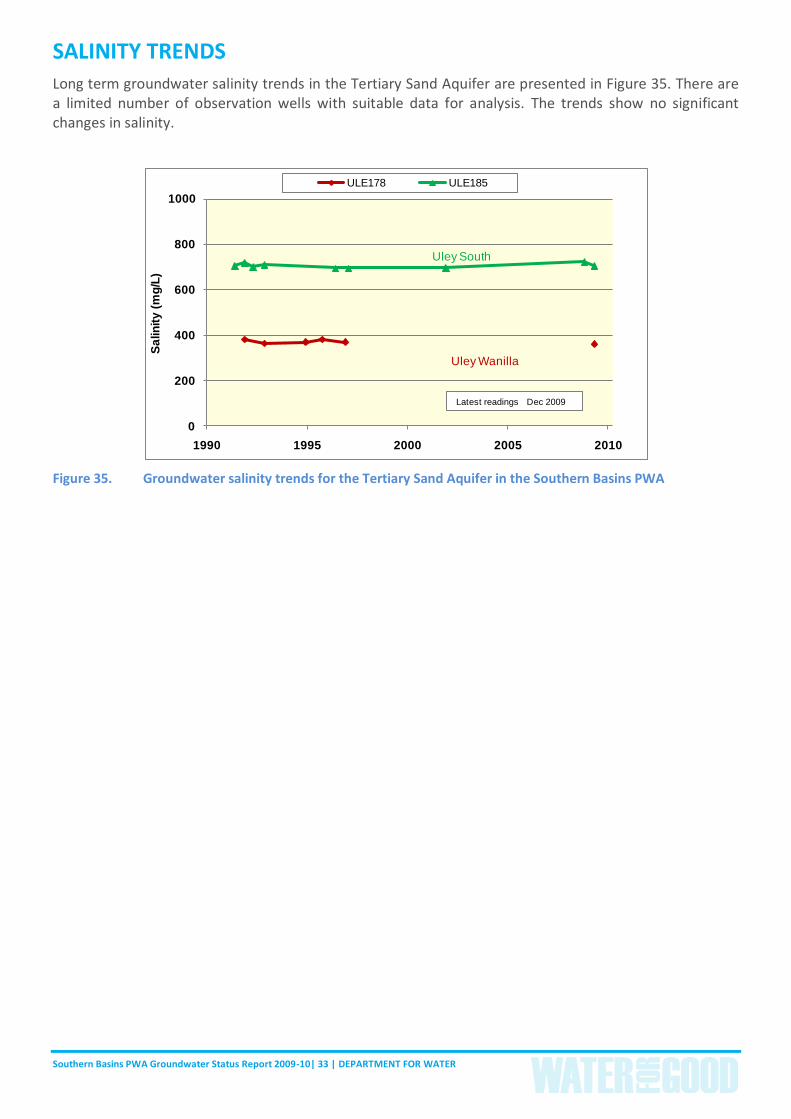
Long term groundwater salinity trends in the Tertiary Sand Aquifer are presented in Figure 35. There are a limited number of observation wells with suitable data for analysis. The trends show no significant changes in salinity.
Figure 35. Groundwater salinity trends for the Tertiary Sand Aquifer in the Southern Basins PWA
0
200
400
600
800
1000
1990 1995 2000 2005 2010
Sa
lin
ity (
mg
/L)
ULE178 ULE185
Latest readings Dec 2009
Uley South
Uley Wanilla