Embed Size (px)
Citation preview
SOUTHEAST Region
Regional Composite
REGIONALDATA REPORT
JAN – DEC2014 vs. 2013
2
Methodology
• IRI gathers chain-wide sales across all RMAs (Retail Market Areas)– Starting in 2013, the IRI Regions reflect an expanded retail data set which
includes sales and volume from Walmart, Sam’s Club, Target and BJ’s, in addition to traditional grocery retailers
• Average Selling Price (ASP) is not Advertised Retail Price– Average selling price is the average of all prices including coupons, promotional
pricing, club/loyalty card deals that are given at the register at the time of purchase
• Categories: Total Avocados, Produce = Total Produce including Avocados
• Timeframe: YTD Q4 (January – December) 2014
• Retail data provided by IRI / FreshLook Marketing
• Important Note: IRI / FreshLook Marketing periodically restates retail data, therefore this review cannot be compared or used in conjunction with prior reviews
3
Southeast Region: Highlights - YTD Q4
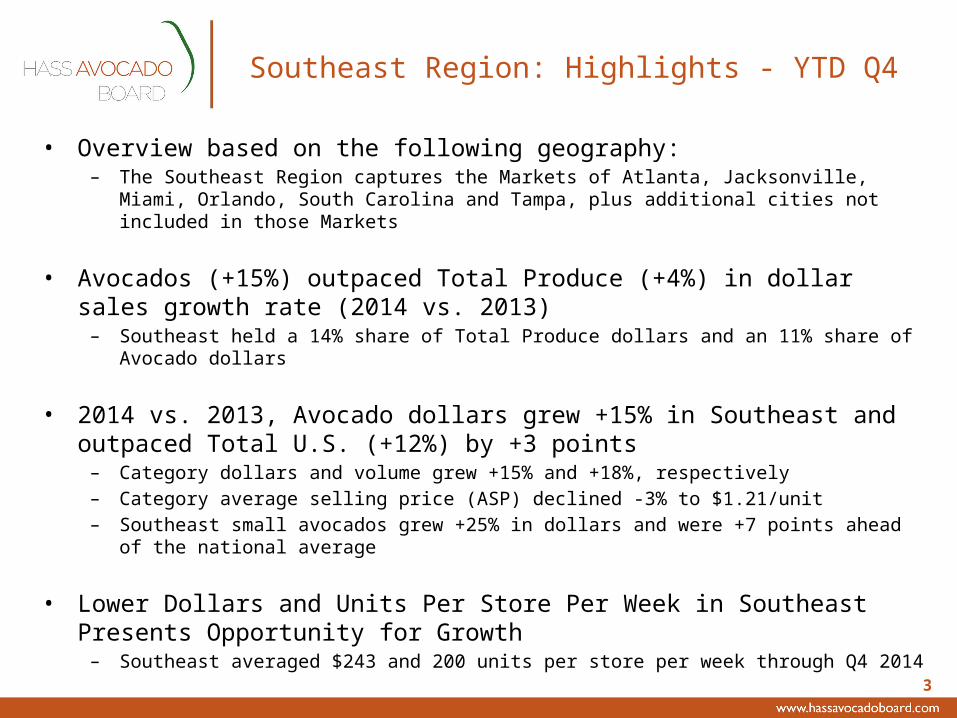
• Overview based on the following geography:– The Southeast Region captures the Markets of Atlanta, Jacksonville, Miami, Orlando,
South Carolina and Tampa, plus additional cities not included in those Markets
• Avocados (+15%) outpaced Total Produce (+4%) in dollar sales growth rate (2014 vs. 2013)– Southeast held a 14% share of Total Produce dollars and an 11% share of Avocado
dollars
• 2014 vs. 2013, Avocado dollars grew +15% in Southeast and outpaced Total U.S. (+12%) by +3 points– Category dollars and volume grew +15% and +18%, respectively– Category average selling price (ASP) declined -3% to $1.21/unit– Southeast small avocados grew +25% in dollars and were +7 points ahead of the
national average
• Lower Dollars and Units Per Store Per Week in Southeast Presents Opportunity for Growth– Southeast averaged $243 and 200 units per store per week through Q4 2014
4
Southeast: YTD Q4 - Avocados vs. Produce
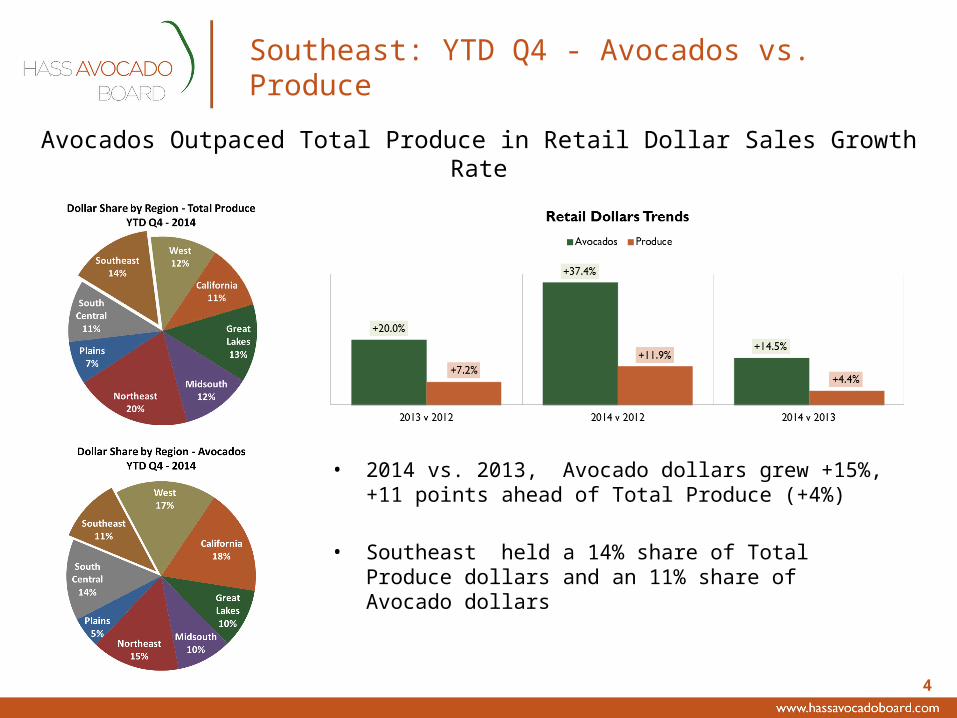
• 2014 vs. 2013, Avocado dollars grew +15%, +11 points ahead of Total Produce (+4%)
• Southeast held a 14% share of Total Produce dollars and an 11% share of Avocado dollars
Avocados Outpaced Total Produce in Retail Dollar Sales Growth Rate
5
Southeast: YTD Q4 Avocado Retail Overview
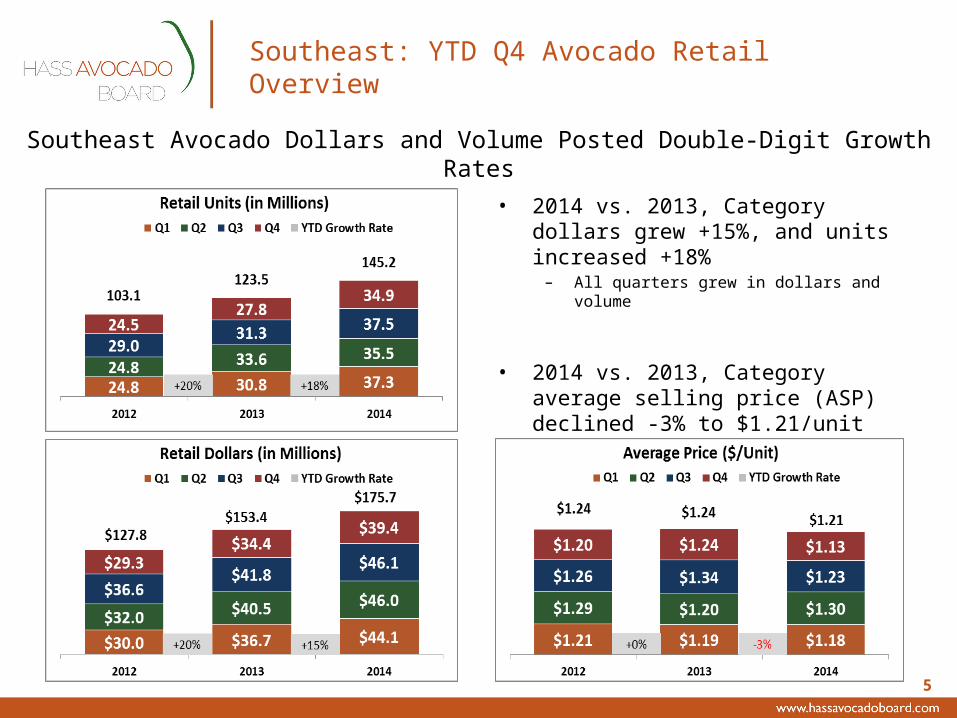
• 2014 vs. 2013, Category dollars grew +15%, and units increased +18%– All quarters grew in dollars and volume
• 2014 vs. 2013, Category average selling price (ASP) declined -3% to $1.21/unit
Southeast Avocado Dollars and Volume Posted Double-Digit Growth Rates
6
RETAIL UNITS
PLU Description 2013 2014 Variance 2013 2014 Variance
4046 Small Hass #60 sizes & smaller 71,778,228 88,743,913 +23.6% 516,365,787 548,422,526 +6.2%
4225 Large Hass #40 & #48 sizes 22,491,606 14,404,785 -36.0% 573,723,099 558,876,954 -2.6%
4770 X-Large Hass #36 sizes & larger 591,820 1,049,964 +77.4% 51,260,370 37,304,289 -27.2%
Other Greenskins, Pinkertons, non-Hass PLUs 10,715,872 11,016,364 +2.8% 29,280,330 30,725,847 +4.9%
Organic All Organic PLUs 504,401 788,959 +56.4% 16,329,239 21,453,937 +31.4%
Bags All bagged PLUs 17,421,874 29,175,846 +67.5% 187,601,391 244,552,871 +30.4%
123,503,802 145,179,830 +17.6% 1,374,560,217 1,441,336,424 +4.9%
RETAIL DOLLARS
PLU Description 2013 2014 Variance 2013 2014 Variance
4046 Small Hass #60 sizes & smaller 84,579,411$ 105,669,611$ +24.9% 403,090,522$ 477,446,510$ +18.4%
4225 Large Hass #40 & #48 sizes 26,755,301$ 18,156,790$ -32.1% 707,519,105$ 734,371,105$ +3.8%
4770 X-Large Hass #36 sizes & larger 1,093,643$ 1,953,927$ +78.7% 75,418,753$ 69,385,913$ -8.0%
Other Greenskins, Pinkertons, non-Hass PLUs 20,706,812$ 20,226,074$ -2.3% 48,304,923$ 51,161,023$ +5.9%
Organic All Organic PLUs 913,774$ 1,539,721$ +68.5% 26,795,567$ 37,185,059$ +38.8%
Bags All bagged PLUs 19,357,748$ 28,134,203$ +45.3% 168,508,870$ 232,858,765$ +38.2%
153,406,689$ 175,680,326$ +14.5% 1,429,637,740$ 1,602,408,376$ +12.1%
AVERAGE SELLING PRICE (ASP) / UNIT
PLU Description 2013 2014 Variance 2013 2014 Variance
4046 Small Hass #60 sizes & smaller $1.18 $1.19 +1.1% $0.78 $0.87 +11.5%
4225 Large Hass #40 & #48 sizes $1.19 $1.26 +6.0% $1.23 $1.31 +6.6%
4770 X-Large Hass #36 sizes & larger $1.85 $1.86 +0.7% $1.47 $1.86 +26.4%
Other Greenskins, Pinkertons, non-Hass PLUs $1.93 $1.84 -5.0% $1.65 $1.67 +0.9%
Organic All Organic PLUs $1.81 $1.95 +7.7% $1.64 $1.73 +5.6%
Bags All bagged PLUs $1.11 $0.96 -13.2% $0.90 $0.95 +6.0%
$1.24 $1.21 -2.6% $1.04 $1.11 +6.9%
JAN
UA
RY -
DEC
EMBER
: 201
3 vs
201
4
Southeast Total U.S.
TOTAL CATEGORY UNITS
Southeast Total U.S.
TOTAL CATEGORY DOLLARS
Southeast Total U.S.
CATEGORY ASP ($/Unit)
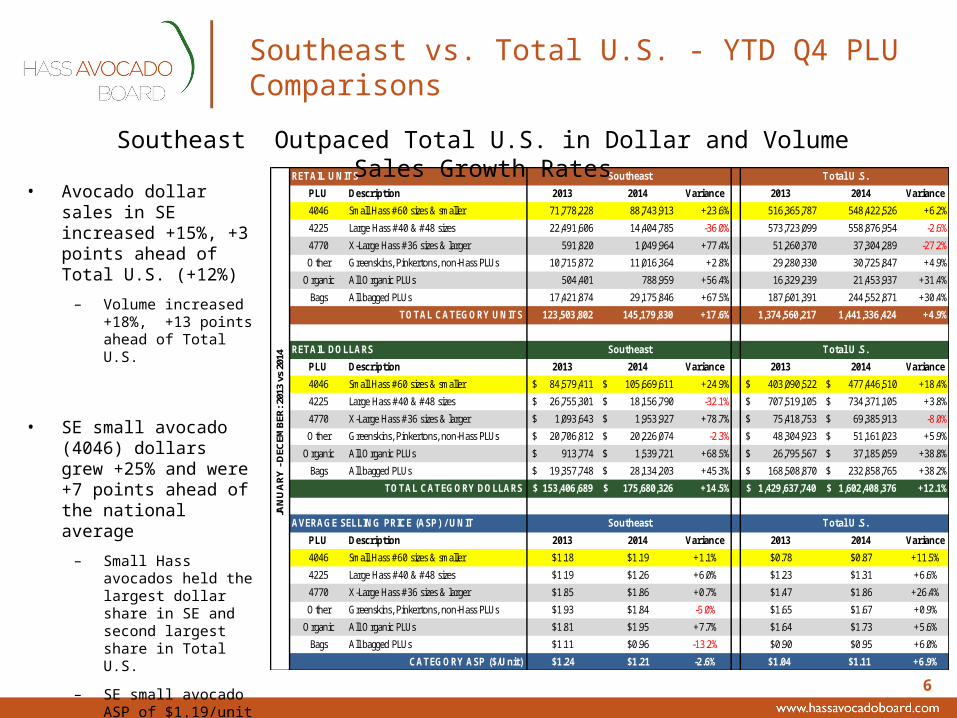
Southeast vs. Total U.S. - YTD Q4 PLU Comparisons
• Avocado dollar sales in SE increased +15%, +3 points ahead of Total U.S. (+12%)
– Volume increased +18%, +13 points ahead of Total U.S.
• SE small avocado (4046) dollars grew +25% and were +7 points ahead of the national average
– Small Hass avocados held the largest dollar share in SE and second largest share in Total U.S.
– SE small avocado ASP of $1.19/unit was +37% higher than the national average
Southeast Outpaced Total U.S. in Dollar and Volume Sales Growth Rates
7
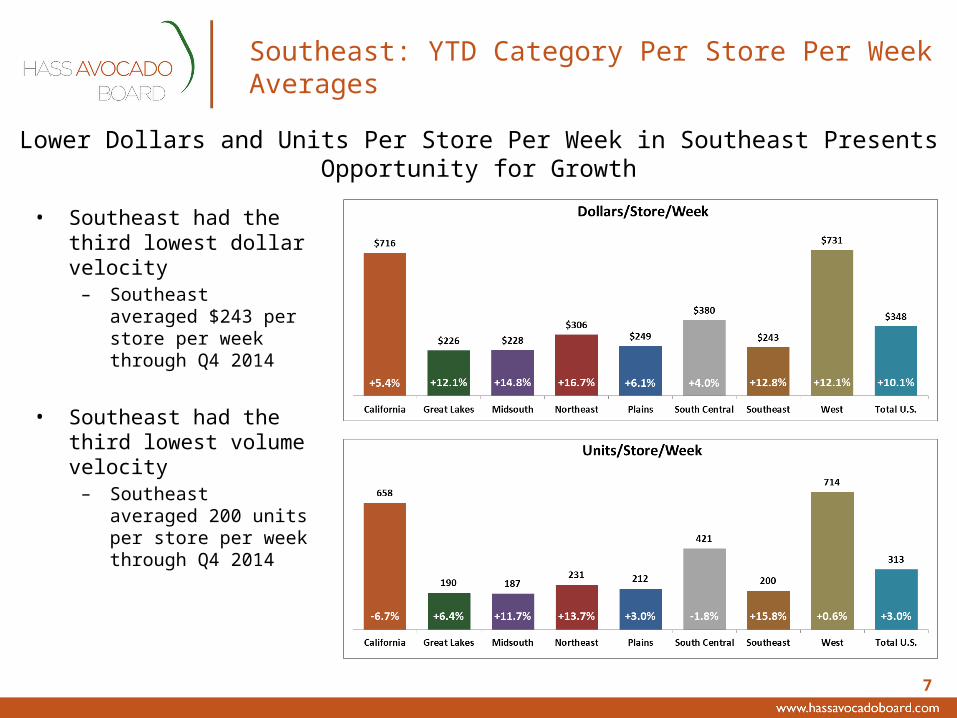
Southeast: YTD Category Per Store Per Week Averages
• Southeast had the third lowest dollar velocity– Southeast averaged
$243 per store per week through Q4 2014
• Southeast had the third lowest volume velocity– Southeast averaged
200 units per store per week through Q4 2014
Lower Dollars and Units Per Store Per Week in Southeast Presents Opportunity for Growth
8
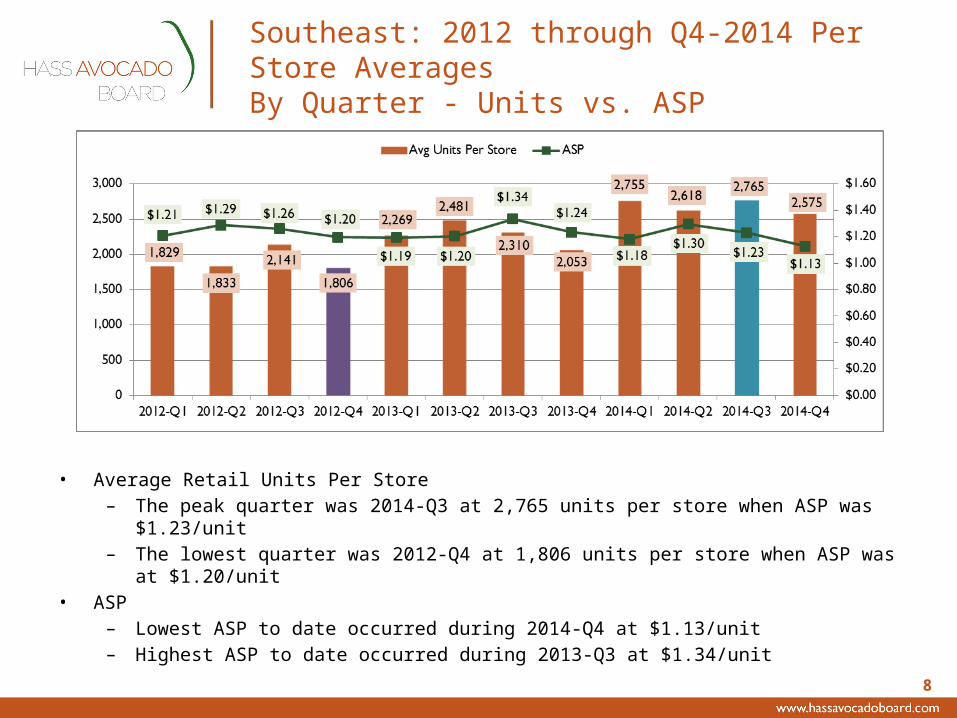
Southeast: 2012 through Q4-2014 Per Store AveragesBy Quarter - Units vs. ASP
• Average Retail Units Per Store– The peak quarter was 2014-Q3 at 2,765 units per store when ASP was $1.23/unit– The lowest quarter was 2012-Q4 at 1,806 units per store when ASP was at
$1.20/unit• ASP
– Lowest ASP to date occurred during 2014-Q4 at $1.13/unit– Highest ASP to date occurred during 2013-Q3 at $1.34/unit