Embed Size (px)
Citation preview
South Somerset District Council
Settlement Profile: South Petherton
October 2017
1
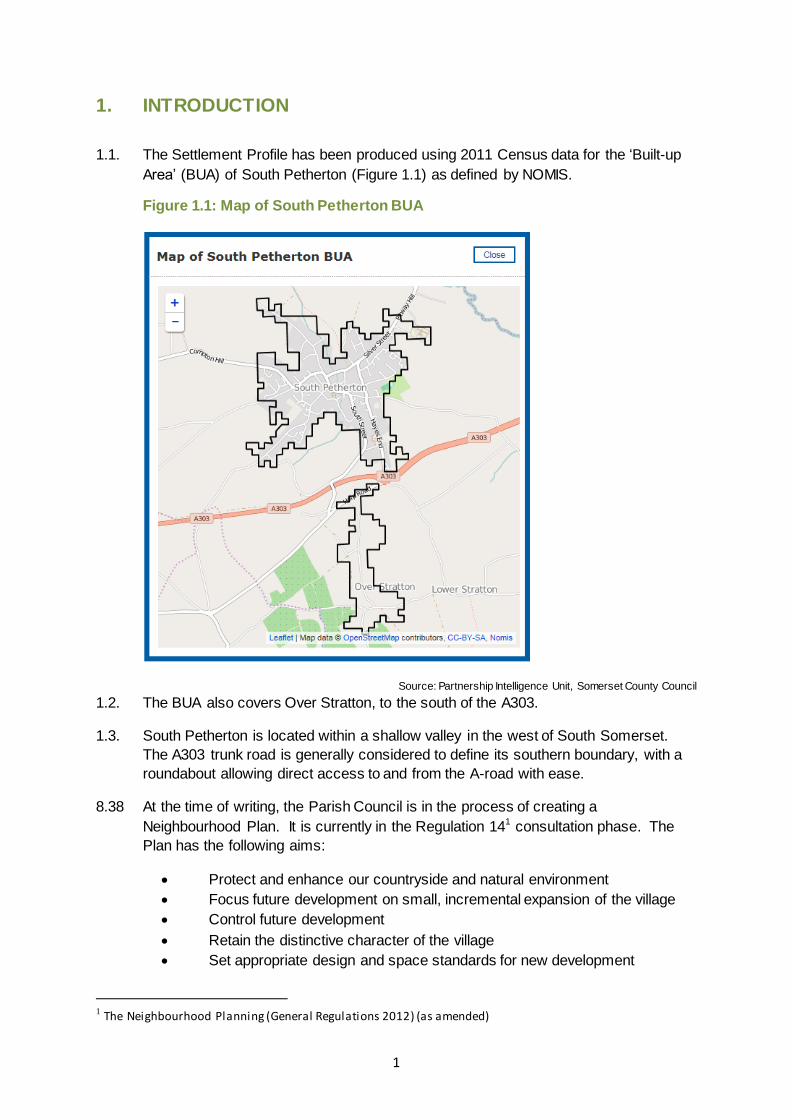
1. INTRODUCTION
1.1. The Settlement Profile has been produced using 2011 Census data for the ‘Built-up
Area’ (BUA) of South Petherton (Figure 1.1) as defined by NOMIS.
Figure 1.1: Map of South Petherton BUA
Source: Partnership Intelligence Unit, Somerset County Council
1.2. The BUA also covers Over Stratton, to the south of the A303.
1.3. South Petherton is located within a shallow valley in the west of South Somerset.
The A303 trunk road is generally considered to define its southern boundary, with a
roundabout allowing direct access to and from the A-road with ease.
8.38 At the time of writing, the Parish Council is in the process of creating a
Neighbourhood Plan. It is currently in the Regulation 141 consultation phase. The
Plan has the following aims:
Protect and enhance our countryside and natural environment
Focus future development on small, incremental expansion of the village
Control future development
Retain the distinctive character of the village
Set appropriate design and space standards for new development
1 The Neighbourhood Planning (General Regulations 2012) (as amended)
2
Establish a more accessible (pedestrian-and cyclist friendly) environment
Ensure new housing meets local needs and increases choice
Strengthen retail/commercial function of village centre
Support the growth of local business / enterprise
Reduce substantially the impact of the motor vehicle
Improve parking provision
Provide for a wide range of community facilities and services and improve
leisure and recreation opportunities
Increase sport and recreation facilities and opportunities at the Rec.
2. POPULATION
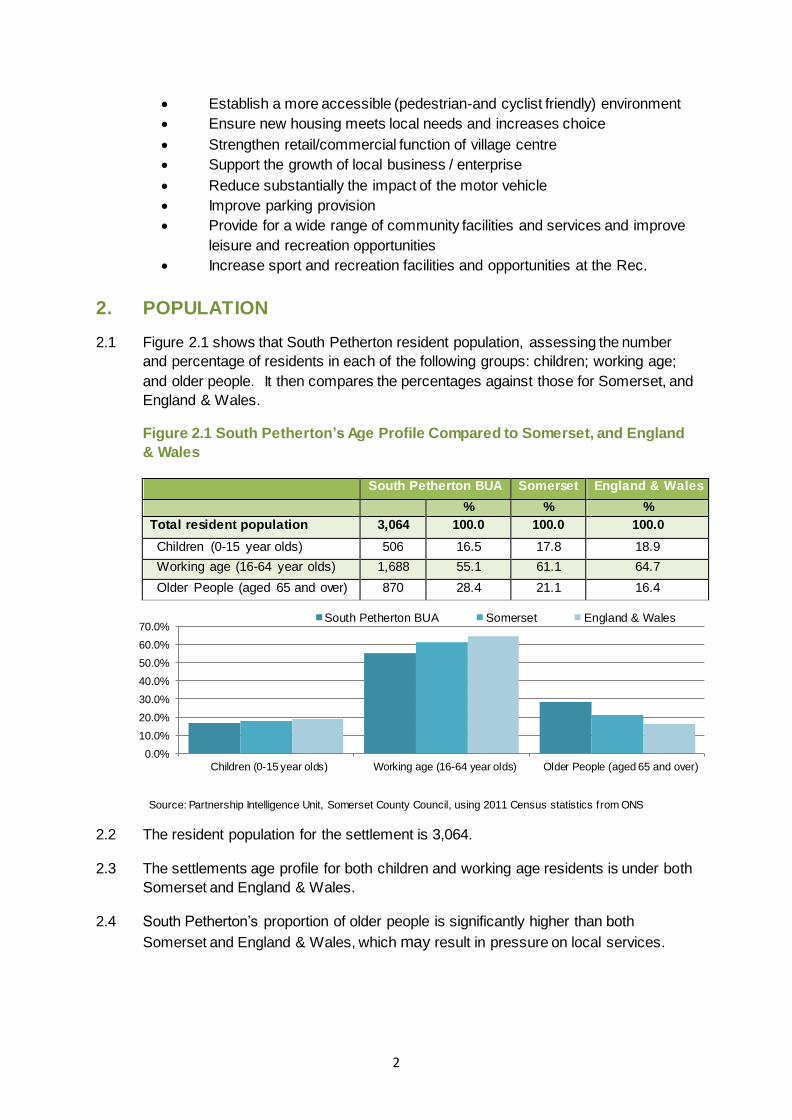
2.1 Figure 2.1 shows that South Petherton resident population, assessing the number
and percentage of residents in each of the following groups: children; working age;
and older people. It then compares the percentages against those for Somerset, and
England & Wales.
Figure 2.1 South Petherton’s Age Profile Compared to Somerset, and England
& Wales
South Petherton BUA Somerset England & Wales
% % %
Total resident population 3,064 100.0 100.0 100.0
Children (0-15 year olds) 506 16.5 17.8 18.9
Working age (16-64 year olds) 1,688 55.1 61.1 64.7
Older People (aged 65 and over) 870 28.4 21.1 16.4
Source: Partnership Intelligence Unit, Somerset County Council, using 2011 Census statistics from ONS
2.2 The resident population for the settlement is 3,064.
2.3 The settlements age profile for both children and working age residents is under both
Somerset and England & Wales.
2.4 South Petherton’s proportion of older people is significantly higher than both
Somerset and England & Wales, which may result in pressure on local services.
0.0%
10.0%
20.0%
30.0%
40.0%
50.0%
60.0%
70.0%
Children (0-15 year olds) Working age (16-64 year olds) Older People (aged 65 and over)
South Petherton BUA Somerset England & Wales
3
3. HOUSING
3.1 Policy SS5 of the Local Plan (2006-2028) sets South Petherton a target of delivering
229 new dwellings by 31st March 2028. As at 31st March 2017, South Petherton has
met this target. It has delivered 232 dwellings and has commitments to deliver a
further 28 dwellings2.
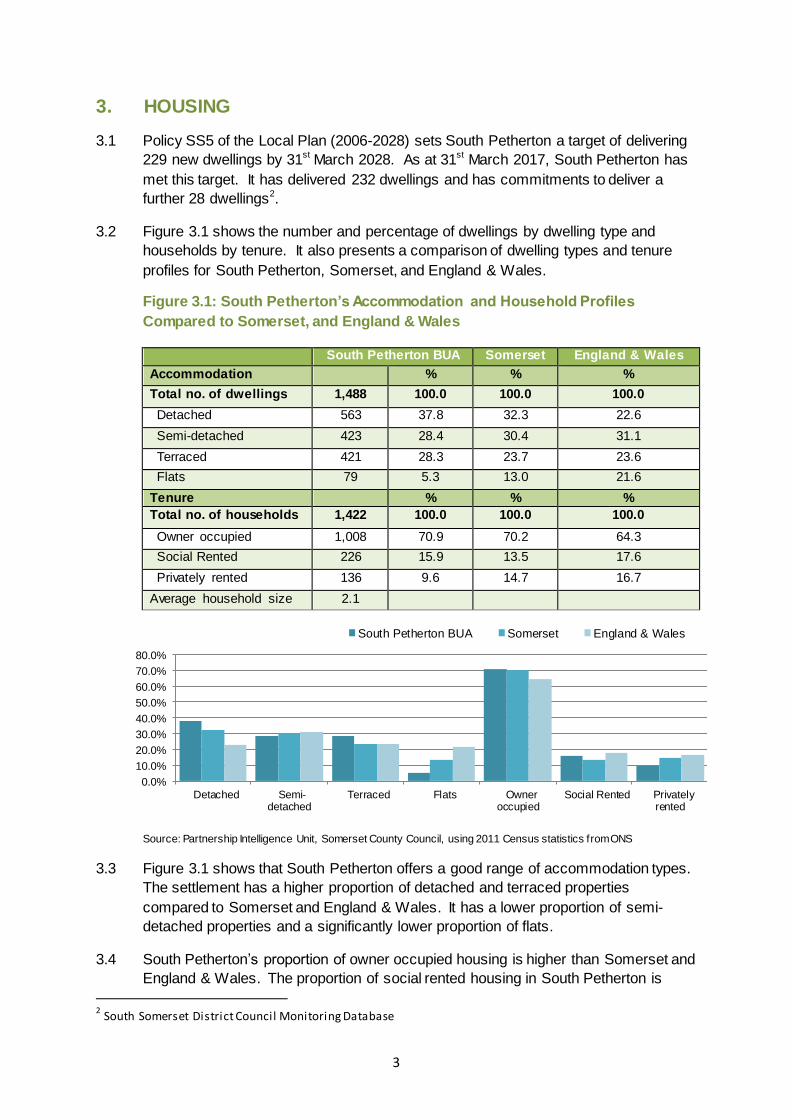
3.2 Figure 3.1 shows the number and percentage of dwellings by dwelling type and
households by tenure. It also presents a comparison of dwelling types and tenure
profiles for South Petherton, Somerset, and England & Wales.
Figure 3.1: South Petherton’s Accommodation and Household Profiles
Compared to Somerset, and England & Wales
South Petherton BUA Somerset England & Wales
Accommodation % % %
Total no. of dwellings 1,488 100.0 100.0 100.0
Detached 563 37.8 32.3 22.6
Semi-detached 423 28.4 30.4 31.1
Terraced 421 28.3 23.7 23.6
Flats 79 5.3 13.0 21.6
Tenure % % %
Total no. of households 1,422 100.0 100.0 100.0
Owner occupied 1,008 70.9 70.2 64.3
Social Rented 226 15.9 13.5 17.6
Privately rented 136 9.6 14.7 16.7
Average household size 2.1
Source: Partnership Intelligence Unit, Somerset County Council, using 2011 Census statistics from ONS
3.3 Figure 3.1 shows that South Petherton offers a good range of accommodation types.
The settlement has a higher proportion of detached and terraced properties
compared to Somerset and England & Wales. It has a lower proportion of semi-
detached properties and a significantly lower proportion of flats.
3.4 South Petherton’s proportion of owner occupied housing is higher than Somerset and
England & Wales. The proportion of social rented housing in South Petherton is
2 South Somerset District Council Monitoring Database
0.0%
10.0%
20.0%
30.0%
40.0%
50.0%
60.0%
70.0%
80.0%
Detached Semi-detached
Terraced Flats Owneroccupied
Social Rented Privatelyrented
South Petherton BUA Somerset England & Wales
4
higher than Somerset but lower than England & Wales. The proportion of privately
rented properties is much lower than Somerset and England & Wales.
3.5 Overall, the settlement would benefit from additional flats and privately rented
housing.
4. ECONOMY
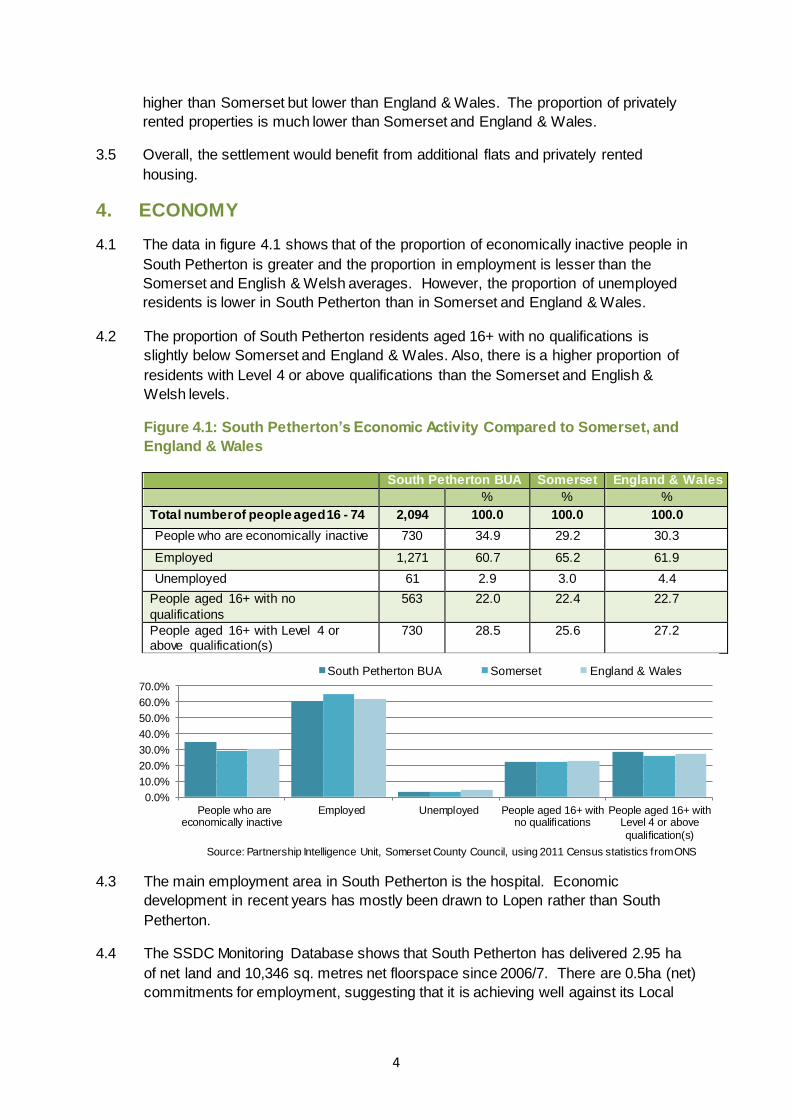
4.1 The data in figure 4.1 shows that of the proportion of economically inactive people in
South Petherton is greater and the proportion in employment is lesser than the
Somerset and English & Welsh averages. However, the proportion of unemployed
residents is lower in South Petherton than in Somerset and England & Wales.
4.2 The proportion of South Petherton residents aged 16+ with no qualifications is
slightly below Somerset and England & Wales. Also, there is a higher proportion of
residents with Level 4 or above qualifications than the Somerset and English &
Welsh levels.
Figure 4.1: South Petherton’s Economic Activity Compared to Somerset, and
England & Wales
South Petherton BUA Somerset England & Wales
% % %
Total number of people aged 16 - 74 2,094 100.0 100.0 100.0
People who are economically inactive 730 34.9 29.2 30.3
Employed 1,271 60.7 65.2 61.9
Unemployed 61 2.9 3.0 4.4
People aged 16+ with no
qualifications
563 22.0 22.4 22.7
People aged 16+ with Level 4 or above qualification(s)
730 28.5 25.6 27.2
Source: Partnership Intelligence Unit, Somerset County Council, using 2011 Census statistics from ONS
4.3 The main employment area in South Petherton is the hospital. Economic
development in recent years has mostly been drawn to Lopen rather than South
Petherton.
4.4 The SSDC Monitoring Database shows that South Petherton has delivered 2.95 ha
of net land and 10,346 sq. metres net floorspace since 2006/7. There are 0.5ha (net)
commitments for employment, suggesting that it is achieving well against its Local
0.0%
10.0%
20.0%
30.0%
40.0%
50.0%
60.0%
70.0%
People who areeconomically inactive
Employed Unemployed People aged 16+ withno qualifications
People aged 16+ withLevel 4 or above
qualification(s)
South Petherton BUA Somerset England & Wales
5
Plan employment land delivery target. However, records show that a large
proportion of this economic development has been at the Lopen Head Nursery site.
4.5 The draft Neighbourhood plan has indicated that new employment should be located
adjacent to the A303.
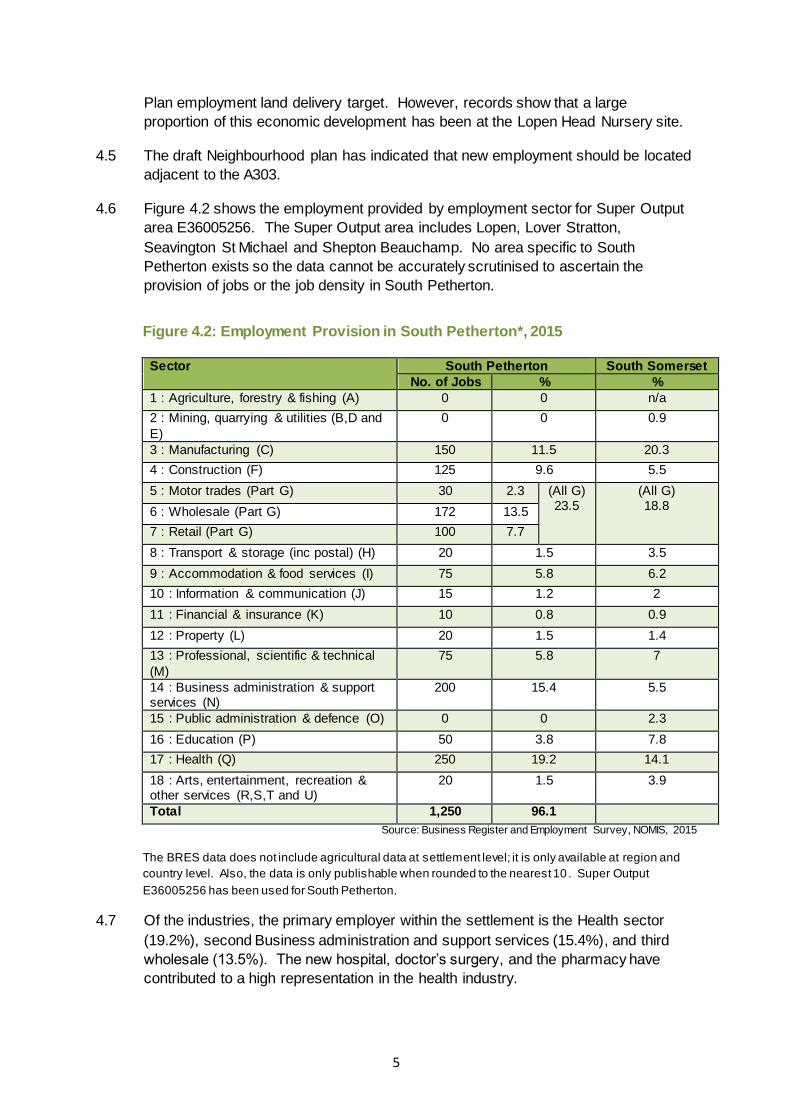
4.6 Figure 4.2 shows the employment provided by employment sector for Super Output
area E36005256. The Super Output area includes Lopen, Lover Stratton,
Seavington St Michael and Shepton Beauchamp. No area specific to South
Petherton exists so the data cannot be accurately scrutinised to ascertain the
provision of jobs or the job density in South Petherton.
Figure 4.2: Employment Provision in South Petherton*, 2015
Sector South Petherton South Somerset
No. of Jobs % %
1 : Agriculture, forestry & fishing (A) 0 0 n/a
2 : Mining, quarrying & utilities (B,D and
E)
0 0 0.9
3 : Manufacturing (C) 150 11.5 20.3
4 : Construction (F) 125 9.6 5.5
5 : Motor trades (Part G) 30 2.3 (All G) 23.5
(All G) 18.8 6 : Wholesale (Part G) 172 13.5
7 : Retail (Part G) 100 7.7
8 : Transport & storage (inc postal) (H) 20 1.5 3.5
9 : Accommodation & food services (I) 75 5.8 6.2
10 : Information & communication (J) 15 1.2 2
11 : Financial & insurance (K) 10 0.8 0.9
12 : Property (L) 20 1.5 1.4
13 : Professional, scientific & technical
(M)
75 5.8 7
14 : Business administration & support services (N)
200 15.4 5.5
15 : Public administration & defence (O) 0 0 2.3
16 : Education (P) 50 3.8 7.8
17 : Health (Q) 250 19.2 14.1
18 : Arts, entertainment, recreation & other services (R,S,T and U)
20 1.5 3.9
Total 1,250 96.1
Source: Business Register and Employment Survey, NOMIS, 2015
The BRES data does not include agricultural data at settlement level; it is only available at region and
country level. Also, the data is only publishable when rounded to the nearest 10 . Super Output
E36005256 has been used for South Petherton.
4.7 Of the industries, the primary employer within the settlement is the Health sector
(19.2%), second Business administration and support services (15.4%), and third
wholesale (13.5%). The new hospital, doctor’s surgery, and the pharmacy have
contributed to a high representation in the health industry.
6
Town Centre
4.8 The Retail and Town Centre uses Study shows that South Petherton has a higher
proportion of comparison units (A1/A2) than the national average, but the proportion
of service units (A3/A4/A5) is below the national average. At the time of the Study,
the centre included a number of charity shops, electrical and hardware shops,
butchers, delicatessens, a Co-op, hairdressers, estate agents, a post office, a bank,
a café, a restaurant, a public house, and a takeaway.
4.9 There are no vacancies within the town centre suggesting that it is a healthy and
vibrant place.
4.10 South Petherton benefits from a free car park providing 25 spaces in the town centre.
The Neighbourhood Plan currently seeks to improve the car parking provision.
5. INFRASTRUCTURE
5.1 The Infrastructure Delivery Plan (IDP) indicates that new housing will generate a
need for additional open space and outdoor play space, sports, community and
cultural facilities; although the timing of this is not fundamental to delivering
development.
5.2 There is also localised flooding, exacerbated by small, culverted, watercourses that
are often undersized and prone to blockage. There is an EA maintained raised
embankment and culvert downstream of Hele Lane ford. Flood defences may need
to be raised in the future to provide an increased standard of protection for the
settlement.
5.3 Short term issues associated with a lack of electricity capacity have been identified
and there may be water treatment works necessary. Both matters are resolvable
with local enhancements, paid for by developers.
5.4 The settlement has a good range of services and facilities, but with new housing
would need to consider looking at new facilities for open space, sports and
community facilities. Overall, no infrastructural issues have been identified that
would impede the growth of the settlement to the Local Plan targets.
6. TRAVEL
6.1 South Petherton’s location next to the A303 makes it a prime location for commuters.
6.2 South Petherton benefits from a good core bus service linking the community to
Yeovil and the wider community with South Petherton Hospital. Other routes also
operate from Watergore as shown in Figure 6.1 below.
7
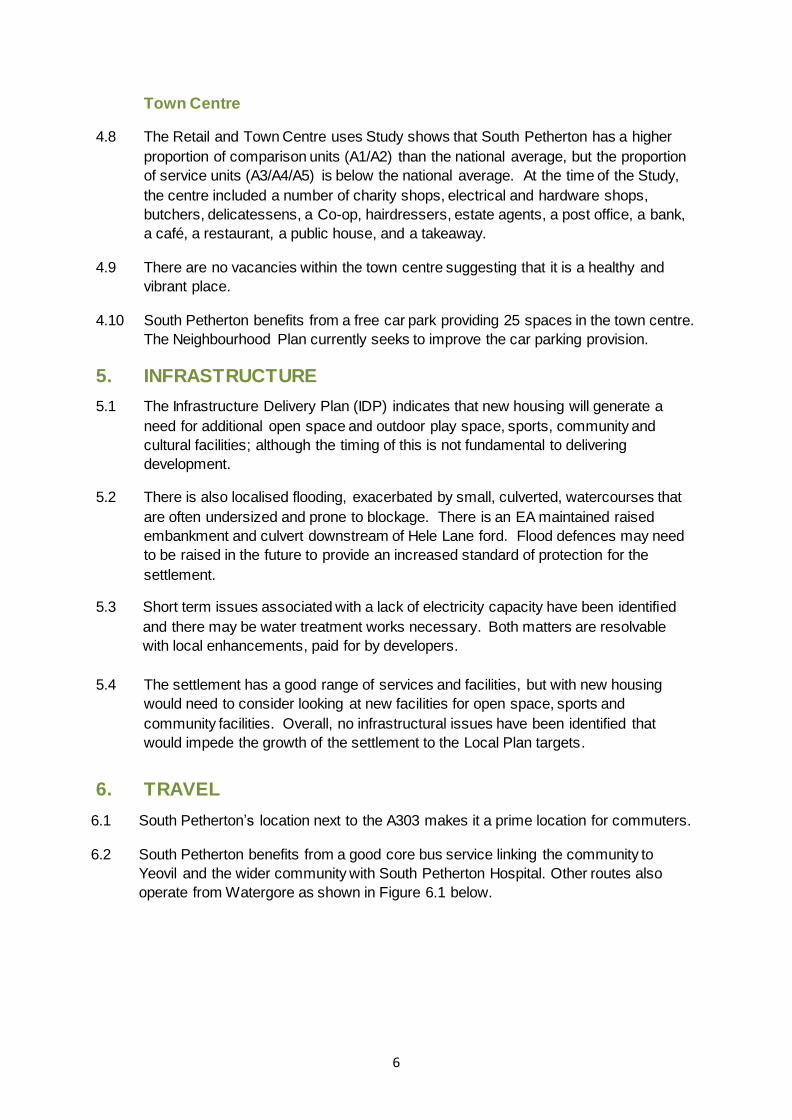
Figure 6.1: Public Transport Provision
Buses
Operator Principal Destinations Frequency (approx.)
South West Coaches
81: South Petherton Hospital – Montacute – Stoke-Sub-Hamdon - Yeovil
Hourly
Nippybus3 N10: Martock – Ilminster – Taunton* 4xdaily
Demand Responsive N6 – links South Petherton to Martock
Multiple daily
Berry’s Coaches Superfast 2 – London Hammersmith* 2xdaily
*From Watergore – Harp Road Garage
6.3 There are no train services in South Petherton. The nearest stations being
Crewkerne or Yeovil.
7. ENVIRONMENT
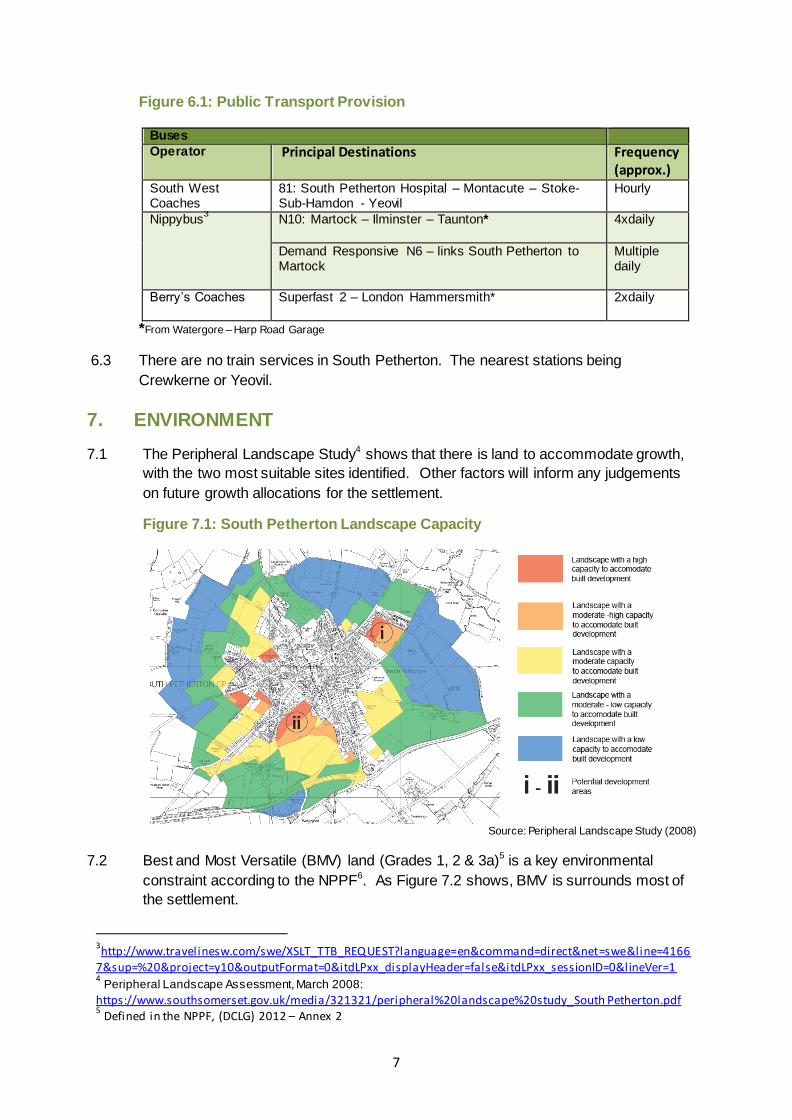
7.1 The Peripheral Landscape Study4 shows that there is land to accommodate growth,
with the two most suitable sites identified. Other factors will inform any judgements
on future growth allocations for the settlement.
Figure 7.1: South Petherton Landscape Capacity
Source: Peripheral Landscape Study (2008)
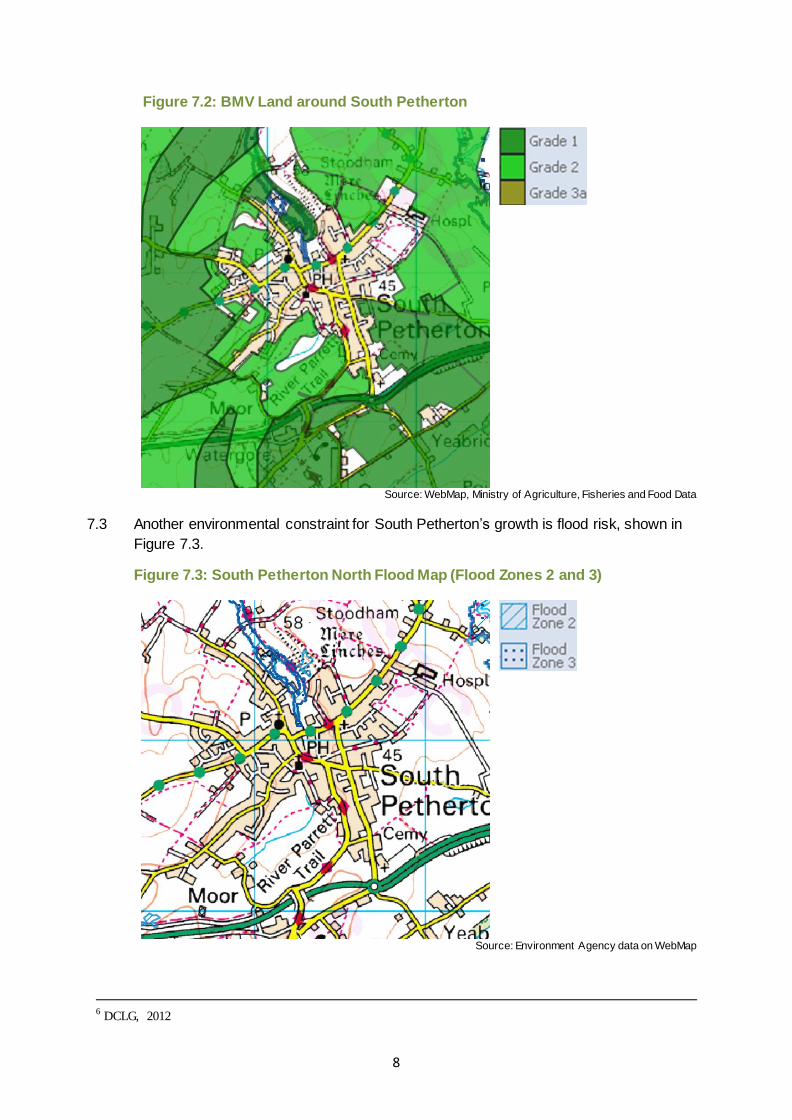
7.2 Best and Most Versatile (BMV) land (Grades 1, 2 & 3a)5 is a key environmental
constraint according to the NPPF6. As Figure 7.2 shows, BMV is surrounds most of
the settlement.
3http://www.travelinesw.com/swe/XSLT_TTB_REQUEST?language=en&command=direct&net=swe&line=4166
7&sup=%20&project=y10&outputFormat=0&itdLPxx_displayHeader=false&itdLPxx_sessionID=0&lineVer=1 4 Peripheral Landscape Assessment, March 2008:
https://www.southsomerset.gov.uk/media/321321/peripheral%20landscape%20study_South Petherton.pdf 5 Defined in the NPPF, (DCLG) 2012 – Annex 2
8
Figure 7.2: BMV Land around South Petherton
Source: WebMap, Ministry of Agriculture, Fisheries and Food Data
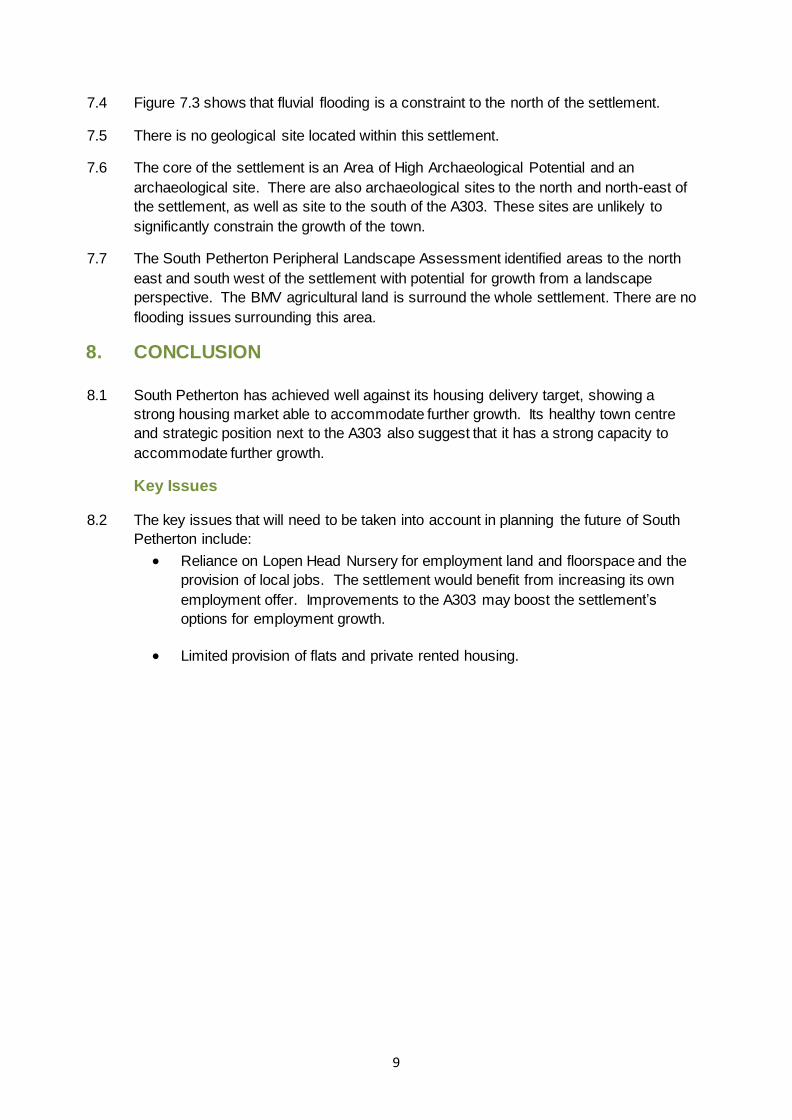
7.3 Another environmental constraint for South Petherton’s growth is flood risk, shown in
Figure 7.3.
Figure 7.3: South Petherton North Flood Map (Flood Zones 2 and 3)
Source: Environment Agency data on WebMap
6 DCLG, 2012
9
7.4 Figure 7.3 shows that fluvial flooding is a constraint to the north of the settlement.
7.5 There is no geological site located within this settlement.
7.6 The core of the settlement is an Area of High Archaeological Potential and an
archaeological site. There are also archaeological sites to the north and north-east of
the settlement, as well as site to the south of the A303. These sites are unlikely to
significantly constrain the growth of the town.
7.7 The South Petherton Peripheral Landscape Assessment identified areas to the north
east and south west of the settlement with potential for growth from a landscape
perspective. The BMV agricultural land is surround the whole settlement. There are no
flooding issues surrounding this area.
8. CONCLUSION
8.1 South Petherton has achieved well against its housing delivery target, showing a
strong housing market able to accommodate further growth. Its healthy town centre
and strategic position next to the A303 also suggest that it has a strong capacity to
accommodate further growth.
Key Issues
8.2 The key issues that will need to be taken into account in planning the future of South
Petherton include:
Reliance on Lopen Head Nursery for employment land and floorspace and the
provision of local jobs. The settlement would benefit from increasing its own
employment offer. Improvements to the A303 may boost the settlement’s
options for employment growth.
Limited provision of flats and private rented housing.