Embed Size (px)
Citation preview
South Lake Tahoe: Magnetic Surveying
Erica Romero and Caitlin Swale
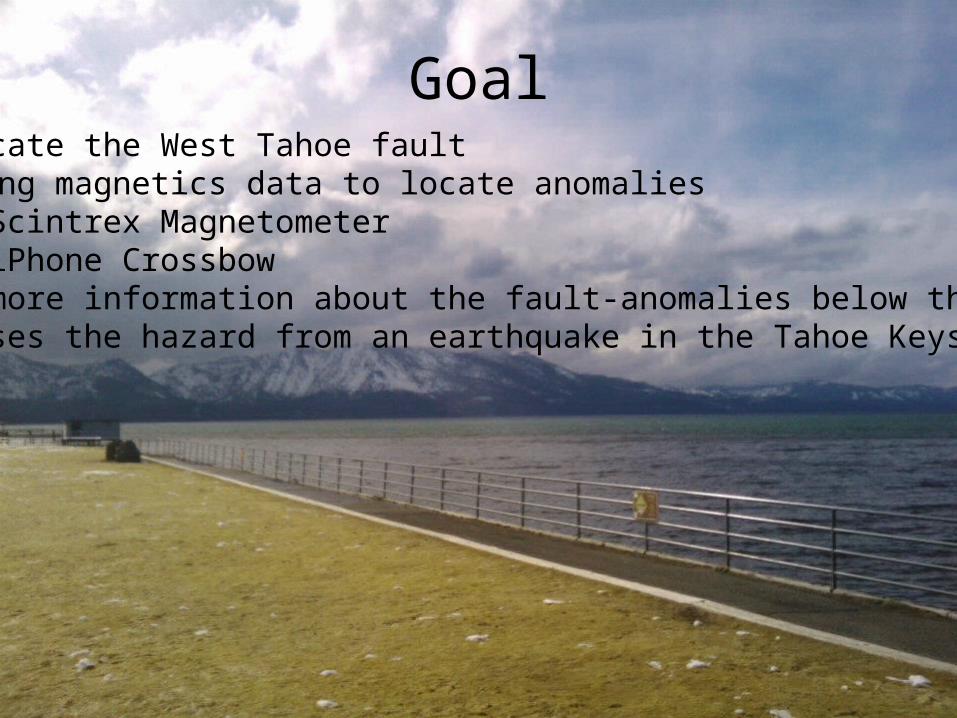
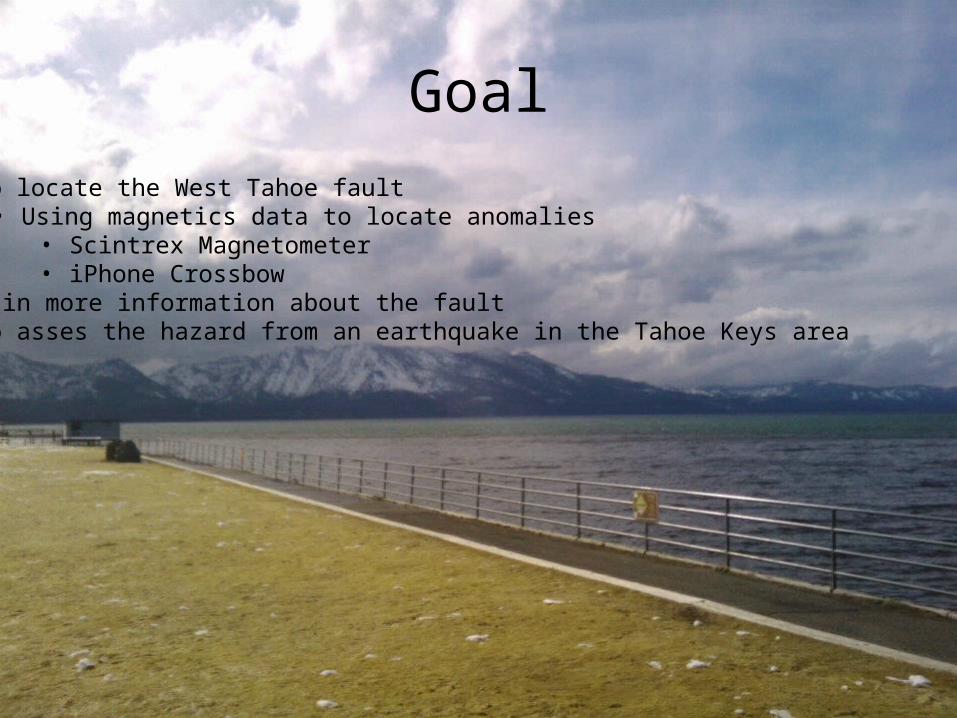
Goal• To locate the West Tahoe fault • Using magnetics data to locate anomalies• Scintrex Magnetometer• iPhone Crossbow
• Gain more information about the fault-anomalies below the surface• To asses the hazard from an earthquake in the Tahoe Keys area
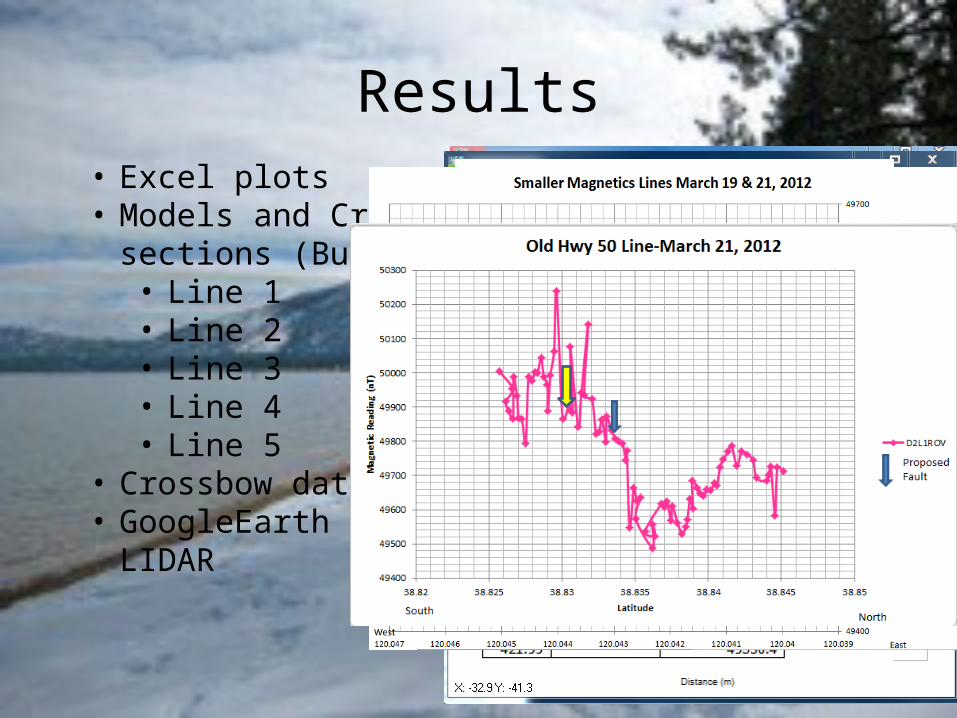
Results• Excel plots• Models and Cross sections
(Burger)• Line 1• Line 2• Line 3• Line 4• Line 5
• Crossbow data• GoogleEarth vs. LIDAR
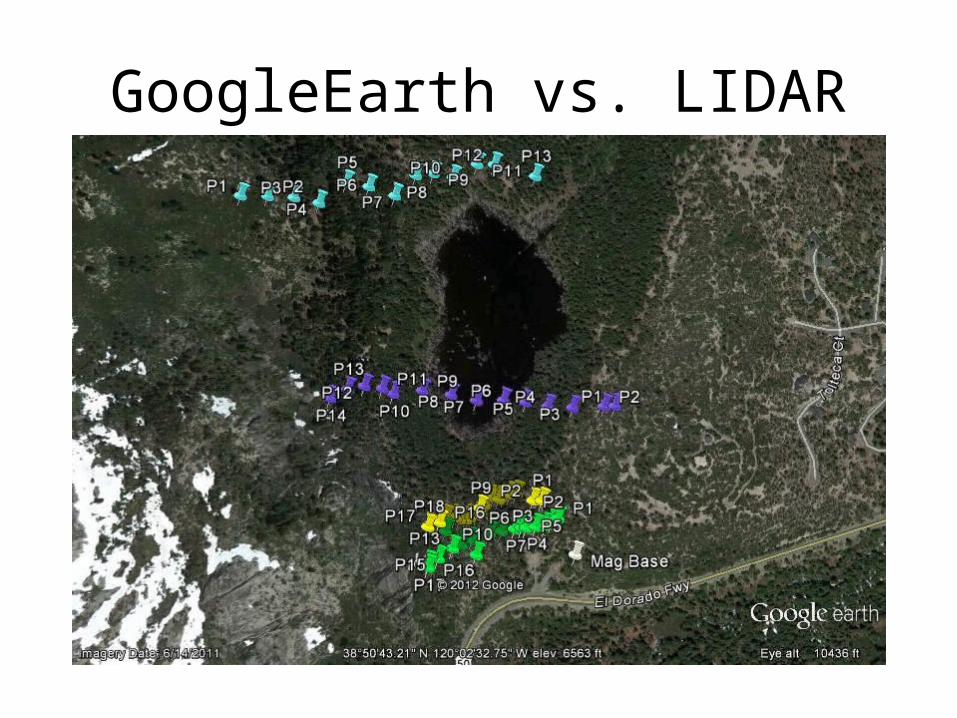
GoogleEarth vs. LIDAR
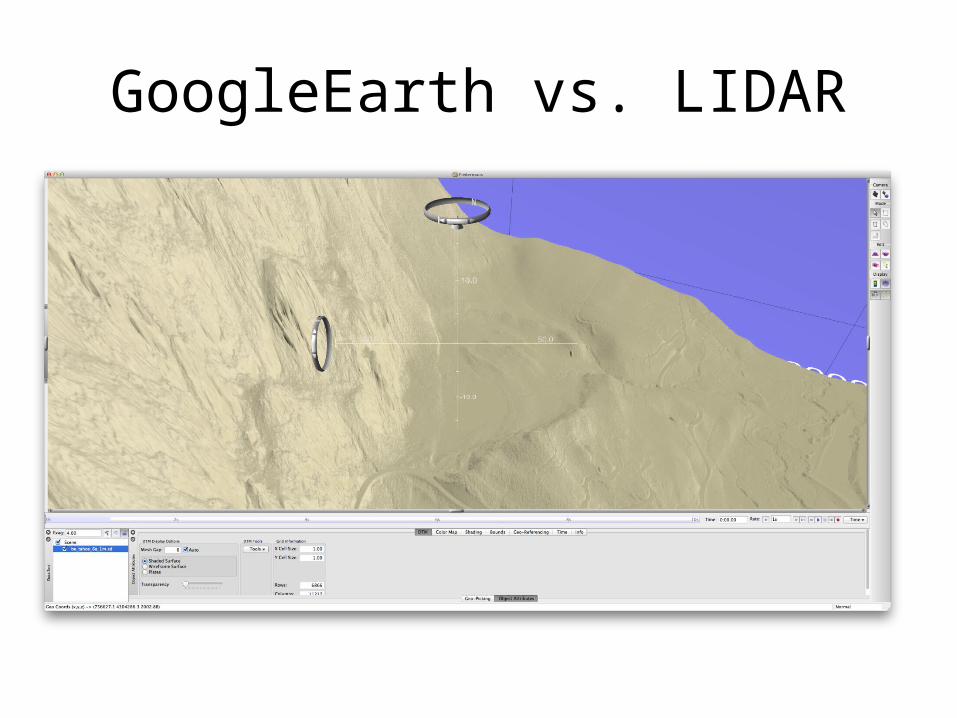
GoogleEarth vs. LIDAR
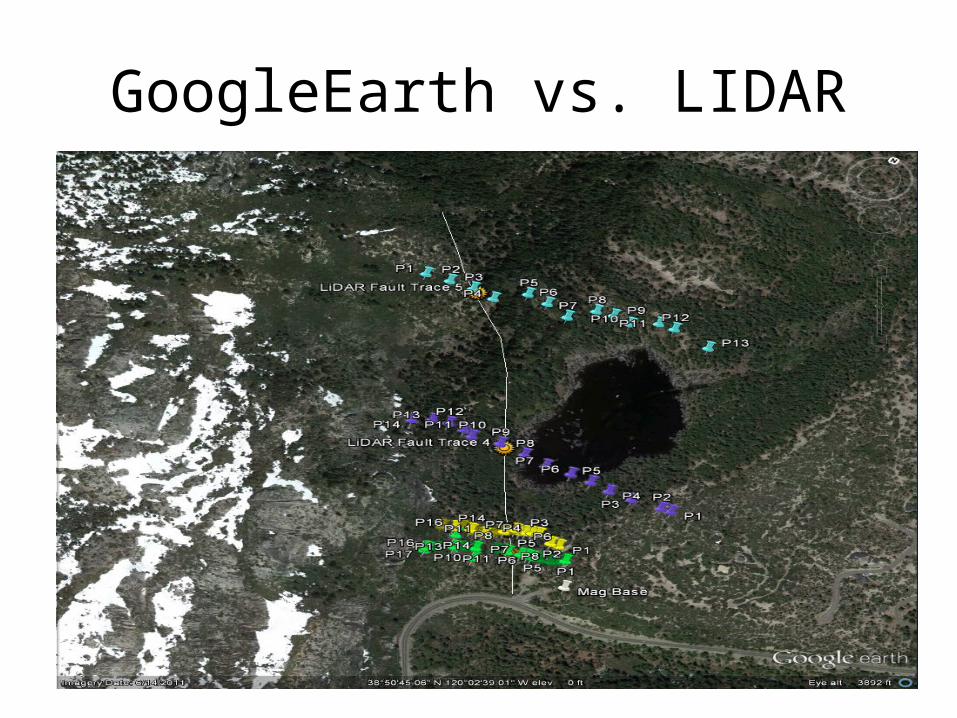
GoogleEarth vs. LIDAR
Where the original PowerPoint starts…
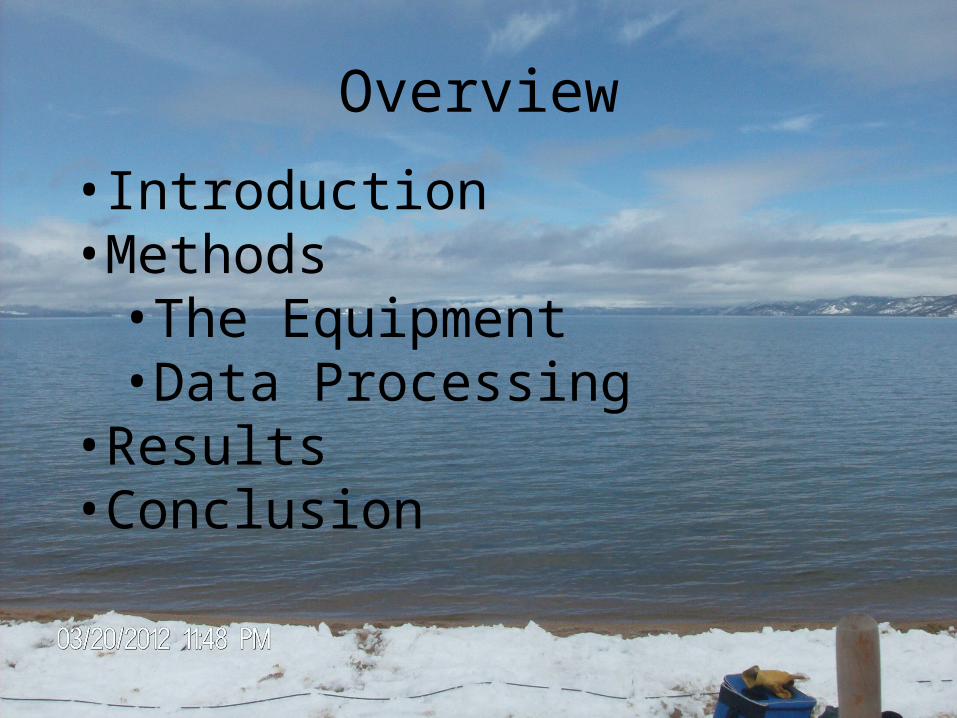
Overview
• Introduction•Methods• The Equipment• Data Processing
• Results• Conclusion
Introduction• Location• Goal• Previous Work• Proposed Lines
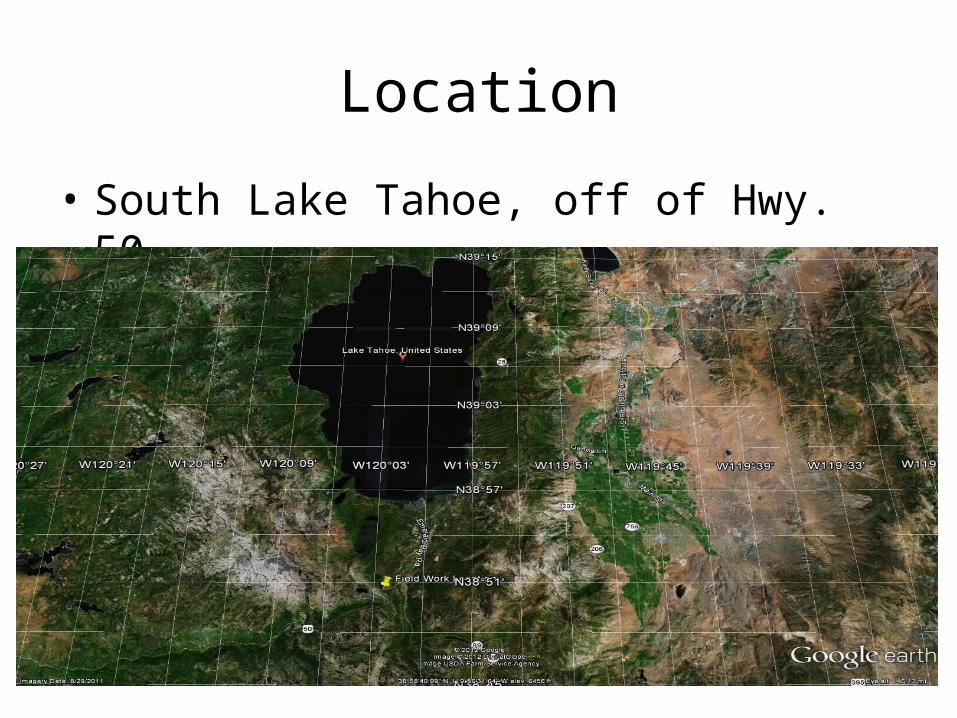
Location
• South Lake Tahoe, off of Hwy. 50
Goal• To locate the West Tahoe fault
• Using magnetics data to locate anomalies• Scintrex Magnetometer• iPhone Crossbow
• Gain more information about the fault• To asses the hazard from an earthquake in the Tahoe Keys area
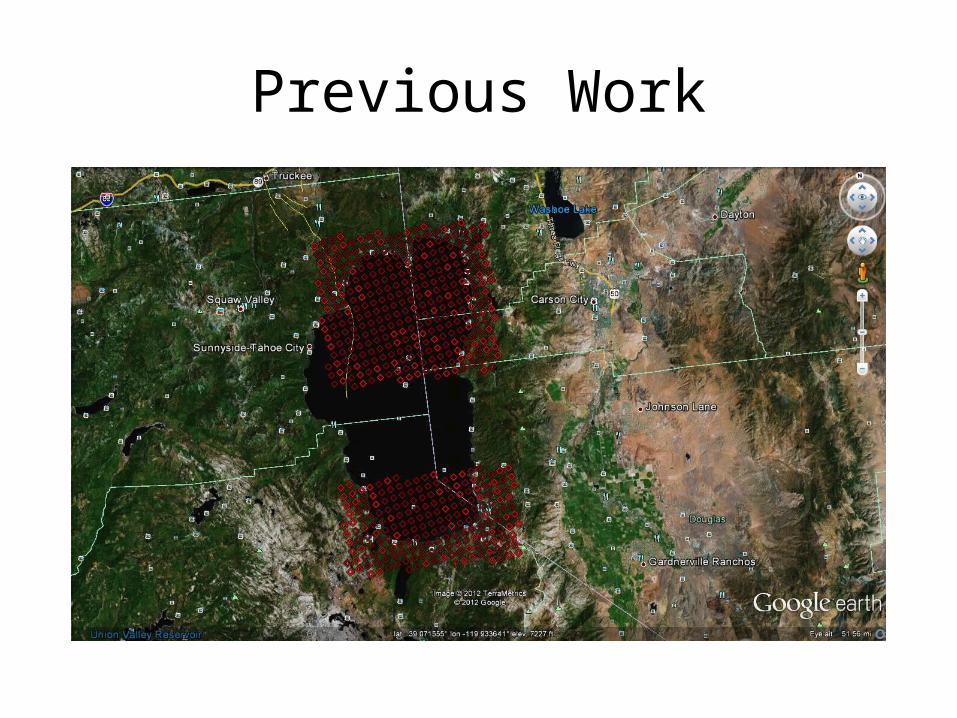
Previous Work
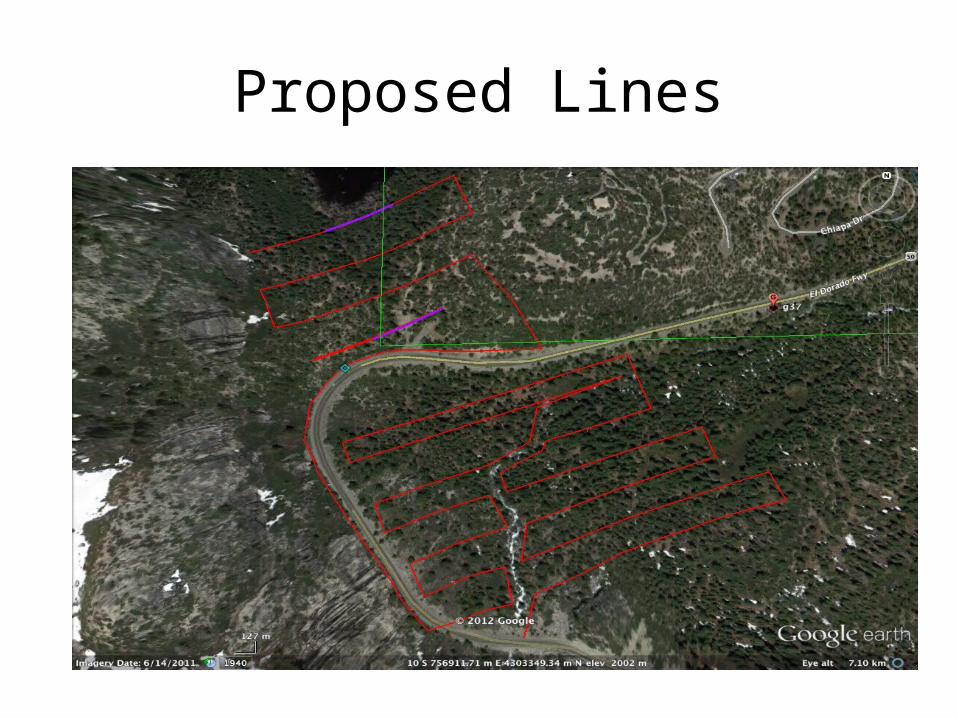
Proposed Lines
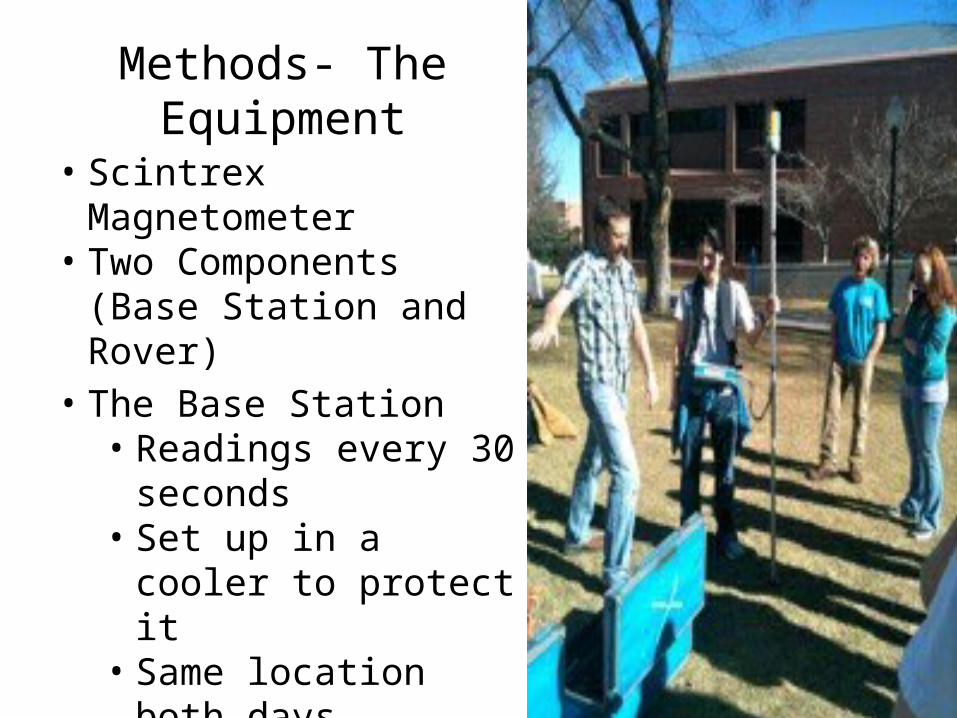
Methods- The Equipment
• Scintrex Magnetometer• Two Components (Base
Station and Rover)
• The Base Station• Readings every 30
seconds• Set up in a cooler to
protect it • Same location both days

The Rover
• Readings taken every ~10 m
• 3 readings taken at each stop, then averaged
• Sensor attached to a staff that must always be orientated towards the north
• The Tahoe sites were accessed by skiing and snowshoeing
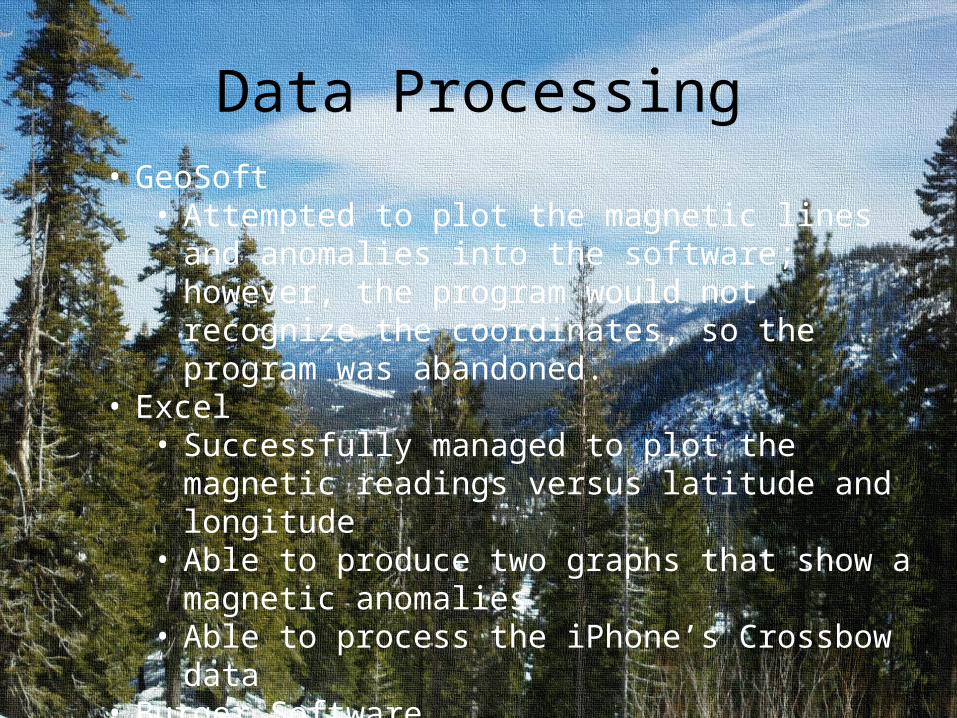
Data Processing• GeoSoft• Attempted to plot the magnetic lines and anomalies into
the software; however, the program would not recognize the coordinates, so the program was abandoned.
• Excel• Successfully managed to plot the magnetic readings versus
latitude and longitude• Able to produce two graphs that show a magnetic
anomalies• Able to process the iPhone’s Crossbow data
• Burger Software• Able to successfully plot the magnetic anomalies shapes to
the data

Results• Excel plots• Models and Cross sections
(Burger)• Line 1• Line 2• Line 3• Line 4• Line 5
• Crossbow data• GoogleEarth vs. LIDAR
Crossbow Data

GoogleEarth vs. LIDAR

GoogleEarth vs. LIDAR

GoogleEarth vs. LIDAR
Conclusions

Questions?


![Swale View, Myton -on -Swale YO61 2QY - Amazon Web …alto2-live.s3.amazonaws.com/.../Brochure/[0]/utNP-Y0HVU60KEA76JrVOA.pdfSwale View, Myton -on -Swale YO61 2QY An internal inspection](https://img.pdfslide.us/doc/110x75/5e2c53b500f19c45a80b29a4/swale-view-myton-on-swale-yo61-2qy-amazon-web-alto2-lives3-0utnp-y0hvu60kea76jrvoapdf.jpg)