Embed Size (px)
Citation preview
Port competition and network polarization at the East
Asian maritime corridor
This paper is currently in press for publication in Territoire en Mouvement
César DUCRUET1
French National Centre for Scientific Research (CNRS)University of Paris I SorbonneUMR 8504 Géographie-cités13 rue du FourF-75006 Paris, FranceTel. +33 (0)140-464-007Fax +33(0)140-464-009Email: [email protected]
Sung-Woo LEE
Korea Maritime Institute (KMI)Logistics and Port Research DepartmentSangam-dong, Mapo-guSeoul, KoreaTel: (822) 2105 2830Fax: (822) 2105 2839Email: [email protected]
Adolf Koi Yu NG
The Hong Kong Polytechnic UniversityFaculty of BusinessDepartment of Logistics and Maritime StudiesHung Hom, Kowloon, Hong Kong, ChinaTel: +852 3400 3625Fax: +852 2330 2704Email: [email protected]
1 Corresponding author
1
Port competition and network polarization at the East
Asian maritime corridor
Abstract
Port competition is often analyzed based on individual characteristics of seaports rather
than inter-port connections. A maritime network perspective is applied to the circulation of
liner vessels between East Asian ports in order to reveal their relative position in 1996 and
2006. Main results confirm the progress of secondary ports over their major competitors,
reflecting the importance of local port policies. However, the overall structure of the
regional network tends to remain polarized by few major hub ports resisting to internal and
external threats.
Key Words: Asia, Centrality, Hub port, Liner shipping, Network analysis, Nodal region
Concurrence portuaire et polarisation réticulaire au sein
du corridor maritime d’Asie orientale
Résumé
L’analyse de la concurrence portuaire se base souvent sur les caractéristiques individuelles
des ports plutôt que sur les connections interportuaires. L’analyse réseau de la circulation
des porte-conteneurs entre les ports d’Asie orientale permet de révéler leur position relative
en 1996 et 2006. Les résultats confirment la montée de ports secondaires face à leurs
concurrents principaux, reflétant par là l’importance des politiques portuaires locales.
Cependant, la structure d’ensemble du réseau régional reste polarisée par quelques hubs
majeurs parvenant à surmonter leurs difficultés internes et externes.
Mots-clés : Analyse de réseau, Asie, Centralité, Lignes régulières, Port hub, Région nodale
2

1. INTRODUCTION
Traditionally in port geography, port development has been approached under two
main perspectives, maritime and continental. Scholars have thus put more emphasis on
hinterland connections (Van Klink, 1998) while others have insisted on the importance of
maritime forelands (Marcadon, 1988). These two dimensions were initially assembled by
Vigarié (1979) in his concept of “port triptych” where the foreland, the hinterland, and the
port itself altogether constitute a spatial system on its own. More recently, the explanatory
power of such concept has been criticized due to changing distribution patterns and the
unprecedented importance of global firms in port selection and competition, calling for
renewed frameworks referring to value chains and integrated networks (Robinson, 2002).
However, despite such conceptual moves, the analysis of port competition remains largely
specialized on one aspect only of the port triptych. Furthermore, maritime forelands and
shipping networks in general have received far less attention than land-based transport
systems, of which hinterlands and ports themselves. Scholars often provide a simplified
picture of maritime linkages among seaports showing port traffic and main shipping
corridors.
This paper wishes exploring port competition through a maritime network
perspective. It proposes a systematic comparison of the relative situation of ports within a
given regional network. The case of East Asia is proposed because this region offers
particular interest for the study of maritime dynamics compared with Europe or North
America, where continental hinterlands are the key influence in port competition (Lee et
al., 2008). While such issues are well documented by recent research on East Asia as a
whole (Taillard, 2004; Gipouloux, 2009), and on regional port dynamics more specifically
(Yap et al., 2006), this area has never been formally analyzed through this methodology.
This is surprising, given the widely accepted importance of the “East Asian maritime
corridor”, which is one of the world’s few maritime-based geographical entities. By
looking at the relative attributes of ports in the regional network, we expect to verify the
existence of this corridor and to assess how this structure has evolved in the recent decade.
Rapid port growth and fierce competition over transhipment activities may have modified
the pattern to a certain extent that is difficult to reveal solely based on official port
statistics. Notably, the current challenges faced by East Asia’s main hub ports such as
Singapore, Hong Kong, Kaohsiung (Taiwan), and Busan (South Korea) are believed to
have put in question their supremacy over their emerging competitors within and outside
3
national boundaries. The extent to which internal (e.g. congestion, rising costs, lack of
space for further expansion) and external threats (i.e. competition) truly resulted in a
different network hierarchy is worth analyzing and has not yet been demonstrated.
The remainder of this paper is organized as follows. Section 2 reviews recent
literature on port competition, insisting on the rarity of – and potential for – conventional
network analysis applied to maritime networks using data on vessel movements. Main
results in section 3 relate changes in network structure and ports’ centrality (1996-2006)
with observations obtained from recent literature and field work. The last section 4
concludes about the implications of the results for port policy and further analysis of
maritime networks.
2. METHODOLOGY FOR A MARITIME NETWORK ANALYSIS
2.1 PORT COMPETITION FROM A MARITIME NETWORK PERSPECTIVE
Port competition can be approached through a variety of issues, such as concession
granting, diversion and concentration of port traffic, investment in port infrastructure, and
subsidisation of hinterland connections (Huybrecht et al., 2002). While it is beyond the
scope of this paper to review exhaustively each of those aspects, one may refer to several
recent efforts towards a synthesis of available indicators and operational concepts. For
instance in Europe, Joly and Martell (2003) offered a comparison based on infrastructure
characteristics, Ducruet and Van der Horst (2009) proposed measuring a level of transport
integration. Concentration dynamics within port systems are often studied using total
throughput (see Ducruet et al., 2009a for a synthesis). The analysis of hinterlands is more
complex due to the intermingling of interested parties locally as in Rotterdam (Van der
Horst and De Langen, 2008), and because port-related traffic on the land leg is difficult to
access (Debrie and Guerrero, 2008). Throughout the literature on the attractiveness of ports
in the selection process, a debate goes on about the respective importance of quantitative
factors (e.g. monetary cost and time) and qualitative factors (e.g. location and overall
service quality), as seen in the studies of Ng (2006, 2009) on European ports, Song and
Yeo (2005), Chang et al. (2008), and Tongzon (2009) on Asian ports.
Maritime forelands and networks have been rarely studied as systematically as
other transport systems. Although competition is a relative process by which ports aim at
capturing traffic within a given region, the patterns of inter-port relations are not well-
4
known and most research relies on individual characteristics. The analysis of maritime
dynamics often remains limited to the application of concentration indexes (Notteboom,
2006) and shift-share analysis (Lee and Kim, 2009) on port traffic statistics. Geographers
provide either theoretical explorations about the emergence of hub ports (Fleming and
Hayuth, 1994) or case studies of individual ocean carriers such as the respective networks
of Maersk (Frémont, 2007) and Coscon (Rimmer and Comtois, 2005). This paper is closer
to former studies of maritime networks on a regional level, such as the ones on the
Caribbean (McCalla, 2008) and the Mediterranean (Cisic et al., 2007), which are based on
the services offered by main ocean carriers. It takes also inspiration from the pioneering
work of Joly (1999) who used vessel movement data to describe the structure of the global
maritime network. Such methodology can be improved and applied to East Asia, which has
been relatively ignored under such perspective, despite recent endeavour proposing
measures of port connectivity (Low et al., 2009).
2.2 TRACKING THE CIRCULATION OF VESSELS
Inter-port vessel movements are used in order to analyze the relative situation of
seaports within a given network. Data was purchased from Lloyd’s Marine Intelligence
Unit (LMIU), a world leader in shipping intelligence and information whose global
database covers approximately 98% of the world fleet of containerships. Original data is
presented through daily movements with ports of call, date of call, and capacity of the
vessel, among other2. Two important aspects can be obtained from such methodology:
individual attributes of performance and centrality, and general attributes that relate to the
structure of the whole network, in terms of connectivity and polarization. Some important
aspects of data preparation and aggregation should be specified before going further.
First, the geographical limits of the study area were arbitrarily defined as a region
extending from Far-East Russia to Indonesia including Japan, South Korea, China, Taiwan,
Philippines, Malaysia, Singapore, Brunei, Vietnam, Thailand, and Cambodia. Close
partners or members of the ASEAN or Asia-Pacific area such as Australia, New Zealand,
Papua New Guinea, Pacific Islands and the Americas were excluded so as to restrain the
study to Asian countries.
2 Other information such as flag, year of build, operating company has not been used in this paper but they represent important research potential for further research. Possible outcomes from an application to North Korea’s maritime connections are proposed by Ducruet, Roussin and Jo (2009b) at: http://www.ejri.net/board/bbs/board.php?bo_table=journal_02&wr_id=25
5
Second, vessel movements were aggregated from daily to yearly flows by summing
the capacity of each vessel call by inter-port link and by port after one year of circulation,
for both 1996 and 2006. This allows for avoiding the influence of seasonal effects on the
overall structure of the network. In addition, official port statistics often refer to yearly
throughput figures, which may be compared with our new indicators.
Third, all types of services were aggregated in terms of function (e.g. hub-and-
spoke, line-bundling) or scale (e.g. local, intra-Asian, round-the-world). Not only such
information is not explicit in the original data, but also we believe that the hypothesized
“corridor” structure emerges from the intermingling of all those services. Isolating specific
services or carriers would, therefore, be in contradiction with the search for a general
spatial configuration or morphology.
Fourth, we wish to analyze inter-port relations through two different perspectives:
direct and indirect relations. Direct relations simply follow successive port calls from the
circulation pattern of the vessels, while indirect relations include couples of ports which
have not been directly connected, what is a specificity of liner shipping with intermediate
calls and loops3. Those are two different ways to look at the structure of a given network,
the latter (indirect links) being more industry-specific than the first. Figure 1 provides a
simplified view about data preparation:
from the vast complexity of liner services passing through seaports, we build a
graph based on direct connections or based on all connections (direct and indirect)
realized by vessels, condensing their circulation patterns after one year of daily
movements;
all individual graphs are merged into one single graph from which new port-related
indicators can be obtained, such as maritime degree (i.e. number of connections)
and betweenness centrality (i.e. number of positions on possible shortest paths).
Result may vary according to the inclusion or exclusion of indirect connections.
As seen in Table 1, the complete graph is denser than the graph of direct
connections, and the observed connectivity is higher for the complete graph as it is more
3 For instance, a vessel calling successively at Busan, Yokohama, and Shanghai creates two direct links (Busan-Yokohama and Yokohama-Shanghai) but also one indirect link (Busan-Shanghai). Thus, the analysis of indirect links includes all possible connections realized by the vessels regardless of the order of the calls.
6
complex4. In both graphs, the connectivity has increased, what supports the idea that
competition may have modified the structure of the network in favour of emerging ports.
Lastly, the complete graph will be analyzed according to the “nodal flow”
methodology (Nystuen and Dacey, 1961) in order to better observe polarization and
interdependencies among East Asian ports. This approach that was widely applied to a
large number of networks5 takes into consideration the valuation of edges (i.e. connections)
between the ports after the summation of vessel capacities. Within the complete
connections (direct and indirect) of a given port, it only retains the one with the highest
traffic flow. This dominant connection is thus the highest traffic share of each port with
another port.6 Of course, other thresholds may extend to the second and/or third nodal
flows, but this paper opts for simplicity because such research in the maritime field is only
at its eve.
[INSERT FIGURE 1 ABOUT HERE]
[INSERT TABLE 1 ABOUT HERE]
3. COMPETITION AND POLARIZATION AT EAST ASIAN PORTS
3.1 DIRECT CONNECTIONS
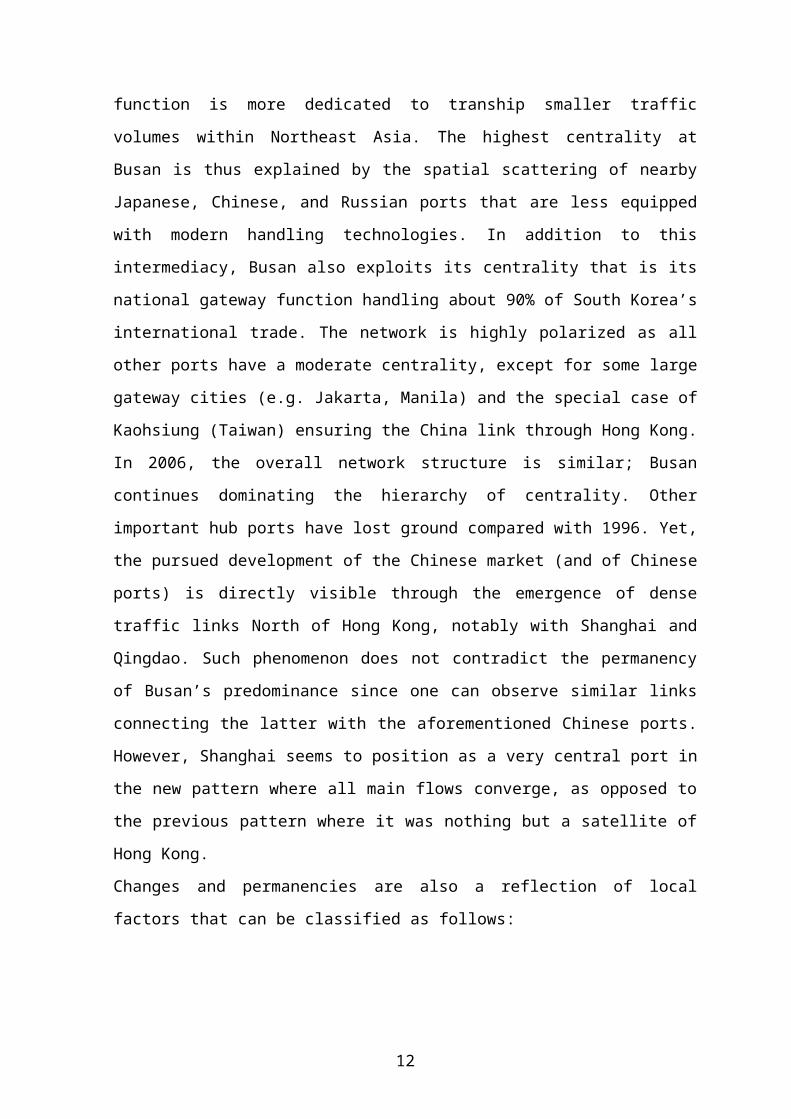
The visualization of direct inter-port connections (Figure 2) highlights the very
strong position of three main ports, namely Busan, Hong Kong, and Singapore. This
confirms the usual rank of these ports based on official statistics of container traffic
volume. In 1996, the corridor is heavily concentrated between Singapore and Hong Kong,
while Busan’s function is more dedicated to tranship smaller traffic volumes within
Northeast Asia. The highest centrality at Busan is thus explained by the spatial scattering
of nearby Japanese, Chinese, and Russian ports that are less equipped with modern
handling technologies. In addition to this intermediacy, Busan also exploits its centrality
that is its national gateway function handling about 90% of South Korea’s international
trade. The network is highly polarized as all other ports have a moderate centrality, except
for some large gateway cities (e.g. Jakarta, Manila) and the special case of Kaohsiung 4 Measures were obtained from TULIP software: http://tulip.labri.fr/5 See for instance Cattan (2004) and Grubesic et al. (2008) for applications on airline networks. 6 The concept of “hub dependence” (i.e. level of dependence of a port upon another port within a given region) based on this nodal flow could have revealed how North Korean ports have gradually become “hub dependent” upon South Korean ports at a time of humanitarian support and acute crisis (Ducruet, 2008).
7

(Taiwan) ensuring the China link through Hong Kong. In 2006, the overall network
structure is similar; Busan continues dominating the hierarchy of centrality. Other
important hub ports have lost ground compared with 1996. Yet, the pursued development
of the Chinese market (and of Chinese ports) is directly visible through the emergence of
dense traffic links North of Hong Kong, notably with Shanghai and Qingdao. Such
phenomenon does not contradict the permanency of Busan’s predominance since one can
observe similar links connecting the latter with the aforementioned Chinese ports.
However, Shanghai seems to position as a very central port in the new pattern where all
main flows converge, as opposed to the previous pattern where it was nothing but a
satellite of Hong Kong.
Changes and permanencies are also a reflection of local factors that can be classified as
follows:
Stability and stagnation of traditional main ports: most of centrally located ports in
1996 have enjoyed lower growth on average. This is particularly true for Japanese
ports (e.g. Yokohama, Kobe, Nagoya, and Moji) and for the port gateways of some
giant cities such as Keelung (Taipei), Manila, and Bangkok. Those are the only
ones to see their centrality lower in 2006 than in 1996, especially Bangkok with
25% decrease. For Japanese ports, this trend may come less from rising handling
costs than from the extended influence of Busan and Shanghai over Japanese ports
in the network. This is accelerated by the government’s environmental policy
favouring short-sea shipping with those hubs rather than trucking, while avoiding
the development of new modern infrastructure close to urban areas (Shinohara,
2009). For Southeast port cities, location within dense urban environments and
congestion are among prime factors behind relative decline of their position
regionally (Ducruet and Lee, 2006). Other top ports such as Busan, Hong Kong and
Singapore have kept their position. The relative permanency of the corridor
structure (i.e. the Singapore-Busan axis) may be explained by efficient planning
policies locally, which allowed these main ports sustaining their predominance over
neighbouring ports despite efforts in the latter to become more competitive (Lee
and Ducruet, 2009). Despite recent studies showing the retreat of Hong Kong from
its hub function towards a more diversified gateway or global city function
(Cullinane et al., 2004; Wang, 2009), this port seems to have overcome local
constraints and regional competition from Shenzhen.
8

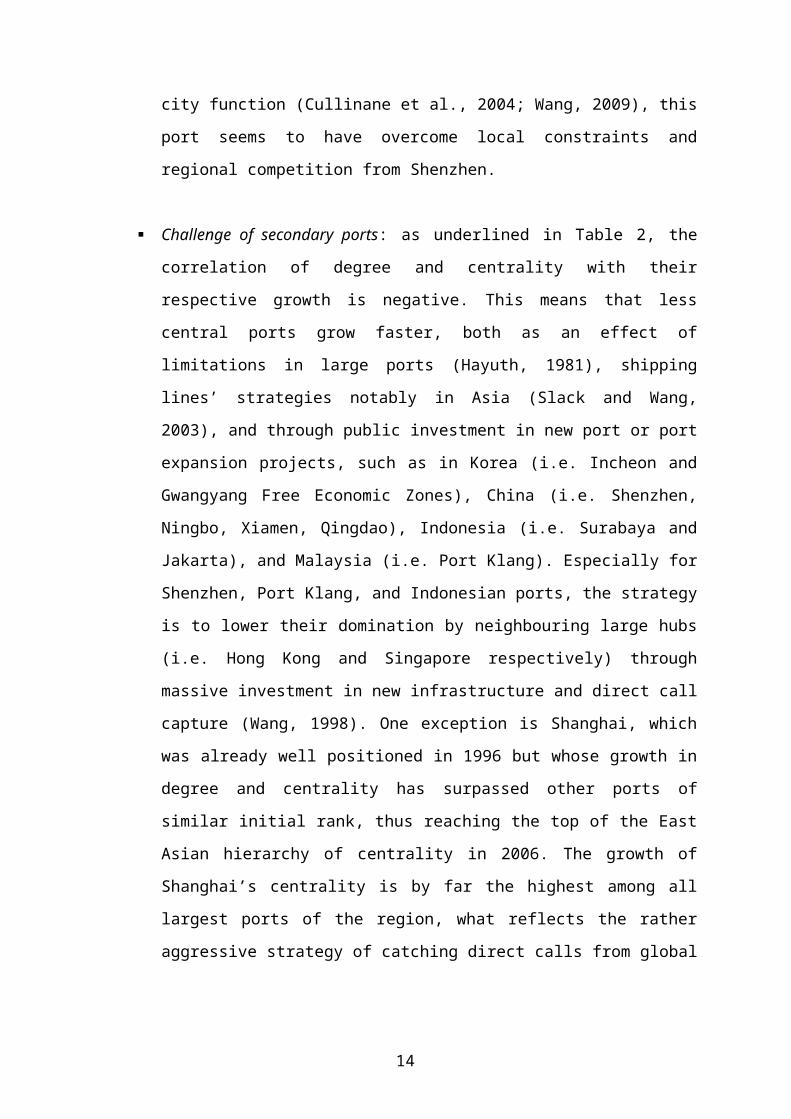
Challenge of secondary ports: as underlined in Table 2, the correlation of degree
and centrality with their respective growth is negative. This means that less central
ports grow faster, both as an effect of limitations in large ports (Hayuth, 1981),
shipping lines’ strategies notably in Asia (Slack and Wang, 2003), and through
public investment in new port or port expansion projects, such as in Korea (i.e.
Incheon and Gwangyang Free Economic Zones), China (i.e. Shenzhen, Ningbo,
Xiamen, Qingdao), Indonesia (i.e. Surabaya and Jakarta), and Malaysia (i.e. Port
Klang). Especially for Shenzhen, Port Klang, and Indonesian ports, the strategy is
to lower their domination by neighbouring large hubs (i.e. Hong Kong and
Singapore respectively) through massive investment in new infrastructure and
direct call capture (Wang, 1998). One exception is Shanghai, which was already
well positioned in 1996 but whose growth in degree and centrality has surpassed
other ports of similar initial rank, thus reaching the top of the East Asian hierarchy
of centrality in 2006. The growth of Shanghai’s centrality is by far the highest
among all largest ports of the region, what reflects the rather aggressive strategy of
catching direct calls from global shipping lines and liner alliances (Wang and
Slack, 2004).
From such analysis we can conclude that the network attributes of East Asian ports
clearly confirm current dynamics of port development and competition in this region where
drastic changes has occurred during the 1990s and early 2000s. Established main ports
have managed keeping their relative position despite local and regional threats, while the
network has become denser at the advantage of rapidly growing ports that capture an
increasing market share.
[INSERT FIGURE 2 ABOUT HERE]
[INSERT TABLE 2 ABOUT HERE]
3.2 THE COMPLETE GRAPH
Despite satisfactory results from the previous analysis, we wish to look at the
network through another perspective by adding indirect connections. We see in Figure 3
9
some interesting deviation from the graph of direct connections. By taking into account the
complexity of liner shipping (i.e. intermediate port calls) this methodology reveals another
dimension of the East Asian port hierarchy. In 1996, Hong Kong is now the most central
port (compared with Busan in the previous analysis), followed by Singapore, Busan,
Nagoya and Yokohama. Indeed, Hong Kong has a better position than Busan when
including indirect connections because it combines hub functions with a commercial
gateway function for South China. Main Japanese ports are also better represented in the
complete graph due to their gateway function serving large urban areas. In 2006, the
impact of local port development in Indonesia is more visible, notably through the
strikingly high centrality of Surabaya. This may be explained by rapid growth in inter-
island shipping within East Indonesia for which Tanjung Perak (Surabaya) is the main hub,
based on ambitious local development of port terminals and industrial districts (Ports and
Harbors, 2004). Jakarta as well has invested in upgrading local port infrastructure and free-
zone development at Tanjung Priok port in order to lower its dependence upon the
Singapore hub (Ghani, 2006). Singapore has surpassed Hong Kong as the most central port
of the region, but its Malaysian competitor Port Klang has gained grounds in the hierarchy.
Although Shanghai has reached a high rank as well, before Busan and after Hong Kong,
Northeast Asian ports seem to have a far less important position than Southeast Asian
ports. This would indicate that the Southeast sub-region has remained polarized by few
main hubs while the Northeast sub-region has become more evenly distributed with the
growth of Chinese ports.
The evolution of individual attributes presented in Table 3 shows comparable
trends with the ones observed at the graph of direct connections: less central ports in 1996
have higher growth (of both degree and centrality scores) on average, with the exception of
Shanghai as a large fast-growing port. Such ports are mostly Chinese ports (e.g. Tianjin,
Qingdao, Dalian, Shenzhen, Ningbo, and Xiamen), but also Incheon and Port Klang.
Manila, Bangkok, and large Japanese ports have seen their centrality decreasing despite the
overall increase in network connectivity between 1996 and 2006. Established hubs such as
Hong Kong, Singapore, Busan, and Taiwanese ports have a stable position with low-paced
growth.
[INSERT FIGURE 3 ABOUT HERE]
[INSERT TABLE 3 ABOUT HERE]
10
3.3 THE NODAL FLOW GRAPH
One last analytical step aims at revealing the relative position of East Asian ports
by simplifying the complete graph through the “nodal flow” methodology. This
methodology must complement previous analytical steps by revealing the extent and
spatial reach of ports’ polarization in the network. Results for all ports are presented in
Figure 4, while Figures 5a and 5b zoom on specific ports.
The graph of nodal flows brings out interesting evidence that does not entirely
match previous results. The overall structure is in accordance with the fact that three main
ports (i.e. Busan, Hong Kong, and Singapore) are the cores of the network at both years. A
more scrutinized observation reveals that conversely to previous analysis, the structure has
remained very stable over time: the three major hubs alone polarize the entire region
without being threatened by important newcomers. Hong Kong is the dominant node of the
network, probably due to its central position between Northeast and Southeast Asian
regions. Zooming on the main hub’s nodal regions provides more clues about their
geographic coverage.
[INSERT FIGURE 4 ABOUT HERE]
In 1996, Busan polarizes mostly second-order Japanese ports located in the Western
regions (Figure 5a), together with Far-East Russian ports; Singapore exerts its centrality
upon Southeast Asian ports, and the rest (of which China, Japan, and Taiwan) is under the
dominance of Hong Kong, except from some large gateways. Hong Kong remains the key
node of the entire network: his position as bridge between Northeast and Southeast Asia is
still very clearly apparent and this is not being challenged by any other ports. In 2006, this
same structure is also apparent, but some noticeable changes can be underlined:
South Korea: Busan has extended and diversified its “tributary area” by including
more many ports and notably more Chinese ports such as Yantai, Weihai, and
Tianjin in North China, while Qingdao possesses its own tributary area. This is the
11
result of a very efficient planning policy aiming at relieving congestion locally
while maintaining Busan’s attractiveness through Busan New Port and Free
Economic Zone construction in the early 2000s in a context of a wider strategy for
South Korea to become Northeast Asia’s logistics hub (Frémont and Ducruet,
2005). Busan port authority is currently planning to open its new container terminal
at the Russian port of Nakhodka for maintaining and extending its regional
influence (KMI, 2008). This is also backed by a number of incentive strategies such
as mileage, tariff discount, exemption of port dues and so on. The case of Incheon
is also explained by strong government involvement in upgrading and extending
local port facilities through the “Pentaport project” including a new container
terminal since 2004, aiming at making Incheon the hub of the Yellow Sea (Ducruet,
2007);
Indonesia and Malaysia: Surabaya and Port Klang have increased their position to
a great extent (cf. Figure 5b). Although they remain dominated by Singapore, they
now polarize their respective Indonesian and Malaysian sub-regions. This new
position is thus explained by the reception of more direct calls and by the shift of
some local ports from Singapore’s influence under their own influence.
Surprisingly, Port Klang, not Tanjung Pelepas, has extended its polarization. This is
somewhat counterintuitive given the shift of Maersk and Evergreen from Singapore
to Tanjung Pelepas in 2000. Port Klang has developed through government
incentive as Malaysia’s main gateway port while Singapore has improved its
customer-friendly policy to maintain and attract shipping lines (Lee and Ducruet,
2009);
China: Shanghai’s tributary area has also diversified from only Chinese ports in
1996 to a mixture of Japanese, Chinese, Yellow Sea Korean ports, and Russian
ports in 2006, but the width of its polarization has not much increased in terms of
the number of ports (i.e. from 6 to 9 dominant connections), notably compared with
the wide extension of the tributary areas of Surabaya and Port Klang as previously
observed. It remains polarized by Hong Kong as a secondary pole in the East Asian
network. This is rather surprising given the ambition of Shanghai playing a key role
in producer services (i.e. global city strategy) and in traffic concentration and
distribution through the opening of Yangshan port (i.e. hub function strategy).
Perhaps, the grand strategy of developing an international shipping centre
12

supported by central and local governments is not yet achieved sufficiently at the
time of the study, due to the expected completion of the Yangshan project in 20107,
as Shanghai has developed primarily as a gateway port for the Yangtze corridor
rather than as a hub port for transhipment. Still, Shanghai polarizes more many
ports than Shenzhen, which is supposed to have become Hong Kong’s rival since
the late 1990s. Just like Shanghai, Shenzhen is mostly a gateway port serving its
local and regional hinterlands with no clear ambition to exert hub function over
neighbouring ports. Competition with Hong Kong is thus landward rather than
seaward, what explains the relatively low position of Shenzhen in the figures;
Taiwan: Kaohsiung and Keelung have faced the stagnation of their traffic in the
2000s due to the underestimation of Chinese port growth, as reflected in the
reduction of the number of weekly calls between 1997 and 2002 at Kaohsiung for
instance (Tai and Hwang, 2005), what is also an effect of industrial relocations
from Taiwan dragon to China. This has motivated the promotion by the
government of a metropolitan new port project since early 2009: two container
terminals opened at Taipei-Keelung to support the global city’s trading needs,
resulting in less cargo flows at Kaohsiung as an effect of domestic competition.
Kaohsiung lost 11% of container cargoes in February 2009, the biggest lost after its
opening, while major shipping lines such as Evergreen, Yangming and Wanhai
may shift fro Kaohsiung to Taipei (Cargonews Korea, 2009).
[INSERT FIGURES 5a and 5b ABOUT HERE]
4. CONCLUSION
This paper has tackled the difficulty analyzing port competition within a given
regional area through relative rather than individual measures of performance. Our results
show that several secondary ports have strived for competitiveness and survival through
direct competition with dominant hubs. This competition is notably based on the
geographical diversification of their connections through the extension of their market
7 The first phase commenced operations in 2004 (+ 2.2 million TEUs), the second phase was opened in December 2006 (72 hectares and 15 quay cranes), while the third and last phase should be realized from 2007 to 2012 resulting in a total of 15 million TEUs and 30 container berths.
13
coverage. The above changes indicate certain implications: when making port choices,
liners take the maintenance of market coverage and frequency of services as important
factors of consideration, while allowing certain diversities and flexibilities within niche
areas, depending on changing trade patterns and new opportunities. Last results show the
permanency of main ports located on main trunk lines as they maintain their predominance
over transhipment activities as opposed to local or feeder ports. In addition, local policies
of main ports succeeded keeping and extending their position in spite of strong external
and internal threats. While the tremendous growth in traffic volume at Chinese ports under
the period of study is reflected in the overall increase of their position in the network, our
results provide an alternative viewpoint that is the permanency of the dominance of
established hub ports along the East Asian maritime corridor. This research suggests that
the position of ports in the liner network is mostly a reflection of the impact of local port
policies (e.g. technological advance, infrastructure expansion) rather than the sole result of
shipping lines’ strategies. Despite the growing spatial freedom of liner networks as
depicted in a vast literature, shipping lines remain highly dependent upon local factors.
In terms of methodology, this paper has compared results from three approaches:
direct links, complete links, and nodal flows. Results obtained from direct links tend to
corroborate well-known port rankings based on official port statistics. The inclusion of
indirect links, which is believed to better match the reality of shipping, provides slightly
different results valuing not only hub functions but also trade functions. Finally, the search
for nodal regions in the East Asian maritime network brings out a clear picture of the
geographic extent and evolution of the influence of main ports and emerging ports,
reflecting upon current strategies and obstacles. More efforts are needed to improve such
results, notably by searching for a relationship between network position and more
classical measures of port performance, such as traffic volume and infrastructure
efficiency, and by comparing our results with more qualitative aspects of nowadays’ port
development. In addition, updating the data would allow evaluating the impact of current
port development projects.
REFERENCES
Cargonews Korea (2009) March 25, www.cargonews.co.kr
14

Cattan, N. (2004) Le monde au prisme des réseaux aériens, Flux 58(4): 32-43.
Chang, Y.T., Lee, S.Y. and Tongzon, J.L. (2008): ‘Port selection factors by shipping lines: different perspectives between trunk liners and feeder service providers’. Marine Policy, 32(6): 877-885.
Cisic, D., Komadina, P. and Hlaca, B. (2007) Network analysis applied to Mediterranean liner transport system. Paper presented at the International Association of Maritime Economists Conference, Athens, Greece, July 4-6.
Cullinane, K., Fei, W. T. and Cullinane, S. (2004), Container terminal development in Mainland China and its impact on the competitiveness of the port of Hong Kong, Transport Reviews 24: 33-56.
Debrie, J. and Guerrero, D. (2008) (Re)spatialiser la question portuaire : pour une lecture géographique des arrière-pays européens, L’Espace Géographique 37(1) : 45-56.
Ducruet, C. (2007) Incheon. In J.B. Hattendorf (ed.), The Oxford Encyclopedia of Maritime History, Oxford: Oxford University Press.
Ducruet, C. (2008) Hub dependence in constrained economies: the case of North Korea, Maritime Policy and Management 35: 374-388.
Ducruet, C. and Lee, S.W. (2006) Frontline soldiers of globalisation: port-city evolution and regional competition, Geojournal 67(2): 107-122.
Ducruet, C., Roussin, S. and Jo, J.C. (2009a) Going West? Spatial polarization of the North Korean port system, Journal of Transport Geography 17(5): 357-368.
Ducruet, C., Roussin, S. and Jo, J.C. (2009b) Political and economic factors in the evolution of North Korea’s maritime connections, Journal of International Trade and Logistics 7(1): 1-23.
Ducruet, C. and Van der Horst, M. (2009) Transport integration at European ports: measuring the role and position of intermediaries, European Journal of Transport and Infrastructure Research 9(2): 121-142.
Fleming, D.K. and Hayuth, Y. (1994) Spatial characteristics of transportation hubs: centrality and intermediacy, Journal of Transport Geography 2: 3-18.
Frémont, A. (2007) Global maritime networks: the case of Maersk, Journal of Transport Geography 15(6): 431-442.
Frémont, A. and Ducruet, C. (2005) The emergence of a mega-port, the case of Busan, from the local to the global, Tijdschrift voor Econ. En Soc. Geografie 96: 421-432.
Ghani, A. (2006) Jakarta to set up 3 new SEZs to boost investments, The Straits Times, November 7.
Gipouloux, F. (2009) La Méditerranée asiatique. Villes portuaires et réseaux marchands en Chine, au Japon et en Asie du Sud-Est, XVIe-XXIe siècle, Paris: CNRS Éditions.
Grubesic (2008) Global airline networks and nodal regions, Geojournal 71(1): 53-66.
Hayuth, Y. (1981) Containerization and the load center concept, Economic Geography 57(2): 161-176.
Huybrecht, M., Meersman, H., Van de Voorde, E., Van Hooydonk, E., Verbeke, A., Winkelmans, W. (Eds.) (2002) Port competitiveness: an economic and legal analysis of the factors determining the competitiveness of seaports, De Boeck, Antwerpen.
15

Joly, O. (1999) La structuration des réseaux de circulation maritime, Unpublished PhD Dissertation in Territorial Planning, Le Havre: Le Havre University.
Joly, O. and Martell, H. (2003) Infrastructure benchmarks for European container ports, Proceedings of the 4th Inha-Le Havre International Conference, Incheon, Republic of Korea, 147-154.
KMI (2008) Far-East Russian port development, Seoul: Korea Maritime Institute.
Lee, S.W., Ducruet, C. (2009) Spatial glocalization in Asia-Pacific hub port cities: a comparison of Hong Kong and Singapore, Urban Geography 30: 162-184.
Lee, S.W. and Kim, G.S. (2009) Port challenge in Northeast Asia: Korea’s two-hub port strategy, In T.E. Notteboom, C. Ducruet and P.W. De Langen (eds.), Ports in Proximity: Competition and Cooperation among Adjacent Seaports, Aldershot: Ashgate (in press).
Lee, S.W., Song, D.W. and Ducruet, C. (2008) A tale of Asia’s world ports: the spatial evolution in global hub port cities, Geoforum 39: 372-385.
Low, J.M.W., Lam, S.W. and Tang, L.C. (2009) Assessment of hub status among Asian ports from a network perspective, Transportation Research Part A 43(6): 593-606.
Marcadon, J. (1988) L’avant-pays des ports français, Paris: Masson.
McCalla, R. (2008) Container transhipment at Kingston, Jamaica, Journal of Transport Geography 16(3): 182-190.
Ng, K.Y.A. (2006) Assessing the attractiveness of ports in the North European container transhipment market: an agenda for future research in port competition, Maritime Economics and Logistics 8(3): 234-250.
Ng, K.Y.A. (2009) Port Competition: The Case of North Europe, Saarbrücken: VDM Verlag.
Nystuen, J.D. and Dacey, M.F. (1961) A graph theory interpretation of nodal regions, Papers of the Regional Science Association 7: 29-42.
Ports and Harbors (2004) Port of Tanjung Perak - the future plan development project, 49(7): 22-23 (Accessed in French version at: http://news.aivp.org/news.php?article1372).
Rimmer, P.J., Comtois, C. (2005) China's extra and intra-Asian liner shipping connections 1990-2000, Journal of International Logistics and Trade 3: 75-97.
Robinson, R. (2002) Ports as elements in value-driven chain systems: the new paradigm, Maritime Policy and Management 29(3): 241-255.
Shinohara, M. (2009) Port competition paradigms and Japanese port clusters, In T.E. Notteboom, C. Ducruet and P.W. De Langen (eds.), Ports in Proximity: Competition and Cooperation among Adjacent Seaports, Aldershot: Ashgate (in press).
Slack, B. and Wang, J.J. (2003) Port peripheral challenge: an Asian perspective, Geojournal 56(2): 159-166.
Song, D.W and Yeo, K.T (2004) A competitive analysis of Chinese container ports using the analytic hierarchy process, Maritime Economics and Logistics 6: 34-52.
Tai, H.H. and Hwang, C.C. (2005) Analysis of hub port choice for container trunk lines in East Asia, Journal of the Eastern Asia Society for Transportation Studies, Vol. 6, pp. 907-919.
16

Taillard, C. (ed.) (2004) Intégrations régionales en Asie orientale, Paris: Les Indes Savantes.
Tongzon, J.L. (2009) Port choice and freight forwarders, Transportation Research Part E: Logistics and Transportation Review 45(1): 186-195.
Van der Horst, M.R. and De Langen, P.W. (2008) Coordination in hinterland transport chains: a major challenge for the seaport community, Maritime Economics and Logistics 10(1-2): 108-129.
Van Klink, H.A. (1998) The port network as a new stage in port development: the case of Rotterdam, Environment and Planning A 30(1): 143-160.
Vigarié, A. (1979) Ports de commerce et vie littorale, Paris: Hachette.
Wang, J.J. (1998) A container load center with a developing hinterland: A case study of Hong Kong, Journal of Transport Geography 6: 187-201.
Wang, J.J. (2009) Hong Kong in transition from a hub port city to a global supply chain management center, In T.E. Notteboom, C. Ducruet and P.W. De Langen (eds.), Ports in Proximity: Competition and Cooperation among Adjacent Seaports, Aldershot: Ashgate (in press).
Wang, J.J. and Slack, B. (2004) Regional governance of port development in China: a case study of Shanghai International Shipping Center, Maritime Policy and Management 31(4): 357-373.
Yap, W.Y., Lam, J.S.L. and Notteboom, T.E. (2006) Developments in container port competition in East Asia, Transport Reviews 26: 167-188.
17

Figure 1. From vessel circulations to graph building and port hierarchy
18
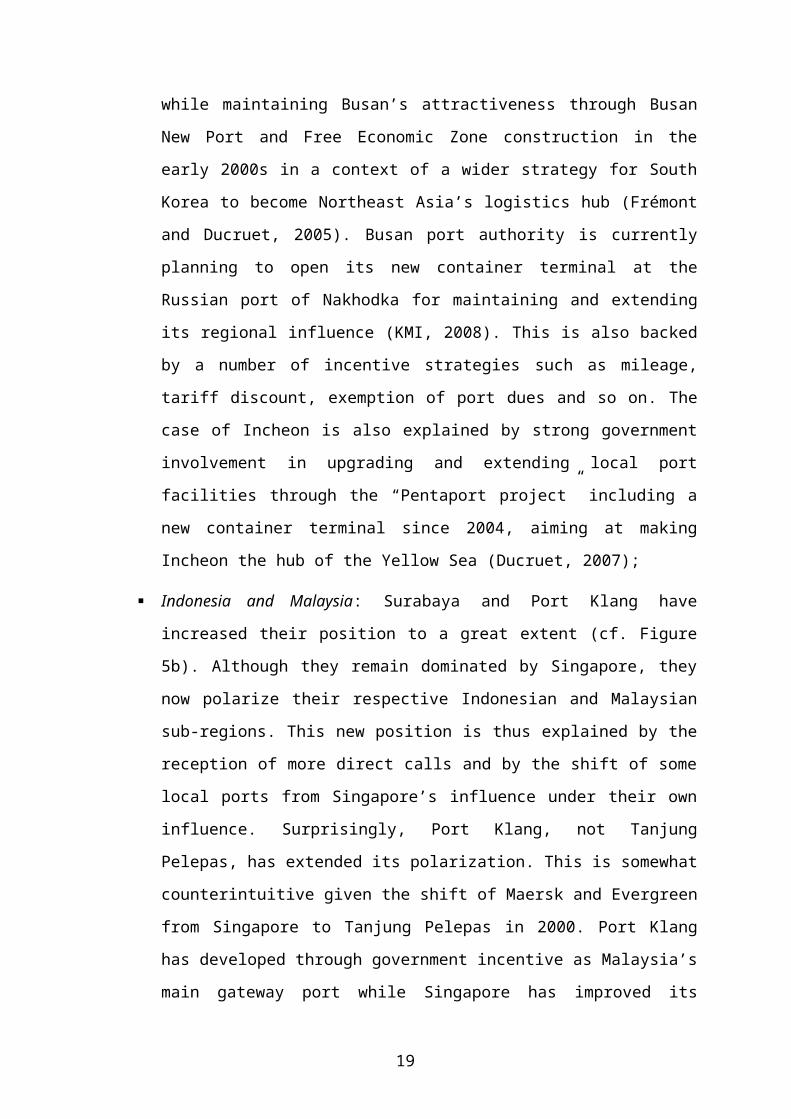
Figure 2. Graph of direct connections among East Asian ports, 1996-2006
Source: realized by authors based on LMIU data
19

Figure 3. Complete graph among East Asian ports, 1996-2006
Source: realized by authors based on LMIU data
N.B. only edges representing over 0.05% of total traffic volume are kept in the figure
20
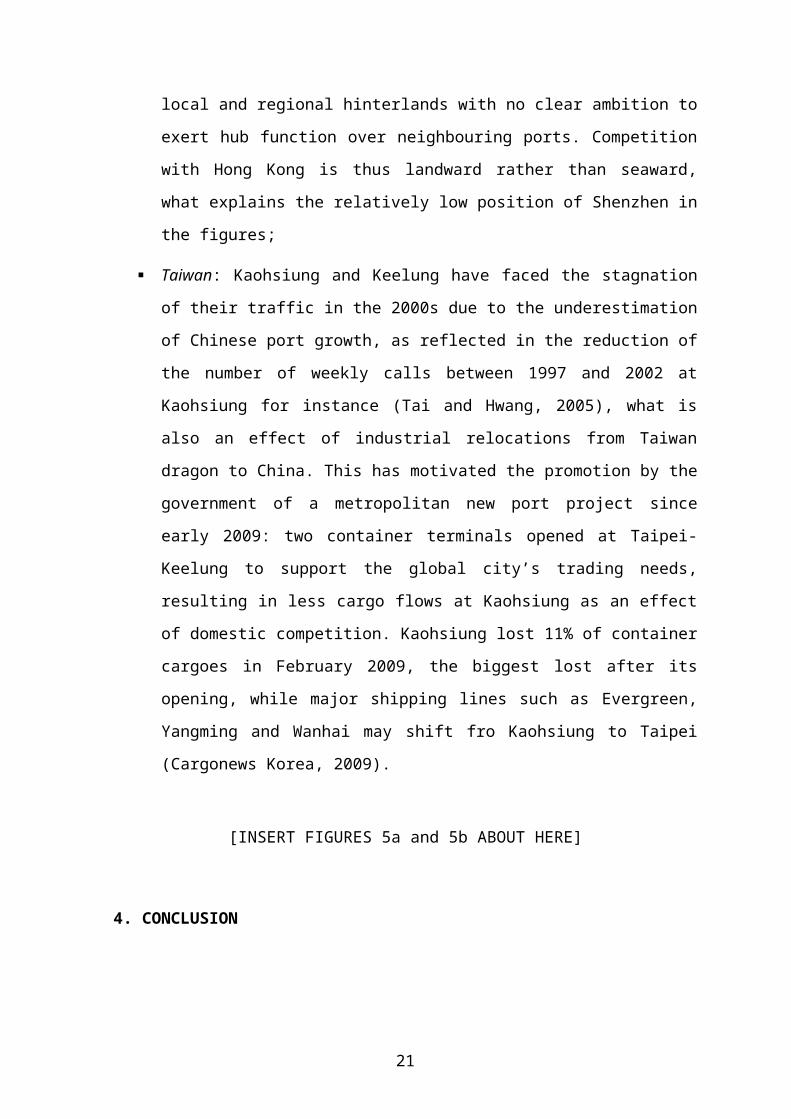
Figure 4. Graph of nodal flows, 1996-2006
Source: realized by authors based on LMIU data
21
Figure 5a. Nodal regions of main East Asian hub ports, 1996-2006
Source: realized by authors based on LMIU data
22
Figure 5b. Nodal regions of emerging East Asian hub ports, 2006
Source: realized by authors based on LMIU data
23

Type Edges Optimal / observed connectivity
1996 2006 1996 2006Direct
connections 996 3,068 36.05 29.04
Complete graph 2,556 6,650 12.75 12.43
Table 1. Characteristics of the East Asian maritime network, 1996-2006
Source: realized by authors based on LMIU data
24
Port name Country code
Maritime degree Betweenness centrality1996 2006 A [log06/
log96] 1996 2006 B [log06/ log96]
25
Busan KOR 89 160 1.13 7,396 11,282 1.05
Singapore SGP 74 133 1.14 7,277 11,284 1.05
Hong Kong CHN 84 159 1.14 6,394 11,200 1.06
Yokohama JPN 63 84 1.07 2,531 2,026 0.97
Shanghai CHN 51 166 1.30 2,520 11,843 1.70
Kobe JPN 61 82 1.07 2,307 1,110 0.91Keelung TWN 52 81 1.11 2,079 1,383 0.95Kaohsiung TWN 56 108 1.16 2,059 3,142 1.06Nagoya JPN 50 81 1.12 1,969 1,128 0.93Moji JPN 39 63 1.13 1,184 566 0.90Tianjin CHN 36 68 1.18 1,067 796 0.96Incheon KOR 30 93 1.33 1,054 2,542 1.13Osaka JPN 46 81 1.15 973 1,464 1.06Ulsan KOR 31 65 1.22 802 827 1.00Port Klang MYS 29 85 1.32 685 3,760 1.26Manila PHL 37 67 1.16 600 946 1.07Bangkok THA 27 44 1.15 574 114 0.75Pasir Gudang MYS 27 54 1.21 527 912 1.09Tokyo JPN 38 81 1.21 485 1,320 1.16Qingdao CHN 25 108 1.45 269 3,206 1.44Hakata JPN 28 72 1.28 259 683 1.17Taichung TWN 25 59 1.27 193 551 1.20Jakarta IDN 16 69 1.53 180 5,278 1.65Laem Chabang THA 22 65 1.35 94 681 1.44Surabaya IDN 13 63 1.62 77 8,582 2.09Dalian CHN 21 87 1.47 66 1,491 1.74Xiamen CHN 20 81 1.47 39 1,737 2.04Ningbo CHN 15 102 1.71 28 2,412 2.34Shenzhen CHN 17 84 1.56 31 1,706 2.17Gwangyang KOR 3 91 4.11 2 1,281 10.32
Average growth 1.37 1.54R² with growth 0.80 0.68
Table 2. Network attributes of main East Asian ports, 1996-2006 (direct connections)
Source: realized by authors based on LMIU data
N.B. growth values higher than average are in bold
Port name Countrycode
Maritime degree Betweenness centrality1996 2006 A [log06/
log96] 1996 2006 B [log06/log96]
26

Hong Kong CHN 144 207 1.07 4,428 5,230 1.02Singapore SGP 120 187 1.09 3,065 6,919 1.10Busan KOR 124 203 1.10 2,179 4,535 1.10Nagoya JPN 124 145 1.03 2,061 1,090 0.92Yokohama JPN 127 143 1.02 1,995 1,145 0.93Kobe JPN 117 159 1.06 1,559 1,557 1.00Shanghai CHN 92 210 1.18 1,189 5,016 1.20Kaohsiung TWN 103 155 1.09 1,173 1,462 1.03Tokyo JPN 106 146 1.07 986 1,227 1.03Keelung TWN 97 136 1.07 900 1,001 1.02Osaka JPN 97 162 1.11 866 1,586 1.09Port Klang MYS 80 154 1.15 685 3,154 1.23Moji JPN 87 111 1.05 644 407 0.93Bangkok THA 76 102 1.07 536 436 0.97Incheon KOR 77 157 1.16 516 1,473 1.17Penang MYS 69 93 1.07 473 609 1.04Tianjin CHN 67 157 1.20 471 1,456 1.18Manila PHL 69 94 1.07 435 290 0.93Laem Chabang THA 67 111 1.12 389 639 1.08Qingdao CHN 73 172 1.20 382 2,165 1.29Hakata JPN 74 137 1.14 288 727 1.16Dalian CHN 59 154 1.24 240 1,472 1.33Surabaya IDN 54 120 1.20 230 6,710 1.62Jakarta IDN 55 116 1.19 200 3,196 1.52Shenzhen CHN 45 156 1.33 122 1,970 1.58Ningbo CHN 46 158 1.32 93 1,803 1.65Xiamen CHN 40 155 1.37 58 1,814 1.85Gwangyang KOR - 151 - - 1,196 -
Average growth 1.14 1.18R² with growth 0.69 0.62
Table 3. Network attributes of main East Asian ports, 1996-2006 (complete graph)
Source: realized by authors based on LMIU data
N.B. growth values higher than average are in bold
27