Embed Size (px)
Citation preview

Chapter II The State of Human Development in Southeast Asia
Human development goes beyond the standard notion of economic development that has come to be synonymous with growth in real per capita income. It includes dimensions such as knowledge and longevity that reflect non-material aspects of the quality of life. This chapter examines the progress of Southeast Asian countries based on a standard set of human development indicators. The report also analyzes indicators related to good governance with the view that this area has a significant impact on human development. The disparities among countries in the region across these indicators are likewise examined, along with the correlation between these indicators, in the context of understanding the relationship between human development and good governance in Southeast Asia. An understanding of the factors that affect the pattern of human development in the region would be a useful input into regional economic integration and regional cooperation arrangements. Policy interventions at the regional level could definitely exert a beneficial impact on human development. For example, countries could exchange information on best practices in terms of government regulation or provision of public goods. This would help accelerate economic growth thereby improving the environment for the enhancement of human development. A. Southeast Asia in the Context of East Asia It is useful to view the disparities among the ten Southeast Asian countries in the larger context of the East Asia region, which includes China, Japan, and Korea. Taken together as the East Asian 13 (ASEAN plus 3), the difference in mean values across six human development indicators among these countries is shown in Tables II.1 and II.2. The larger variation is recorded in per capita GDP (PPP$), per capita health expenditures, and education-related indexes. Cambodia, Myanmar, and Lao PDR are clearly lagging behind the rest of East Asia. Table II.2 shows that the thirteen East Asian countries have higher coefficients of variation for per capita GDP (PPP$) and per capita health expenditures at 98 percent and 127 percent, respectively. Public expenditure on education also has a relatively high coefficient of variation at 46 percent and 48 percent for the years 1990 and 1998-2000 respectively. The disparity is relatively high compared to similar regional groupings in Europe and Latin America (see Appendix for complete data). In terms of per capita GDP (PPP$), the disparity between the high HDI and medium HDI countries in East Asia is also very large. Specifically, Japan, South Korea, Singapore, and Brunei’s combined average per capita GDP (PPP$) is five times more than the combined average of China, Indonesia, Malaysia, the Philippines, Thailand, and Viet Nam and roughly thirteen times more than those of Cambodia, Myanmar and Lao PDR.
12

Table II.1 Human Development Indicators for the East Asia 13
HDI Life
Expectancy at birth
Education Index
GDP per
capita (PPP$)
Public Expenditure on Education (% of GDP)
Per Capita Health
Expenditure GDI
Countries 1990 2001 2001 2001 2001 1990 1998-
2000 2000 2001
Singapore 0.819 0.884 77.8 0.87 22680 -- 3.7 913 0.880 Brunei -- 0.872 76.1 0.89 19210 -- 4.8 618 0.867 Malaysia 0.720 0.79 72.8 0.83 8750 5.2 6.2 310 0.780 Thailand 0.705 0.768 68.9 0.88 6400 3.5 5.4 237 0.766 Philippines 0.713 0.751 69.5 0.90 3840 2.9 4.2 167 0.748 Viet Nam 0.603 0.688 68.6 0.83 2070 -- -- 130 0.687 Indonesia 0.619 0.682 66.2 0.80 2940 1.0 -- 84 0.677 Cambodia 0.512 0.556 57.4 0.64 1860 -- 1.9 97 0.551 Myanmar -- 0.549 57.0 0.72 1027 -- 0.5 24 -- Lao PDR 0.449 0.525 53.9 0.63 1620 -- 2.3 52 0.518 Japan 0.906 0.932 81.3 0.94 25130 -- 3.5 2009 0.926 S. Korea 0.814 0.879 75.2 0.96 15090 3.5 3.8 899 0.873 China 0.624 0.721 70.6 0.79 4020 2.3 2.1 205 0.718 Mean 0.680 0.738 68.87 0.822 8818.23 3.07 3.49 441.92 0.750 STD 0.14 0.14 8.41 0.10 8661.37 1.40 1.68 561.23 0.13 CV 0.20 0.18 0.12 0.13 0.98 0.46 0.48 1.27 0.17 Source: 2003 Human Development Report
Table II.2 Average Values for Social and Economic Indicators
for East Asia 13
Social and Economic
Indicators
Japan South Korea
Singapore Brunei
China/Indonesia Malaysia
Philippines Thailand Viet Nam
Cambodia Myanmar Lao PDR
Human Development Index (2001)
0.892
0.730
0.540
Per Capita GDP (PPP$, 2001) 20,527 4,670 1,502 Per Capita Health Expenditures 1,109 188.83 57.67 Education Index 0.915 0.840 0.660 Public Expenditure on Education (% of GDP) 4.0 4.48 1.57
Gender-related Development Index 0.887 0.730 0.540 Source: HDR 2003
13

B. East Asia vis-à-vis Europe In contrast, selected 34 countries of Europe, as shown in Table II.3, fare better in terms of level and the variance in the same set of indicators. The high HDI countries (EU-15) of the region only have a little more than twice the average per capita GDP (PPP$) of the medium HDI countries (Accession-12), and a little over ten times more than the lower medium HDI countries (CIS-7).
Table II.3 Average Values of Social and Economic Indicators Various Groups of European Countries
Social and Economic Indicators EU-15 Accession-12
CIS-7
Human Development Index (2001)
0.924
0.837
0.722
Per Capita GDP (PPP$, 2001) 26,447 11,587 2,404 Per Capita Health Expenditures 2,064 672 110 Education Index 0.966 0.920 0.887 Public Expenditure on Education (% of GDP)
5.35 5.05 3.7
Gender-related Development Index 0.920 0.834 0.706
Accession countries are those that recently joined the EU and those that are scheduled to accede over the next decade: Cyprus, Bulgaria, Czech Republic, Estonia, Hungary, Latvia, Lithuania, Malta, Poland, Romania, Slovak Republic, Slovenia; The CIS-7 are the poorer members of the Commonwealth of Independent States: Armenia, Azerbaijan, Georgia, Kyrgyzstan, Moldova, Tajikistan, Uzbekistan. Kyrgyzstan, Tajikistan, and Uzbekistan are technically part of Central Asia but are included here to complete the spectrum of related countries at various stages of development. Source: HDR 2003 The difference between East Asia and Europe is also shown in Table II.4, which summarizes the mean, standard deviation, and coefficient of variation measures for the two regions across HDI and per capita GDP (PPP$). The coefficient of variation in HDI of the 34 European countries is only 9.6 percent while that of the East Asia 13 is almost twice that of the former, or 18.4 percent. ASEAN 10 has a coefficient of variation twice that of the European 34. In terms of per capital GDP (PPP$), East Asia has a higher coefficient of variation (98.2 percent) than Europe (71.6 percent). A much higher coefficient of variation is observed for ASEAN 10 countries for per capita GDP, which stands at 109 percent.
14

Table II.4 Summary Measures for Europe 34, East Asia 13, and ASEAN 10
Social and Economic
Indicators Mean Standard Deviation
Coefficient
of Variation (%)
HDI (2001) Europe 34
0.852
0.081
9.6
HDI (2001) East Asia 13 0.738
0.135
18.4
HDI (2001) ASEAN 10 0.707 0.130 19.0
Per Capita GDP (PPP$, 2001) Europe 33
16,265 11,549 71.0
Per Capita GDP (PPP$, 2001) East Asia 13
8,818 8,661 98.2
Per Capita GDP (PPP$, 2001) ASEAN 10
7,040 7,747 109.0
In general, Europe has a much higher level of human development than East Asia, which could be attributed primarily to its longer process of development. Disparities between higher income and lower income countries is more pronounced in East Asia than in Europe. The process of convergence has also been observed to be very strong in the EU, mild in Latin America and non-existent in Southeast Asia (Karras 1997, see also Table I.1). Much of the strength of EU’s convergence could be attributed to its more rigid and institutionalized integration process. Meanwhile, the lack of convergence among countries in Southeast Asia serves as a major obstacle to more effective regional cooperation and integration. C. Clustering Southeast Asian Countries on HD Indicators The ten countries of Southeast Asia may be clustered together into four groups based on their HDI rankings and six other human development indicators as summarized in Table II.5. Singapore and Brunei – the smallest countries in the region both in terms of population and geographic size – rank the highest in terms of the seven indicators (HDI, life, education, GDP, human poverty index, gender development index, and gender empowerment measures). These two countries fall in the “high human development” category based on HDI rank, life expectancy, education, and GDP values, which are closer to that of Japan and South Korea in East Asia and to some developed countries in the European Union. Malaysia, Thailand, and the Philippines belong to a second cluster of upper “medium human development” countries in the region that may appear to have a wider range of
15

difference in their HDI ranking but are essentially much closer and less variant in terms of life, education, and GDP indexes. Meanwhile, Viet Nam and Indonesia belong to a third category, which may be called medium “medium human development” countries. Although they appear to have a big difference in terms of HDI ranking, their life, education, and GDP indexes are much closer. Cambodia, Myanmar, and Lao PDR belong to the last group of countries (lower “medium human development”) in the region whose HDI ranking, life, education, and GDP indexes are quite close. These countries also have a higher level of human poverty index (HPI)—especially Cambodia and Lao PDR—relative to the other Southeast Asian countries.
Table II.5 The State of Human Development in Southeast Asia, 20012 Country HDI Life Educ GDP HPI GDI GEM Singapore 28 0.88 0.87 0.91 6 28 26 Brunei 31 0.85 0.89 0.88 …. 31 …. Malaysia 58 0.80 0.83 0.75 …. 53 45 Thailand 74 0.73 0.88 0.69 24 61 55 Philippines 85 0.74 0.90 0.61 28 66 35 Viet Nam 109 0.73 0.83 0.51 39 89 …. Indonesia 122 0.69 0.80 0.56 33 91 …. Cambodia 130 0.54 0.64 0.49 73 105 64 Myanmar 131 0.53 0.72 0.39 45 …. …. Lao PDR 135 0.48 0.63 0.46 66 109 …. Source: HDR 2003 D. Trends in Human Development in Southeast Asia Over the last decade or so, the HDI rankings of Southeast Asian countries have not changed significantly on average. Cambodia and the Philippines had the widest range of fluctuation in HDI ranking over the last 12 years (with a range of 35 and 30, respectively). Table II.6 is a summary of HDI rankings of Southeast Asian countries based on Human Development Reports between 1991-2003.
2 Source: Hadi Soesastro, "Talking Points on the State of Human Development in Southeast Asia", paper presented at the Southeast Asia Human Development Report Inception Workshop, UNDP and ISDS, Shangri-La Hotel, Manila, Philippines, 18-20 August 2003. Values in Table 1 were taken from Human Development Report (HDR) 2003.
16

Table II.6 HDI Rankings of Southeast Asian Countries, 1991-2003
Country
1991 1992 1993 1994 1995 1996 1997 1998 1999 2000 2001 2002 2003 Ave R
Singapore 37 40 43 43 35 34 26 28 22 24 26 25 28 32 21 Brunei 42 41 44 44 41 36 38 35 25 32 32 32 31 36 19 Malaysia 52 51 57 57 59 53 60 60 56 61 56 59 58 57 10 Thailand 66 69 74 54 58 52 59 59 67 76 66 70 74 65 22 Philippines 84 80 92 99 100 95 98 98 77 77 70 77 85 87 30 Indonesia 98 98 108 105 104 102 99 96 105 109 102 110 112 104 16 Viet Nam 99 102 115 116 120 121 121 122 110 108 101 109 109 112 23 Myanmar 106 111 123 130 132 133 131 131 128 125 118 127 131 125 26 Lao PDR 128 129 141 133 138 138 136 136 140 140 131 143 135 136 15 Cambodia 140 136 148 147 153 156 153 140 137 136 121 130 130 141 35
Note: Ave = mean over the last 12 years; R = range Source: HDR, 1991-2003. Although HDI rankings of Southeast Asian countries have not changed that much, the trend in human development index appears to have improved significantly since 1975 for most countries in the region. Indonesia had the most significant improvement (at 0.22) in terms of the difference in HDI values from 1975 to 2001, followed by Malaysia (0.18), Singapore (0.16), Thailand (0.16), Viet Nam (0.11), the Philippines (0.10), and Laos (0.10), respectively. Cambodia has the least improvement in human development index (0.04) although this attributable to the shorter time span involved. Table II.7 is a summary of HDI trends in the region. Note that the HDI values are consistent with the four clusters of countries in the region as noted earlier over the period covered. The ten countries of Southeast Asia also vary significantly across several social and economic indicators. Table II.8 shows that although the average HDI values of Singapore and Brunei are not really that very far from those of Malaysia, Thailand, the Philippines, Viet Nam, and Indonesia, the two groups differ substantially in terms of the mean per capita GDP (PPP$) and per capita health expenditures. However, indicators related to education do not show a large difference between the first two groups. Cambodia, Myanmar, and Lao PDR have the lowest values in all six indicators. Their average per capita GDP (PPP$) is 30 percent of the mean of the five medium HDI countries, while their mean per capita health expenditures is only 8 percent and 31 percent of the average of the high and medium HDI countries, respectively.
17

Table II.7 HDI Trends in Southeast Asia, 1975-2001
HDI Rank Country 1975 1980 1985 1990 1995 2001 D
28 Singapore 0.722 0.755 0.782 0.819 0.858 0.884 0.16 31 Brunei .. .. .. .. .. 0.872 ..
58 Malaysia 0.615 0.658 0.692 0.721 0.759 0.790 0.18 74 Thailand 0.612 0.650 0.673 0.705 0.739 0.768 0.16 85 Philippines 0.647 0.680 0.684 0.713 0.731 0.751 0.10
109 Viet Nam .. .. 0.582 0.603 0.646 0.688 0.11 112 Indonesia 0.464 0.526 0.578 0.619 0.659 0.682 0.22
130 Cambodia .. .. .. 0.512 0.543 0.556 0.04 131 Myanmar .. .. .. .. .. 0.549 .. 135 Lao PD. .. .. 0.422 0.449 0.485 0.525 0.10
Note: D = difference between 2001 HDI values and earliest available HDI values. Source: HDR 2003
Table II.8 Average Values for Social and Economic Indicators Southeast Asia 10, 2001
Social and Economic
Indicators
Singapore Brunei
Malaysia Thailand
Philippines Viet Nam Indonesia
Cambodia Myanmar
Laos
Human Development Index (2001)
0.890
0.740
0.540
Per Capita GDP (PPP$, 2001) 20,945 4,800 1,502
Per Capita Health Expenditures 765.50
185.60
57.67
Education Index 0.880 0.850 0.660 Public Expenditure on Education (% of GDP)
4.25 3.95* 1.57
Gender-related Development Index
0.880 0.730 0.540
Note: * = Average public expenditure on education were computed using values for Malaysia, Philippines, and Thailand only; no values for Indonesia and Viet Nam available in 2001. Source: HDR 2003 The foremost factor that distinguishes the higher income countries in East Asia from the CMLV countries is that the latter—with the exception of Myanmar—are transition economies, which experienced debilitating conflicts that ended only within the last 30
18

years. However, this aspect alone cannot explain the lack of economic convergence in Southeast Asia since the ASEAN-5—Indonesia, Malaysia, the Philippines, Singapore and Thailand—were the only countries involved in the study of Karras (1997) and these countries exhibited very slow convergence between 1990 and 2001 in terms of per capita GDP and human development (Table I.1). It should also be noted that income distribution within countries in Southeast Asia is relatively unequal. The Gini index for the more advanced countries in Southeast Asia is relatively high—exceeding the threshold of 40 for low inequality—especially when compared to the different groups of European countries (Table II. 9).3
Table II.9 Gini Index for Selected Countries and Regional Groupings
Cambodia 40.4 (1997) Indonesia 30.3 (2000) Lao PDR 37.0 (1997) Malaysia 49.2 (1997) Philippines 46.1 (2000) Singapore 42.5 (1998) Thailand 43.2 (2000) Viet Nam 36.1 (1998) EU -15 24.7-38.2 Accession 12 24.4-37.6 CIS-7 26.8-38.9 NOTE: No data available for Myanmar and Brunei. Number in parenthesis is latest year available. Data for groups of European countries are expressed as a range (please refer to Appendix for individual country data) Source: World Bank,
Other factors should also be considered. Using human development indicators as shown in Table II.10, it is clear that the variation among the Southeast Asian countries is large for three variables: per capita GDP (PPP$), per capita health expenditures, and public expenditures on education. For the first two indicators, the coefficients of variation are 110 percent and 109 percent, respectively. Public expenditure on education (as a percent of GDP) also varies significantly and does not show clear convergence with a coefficient of variation of 55 percent and 53 for 1990 and 1998-2000, respectively. Apparently, the wide disparity in human development and relatively unequal distribution of income can be partly attributed to factors related to human resource development.
3 With the exception of Indonesia although some experts doubt the accuracy of a Gini Index of 30.3. One reason is that expenditures and not income is used to calculate this particular Gini Index. An economics professor at the University of Indonesia even quipped that the low value of the Gini index indicates that there is ‘equality in poverty in Indonesia.’ A study by Asra (2000) shows an income-based Gini Index of 44 in 1982.
19

Table II.10 Human Development Indicators for Southeast Asia
Countries HDI Life Expectancy at birth
Education Index
GDP per capita (PPP$)
Public Expenditure on Education (% of GDP)
Per Capita Health Expenditure
GDI
1990 2001 2001 2001 2001 1990 1998-2000 2000 2001
Singapore 0.819 0.884 77.8 0.87 22680 -- 3.7 913 0.880 Brunei -- 0.872 76.1 0.89 19210 -- 4.8 618 0.867 Malaysia 0.720 0.79 72.8 0.83 8750 5.2 6.2 310 0.780 Thailand 0.705 0.768 68.9 0.88 6400 3.5 5.4 237 0.766 Philippines 0.713 0.751 69.5 0.90 3840 2.9 4.2 167 0.748 Viet Nam 0.603 0.688 68.6 0.83 2070 -- -- 130 0.687 Indonesia 0.619 0.682 66.2 0.80 2940 1.0 -- 84 0.677 Cambodia 0.512 0.556 57.4 0.64 1860 -- 1.9 97 0.551 Myanmar -- 0.549 57.0 0.72 1027 -- 0.5 24 -- Lao PDR 0.449 0.525 53.9 0.63 1620 -- 2.3 52 0.518 Mean 0.643 0.707 66.82 0.799 7039.70 3.15 3.63 263.20 0.720 STD 0.12 0.13 8.23 0.10 7747.17 1.73 1.93 286.66 0.13 CV 0.19 0.18 0.12 0.13 1.10 0.55 0.53 1.09 0.17 Source: HDR 2003 E. Economic Performance and Budget Structure Differences in economic performance and development priorities as reflected in the national budget could also explain the disparity in economic and human development in Southeast Asia. In terms of economic performance, countries in the region have performed well between 1990-2001 based on GDP growth rates, especially the CMLV countries (Table II.11). Among the original ASEAN-6, Brunei and the Philippines were the laggards in the region during this period. In terms of total GDP and GDP per capita (both US$ and PPP$), Cambodia and Lao PDR had the lowest among ASEAN countries in 2001 as shown in Table II.12. It is also clear from Table II.12 that, although Southeast Asian countries still lag behind Japan, Korea, and China in terms of total GDP, the GDP per capita Singapore is much closer to that of Japan and Korea. China’s GDP per capita is closer to that of the Philippines. Singapore has the highest GDP per capita in Southeast Asia at US$ 22,680 (in purchasing power parity, 2002 figures) and third highest in Asia after Japan and Hong Kong. Although a high income country with GDP per capita levels closer to OECD countries than developing countries, it is classified by the OECD as a “more advanced developing country”. However, high income levels does not necessary correlate with high human development. Singapore has a score of –7 for the difference between the rankings based on GDP per capita in PPP and the HDI rank. A negative figure would indicate that Singapore’s GDP per capita rank was higher than the HDI rank. If the negative
20

differences were large, it would seem to suggest that the country is more “developed” in income terms compared to human development.
Table II.11 GDP Growth Rates of East Asian Countries, 1975-2001
HDI
EAST ASIAN
GDP Growth Rate
(%)
GDP per capita (PPP$)
Highest Value
GDP per capita (PPP$) Year
RANK COUNTRIES 1975-2001 1990-2001 1975-2001 Highest
28 Singapore 5.1 4.4 23,804 2000 31 Brunei -2.2 -0.7 .. .. 58 Malaysia 4.1 3.9 8,996 1997 74 Thailand 5.4 3.0 6,763 1996 85 Philippines 0.1 1.0 3,946 1982
109 Viet Nam 4.9 6.0 2,070 2001 112 Indonesia 4.3 2.3 3,267 1997 130 Cambodia 2.1 2.2 1,860 2001 131 Myanmar 1.8 5.7 .. .. 135 Lao PDR 3.3 3.9 1,620 2001
9 Japan 2.6 1.0 25,309 2000
30 Korea 6.2 4.7 15,090 2001 104 China 8.2 8.8 4,020 2001
Source: HDR 2003
Table II.12 GDP of East Asian Countries 2001
HDI
EAST ASIAN
GDP (US$b)
GDP (PPP$b) GDP per capita US$ GDP per capita (PPP$)
RANK COUNTRIES 2001 2001 2001 2001
28 Singapore 85.6 93.7 20,733 22,680 31 Brunei Darussalam .. .. .. .. 58 Malaysia 88.0 208.3 3,699 8,750 74 Thailand 114.7 391.7 1,874 6,400 85 Philippines 71.4 301.1 912 3,840
109 Viet Nam 32.7 164.5 411 2,070 112 Indonesia 145.3 615.2 695 2,940 130 Cambodia 3.4 22.8 278 1,860 131 Myanmar .. .. .. .. 135 Lao PDR 1.8 8.8 326 1,620
9 Japan 4,141.4 3,193.0 32,601 25,130
30 Korea 422.2 714.2 8,917 15,090 104 China 1,159.0 5,111.2 911 4,020
21

Although the negative difference in Singapore’s case is not very large in 2002, they were larger during the 1991-2000 period (ranging from –11 to –22). Oil exporting countries in the Middle East tend to have large negative differences e.g. Qatar (-19), Kuwait (-17) and united Arab Emirates (-25). Despite impressive growth rates in the East Asian region, however, data on public expenditures (Table II.13) reveal a disturbing picture: total debt servicing was between 6.2 to as much as 17.5 percent (in 2001) of the GDPs of five countries—Thailand, Indonesia, the Philippines, Korea, and Malaysia—while military spending was much higher for Brunei, Singapore, Cambodia, and Myanmar (between 3.0 to as much as 6.1 percent in 2001). Understandably, the countries that spent more on debt servicing were those hit very hard by the Asian financial crisis in 1997.
Table II.13 Public Expenditures on Education, Health, Military and Debt Service
Education (% of GDP)
Health (% of GDP)
Military (% of GDP)
Debt Service (% of GDP)
Countries 1990 1998-200 1990 2000 1990 2001 1990 2001
Singapore .. 3.7 1.0 1.2 4.8 5.0 .. .. Brunei .. 4.8 1.6 2.5 6.7 6.1 .. .. Malaysia 5.2 6.2 1.5 1.5 2.6 2.2 9.8 7.1 Thailand 3.5 5.4 0.9 2.1 2.3 1.4 6.2 17.5 Philippines 2.9 4.2 1.5 1.6 1.4 1.0 8.1 10.9 Viet Nam .. .. 0.9 1.3 7.9 .. 2.7 3.7 Indonesia 1.0 .. 0.6 0.6 1.8 1.1 8.7 10.7 Cambodia .. 1.9 .. 2.0 3.1 3.0 2.7 0.6 Myanmar .. 0.5 1.0 0.4 3.4 2.3 .. .. Lao PDR .. 2.3 0.0 1.3 .. 2.1 1.1 2.5 Japan .. 3.5 4.6 6.0 0.9 1.0 .. .. South Korea 3.5 3.8 1.8 2.6 3.7 2.8 3.3 6.2 China 2.3 2.1 2.2 1.9 2.7 2.3 2.0 2.1
Source: HDR 2003 Thailand, which had the highest public expenditure in Southeast Asia to service debt at 17.5 percent in 2001, has been managing its debt stock quite well over the last three years. The country’s external debt amounted to US$59.3 billion at the end of 2002, which was down from US$67.5 billion in 2001. The ratio of public sector debt to private sector debt has also been falling, from 41.7 percent in 2001 to 38.5 percent at the end of 2002. The Thai government has announced plans to further lower its public debt target to 54.6 percent of GDP in 2003 and cited better than expected growth performance and the repayment of more than Baht 37.4 billion in government debt as reasons for the lower target (ADO 2003). Indonesia has also been making some progress in debt management. The fiscal burden of servicing debt has been an important feature of the government’s budget in the post-1997 crisis years. Roughly 5.3 percent of GDP in 2002 were for interest payments and
22
represented one the major expenditures in the national budget. Even so, due to appreciating exchange rate vis-à-vis the US currency and increases in the nominal GDP, the country’s government-to-debt ratio declined significantly from 98 percent in 2000 to about 72 percent in 2002. The Indonesian government also made some notable progress in 2002 with plans to make future repayment of its external and domestic debt more manageable (ADO 2003). Singapore’s economy has been going through a difficult time since the Asian financial crisis of 1997-1998. The city-state experienced two recessions in 1998 (-0.9 percent) and in 2001 (-1.9 percent). Although the economy registered a robust rebound in 1999 and 2000, economy recovery has been interrupted by a sequence of external shocks including the September 11 terrorist attacks in the US, the Iraq war and more recently the Severe Acute Respiratory (SARS) outbreak. The GDP index has fallen from a high of 0.99 in 1998 to 0.89 in 2001 but it has improved slightly to 0.91 in 2002 and 2003. Given increased global competition (especially from emerging markets such as China and India) and rapid technological changes, many economists predict that the era of robust and sustainable economic growth is now over for Singapore. The city-state will need to make the necessary economy restructuring in order to remain competitive. Among ASEAN countries, Malaysia clearly leads the group in terms of higher expenditure on education followed by Thailand, Brunei, the Philippines, and Singapore. Between education and health, countries in East Asia (except Japan) apparently spent more on education. In general, health expenditures had very minimal increase between 1990 and 2000 for most countries in the region and remained almost constant for others (notably Malaysia, Indonesia, and the Philippines) even as it decreased for Myanmar. F. Accounting for Disparities in Health and Education Expenditures4 Several factors have influenced the amount of public spending on health and education in Southeast Asia: distorted priorities (high defense spending in Cambodia, Lao PDR, and Myanmar crowd out the social sector); internal pressure not to cut spending despite high budget deficits (Thailand, Philippines, and Indonesia); the importance of safety nets (policy and structural adjustments included funding for the social sector in Indonesia and Thailand); and access to foreign aid (e.g. direct assistance to Myanmar for social services). The case of Cambodia is an illustration of a country said to have ‘distorted’ priorities. Excessive public expenditure on defense from 1994 to 1998—between 3.3 and 5 percent of GDP annually—crowded out the social sectors. In 1998, public spending on health and education accounted for only 0.7 percent and 1.3 percent of GDP, respectively. Data in the appendix indicates that this trend has not changed significantly in the following years. To make matters worse, actual expenditure for education—and even more so for health—falls short of budgeted levels. 4 The first six paragraphs of this section of the chapter were adopted from Gonzales and Mendoza (2002).
23

Myanmar’s military spending is also high. In 1997, for instance, public expenditure on defense accounted for 7.6 percent of GNP. Meanwhile, past spending on health and education had averaged about 0.5 percent of GDP. Myanmar’s budget has strained social sector provisions, resulting in low educational attainments and inadequate health care. Myanmar has to rely on donor assistance—particularly from the EU—to support basic service provision. In Indonesia, the government tried to maintain the same real level of spending for basic education as in pre-1997 years through a ‘stay in school’ campaign in 1998, which included target scholarships for the poorest children; and block grants to schools to compensate for reduction in parental contributions and increases in costs of inputs. The Indonesian government used part of the Policy Reform Support Loan from the World Bank in 1998 to support the purchase of food and essential drugs, including vaccines and drugs needed for communicable disease control. Due to a big revenue shortfall in 1998 following the Asian financial crisis, the Philippine government imposed austerity measures, cutting allocations by as much as 25 percent. But mindful of possible adverse effects, it exempted the basic social services sector—basic education and primary health. Despite this favorable policy, the social sector failed to maintain its share of the national budget. Trends in education financing in the Philippines are likewise not encouraging. With rapid expansion of publicly funded state colleges and universities, tertiary education is crowding out the budget for elementary education. In a similar vein, Viet Nam has protected social sector spending even if the overall budget has fallen. Malaysia’s relatively strong fiscal and debt management policies allowed it to weather the early effects of the financial crisis, slowing down contraction. Malaysia has run budgetary surpluses for the past five years, sheltering social expenditures. The impetus for this is reliance on a regulatory regime that expands private provision of social services.
Malaysia clearly places a lot of emphasis on education—expenditure on education takes up a sizeable chunk of the government’s budget. From 1999-2003, an average of 25 percent of total government expenditure was spent on education. Meanwhile, public healthcare services are fairly good. There is an extensive network of primary healthcare services in the country which is supported by 116 government hospitals with about 29,000 beds. Singapore’s achievements in education are impressive. The UNDP education index for Singapore remains high at 0.87 over the past 4 years. Reforms in the education sector have been implemented over the past few years. School curriculum have been modified to enhance the skills of students as well as to promote greater creativity. Meanwhile university admission system has been broadened to take into account of other components (such as co-curricular activities and project work) besides the standard entrance examinations. The government is also planning to establish specialized independent schools for students with specialized talents viz. sports and art schools.
24

G. Governance in Southeast Asia Following the Asian financial crisis in 1997, good governance surfaced as an important variable in sustaining future growth and stability in the region. While institutional weaknesses were not necessarily the cause of the financial crisis, the lack of governmental accountability and transparency, corruption, highly centralized control, and poor policy coordination exacerbated the crisis. This factor could also explain the wide disparity in development and slow convergence in Southeast Asia. Governance is basically defined as the exercise of economic, political, and administrative powers in managing the state’s resource endowment. This is done through institutionalized processes and mechanism in which civil society groups and individuals articulate their interests, exercise their rights, perform their obligations, and mediate their differences (UNDP 1998 and Shah 1998). Good governance has five components: 1) transparency, which refers to the guaranteed free flow of information and where institutions and processes are directly accessible to those concerned with them; 2) accountability, which refers to responsibility of decision-makers in government, the private sector, and civil society to the public and to institutional stakeholders; 3) the rule of law, which refers to the fair and impartial enforcement of rules and legal frameworks; 4) efficient and effective governance, which refers to the ability of institutions and processes to produce outcomes that meet needs while making the best use of resources; and 5) participatory process, which refers to mediation of differences and reaching a broad consensus on political, economic, and social priorities (UNDP 1998). Kaufmann, Kraay, and Mastruzzi (2003, hereafter referred to as KKM 2003) defined governance broadly as the traditions and institutions by which authority in a country is exercised. They came up with six clusters of indicators that in a way unbundle the dimensions of good governance: 1) voice and accountability; 2) political stability and absence of violence; 3) government effectiveness; 4) regulatory quality; 5) rule of law; and 6) control of corruption. The first cluster is intended to capture the first part of KKM’s definition of governance: the process by which those in authority are selected and replaced. Under “Voice and Accountability” are included a number of indicators measuring various aspects of the political process, civil liberties and political rights. These indicators measure the extent to which citizens of a country are able to participate in the selection of governments. They also included in this category indicators measuring the independence of the media, which serves an important role in monitoring those in authority and holding them accountable for their actions. The second governance cluster is labeled “Political Stability and Absence of Violence”. In this index KKM combined several indicators that measure perceptions of the likelihood that the government in power will be destabilized or overthrown by possibly unconstitutional and/or violent means, including domestic violence and terrorism. This
25

index captures the idea that the quality of governance in a country is compromised by the likelihood of wrenching changes in government, which not only has a direct effect on the continuity of policies, but also at a deeper level undermines the ability of all citizens to peacefully select and replace those in power. The third and fourth clusters summarize various indicators of the ability of the government to formulate and implement sound policies. In “Government Effectiveness” the following indicators were combined: responses on the quality of public service provision, the quality of the bureaucracy, the competence of civil servants, the independence of the civil service from political pressures, and the credibility of the government’s commitment to policies. The main focus of this index is on “inputs” required for the government to be able to produce and implement good policies and deliver public goods. The fourth cluster, which is referred to as “Regulatory Quality”, focuses more on the policies themselves. It includes measures of the incidence of market unfriendly policies such as price controls or inadequate bank supervision, as well as perceptions of the burdens imposed by excessive regulation in areas such as foreign trade and business development. The last two clusters summarize in broad terms the respect of citizens and the state for the institutions which govern their interactions. Included in the “Rule of Law” are several indicators that measure the extent to which agents have confidence in and abide by the rules of society. These include perceptions of the incidence of crime, the effectiveness and predictability of the judiciary, and the enforceability of contracts. Together, these indicators measure the success of a society in developing an environment in which fair and predictable rules form the basis for economic and social interactions, and importantly, the extent to which property rights are protected. The final cluster, referred to as “Control of Corruption”, measures perceptions of corruption, conventionally defined as the exercise of public power for private gain. Despite this straightforward focus, the particular aspect of corruption measured by the various sources of indicators differs somewhat, ranging from the frequency of “additional payments to get things done,” to the effects of corruption on the business environment, to measuring “grand corruption” in the political arena or in the tendency of elite forms to engage in “state capture”. The presence of corruption is often a manifestation of a lack of respect of both the corrupter (typically a private citizen or firm) and the corrupted (typically a public official or politician) for the rules that govern their interactions, and hence represents a failure of governance according to KKM’s and the UNDP’s definition. This section of the chapter presents a set of estimates of six dimensions of governance in Southeast Asia covering eleven countries (including Timor Leste) based on KKM (2003) data sets from 199 countries and territories for four time periods: 1996, 1998, 2000, and 2002. These indicators are based on several hundred variables measuring perceptions of governance, drawn from 25 separate data sources constructed by 18 different organizations. KMM assigned the individual measures of governance perceptions to six categories capturing key dimensions of governance, and use an unobserved components
26
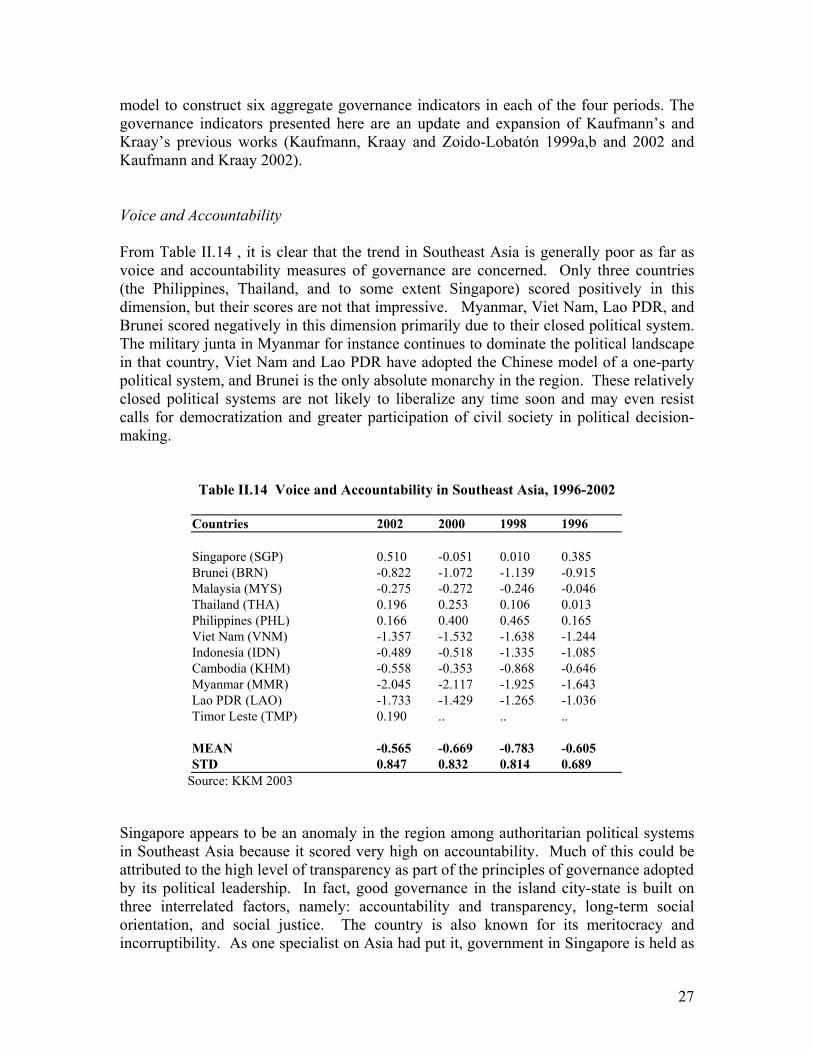
model to construct six aggregate governance indicators in each of the four periods. The governance indicators presented here are an update and expansion of Kaufmann’s and Kraay’s previous works (Kaufmann, Kraay and Zoido-Lobatón 1999a,b and 2002 and Kaufmann and Kraay 2002). Voice and Accountability From Table II.14 , it is clear that the trend in Southeast Asia is generally poor as far as voice and accountability measures of governance are concerned. Only three countries (the Philippines, Thailand, and to some extent Singapore) scored positively in this dimension, but their scores are not that impressive. Myanmar, Viet Nam, Lao PDR, and Brunei scored negatively in this dimension primarily due to their closed political system. The military junta in Myanmar for instance continues to dominate the political landscape in that country, Viet Nam and Lao PDR have adopted the Chinese model of a one-party political system, and Brunei is the only absolute monarchy in the region. These relatively closed political systems are not likely to liberalize any time soon and may even resist calls for democratization and greater participation of civil society in political decision-making.
Table II.14 Voice and Accountability in Southeast Asia, 1996-2002
Countries 2002 2000 1998 1996 Singapore (SGP) 0.510 -0.051 0.010 0.385 Brunei (BRN) -0.822 -1.072 -1.139 -0.915 Malaysia (MYS) -0.275 -0.272 -0.246 -0.046 Thailand (THA) 0.196 0.253 0.106 0.013 Philippines (PHL) 0.166 0.400 0.465 0.165 Viet Nam (VNM) -1.357 -1.532 -1.638 -1.244 Indonesia (IDN) -0.489 -0.518 -1.335 -1.085 Cambodia (KHM) -0.558 -0.353 -0.868 -0.646 Myanmar (MMR) -2.045 -2.117 -1.925 -1.643 Lao PDR (LAO) -1.733 -1.429 -1.265 -1.036 Timor Leste (TMP) 0.190 .. .. .. MEAN -0.565 -0.669 -0.783 -0.605 STD 0.847 0.832 0.814 0.689
Source: KKM 2003 Singapore appears to be an anomaly in the region among authoritarian political systems in Southeast Asia because it scored very high on accountability. Much of this could be attributed to the high level of transparency as part of the principles of governance adopted by its political leadership. In fact, good governance in the island city-state is built on three interrelated factors, namely: accountability and transparency, long-term social orientation, and social justice. The country is also known for its meritocracy and incorruptibility. As one specialist on Asia had put it, government in Singapore is held as
27

a trusteeship rather than an agency of special interest (Weatherbee 2004). Indonesia is a stark contrast to Singapore in that it suffers from a crisis of governance where all the symptoms of state decay are apparently present. These include: loss of de facto control over parts of the country, increased crime rate, emergence of non-state agents of coercion, unconstrained corporate and public corruption, and institutional incapacity. In the midst of these stands an immobile government that seemed to have no vision or direction and has neither the political will nor the capacity to address fundamental challenges to governance. The stasis in the Megawati government could also be attributed to contending political forces that prevent decisive action and to an enormous bureaucracy that remains strongly resistant to change. Specifically, the multi-partisan composition of the cabinet combined intra-party feuding and ideological differences have rendered the Megawati government immobile (Weatherbee 2004, Smith 2003). Political Instability and Ethnic Conflicts Political stability is another dimension of governance that has an impact on economic and social development. In Southeast Asia, the countries that have been unstable between 1996 and 2002 are Indonesia, Myanmar, Cambodia, and the Philippines (Table II.15). Ethnic tensions in the region had in fact increased in the last decade, which implies poor conflict management in these countries. Moreover, ethnic conflict in Indonesia and the Philippines has also hurt their economic growth. The situation could worsen if international investors equate ethnic conflict with political instability, prompting them to withdraw their investments from the region (Gonzales and Mendoza 2002). An imperative of good governance is to provide for domestic security that ensures the physical safety and legal rights of all citizens. On this dimension, Indonesia’s political stability and domestic security continue to be at risk given that a poorly led and poorly trained police force could not arrest the increasing tide of criminality in the country. This has led to a decline in the confidence of the Indonesian people on state institutions of law and order, thus prompting them to take the law into their own hands for self-defense through the formation of militia groups, increased vigilantism, and even mob justice. Complicating this internal security situation are increased ethnic tensions and sectarian violence since the downfall of Suharto in 1998 that range from random acts of arson and bombings to some type of ethnic cleansing. Exacerbating the situation is the tendency of Megawati administration to appease military interests and showed no sign of attempting to reform the military establishment (Weatherbee 2004, Smith 2003). In Cambodia, political instability remains precarious as contending political parties fail to form a coalition government following the elections in 2003. To a large extent, the instability in the country stems from the animosities of Cambodian factions that have been engaged in civil war for twenty years since the 1970s. This prolonged conflict continues to curtail access to social services and economic opportunities for Cambodians
28

as the government is unable to govern effectively. Consequently, this has increased poverty and retarded economic growth (Gonzales and Mendoza 2002, Osborne 2003). In Myanmar, the military-led State Peace and Development Council (SPDC) continues to dominate the political scene in the country even as it attempts to parry international pressures (including those from ASEAN) for democratic reforms. In September 2003, newly installed Prime Minister General Khin Nyunt announced a seven-stage roadmap to democracy that will pave the way for a national reconciliation process involving all political parties including the National League for Democracy (NLD) led by Aung San Suu Kyi and peace talks with ethnic rebel groups. Part of the reconciliation process is calling a National Convention of all political parties and ethnic groups that will design a new constitution of Myanmar. So far, the military junta has forged a peace agreement with 17 ethnic groups that have been fighting the central government in Yangon. However, it remains to be seen whether reconciliation with the democratic forces led by the NLD could really prosper.
Table II.15 Political Stability in Southeast Asia, 1996-2002 Countries 2002 2000 1998 1996 SGP 1.275 1.528 1.405 1.292 BRN 1.103 1.255 1.431 0.858 MYS 0.505 0.333 0.551 0.924 THA 0.548 0.282 0.320 0.214 PHL -0.490 -0.318 0.088 -0.049 VNM 0.489 0.426 0.615 0.376 IDN -1.374 -1.855 -1.518 -0.339 KHM -0.251 -1.224 -1.372 -1.100 MMR -1.377 -1.414 -1.053 -0.924 LAO -0.125 0.399 0.982 0.961 TMP -0.936 .. .. .. MEAN -0.057 -0.059 0.145 0.221 STD 0.926 1.128 1.099 0.821
Source: KKM 2003 A major obstacle to the roadmap is apparent the lack of consensus among the military rulers on the speed of democratic reforms in the country. For one, the top leader of the ruling junta, Senior General Than Swe, seem to be not in a hurry to convene the National Convention even as he is not prepared to give a role to Suu Kyi in the reconciliation process. Should the roadmap to democracy fail, the political legitimacy of the ruling military would continue to be challenged and also exacerbate the economic conditions of the country. In fact, the SPCD in recent years has resorted to infrastructure construction to enhance its legitimacy that necessitated the printing of unrevealed amounts of local currency. This in turn contributed to uncontrolled inflation and the use of “corvee labor” that was denounced by the international community in 2002. Public expenditure on infrastructure has also lessened (in absolute and per capita terms) the government’s budget for social services such as health and education, which are supposed to be as important priorities of the SPCD (Steinberg 2003).
29

Government Effectiveness There appears to be a wide disparity among Southeast Asian countries in terms of government effectiveness as can be gleaned from Table II.16. Data from KKM (2003) indicate that the most effective government is that of Singapore, followed by Brunei and Malaysia. Thailand and the Philippines scored the lowest among those in the positive side of the scale. Indonesia and the CMLV countries (and more recently Timor Leste) are in the negative side of the scale, with Myanmar as consistently the most ineffective government in the region.
Table II.16 Government Effectiveness in Southeast Asia, 1996-2002
Countries 2002 2000 1998 1996 SGP 2.262 2.477 2.588 2.037 BRN 0.955 1.053 0.133 1.009 MYS 0.924 0.683 0.765 0.805 THA 0.280 0.205 0.112 0.313 PHL -0.064 0.096 0.218 0.094
-0.267 -0.266 -0.230 -0.182 IDN -0.558 -0.495 -0.584 0.077 KHM -0.560 -0.272 -1.044 -0.691 MMR -1.285 -1.314 -1.640 -0.909 LAO -0.796 -0.666 -0.338 -0.127 TMP -0.777 .. .. .. MEAN 0.010 0.150 -0.002 0.243 STD 1.027 1.059 1.138 0.862
VNM
Source: KKM 2003 Singapore’s high level of government effectiveness may be attributed to the small size and scope of government, high pay for the upper crust of its quality bureaucracy (which is twice those in Malaysia, four times, those in Thailand, and five time those in the Philippines), and high level of accountability. In contrast, the CMLV countries are the least effective. For instance, Myanmar – despite its poor planning capacity – the state substantially controls most sectors of the country’s economy (e.g., energy, heavy industry, rice trade) and the business environment is generally unfriendly (Gonzales and Mendoza 2002). Regulatory Quality Southeast Asian countries that scored positively in government effectiveness also performed well in this dimension of governance. Table II.17 essentially mirrors the same performance of Singapore, Brunei, Malaysia, Thailand and the Philippines in regulatory effectiveness, while the CMLV countries and Timor Leste were on the negative side of the scale.
30

Table II.17 Regulatory Quality in Southeast Asia, 1996-2002 Countries 2002 2000 1998 1996 SGP 1.894 2.265 1.648 1.950 BRN 1.053 0.271 -0.059 2.200 MYS 0.576 0.349 0.566 0.696 THA 0.340 0.680 0.270 0.377 PHL 0.096 0.345 0.710 0.342 VNM -0.690 -0.607 -0.583 -0.545 IDN -0.682 -0.427 0.101 0.186 KHM -0.428 0.044 -0.218 -0.304 MMR -1.855 -1.372 -1.249 -1.031 LAO -1.238 -1.181 -1.178 -1.075 TMP -1.264 .. .. .. MEAN -0.200 0.037 0.001 0.280 STD 1.114 1.040 0.880 1.118
Source: KKM 2003 Singapore has the friendliest regulatory structure in the region, while the Philippines, Malaysia and Thailand have apparently relaxed many of their stringent and market-unfriendly policies. Clearly, the command economies in the region, Lao PDR, Myanmar, and Viet Nam, are still bogged down by a number of restrictive policies. One of the reasons for the maintenance of state control of the economies in Lao PDR and Myanmar, for instance, is that the ruling party or junta would want to prevent the emergence of alternative centers of power that may emerge in the private sector. Both countries have in fact not undertaken market-oriented liberalizing reforms. Meanwhile, Viet Nam’s liberalization policy, doi moi, which dates back to the mid-1980s, is limited only to marketing of goods and services. Essentially, the state still determines the economic inputs to production and processing of goods. Although Cambodia is the only market economy among the CMLV, much of its economy is still dominated by illegal activities (casinos, narcotics, and illegal logging, for instance) even as it still lacks the basic infrastructure such as roads and power grids (Gonzales and Mendoza 2002, Haas 2004). The cost of business entry in Southeast Asia as a fraction of GDP per capita also varies in the region. For instance, registration costs in Thailand and Singapore are comparable to those of OECD countries, while it is more expensive to do so in Viet Nam and Indonesia. To some extent, the number of procedures to register a business in the region correlates with income per capita. Thus, lower income economies such as Viet Nam, the Philippines, and Indonesia have more procedures. Although some have argued that while stricter regulation of entry could bring about better quality of products, better environmental records, or sharper competition, it could also lead to higher levels of corruption and bigger size of the unofficial economy. This is because costly regulations deter entry into the formal sector and reduce competition (Gonzales and Mendoza 2002). In the long run, costly regulations deter the entry of foreign direct investments that create jobs and reduce unemployment, especially for poor countries in the region. The lack of
31

adequate employment opportunities at home could then drive many people to explore overseas employment as migrant workers, which is the case for the Philippines and Indonesia. They become vulnerable to a number of risks, including physical abuse, rape (especially in the case of women workers), and white slavery. Human trafficking of women and children, especially the poor and uneducated, is another consequence of lack of job opportunities that stems from inadequate employment-generating investments. Rule of Law and Control of Corruption A big disparity also exists among Southeast Asian countries as far as rule of law is concerned. Table II.18 shows that Singapore tops the region in this dimension of good governance, followed by Brunei, Malaysia, and Thailand. Indonesia and the Philippines, along with Timor Leste and CMLV countries, are on the negative side of the scale. Myanmar and Lao PDR consistently scored the lowest in the region in this dimension. Control of corruption is related to the rule of law, and it is not surprising that Table II.19 somewhat mirrors the performance of Southeast Asian countries (except Thailand) in the same manner.
Table II.18 Rule of Law in Southeast Asia, 1996-2002 Countries 2002 2000 1998 1996 SGP 1.751 2.117 2.239 2.015 BRN 0.645 0.943 0.915 0.669 MYS 0.577 0.549 0.817 0.800 THA 0.300 0.428 0.398 0.464 PHL -0.498 -0.500 -0.040 -0.109 VNM -0.393 -0.737 -0.806 -0.472 IDN -0.802 -0.898 -0.974 -0.338 KHM -0.860 -0.736 -0.728 -0.864 MMR -1.620 -1.141 -1.058 -1.253 LAO -1.050 -1.017 -1.071 -1.292 TMP -1.106 .. .. .. Mean -0.278 -0.099 -0.031 -0.038 STD 0.989 1.066 1.109 1.037
Source: KKM 2003 Prior to the Asian financial crisis, there was a more positive perception of rule of law in the region. As Southeast Asian countries experienced tremendous growth, confidence in their legal institutions also increased. However, some weak points within the region emerged, such as the erosion of judicial independence and the rise in corruption levels. Indonesia and the Philippines are on the negative scale of both indexes given that in these countries, economic rent-seekers are perceived as having primarily responsible for undermining the institutions that are designed to keep them out. The concentration of wealth in a few families in these countries (including Thailand) also explains their poor
32

ratings in the two dimensions of good governance. This is so because wealth concentration, combined with the interlocking links between owners and government officials, overshadows the independence of legal institutions. Specifically, in the context of “state capture”, legal institutions are subverted and are less likely to evolve in a manner that promotes transparent and market-based activities. According to one study (Claessens, Jankov, and Lang 1999), there is also a strong correlation between the share of the largest 15 families in total market capitalization, on one hand, and the efficiency of the judicial system, the rule of law, and corruption, on the other (Gonzales and Mendoza 2002).
Table II.19 Control of Corruption in Southeast Asia (1996-2002) Countries 2002 2000 1998 1996 SGP 2.304 2.501 2.516 2.039 BRN 0.321 -0.146 0.059 0.342 MYS 0.375 0.183 0.747 0.480 THA -0.153 -0.340 -0.119 -0.297 PHL -0.525 -0.492 -0.349 -0.368 VNM -0.680 -0.751 -0.620 -0.599 IDN -1.161 -1.087 -0.993 -0.439 KHM -0.904 -0.565 -1.270 -0.871 MMR -1.368 -1.252 -1.299 -1.087 LAO -1.251 -0.907 -0.702 -0.871 TMP -0.530 .. .. .. MEAN -0.325 -0.286 -0.203 -0.167 STD 1.051 1.070 1.144 0.925
Source: KKM 2003 Thailand’s score in both indexes (positive in the rule of law but negative in control of corruption) is somewhat intriguing. The country is quite strong in terms of judicial independence but still has problems with controlling corruption. The emergence of Prime Minister Thaksin’s Thai Rak Thai party has raised questions about corruption, governance, and press freedom (Cronin 2004). Since the acquittal of Thaksin by the Constitution Court in 2001 of assets concealment charges, public confidence in Thailand’s democratic institutions appears to have sagged. The National Counter Corruption Commission, which indicted Thaksin, continues to perform its job well in dealing with graft allegations against Thaksin’s cabinet members and prominent bureaucrats. It has demonstrated exceptional mettle in the face of fierce and powerful critics and enemies (Thitinan 2003). In Viet Nam, the Nam Cam scandal in December 2001 revealed an organized criminal network engaged in a number of criminal activities such as murder, drug trafficking, prostitution, gambling, extortion and fraud. It involved high-ranking party and state officials that extended from Ho Chi Minh City to Hanoi, Haiphong, and other provinces and cities. This scandal resulted in the expulsion of members in the Vietnamese Communist Party and arrest of twelve party members including senior police officials.
33

More importantly, it has also tarnished the reputation of Ho Chi Minh City as the country’s center for economic reform and renovation (Thayer 2003). The Nam Cam scandal essentially points to the level of corruption in Viet Nam’s ruling party and state bureaucracy that extends to the criminal underground economy of the country. Corruption also has an impact in the health and education welfare of the poor. In their study of the relationship between corruption and health and education outcomes in the Philippines, Azfar and Gurgur (2004) concluded that corruption lowers the immunization rate of children, delays the vaccination of newborns, prevents the treatment of patients, discourages the use of public health clinics, reduces satisfaction of households with public health services, and increases waiting time of patients at health clinics. Corruption also has a negative effect on education outcomes: it reduces test scores, lowers national ranking of schools, raises variation of test scores within schools and reduces satisfaction ratings. They also argued that corruption affects public services in rural areas in different ways than urban areas, and that corruption harms the poor more than the wealthy. H. Governance and Human Development Each aspect of governance would definitely influence the course of human development. For example, lack of government effectiveness translates into bad economic policies and poor delivery of public goods. This would curtail the opportunities of a country’s citizens, especially if the level of social services is scaled down. Political instability and ethnic conflicts adversely affects human security, which has a direct link to human development. Finally, unabated corruption in the government deprives the citizens of the country also in terms of basic infrastructure and public goods. Many other examples could be cited. What is more important is to determine whether the quality of governance in Southeast Asia can explain the general trend in human development in this region: i.e. it has a lower level compared to similar groupings of countries in Europe and Latin America, it displays more disparity, and the convergence process is slow or even non-existent. In order to facilitate the analysis, simple correlations between the 2001 Human Development Index and the six indicators of governance were calculated across the ten Southeast Asian countries for which the HDI is available (Table II.20). The data show that the HDI is strongly correlated with all the six indicators of governance. An interesting observation is that the HDI is more closely associated with factors that have a more direct bearing on the economy: the quality of regulation, rule of law and government effectiveness. Meanwhile, a cursory look at the computed standard deviations of the six governance indicators (Tables II.14-19) shows that the disparity among countries hardly changed between 1996 and 2002. This implies that the quality of governance across countries in Southeast Asia has not converged. The existing evidence, therefore, points to the quality
34

of governance as one factor that accounts for the aforementioned general trend of human development in Southeast Asia.
Table II.20 Correlation Coefficient between 2001 HDI and Various Indicators
of Governance for 2002 Voice and Accountability 0.708 Political Stability 0.703 Government Effectiveness 0.896 Regulatory Quality 0.914 Rule of Law 0.905 Control of Corruption 0.833 NOTE: Correlation coefficient computed using data for ten Southeast Asian countries. Timor Leste does not yet have a calculated HDI. Source of basic data: UNDP HDR 2003 and KKM 2003.
I. Narrowing the Gap Through Regional Economic Integration and
Regional Cooperation This is a clear indication that there is great divergence in the basic economic and social infrastructure in East Asia. This observation also applies in the case when only Southeast Asian countries are considered since the summary measures are approximately the same. Evidence presented in this chapter points to human resource development and governance as two factors that could help explain the disparity, low level, and lack of convergence of human development in this region. The next two chapters of this report focus on the role of regional economic integration and regional cooperation—particularly with regard to human resource development and governance—in narrowing the gaps in human development in Southeast Asia. The relatively huge disparity among these countries is actually a hindrance to more effective regional economic integration and regional cooperation. For example, activities at the regional level require special types of capabilities on the part of participating countries for the preparation, assessment, and implementation of regional integration or cooperation agreements. A relatively low value of the HDI may indicate that the country does not possess the necessary capabilities. Hence, addressing both issues of human development and regional cooperation simultaneously may create a virtuous feedback mechanism in Southeast Asia.
35

References Asra, Abuzar (2000): “Poverty and Inequality in Indonesia: Estimates, Decomposition
and Key Issues,” Journal of the Asia Pacific Economy 5 (1/2): 91-111. Azfar, Omar and Tugrul Gurgur (2004): “Does Corruption Affect Health and Education
Outcomes in the Philippines?” The IRIS Discussion Papers on Institutions and Development, No. 04/07. College Park: Center for Institutional Reform and Informal Sector, Univeristy of Maryland, March.
Claessens, Stijn, Simeon Djankov and Larry H. P. Lang (1999): “Who Controls East
Asian Corporations?” World Bank Working Paper, February. Cronin, Richard P. (2004): “Challenges of Governance in Asia: Significance for Regional
Security and Stability.” In Yoichiro Sato (ed.) Growth and Governance in Asia. Honolulu: The Asia-Pacific Center for Security Studies.
Fareed Zakaria (1997): “The Rise of Illiberal Democracy,” Foreign Affairs, Vol. 76, No.
6 (November). Freedom House (2003): “Singapore”. Accessed from http:
www.freedomhouse.orgg/research/freeworld/2003/countryratings/singapore.htm. George, Cherian (2000): Singapore: The Air-Conditioned Nation. Landmark Books,
Singapore. Gonzales, Eduardo T. and Magdalena L. Mendoza (2002): Governance in Southeast
Asia: Issues and Options. Manila: Philippine Institute for Development Studies. Government of Malaysia: Department of Statistics Website,
http://www.statistics.gov.my/english/framesetkeystates.htm. Haas, Michael (2004): “Internal Security, Democratization, and Globalization in
Southeast Asia,” in Yoichiro Sato (ed.) Growth and Governance in Asia. Honolulu: The Asia-Pacific Center for Security Studies.
Herderson, Jeffrey, David Hulme, Richard Philips and Noorul Ainur M Nur (2002).
Economic Governance and Poverty Reduction in Malaysia. Jomo Kwame Sundaram (1988). A Question of Class: Capital, the State,and Uneven
Development in Malaya. New York: Monthly Review Press. Karras, G. (1997): “Economic Integration and Convergence: Lessons from Asia, Europe
and Latin America.” Journal of Economic Integration 12(4), 419-432 (December)
36

Kaufmann, Daniel, Aart Kraay and Mossimo Mastruzzi (2003): Governance Matters III: Governance Indicators 1996-2002, from http://ideas.repec.org/p/wpa/wuwpma/0308006.html.
Khong Cho-Oon (1995): “Singapore: Political Legitimay Through Managing
Conformity”, in Muthiah Alagappa (ed.), Political Legitimacy in Southeast Asia: Stanford University Press.
Lam Per Eng. “Singapore: Rich State, Illiberal Regime”, in James W. Morley (ed.),
Political Change in the Asia-Pacific Region. Institute of Southeast Asian Studies, Singapore, 1999.
Mauzy, Diane K. and R.S. Milne. Singapore Politics Under the People’s Action Party.
Routledge, London, 2002. Milne, R.S and Mauzy, Diane (1999). Malaysian Politics Under Mahathir. London:
Routledge. Rodan, Garry (1996): “Elections without representation: The Singapore experience under
the PAP”, in R.H. Taylor (ed.), The Politics of Elections in Southeast Asia. Woodrow Wilson Center Press and Cambridge University Press.
Smith, Anthony L. (2003): “Indonesia in 2002: Megawati’s Way,” Southeast Asian
Affairs 2003: Singapore: Institute of Southeast Asian Studies. Steinberg, David I. (2003): “Myanmar Reconciliation – Progress in the Process?”
Southeast Asian Affairs 2003. Singapore: Institute of Southeast Asian Studies. Thayer, Carlyle A. (2003): “Viet Nam: The Stewardship of Nong Duc Manh,” in
Southeast Asian Affairs 2003. Singapore: Institute of Southeast Asian Studies. Thitinan Pongsudhirak (2003): “Thailand: Democratic Authoritarianism,” in Southeast
Asian Affairs 2003. Singapore: Institute of Southeast Asian Studies. Tjhin, Christine, Aries Arugay & Herman Kraft (2004): Assessing Democratisation in
Southeast Asia: Towards Regional Grassroots Empowerment. CSIS Working Paper, March. Accessed at http://www.csis.or.id/papers/wps051.
Transparency International Website at http://www.transparency.org Vasil, Raj K. (2000): Governing Singapore: Democracy and National Development. St.
Leonards: Allen and Unwin. Weatherbee, Donald E. (2004): “Governance in Southeast Asia: The Good, the Bad and
the Ugly,” in Yoichiro Sato (ed.) Growth and Governance in Asia. Honolulu: The Asia-Pacific Center for Security Studies.
37

Worthington, Ross (2003): Governance in Singapore. Routledge, London. Yeo Law Hwee (2003): “Electoral Politics in Singapore” in Aurel Croissant, Gabriele
Burns and Marei John (eds.) Electoral Politics in Southeast & East Asia. Friedrich Ebert Stiftung, Singapore.
The World Bank (2004). East Asia Update on Strong Fundamentals to the Fore,
accessed from http://www.worldbank.org/wbi/reducingpoverty/Conference.html.
38

Appendix to Chapter II Human Development Indicators for Selected Countries in
Europe and Latin America
Table AII.1 Human Development Indicators for EU-15
HDI Life Education GDP Public exp Per Capita Gender- GINI IndexExpectancy Index per capita on educ health exp related
at Birth (PPP US$) as % of GDP devt index1990 2001 2001 2001 1990 1998-2000 2000
Austria 0.890 0.929 78.30 0.97 26730 5.40 5.80 2245.00 0.924 30.0 (1997) Belgium 0.892 0.937 78.50 0.99 25520 5.00 5.90 2306.00 0.931 25.0 (1996) Denmark 0.893 0.930 76.40 0.99 29000 - 8.20 2434.00 0.928 24.7 (1997) Finland 0.894 0.930 77.80 0.99 24430 5.60 6.10 1698.00 0.928 26.9 (2000) France 0.896 0.925 78.70 0.96 23990 5.40 5.80 2380.00 0.923 32.7 (1995) Germany 0.885 0.921 78.00 0.96 25350 - 4.60 2768.00 0.924 28.3 (2000) Greece 0.869 0.892 78.10 0.93 17440 2.50 3.80 1349.00 0.886 35.4 (1998) Ireland 0.871 0.930 76.70 0.96 32410 5.20 4.40 1908.00 0.923 36.0 (1996) Italy 0.884 0.916 78.60 0.93 24670 3.10 4.50 2028.00 0.910 36.0 (2000) Luxembourg 0.886 0.930 78.10 0.90 53780 3.00 3.70 2785.00 0.920 30.8 (1995) Netherlands 0.904 0.938 78.20 0.99 27190 6.00 4.80 2216.00 0.934 32.6 (1994) Portugal 0.847 0.896 75.90 0.97 18150 4.20 5.80 1397.00 0.892 38.5 (1997) Spain 0.883 0.918 79.10 0.97 20150 4.40 4.50 1547.00 0.912 32.5 (1990) Sweden 0.893 0.941 79.90 0.99 24180 7.40 7.80 2108.00 0.940 25.0 (1995) United Kingdom 0.877 0.930 77.90 0.99 24160 4.90 4.50 1804.00 0.928 36.0 (1999)
Mean 0.88 0.92 78.01 0.97 26476.67 4.78 5.35 2064.87 0.92 STD 0.01 0.01 1.03 0.03 8473.07 1.34 1.33 448.74 0.01 CV 0.02 0.02 0.01 0.03 0.32 0.28 0.25 0.22 0.02
39
Table AII.2 Human Development Indicators for Accession 12
HDI Life Education GDP Public exp Per Capita Gender- GINI IndexExpectancy Index per capita on educ health exp related
at Birth (PPP US$) as % of GDP devt index1990 2001 2001 2001 1990 1998-2000 2000
Bulgaria 0.792 0.795 70.9 0.91 6890 5.2 3.4 225 0.794 31.9 (2001) Czech Republic 0.835 0.861 75.1 0.91 14720 - 4.4 1031 0.857 25.4 (1996) Estonia 0.814 0.833 71.2 0.96 10170 - 7.5 540 0.831 37.2 (2000) Hungary 0.803 0.837 71.5 0.93 12340 5.8 5 838 0.834 24.4 (1999) Latvia 0.803 0.811 70.5 0.95 7730 3.8 5.9 406 0.81 32.4 (1998) Lithuania 0.819 0.824 72.3 0.94 8470 4.6 6.4 430 0.823 36.3 (2000) Malta 0.812 0.856 78.1 0.87 13160 4.3 4.9 803 0.844 - Poland 0.794 0.841 73.6 0.95 9450 - 5 575 0.839 31.6 (1998) Romania 0.768 0.773 70.5 0.88 5830 2.8 3.5 190 0.771 30.3 (2000) Slovak Republic - 0.836 73.3 0.9 11960 5.1 4.2 653 0.834 25.8 (1996) Slovenia 0.843 0.881 75.9 0.94 17130 - - 1463 0.879 28.4 (1999) Cyprus 0.844 0.891 78.1 0.9 21190 3.5 5.4 904 0.886 -
Mean 0.81 0.84 73.42 0.92 11586.67 4.39 5.05 671.50 0.83 STD 0.02 0.03 2.80 0.03 4495.56 0.99 1.22 362.03 0.03 CV 0.03 0.04 0.04 0.03 0.39 0.23 0.24 0.54 0.04

Table AII.3 Human Development Indicators for CIS-7
HDI Life Education GDP Public exp Per Capita Gender- GINI IndexExpectancy Index per capita on educ health exp related
at Birth (PPP US$) as % of GDP devt index1990 2001 2001 2001 1990 1998-2000 2000
Armenia 0.756 0.729 72.1 0.86 2650 7 2.9 192 0.727 37.9 (1998) Azerbaijan - 0.744 71.8 0.88 3090 - 4.2 57 - 36.5 (2001) Georgia - 0.746 73.4 0.89 2560 - - 197 - 36.9 (2001) Kyrgystan - 0.727 68.1 0.91 2750 8.3 5.4 145 - 29.0 (2001) Moldova 0.756 0.7 68.5 0.86 2150 - 4 65 0.697 36.2 (2001) Tajikistan 0.736 0.677 68.3 0.9 1170 9.7 2.1 29 0.673 34.7 (1998) Uzbekistan 0.728 0.729 69.3 0.91 2460 - - 86 0.727 26.8 (2000)
Mean 0.74 0.72 70.21 0.89 2404.29 8.33 3.72 110.14 0.71 STD 0.01 0.02 2.17 0.02 614.49 1.35 1.27 67.69 0.03 CV 0.02 0.03 0.03 0.02 0.26 0.16 0.34 0.61 0.04
Table AII.4 Human Development Indicators for Latin America
HDI Life Education GDP Public exp Per Capita Gender- GINI IndexExpectancy Index per capita on educ health exp related
at Birth (PPP US$) as % of GDP devt index1990 2001 2001 2001 1990 1998-2000 2000
Argentina 0.807 0.849 73.9 0.94 11320 1.1 4 1091 0.839 52.2 (2001) Brazil 0.712 0.777 67.8 0.90 7360 - 4.7 631 0.77 58.5 (2001) Chile 0.780 0.831 75.8 0.89 9190 2.5 4.2 697 0.821 57.1 (2000) Mexico 0.757 0.800 73.1 0.86 8430 3.6 4.4 477 0.790 54.6 (2000) Peru 0.702 0.752 69.4 0.88 4570 2.2 3.3 238 0.734 49.8 (2000) Paraguay 0.726 0.751 70.5 0.84 5210 1.1 5.0 323 0.739 56.8 (1999) Uruguay 0.799 0.834 75.0 0.93 8400 3 2.8 1007 0.83 44.6 (2000)
Mean 0.75 0.80 72.21 0.89 7782.86 2.25 4.06 637.71 0.79 STD 0.04 0.04 3.02 0.04 2324.22 1.01 0.77 324.05 0.04 CV 0.06 0.05 0.04 0.04 0.30 0.45 0.19 0.51 0.05
40