Embed Size (px)
Citation preview
South Dayton Valley Area Drainage Master Plan Executive Summary
June 2020
prepared for
Lyon County | Carson Water Subconservancy District
8400 S Kyrene Rd, STE 201
Tempe, AZ 85284
www.jefuller.com
i
Table of Contents
1 Introduction .......................................................................................................................................... 1
1.1 Project Purpose ............................................................................................................................. 1
1.2 Project Location ............................................................................................................................ 1
1.3 Previous Studies ............................................................................................................................ 3
1.4 Historical Flowpath Assessment ................................................................................................... 3
2 Hydrologic and Hydraulic Modeling ...................................................................................................... 5
2.1 Method Description ...................................................................................................................... 5
2.2 Hydrology Overview ...................................................................................................................... 5
2.3 Model Results ............................................................................................................................... 6
2.4 Verification of Results ................................................................................................................. 13
2.5 Summary ..................................................................................................................................... 13
3 Sedimentation Analyses ...................................................................................................................... 14
3.1 Sediment Sampling and Transport Analyses ............................................................................... 14
3.2 Sediment Transport Analyses ..................................................................................................... 14
3.3 Results ......................................................................................................................................... 14
4 Flood Hazard Classification ................................................................................................................. 18
4.1 Hazard Results ............................................................................................................................. 18
4.1.1 HAZUS Analysis Results ....................................................................................................... 25
5 Regional Flood Mitigation Alternatives .............................................................................................. 26
5.1 Introduction ................................................................................................................................ 26
5.2 Mitigation Alternatives ............................................................................................................... 26
5.2.1 Alternative 1 ........................................................................................................................ 26
5.2.2 Alternative 1a ...................................................................................................................... 26
5.2.3 Alternative 1b ...................................................................................................................... 26
5.2.4 Summary ............................................................................................................................. 27
5.3 Selected Regional Mitigation Alternative ................................................................................... 32
5.4 Ranchos Drainage Improvement Assessment ............................................................................ 34
5.4.1 Cost Estimates ..................................................................................................................... 35
5.5 Selected Regional Alternative Conceptual 15% Design Plans ..................................................... 35
5.6 Benefits Summary ....................................................................................................................... 36
5.6.1 Buildings Benefit ................................................................................................................. 36
5.6.2 Flood Risk Area and Flood Depth Reduction Benefit .......................................................... 38
ii
5.7 Future Design Considerations ..................................................................................................... 38
6 ADMP Mitigation Prioritization ........................................................................................................... 39
6.1 ADMP Limitations ....................................................................................................................... 41
7 References .......................................................................................................................................... 42
List of Figures
Figure 1-1. Study area vicinity map ............................................................................................................... 2
Figure 1-2. Historical flowpath comparison ................................................................................................. 4
Figure 2-1. Existing conditions 25-year, 24-hour flow depth results ............................................................ 7
Figure 2-2. Existing conditions 100-year, 6-hour flow depth results ............................................................ 8
Figure 2-3. Existing conditions 100-year, 24-hour flow depth results .......................................................... 9
Figure 2-4. Existing conditions 25-year, 24-hour discharge results ............................................................ 10
Figure 2-5. Existing conditions 100-year, 6-hour discharge results ............................................................ 11
Figure 2-6. Existing conditions 100-year, 24-hour discharge results .......................................................... 12
Figure 3-1. Total accumulated sediment transport capacity by the Yang methodology for the 100-year,
24-hour event ............................................................................................................................................. 15
Figure 3-2. Cumulative sediment transport profile for the primary overland flow path throughout the
100-year 24-hour event .............................................................................................................................. 17
Figure 4-1. USBR criteria flooding hazards to pedestrians based on the 100-year, 24-hour results ......... 19
Figure 4-2. USBR criteria flooding hazards to vehicles based on the 100-year, 24-hour results ............... 20
Figure 4-3. Hazardous road crossings during a 100-year, 24-hour storm (USBR criteria) ......................... 21
Figure 4-4. Hazardous road crossings during a 25-year, 24-hour storm (USBR criteria) ........................... 22
Figure 4-5. USBR criteria flooding hazards to buildings based on the 100-year, 24-hour results ............. 23
Figure 4-6. Building inundation assessment (100-Year, 24-Hour) result example .................................... 24
Figure 5-1. Conceptual layout of Alternative 1 ........................................................................................... 29
Figure 5-2. Conceptual layout of Alternative 1a ......................................................................................... 30
Figure 5-3. Conceptual layout of Alternative 1b ......................................................................................... 31
Figure 5-4. Selected mitigation system ....................................................................................................... 33
Figure 5-5. Example 15% design plan sheet for Basin #2 ........................................................................... 36
Figure 6-1. Potential mitigation construction phasing ............................................................................... 40
iii
List of Tables Table 4-1. Summary of flood damage estimates (base conditions) ........................................................... 25
Table 5-1. Alternative comparison summary .............................................................................................. 28
Table 5-2. Sediment design volumes .......................................................................................................... 34
Table 5-3. Drainage improvement concept cost estimates ........................................................................ 35
Table 5-4. Summary of buildings removed from potential inundation ...................................................... 37
Table 5-5. Summary of flood damage estimates and potential benefits ................................................... 37
Table 5-6. Potential flood risk area reduction benefit ................................................................................ 38
Table 6-1. Potential mitigation construction phasing cost ......................................................................... 41
1 South Dayton Valley Area Drainage Master Plan Executive Summary
1 INTRODUCTION
1.1 PROJECT PURPOSE The South Dayton Valley Area Drainage Master Plan (SDVADMP) was developed to meet three primary
objectives:
1. Evaluate and identify flooding and sedimentation hazards within the project area by completion
of a technical study that includes data collection, review of previous studies, information
gathering from public agencies and residents, hydrologic and hydraulic modeling, geomorphic
assessments, and field surveys.
2. Develop a series of alternatives to either partially or wholly mitigate the hazards identified in the
first objective.
3. Provide stakeholder coordination and public outreach of the project through a series of public
meetings to inform of the existing hazards and to present the mitigation alternatives.
Each major task of the project is presented herein with a description of the technical approach, analysis
results, interpretation of results, and applicability to the overall project purpose. The results of this
study can be used as a planning tool and as input to the design of potential future drainage
infrastructure and flood mitigation measures that are appropriate for the physical environment for both
existing and future development.
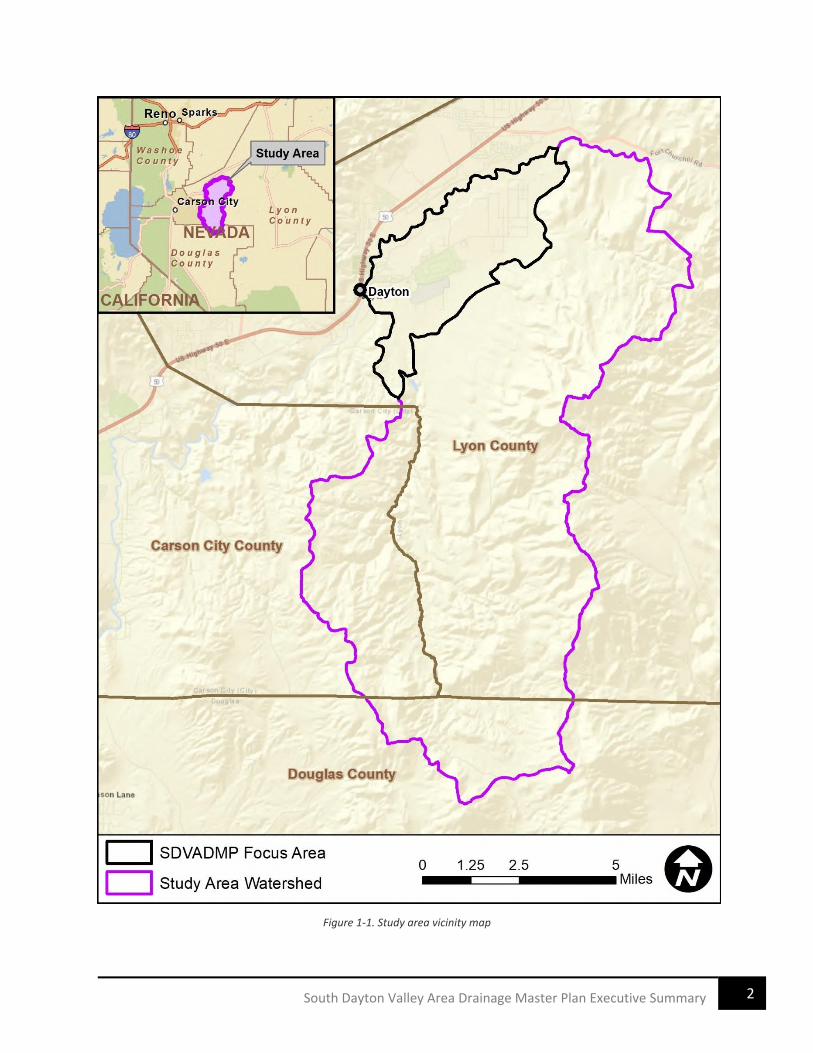
1.2 PROJECT LOCATION The SDVADMP study area is 97 square miles and is located on the northern slopes of the Pine Nut
Mountains, approximately 15 miles east of Carson City (Figure 1-1). Most of the study area spans Lyon
County, with smaller portions of the upper watershed extending into Carson City and Douglas Counties.
The percent study area by county is: Lyon County (75%), Carson City County (16%), and Douglas County
(9%). The primary focus area of the SDVADMP is the lower watershed area downstream of the
mountains, also shown on Figure 1-1.
2 South Dayton Valley Area Drainage Master Plan Executive Summary
Figure 1-1. Study area vicinity map
3 South Dayton Valley Area Drainage Master Plan Executive Summary
1.3 PREVIOUS STUDIES An early phase of the study included research and collection of previous reports and studies relevant to
the ADMP area. These included:
• Subdivision Drainage Reports
• Flood Insurance Studies and FEMA Floodplain Mapping
• U.S. Army Corps of Engineers Alluvial Fan Mapping
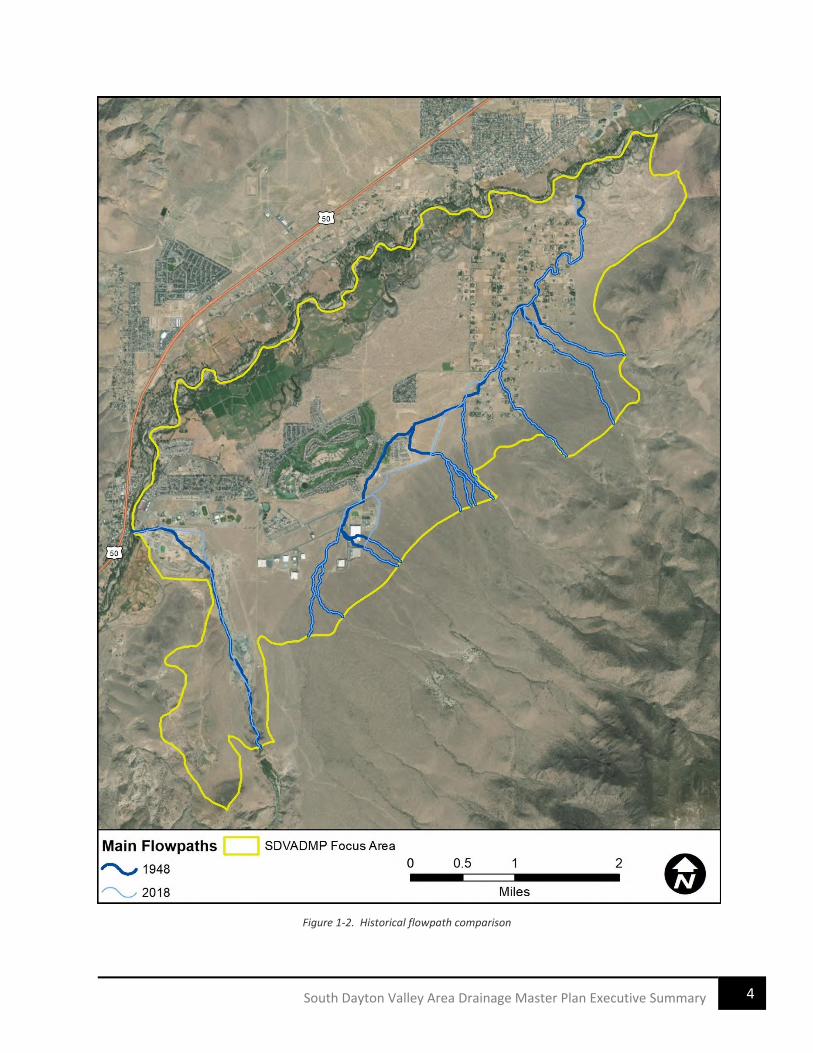
1.4 HISTORICAL FLOWPATH ASSESSMENT A historical flowpath assessment was conducted for the SDVADMP study area to assess the natural
flowpaths of the study watercourses with the goal that understanding the natural flowpaths will aid in
understanding the current flooding patterns and potential future flooding trends.
The most significant changes in flowpath alignment since 1948/1953 have occurred due to manmade
channel realignments (Figure 1-2). Both the historical and modern aerial photography indicate evidence
of distributary and active alluvial fan drainage patterns within the project focus area, but many of the
main drainage channels have remained laterally stable for at least the past 70 years. This suggests that
there may not have been a flood event of sufficient magnitude since at least 1948 to cause major
channel avulsions. The major watercourses were investigated during the field verification phase of the
ADMP and were not found to be incised or laterally confined within the lower project focus area. In
other words, there are no physical constraints that should have prevented historical channel avulsions
since 1948, which further suggests that there hasn’t been a flood event with sufficient energy to cause a
major channel avulsion. As such, flowpath uncertainty scenarios are not recommended for this study
area as they were in the Dayton Valley ADMP.
4 South Dayton Valley Area Drainage Master Plan Executive Summary
Figure 1-2. Historical flowpath comparison
5 South Dayton Valley Area Drainage Master Plan Executive Summary
2 HYDROLOGIC AND HYDRAULIC MODELING
2.1 METHOD DESCRIPTION To maintain consistency with the adjacent Dayton Valley Area Drainage Master Plan (DVADMP), the
same general procedures were used in model development. The procedures that were used for
hydrology and infiltration for the SDVADMP are as follows:
• Infiltration was simulated using runoff curve number (CN) methodology per the Lyon County
Drainage Guidelines (2018).
• Rainfall depths were based on the NOAA Atlas 14 (NOAA14) precipitation estimates.
• The hyetograph for the 6-hour storm was based on the balanced mass curve, while the
hyetographs for the 24-hour storms were based on the Nevada Department of Transportation
(NDOT) 90th percentile maximum intensity with smoothing by the generalized logistic equation
(GLE) (NDOT, 2015).
All modeling, both hydrologic and hydraulic, was done using the FLO-2D Pro software1 package, Build
No. 16.06.16 with an executable dated February 28, 2017. This version has been used for multiple area
drainage master studies and has functioned adequately. FLO-2D was selected for the SDVADMP due to
the following: 1) to maintain method consistency with other ADMPs and drainage studies in the area
(Manhard, 2012; JEF, 2019), 2) to streamline model development since there are many small subbasins
that would require individual analysis if a lumped parameter model, such as HEC-HMS were used, and 3)
FLO-2D is a combined rainfall-runoff model (i.e., both hydrologic and hydraulic processes are simulated
within the model).
2.2 HYDROLOGY OVERVIEW As a part of the SDVADMP, three design storms were simulated:
• 25-year, 24-hour
• 100-year, 24- hour
• 100-year, 6-hour
The 24-hour durations were chosen to be consistent with the County’s drainage regulations, while the 6-
hour duration was chosen because this higher intensity duration usually results in higher peak flow
estimates for smaller (i.e., < 20 square miles) drainage areas.
NOAA Atlas 14 (NOAA14) precipitation depth estimates were downloaded from the National Weather
Service (NWS) website (2018) as raster images.
1 https://www.flo-2d.com/
6 South Dayton Valley Area Drainage Master Plan Executive Summary
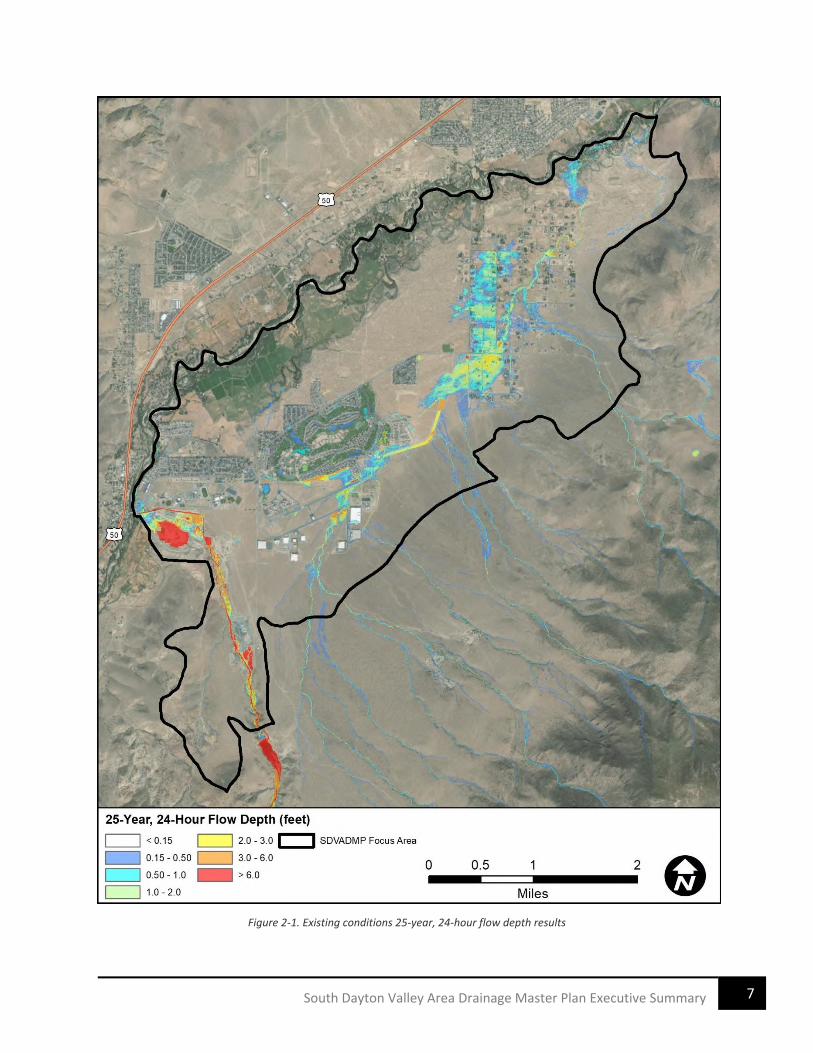
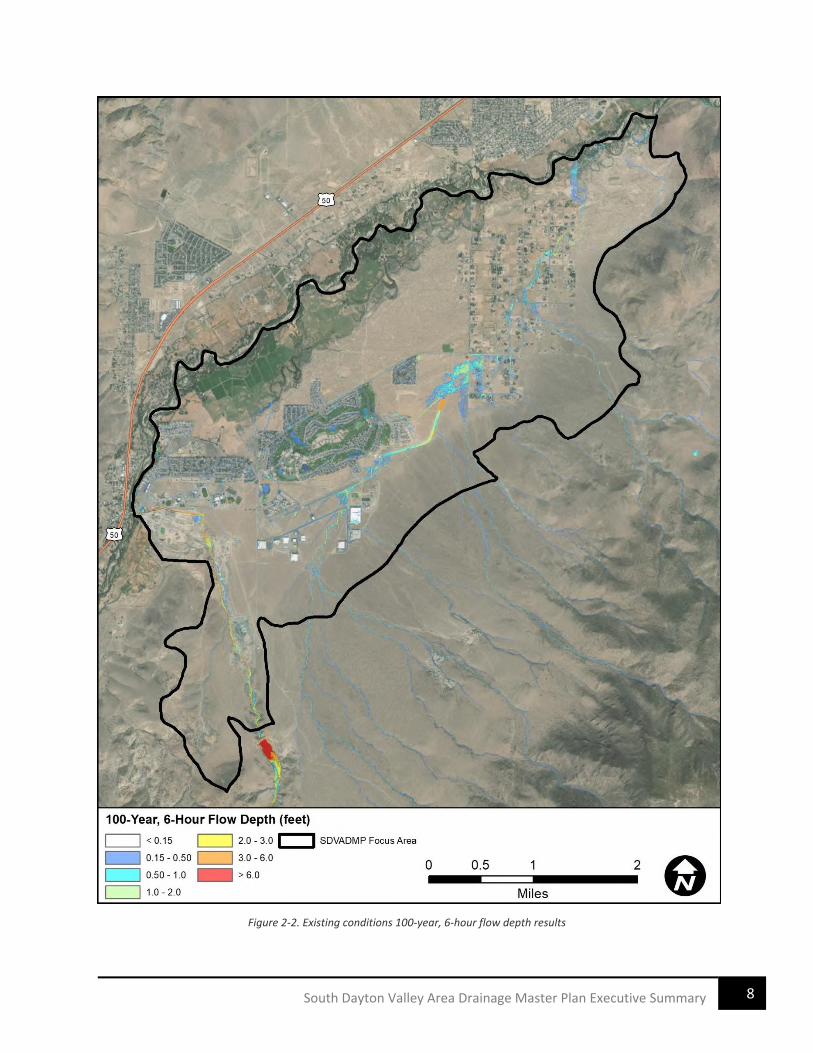
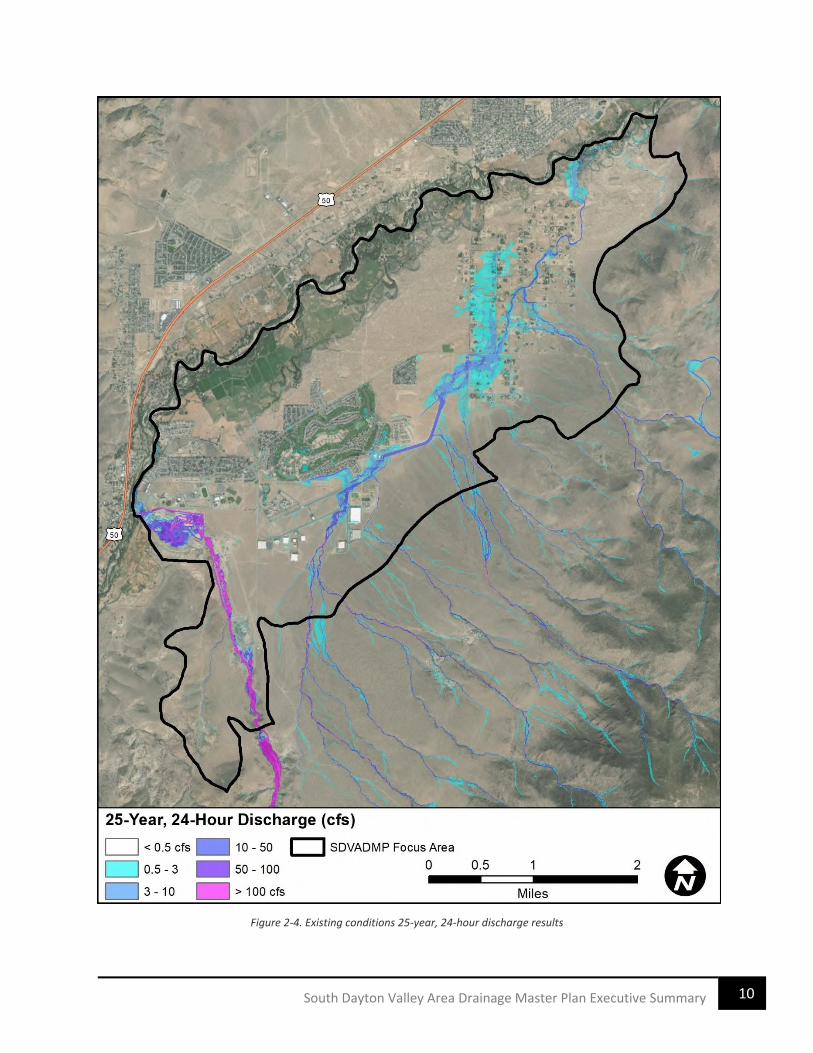
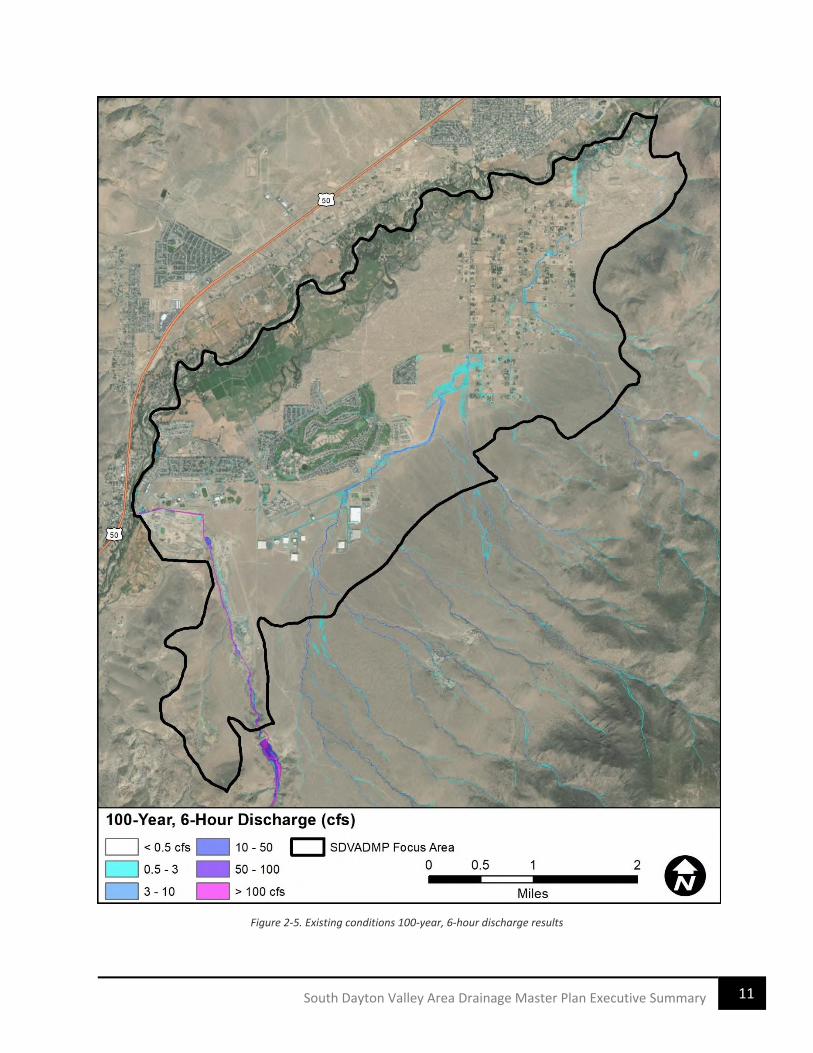
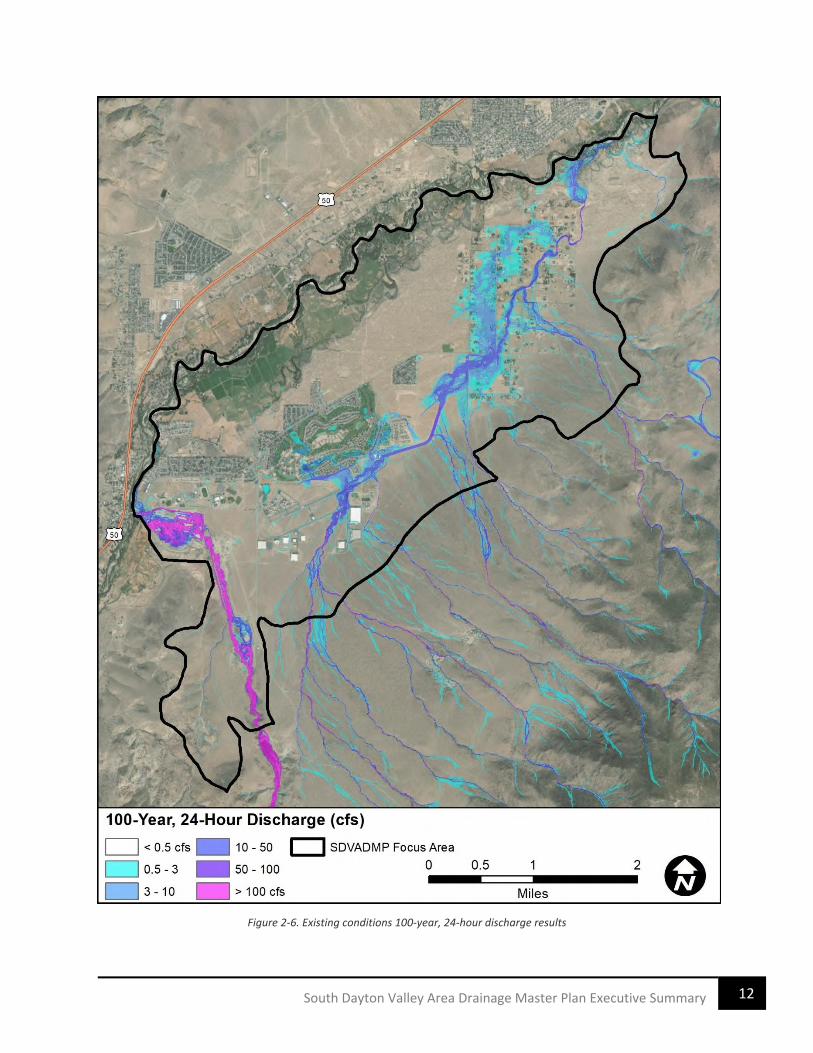
2.3 MODEL RESULTS Flow depth and discharge results from the existing conditions FLO-2D modeling are shown on Figure
2-1through Figure 2-6. These figures are for general illustrative purposes and not practical for obtaining
detailed information at site-specific locations. For more detailed information, the digital data are
included in Appendix C (of the main report).
7 South Dayton Valley Area Drainage Master Plan Executive Summary
Figure 2-1. Existing conditions 25-year, 24-hour flow depth results
8 South Dayton Valley Area Drainage Master Plan Executive Summary
Figure 2-2. Existing conditions 100-year, 6-hour flow depth results

9 South Dayton Valley Area Drainage Master Plan Executive Summary
Figure 2-3. Existing conditions 100-year, 24-hour flow depth results
10 South Dayton Valley Area Drainage Master Plan Executive Summary
Figure 2-4. Existing conditions 25-year, 24-hour discharge results
11 South Dayton Valley Area Drainage Master Plan Executive Summary
Figure 2-5. Existing conditions 100-year, 6-hour discharge results
12 South Dayton Valley Area Drainage Master Plan Executive Summary
Figure 2-6. Existing conditions 100-year, 24-hour discharge results
13 South Dayton Valley Area Drainage Master Plan Executive Summary
2.4 VERIFICATION OF RESULTS Model verification was conducted using the following sources:
• USGS Regression Equations
• County staff experience
• Resident flooding experience (photographs and videos)
• Eldorado Canyon Dam Hydraulic Modeling
2.5 SUMMARY The existing conditions FLO-2D models were created using the best available information for land cover,
land use, topography, and hydrology. Every effort was made to ensure the models represented existing
conditions as of the date of the LiDAR survey and the NEXTMap data. However, the NEXTMap did not
provide near the resolution of the LiDAR data, and areas along the LiDAR/NEXTMap seam were
smoothed to prevent erroneous ponding. Therefore, flow patterns and peak discharges in areas within
the NEXTMap limits should be verified before being used for future projects.
Photographs and anecdotal information collected from both Lyon County and the residents within the
community were used to help calibrate and verify the modeling results. Like all models, the SDVADMP
FLO-2D models are a simulation of potential conditions that could occur during a range of storm events.
The models cannot exactly duplicate actual, observed storm events at all locations within the
community due to the vast number of variables that change with each unique storm event.
The modeling results reflect the complex flooding and sedimentation hazards that exist within the South
Dayton Valley study area. The results provide valuable, quantitative, detailed information from which
future planning and development decisions can be based. The existing conditions models also serve as a
foundation from which potential mitigation alternatives can be assessed (Section 5).
Although the ADMP FLO-2D modeling effort was not intended to replicate an actual historical flood
event, the comparison of the modeling results with USGS regression equations, anecdotal flood
information, and independent hydraulic calculations indicate the project FLO-2D models suitably depict
storm runoff conditions – indicating that the underlying input parameters are reasonable. Given the
distributary nature of the flooding within the community, and the high sediment transport rates (see
Section 5), flooding characteristics (e.g., depth, discharge, location) are likely to change from one flood
event to the next. Even small anthropogenic changes to the landscape (e.g. dirt piles, berms,
construction of outbuildings, landscaping debris piles, etc.) will result in sediment accumulation, channel
scour, and changes in flowpath directions that may not be represented in the project FLO-2D modeling.
In other words, the results of the modeling represent potential flooding conditions as of the date of the
project topographic mapping. Updated mapping and FLO-2D modeling are recommended if major
changes to the landscape occur in the future.
14 South Dayton Valley Area Drainage Master Plan Executive Summary
3 SEDIMENTATION ANALYSES
3.1 SEDIMENT SAMPLING AND TRANSPORT ANALYSES The Sedimentation Analyses included the following major elements:
• 12 sediment samples collected, and gradation curves developed.
o Median D50 grain size was 6.4 mm.
o Average D50 grain size was 12.0 mm.
• Sediment Transport Analysis
3.2 SEDIMENT TRANSPORT ANALYSES The FLO-2D hydraulic modeling was used to assess the trends of both flooding and sedimentation
throughout the study area. Hydraulic data from FLO-2D inherently includes both discharge and flow
depth at each grid element. This hydraulic data was used to estimate sedimentation using the Yang
sediment transport equation (1973, 1984) on a cell-by-cell scale. For this study, only the Yang equation
was calculated based on the results of the analyses from the previous Dayton Valley ADMP.
For each modeled storm event, the total accumulated (i.e., throughout the entire storm event) sediment
transport capacities were calculated at each cell. These accumulated capacities can identify areas where
deposition or scour may be expected.
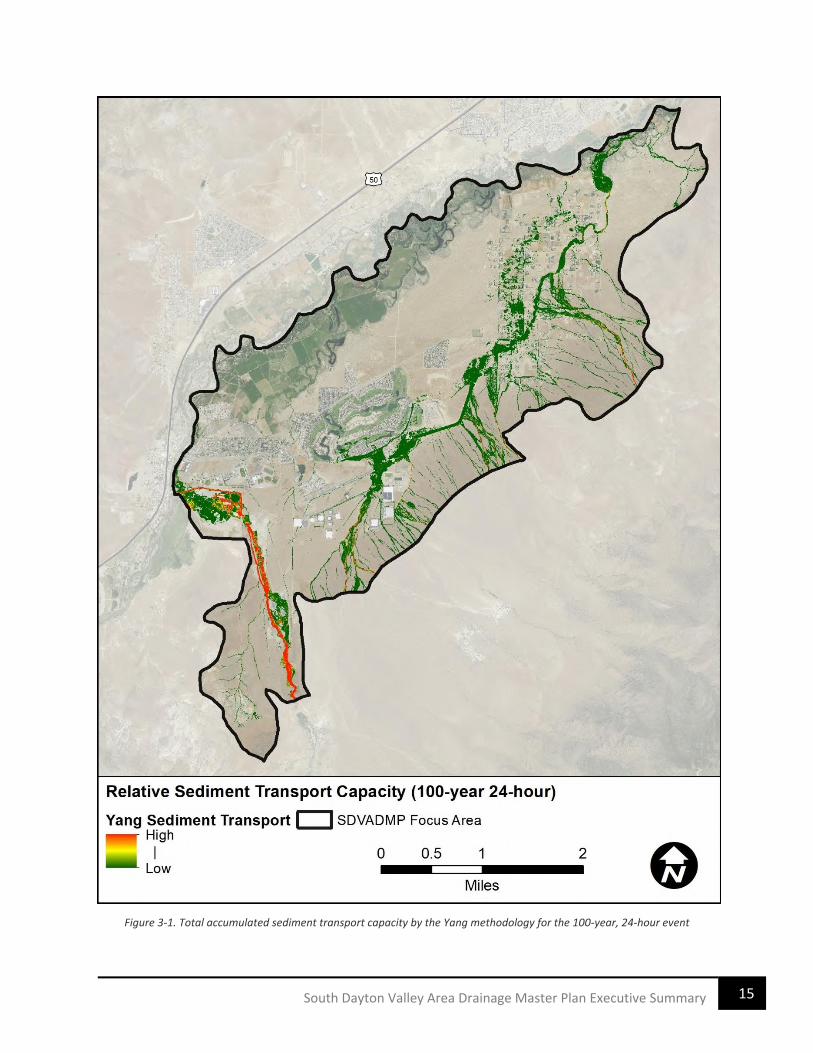
3.3 RESULTS Since the total accumulated transport is calculated at each cell, an overall map of the study area with
sediment transport capacities can be produced similar to the FLO-2D results presented in Section 3.
Since the 100-year, 24-hour storm produces the largest amount of flow and sediment, it is used as a
representative example. The relative total accumulated sediment transport within the focus area
calculated with the Yang equation is shown in Figure 3-1. Note - The colors in both these figures
represent relative transport capacity to each other, so green is relatively low compared to red, but green
is higher than areas without color.
In general, the results are straightforward. Higher sediment transport rates appear in the channels,
while lower rates appear as the flow spreads out over the piedmont. Unsurprisingly, the Eldorado
Canyon produces the most sediment because it has the largest drainage area with the longest drain
time. Finally, since these sediment results are based on hydraulic conditions, off-site inflows are
considered because inflow hydrographs have been input at all major watercourses through the
upstream FLO-2D modeling.
15 South Dayton Valley Area Drainage Master Plan Executive Summary
Figure 3-1. Total accumulated sediment transport capacity by the Yang methodology for the 100-year, 24-hour event
16 South Dayton Valley Area Drainage Master Plan Executive Summary
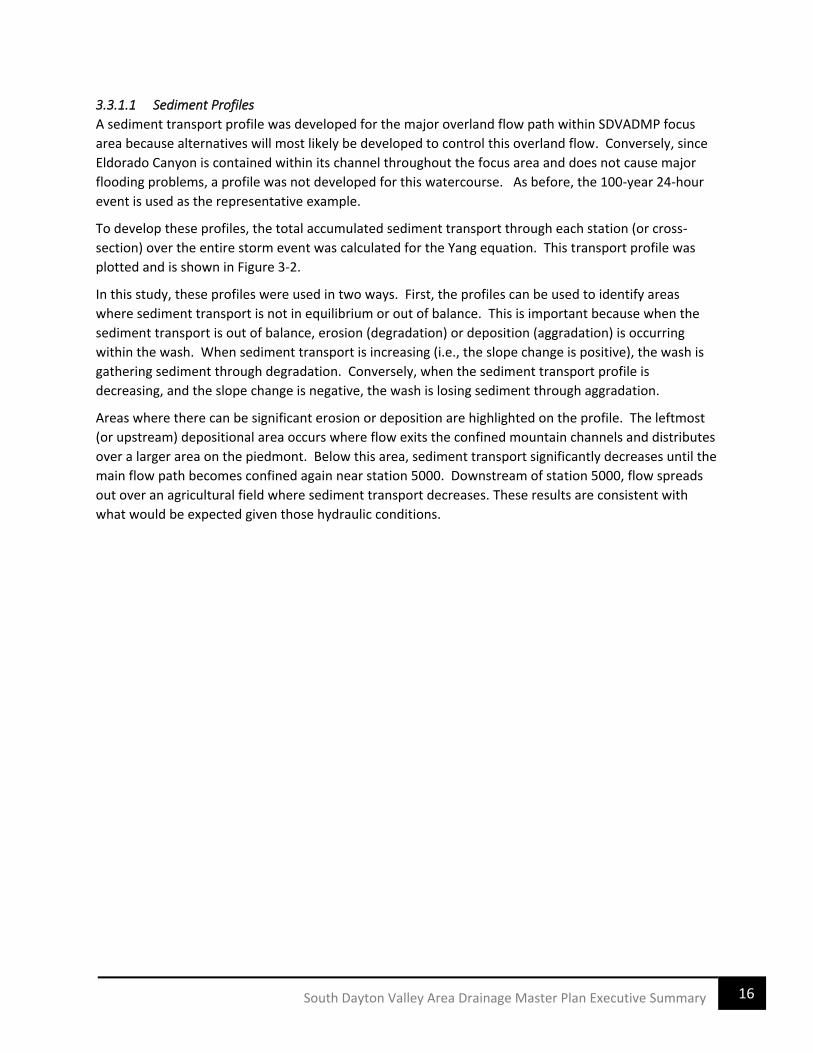
3.3.1.1 Sediment Profiles
A sediment transport profile was developed for the major overland flow path within SDVADMP focus
area because alternatives will most likely be developed to control this overland flow. Conversely, since
Eldorado Canyon is contained within its channel throughout the focus area and does not cause major
flooding problems, a profile was not developed for this watercourse. As before, the 100-year 24-hour
event is used as the representative example.
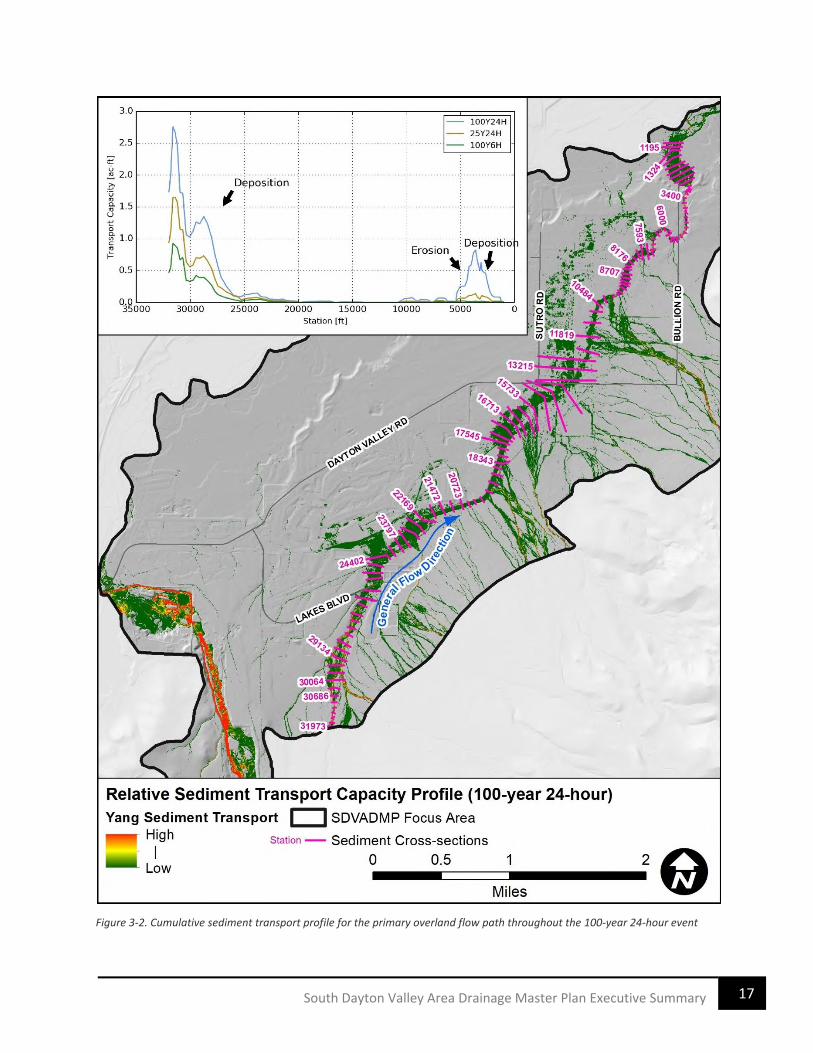
To develop these profiles, the total accumulated sediment transport through each station (or cross-
section) over the entire storm event was calculated for the Yang equation. This transport profile was
plotted and is shown in Figure 3-2.
In this study, these profiles were used in two ways. First, the profiles can be used to identify areas
where sediment transport is not in equilibrium or out of balance. This is important because when the
sediment transport is out of balance, erosion (degradation) or deposition (aggradation) is occurring
within the wash. When sediment transport is increasing (i.e., the slope change is positive), the wash is
gathering sediment through degradation. Conversely, when the sediment transport profile is
decreasing, and the slope change is negative, the wash is losing sediment through aggradation.
Areas where there can be significant erosion or deposition are highlighted on the profile. The leftmost
(or upstream) depositional area occurs where flow exits the confined mountain channels and distributes
over a larger area on the piedmont. Below this area, sediment transport significantly decreases until the
main flow path becomes confined again near station 5000. Downstream of station 5000, flow spreads
out over an agricultural field where sediment transport decreases. These results are consistent with
what would be expected given those hydraulic conditions.
17 South Dayton Valley Area Drainage Master Plan Executive Summary
Figure 3-2. Cumulative sediment transport profile for the primary overland flow path throughout the 100-year 24-hour event
18 South Dayton Valley Area Drainage Master Plan Executive Summary
4 FLOOD HAZARD CLASSIFICATION
4.1 HAZARD RESULTS Flood hazards were defined based on the physical characteristics of the flood water: location, depth,
and velocity. The results from the hazard assessments are included below:
• Flooding hazards to pedestrians Figure 4-1)
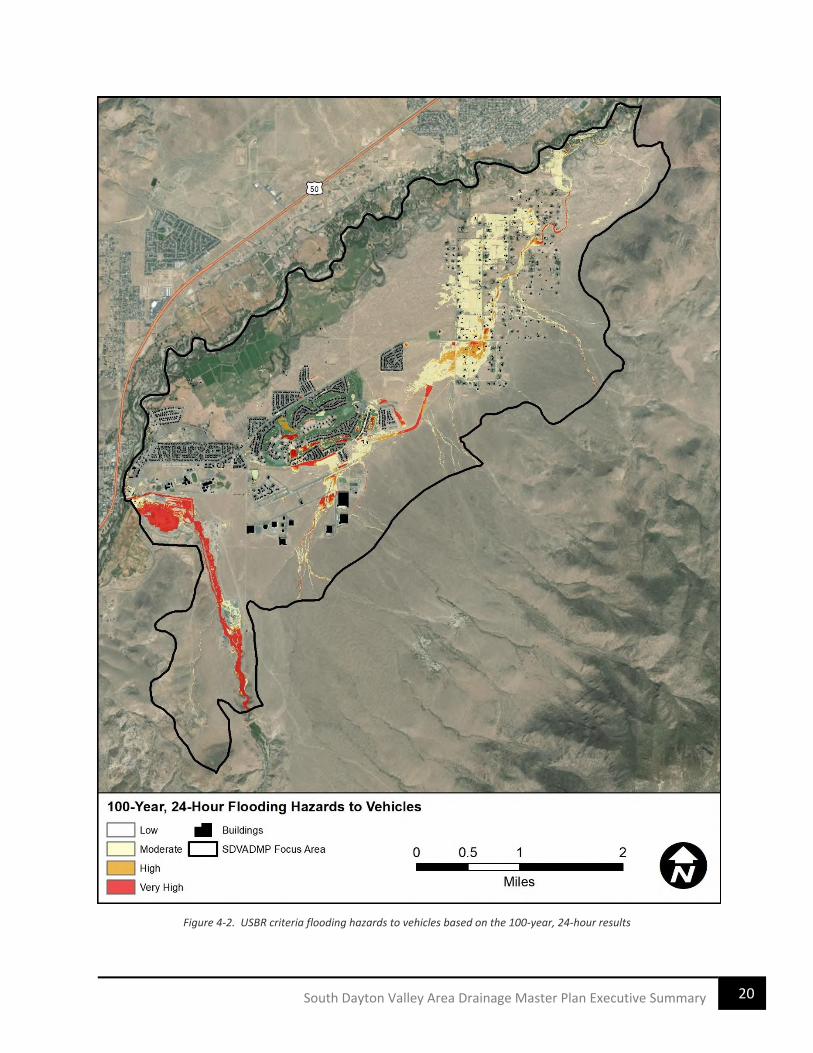
• Flooding hazards to vehicles Figure 4-2)
• Flooding hazards at specific roadway crossings
o 25-year, 24-hour storm (Figure 4-4)
o 100-year, 24-hour storm (Figure 4-3)
• Flooding hazards to buildings (Figure 4-5)
• Building inundation assessment (Figure 4-6)
These analyses help identify areas that have a higher risk of flooding and which property and
infrastructure are most susceptible to damage. Having this information helps focus the mitigation
alternative to areas where they are most needed.

19 South Dayton Valley Area Drainage Master Plan Executive Summary
Figure 4-1. USBR criteria flooding hazards to pedestrians based on the 100-year, 24-hour results
20 South Dayton Valley Area Drainage Master Plan Executive Summary
Figure 4-2. USBR criteria flooding hazards to vehicles based on the 100-year, 24-hour results

21 South Dayton Valley Area Drainage Master Plan Executive Summary
Figure 4-3. Hazardous road crossings during a 100-year, 24-hour storm (USBR criteria)
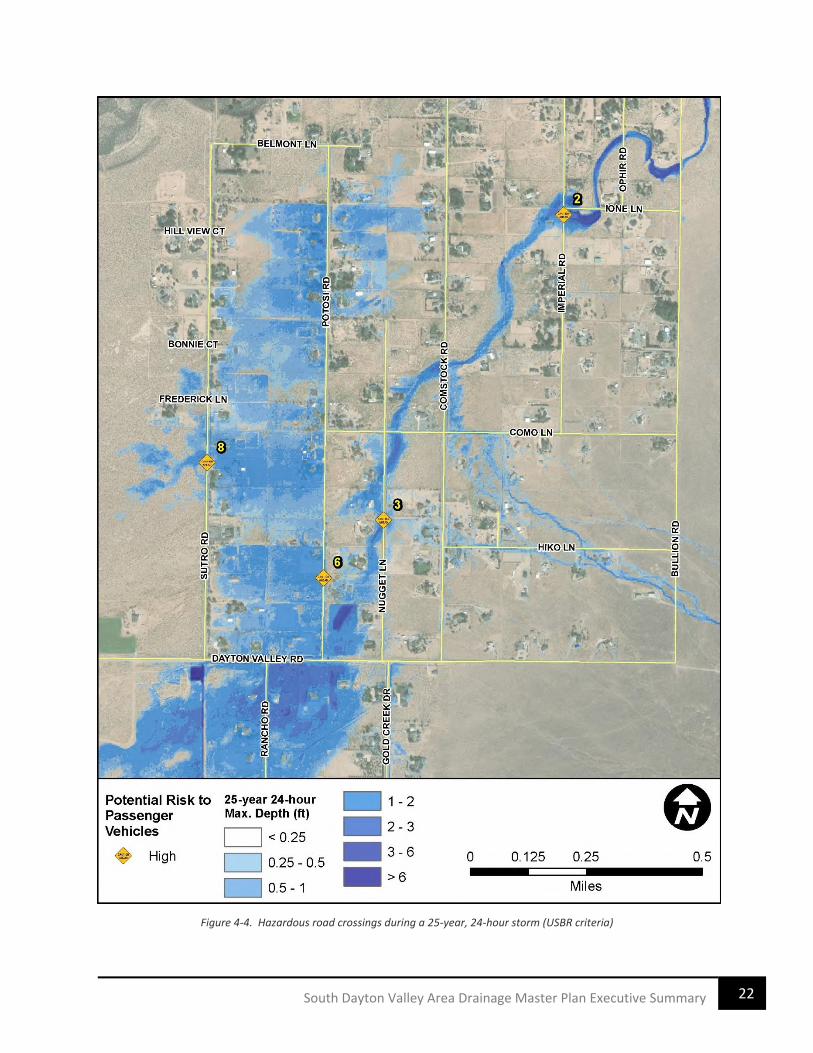
22 South Dayton Valley Area Drainage Master Plan Executive Summary
Figure 4-4. Hazardous road crossings during a 25-year, 24-hour storm (USBR criteria)

23 South Dayton Valley Area Drainage Master Plan Executive Summary
Figure 4-5. USBR criteria flooding hazards to buildings based on the 100-year, 24-hour results
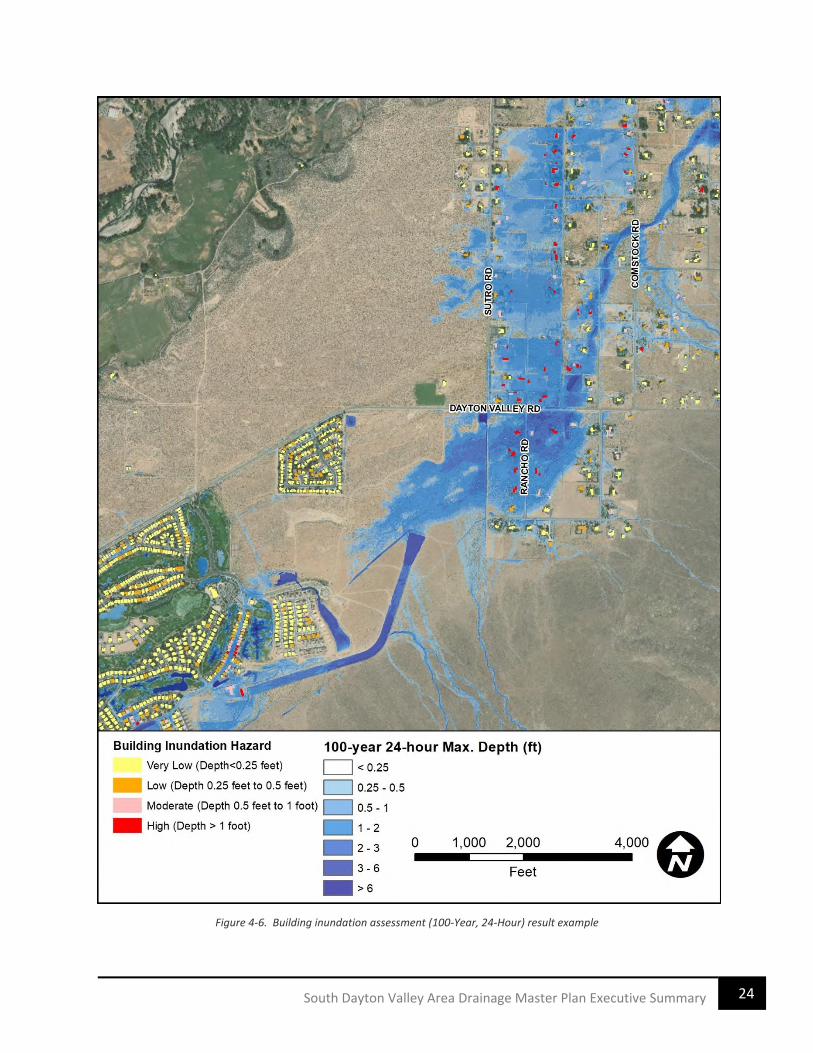
24 South Dayton Valley Area Drainage Master Plan Executive Summary
Figure 4-6. Building inundation assessment (100-Year, 24-Hour) result example
25 South Dayton Valley Area Drainage Master Plan Executive Summary
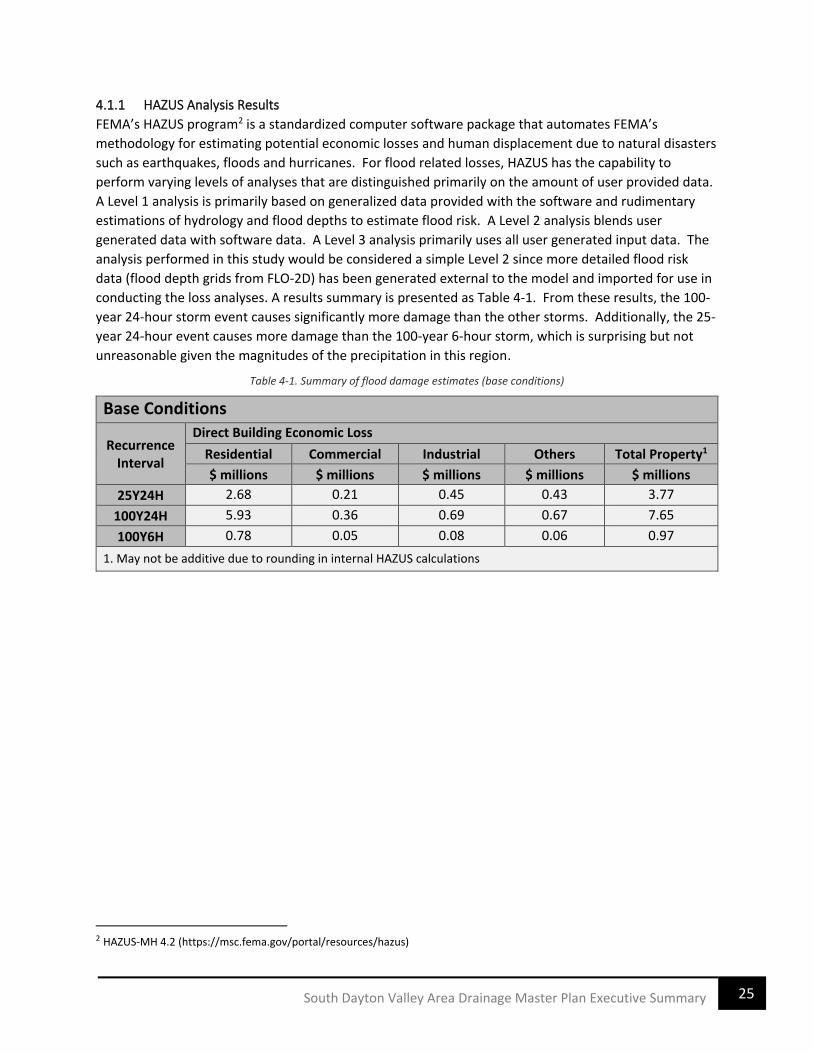
4.1.1 HAZUS Analysis Results
FEMA’s HAZUS program2 is a standardized computer software package that automates FEMA’s
methodology for estimating potential economic losses and human displacement due to natural disasters
such as earthquakes, floods and hurricanes. For flood related losses, HAZUS has the capability to
perform varying levels of analyses that are distinguished primarily on the amount of user provided data.
A Level 1 analysis is primarily based on generalized data provided with the software and rudimentary
estimations of hydrology and flood depths to estimate flood risk. A Level 2 analysis blends user
generated data with software data. A Level 3 analysis primarily uses all user generated input data. The
analysis performed in this study would be considered a simple Level 2 since more detailed flood risk
data (flood depth grids from FLO-2D) has been generated external to the model and imported for use in
conducting the loss analyses. A results summary is presented as Table 4-1. From these results, the 100-
year 24-hour storm event causes significantly more damage than the other storms. Additionally, the 25-
year 24-hour event causes more damage than the 100-year 6-hour storm, which is surprising but not
unreasonable given the magnitudes of the precipitation in this region.
Table 4-1. Summary of flood damage estimates (base conditions)
Base Conditions
Recurrence Interval
Direct Building Economic Loss
Residential Commercial Industrial Others Total Property1
$ millions $ millions $ millions $ millions $ millions
25Y24H 2.68 0.21 0.45 0.43 3.77
100Y24H 5.93 0.36 0.69 0.67 7.65
100Y6H 0.78 0.05 0.08 0.06 0.97
1. May not be additive due to rounding in internal HAZUS calculations
2 HAZUS-MH 4.2 (https://msc.fema.gov/portal/resources/hazus)

26 South Dayton Valley Area Drainage Master Plan Executive Summary
5 REGIONAL FLOOD MITIGATION ALTERNATIVES
5.1 INTRODUCTION The development of the regional alternatives comprised the following elements:
1) Drainage improvement assessment for the Ranchos area
2) Flood hazard identification
3) Alternative formulation/evaluation
4) Development of conceptual 15% design plans and cost estimates for the selected mitigation
alternative
5.2 MITIGATION ALTERNATIVES The consultant team developed three mitigation alternative systems that were presented to Lyon
County. Each system was comprised of a series of sediment/detention basins and collector/conveyance
channels in various configurations that would result in significant mitigation of offsite flooding to the
South Dayton community.
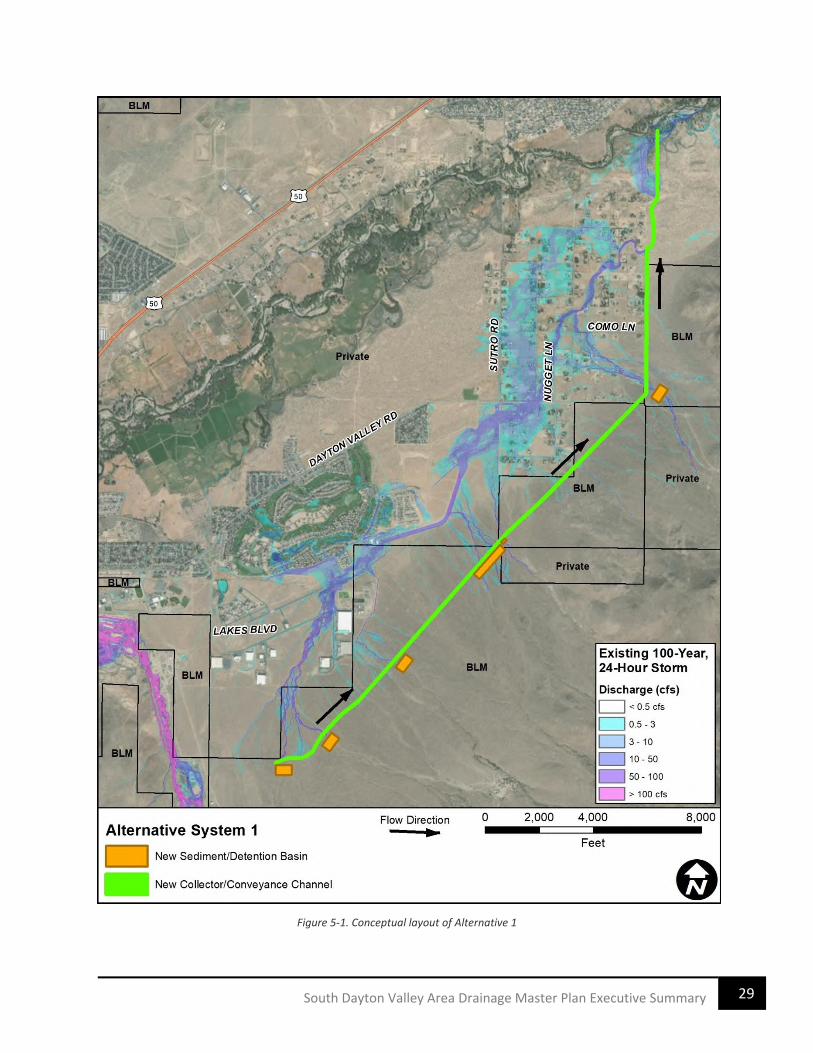
5.2.1 Alternative 1
Alternative 1 was initially proposed as six sediment/detention basins located at the major offsite
drainage channels on the lower piedmont. The basins would be connected to a collector/conveyance
channel that spanned the entire length of the piedmont and drained to the Carson River east of the
South Dayton community (Figure 5-1).
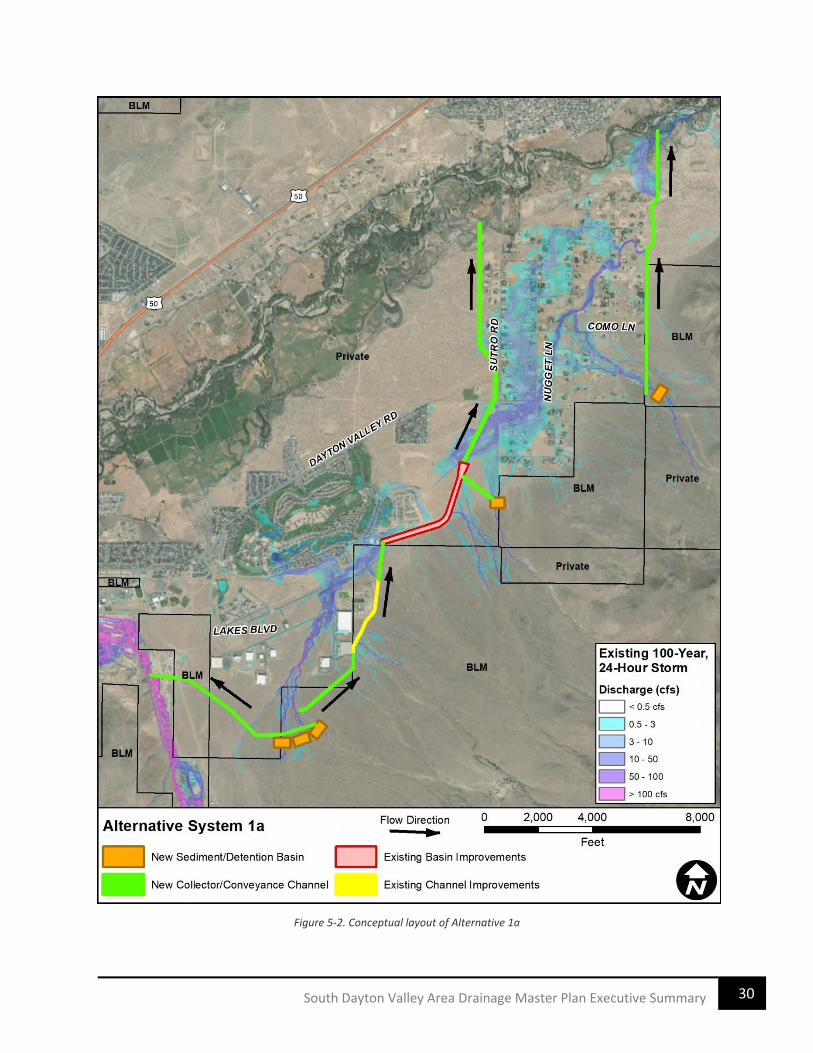
5.2.2 Alternative 1a
Alternative 1a is comprised of five sediment/detention basins, a series of collector/conveyance
channels, and proposed improvements to existing drainage infrastructure (Figure 5-2). Three basins
would be located south of the airport commercial district and would collect and pass offsite runoff to a
conveyance channel that would flow to the northwest and empty into the main channel of El Dorado
Canyon. A separate collector channel would be constructed southeast of the airport commercial district
and would be incorporated into the existing drainage channel to the east of the commercial district. The
existing channel would need to be improved to collect and convey the storm runoff. A new conveyance
channel would need to extend from the existing channel to the existing regional detention basin east of
the Dayton Valley Golf Course community. The existing basin would also need to be improved to safely
detain and convey the storm runoff. A new conveyance channel would extend from the existing basin
outlet across Dayton Valley Road and north to the Carson River.
To mitigate offsite flows from east of the Ranchos area, a single sediment/detention basin would be
located on the main drainage corridor and would connect to a collector/conveyance channel that would
extend directly north and connect to the existing channel that exists the Ranchos development. The
existing channel would require improvements to convey the storm runoff directly north to the Carson
River.
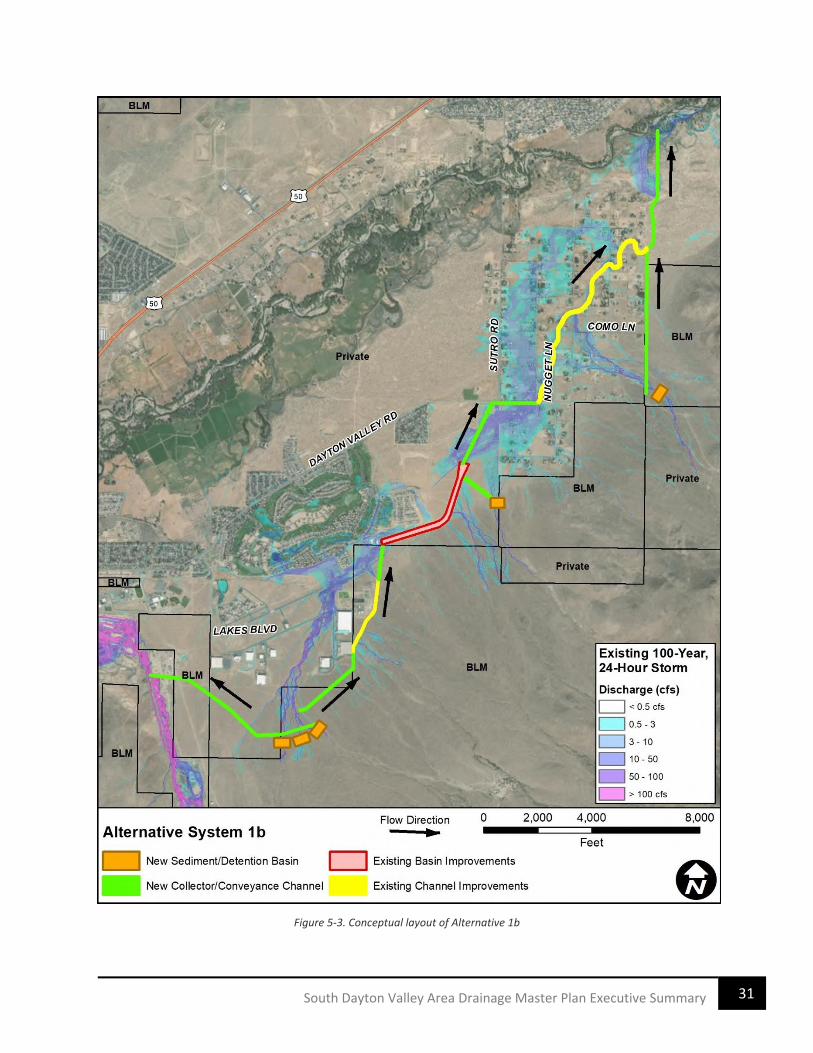
5.2.3 Alternative 1b
Alternative 1b incorporates all the structure elements of 1a except for the conveyance system
downstream of the existing regional basin. The 1b system includes a conveyance channel from the basin

27 South Dayton Valley Area Drainage Master Plan Executive Summary
outlet to Dayton Valley Road, then extends south of the road to the existing drainage channel that flows
through the Ranchos development (Figure 5-3). A new culvert at Dayton Valley Road would allow the
flow to pass beneath the road to the existing channel. The ADMP hydraulic modeling results indicate a
section of the existing channel does not have capacity to convey the offsite flow, thus channel
improvements would be necessary. The existing channel alignment through the Ranchos intersects
many individual private parcels.
5.2.4 Summary
Figure 5-1 through Figure 5-3 illustrate the conceptual layout of each alternative system. Land
ownership within the alternative areas is either Private or Bureau of Land Management (BLM). The land
ownership boundaries are shown in the figures.
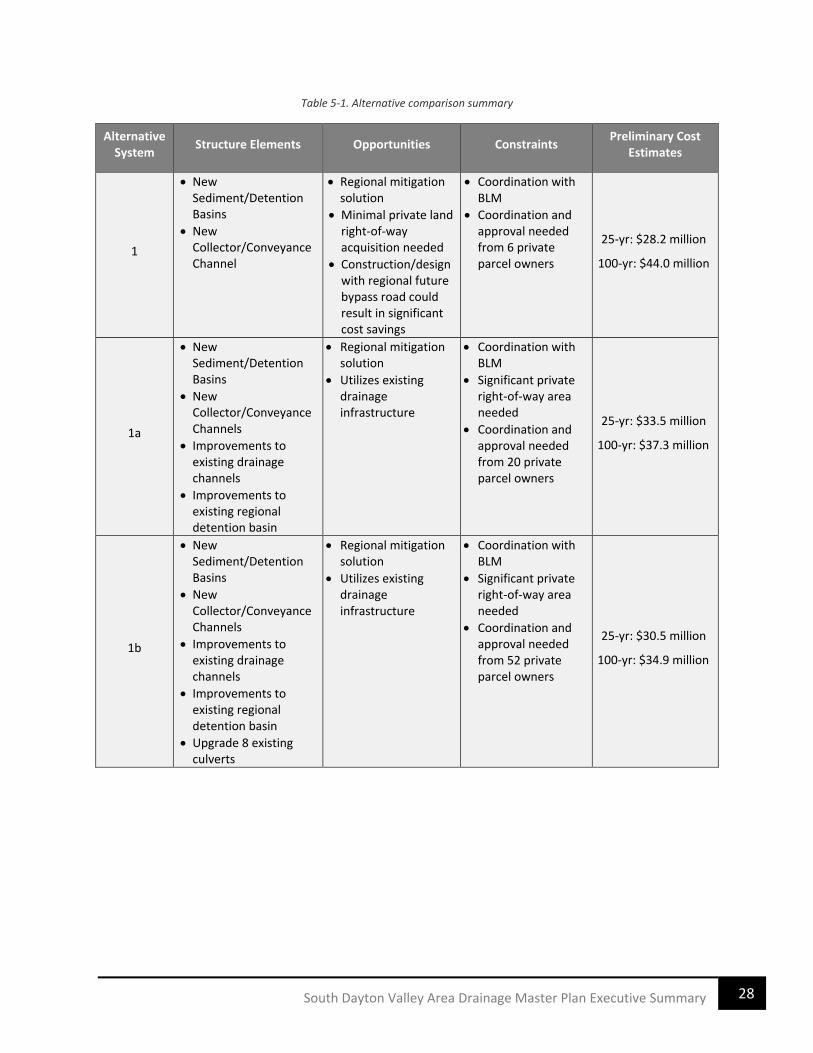
Table 5-1 provides a summary of the alternatives and the key opportunities and constraints that were
presented to Lyon County to aid in their decision in selecting a preferred alternative system to advance
to the conceptual design phase of the ADMP.
28 South Dayton Valley Area Drainage Master Plan Executive Summary
Table 5-1. Alternative comparison summary
Alternative System
Structure Elements Opportunities Constraints Preliminary Cost
Estimates
1
• New Sediment/Detention Basins
• New Collector/Conveyance Channel
• Regional mitigation solution
• Minimal private land right-of-way acquisition needed
• Construction/design with regional future bypass road could result in significant cost savings
• Coordination with BLM
• Coordination and approval needed from 6 private parcel owners
25-yr: $28.2 million
100-yr: $44.0 million
1a
• New Sediment/Detention Basins
• New Collector/Conveyance Channels
• Improvements to existing drainage channels
• Improvements to existing regional detention basin
• Regional mitigation solution
• Utilizes existing drainage infrastructure
• Coordination with BLM
• Significant private right-of-way area needed
• Coordination and approval needed from 20 private parcel owners
25-yr: $33.5 million
100-yr: $37.3 million
1b
• New Sediment/Detention Basins
• New Collector/Conveyance Channels
• Improvements to existing drainage channels
• Improvements to existing regional detention basin
• Upgrade 8 existing culverts
• Regional mitigation solution
• Utilizes existing drainage infrastructure
• Coordination with BLM
• Significant private right-of-way area needed
• Coordination and approval needed from 52 private parcel owners
25-yr: $30.5 million
100-yr: $34.9 million
29 South Dayton Valley Area Drainage Master Plan Executive Summary
Figure 5-1. Conceptual layout of Alternative 1
30 South Dayton Valley Area Drainage Master Plan Executive Summary
Figure 5-2. Conceptual layout of Alternative 1a
31 South Dayton Valley Area Drainage Master Plan Executive Summary
Figure 5-3. Conceptual layout of Alternative 1b
32 South Dayton Valley Area Drainage Master Plan Executive Summary
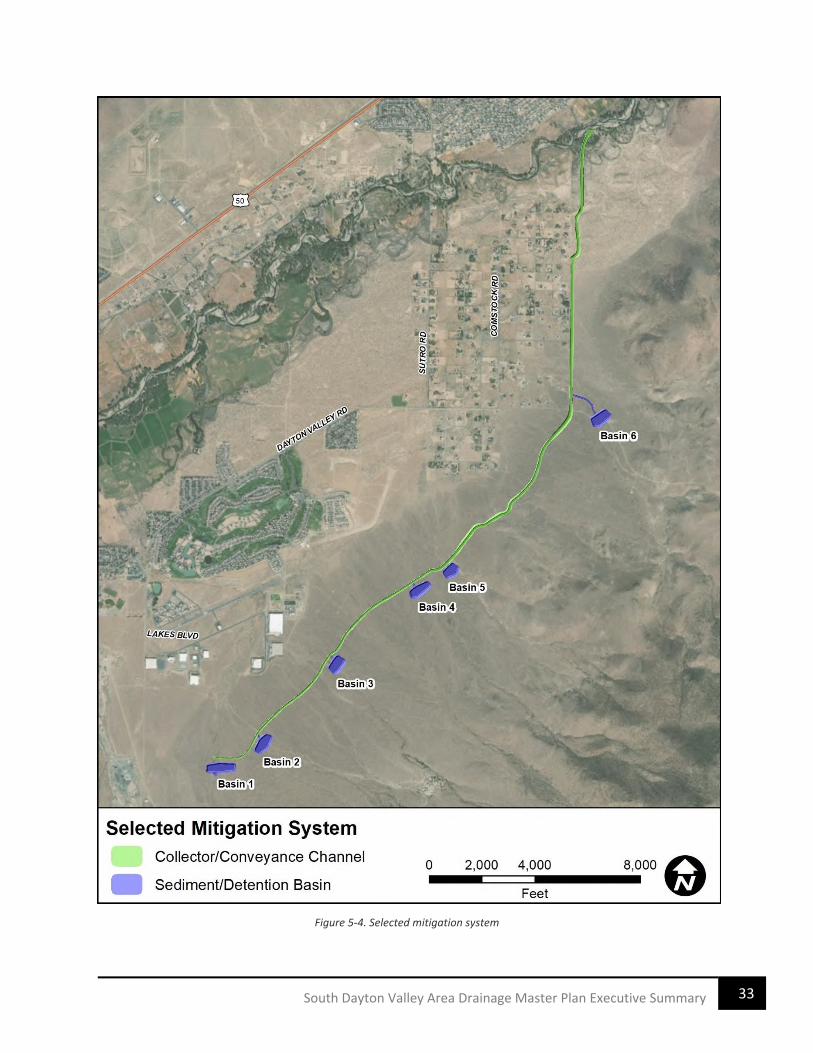
5.3 SELECTED REGIONAL MITIGATION ALTERNATIVE Lyon County selected Alternative System 1 to advance to the concept phase of the ADMP. The final
system concept is comprised of six sediment/detention basins and one collector/conveyance channel
that spans the length of most of the Pine Nut Mountain piedmont that drains to South Dayton (Figure
5-4). The consultant team developed proposed mitigation structures for both the 100-year and 25-year
storms to assess which would provide the most overall benefit. There were many considerations that
led to the selection of the alternative system. A few of the most significant are:
• Provides a regional solution that mitigates most of the offsite flood risk to the South Dayton
community.
• The Lyon County Comprehensive Master Plan3 includes a proposed South Dayton Bypass Road
that could parallel the proposed conveyance channel, resulting in significant cost savings if
constructed concurrently with mitigation system; or at least each project is designed and
constructed with the other project in mind.
• The basins and channel are located primarily on public land which would minimize the number
of private landowners involved in acquiring property right-of-way to construct and maintain
the system.
3 https://www.lyon-county.org/773/Comprehensive-Master-Plan
33 South Dayton Valley Area Drainage Master Plan Executive Summary
Figure 5-4. Selected mitigation system
34 South Dayton Valley Area Drainage Master Plan Executive Summary
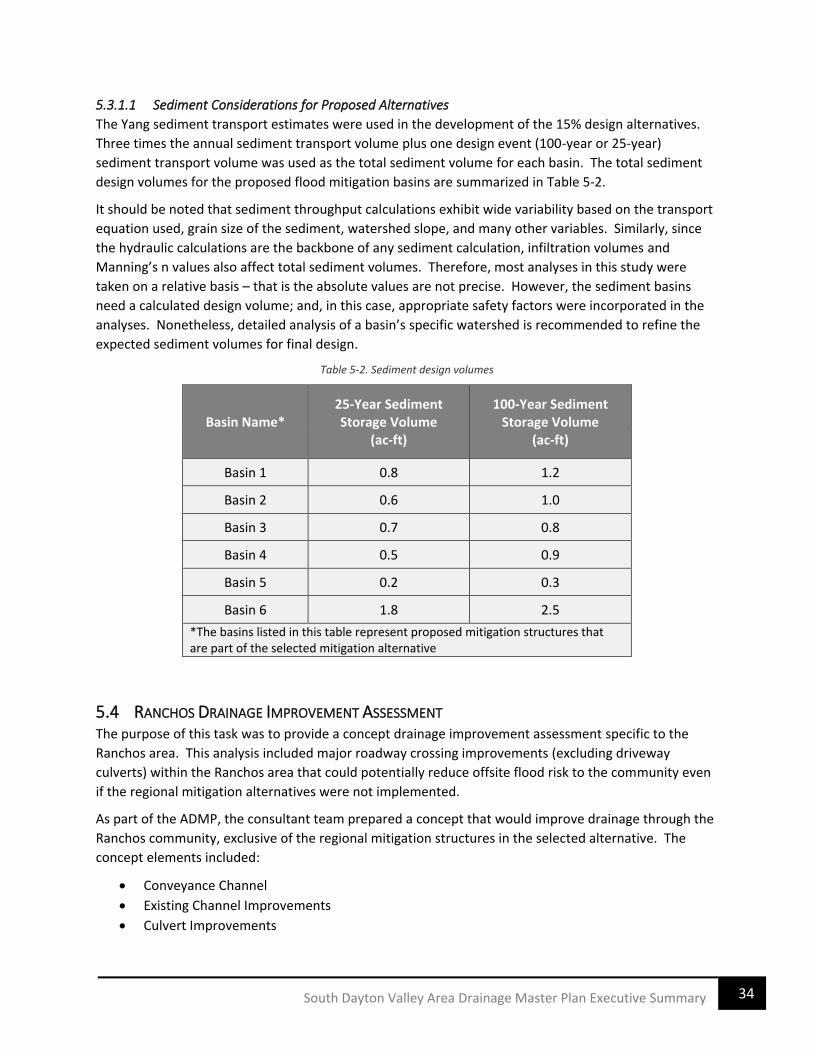
5.3.1.1 Sediment Considerations for Proposed Alternatives
The Yang sediment transport estimates were used in the development of the 15% design alternatives.
Three times the annual sediment transport volume plus one design event (100-year or 25-year)
sediment transport volume was used as the total sediment volume for each basin. The total sediment
design volumes for the proposed flood mitigation basins are summarized in Table 5-2.
It should be noted that sediment throughput calculations exhibit wide variability based on the transport
equation used, grain size of the sediment, watershed slope, and many other variables. Similarly, since
the hydraulic calculations are the backbone of any sediment calculation, infiltration volumes and
Manning’s n values also affect total sediment volumes. Therefore, most analyses in this study were
taken on a relative basis – that is the absolute values are not precise. However, the sediment basins
need a calculated design volume; and, in this case, appropriate safety factors were incorporated in the
analyses. Nonetheless, detailed analysis of a basin’s specific watershed is recommended to refine the
expected sediment volumes for final design.
Table 5-2. Sediment design volumes
Basin Name* 25-Year Sediment Storage Volume
(ac-ft)
100-Year Sediment Storage Volume
(ac-ft)
Basin 1 0.8 1.2
Basin 2 0.6 1.0
Basin 3 0.7 0.8
Basin 4 0.5 0.9
Basin 5 0.2 0.3
Basin 6 1.8 2.5
*The basins listed in this table represent proposed mitigation structures that are part of the selected mitigation alternative
5.4 RANCHOS DRAINAGE IMPROVEMENT ASSESSMENT The purpose of this task was to provide a concept drainage improvement assessment specific to the
Ranchos area. This analysis included major roadway crossing improvements (excluding driveway
culverts) within the Ranchos area that could potentially reduce offsite flood risk to the community even
if the regional mitigation alternatives were not implemented.
As part of the ADMP, the consultant team prepared a concept that would improve drainage through the
Ranchos community, exclusive of the regional mitigation structures in the selected alternative. The
concept elements included:
• Conveyance Channel
• Existing Channel Improvements
• Culvert Improvements
35 South Dayton Valley Area Drainage Master Plan Executive Summary
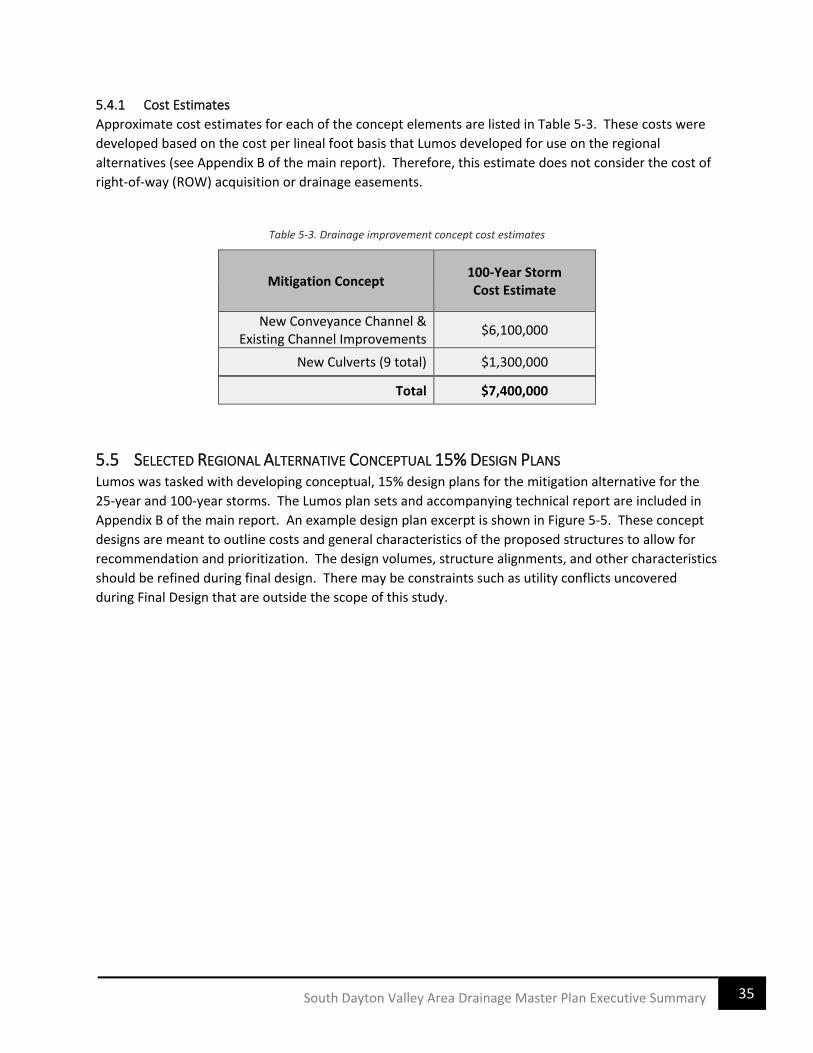
5.4.1 Cost Estimates
Approximate cost estimates for each of the concept elements are listed in Table 5-3. These costs were
developed based on the cost per lineal foot basis that Lumos developed for use on the regional
alternatives (see Appendix B of the main report). Therefore, this estimate does not consider the cost of
right-of-way (ROW) acquisition or drainage easements.
Table 5-3. Drainage improvement concept cost estimates
Mitigation Concept 100-Year Storm Cost Estimate
New Conveyance Channel & Existing Channel Improvements
$6,100,000
New Culverts (9 total) $1,300,000
Total $7,400,000
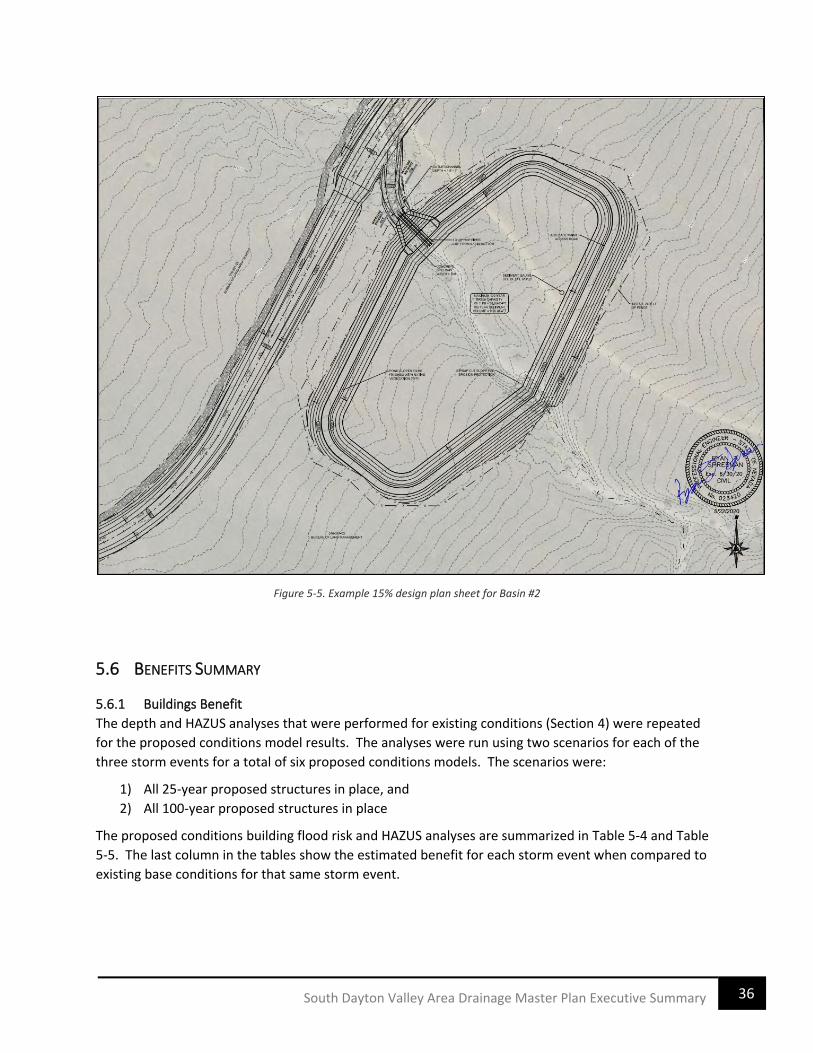
5.5 SELECTED REGIONAL ALTERNATIVE CONCEPTUAL 15% DESIGN PLANS Lumos was tasked with developing conceptual, 15% design plans for the mitigation alternative for the
25-year and 100-year storms. The Lumos plan sets and accompanying technical report are included in
Appendix B of the main report. An example design plan excerpt is shown in Figure 5-5. These concept
designs are meant to outline costs and general characteristics of the proposed structures to allow for
recommendation and prioritization. The design volumes, structure alignments, and other characteristics
should be refined during final design. There may be constraints such as utility conflicts uncovered
during Final Design that are outside the scope of this study.
36 South Dayton Valley Area Drainage Master Plan Executive Summary
Figure 5-5. Example 15% design plan sheet for Basin #2
5.6 BENEFITS SUMMARY
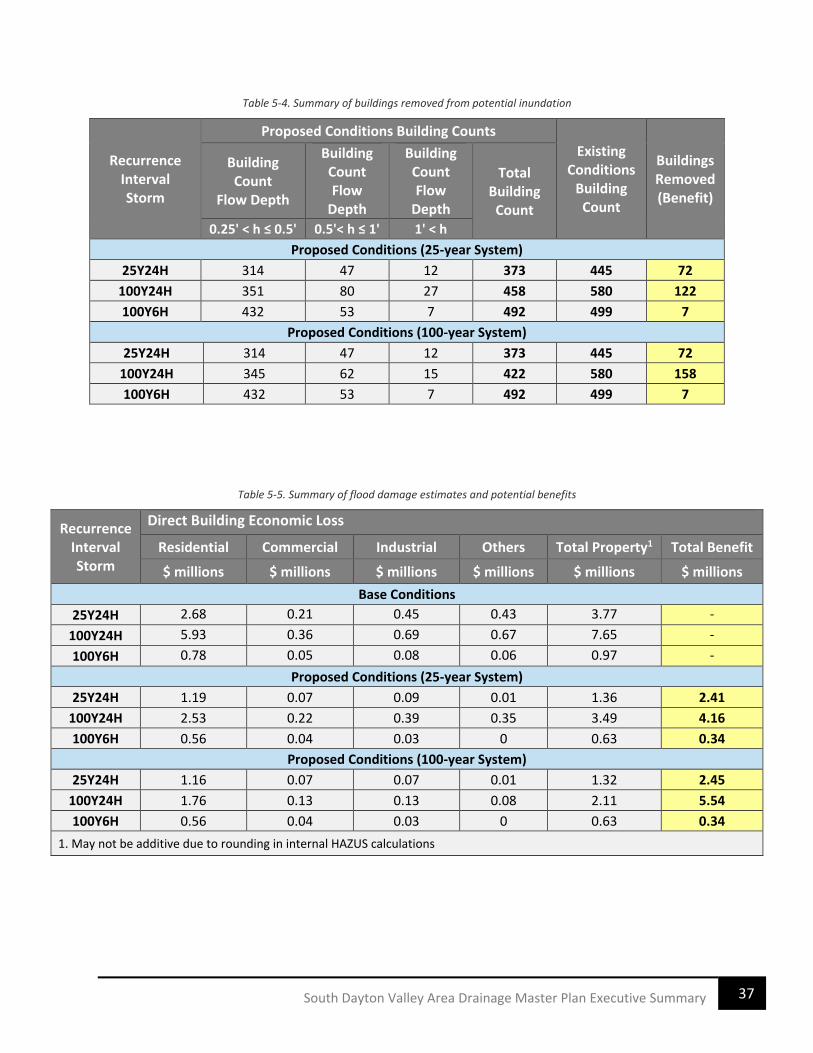
5.6.1 Buildings Benefit
The depth and HAZUS analyses that were performed for existing conditions (Section 4) were repeated
for the proposed conditions model results. The analyses were run using two scenarios for each of the
three storm events for a total of six proposed conditions models. The scenarios were:
1) All 25-year proposed structures in place, and
2) All 100-year proposed structures in place
The proposed conditions building flood risk and HAZUS analyses are summarized in Table 5-4 and Table
5-5. The last column in the tables show the estimated benefit for each storm event when compared to
existing base conditions for that same storm event.
37 South Dayton Valley Area Drainage Master Plan Executive Summary
Table 5-4. Summary of buildings removed from potential inundation
Recurrence Interval Storm
Proposed Conditions Building Counts
Existing Conditions
Building Count
Buildings Removed (Benefit)
Building Count
Flow Depth
Building Count Flow
Depth
Building Count Flow
Depth
Total Building Count
0.25' < h ≤ 0.5' 0.5'< h ≤ 1' 1' < h
Proposed Conditions (25-year System)
25Y24H 314 47 12 373 445 72
100Y24H 351 80 27 458 580 122
100Y6H 432 53 7 492 499 7
Proposed Conditions (100-year System)
25Y24H 314 47 12 373 445 72
100Y24H 345 62 15 422 580 158
100Y6H 432 53 7 492 499 7
Table 5-5. Summary of flood damage estimates and potential benefits
Recurrence Interval Storm
Direct Building Economic Loss
Residential Commercial Industrial Others Total Property1 Total Benefit
$ millions $ millions $ millions $ millions $ millions $ millions
Base Conditions
25Y24H 2.68 0.21 0.45 0.43 3.77 -
100Y24H 5.93 0.36 0.69 0.67 7.65 -
100Y6H 0.78 0.05 0.08 0.06 0.97 -
Proposed Conditions (25-year System)
25Y24H 1.19 0.07 0.09 0.01 1.36 2.41
100Y24H 2.53 0.22 0.39 0.35 3.49 4.16
100Y6H 0.56 0.04 0.03 0 0.63 0.34
Proposed Conditions (100-year System)
25Y24H 1.16 0.07 0.07 0.01 1.32 2.45
100Y24H 1.76 0.13 0.13 0.08 2.11 5.54
100Y6H 0.56 0.04 0.03 0 0.63 0.34
1. May not be additive due to rounding in internal HAZUS calculations
38 South Dayton Valley Area Drainage Master Plan Executive Summary
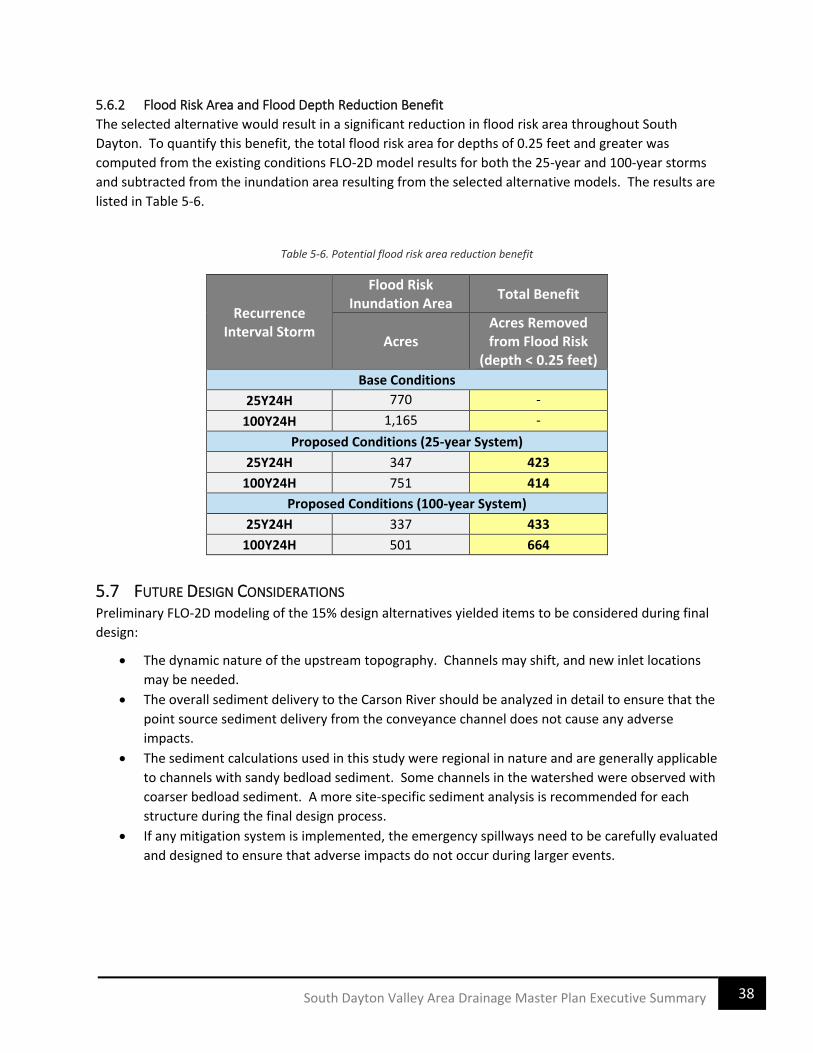
5.6.2 Flood Risk Area and Flood Depth Reduction Benefit
The selected alternative would result in a significant reduction in flood risk area throughout South
Dayton. To quantify this benefit, the total flood risk area for depths of 0.25 feet and greater was
computed from the existing conditions FLO-2D model results for both the 25-year and 100-year storms
and subtracted from the inundation area resulting from the selected alternative models. The results are
listed in Table 5-6.
Table 5-6. Potential flood risk area reduction benefit
Recurrence Interval Storm
Flood Risk Inundation Area
Total Benefit
Acres Acres Removed from Flood Risk
(depth < 0.25 feet)
Base Conditions
25Y24H 770 -
100Y24H 1,165 -
Proposed Conditions (25-year System)
25Y24H 347 423
100Y24H 751 414
Proposed Conditions (100-year System)
25Y24H 337 433
100Y24H 501 664
5.7 FUTURE DESIGN CONSIDERATIONS Preliminary FLO-2D modeling of the 15% design alternatives yielded items to be considered during final
design:
• The dynamic nature of the upstream topography. Channels may shift, and new inlet locations
may be needed.
• The overall sediment delivery to the Carson River should be analyzed in detail to ensure that the
point source sediment delivery from the conveyance channel does not cause any adverse
impacts.
• The sediment calculations used in this study were regional in nature and are generally applicable
to channels with sandy bedload sediment. Some channels in the watershed were observed with
coarser bedload sediment. A more site-specific sediment analysis is recommended for each
structure during the final design process.
• If any mitigation system is implemented, the emergency spillways need to be carefully evaluated
and designed to ensure that adverse impacts do not occur during larger events.
39 South Dayton Valley Area Drainage Master Plan Executive Summary
6 ADMP MITIGATION PRIORITIZATION
The regional alternative structures presented in this report can be designed and constructed in phases
as funding sources are identified and/or become available. Construction should occur beginning
furthest downstream so as not to cause adverse flooding conditions due to point-source releases of
stormwater. Other phasing strategies could be considered, but interim spillways and/or basins should
be implemented to avoid adverse impacts until the full project is built.
Figure 6-1 shows a potential construction phasing strategy that could be implemented by Lyon County,
while Table 6-1 lists a possible phasing schedule with associated costs. Note that the phasing cost for
the conveyance channel was computed by dividing the total channel cost by the number of phases. The
actual costs of each phase of channel construction may vary from those in Table 6-1 due to variability in
channel geometry and erosion protection and that if phased into multiple construction contracts,
certain bid items such as mobilization will be increased

40 South Dayton Valley Area Drainage Master Plan Executive Summary
Figure 6-1. Potential mitigation construction phasing

41 South Dayton Valley Area Drainage Master Plan Executive Summary
Table 6-1. Potential mitigation construction phasing cost
Phase Structure Elements 25-Year
Structure Cost Estimate2
100-Year Structure Cost
Estimate2
Phase 1 Conveyance Channel (5,200 LF1) $3,030,000 $4,500,000
Phase 2 Conveyance Channel (4,500 LF) $2,600,000 $3,800,000
Phase 3 Conveyance Channel (1,100 LF)
Basin #6 $700,000 $2,400,000
$970,000 $2,800,000
Phase 4 Conveyance Channel (7,200 LF) $4,200,000 $6,100,000
Phase 5 Conveyance Channel (2,300 LF)
Basin #5 Basin #4
$1,350,000 $1,100,000 $3,100,000
$2,000,000 $2,200,000 $4,400,000
Phase 6 Conveyance Channel (3,700 LF) $2,200,000 $3,200,000
Phase 7 Conveyance Channel (900 LF)
Basin #3 $515,000 $2,000,000
$760,000 $3,200,000
Phase 8 Conveyance Channel (3,300 LF) $1,950,000 $3,000,000
Phase 9 Conveyance Chanel (2,500 LF)
Basin #2 Basin #1
$1,500,000 $2,000,000 $2,600,000
$2,200,000 $2,200,000 $3,000,000
1. LF = linear feet (approximate)
2. Construction costs have been rounded for simplification. See Appendix B for a detailed breakdown of cost estimates.
6.1 ADMP LIMITATIONS While the results are based on detailed topography, hydrology, and hydraulic modeling, they represent
the existing conditions as of the date of the LiDAR mapping. Because of the unique landform and
sediment characteristics of the watershed, the topography and distribution of flow can be very dynamic
(i.e., small culverts or drainage channels can quickly fill with sediment causing water to change course
from what it was previously). Therefore, during final design of any of the alternatives, or prior to any
future development within the project area, a detailed assessment of upstream flow distribution should
be undertaken.
Furthermore, this study did not analyze rain on snow events, flooding recurrence intervals greater than
100-year, or post-wildfire flooding events. These types of events are considered outside the scope of
the typical area drainage master plan process. The hydrology used in this study was state of the art,
engineering design storms based on recent NDOT research. These atypical events could create hydraulic
conditions that exceed these design storms.
42 South Dayton Valley Area Drainage Master Plan Executive Summary
7 REFERENCES
JE Fuller, Inc. (JEF), 2019, Dayton Valley Area Drainage Master Plan Technical Study Data Notebook. Lyon
and Storey Counties, Nevada.
Manhard Consulting, 2012, Ramsey Canyon Watershed Flood Control Study. Lyon County, Nevada.
Lyon County, 2018, Drainage Guidelines for Lyon County, revised September 20, 2018.
National Weather Service (NWS), 2018, NOAA Atlas 14 Precipitation Frequency Estimates, retrieved
from https://hdsc.nws.noaa.gov/hdsc/pfds/pfds_gis.html, on June 18, 2018.
Nevada Department of Transportation (NDOT), 2015, Streamlining Hydrologic Prediction Processes
Using New and More Accurate Techniques and Methods, NDOT Research Report, Report No. 530-
13-803.
Yang, C. T., 1973, Incipient motion and sediment transport, Journal of the Hydraulics Division, ASCE, 99
(HY10), pp. 1670-1704.
____, 1984, Unit stream power equation for gravel. Journal of Hydraulic Engineering, ASCE, 110(HY12),
pp. 1783-1797.