Embed Size (px)
Citation preview

State of California The Resources Agency
DEPARTMENT OF WATER RESOURCES San Joaquin District
SAN JOAQUIN VALLEY DRAINAGE MONITORING PROGRAM
1998
District Report
July 2002 Gray Davis Mary D. Nichols Thomas M. Hannigan Governor Secretary for Resources Director State of California The Resources Agency Department of Water Resources

iii
FOREWORD The purpose of this annual report is to share valuable information about agricultural drainage water. This report is distributed to interested parties to expand the understanding of drainage problem areas, groundwater impacts and water quality trends resulting from agricultural drainage practices. The Drainage Monitoring and Evaluation Program is a cooperative effort of State, federal and local agencies. Data on the quality and quantity of drainage water and aerial extent of shallow groundwater is collected, assembled, analyzed, and disseminated. DWR collects shallow groundwater data and monitors about thirty drainage sump systems for flow and water quality constituents including sodium, calcium, total dissolved solids, selenium and other targeted constituents. The constituents are investigated for trends that show the results of irrigation and drainage management practices. Data from over ten other agencies are combined with DWR data and summarized in this report. In addition, a shallow groundwater map is drawn from measurements of over 1,000 wells to show groundwater levels to identify present and potential problem drainage areas due to encroachment into the root zone. To improve its ongoing data-gathering efforts, the Department of Water Resources invites water resources specialists to participate in discussing and commenting on the scope of this report.
Paula J. Landis, Chief San Joaquin District

v
CONTENTS Page FOREWORD ............................................................................................................................. iii ORGANIZATION ..................................................................................................................... vii INTRODUCTION ..................................................................................................................... 1 THE DRAINAGE PROBLEM ................................................................................................. 2 DRAINAGE PROBLEM AREAS............................................................................................. 3 1998 DRAINAGE-MONITORING PROGRAM...................................................................... 6 Flows.................................................................................................................................... 10
Mineral Constituent Concentrations .................................................................................... 11
Pesticides ............................................................................................................................. 13
Nutrients............................................................................................................................... 13
Trace Elements..................................................................................................................... 22
Selenium .............................................................................................................................. 22 DWR'S FUTURE MONITORING PROGRAM ....................................................................... 25 BIBLIOGRAPHY...................................................................................................................... 64 SYMBOLS and ABBREVIATIONS ........................................................................................ 65
Tables
1 Acreage of Present and Potential Drainage Problems, 1987-1990................................ . 4 2 Acreage of Present and Potential Drainage Problems, 1991-1998................................ 5 3 Drainage Monitoring Stations, 1998 ............................................................................. 6 4 Subsurface Drain Flows, 1998....................................................................................... 10 5 Summary of Minerals Detected, 1998 ........................................................................... 11 6 Total Dissolved Solids in Subsurface Drains, 1986-1998 ............................................. 12

vi
Tables (continued)
Page 7 Mineral Analyses of Central Area Drains, 1998............................................................ 14 8 Mineral Analyses of Southern Area Drains, 1998......................................................... 17 9 Summary of Selenium Detected, 1998........................................................................... 22 10 Selenium, Electrical Conductivity, and Field pH Central Area Drains, 1998 ............................................................................................. 23 11 Selenium, Electrical Conductivity, and Field pH Southern Area Subsurface Drains, 1998........................................................................ 24
Figures 1 Overview of Sampling Area Locations.......................................................................... 7 2 Central Area Drain Locations ........................................................................................ 8 3 Southern Area Drain Locations ..................................................................................... 9 4 1998 Selenium Levels-Central Area, San Joaquin Valley Stations............................... 26 5 1998 Selenium Levels-Southern Area, San Joaquin Valley
Lemoore/Corcoran Stations ........................................................................................... 27 6 1998 Selenium Levels-Southern Area, San Joaquin Valley
Lost Hills/Semitropic Stations ....................................................................................... 28 7 1998 Selenium Levels-Southern Area, San Joaquin Valley
Kern Lakebed Stations................................................................................................... 29
Appendix Graphs of Water Quality in Drainage Sumps-Central Area …………………………. 30 Graphs of Water Quality in Drainage Sumps-Southern Area ………………………… 42 Plate 1-Present and Potential Drainage Problem Areas, San Joaquin Valley, 1998 …. 63

vii
STATE OF CALIFORNIA Gray Davis, Governor
THE RESOURCES AGENCY
Mary D. Nichols, Secretary for Resources
DEPARTMENT OF WATER RESOURCES Thomas M. Hannigan, Director
Vacant Steve Macaulay Jonas Minton Deputy Director Chief Deputy Director DeputyDirector L. Lucinda Chipponeri Peggy Bernardy Deputy Director Chief Counsel
DIVISION OF PLANNING AND LOCAL ASSISTANCE Naser J. Bateni ...................................................................................................................................... Chief
SAN JOAQUIN DISTRICT Paula J. Landis .......................................................................................................................... District Chief Jose I. Faria ...........................................................................................Chief, Special Investigations Branch
This report was prepared under the supervision of Kurt C. Kovac .......................................................................................... Senior Engineer, Water Resources
by David A. Lara.......................................................................................................Engineer, Water Resources
with assistance from Tony Lam.....................................................................................................Junior Engineering Technician I Kenneth W. Winden............................................................................................................Senior Delineator Patricia A. Conley.............................................................................................................. Office Technician
Data for this report was collected under the supervision of
Iris M. Yamagata ..................................................................................... Senior Engineer, Water Resources
by
W. Larry Baxter .............................................................................. Water Resources Engineering Associate Gilbert M. Pineda...........................................................................................Water Resources Technician II Holly Jo Ferrin ...............................................................................................Water Resources Technician II Carlynn J. Mayer............................................................................................Water Resources Technician II
1
INTRODUCTION In 1959, the California Department of Water Resources began monitoring agricultural drainage water in the San Joaquin Valley. Initial monitoring efforts (1959-1963) focused on mineral analyses. In 1963, the monitoring program became part of the San Joaquin Drainage Investigation and included analyses for pesticides in both surface and subsurface drainage waters. From 1966 to 1969, intensive nutrient sampling became a part of the investigation. Although the San Joaquin Drainage Investigation ended in 1970, monitoring continued as a separate departmental activity until 1975 when the Department of Water Resources, the U.S. Bureau of Reclamation, and the State Water Resources Control Board formed the Interagency Drainage Program. The program continued until 1979 when monitoring resumed as a separate activity under the DWR’s Agricultural Drainage Program. Focusing national attention on drainage and drainage-related problems was the discovery in 1983 of migratory bird deaths and deformities linked to high selenium levels in drainage water at Kesterson Reservoir, the terminus of the San Luis Drain. This discovery resulted in an interagency drainage study. In 1984, the San Joaquin Valley Drainage Program was established to investigate and identify possible solutions to drainage and drainage-related problems. The SJVDP is a cooperative federal-State program established by the Secretary of the Interior and the Governor of California. Cooperating agencies are DWR, California Department of Fish and Game, USBR, U.S. Fish and Wildlife Service, and the U.S. Geological Survey. The SJVDP developed a comprehensive study entitled, A Management Plan for Agricultural Subsurface Drainage and Related Problems on the Westside San Joaquin Valley, also known as the Rainbow Report (September 1990). This report summarizes the results of subsurface agricultural drainage problems and presents a plan for managing drainage problems. In 1991, federal and State agencies initiated the San Joaquin Valley Drainage Implementation Program to pick up where SJVDP left off. Four federal agencies (USBR, USFWS, USGS, and Natural Resources Conservation Service) and four State agencies (DFG, DWR, Department of Food and Agriculture, and SWRCB) signed a memorandum of understanding and released an implementation strategy in December 1991. They agreed to (1) work together and identify specific tasks associated with responsible parties, (2) seek needed funding and authority, and (3) set schedules for implementing all components of the SJVDP 1990 Plan. The MOU and all the agencies involved recognize the success of the program depends upon local districts and irrigators to carry out effective drainage management measures. Because drainage is a regional problem, federal and State agencies will continue to coordinate efforts. The DWR drainage monitoring program is continuously being evaluated and modified to meet the needs of the implementation strategy.

2
THE DRAINAGE PROBLEM The San Joaquin Valley, one of the world’s most productive agricultural regions, has experienced mounting problems with the management and disposal of agricultural drainage water. The drainage problem is an outgrowth of naturally saline soils and imported water, as well as the valley’s distinctive geological makeup, which prevents effective natural drainage in certain areas. Soils on the western side of the valley are derived from the marine sediments that make up the Coast Range. These soils, high in salts and trace elements, are similar to those that occur in a marine environment. In addition, much of the valley is underlain by a shallow, clay layer that obstructs vertical movement of irrigation water. As salts and minerals from surface soils are leached into the groundwater, the water table rises to within a few feet of the surface and into the root zone. Unless this water is removed, crops growing in these soils eventually die. In the late 1940s, farmers began installing subsurface drains in fields with drainage problems. By 1965, 330 miles of subsurface drains and 750 miles of open ditch drains were in operation in the valley delivering drainage water to evaporation ponds and other discharge sites. With this drainage network in operation, the main problem became how to manage and dispose of the salty drain water. The original plan was to construct a master drain (the San Luis Drain) to collect the water and route it out of the valley into the Sacramento-San Joaquin River Delta. By 1973, an 87-mile-long section of the San Luis Drain was receiving irrigation runoff and discharging into Kesterson Reservoir. The plan was to extend the drain north to a discharge site in the Delta. Kesterson Reservoir was to regulate discharges going to the Delta and provide a wetland habitat. The San Luis Drain was never completed and drainage accumulated at Kesterson Reservoir. In 1982, federal studies reported high selenium levels in fish taken from Kesterson. In 1983, federal-State studies determined that the bioaccumulation of selenium was causing deformities in embryos of waterfowl nesting at the reservoir. In 1985, the U.S. Department of the Interior ordered a halt to drainage water discharges into the San Luis Drain and Kesterson Reservoir, even though irrigation water deliveries to west side agricultural lands continued. Today, the future of the master drain remains in doubt. Practices of disposing and managing drainage water are being scrutinized for their impacts on the environment. Management practices such as source control, drainage reuse, groundwater management, integrated on-farm drainage management, and others identified in the Rainbow Report are being implemented. Monitoring of shallow groundwater and agricultural drainage water is an integral activity to determine the effectiveness of these management practices.

3
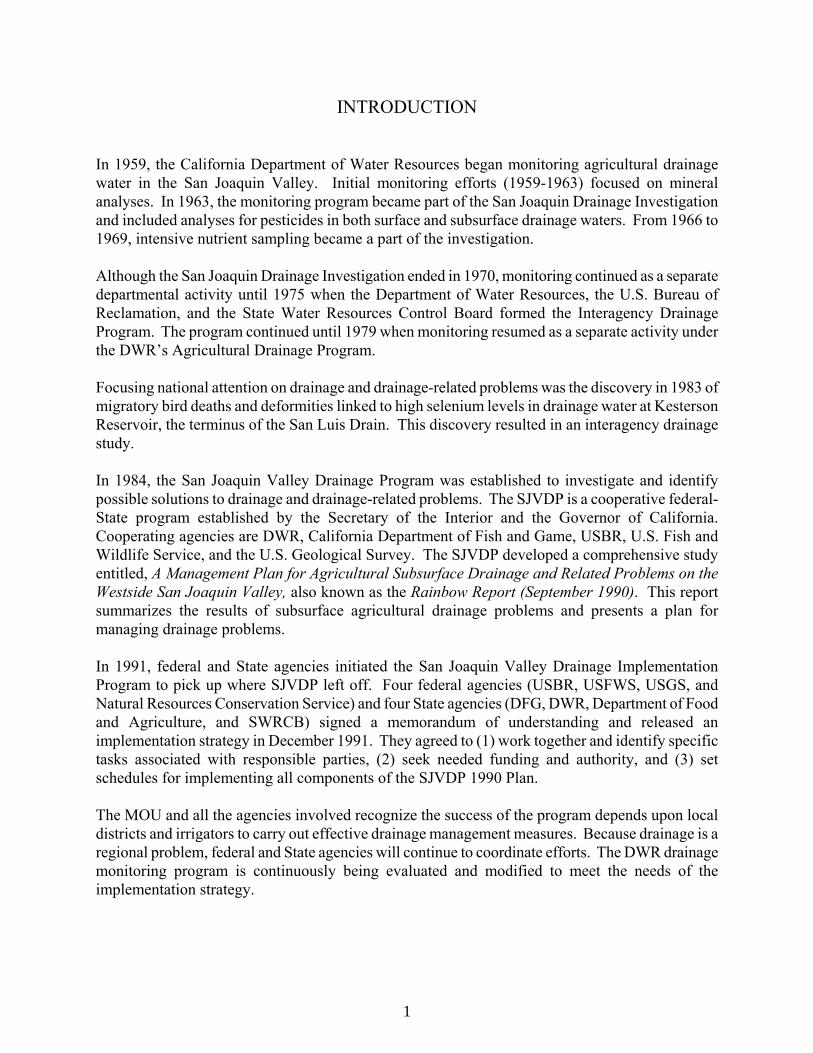
DRAINAGE PROBLEM AREAS The San Joaquin Valley is a rich agricultural region that encompasses large areas with high water tables. Irrigation practices, cropping patterns, seepage from unlined ditches or ponds, soil type, geology, and other factors influence the elevations of these water tables. Since the importation of water for irrigation, inadequate drainage and accumulating salts have been persistent problems in parts of the valley. The poor natural drainage conditions, coupled with rising groundwater levels and increasing soil salinity, have meant that various soils could no longer produce crops and some farms within the problem area have been abandoned. In this report “present problem area” is defined as a location where the water table is within 5 feet of the ground surface at any time during the year. A "potential problem area" indicates the water table is between 5 and 20 feet below the ground surface. Present and potential drainage problem areas are established by planimetering within specific intervals from DWR's annual "Present and Potential Drainage Problem Area" map (Plate 1). A history of how Plate 1 was produced shows the limitations of Table 1, 1987-1990. In the mid-1990’s, DWR produced maps for the years 1987 through 1991. The first map was based on generalizations with the intent of covering as large an area as possible. The initial data for the 1987 map were sparse, but even less information was available for the 1988-1990 maps. As a result, vast areas were subject to interpolations and estimates. A canvass for additional groundwater data for the transition period, 1988-1990, could not be conducted since these maps were drawn long after the original data was collected; consequently, comparisons should not be made for this series of maps. Beginning with the 1991 map, an effort was made to standardize the methods of data collection so that comparisons could be made and trends analyzed. Study area boundaries were drawn and a relatively stable network of monitoring wells was established. Water level data from newly drilled monitoring wells became part of this network. The 1991-1998 data (Table 2) and subsequent maps are the only representations that can be used for comparison. In preparing Plate 1, DWR did not take into account items such as existing drainage systems, wildlife refuges, urban areas, pasture land, native vegetation, data-poor areas, and the outer boundary. This report provides information on the extent of drainage conditions; therefore, other factors must be considered when making projections about areas that will require drainage systems in the future.
4
TABLE 1
ACREAGE OF PRESENT AND POTENTIAL DRAINAGE PROBLEMS 1987-1990
0 to 5 ft 59,000 13,000 16,000 15,0005 to 10 ft 97,000 134,000 130,000 114,000
10 to 15 ft 174,000 58,000 96,000 87,000>15 ft 9,000 27,000 19,000
Unaccounted** 110,000 56,000 95,000TOTAL 330,000 324,000 325,000 330,000
0 to 5 ft 263,000 92,0005 to 10 ft 87,000 40,000 53,000 172,000
10 to 15 ft 16,000>15 ft
Unaccounted** 326,000 313,000 101,000TOTAL 366,000 366,000 366,000 365,000
0 to 5 ft 109,000 18,000 11,000 27,0005 to 10 ft 135,000 229,000 258,000 205,000
10 to 15 ft 166,000 104,000 88,000 65,000 >15 ft 58,000 53,000 10,000
Unaccounted** 105,000TOTAL 410,000 409,000 410,000 412,000
0 to 5 ft 255,000 132,000 126,000 74,0005 to 10 ft 78,000 206,000 207,000 143,000
10 to 15 ft 79,000 58,000 59,000 65,000>15 ft 16,000 20,000 17,000
Unaccounted** 110,000TOTAL 412,000 412,000 412,000 409,000
0 to 5 ft 686,000 163,000 153,000 208,0005 to 10 ft 397,000 609,000 648,000 634,000
10 to 15 ft 435,000 220,000 243,000 217,000>15 ft 0 83,000 100,000 46,000
Unaccounted** 0 436,000 369,000 411,000TOTAL AREA 1,518,000 1,511,000 1,513,000 1,516,000
** Acreage where data is insufficient to include any depth to water interval.
1990
Kern Sub-Basin Transition Period
Depth to Groundwater 1988 1989
Tulare Sub-Basin
* Spring 1987 map shows 0-5, 5-10, and 10-20 feet to water.
1987*
Variations in total result from rounding of numbers.
Initial
Westlands Sub-Basin
Grasslands Sub-Basin
TOTALS

5
TABLE 2
ACREAGE OF PRESENT AND POTENTIAL DRAINAGE PROBLEMS 1991-1998
0 to 5 ft 40,000 34,000 24,000 10,000 32,000 50,000 58,000 83,8205 to 10 ft 121,000 172,000 126,000 148,000 173,000 163,000 182,000 194,787
10 to 15 ft 152,000 84,000 162,000 137,000 115,000 82,000 78,000 77,48915 to 20 ft 15,000 40,000 17,000 32,000 8,000 31,000 8,000 0TOTAL 328,000 330,000 329,000 327,000 328,000 326,000 326,000 356,097
0 to 5 ft 119,000 189,000 199,000 131,000 195,000 221,000 301,000 264,1425 to 10 ft 244,000 121,000 135,000 212,000 157,000 130,000 61,000 19,844
10 to 15 ft 2,000 54,000 30,000 23,000 11,000 15,000 2,000 015 to 20 ft 0 1,000 0 0 0 0 0 0TOTAL 365,000 365,000 364,000 366,000 363,000 366,000 364,000 283,986
0 to 5 ft 38,000 110,000 75,000 34,000 126,000 104,000 228,000 278,1615 to 10 ft 201,000 160,000 172,000 194,000 150,000 205,000 90,000 94,440
10 to 15 ft 85,000 69,000 87,000 96,000 65,000 58,000 49,000 19,63215 to 20 ft 85,000 73,000 77,000 85,000 68,000 41,000 41,000 0TOTAL 409,000 412,000 411,000 409,000 409,000 408,000 408,000 392,234
0 to 5 ft 114,000 136,000 147,000 146,000 166,000 164,000 156,000 235,3005 to 10 ft 184,000 150,000 131,000 128,000 144,000 153,000 186,000 117,285
10 to 15 ft 72,000 77,000 99,000 86,000 64,000 59,000 44,000 39,21215 to 20 ft 42,000 46,000 33,000 51,000 35,000 33,000 22,000 6,772TOTAL 412,000 409,000 410,000 411,000 409,000 409,000 408,000 398,568
0 to 5 ft 311,000 469,000 445,000 321,000 519,000 539,000 743,000 861,4235 to 10 ft 750,000 603,000 564,000 682,000 624,000 651,000 519,000 426,356
10 to 15 ft 311,000 284,000 378,000 342,000 255,000 214,000 173,000 136,33415 to 20 ft 142,000 160,000 127,000 168,000 111,000 105,000 71,000 6,772
TOTAL AREA 1,514,000 1,516,000 1,514,000 1,513,000 1,509,000 1,509,000 1,506,000 1,430,885
Westlands Sub-Basin
19981991 1992 1993 1994
Variations in total result from rounding of numbers.
1995 1996 1997
Grasslands Sub-Basin
TOTALS
Depth to Groundwater
Kern Sub-Basin
Tulare Sub-Basin

6
1998 DRAINAGE-MONITORING PROGRAM
DWR’s San Joaquin Valley drainage-monitoring activities for 1998 consisted of collecting water samples from 25 subsurface and 2 surface drainage sumps for the stations listed in Table 3. Figure 1 provides an overview of the sampling area locations. Because DWR monitors only the Central and Southern Areas (Figures 2 and 3, respectively) the Northern Area stations are not included in this report.
TABLE 3
DRAINAGE MONITORING STATIONS 1998
BVS 6016 CCN** 3550BVS 8003 CNR 0801
CTL* 4504 COC 4126DPS 1367 COC 5329DPS 2535 ERR 7525
DPS* 3235 ERR 8429DPS 3465 ERR 8641DPS 4616 GSY 0855FBH 2016 HCH** 7439FBH 8061 LNW 5454
HMH 7516 LNW 5467 LNW 6459 LNW 6467SFD 2727
STC** 3505STC 5436
STC** 6467 VGD 3906 VGD 4406 VGD 5412
**Inoperative in 1998
Central Area Southern Area
*Surface drain

7
Insert: Figure 1, Overview of Sampling Area Locations (p. 7) Figure 2, Central Area Drain Locations (p. 8). Figure 3, Southern Area Drain Locations (p. 9).
10
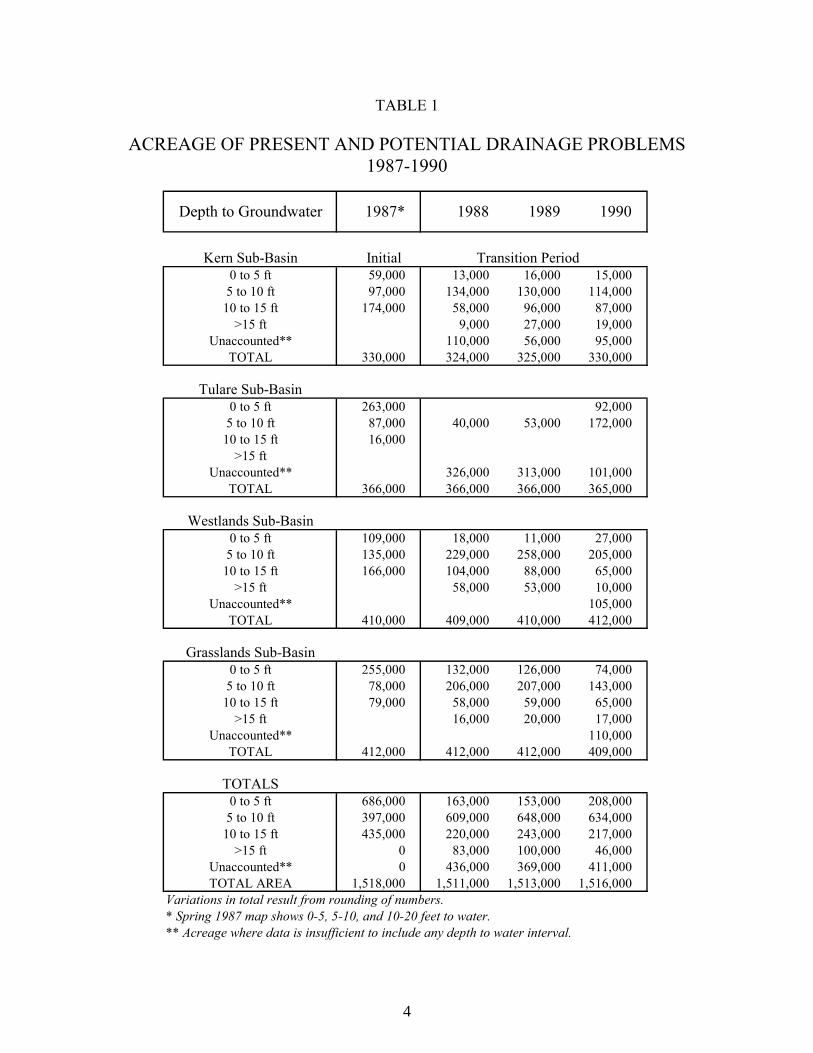
Flows Drainage flow data is collected from sumps with functional flow meters. Table 4 lists the 1998 subsurface drain flows in acre-feet. Many drains receive groundwater from areas outside the drainage pipe collector network. As a result, one drainage sump may act as a collector point for six or more systems. Depending on the soil surrounding the drain, one month’s flow may consist of part of the previous months irrigation; therefore, caution should be exercised in using these results.
TABLE 4
SUBSURFACE DRAIN FLOWS 1998
(acre-feet)
Area Tiled Jan - Mar Mar - May May - July July - Sept Sept - Nov Nov 11-(acres) 12 11 12 20 21 9 10 11 12 10 12-Jan-99
BVS 6016 740 23.1 242.2 98.0 81.2 3.7 -BVS 8003 110 - 11.3 16.8 15.7 - 323.8DPS 1367 120 - 48.7 49.4 45.4 29.4 30.0DPS 2535 320 - - 23.0 27.4 - 368.6DPS 3465 160 - 21.2 22.7 33.3 - 687.3DPS 4616 140 - - - - - -FBH 2016 81 - - 21.6 13.0 - 418.2FBH 8061 320 - 11.1 33.8 - - 27.4HMH 7516 320 - - - - - -
CCN 3550* 880 - - - - - -CNR 0801 - - - - - - -COC 4126 - - - - - - -COC 5329 - - - - - - -ERR 7525 220 - 61.3 - 22.0 - 0.0ERR 8429 - - - 133.0 163.1 91.9 61.0ERR 8641 258 - 8.0 26.0 31.6 21.1 6.4GSY 0855 60 - - - - 15.5 9.7HCH 7439* - - - - - - -LNW 5454 - 4.8 7.8 - 202.5 26.9 -LNW 5467 - - - - - - -LNW 6459 581 67.5 - 21.1 48.9 38.8 21.3LNW 6467 1,420 21.6 - 25.1 118.1 36.0 21.1SFD 2727 120 6.4 17.0 13.9 - - -STC 3505* 140 - - - - - -STC 5436 153 - - - - - -STC 6467* 124 - - - - - -VGD 3906 870 - - - - - -VGD 4406 310 - - - - - -VGD 5412 275 - - - - - -- Denotes insufficient data or no reading. *Inoperative in 1998.
Station
Central Area
Southern Area

11
Mineral Constituent Concentrations
Drainage water contains dissolved mineral substances which include sulfates, chlorides, carbonates, and bicarbonates of the elements calcium, magnesium, sodium, and potassium. Salinity is the dissolved mineral concentrate in water, which is commonly measured as either total dissolved solids (TDS) in milligrams per liter (mg/L) or electrical conductivity (EC) in microsiemens per centimeter ( S/cm). The amount and percentage of the mineral constituents found in subsurface agricultural drainage water vary from location to location in the San Joaquin Valley (Table 5). The areas with drainage water high in sodium will have a direct impact upon the water’s reuse for irrigation of agricultural crops and potentially reduce the crop yield.
TABLE 5
SUMMARY OF MINERALS DETECTED 1998
(milligrams per Liter)
Arithmetic Geometric Arithmetic Geometric Average Mean Average Mean
Boron 4.4 49.0 13.8 10.3 0.24 8.8 4.3 2.0Calcium 265 642 458 447 16 433 211 94Magnesium 28 409 174 149 6 116 58 31Nitrate 12 273 72 46 0.15 41 18 6Sodium 451 3,490 1,184 998 25 866 398 181TDS 2,604 10,300 5,631 5,223 150 4,140 2,099 949EC ( S/cm) 3,800 12,300 7,090 6,692 264 5,610 2,842 1,431SAR 5.1 35.5 11.7 10.2 1.4 15.4 6.2 4.4
Boron 1.2 60.3 18.2 10.5Calcium 90 1,050 398 346Magnesium 34 799 257 205Nitrate 1.6 316 43 25Sodium 508 9,050 3,134 2,447TDS 3,030 28,600 11,429 9,682EC ( S/cm) 3,770 35,300 14,000 12,035SAR 6.3 84.0 30.7 25.3
Subsurface Drains Surface Drains
Southern Area
Central Area
Element MaximumMinimum MaximumMinimum
No surface drains within the Southern Area. Water high in TDS and chloride can lead to crop tissue burns if applied during germination. Table 6 presents the minimum and maximum TDS values, along with two types of averages: the arithmetic average and geometric mean. The arithmetic average is the average of all obtained data for the given year. The geometric mean, largely used by regulatory agencies, provides an average of central tendency that is less influenced by spiked values in the data set.

12
TABLE 6
TOTAL DISSOLVED SOLIDS IN SUBSURFACE DRAINS 1986-1998
(milligrams per Liter)
1986 1987 1988 1989 1990 1991 1992 1993 1994 1996 1997 1998 Min MaxCentral Area5,898 6,216 5,584 5,462 5,458 5,846 5,311 5,736 5,634 5,407 5,299 5,6315,391 5,603 5,021 4,918 4,954 5,193 4,707 5,165 5,003 4,848 4,912 5,223
Southern Area13,708 17,297 14,408 13,318 14,038 13,554 13,306 13,613 12,868 9,771 11,325 11,5218,934 11,979 9,423 8,778 9,286 8,895 8,529 8,900 8,531 6,936 8,503 9,757
2,604 10,300
3,030 28,600
1998 Arithmetic Average Geometric Mean
No data collected in 1995. In practice, EC is a simple measurement that can be used to indicate TDS for a given water at a specific site. EC is a measure of the ability to conduct an electrical current through a given solution. The strength of the current is dependent upon the temperature, type, and concentration of ions within the solution. The standard practice, as used in this report, is to adjust EC measurements to 77oF (25oC). EC levels for 1998, in both the Central and Southern subsurface drains varied from 3,800 to12,300
S/cm and 3,770 to 35,300 S/cm, respectively. EC results for both surface stations included an arithmetic average of 2,842 S/cm with a maximum level of 5,610 S/cm (DPS 3235). With respect to water reuse for irrigation, two factors must be taken into account: EC and the sodium adsorption ratio (SAR). The SAR is widely used for estimating water permeability problems. The high sodium in a high SAR value water replaces the more beneficial calcium and magnesium ions in the soil. This exchange alters the soil structure causing the soil to slake, resulting in a loss of porosity, and thus reducing the infiltration rate of the applied water through the soil. To evaluate a potential permeability problem, SAR values are used in combination with EC values. The following equation distinguishes the elements associated with SAR values.
SAR =
2
22 MgCaNa
Where Na+, Ca+2, and Mg+2 represent the concentrations in milliequivalents per liter of the respective ions. In general, irrigation waters having SAR values less than 3 are low risk. Although some salt tolerant crops may have SAR values as high as 16, considerable care is advised for values greater than 6 when reusing agricultural drainage water for irrigation purposes.

13
In 1998, the Central Area subsurface drains had a minimum SAR value of 5.1 (DPS 1367) and a maximum value of 35.5 (BVS 8003) with a geometric mean of 10.2 mg/L. Accordingly, the Southern Area subsurface drains had a minimum SAR value of 6.3 (COC 4126) and a maximum value of 84.0 (LNW 6459) with a combined arithmetic average of 30.4. Sodium concentrations ranged from 451 to 3,490 mg/L and 508 to 9,050 mg/L for both Central and Southern Areas, respectively. Boron, an essential mineral for plant growth, can be toxic if excessive levels in irrigation water are applied to plants. Boron toxicity levels are dependent upon climate, soil, and crop variety. Tree and vine crops are the most sensitive (0.5-1.0 mg/L), whereas cotton and asparagus the most tolerant (6.0-15.0 mg/L) The Central Area recorded a maximum level of 49.0 mg/L (DPS 4616) with a combined arithmetic average of 13.8 mg/L. Boron in the Southern Area drains were greater with a maximum concentration of 60.3 mg/L (LNW 5454) and a combined average of 18.2 mg/L. Boron for both surface drains averaged 4.3 mg/L with a maximum level of 8.8 mg/L (DPS 3235). Concentrations for total hardness, as calcium carbonate, were also lowest in the Central Area with a maximum level of 2,634 mg/L (DPS 4616) and an arithmetic average of 1,877 mg/L. The Southern Area recorded a maximum hardness level of 4,350 mg/L (SFD 2727) and a combined arithmetic average of 1,931 mg/L. In evaluating hardness, warm water levels greater than 300 mg/L can cause scaling in irrigation and drainage pipes. Concentrations greater than 300 mg/L were accounted for in all drains, excluding the surface drain CTL 4504, which recorded a maximum level of 262 mg/L. In the past effluent at the two surface stations (CTL 4504 and DPS 3235) have had sodium, sulfate, and chloride as their principal mineral constituents. Since surface drains contain a mixture of tail water, reused drain water, and added runoff, the mineral levels are lower than subsurface drainage water. Mineral constituents for the Central and Southern Area drains are listed in Tables 7 and 8, respectively. Potassium, alkalinity, sulfate, and chloride were last sampled in 1992, therefore, no results are listed.
Pesticides Extensive sampling and analyses by federal and State scientists from1984 to 1989 have shown that pesticides are rarely detected in valley subsurface water. As a result, the drainage-monitoring program did not include testing for pesticides in 1998.
Nutrients The 1998 drainage-monitoring program did not sample subsurface drains for nutrients. In the past, nutrient data was analyzed for correlation of nutrient values versus the time of year when sampled. This relationship was difficult to evaluate due to: 1. Over-irrigation, which leads to increased leaching of salts from soils. 2. Variable commercial fertilizer application rates. 3. Yearly sample value fluctuations. 4. Variable soil types.

Station Date
Time
Temp.Field
Laboratory
pH EC Ca Mg Na NO3 B TDSSum TH
SAR
Mineral Constituentsmg/L
meq/L
MineralConstituents
(mg/L)
(µS/cm) °C °F
TABLE 7
MINERAL ANALYSES OF CENTRAL AREA DRAINS1998
BVS 60166,1716,560
7.2 452 152 11.36.6 5,22022.55 47.39 4.40
1,75061 12.50
1090 273.0-
01/11/19981615
16
6,560452 152 11.36.6 5,220
22.55 47.39 0.9912.501090 61.6
-03/11/19981200
6,7266,690
7.4 510 174 10.06.5 5,10025.45 44.35 0.9663 14.31
1020 59.3-
05/20/19981310
17
5,0985,030
7.2 351 131 8.24.9 3,94017.51 30.70 0.58
1,41670 10.77
706 36.0-
09/09/19981315
21
8,5478,580
7.3 502 194 13.210.1 7,09025.05 59.57 1.03
2,05368 15.95
1370 64.0-
11/10/19981445
20
BVS 80037,3817,710
7.5 329 192 16.616.0 6,51016.42 66.52 0.56
1,61061 15.79
1530 35.0-
03/11/19981645
16
9,5589,440
7.4 378 239 18.320.0 8,00018.86 80.43 0.2563 19.65
1850 15.2-
05/20/19981340
17
10,4769,460
7.3 363 225 35.519.9 8,08018.11 151.7 0.31
1,83370 18.50
3490 19.0-
09/09/19981330
21
CTL 45041,1411,170
8.1 62 26 3.71.5 7063.09 6.00 0.11
26259 2.14
138 6.9-
03/11/19981230
15
260264
7.6 16 6 1.40.4 1500.78 1.08 0.0064 0.46
24.9 0.2-
05/20/1998910
18
291291
8.1 16 7 2.00.5 1680.80 1.70 0.01
6975 0.58
39 0.7-
09/09/1998930
24
299272
7.8 17 7 1.50.2 1610.86 1.30 0.02
7355 0.61
29.83 1.2-
11/10/19981215
13
14

Station Date
Time
Temp.Field
Laboratory
pH EC Ca Mg Na NO3 B TDSSum TH
SAR
Mineral Constituentsmg/L
meq/L
MineralConstituents
(mg/L)
(µS/cm) °C °F
TABLE 7
MINERAL ANALYSES OF CENTRAL AREA DRAINS1998 (continued)
DPS 13675,3935,460
7.3 639 28 5.94.9 4,16031.89 24.39 3.50
2,12063 2.30
561 217.0-
01/13/19981145
17
5,4525,500
7.2 586 123 5.34.4 4,21029.24 23.52 4.00
1,97063 10.12
541 248.0-
03/11/19981515
17
5,5085,700
7.3 642 143 5.34.8 4,35032.04 24.74 0.8864 11.76
569 54.5-
05/20/19981205
18
6,4385,670
7.2 589 133 5.65.1 4,30029.39 25.00 0.90
2,01968 10.94
575 56.0-
09/09/19981200
20
5,5605,590
7.3 582 129 5.14.7 4,41029.04 22.83 0.85
1,98566 10.61
525 53.0-
11/10/19981330
19
DPS 25358,1658,400
7.3 445 177 15.218.1 6,38022.21 65.22 0.3663 14.56
1500 22.1-
05/20/19981050
17
DPS 32354,9444,860
8.2 355 98 8.87.6 3,60017.71 31.57 0.58
1,29063 8.06
726 36.3-
03/11/19981345
17
5,5225,610
8.3 416 116 9.78.8 4,08020.76 37.65 0.6763 9.54
866 41.4-
05/20/19981005
17
4,9934,970
8.2 371 99 8.37.8 3,79018.51 30.35 0.42
1,33472 8.14
698 26.0-
09/09/19981045
22
5,3075,300
8.3 433 105 7.57.6 4,14021.61 28.96 0.45
1,51454 8.63
666 28.0-
11/10/19981300
12
DPS 34658,4708,480
7.2 564 206 11.715.0 6,39028.14 55.65 1.39
2,26061 16.94
1280 86.0-
03/11/19981445
16
9,3159,700
7.2 602 238 13.817.7 7,17030.04 68.70 0.3664 19.57
1580 22.1-
05/20/19981125
18
7,7767,190
6.7 494 182 10.312.9 4,87024.65 45.65 0.27
1,98370 14.97
1050 17.0-
09/09/19981130
21
15

Station Date
Time
Temp.Field
Laboratory
pH EC Ca Mg Na NO3 B TDSSum TH
SAR
Mineral Constituentsmg/L
meq/L
MineralConstituents
(mg/L)
(µS/cm) °C °F
TABLE 7
MINERAL ANALYSES OF CENTRAL AREA DRAINS1998 (continued)
DPS 461611,93811,900
7.5 443 354 20.545.0 10,10022.11 103.4 0.84
2,56057 29.11
2380 52.0-
03/11/19981145
14
12,22112,300
7.4 449 409 19.849.0 10,30022.41 104.7 0.2061 33.63
2410 12.3-
05/20/1998830
16
11,76011,590
7.4 438 374 17.949.0 9,88021.86 91.74 0.19
2,63461 30.76
2110 12.0-
11/10/19981130
16
FBH 20169,3159,520
7.6 470 295 15.816.0 8,26023.45 76.96 0.3564 24.26
1770 21.5-
05/20/19981445
18
6,6605,800
7.4 416 161 8.88.0 4,89020.76 36.26 0.21
1,70268 13.24
834 13.0-
09/09/19981415
20
FBH 80614,3404,380
7.4 324 123 7.46.2 3,53016.17 26.87 0.61
1,32059 10.12
618 38.0-
03/11/19981715
15
HMH 75163,6593,800
7.3 344 62 6.57.0 2,69017.17 21.52 2.74
1,11064 5.10
495 170.0-
01/13/19981215
18
4,5084,540
407 77 6.57.0 3,26020.31 23.57 3.71
1,33063 6.33
542 230.0-
03/11/19981545
17
4,1744,290
7.3 372 74 7.27.0 3,05018.56 25.39 0.7464 6.09
584 45.9-
05/20/19981235
18
4,9404,840
7.1 426 82 7.28.2 3,69021.26 27.04 0.87
1,40268 6.74
622 54.0-
09/09/19981230
20
3,6843,850
7.2 265 56 6.66.8 2,60413.22 19.61 0.61
2,61054 4.61
451 38.0-
11/10/19981415
12
16

Station Date
Time
Temp.Field
Laboratory
pH EC Ca Mg Na NO3 B TDSSum TH
SAR
Mineral Constituentsmg/Lmeq/L
MineralConstituents
(mg/L)
(µS/cm) °C °F
TABLE 8
MINERAL ANALYSES OF SOUTHERN AREA DRAINS1998
CNR 0801
13,3347.1 414 356 23.728.0 11,30020.66 118.2 0.94
2,50066 29.28
2720 58.0-
01/13/19981415
19
11,50010,600
7.2 360 286 21.121.0 9,30017.96 96.09 0.8123.52
2210 50.2-
03/09/19981600
10,1709,800
7.1 385 355 16.320.0 8,64019.21 80.00 0.6166 29.19
1840 37.8-
05/04/19981215
19
12,15011,900
7.2 380 331 23.227.7 10,80018.96 111.3 0.8570 27.22
2560 53.0-
07/06/19981315
21
11,44011,300
7.1 362 299 22.024.9 10,10018.06 101.7 0.87
2,13673 24.59
2340 54.0-
09/08/19981400
23
COC 4126
6,3255,420
7.5 580 160 6.32.6 4,82028.94 29.04 1.7213.16
668 106.8-
03/09/19981530
7,0625,530
7.1 604 172 6.42.9 4,93030.14 30.30 1.5966 14.14
697 98.7-
05/04/19981145
19
5,5005,300
7.3 549 144 6.32.9 4,83027.40 27.83 1.31
1,96477 11.84
640 81.0-
09/08/19981330
25
5,5096,940
7.3 449 137 11.94.8 6,14022.41 48.70 0.31
1,68066 11.27
1120 19.0-
11/09/19981300
19
COC 5329
7,7977.5 544 150 10.14.5 5,64027.15 44.78 0.82
1,98066 12.34
1030 51.0-
01/13/19981300
19
8,3387,960
7.2 581 184 13.07.0 6,74028.99 60.87 0.4615.13
1400 28.3-
03/09/19981500
9,0407,940
6.9 605 187 12.46.7 6,67030.19 59.13 0.7966 15.38
1360 48.8-
05/04/19981100
19
8,2158,250
6.9 588 187 13.18.3 7,16029.34 61.74 0.2372 15.38
1420 14.0-
07/06/19981215
22
7,0386,860
6.8 538 156 10.46.1 6,08026.85 46.09 0.21
1,98612.83
1060 13.0-
09/08/19981300
17

Station Date
Time
Temp.Field
Laboratory
pH EC Ca Mg Na NO3 B TDSSum TH
SAR
Mineral Constituentsmg/Lmeq/L
MineralConstituents
(mg/L)
(µS/cm) °C °F
TABLE 8
MINERAL ANALYSES OF SOUTHERN AREA DRAINS1998 (continued)
ERR 7525
5,1955,370
7.1 150 84 17.22.5 4,0107.49 46.09 0.18
72170 6.91
1060 11.0-
09/08/1998845
21
4,5145,380
7.0 137 72 16.82.5 4,0306.84 42.30 0.08
63964 5.92
973 5.1-
11/10/1998945
18
ERR 8429
9,1537.3 112 89 35.43.0 6,3605.59 90.00 1.02
64666 7.32
2070 63.0-
01/13/19981000
19
10,63810,000
7.3 122 105 36.43.7 7,4106.09 98.70 0.258.63
2270 15.5-
03/10/19981000
8,0507,390
7.5 101 81 30.92.7 5,2605.04 74.78 0.2864 6.66
1720 17.5-
05/20/19981330
18
5,9356,130
7.3 125 68 23.43.0 4,4606.24 56.96 0.3572 5.60
1310 22.0-
07/07/1998845
22
9,2759,160
7.3 132 93 32.63.8 6,9006.59 86.96 0.47
71372 7.65
2000 29.0-
09/09/1998900
22
8,0508,660
7.2 118 81 30.73.1 6,5905.89 76.96 0.40
62864 6.66
1770 25.0-
11/10/19981015
18
ERR 8641
4,2387.1 136 75 14.61.4 3,2306.79 37.22 0.03
64966 6.17
856 2.1-
01/13/19981015
19
16,28415,000
7.1 364 330 32.63.7 12,60018.16 155.2 0.0363 27.14
3570 1.7-
05/20/19981415
17
14,31914,100
7.3 263 299 29.93.5 11,80013.12 129.5 0.02
1,88868 24.59
2980 1.5-
09/09/1998915
20
GSY 0855
12,36214,600
7.5 455 358 26.24.1 13,54022.70 133.9 0.07
2,60064 29.44
3080 4.5-
11/10/19981045
18
18

Station Date
Time
Temp.Field
Laboratory
pH EC Ca Mg Na NO3 B TDSSum TH
SAR
Mineral Constituentsmg/Lmeq/L
MineralConstituents
(mg/L)
(µS/cm) °C °F
TABLE 8
MINERAL ANALYSES OF SOUTHERN AREA DRAINS1998 (continued)
LNW 5454
25,9907.1 542 295 52.341.0 20,00027.05 264.7 2.68
2,57066 24.26
6090 166.0-
01/13/19981100
19
25,58825,000
7.3 538 278 55.250.9 26,00026.85 275.2 0.6364 22.86
6330 39.3-
05/20/19981030
18
18,00017,700
7.3 449 138 43.960.3 14,80022.41 180.4 0.55
1,69077 11.35
4150 34.0-
09/08/19981130
25
20,62219,800
7.6 446 189 44.742.9 16,58022.26 194.3 0.52
1,89266 15.54
4470 32.0-
11/09/19981115
19
LNW 5467
14,4087.3 545 174 26.718.0 10,70027.20 121.7 5.10
2,08066 14.31
2800 316.0-
01/13/19981130
19
10,35010,400
6.9 579 115 20.012.9 8,14028.89 87.39 1.069.46
2010 65.7-
03/09/19981300
16,10015,100
7.5 584 211 29.622.7 11,60029.14 142.6 1.2164 17.35
3280 75.1-
05/20/19981000
18
13,37213,100
6.9 1,05 342 18.436.9 10,10052.40 116.5 1.05
4,03173 28.13
2680 65.0-
09/08/19981100
23
12,43012,300
7.5 532 158 20.415.8 9,84026.55 90.87 1.00
1,97966 12.99
2090 62.0-
11/09/19981045
19
LNW 6459
35,56034,300
7.3 522 278 76.241.1 26,20026.05 376.5 0.4422.86
8660 27.4-
03/09/19981230
35,53235,300
7.3 450 261 84.046.2 25,80022.46 393.4 0.6070 21.46
9050 37.0-
07/06/1998945
21
24,18024,000
7.2 467 187 62.338.1 19,30023.30 273.9 0.45
1,93773 15.38
6300 28.0-
09/08/19981015
23
19

Station Date
Time
Temp.Field
Laboratory
pH EC Ca Mg Na NO3 B TDSSum TH
SAR
Mineral Constituentsmg/Lmeq/L
MineralConstituents
(mg/L)
(µS/cm) °C °F
TABLE 8
MINERAL ANALYSES OF SOUTHERN AREA DRAINS1998 (continued)
LNW 6467
27,37026,600
7.3 584 362 54.544.0 23,20029.14 295.6 1.0564 29.77
6800 65.3-
05/20/1998945
18
24,57024,100
7.2 551 298 49.942.0 19,00027.50 254.3 1.0270 24.51
5850 63.0-
07/06/19981015
21
25,22024,800
7.1 531 316 51.643.2 20,20026.50 264.3 0.97
2,62873 25.99
6080 60.0-
09/08/19981045
23
SFD 2727
15,8207.1 425 799 15.74.2 6,34021.21 103.4 2.32
4,35066 65.71
2380 144.0-
01/13/19981130
19
9,7759,410
6.9 296 606 12.62.8 8,90014.77 71.74 0.2164 49.84
1650 13.3-
05/20/19981500
18
8,7509,610
7.3 257 539 13.43.0 9,08012.82 71.39 0.2472 44.33
1642 15.0-
07/07/19981030
22
3,6843,770
6.8 159 170 6.71.2 3,0307.93 22.09 0.11
1,09772 13.98
508 7.1-
09/09/19981015
22
STC 5436
11,37811,900
7.5 90 34 68.010.3 8,5304.51 129.5 0.2968 2.75
2980 18.0-
07/01/1998745
20
7,8308,100
7.3 132 47 31.65.5 5,6006.59 72.17 0.34
52370 3.87
1660 21.0-
09/09/19981200
21
VGD 3906
28,58028,100
7.3 409 777 54.736.0 28,60020.41 355.2 0.1364 63.90
8170 7.8-
05/20/1998845
18
26,27226,200
7.3 354 640 52.833.9 21,30017.66 313.0 0.1866 52.63
7200 11.0-
07/06/1998815
19
25,65025,000
7.3 424 658 46.834.9 24,90021.16 286.9 0.16
3,76970 54.11
6600 9.8-
09/08/1998900
21
VGD 4406
19,71018,700
7.2 421 386 40.833.1 18,50021.01 209.5 0.26
2,64170 31.74
4820 16.0-
09/08/1998830
21
20

Station Date
Time
Temp.Field
Laboratory
pH EC Ca Mg Na NO3 B TDSSum TH
SAR
Mineral Constituentsmg/Lmeq/L
MineralConstituents
(mg/L)
(µS/cm) °C °F
TABLE 8
MINERAL ANALYSES OF SOUTHERN AREA DRAINS1998 (continued)
VGD 5412
8,33812,100
7.3 347 196 30.919.9 10,70017.32 126.0 0.1716.12
2900 10.8-
03/09/19981000
14,75014,100
7.3 376 257 34.924.0 11,00018.76 155.6 0.2063 21.13
3580 12.2-
05/20/1998730
17
13,84213,800
7.3 337 265 33.621.6 12,70016.82 147.3 0.2466 21.79
3390 15.0-
07/06/1998745
19
15,12015,100
7.3 357 303 33.123.6 13,70017.81 153.0 0.19
2,14070 24.92
3520 12.0-
09/08/1998815
21
21
22
Trace Elements Trace elements occur naturally in rock and soil. Aluminum, barium, cadmium, cobalt, copper, iron, lead, mercury, silver, and zinc historically have been very low or undetectable in drainage water. Consequently, they have not been sampled since 1987. Selenium was the only trace element sampled for in 1998. A summary of selenium concentrations detected in the Central and Southern Area drains is listed in Table 9. The 1998 selenium levels are compared to laboratory EC, and field pH in Tables 10 and 11 for the Central and Southern stations, respectively.
TABLE 9
SUMMARY OF SELENIUM DETECTED 1998
(milligrams per Liter)
Selenium Selenium is a naturally occurring, nonmetallic chemical element that accumulates in drainage water when selenium-enriched salts are leached into the shallow groundwater. Water-quality problems associated with selenium are most likely in areas of the San Joaquin Valley where soils are formed of sediments from marine sedimentary rocks of the Coast Range. The occurrence of Coast Range sediments and the highest selenium concentrations are clearly linked throughout the Valley. Three areas of the western valley (1) the alluvial fans near Panoche and Cantua Creeks in the central western valley, (2) an area west of the town of Lost Hills, and (3) the Buena Vista Lake Bed area have the highest soil selenium concentrations. High concentrations of selenium occur in subsurface drain water from some agricultural lands near, but not necessarily within, all three areas. Selenium levels for the Central Area subsurface drains ranged from 0.016 to 0.173 mg/L; the Central surface drains ranged from 0.001 to 0.124 mg/L . All Southern Area drains had measurable levels of selenium, varying from 0.001 to 0.78 mg/L. Selenium levels for the Central and Southern Area stations are shown in Figures 4 through 7.
Arithmetic GeometricAverage Mean
0.001 0.124 0.043 0.012
0.016 0.173 0.080 0.059
0.001 0.780 0.091 0.019
Central Surface Drains
Central Subsurface Drains
Southern Subsurface Drains
Area Minimum Maximum

23
TABLE 10
SELENIUM, ELECTRICAL CONDUCTIVITY, and FIELD pH CENTRAL AREA DRAINS
1998
Se Lab. EC Se Lab. ECmg/L S/cm mg/L S/cm
BVS 6016 01/11/98 0.106 6,560 7.2 DPS 3235* 03/11/98 0.085 4,860 8.2BVS 6016 03/11/98 0.106 6,560 - DPS 3235* 05/20/98 0.124 5,610 8.3BVS 6016 05/20/98 0.102 6,690 7.4 DPS 3235* 09/09/98 0.065 4,970 8.2BVS 6016 09/09/98 0.059 5,030 7.2 DPS 3235* 11/10/98 0.064 5,300 8.3BVS 6016 11/10/98 0.159 8,580 7.3 DPS 3465 03/11/98 0.028 8,480 7.2BVS 8003 03/11/98 0.093 7,710 7.5 DPS 3465 05/20/98 0.030 9,700 7.2BVS 8003 05/20/98 0.170 9,440 7.4 DPS 3465 09/09/98 0.018 7,190 6.7BVS 8003 09/09/98 0.067 9,460 7.3 DPS 4616 03/11/98 0.017 11,900 7.5CTL 4504* 03/11/98 0.004 1,170 8.1 DPS 4616 05/20/98 0.019 12,300 7.4CTL 4504* 05/20/98 0.001 264 7.6 DPS 4616 11/10/98 0.016 11,590 7.4CTL 4504* 09/09/98 0.001 291 8.1 FBH 2016 05/20/98 0.037 9,520 7.6CTL 4504* 11/10/98 0.002 272 7.8 FBH 2016 09/09/98 0.173 5,800 7.4DPS 1367 01/13/98 0.142 5,460 7.3 FBH 8061 03/11/98 0.038 4,380 7.4DPS 1367 03/11/98 0.152 5,500 7.2 HMH 7516 01/13/98 0.032 3,800 7.3DPS 1367 05/20/98 0.170 5,700 7.3 HMH 7516 03/11/98 0.050 4,540 -DPS 1367 09/09/98 0.162 5,670 7.2 HMH 7516 05/20/98 0.041 4,290 7.3DPS 1367 11/10/98 0.164 5,590 7.3 HMH 7516 09/09/98 0.045 4,840 7.1DPS 2535 05/20/98 0.031 8,400 7.3 HMH 7516 11/10/98 0.025 3,850 7.2* Surface Drain
Station Date Field pH Field pHDateStation

24
TABLE 11
SELENIUM, ELECTRICAL CONDUCTIVITY, and FIELD pH SOUTHERN AREA SUBSURFACE DRAINS
1998
Se Lab. EC Se Lab. ECmg/L S/cm mg/L S/cm
CNR 0801 01/13/98 0.008 13,334 7.1 LNW 5467 01/13/98 0.180 14,408 7.3CNR 0801 03/09/98 0.031 10,600 7.2 LNW 5467 03/09/98 0.104 10,400 6.9CNR 0801 05/04/98 0.033 9,800 7.1 LNW 5467 05/20/98 0.206 15,100 7.5CNR 0801 07/06/98 0.032 11,900 7.2 LNW 5467 09/08/98 0.181 13,100 6.9CNR 0801 09/08/98 0.027 11,300 7.1 LNW 5467 11/09/98 0.124 12,300 7.5COC 4126 03/09/98 0.030 5,420 7.5 LNW 6459 03/09/98 0.085 34,300 7.3COC 4126 05/04/98 0.032 5,530 7.1 LNW 6459 07/06/98 0.082 35,300 7.3COC 4126 09/08/98 0.028 5,300 7.3 LNW 6459 09/08/98 0.060 24,000 7.2COC 4126 11/09/98 0.102 6,940 7.3 LNW 6467 05/20/98 0.620 26,600 7.3COC 5329 01/13/98 0.095 7,797 7.5 LNW 6467 07/06/98 0.270 24,100 7.2COC 5329 03/09/98 0.318 7,960 7.2 LNW 6467 09/08/98 0.780 24,800 7.1COC 5329 05/04/98 0.402 7,940 6.9 SFD 2727 01/13/98 0.007 15,820 7.1COC 5329 07/06/98 0.256 8,250 6.9 SFD 2727 05/20/98 0.004 9,410 6.9COC 5329 09/08/98 0.252 6,860 6.8 SFD 2727 07/07/98 0.004 9,610 7.3ERR 7525 09/09/98 0.007 5,370 7.1 SFD 2727 09/09/98 0.002 3,770 6.8ERR 7525 11/10/98 0.007 5,380 7.0 STC 5436 07/01/98 0.001 11,900 7.5ERR 8429 01/13/98 0.005 9,153 7.3 STC 5436 09/09/98 0.001 8,100 7.3ERR 8429 03/10/98 0.001 10,000 7.3 VGD 3906 05/20/98 0.003 28,100 7.3ERR 8429 05/20/98 0.005 7,390 7.5 VGD 3906 07/06/98 0.003 26,200 7.3ERR 8429 07/07/98 0.004 6,130 7.3 VGD 3906 09/08/98 0.003 25,000 7.3ERR 8429 09/09/98 0.005 9,160 7.3 VGD 4406 09/08/98 0.002 18,700 7.2ERR 8429 11/10/98 0.005 8,660 7.2 VGD 5412 03/09/98 0.002 12,100 7.3ERR 8641 01/13/98 0.001 4,238 7.1 VGD 5412 05/20/98 0.002 14,100 7.3ERR 8641 05/20/98 0.010 15,000 7.1 VGD 5412 07/06/98 0.002 13,800 7.3ERR 8641 09/09/98 0.006 14,100 7.3 VGD 5412 09/08/98 0.002 15,100 7.3GSY 0855 11/10/98 0.017 14,600 7.5LNW 5454 01/13/98 0.236 25,990 7.1LNW 5454 05/20/98 0.203 25,000 7.3LNW 5454 09/08/98 0.008 17,700 7.3LNW 5454 11/09/98 0.108 19,800 7.6
Date Field pHStation Date Field pH Station

25
DWR’s Future Monitoring Program
Plans are being formulated to modify and redirect activities of DWR’s ongoing monitoring program. Additional piezometers will be installed in areas where groundwater level and quality data are lacking. This effort will be focused in the Lost Hills, Buttonwillow and Buena Vista areas. Currently, a plan is being developed to replace non-functioning flow accumulator meters on existing sumps and to install flow accumulators on new sumps. This work involves cooperation and participation from water and drainage districts and from willing growers. Protocols to collect data from the various districts are being refined so that data can be obtained and evaluated in a timely manner. The two databases that store groundwater and sump data are being refined. Also, preparations are being made to produce a 2001 Electrical Conductivity Map. In addition, plans are being made to solicit regulatory agencies for appropriate drainage data that can be included in the annual report. Lastly, water quality sampling will be modified yearly to address specific constituent issues.

26
Insert: Figure 4, 1998 Selenium Levels-Central Area Stations (p. 26] Figure 5, 1998 Selenium Levels-Southern Area, Lemoore/Corcoran Stations (p.27) Figure 6, 1998 Selenium Levels-Southern Area, Lost Hills/Semitropic Stations (p.28). Figure 7, 1998 Selenium Levels-Southern Area, Kern Lakebed Stations (p.29).

30
APPENDIX A
GRAPHS OF WATER QUALITY IN DRAINAGE SUMPS
CENTRAL AREA

31
10
10
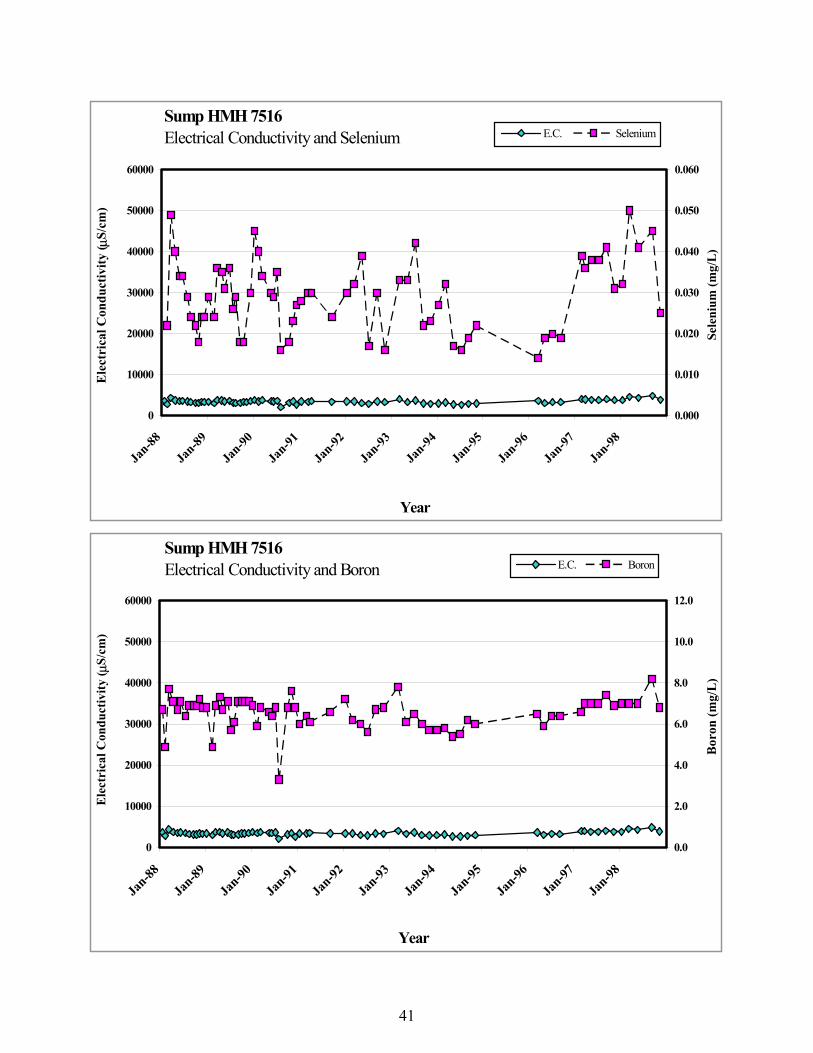
Sump BVS 6016Electrical Conductivity and Selenium
0
10000
20000
30000
40000
50000
60000
Jan-88
Jan-89
Jan-90
Jan-91
Jan-92
Jan-93
Jan-94
Jan-95
Jan-96
Jan-97
Jan-98
Year
Ele
ctri
cal C
ondu
ctiv
ity (
S/cm
)
0.000
0.040
0.080
0.120
0.160
0.200
0.240
Sele
nium
(mg/
L)
E.C. Selenium
Sump BVS 6016Electrical Conductivity and Boron
0
10000
20000
30000
40000
50000
60000
Jan-88
Jan-89
Jan-90
Jan-91
Jan-92
Jan-93
Jan-94
Jan-95
Jan-96
Jan-97
Jan-98
Year
Ele
ctri
cal C
ondu
ctiv
ity (
S/cm
)
0.0
2.0
4.0
6.0
8.0
10.0
12.0
Bor
on (m
g/L
)
E.C. Boron

32
Sump BVS 8003Electrical Conductivity and Selenium
0
10000
20000
30000
40000
50000
60000
Jan-88
Jan-89
Jan-90
Jan-91
Jan-92
Jan-93
Jan-94
Jan-95
Jan-96
Jan-97
Jan-98
Year
Ele
ctri
cal C
ondu
ctiv
ity (
S/cm
)
0.000
0.050
0.100
0.150
0.200
0.250
0.300
Sele
nium
(mg/
L)
E.C. Selenium
Sump BVS 8003Electrical Conductivity and Boron
0
10000
20000
30000
40000
50000
60000
Jan-88
Jan-89
Jan-90
Jan-91
Jan-92
Jan-93
Jan-94
Jan-95
Jan-96
Jan-97
Jan-98
Year
Ele
ctri
cal C
ondu
ctiv
ity (
S/cm
)
0.0
7.0
14.0
21.0
28.0
35.0
42.0
Bor
on (m
g/L
)
E.C. Boron

33
Sump CTL 4504Electrical Conductivity and Selenium
0
10000
20000
30000
40000
50000
60000
Jan-88
Jan-89
Jan-90
Jan-91
Jan-92
Jan-93
Jan-94
Jan-95
Jan-96
Jan-97
Jan-98
Year
Ele
ctri
cal C
ondu
ctiv
ity (
S/cm
)
0.000
0.020
0.040
0.060
0.080
0.100
0.120
Sele
nium
(mg/
L)
E.C. Selenium
Sump CTL 4504Electrical Conductivity and Boron
0
10000
20000
30000
40000
50000
60000
Jan-88
Jan-89
Jan-90
Jan-91
Jan-92
Jan-93
Jan-94
Jan-95
Jan-96
Jan-97
Jan-98
Year
Ele
ctri
cal C
ondu
ctiv
ity (
S/cm
)
0.0
2.0
4.0
6.0
8.0
10.0
12.0
Bor
on (m
g/L
)
E.C. Boron

34
Sump DPS 1367Electrical Conductivity and Selenium
0
10000
20000
30000
40000
50000
60000
Jan-88
Jan-89
Jan-90
Jan-91
Jan-92
Jan-93
Jan-94
Jan-95
Jan-96
Jan-97
Jan-98
Year
Ele
ctri
cal C
ondu
ctiv
ity (
S/cm
)
0.000
0.040
0.080
0.120
0.160
0.200
0.240
Sele
nium
(mg/
L)
E.C. Selenium
Sump DPS 1367Electrical Conductivity and Boron
0
10000
20000
30000
40000
50000
60000
Jan-88
Jan-89
Jan-90
Jan-91
Jan-92
Jan-93
Jan-94
Jan-95
Jan-96
Jan-97
Jan-98
Year
Ele
ctri
cal C
ondu
ctiv
ity (
S/cm
)
0.0
1.0
2.0
3.0
4.0
5.0
6.0
Bor
on (m
g/L
)
E.C. Boron

35
Sump DPS 2535Electrical Conductivity and Selenium
0
10000
20000
30000
40000
50000
60000
Jan-88
Jan-89
Jan-90
Jan-91
Jan-92
Jan-93
Jan-94
Jan-95
Jan-96
Jan-97
Jan-98
Year
Ele
ctri
cal C
ondu
ctiv
ity (
S/cm
)
0.000
0.010
0.020
0.030
0.040
0.050
0.060
Sele
nium
(mg/
L)
E.C. Selenium
Sump DPS 2535Electrical Conductivity and Boron
0
10000
20000
30000
40000
50000
60000
Jan-88
Jan-89
Jan-90
Jan-91
Jan-92
Jan-93
Jan-94
Jan-95
Jan-96
Jan-97
Jan-98
Year
Ele
ctri
cal C
ondu
ctiv
ity (
S/cm
)
0.0
5.0
10.0
15.0
20.0
25.0
30.0
Bor
on (m
g/L
)
E.C. Boron

36
Sump DPS 3235Electrical Conductivity and Selenium
0
10000
20000
30000
40000
50000
60000
Jan-88
Jan-89
Jan-90
Jan-91
Jan-92
Jan-93
Jan-94
Jan-95
Jan-96
Jan-97
Jan-98
Year
Ele
ctri
cal C
ondu
ctiv
ity (
S/cm
)
0.000
0.040
0.080
0.120
0.160
0.200
0.240
Sele
nium
(mg/
L)
E.C. Selenium
Sump DPS 3235Electrical Conductivity and Boron
0
10000
20000
30000
40000
50000
60000
Jan-88
Jan-89
Jan-90
Jan-91
Jan-92
Jan-93
Jan-94
Jan-95
Jan-96
Jan-97
Jan-98
Year
Ele
ctri
cal C
ondu
ctiv
ity (
S/cm
)
0.0
2.0
4.0
6.0
8.0
10.0
12.0
Bor
on (m
g/L
)
E.C. Boron

37
Sump DPS 3465Electrical Conductivity and Selenium
0
10000
20000
30000
40000
50000
60000
Jan-88
Jan-89
Jan-90
Jan-91
Jan-92
Jan-93
Jan-94
Jan-95
Jan-96
Jan-97
Jan-98
Year
Ele
ctri
cal C
ondu
ctiv
ity (
S/cm
)
0.000
0.020
0.040
0.060
0.080
0.100
0.120
Sele
nium
(mg/
L)
E.C. Selenium
Sump DPS 3465Electrical Conductivity and Boron
0
10000
20000
30000
40000
50000
60000
Jan-88
Jan-89
Jan-90
Jan-91
Jan-92
Jan-93
Jan-94
Jan-95
Jan-96
Jan-97
Jan-98
Year
Ele
ctri
cal C
ondu
ctiv
ity (
S/cm
)
0.0
4.0
8.0
12.0
16.0
20.0
24.0
Bor
on (m
g/L
)
E.C. Boron

38
Sump DPS 4616Electrical Conductivity and Selenium
0
10000
20000
30000
40000
50000
60000
Jan-88
Jan-89
Jan-90
Jan-91
Jan-92
Jan-93
Jan-94
Jan-95
Jan-96
Jan-97
Jan-98
Year
Ele
ctri
cal C
ondu
ctiv
ity (
S/cm
)
0.000
0.010
0.020
0.030
0.040
0.050
0.060
Sele
nium
(mg/
L)
E.C. Selenium
Sump DPS 4616Electrical Conductivity and Boron
0
10000
20000
30000
40000
50000
60000
Jan-88
Jan-89
Jan-90
Jan-91
Jan-92
Jan-93
Jan-94
Jan-95
Jan-96
Jan-97
Jan-98
Year
Ele
ctri
cal C
ondu
ctiv
ity (
S/cm
)
0.0
10.0
20.0
30.0
40.0
50.0
60.0
Bor
on (m
g/L
)
E.C. Boron

39
Sump FBH 2016Electrical Conductivity and Selenium
0
10000
20000
30000
40000
50000
60000
Jan-88
Jan-89
Jan-90
Jan-91
Jan-92
Jan-93
Jan-94
Jan-95
Jan-96
Jan-97
Jan-98
Year
Ele
ctri
cal C
ondu
ctiv
ity (
S/cm
)
0.000
0.080
0.160
0.240
0.320
0.400
0.480
Sele
nium
(mg/
L)
E.C. Selenium
Sump FBH 2016Electrical Conductivity and Boron
0
10000
20000
30000
40000
50000
60000
Jan-88
Jan-89
Jan-90
Jan-91
Jan-92
Jan-93
Jan-94
Jan-95
Jan-96
Jan-97
Jan-98
Year
Ele
ctri
cal C
ondu
ctiv
ity (
S/cm
)
0.0
4.0
8.0
12.0
16.0
20.0
24.0
Bor
on (m
g/L
)
E.C. Boron

40
Sump FBH 8061Electrical Conductivity and Selenium
0
10000
20000
30000
40000
50000
60000
Jan-88
Jan-89
Jan-90
Jan-91
Jan-92
Jan-93
Jan-94
Jan-95
Jan-96
Jan-97
Jan-98
Year
Ele
ctri
cal C
ondu
ctiv
ity (
S/cm
)
0.000
0.010
0.020
0.030
0.040
0.050
0.060
Sele
nium
(mg/
L)
E.C. Selenium
Sump FBH 8061Electrical Conductivity and Boron
0
10000
20000
30000
40000
50000
60000
Jan-88
Jan-89
Jan-90
Jan-91
Jan-92
Jan-93
Jan-94
Jan-95
Jan-96
Jan-97
Jan-98
Year
Ele
ctri
cal C
ondu
ctiv
ity (
S/cm
)
0.0
2.0
4.0
6.0
8.0
10.0
12.0
Bor
on (m
g/L
)
E.C. Boron
41
Sump HMH 7516Electrical Conductivity and Selenium
0
10000
20000
30000
40000
50000
60000
Jan-88
Jan-89
Jan-90
Jan-91
Jan-92
Jan-93
Jan-94
Jan-95
Jan-96
Jan-97
Jan-98
Year
Ele
ctri
cal C
ondu
ctiv
ity (
S/cm
)
0.000
0.010
0.020
0.030
0.040
0.050
0.060
Sele
nium
(mg/
L)
E.C. Selenium
Sump HMH 7516Electrical Conductivity and Boron
0
10000
20000
30000
40000
50000
60000
Jan-88
Jan-89
Jan-90
Jan-91
Jan-92
Jan-93
Jan-94
Jan-95
Jan-96
Jan-97
Jan-98
Year
Ele
ctri
cal C
ondu
ctiv
ity (
S/cm
)
0.0
2.0
4.0
6.0
8.0
10.0
12.0
Bor
on (m
g/L
)
E.C. Boron
42
APPENDIX B
GRAPHS OF WATER QUALITY IN DRAINAGE SUMPS
SOUTHERN AREA

43
Sump CCN 3550 Electrical Conductivity and Boron
0
10000
20000
30000
40000
50000
60000
Jan-88
Jan-89
Jan-90
Jan-91
Jan-92
Jan-93
Jan-94
Jan-95
Jan-96
Jan-97
Year
Ele
ctri
cal C
ondu
ctiv
ity (
S/cm
)
0.00
0.24
0.48
0.72
0.96
1.20
1.44
Bor
on (m
g/L
)
E.C. Boron
Sump CCN 3550Electrical Conductivity and Selenium
0
10000
20000
30000
40000
50000
60000
Jan-88
Jan-89
Jan-90
Jan-91
Jan-92
Jan-93
Jan-94
Jan-95
Jan-96
Jan-97
Year
Ele
ctri
cal C
ondu
ctiv
ity (
S/cm
)
0.000
0.001
0.002
0.003
0.004
0.005
0.006
Sele
nium
(mg/
L)
E.C. Selenium

44
Sump CNR 0801Electrical Conductivity and Selenium
0
10000
20000
30000
40000
50000
60000
Jan-88
Jan-89
Jan-90
Jan-91
Jan-92
Jan-93
Jan-94
Jan-95
Jan-96
Jan-97
Jan-98
Year
Ele
ctri
cal C
ondu
ctiv
ity (
S/cm
)
0.000
0.008
0.016
0.024
0.032
0.040
0.048
Sele
nium
(mg/
L)
E.C. Selenium
Sump CNR 0801Electrical Conductivity and Boron
0
10000
20000
30000
40000
50000
60000
Jan-88
Jan-89
Jan-90
Jan-91
Jan-92
Jan-93
Jan-94
Jan-95
Jan-96
Jan-97
Jan-98
Year
Ele
ctri
cal l
Con
duct
ivity
(S/
cm)
0.00
7.00
14.00
21.00
28.00
35.00
42.00
Bor
on (m
g/L
)
E.C. Boron
45
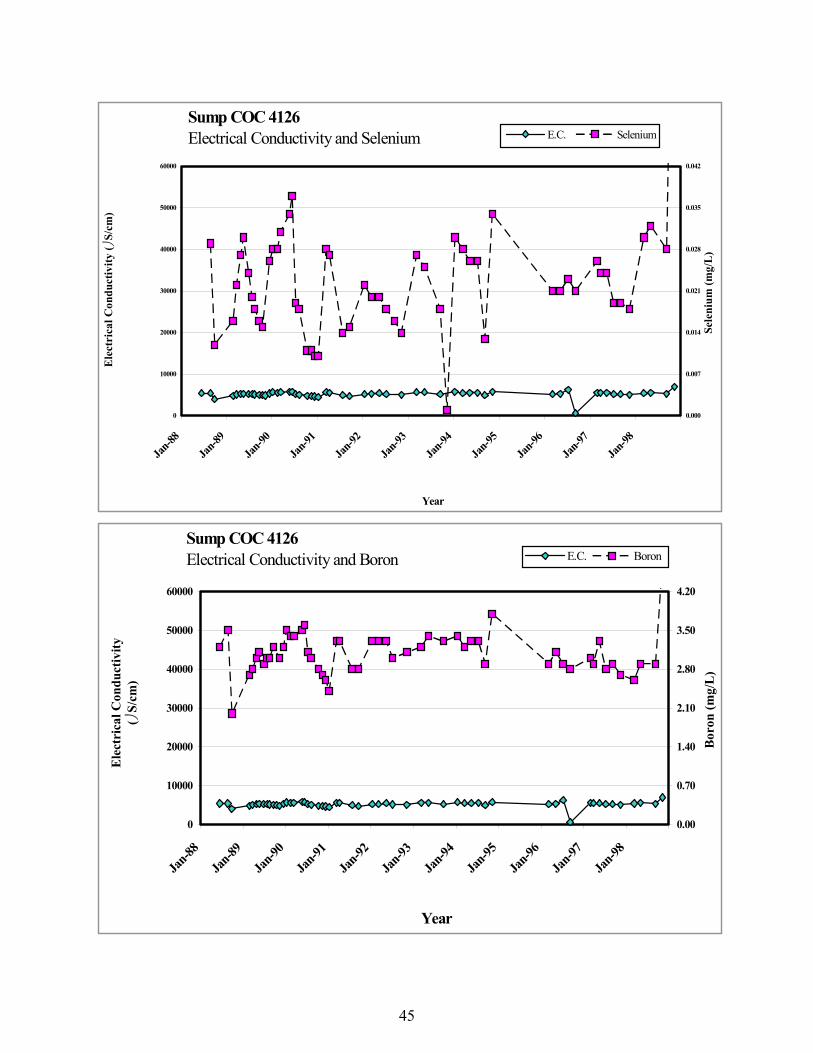
Sump COC 4126Electrical Conductivity and Selenium
0
10000
20000
30000
40000
50000
60000
Jan-8
8Ja
n-89
Jan-9
0Ja
n-91
Jan-9
2Ja
n-93
Jan-9
4Ja
n-95
Jan-9
6Ja
n-97
Jan-9
8
Year
Ele
ctri
cal C
ondu
ctiv
ity (
S/cm
)
0.000
0.007
0.014
0.021
0.028
0.035
0.042
Sele
nium
(mg/
L)
E.C. Selenium
Sump COC 4126Electrical Conductivity and Boron
0
10000
20000
30000
40000
50000
60000
Jan-8
8Ja
n-89Ja
n-90
Jan-9
1Ja
n-92Ja
n-93
Jan-9
4Ja
n-95Ja
n-96
Jan-9
7Ja
n-98
Year
Ele
ctri
cal C
ondu
ctiv
ity
( S/
cm)
0.00
0.70
1.40
2.10
2.80
3.50
4.20
Bor
on (m
g/L
)
E.C. Boron

46
Sump COC 5329Electrical Conductivity and Selenium
0
10000
20000
30000
40000
50000
60000
Jan-88
Jan-89
Jan-90
Jan-91
Jan-92
Jan-93
Jan-94
Jan-95
Jan-96
Jan-97
Jan-98
Year
Ele
ctri
cal C
ondu
ctiv
ity (
S/cm
)
0.000
0.150
0.300
0.450
0.600
0.750
0.900
Sele
nium
(mg/
L)
E.C. Selenium
Sump COC 5329Electrical Conductivity and Boron
0
10000
20000
30000
40000
50000
60000
Jan-88
Jan-89
Jan-90
Jan-91
Jan-92
Jan-93
Jan-94
Jan-95
Jan-96
Jan-97
Jan-98
Year
Ele
ctri
cal C
ondu
ctiv
ity (
S/cm
)
0.00
2.00
4.00
6.00
8.00
10.00
12.00
Bor
on (m
g/L
)
E.C. Boron

47
Sump ERR 7525Electrical Conductivity and Selenium
0
10000
20000
30000
40000
50000
60000
Jan-88
Jan-89
Jan-90
Jan-91
Jan-92
Jan-93
Jan-94
Jan-95
Jan-96
Jan-97
Jan-98
Year
Ele
ctri
cal C
ondu
ctiv
ity (
S/cm
)
0.000
0.003
0.006
0.009
0.012
0.015
0.018
Sele
nium
(mg/
L)
E.C. Selenium
Sump ERR 7525Electrical Conductivity and Boron
0
10000
20000
30000
40000
50000
60000
Jan-88
Jan-89
Jan-90
Jan-91
Jan-92
Jan-93
Jan-94
Jan-95
Jan-96
Jan-97
Jan-98
Year
Ele
ctri
cal C
ondu
ctiv
ity (
S/cm
)
0.00
0.80
1.60
2.40
3.20
4.00
4.80
Bor
on (m
g/L
)
E.C. Boron

48
Sump ERR 8429Electrical Conductivity and Selenium
0
10000
20000
30000
40000
50000
60000
Jan-88
Jan-89
Jan-90
Jan-91
Jan-92
Jan-93
Jan-94
Jan-95
Jan-96
Jan-97
Jan-98
Year
Ele
ctri
cal C
ondu
ctiv
ity (
S/cm
)
0.000
0.002
0.004
0.006
0.008
0.010
0.012
Sele
nium
(mg/
L)
E.C. Selenium
Sump ERR 8429Electrical Conductivity and Boron
0
10000
20000
30000
40000
50000
60000
Jan-88
Jan-89
Jan-90
Jan-91
Jan-92
Jan-93
Jan-94
Jan-95
Jan-96
Jan-97
Jan-98
Year
Ele
ctri
cal C
ondu
ctiv
ity (
S/cm
)
0.00
0.70
1.40
2.10
2.80
3.50
4.20
Bor
on (m
g/L
)
E.C. Boron

49
Sump ERR 8641Electrical Conductivity and Selenium
0
10000
20000
30000
40000
50000
60000
Jan-88
Jan-89
Jan-90
Jan-91
Jan-92
Jan-93
Jan-94
Jan-95
Jan-96
Jan-97
Jan-98
Year
Ele
ctri
cal C
ondu
ctiv
ity (
S/cm
)
0.000
0.008
0.016
0.024
0.032
0.040
0.048
Sele
nium
(mg/
L)
E.C. Selenium
Sump ERR 8641Electrical Conductivity and Boron
0
10000
20000
30000
40000
50000
60000
Jan-88
Jan-89
Jan-90
Jan-91
Jan-92
Jan-93
Jan-94
Jan-95
Jan-96
Jan-97
Jan-98
Year
Ele
ctri
cal C
ondu
ctiv
ity (
S/cm
)
0.00
1.10
2.20
3.30
4.40
5.50
6.60
Bor
on (m
g/L
)
E.C. Boron

50
Sump GSY 0855Electrical Conductivity and Selenium
0
10000
20000
30000
40000
50000
60000
Jan-88
Jan-89
Jan-90
Jan-91
Jan-92
Jan-93
Jan-94
Jan-95
Jan-96
Jan-97
Jan-98
Year
Ele
ctri
cal C
ondu
ctiv
ity (
S/cm
)
0.00
0.01
0.02
0.03
0.04
0.05
0.05
Sele
nium
(mg/
L)
E.C. Selenium
Sump GSY 0855Electrical Conductivity and Boron
0
10000
20000
30000
40000
50000
60000
Jan-88
Jan-89
Jan-90
Jan-91
Jan-92
Jan-93
Jan-94
Jan-95
Jan-96
Jan-97
Jan-98
Year
Ele
ctri
cal C
ondu
ctiv
ity (
S/cm
)
0.00
1.00
2.00
3.00
4.00
5.00
6.00
Bor
on (m
g/L
)
E.C. Boron

51
Sump HCH 7439Electrical Conductivity and Selenium
0
10000
20000
30000
40000
50000
60000
Jan-88
Jan-89
Jan-90
Jan-91
Jan-92
Jan-93
Jan-94
Jan-95
Jan-96
Jan-97
Jan-98
Year
Ele
ctri
cal C
ondu
ctiv
ity (
S/cm
)
0.000
0.004
0.008
0.012
0.016
0.020
0.024
Sele
nium
(mg/
L)
E.C. Selenium
Sump HCH 7439Electrical Conductivity and Boron
0
10000
20000
30000
40000
50000
60000
Jan-88
Jan-89
Jan-90
Jan-91
Jan-92
Jan-93
Jan-94
Jan-95
Jan-96
Jan-97
Jan-98
Year
Ele
ctri
cal C
ondu
ctiv
ity (
S/cm
)
0.00
1.10
2.20
3.30
4.40
5.50
6.60
Bor
on (m
g/L
)
E.C. Boron

52
Sump LNW 5454Electrical Conductivity and Selenium
0
10000
20000
30000
40000
50000
60000
Jan-88
Jan-89
Jan-90
Jan-91
Jan-92
Jan-93
Jan-94
Jan-95
Jan-96
Jan-97
Jan-98
Year
Ele
ctri
cal C
ondu
ctiv
ity (
S/cm
)
0.000
0.050
0.100
0.150
0.200
0.250
0.300
Sele
nium
(mg/
L)
E.C. Selenium
Sump LNW 5454Electrical Conductivity and Boron
0
10000
20000
30000
40000
50000
60000
Jan-88
Jan-89
Jan-90
Jan-91
Jan-92
Jan-93
Jan-94
Jan-95
Jan-96
Jan-97
Jan-98
Year
Ele
ctri
cal C
ondu
ctiv
ity (
S/cm
)
0.00
11.00
22.00
33.00
44.00
55.00
66.00
Bor
on (m
g/L
)
E.C. Boron

53
1x
Sump LNW 5467Electrical Conductivity and Selenium
0
10000
20000
30000
40000
50000
60000
Jan-88
Jan-89
Jan-90
Jan-91
Jan-92
Jan-93
Jan-94
Jan-95
Jan-96
Jan-97
Jan-98
Year
Ele
ctri
cal C
ondu
ctiv
ity (
S/cm
)
0.000
0.050
0.100
0.150
0.200
0.250
0.300
Sele
nium
(mg/
L)
E.C. Selenium
Sump LNW 5467Electrical Conductivity and Boron
0
10000
20000
30000
40000
50000
60000
Jan-88
Jan-89
Jan-90
Jan-91
Jan-92
Jan-93
Jan-94
Jan-95
Jan-96
Jan-97
Jan-98
Year
Ele
ctri
cal C
ondu
ctiv
ity (
S/cm
)
0.00
5.00
10.00
15.00
20.00
25.00
30.00
Bor
on (m
g/L
)
E.C. Boron
54
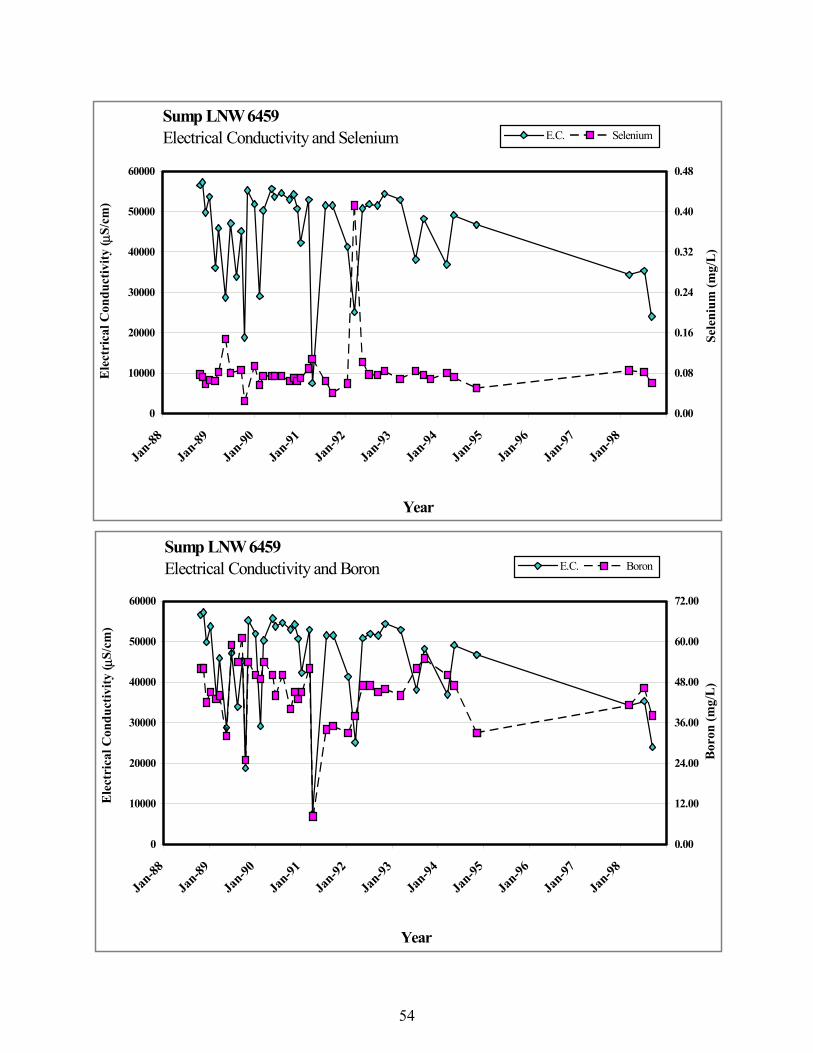
Sump LNW 6459Electrical Conductivity and Selenium
0
10000
20000
30000
40000
50000
60000
Jan-88
Jan-89
Jan-90
Jan-91
Jan-92
Jan-93
Jan-94
Jan-95
Jan-96
Jan-97
Jan-98
Year
Ele
ctri
cal C
ondu
ctiv
ity (
S/cm
)
0.00
0.08
0.16
0.24
0.32
0.40
0.48
Sele
nium
(mg/
L)
E.C. Selenium
Sump LNW 6459Electrical Conductivity and Boron
0
10000
20000
30000
40000
50000
60000
Jan-88
Jan-89
Jan-90
Jan-91
Jan-92
Jan-93
Jan-94
Jan-95
Jan-96
Jan-97
Jan-98
Year
Ele
ctri
cal C
ondu
ctiv
ity (
S/cm
)
0.00
12.00
24.00
36.00
48.00
60.00
72.00
Bor
on (m
g/L
)
E.C. Boron

55
Sump LNW 6467Electrical Conductivity and Selenium
0
10000
20000
30000
40000
50000
60000
Jan-88
Jan-89
Jan-90
Jan-91
Jan-92
Jan-93
Jan-94
Jan-95
Jan-96
Jan-97
Jan-98
Year
Ele
ctri
cal C
ondu
ctiv
ity (
S/cm
)
0.00
0.16
0.32
0.48
0.64
0.80
0.96
Sele
nium
(mg/
L)
E.C. Selenium
Sump LNW 6467Electrical Conductivity and Boron
0
10000
20000
30000
40000
50000
60000
Jan-88
Jan-89
Jan-90
Jan-91
Jan-92
Jan-93
Jan-94
Jan-95
Jan-96
Jan-97
Jan-98
Year
Ele
ctri
cal C
ondu
ctiv
ity (
S/cm
)
0.0
11.0
22.0
33.0
44.0
55.0
66.0
Bor
on (m
g/L
)
E.C. Boron

56
Sump SFD 2727Electrical Conductivity and Selenium
0
10000
20000
30000
40000
50000
60000
Jan-88
Jan-89
Jan-90
Jan-91
Jan-92
Jan-93
Jan-94
Jan-95
Jan-96
Jan-97
Jan-98
Year
Ele
ctri
cal C
ondu
ctiv
ity (
S/cm
)
0.000
0.001
0.002
0.003
0.004
0.005
0.006
0.007
0.008
Sele
nium
(mg/
L)
E.C. Selenium
Sump SFD 2727Electrical Conductivity and Boron
0
10000
20000
30000
40000
50000
60000
Jan-88
Jan-89
Jan-90
Jan-91
Jan-92
Jan-93
Jan-94
Jan-95
Jan-96
Jan-97
Jan-98
Year
Ele
ctri
cal C
ondu
ctiv
ity (
S/cm
)
0.0
1.0
2.0
3.0
4.0
5.0
6.0
Bor
on (m
g/L
)
E.C. Boron

57
Sump STC 3505Electrical Conductivity and Selenium
0
10000
20000
30000
40000
50000
60000
Jan-88
Jan-89
Jan-90
Jan-91
Jan-92
Jan-93
Jan-94
Jan-95
Jan-96
Jan-97
Jan-98
Year
Ele
ctri
cal C
ondu
ctiv
ity (
S/cm
)
0.000
0.002
0.004
0.006
0.008
0.010
0.012
Sele
nium
(mg/
L)
E.C. Selenium
Sump STC 3505Electrical Conductivity and Boron
0
10000
20000
30000
40000
50000
60000
Jan-88
Jan-89
Jan-90
Jan-91
Jan-92
Jan-93
Jan-94
Jan-95
Jan-96
Jan-97
Jan-98
Year
Ele
ctri
cal C
ondu
ctiv
ity (
S/cm
)
0.0
0.4
0.8
1.2
1.6
2.0
2.4
Bor
on (m
g/L
)
E.C. Boron

58
Sump STC 5436Electrical Conductivity and Selenium
0
10000
20000
30000
40000
50000
60000
Jan-88
Jan-89
Jan-90
Jan-91
Jan-92
Jan-93
Jan-94
Jan-95
Jan-96
Jan-97
Jan-98
Year
Ele
ctri
cal C
ondu
ctiv
ity (
S/cm
)
0.000
0.001
0.002
0.003
0.004
0.005
0.006
Sele
nium
(mg/
L)
E.C Selenium
Sump STC 5436Electrical Conductivity and Boron
0
10000
20000
30000
40000
50000
60000
Jan-88
Jan-89
Jan-90
Jan-91
Jan-92
Jan-93
Jan-94
Jan-95
Jan-96
Jan-97
Jan-98
Year
Ele
ctri
cal C
ondu
ctiv
ity (
S/cm
)
0.00
5.00
10.00
15.00
20.00
25.00
30.00
Bor
on (m
g/L
)
E.C Boron

59
Sump STC 6467Electrical Conductivity and Selenium
0
10000
20000
30000
40000
50000
60000
Jan-88
Jan-89
Jan-90
Jan-91
Jan-92
Jan-93
Jan-94
Jan-95
Jan-96
Jan-97
Jan-98
Year
Ele
ctri
cal C
ondu
ctiv
ity (
S/cm
)
0.000
0.001
0.002
0.003
0.004
0.005
0.006
Sele
nium
(mg/
L)
E.C Selenium
Sump STC 6467Electrical Conductivity and Boron
0
10000
20000
30000
40000
50000
60000
Jan-88
Jan-89
Jan-90
Jan-91
Jan-92
Jan-93
Jan-94
Jan-95
Jan-96
Jan-97
Jan-98
Year
Ele
ctri
cal C
ondu
ctiv
ity (
S/cm
)
0.00
0.40
0.80
1.20
1.60
2.00
2.40
Bor
on (m
g/L
)
E.C Boron

60
Sump VGD 3906Electrical Conductivity and Selenium
0
10000
20000
30000
40000
50000
60000
Jan-88
Jan-89
Jan-90
Jan-91
Jan-92
Jan-93
Jan-94
Jan-95
Jan-96
Jan-97
Jan-98
Year
Ele
ctri
cal C
ondu
ctiv
ity (
S/cm
)
0.000
0.002
0.004
0.006
0.008
0.010
0.012
Sele
nium
(mg/
L)
E.C Selenium
Sump VGD 3906Electrical Conductivity and Boron
0
10000
20000
30000
40000
50000
60000
Jan-88
Jan-89
Jan-90
Jan-91
Jan-92
Jan-93
Jan-94
Jan-95
Jan-96
Jan-97
Jan-98
Year
Ele
ctri
cal C
ondu
ctiv
ity (
S/cm
)
0.00
8.00
16.00
24.00
32.00
40.00
48.00
Bor
on (m
g/L
)
E.C Boron

61
Sump VGD 4406Electrical Conductivity and Selenium
0
10000
20000
30000
40000
50000
60000
Jan-88
Jan-89
Jan-90
Jan-91
Jan-92
Jan-93
Jan-94
Jan-95
Jan-96
Jan-97
Jan-98
Year
Ele
ctri
cal C
ondu
ctiv
ity (
S/cm
)
0.000
0.002
0.004
0.006
0.008
0.010
0.012
Sele
nium
(mg/
L)
E.C Selenium
Sump VGD 4406Electrical Conductivity and Boron
0
10000
20000
30000
40000
50000
60000
Jan-88
Jan-89
Jan-90
Jan-91
Jan-92
Jan-93
Jan-94
Jan-95
Jan-96
Jan-97
Jan-98
Year
Ele
ctri
cal C
ondu
ctiv
ity (
S/cm
)
0.00
8.00
16.00
24.00
32.00
40.00
48.00
Bor
on (m
g/L
)
E.C Boron

62
Sump VGD 5412Electrical Conductivity and Selenium
0
10000
20000
30000
40000
50000
60000
Jan-88
Jan-89
Jan-90
Jan-91
Jan-92
Jan-93
Jan-94
Jan-95
Jan-96
Jan-97
Jan-98
Year
Ele
ctri
cal C
ondu
ctiv
ity (
S/cm
)
0.000
0.001
0.002
0.003
0.004
0.005
0.006
Sele
nium
(mg/
L)
E.C Selenium
Sump VGD 5412Electrical Conductivity and Boron
0
10000
20000
30000
40000
50000
60000
Jan-88
Jan-89
Jan-90
Jan-91
Jan-92
Jan-93
Jan-94
Jan-95
Jan-96
Jan-97
Jan-98
Year
Ele
ctri
cal C
ondu
ctiv
ity (
S/cm
)
0.00
6.00
12.00
18.00
24.00
30.00
36.00
Bor
on (m
g/L
)
E.C Boron

63
Insert: Plate 1. Present & Potential Drainage Problem Areas

64
BIBLIOGRAPHY
Ayers, R.S. and D.W. Westcot. 1985. Water Quality for Agriculture. Food and Agriculture Organization of the United Nations. Rome, Italy. California Department of Water Resources. 1978. Introduction to Water Quality Course Manual. Division of Planning, Sacramento, California. California Regional Water Quality Control Board, Central Valley Region.1989. The Designated Level Methodology for Waste Classification and Cleanup Level Determination. Fresno, California. Doorenbos, J. and W.O. Pruitt. 1977. Guidelines for Predicting Crop Water Requirements. Food and Agriculture Organization of the United Nations. Rome, Italy. Hem, John D. 1970. Study and Interpretation of the Chemical Characteristics of Natural Water. U.S. Government Printing Office, Washington, DC. San Joaquin Valley Interagency Drainage Program. 1979. Agricultural Drainage and Salt
Management in the San Joaquin Valley, Final Report. Fresno, California. San Joaquin Valley Drainage Program. 1990. A Management Plan for Agricultural Subsurface Drainage and Related Problems on the Westside San Joaquin Valley.
Sacramento, California.
Tchobanoglous, George and Edward D. Schroeder, University of California at Davis. 1985. Water Quality-Characteristics-Modeling-Modification. Addison-Wesley Publishing, Canada.
United States Bureau of Reclamation, et al. 1991. A Strategy for Implementation of the
Management Plan for Agricultural Subsurface Drainage and Related Problems on the Westside San Joaquin Valley. A joint effort by the U.S. Bureau of Reclamation, Fish
and Wildlife Service, Soil Conservation Service, and Geological Survey; and the California Department of Water Resources, Department of Fish and Game,
Department of Food and Agriculture, and State Water Resources Control Board. United States Geological Survey. 1993. Water-Quality Data for Shallow Wells in the Western and Southern Tulare Basin, San Joaquin Valley, California, May to August 1989. Open-file Report 92-655. Sacramento, California University of California, SJVDIP. January 2000. Final Report-Evaluation of the 1990 Drainage Management Plan for the Westside San Joaquin Valley, California. Prepared by SJVDIP and the University of California Ad Hoc Coordination Committee Utah State University Foundation. 1969. Characteristics and Pollution Problems of Irrigation
Return Flow. Robert S. Kerr Water Research Center, Ada, Oklahoma.
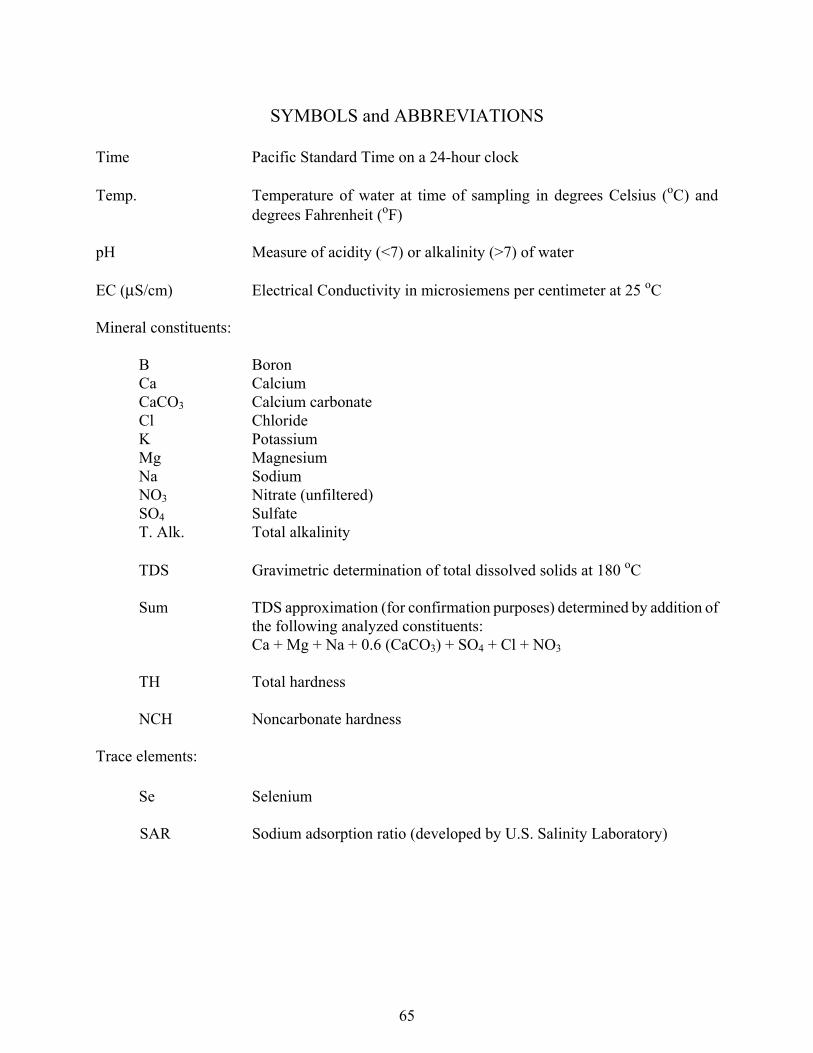
65
SYMBOLS and ABBREVIATIONS Time Pacific Standard Time on a 24-hour clock Temp. Temperature of water at time of sampling in degrees Celsius ( C) and
degrees Fahrenheit ( F) pH Measure of acidity (<7) or alkalinity (>7) of water EC ( S/cm) Electrical Conductivity in microsiemens per centimeter at 25 C Mineral constituents:
B Boron Ca Calcium CaCO3 Calcium carbonate Cl Chloride K Potassium Mg Magnesium Na Sodium NO3 Nitrate (unfiltered) SO4 Sulfate T. Alk. Total alkalinity
TDS Gravimetric determination of total dissolved solids at 180 C
Sum TDS approximation (for confirmation purposes) determined by addition of
the following analyzed constituents: Ca + Mg + Na + 0.6 (CaCO3) + SO4 + Cl + NO3
TH Total hardness
NCH Noncarbonate hardness
Trace elements:
Se Selenium SAR Sodium adsorption ratio (developed by U.S. Salinity Laboratory)

METRIC CONVERSIONS
Quantity
To Convert from Metric Unit
To Customary Unit
Multiply
Metric Unit by
To Convert to Metric Unit
Multiply Customary Unit
by Length millimeters (mm) inches (in) 0.03937 25.4
centimeters (cm) for snow depth inches (in) 0.3937 2.54 metros (m) feet (ft) 3.2808 0.3048 kilometers (km) miles (mi) 0.62139 1.6093
Area square millimeters (mm2) square inches (in2) 0.00155 645.16
square metros (m2) square feet (ft2) 10.764 0.092903 hectares (ha) acres (ac) 2.4710 0.40469 square kilometers (km2) square miles (mi2) 0.3861 2.590
Volume liters (L) gallons (gal) 0.26417 3.7854
megalitres million gallons (106 gal) 0.26417 3.7854 cubic meters (m3) cubic feet (ft3) 35.315 0.028317 cubic meters (m3) cubic yards (yd3) 1.308 0.76455 cubic decameters (dam3) acre-feet (ac-ft) 0.8107 1.2335
Flow cubic meters per second (m3/s) cubic feet per second (ft3/s) 35.315 0.028317
liters per minute (L/min) gallons per minute (gal/min) 0.26417 3.7854 liters per day (L/day) gallons per day (gal/day) 0.26417 3.7854 megalitres per day (ML/day) million gallons per day (mgd) 0.26417 3.7854 cubic decameters per day acre-feet per day (ac-ft/day) 0.8107 1.2335 (dam3/day)
Mass kilograms (kg) pounds (lb) 2.2046 0.45359
megagrams (Mg) tons (short, 2,000 lb) 1.1023 0.90718 Velocity meters per second (m/s) feet per second (ft/s) 3.2808 0.3048 Power kilowatts (kW) horsepower (hp) 1.3405 0.746 Pressure kilopascals (kPa) pounds per square inch (psi) 0.14505 6.8948
kilopascals (kPa) feet head of water 0.33456 2.989 Specific liters per minute per meter gallons per minute per 0.08052 12.419 Capacity drawdown foot drawdown Concentration milligrams per liter (mg/L) parts per million (ppm) 1.0 1.0 Electrical microsiemens per centimeter micromhos per centimeter 1.0 1.0 Conductivity (FS/cm) (Fmho/cm) Temperature degrees Celsius (EC) degrees Fahrenheit (EF) (1.8xEC)+32 (EF--32)/1.8

67