Embed Size (px)
Citation preview

SOUTH DAKOTA INVESTMENT COUNCIL
AUDIT REPORT
Fiscal Year Ended June 30, 2021
State of South Dakota Department of Legislative Audit
427 South Chapelle c/o 500 East Capitol
Pierre, SD 57501-5070

SOUTH DAKOTA INVESTMENT COUNCIL TABLE OF CONTENTS
Cash Flow Portfolio Independent Auditor’s Report on Internal Control Over Financial Reporting and on Compliance and Other Matters Based on an Audit of Financial Statements Performed in Accordance with Government Auditing Standards .......................... 1 Independent Auditor's Report ................................................................................. 3 Financial Statements: Statement of Net Position ........................................................................... 5 Statement of Changes in Net Position ........................................................ 6 Notes to the Financial Statements.......................................................................... 7 Trust Portfolios Independent Auditor’s Report on Internal Control Over Financial Reporting and on Compliance and Other Matters Based on an Audit of Financial Statements Performed in Accordance with Government Auditing Standards .......................... 12 Independent Auditor's Report ................................................................................. 14 Financial Statements: Statement of Net Position ........................................................................... 16 Statement of Changes in Net Position ........................................................ 17 Notes to the Financial Statements.......................................................................... 18
INDEPENDENT AUDITOR’S REPORT ON INTERNAL CONTROL OVER FINANCIAL REPORTING AND ON COMPLIANCE AND OTHER MATTERS
BASED ON AN AUDIT OF FINANCIAL STATEMENTS PERFORMED IN ACCORDANCE WITH GOVERNMENT AUDITING STANDARDS
Executive Board Legislative Research Council and Investment Council State of South Dakota We have audited, in accordance with the auditing standards generally accepted in the United States of America and the standards applicable to financial audits contained in Government Auditing Standards issued by the Comptroller General of the United States, the financial statements of the Cash Flow portfolio, an internal investment pool of the State of South Dakota, as of and for the year ended June 30, 2021, and the related notes to the financial statements, which collectively comprise the Cash Flow portfolio’s basic financial statements and have issued our report thereon dated October 1, 2021.
Internal Control Over Financial Reporting In planning and performing our audit of the financial statements, we considered the South Dakota Investment Council’s internal control over financial reporting (internal control) as a basis for designing audit procedures that are appropriate in the circumstances for the purpose of expressing our opinion on the financial statements, but not for the purpose of expressing an opinion on the effectiveness of the South Dakota Investment Council’s internal control. Accordingly, we do not express an opinion on the effectiveness of the South Dakota Investment Council’s internal control. A deficiency in internal control exists when the design or operation of a control does not allow management or employees, in the normal course of performing their assigned functions, to prevent, or detect and correct misstatements on a timely basis. A material weakness is a deficiency, or a combination of deficiencies, in internal control, such that there is a reasonable possibility that a material misstatement of the entity’s financial statements will not be prevented or detected and corrected on a timely basis. A significant deficiency is a deficiency, or a combination of deficiencies, in internal control that is less severe than a material weakness, yet important enough to merit attention by those charged with governance. Our consideration of internal control was for the limited purpose described in the first paragraph of this section and was not designed to identify all deficiencies in internal control that might be material weaknesses or significant deficiencies. Given these limitations, during our audit we did not identify any deficiencies in internal control that we consider to be material weaknesses. However, material weaknesses may exist that have not been identified.
1
Compliance and Other Matters As part of obtaining reasonable assurance about whether the South Dakota Investment Council’s financial statements are free from material misstatement, we performed tests of its compliance with certain provisions of laws, regulations, and contracts, noncompliance with which could have a direct and material effect on the financial statements. However, providing an opinion on compliance with those provisions was not an objective of our audit, and accordingly, we do not express such an opinion. The results of our tests disclosed no instances of noncompliance or other matters that are required to be reported under Government Auditing Standards.
Purpose of this Report
The purpose of this report is solely to describe the scope of our testing of internal control and compliance and
the results of that testing, and not to provide an opinion on the effectiveness of the entity’s internal control or on
compliance. This report is an integral part of an audit performed in accordance with Government Auditing
Standards in considering the entity’s internal control and compliance. Accordingly, this communication is not
suitable for any other purpose. As required by South Dakota Codified Law 4-11-11, this report is a matter of
public record and its distribution is not limited.
Russell A. Olson Auditor General October 1, 2021
2

INDEPENDENT AUDITOR'S REPORT Executive Board Legislative Research Council and Investment Council State of South Dakota
Report on the Financial Statements We have audited the accompanying financial statements of the Cash Flow portfolio, an internal investment pool of the State of South Dakota, as of and for the fiscal year ended June 30, 2021, and related notes to the financial statements, as listed in the table of contents.
Management’s Responsibility for the Financial Statements Management is responsible for the preparation and fair presentation of these financial statements in accordance with accounting principles generally accepted in the United States of America; this includes the design, implementation, and maintenance of internal control relevant to the preparation and fair presentation of financial statements that are free from material misstatement, whether due to fraud or error.
Auditor’s Responsibility Our responsibility is to express an opinion on these financial statements based on our audit. We conducted our audit in accordance with auditing standards generally accepted in the United States of America and the standards applicable to financial audits contained in Government Auditing Standards, issued by the Comptroller General of the United States. Those standards require that we plan and perform the audit to obtain reasonable assurance about whether the financial statements are free from material misstatement. An audit involves performing procedures to obtain audit evidence about the amounts and disclosures in the financial statements. The procedures selected depend on the auditor’s judgment, including the assessment of the risks of material misstatement of the financial statements, whether due to fraud or error. In making those risk assessments, the auditor considers internal control relevant to the entity’s preparation and fair presentation of the financial statements in order to design audit procedures that are appropriate in the circumstances, but not for the purpose of expressing an opinion on the effectiveness of the entity’s internal control. Accordingly, we express no such opinion. An audit also includes evaluating the appropriateness of accounting policies used and the reasonableness of significant accounting estimates made by management, as well as evaluating the overall presentation of the financial statements. We believe that the audit evidence we have obtained is sufficient and appropriate to provide a basis for our audit opinion.
3
Opinion In our opinion, the financial statements referred to above present fairly, in all material respects, the financial position of the portfolio listed above as of June 30, 2021, and the changes in its financial position for the year then ended in accordance with accounting principles generally accepted in the United States of America.
Emphasis of Matter The financial statements present only the above referenced investment portfolio managed by the South Dakota Investment Council and do not purport to, and do not, present fairly the financial position of the State of South Dakota as of June 30, 2021, the changes in its financial position, or, where applicable, its cash flows for the fiscal year then ended in accordance with accounting principles generally accepted in the United States of America. Our opinion is not modified with respect to this matter.
Other Reporting Required by Government Auditing Standards In accordance with Government Auditing Standards, we have also issued our report dated October 1, 2021, on our consideration of the South Dakota Investment Council’s internal control over financial reporting and our tests of its compliance with certain provisions of laws, regulations, contracts, and other matters. The purpose of that report is solely to describe the scope of our testing of internal control over financial reporting and compliance and the results of that testing, and not to provide an opinion on the effectiveness of the South Dakota Investment Council’s internal control over financial reporting or on compliance. That report is an integral part of an audit performed in accordance with Government Auditing Standards in considering South Dakota Investment Council’s internal control over financial reporting and compliance.
Russell A. Olson Auditor General October 1, 2021
4

Assets
Cash & cash equivalents 23,421,690$
Investment income receivable 5,596,767
Investments, at fair value
Short term investment fund 860,671,207
Fixed income 1,245,284,911
Total investments 2,105,956,118
Total assets 2,134,974,575
Liabilities
Earnings distribution - declared 33,352,907
Total liabilities 33,352,907
Net Position 2,101,621,668$
The accompanying notes are an integral part of the financial statements.
As of June 30, 2021
Statement of Net Position
Cash Flow Portfolio
South Dakota Investment Council
5

Additions:
Investment income (loss):
From investing activities:
Net depreciation in fair value of investments (24,895,464)$
Interest 25,103,194
Investment income 207,730
Less investment activity expense (569,817)
Net investment activity loss (362,087)
Total investment loss (362,087)
Total reductions (362,087)
Deductions:
Withdrawals (net) 535,483,248
Statutorily required distributions 33,352,907
Total deductions 568,836,155
Net decrease in net position (569,198,242)
Net position - Beginning of year 2,670,819,910
Net position - End of year 2,101,621,668$
The accompanying notes are an integral part of the financial statements.
For the fiscal year ended June 30, 2021
Statement of Changes in Net Position
Cash Flow Portfolio
South Dakota Investment Council
6

SOUTH DAKOTA INVESTMENT COUNCIL CASH FLOW PORTFOLIO
NOTES TO THE FINANCIAL STATEMENTS 1. Reporting Entity: The South Dakota Investment Council (SDIC) is a principal, functional sub-unit of state government. The
SDIC is responsible for the investment of the state’s monies in the state treasury. The SDIC provides investment management services on a prefunded cost recovery basis as authorized by South Dakota Codified Law (SDCL) 4-5-30.
The statements represent the financial activity of the Cash Flow portfolio. The Cash Flow portfolio
represents the state’s aggregate idle fund monies for all state funds, except certain funds for which separate portfolios have been established.
2. Summary of Significant Accounting Policies: a. Basis of Presentation:
The accompanying financial statements of the investment activity of the SDIC on behalf of the Cash Flow portfolio are prepared in accordance with generally accepted accounting principles (GAAP) for governments as prescribed by the Governmental Accounting Standards Board (GASB).
b. Basis of Accounting:
The statements for the portfolio are reported on the full accrual basis of accounting. Under this method, revenues are recognized in the accounting period in which they are earned and expenses are recognized in the period incurred. Security transactions and the related gains and losses are recorded on a trade date basis using the average cost method. Interest income is accrued as earned.
c. Cash and Cash Equivalents:
Cash includes demand deposits. Cash equivalents include non-negotiable certificates of deposit, which are reported at cost.
d. Valuation of Securities:
Investments are reported at fair value, in accordance with GASB Statement No. 72. Fair value is the price that would be received to sell an asset or paid to transfer a liability in an orderly transaction between market participants at the measurement date. GASB 72 sets forth the framework for measuring value. The framework provides a fair value hierarchy that prioritizes the inputs to valuation techniques used to measure fair value into three levels. The three levels of the fair value hierarchy under GASB 72 are described as follows:
Level 1 – Valuation inputs are quoted prices in active markets for identical asset or liability as of the
measurement date. Level 2 – Valuation inputs other than quoted prices included within Level 1 that are observable for an
asset or liability, either directly or indirectly. Level 3 – Valuation inputs are based on significant unobservable inputs for an asset or liability. As a practical expedient, GASB 72 allows the net asset value (NAV) or its equivalent to be used when
a readily determinable fair value is not available. The NAV valuations are based on valuations of the underlying companies or securities as determined and reported by the fund manager or general partner and are excluded from the fair value hierarchy.
7
Additional required disclosures can be found in Note 4: Fair Value Measurement.
e. Use of Estimates:
The preparation of financial statements in accordance with GAAP requires management to make estimates that affect the reported amounts of net position as of June 30, 2021. Actual results could differ from those estimates.
f. New GAAP Implementation:
Government Accounting Standards Board did not issue any new or updated statements that affected SDIC for fiscal year 2021.
3. Deposits, Investments and Securities Lending: The State Investment Officer is responsible for the investment of state public funds. State public funds in
the Cash Flow portfolio are invested using the pooled deposit and investment concept which preserves the integrity of the fund cash balances of each state fund while simultaneously allowing the deposit and investment of aggregate idle fund monies. The Cash Flow portfolio may be invested in the following classes of securities and investments and not otherwise:
(1) Direct and indirect obligations of the United States government; (2) Agencies and instrumentalities of the United States government; (3) Direct obligations of the State of South Dakota and any of its political subdivisions;
(4) Obligations consisting of notes, bonds, debentures, and certificates which are direct obligations of a solvent corporation or trust existing under the laws of the United States or any state thereof, if such investments are rated in the four highest classifications established by at least two standard rating services at the time of purchase;
(5) Savings accounts, share accounts, certificates of deposit of banks, savings and loan associations,
building and loan associations and bankers’ acceptances;
(6) In addition to the investments authorized by subdivisions (1) to (5) of this section, inclusive, the investment council may also allocate a sum certain of state public funds for investment in the accounts and certificates of South Dakota banks and associations. This sum shall initially be offered to South Dakota banks and associations, and if not initially fully subscribed, the investment officer shall immediately reoffer the unsubscribed sum to other qualified public depositories. “Qualified public depository” is a state bank and loan association or federally chartered credit union located in this state which receives or holds public deposits and segregates eligible collateral for public deposits.
Deposits: Custodial Credit Risk. The custodial credit risk for deposits is the risk that, in the event of the failure of a
depository institution, a government will not be able to recover deposits or will not be able to recover collateral securities that are in the possession of an outside party. The Cash Flow portfolio’s certificates of deposit and other deposits in state financial institutions in excess of depository insurance must be 100% collateralized. Collateral is valued at the lower of cost or market as reported in the quarterly call reports prepared by the qualified public depositories pursuant to SDCL 4-6A-7. Collateral is required to be segregated by each depository as approved by the South Dakota Public Deposit Protection Commission. Collateral may not be held in any safety deposit vault owned or controlled either directly or indirectly by the pledging financial institution, but must be deposited for safekeeping in a financial institution that is a member of the Federal Reserve. As of June 30, 2021, pledged collateral for two depositories did not equal at least 100 percent of the total public deposits in excess of depository insurance. As a result, $25,854 of the Cash Flow portfolio’s certificates of deposit was exposed to custodial credit risk.
8
Investments: Securities Lending. State statutes and the SDIC policies permit the use of investments for securities
lending transactions. These transactions involve the lending of corporate debt to broker-dealers for collateral in the form of securities, with the simultaneous agreement to return the collateral for the same securities in the future. The SDIC’s securities custodian is an agent in lending securities and shall accept only U.S. Government securities or its agencies as collateral for any loan or loaned securities. The collateral required must equal 102% of fair value plus accrued interest for corporate debt securities. The earnings generated from the collateral investments results in the gross earnings from lending activities, which is then split on a percentage basis with the lending agent.
The Cash Flow portfolio did not have any securities on loan as of June 30, 2021 so the portfolio did not
have any credit risk exposure to borrowers. The contract with the lending agent requires the agent to indemnify the SDIC if the borrowers fail to return
the loaned securities and the collateral is inadequate to replace the securities lent. All securities loans can be terminated on demand by either the SDIC or the borrower. The SDIC does not have the ability to pledge or sell collateral securities unless the borrower defaults. Regarding restrictions on loans, the securities lending agreement does limit the total value of securities that can be out on loan on any given day.
Custodial Credit Risk. The custodial credit risk for investments is the risk that, in the event of the failure of
the counterparty to a transaction, a government will not be able to recover the value of investment or collateral securities that are in the possession of an outside party. The SDIC’s securities lending policies are detailed in the preceding Securities Lending section. As of June 30, 2021, the Cash Flow portfolio does not have custodial credit risk with regard to securities lending.
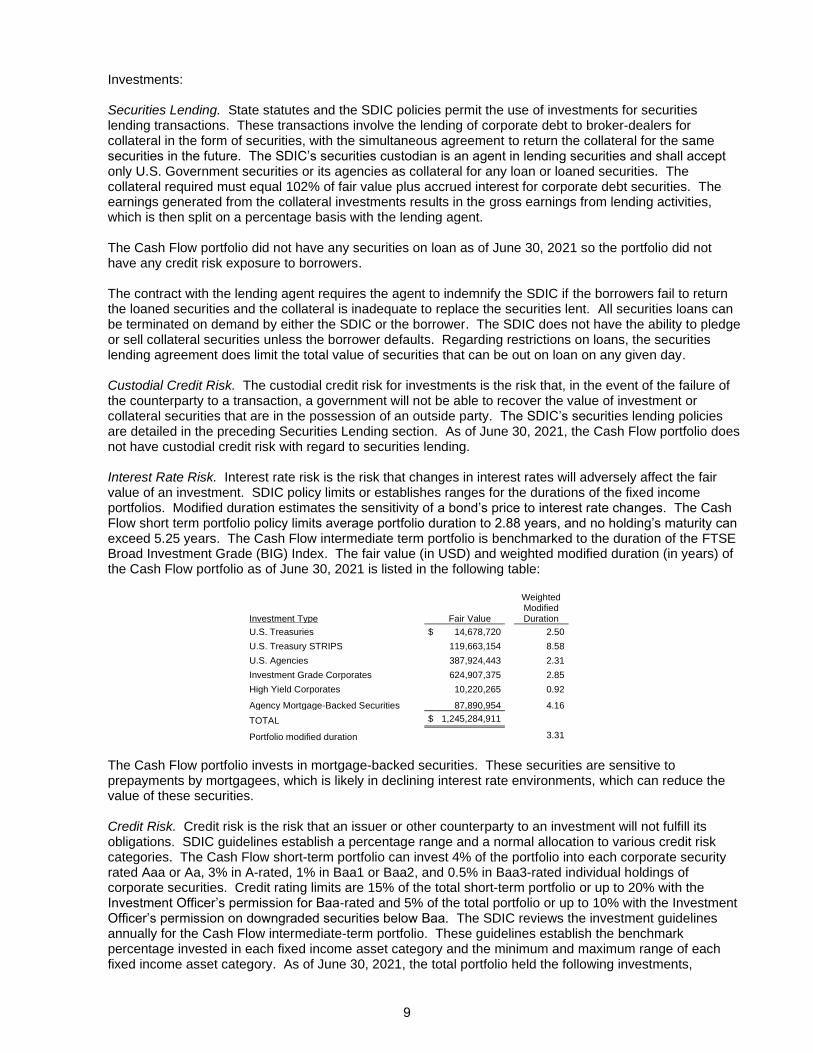
Interest Rate Risk. Interest rate risk is the risk that changes in interest rates will adversely affect the fair
value of an investment. SDIC policy limits or establishes ranges for the durations of the fixed income portfolios. Modified duration estimates the sensitivity of a bond’s price to interest rate changes. The Cash Flow short term portfolio policy limits average portfolio duration to 2.88 years, and no holding’s maturity can exceed 5.25 years. The Cash Flow intermediate term portfolio is benchmarked to the duration of the FTSE Broad Investment Grade (BIG) Index. The fair value (in USD) and weighted modified duration (in years) of the Cash Flow portfolio as of June 30, 2021 is listed in the following table:
Investment Type Fair Value
Weighted Modified Duration
U.S. Treasuries $ 14,678,720 2.50
U.S. Treasury STRIPS 119,663,154 8.58
U.S. Agencies 387,924,443 2.31
Investment Grade Corporates 624,907,375 2.85
High Yield Corporates 10,220,265 0.92
Agency Mortgage-Backed Securities 87,890,954 4.16
TOTAL $ 1,245,284,911
Portfolio modified duration 3.31
The Cash Flow portfolio invests in mortgage-backed securities. These securities are sensitive to
prepayments by mortgagees, which is likely in declining interest rate environments, which can reduce the value of these securities.
Credit Risk. Credit risk is the risk that an issuer or other counterparty to an investment will not fulfill its
obligations. SDIC guidelines establish a percentage range and a normal allocation to various credit risk categories. The Cash Flow short-term portfolio can invest 4% of the portfolio into each corporate security rated Aaa or Aa, 3% in A-rated, 1% in Baa1 or Baa2, and 0.5% in Baa3-rated individual holdings of corporate securities. Credit rating limits are 15% of the total short-term portfolio or up to 20% with the Investment Officer’s permission for Baa-rated and 5% of the total portfolio or up to 10% with the Investment Officer’s permission on downgraded securities below Baa. The SDIC reviews the investment guidelines annually for the Cash Flow intermediate-term portfolio. These guidelines establish the benchmark percentage invested in each fixed income asset category and the minimum and maximum range of each fixed income asset category. As of June 30, 2021, the total portfolio held the following investments,
9

excluding those issued by or explicitly guaranteed by the U.S. Government, which are not considered to have credit risk. The investments are grouped as rated by Moody’s Investors Service (at fair value):
Moody’s rating:
Aaa $ 1,263,149,422
Aa 115,131,809
A 390,381,033
Baa 104,840,761
Ba 10,220,265
Total $ 1,883,723,290
Concentration of Credit Risk. Concentration of credit risk is the risk of loss that may be attributed to the
magnitude of a government’s investment in a single issuer. The Cash Flow portfolio has a policy in place limiting its investments in individual holdings. Information regarding the policy is located in the Credit Risk section. Additionally, there are no single issuer exposures (excluding those issued by or explicitly guaranteed by the U.S. Government, or involving mutual funds or investment pools) within the portfolio that comprises 5% of the overall portfolio as of June 30, 2021.
4. Fair Value Measurement: Investments are reported at fair value as of June 30, 2021, to the extent available. GASB Statement No. 72
– Fair Value Measurement and Application, defines fair value as the price that would be received to sell an asset or paid to transfer a liability in an orderly transaction between market participants at the measurement date. This statement establishes a hierarchy of valuation inputs based on the extent to which the inputs are observable in the marketplace. Level 1 inputs are quoted prices in active markets for identical assets; Level 2 inputs are other than quoted prices included within Level 1 that are observable; Level 3 inputs are significant unobservable inputs. Investments that are measured at fair value using the net asset value per share (or its equivalent) as a practical expedient are not classified in the hierarchy below.
The following table summarizes the Cash Flow portfolio investments within the fair value hierarchy as of
June 30, 2021:
Total Level 1 Level 2 Level 3
Investments by fair value level
Debt securities
U.S. Treasuries $ 14,678,720 $ 0 $ 14,678,720 $ 0
U.S. Treasury STRIPS 119,663,154 0 119,663,154 0
U.S. Agencies 387,924,443 0 387,924,443 0
Investment Grade Corporates 624,907,375 0 624,907,375 0
High Yield Corporates 10,220,265 0 10,220,265 0
Agency Mortgage-Backed Securities 87,890,954 0 87,890,954 0
Total debt securities 1,245,284,911 0 1,245,284,911 0
Total investments by fair value level 1,245,284,911 $ 0 $ 1,245,284,911 $ 0
Investments measured at the net asset value (NAV)
Short Term Investment Funds 860,671,207
Total investments measured at the NAV 860,671,207
Total investments measured at the fair value $ 2,105,956,118
The Cash Flow portfolio did not hold any Level 1 or Level 3 investments as of June 30, 2021. Debt securities classified in Level 2 of the fair value hierarchy are valued using observable inputs other than quoted prices for identical securities. The prices are determined by the use of matrix pricing techniques maintained by the various pricing vendors for these securities. Matrix pricing is used to value securities based on the securities’ relationship to benchmark quoted prices.
The Cash Flow portfolio holds shares or interest in investments where the fair value of the investments are measured on a recurring basis using net asset value per share (or its equivalent) of the investment as a practical expedient. The NAV valuations are based on valuations of the underlying companies or securities as determined and reported by the fund manager.
10
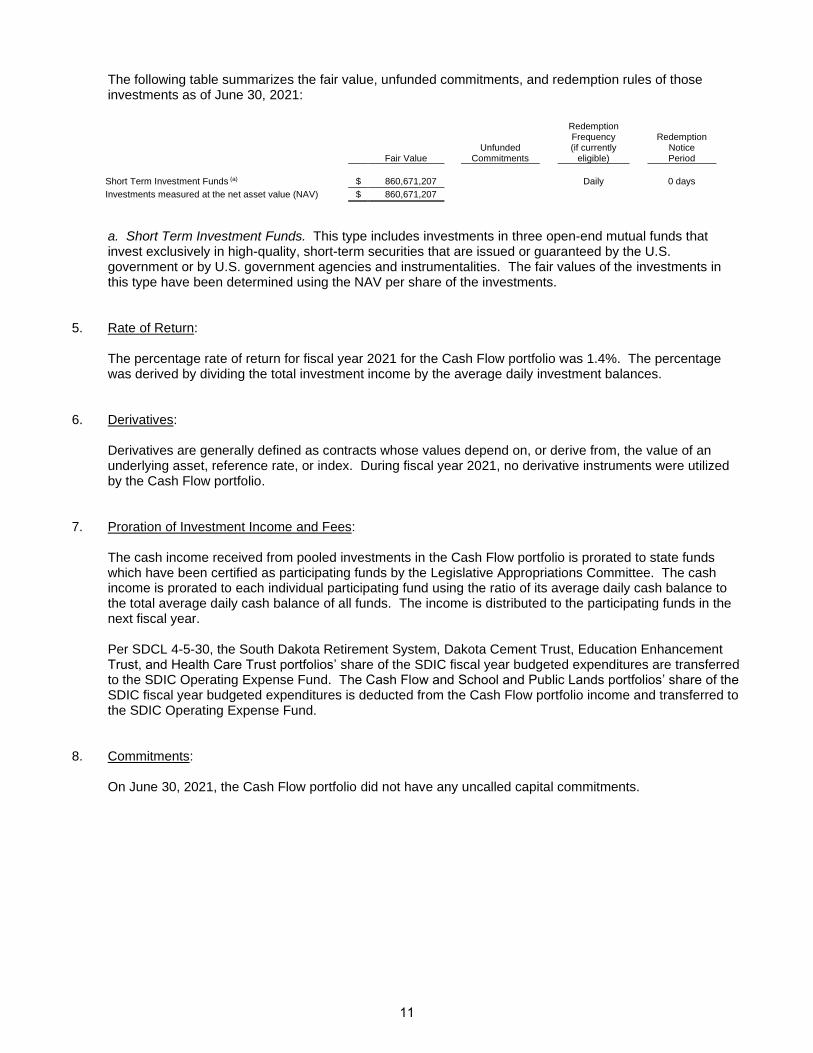
The following table summarizes the fair value, unfunded commitments, and redemption rules of those investments as of June 30, 2021:
Fair Value
Unfunded Commitments
Redemption Frequency (if currently
eligible)
Redemption Notice Period
Short Term Investment Funds (a) $ 860,671,207 Daily 0 days
Investments measured at the net asset value (NAV) $ 860,671,207
a. Short Term Investment Funds. This type includes investments in three open-end mutual funds that invest exclusively in high-quality, short-term securities that are issued or guaranteed by the U.S. government or by U.S. government agencies and instrumentalities. The fair values of the investments in this type have been determined using the NAV per share of the investments.
5. Rate of Return: The percentage rate of return for fiscal year 2021 for the Cash Flow portfolio was 1.4%. The percentage
was derived by dividing the total investment income by the average daily investment balances. 6. Derivatives: Derivatives are generally defined as contracts whose values depend on, or derive from, the value of an
underlying asset, reference rate, or index. During fiscal year 2021, no derivative instruments were utilized by the Cash Flow portfolio.
7. Proration of Investment Income and Fees: The cash income received from pooled investments in the Cash Flow portfolio is prorated to state funds
which have been certified as participating funds by the Legislative Appropriations Committee. The cash income is prorated to each individual participating fund using the ratio of its average daily cash balance to the total average daily cash balance of all funds. The income is distributed to the participating funds in the next fiscal year.
Per SDCL 4-5-30, the South Dakota Retirement System, Dakota Cement Trust, Education Enhancement
Trust, and Health Care Trust portfolios’ share of the SDIC fiscal year budgeted expenditures are transferred to the SDIC Operating Expense Fund. The Cash Flow and School and Public Lands portfolios’ share of the SDIC fiscal year budgeted expenditures is deducted from the Cash Flow portfolio income and transferred to the SDIC Operating Expense Fund.
8. Commitments: On June 30, 2021, the Cash Flow portfolio did not have any uncalled capital commitments.
11
INDEPENDENT AUDITOR’S REPORT ON INTERNAL CONTROL OVER FINANCIAL REPORTING AND ON COMPLIANCE AND OTHER MATTERS
BASED ON AN AUDIT OF FINANCIAL STATEMENTS PERFORMED IN ACCORDANCE WITH GOVERNMENT AUDITING STANDARDS
Executive Board Legislative Research Council and Investment Council State of South Dakota We have audited, in accordance with the auditing standards generally accepted in the United States of America and the standards applicable to financial audits contained in Government Auditing Standards issued by the Comptroller General of the United States, the financial statements of the School and Public Lands, Dakota Cement Trust, Education Enhancement Trust, and Health Care Trust portfolios, internal investment pools of the State of South Dakota, as of and for the year ended June 30, 2021, and the related notes to the financial statements, which collectively comprise the School and Public Lands, Dakota Cement Trust, Education Enhancement Trust, and Health Care Trust portfolios basic financial statements and have issued our report thereon dated October 1, 2021.
Internal Control Over Financial Reporting In planning and performing our audit of the financial statements, we considered the South Dakota Investment Council’s internal control over financial reporting (internal control) as a basis for designing audit procedures that are appropriate in the circumstances for the purpose of expressing our opinion on the financial statements, but not for the purpose of expressing an opinion on the effectiveness of the South Dakota Investment Council’s internal control. Accordingly, we do not express an opinion on the effectiveness of the South Dakota Investment Council’s internal control. A deficiency in internal control exists when the design or operation of a control does not allow management or employees, in the normal course of performing their assigned functions, to prevent, or detect and correct misstatements on a timely basis. A material weakness is a deficiency, or a combination of deficiencies, in internal control, such that there is a reasonable possibility that a material misstatement of the entity’s financial statements will not be prevented, or detected and corrected on a timely basis. A significant deficiency is a deficiency, or a combination of deficiencies, in internal control that is less severe than a material weakness, yet important enough to merit attention by those charged with governance. Our consideration of internal control was for the limited purpose described in the first paragraph of this section and was not designed to identify all deficiencies in internal control that might be material weaknesses or significant deficiencies. Given these limitations, during our audit we did not identify any deficiencies in internal
12
control that we consider to be material weaknesses. However, material weaknesses may exist that have not been identified.
Compliance and Other Matters As part of obtaining reasonable assurance about whether the South Dakota Investment Council’s financial statements are free from material misstatement, we performed tests of its compliance with certain provisions of laws, regulations, and contracts, noncompliance with which could have a direct and material effect on the financial statements. However, providing an opinion on compliance with those provisions was not an objective of our audit, and accordingly, we do not express such an opinion. The results of our tests disclosed no instances of noncompliance or other matters that are required to be reported under Government Auditing Standards.
Purpose of this Report
The purpose of this report is solely to describe the scope of our testing of internal control and compliance and
the results of that testing, and not to provide an opinion on the effectiveness of the entity’s internal control or on
compliance. This report is an integral part of an audit performed in accordance with Government Auditing
Standards in considering the entity’s internal control and compliance. Accordingly, this communication is not
suitable for any other purpose. As required by South Dakota Codified Law 4-11-11, this report is a matter of
public record and its distribution is not limited.
Russell A. Olson Auditor General October 1, 2021
13

INDEPENDENT AUDITOR'S REPORT Executive Board Legislative Research Council and Investment Council State of South Dakota
Report on the Financial Statements We have audited the accompanying financial statements of the School and Public Lands, Dakota Cement Trust, Education Enhancement Trust, and Health Care Trust portfolios, internal investment pools of the State of South Dakota, as of and for the fiscal year ended June 30, 2021, and related notes to the financial statements, as listed in the table of contents.
Management’s Responsibility for the Financial Statements Management is responsible for the preparation and fair presentation of these financial statements in accordance with accounting principles generally accepted in the United States of America; this includes the design, implementation, and maintenance of internal control relevant to the preparation and fair presentation of financial statements that are free from material misstatement, whether due to fraud or error.
Auditor’s Responsibility Our responsibility is to express an opinion on these financial statements based on our audit. We conducted our audit in accordance with auditing standards generally accepted in the United States of America and the standards applicable to financial audits contained in Government Auditing Standards, issued by the Comptroller General of the United States. Those standards require that we plan and perform the audit to obtain reasonable assurance about whether the financial statements are free from material misstatement. An audit involves performing procedures to obtain audit evidence about the amounts and disclosures in the financial statements. The procedures selected depend on the auditor’s judgment, including the assessment of the risks of material misstatement of the financial statements, whether due to fraud or error. In making those risk assessments, the auditor considers internal control relevant to the entity’s preparation and fair presentation of the financial statements in order to design audit procedures that are appropriate in the circumstances, but not for the purpose of expressing an opinion on the effectiveness of the entity’s internal control. Accordingly, we express no such opinion. An audit also includes evaluating the appropriateness of accounting policies used and the reasonableness of significant accounting estimates made by management, as well as evaluating the overall presentation of the financial statements.
14

We believe that the audit evidence we have obtained is sufficient and appropriate to provide a basis for our audit opinions.
Opinions In our opinion, the financial statements referred to above present fairly, in all material respects, the financial position of the portfolios listed above as of June 30, 2021, and the changes in their financial position for the year then ended in accordance with accounting principles generally accepted in the United States of America.
Emphasis of Matter As explained in the following table and in Note 2 to the financial statements, the financial statements include investments whose carrying values have been estimated by management in the absence of readily determinable fair values. Management’s estimates are based on information provided by the fund managers or the general partners: Portfolio
Amount
Percent of Net Position
School and Public Lands $ 67,223,930 18% Dakota Cement Trust $ 73,285,678 19% Education Enhancement Trust $ 125,544,278 18% Health Care Trust $ 32,466,961 15%
The financial statements present only the above referenced investment portfolios managed by the South Dakota Investment Council and do not purport to, and do not, present fairly the financial position of the State of South Dakota as of June 30, 2021, the changes in its financial position, or, where applicable, its cash flows for the fiscal year then ended in accordance with accounting principles generally accepted in the United States of America. Our opinion is not modified with respect to this matter.
Other Reporting Required by Government Auditing Standards In accordance with Government Auditing Standards, we have also issued our report dated October 1, 2021, on our consideration of the South Dakota Investment Council’s internal control over financial reporting and our tests of its compliance with certain provisions of laws, regulations, contracts, and other matters. The purpose of that report is solely to describe the scope of our testing of internal control over financial reporting and compliance and the results of that testing, and not to provide an opinion on the effectiveness of the South Dakota Investment Council’s internal control over financial reporting or on compliance. That report is an integral part of an audit performed in accordance with Government Auditing Standards in considering South Dakota Investment Council’s internal control over financial reporting and compliance.
Russell A. Olson Auditor General October 1, 2021
15

School and Dakota Education Health Care
Public Lands Cement Trust Enhancement Trust
Portfolio Portfolio Trust Portfolio Portfolio
Assets
Cash & cash equivalents 143,097$ 182,272$ 775,288$ 69,395$
Receivables
Investment income receivable 439,681 442,066 1,164,543 229,363
Unsettled investment sales 125,909 158,742 251,749 67,714
Total receivables 565,590 600,808 1,416,292 297,077
Investments, at fair value
Short term investment fund 132,426,653 131,053,976 256,105,495 77,577,852
Fixed income 89,469,275 91,562,369 166,119,915 52,817,745
Equities 88,935,258 81,835,291 175,737,849 54,684,050
Alternative investments 67,223,930 73,285,678 125,544,278 37,479,329
Total investments 378,055,116 377,737,314 723,507,537 222,558,976
Total assets 378,763,803 378,520,394 725,699,117 222,925,448
Liabilities
Earnings distribution - declared - - 23,673,657 5,839,236
Total liabilities 0 0 23,673,657 5,839,236
Net Position 378,763,803$ 378,520,394$ 702,025,460$ 217,086,212$
The accompanying notes are an integral part of the financial statements.
South Dakota Investment Council
Trust Portfolios
Statement of Net Position
As of June 30, 2021
16

School and Dakota Education Health Care
Public Lands Cement Trust Enhancement Trust
Portfolio Portfolio Trust Portfolio Portfolio
Additions:
Contributions 9,503,727$ -$ 8,714,845$ 50,000,000$
Investment income
Net appreciation in fair value of investments 53,525,674 54,490,742 101,120,264 25,615,787
Interest 2,222,687 2,275,281 5,036,792 1,109,869
Dividends 1,882,279 1,845,643 3,639,828 908,656
Real estate income 622,584 657,557 1,142,945 296,980
Investment income 58,253,224 59,269,223 110,939,829 27,931,292
Less investment activity expense (855,622) (1,127,919) (2,163,805) (498,096)
Net investment activity income 57,397,602 58,141,304 108,776,024 27,433,196
Securities lending income 11,754 8,580 16,411 4,656
Securities lending expenses (3,521) (2,570) (4,920) (1,392)
Net securities lending activity income 8,233 6,010 11,491 3,264
Total investment income 57,405,835 58,147,314 108,787,515 27,436,460
Total additions 66,909,562 58,147,314 117,502,360 77,436,460
Deductions:
Statutorily required distributions 16,016,495 13,435,863 23,673,657 5,839,236
Total deductions 16,016,495 13,435,863 23,673,657 5,839,236
Net increase in net position 50,893,067 44,711,451 93,828,703 71,597,224
Net position - Beginning of year 327,870,736 333,808,943 608,196,757 145,488,988
Net position - End of year 378,763,803$ 378,520,394$ 702,025,460$ 217,086,212$
The accompanying notes are an integral part of the financial statements.
South Dakota Investment Council
From investing activities:
From securities lending activities:
For the fiscal year ended June 30, 2021
Statement of Changes in Net Position
Trust Portfolios
17

SOUTH DAKOTA INVESTMENT COUNCIL TRUST PORTFOLIOS
NOTES TO THE FINANCIAL STATEMENTS 1. Reporting Entity: The South Dakota Investment Council (SDIC) is a principal, functional sub-unit of state government. The
SDIC is responsible for the investment of the state’s monies in the state treasury. The SDIC provides investment management services on a prefunded cost recovery basis as authorized by South Dakota Codified Law (SDCL) 4-5-30.
The statements represent the financial activity of the School and Public Lands, Dakota Cement Trust,
Education Enhancement Trust, and Health Care Trust portfolios. The statements report investments by each portfolio. The School and Public Lands portfolio represents assets held in permanent school funds. The Dakota Cement Trust portfolio represents proceeds from the sale of the South Dakota Cement Plant. The Education Enhancement Trust portfolio represents assets held in trust from the master settlement agreement between the State of South Dakota and major United States tobacco product manufacturers and other funds. The Health Care Trust portfolio represents assets held in trust from federal reimbursement for Medicaid and Medicare costs associated with publicly owned and operated nursing facilities and other funds.
2. Summary of Significant Accounting Policies: a. Basis of Presentation:
The accompanying financial statements of the investment activity of the SDIC on behalf of the School and Public Lands, Dakota Cement Trust, Education Enhancement Trust, and Health Care Trust portfolios are prepared in accordance with generally accepted accounting principles (GAAP) for governments as prescribed by the Governmental Accounting Standards Board (GASB).
b. Basis of Accounting:
The statements for the portfolios are reported on the full accrual basis of accounting. Under this method, revenues are recognized in the accounting period in which they are earned and expenses are recognized in the period incurred. Security transactions and the related gains and losses are recorded on a trade date basis using the average cost method. Purchases and sales of foreign investments and the related income are translated at the rate of exchange on the respective transaction dates. Realized and unrealized gains and losses resulting from foreign currency changes are included in the Statement of Changes in Net Position. Dividend income is recorded on the ex-dividend date and interest income is accrued as earned.
c. Cash and Cash Equivalents:
Cash includes demand deposits and foreign currency cash balances. Foreign currency cash balances are translated into United States Dollars (USD) using the year-end spot foreign currency exchange rates.
d. Valuation of Securities:
Investments are reported at fair value, in accordance with GASB Statement No. 72. Fair value is the price that would be received to sell an asset or paid to transfer a liability in an orderly transaction between market participants at the measurement date. GASB 72 sets forth the framework for measuring value. The framework provides a fair value hierarchy that prioritizes the inputs to valuation techniques used to measure fair value into three levels. The three levels of the fair value hierarchy under GASB 72 are described as follows:
18
Level 1 – Valuation inputs are quoted prices in active markets for identical asset or liability as of the measurement date.
Level 2 – Valuation inputs other than quoted prices included within Level 1 that are observable for an
asset or liability, either directly or indirectly. Level 3 – Valuation inputs are based on significant unobservable inputs for an asset or liability. As a practical expedient, GASB 72 allows the net asset value (NAV) or its equivalent to be used when
a readily determinable fair value is not available. The NAV valuations are based on valuations of the underlying companies or securities as determined and reported by the fund manager or general partner and are excluded from the fair value hierarchy.
Additional required disclosures can be found in Note 4: Fair Value Measurement. Alternative investments, which consist of investments in a variety of markets and industries through
limited partnerships, are valued as Level 3 on the fair value hierarchy or at NAV. These fair value estimates are subjective and based on judgment. The alternative investments fair values as a percentage of net position as of June 30, 2021 for School and Public Lands, Dakota Cement Trust, Education Enhancement Trust, and Health Care Trust portfolios were 18%, 19%, 18%, and 15%, respectively.
Investments denominated in foreign currencies are translated into USD using the year-end spot
foreign currency exchange rates. Foreign exchange rate gains and losses are included with the net appreciation in fair value of investments.
e. Use of Estimates:
The preparation of financial statements in accordance with GAAP requires management to make estimates that affect the reported amounts of net position as of June 30, 2021. Actual results could differ from those estimates.
f. New GAAP Implementation:
Government Accounting Standards Board did not issue any new or updated statements that affected SDIC for fiscal year 2021.
3. Deposits, Investments and Securities Lending: The State Investment Officer is responsible for the investment of state public funds. The portfolios are
governed by the prudent man rule; that is, the SDIC should use the same degree of care as a prudent man. The SDIC dictates the limits on the percentages the portfolios invest in various asset classes.
Deposits: Custodial Credit Risk. The custodial credit risk for deposits is the risk that, in the event of the failure of a
depository institution, a government will not be able to recover deposits or will not be able to recover collateral securities that are in the possession of an outside party. The SDIC has a formal deposit policy specific to custodial credit risk for the global equity portfolios of School and Public Lands, Dakota Cement Trust, Education Enhancement Trust, and Health Care Trust. The policy states that the USD equivalent of any non-USD currency cannot exceed 2.0% of the portfolio fair value on a trade date + 5 calendar day basis. As of June 30, 2021, the portfolios had bank balances in various foreign currencies. These deposits are not collateralized or covered by depository insurance. As a result, the following amounts were exposed to custodial credit risk:
School & Public Lands Portfolio
Dakota Cement Trust Portfolio
Education Enhancement Trust Portfolio
Health Care Trust Portfolio
Foreign Currency Cash Balances $ 144,007 $ 183,203 $ 346,800 $ 69,926
19
Investments: Securities Lending. State statutes and the SDIC policies permit the use of investments for securities
lending transactions. These transactions involve the lending of corporate debt, foreign equity securities, and domestic equity securities to broker-dealers for collateral in the form of securities, with the simultaneous agreement to return the collateral for the same securities in the future. The SDIC’s securities custodian is an agent in lending securities and shall accept only U.S. Government securities or its agencies as collateral for any loan or loaned securities. The collateral required must equal 102% of fair value plus accrued interest for corporate debt securities, 102% of fair value for U.S. equity securities and 105% of fair value for foreign securities except in the case of loans of foreign securities which are denominated and payable in USD, in which event the collateral required is 102% of fair value. The earnings generated from the collateral investments results in the gross earnings from lending activities, which is then split on a percentage basis with the lending agent.
The fair value of securities on loan as of June 30, 2021 and the collateral held on the same date is listed in
the following table:
School & Public Lands Portfolio
Dakota Cement Trust Portfolio
Education Enhancement Trust Portfolio
Health Care
Trust Portfolio
Fair Value of Securities on Loan $ 2,608,129 $ 1,902,114 $ 3,482,134 $ 1,207,572
Collateral Held 2,677,630 1,953,043 3,574,560 1,238,797
Collateral % Held 102.66% 102.68% 102.65% 102.59%
The School & Public Lands, Dakota Cement Trust, Education Enhancement Trust and Health Care Trust
portfolios have no credit risk exposure to borrowers because the amounts the portfolios owe the borrowers exceed the amounts the borrowers owe the portfolios. The contract with the lending agent requires the agent to indemnify the portfolios if the borrowers fail to return the loaned securities and the collateral is inadequate to replace the securities lent.
All securities loans can be terminated on demand by either the SDIC or the borrower. The SDIC does not
have the ability to pledge or sell collateral securities unless the borrower defaults, therefore no asset and corresponding liability for the collateral value of securities received has been established on the Statement of Net Position. Regarding restrictions on loans, the securities lending agreement does limit the total value of securities that can be out on loan on any given day.
Custodial Credit Risk. The custodial credit risk for investments is the risk that, in the event of the failure of
the counterparty to a transaction, a government will not be able to recover the value of investment or collateral securities that are in the possession of an outside party. The SDIC’s securities lending policies are detailed in the preceding Securities Lending section. As of June 30, 2021, the School and Public Lands, Dakota Cement Trust, Education Enhancement Trust, and Health Care Trust portfolios do not have custodial credit risk with regard to securities lending.
Interest Rate Risk. Interest rate risk is the risk that changes in interest rates will adversely affect the fair
value of an investment. SDIC policy limits or establishes ranges for the durations of the investment grade fixed income portfolios. Modified duration estimates the sensitivity of a bond’s price to interest rate changes. The investment grade fixed income portfolios of School and Public Lands, Dakota Cement Trust, Education Enhancement Trust, and Health Care Trust are benchmarked to the duration of the FTSE Broad Investment Grade (BIG) Index. The fair value (in USD) and weighted modified duration (in years) of the portfolios as of June 30, 2021 are listed in the following table:
20

School & Public Lands Portfolio
Dakota Cement Trust Portfolio
Education Enhancement Trust Portfolio
Health Care Trust Portfolio
Investment Type Fair Value
Wgtd. Mod. Dur.
Fair Value
Wgtd. Mod. Dur.
Fair Value
Wgtd. Mod. Dur. Fair Value
Wgtd. Mod. Dur.
U.S. Treasury Bills $ 389,978 0.15 $ 419,976 0.15 $ 894,948 0.14 $ 381,983 0.11
U.S. Treasury STRIPS 19,237,394 8.58 19,585,692 8.58 21,056,632 8.58 8,532,079 8.58
U.S. Agencies 1,653,064 5.76 1,683,194 5.76 1,808,832 5.76 733,646 5.76
Investment Grade Corporates 18,979,400 5.05 19,377,787 5.06 20,741,787 5.05 8,449,475 5.06
Total Bond Market Mutual Fund 8,314,742 6.80
High Yield Corporates 487,630 0.28 495,690 0.28 532,968 0.28 215,605 0.28
High Yield Bond Mutual Fund 14,410,648 3.60 14,725,044 3.60 26,838,153 3.60 8,483,029 3.60
Agency Mortgage-Backed Securities 14,778,207 4.49 15,409,928 4.52 15,990,153 4.55 6,598,217 4.41
Non-Agency Mortgage-Backed Securities 19,532,954 0.64 19,865,058 0.66 36,070,621 0.64 11,108,969 0.52
Municipal Bonds 42,185,821 4.28
TOTAL $ 89,469,275 $ 91,562,369 $ 166,119,915 $ 52,817,745
Portfolio modified duration 4.49 4.50 4.03 4.59
The School and Public Lands, Dakota Cement Trust, Education Enhancement Trust, and Health Care Trust
portfolios invest in mortgage-backed securities. These securities are sensitive to prepayments by mortgagees, which is likely in declining interest rate environments, which can reduce the value of these securities.
Credit Risk. Credit risk is the risk that an issuer or other counterparty to an investment will not fulfill its
obligations. SDIC policy establishes a percentage range and a normal allocation to various credit risk categories. The SDIC sets the investment policy annually for the School and Public Lands, Dakota Cement Trust, Education Enhancement Trust, and Health Care Trust portfolios. This policy establishes the benchmark percentage invested in each asset category and the minimum and maximum range of each asset category. As of June 30, 2021, the portfolios held the following investments, excluding those issued by or explicitly guaranteed by the U.S. Government, which are not considered to have credit risk. The investments are grouped as rated by Moody’s Investors Service (at fair value):
School & Public Lands Portfolio
Dakota Cement Trust Portfolio
Education Enhancement Trust Portfolio
Health Care
Trust Portfolio
Moody’s rating:
Aaa $ 145,474,144 $ 145,517,030 $ 274,127,081 $ 83,768,748
Aa 5,962,813 6,159,353 23,340,682 2,752,825
A 6,681,684 6,845,727 21,357,511 2,954,147
Baa 6,514,406 6,602,391 7,256,187 2,921,988
Ba 1,056,653 1,028,278 1,592,173 574,566
B 1,719,665 1,914,614 3,331,753 1,311,048
Caa 3,781,522 3,607,340 6,976,979 2,082,831
Ca 3,794,263 4,074,831 7,311,563 2,339,307
C 416,446 486,367 793,078 365,134
Unrated 22,679,181 22,904,411 50,392,985 20,899,417
Total $ 198,080,777 $ 199,140,342 $ 396,479,992 $ 119,970,011
Concentration of Credit Risk. Concentration of credit risk is the risk of loss that may be attributed to the
magnitude of a government’s investment in a single issuer. The SDIC does not have a formal policy in place to limit investments in any particular issuer for the School and Public Lands, Dakota Cement Trust, Education Enhancement Trust, and Health Care Trust portfolios. Additionally, there are no single issuer exposures (excluding those issued by or explicitly guaranteed by the U.S. Government, or involving mutual funds or investment pools) within the portfolios that comprise 5% of the overall portfolios as of June 30, 2021.
Foreign Currency Risk. Foreign currency risk is the risk that changes in exchange rates will adversely
affect the fair value of an investment or deposit. The School and Public Lands, Dakota Cement Trust, Education Enhancement Trust, and Health Care Trust portfolios’ exposure to foreign currency risk derives from their positions in foreign currency and foreign currency-denominated equity investments. To match the unhedged benchmark, the SDIC’s normal procedure is not to hedge foreign currency back to USD. SDIC’s
21

procedure does allow hedging under certain circumstances when deemed appropriate by the State Investment Officer and portfolio manager. The portfolios’ exposure to foreign currency risk as of June 30, 2021 was as follows (in USD fair values):
School & Public Lands Portfolio Dakota Cement Trust Portfolio
Currency Equities Cash Totals Equities Cash Totals
Australian Dollar $ 238,108 $ 25,694 $ 263,802 $ 220,241 $ 35,121 $ 255,362
British Pound 3,479,093 561 3,479,654 3,201,567 10,486 3,212,053
Canadian Dollar 1,376,076 59,728 1,435,804 1,292,789 74,908 1,367,697
Danish Krone 88,237 0 88,237 81,127 0 81,127
Euro 6,512,261 11,723 6,523,984 6,003,326 613 6,003,939
Hong Kong Dollar 124,853 24,187 149,040 114,679 40,230 154,909
Japanese Yen 2,724,865 21,747 2,746,612 2,568,785 21,464 2,590,249
Norwegian Krone 23,775 367 24,142 25,405 381 25,786
South Korean Won 1,626,932 0 1,626,932 1,490,515 0 1,490,515
Swedish Krona 15,233 0 15,233 14,151 0 14,151
Swiss Franc 2,614,170 0 2,614,170 2,406,696 0 2,406,696
Total $ 18,823,603 $ 144,007 $ 18,967,610 $ 17,419,281 $ 183,203 $ 17,602,484
Education Enhancement Trust Portfolio Health Care Trust Portfolio
Currency Equities Cash Totals Equities Cash Totals
Australian Dollar $ 440,097 $ 79,297 $ 519,394 $ 126,693 $ 13,027 $ 139,720
British Pound 6,423,309 22,406 6,445,715 2,029,486 6,828 2,036,314
Canadian Dollar 2,494,796 129,562 2,624,358 833,978 21,783 855,761
Danish Krone 172,110 0 172,110 52,618 0 52,618
Euro 12,052,267 1,170 12,053,437 3,811,494 263 3,811,757
Hong Kong Dollar 228,141 72,243 300,384 74,619 14,999 89,618
Japanese Yen 5,100,752 41,382 5,142,134 1,589,139 12,858 1,601,997
Norwegian Krone 49,328 740 50,068 11,221 168 11,389
South Korean Won 3,011,075 0 3,011,075 947,662 0 947,662
Swedish Krona 29,690 0 29,690 9,129 0 9,129
Swiss Franc 4,838,002 0 4,838,002 1,541,832 0 1,541,832
Total $ 34,839,567 $ 346,800 $ 35,186,367 $ 11,027,871 $ 69,926 $ 11,097,797
Investments with external managers, which are not included in the table above, may expose the portfolios
to additional foreign currency risk. The fair values (in USD) of externally-managed real estate, private equity, and other fund investments as of June 30, 2021 were as follows:
School & Public Lands Portfolio
Dakota Cement Trust Portfolio
Education Enhancement Trust Portfolio
Health Care Trust Portfolio
Real Estate Funds $ 34,738,357 $ 36,675,013 $ 64,393,067 $ 16,183,335
Private Equity Funds 32,484,356 36,608,680 61,148,343 16,282,899
Other Funds 1,217 1,985 2,868 727
Total $ 67,223,930 $ 73,285,678 $ 125,544,278 $ 32,466,961
4. Fair Value Measurement: Investments are reported at fair value as of June 30, 2021, to the extent available. GASB Statement No. 72
– Fair Value Measurement and Application, defines fair value as the price that would be received to sell an asset or paid to transfer a liability in an orderly transaction between market participants at the measurement date. This statement establishes a hierarchy of valuation inputs based on the extent to which the inputs are observable in the marketplace. Level 1 inputs are quoted prices in active markets for identical assets; Level 2 inputs are other than quoted prices included within Level 1 that are observable; Level 3 inputs are significant unobservable inputs. Investments that are measured at fair value using the net asset value per share (or its equivalent) as a practical expedient are not classified in the hierarchy below.
The following tables summarize the School and Public Lands, Dakota Cement Trust, Education
Enhancement Trust, and Health Care Trust portfolio investments within the fair value hierarchy as of June 30, 2021:
22

School & Public Lands Portfolio
Total Level 1 Level 2 Level 3
Investments by fair value level
Debt securities
U.S. Treasury Bills $ 389,978 $ 0 $ 389,978 $ 0
U.S. Treasury STRIPS 19,237,394 0 19,237,394 0
U.S. Agencies 1,653,064 0 1,653,064 0
Investment Grade Corporates 18,979,400 0 18,979,400 0
High Yield Corporates 487,630 0 487,630 0
Agency Mortgage-Backed Securities 14,778,207 0 14,778,207 0
Non-Agency Mortgage-Backed Securities 19,532,954 0 19,532,954 0
Total debt securities 75,058,627 0 75,058,627 0
Equity securities
Domestic Stock 56,626,256 56,626,256 0 0
Depository Receipts 1,086,475 1,086,475 0 0
ETF - Exchange Traded Funds 12,378,950 12,378,950 0 0
International Stock 18,823,602 18,823,602 0 0
Stock Rights 19,975 19,975 0 0
Total equity securities 88,935,258 88,935,258 0 0
Alternative Investments
Other Funds 0 0 0 0
Total alternative investments 0 0 0 0
Total investments by fair value level 163,993,885 $ 88,935,258 $ 75,058,627 $ 0
Investments measured at the net asset value (NAV)
Short Term Investment Funds 132,426,653
Mutual Funds 14,410,648
Alternative investments
Real Estate Funds 34,738,357
Private Equity Funds 32,484,356
Other Funds 1,217
Total alternative investments 67,223,930
Total Investments measured at the NAV 214,061,231
Total Investments measured at the fair value $ 378,055,116
Dakota Cement Trust Portfolio
Total Level 1 Level 2 Level 3
Investments by fair value level
Debt securities
U.S. Treasury Bills $ 419,976 $ 0 $ 419,976 $ 0
U.S. Treasury STRIPS 19,585,692 0 19,585,692 0
U.S. Agencies 1,683,194 0 1,683,194 0
Investment Grade Corporates 19,377,787 0 19,377,787 0
High Yield Corporates 495,690 0 495,690 0
Agency Mortgage-Backed Securities 15,409,928 0 15,409,928 0
Non-Agency Mortgage-Backed Securities 19,865,058 0 19,865,058 0
Total debt securities 76,837,325 0 76,837,325 0
Equity securities
Domestic Stock 52,150,217 52,150,217 0 0
Depository Receipts 1,001,138 1,001,138 0 0
ETF - Exchange Traded Funds 11,242,969 11,242,969 0 0
International Stock 17,419,281 17,419,281 0 0
Stock Rights 21,686 21,686 0 0
Total equity securities 81,835,291 81,835,291 0 0
Alternative Investments
Other Funds 0 0 0 0
Total alternative investments 0 0 0 0
Total investments by fair value level 158,672,616 $ 81,835,291 $ 76,837,325 $ 0
Investments measured at the net asset value (NAV)
Short Term Investment Funds 131,053,976
Mutual Funds 14,725,044
Alternative investments
Real Estate Funds 36,675,013
Private Equity Funds 36,608,680
Other Funds 1,985
Total alternative investments 73,285,678
Total Investments measured at the NAV 219,064,698
Total Investments measured at the fair value $ 377,737,314
23
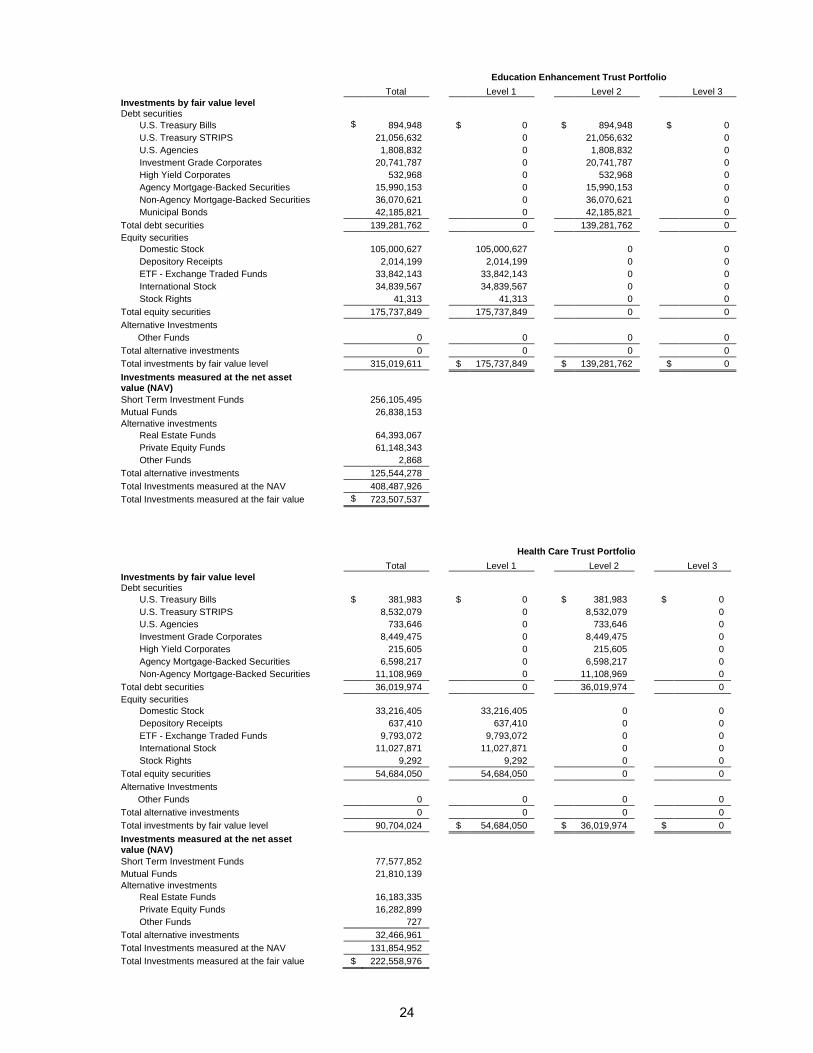
Education Enhancement Trust Portfolio
Total Level 1 Level 2 Level 3
Investments by fair value level
Debt securities
U.S. Treasury Bills $ 894,948 $ 0 $ 894,948 $ 0
U.S. Treasury STRIPS 21,056,632 0 21,056,632 0
U.S. Agencies 1,808,832 0 1,808,832 0
Investment Grade Corporates 20,741,787 0 20,741,787 0
High Yield Corporates 532,968 0 532,968 0
Agency Mortgage-Backed Securities 15,990,153 0 15,990,153 0
Non-Agency Mortgage-Backed Securities 36,070,621 0 36,070,621 0
Municipal Bonds 42,185,821 0 42,185,821 0
Total debt securities 139,281,762 0 139,281,762 0
Equity securities
Domestic Stock 105,000,627 105,000,627 0 0
Depository Receipts 2,014,199 2,014,199 0 0
ETF - Exchange Traded Funds 33,842,143 33,842,143 0 0
International Stock 34,839,567 34,839,567 0 0
Stock Rights 41,313 41,313 0 0
Total equity securities 175,737,849 175,737,849 0 0
Alternative Investments
Other Funds 0 0 0 0
Total alternative investments 0 0 0 0
Total investments by fair value level 315,019,611 $ 175,737,849 $ 139,281,762 $ 0
Investments measured at the net asset value (NAV)
Short Term Investment Funds 256,105,495
Mutual Funds 26,838,153
Alternative investments
Real Estate Funds 64,393,067
Private Equity Funds 61,148,343
Other Funds 2,868
Total alternative investments 125,544,278
Total Investments measured at the NAV 408,487,926
Total Investments measured at the fair value $ 723,507,537
Health Care Trust Portfolio Total Level 1 Level 2 Level 3
Investments by fair value level
Debt securities
U.S. Treasury Bills $ 381,983 $ 0 $ 381,983 $ 0
U.S. Treasury STRIPS 8,532,079 0 8,532,079 0
U.S. Agencies 733,646 0 733,646 0
Investment Grade Corporates 8,449,475 0 8,449,475 0
High Yield Corporates 215,605 0 215,605 0
Agency Mortgage-Backed Securities 6,598,217 0 6,598,217 0
Non-Agency Mortgage-Backed Securities 11,108,969 0 11,108,969 0
Total debt securities 36,019,974 0 36,019,974 0
Equity securities
Domestic Stock 33,216,405 33,216,405 0 0
Depository Receipts 637,410 637,410 0 0
ETF - Exchange Traded Funds 9,793,072 9,793,072 0 0
International Stock 11,027,871 11,027,871 0 0
Stock Rights 9,292 9,292 0 0
Total equity securities 54,684,050 54,684,050 0 0
Alternative Investments
Other Funds 0 0 0 0
Total alternative investments 0 0 0 0
Total investments by fair value level 90,704,024 $ 54,684,050 $ 36,019,974 $ 0
Investments measured at the net asset value (NAV)
Short Term Investment Funds 77,577,852
Mutual Funds 21,810,139
Alternative investments
Real Estate Funds 16,183,335
Private Equity Funds 16,282,899
Other Funds 727
Total alternative investments 32,466,961
Total Investments measured at the NAV 131,854,952
Total Investments measured at the fair value $ 222,558,976
24

Equity securities classified in Level 1 of the fair value hierarchy are valued using quoted prices in active markets for identical securities as of the measurement date as issued by pricing vendors.
Debt securities classified in Level 2 of the fair value hierarchy are valued using observable inputs other than quoted prices for identical securities. The prices are determined by the use of matrix pricing techniques maintained by the various pricing vendors for these securities. Matrix pricing is used to value securities based on the securities’ relationship to benchmark quoted prices. The Other Fund classified in Level 3 of the fair value hierarchy is valued at zero. It is an investment in an alternative investment fund that invested in distressed and defaulted debt securities and equities of financially troubled companies. All positions in the fund have been liquidated and only cash remains. The fund holds contingent liabilities that offset cash. Due to the highly questionable outcome of the contingent liabilities it has been determined that a value of zero best reflects the fair value considering the information available as of June 30, 2021.
The School and Public Lands, Dakota Cement Trust, Education Enhancement Trust, and Health Care Trust
portfolios hold shares or interests in investments where the fair value of the investments are measured on a recurring basis using net asset value per share (or its equivalent) of the investment as a practical expedient. The NAV valuations are based on valuations of the underlying companies or securities as determined and reported by the fund manager or general partner.
The following tables summarize the fair value, unfunded commitments, and redemption rules of those
investments as of June 30, 2021:
School & Public Lands Portfolio
Fair Value
Unfunded Commitments
Redemption Frequency (if
currently eligible)
Redemption Notice Period
Short Term Investment Funds (a) $ 132,426,653 Daily 0 days
Mutual Funds (b) 14,410,648 Daily 1 day
Alternative investments
Real Estate Funds (c) 34,738,357 $ 24,265,893
Private Equity Funds (d) 32,484,356 13,254,288
Other Funds (e) 1,217
Total alternative investments 67,223,930
Investments measured at the net asset value (NAV) $ 214,061,231
Dakota Cement Trust Portfolio
Fair Value
Unfunded Commitments
Redemption Frequency (if
currently eligible)
Redemption Notice Period
Short Term Investment Funds (a) $ 131,053,976 Daily 0 days
Mutual Funds (b) 14,725,044 Daily 1 day
Alternative investments
Real Estate Funds (c) 36,675,013 $ 24,851,115
Private Equity Funds (d) 36,608,680 13,673,445
Other Funds (e) 1,985
Total alternative investments 73,285,678
Investments measured at the net asset value (NAV) $ 219,064,698
25

Education Enhancement Trust Portfolio
Fair Value
Unfunded Commitments
Redemption Frequency (if
currently eligible)
Redemption Notice Period
Short Term Investment Funds (a) $ 256,105,495 Daily 0 days
Mutual Funds (b) 26,838,153 Daily 1 day
Alternative investments
Real Estate Funds (c) 64,393,067 $ 45,598,056
Private Equity Funds (d) 61,148,343 25,191,183
Other Funds (e) 2,868
Total alternative investments 125,544,278
Investments measured at the net asset value (NAV) $ 408,487,926
Health Care Trust Portfolio
Fair Value
Unfunded Commitments
Redemption Frequency (if
currently eligible)
Redemption Notice Period
Short Term Investment Funds (a) $ 77,577,852 Daily 0 days
Mutual Funds (b) 21,810,139 Daily 1 day
Alternative investments
Real Estate Funds (c) 16,183,335 $ 10,855,704
Private Equity Funds (d) 16,282,899 5,980,199
Other Funds (e) 727
Total alternative investments 32,466,961
Investments measured at the net asset value (NAV) $ 131,854,952
a. Short Term Investment Funds. This type includes investments in one open-end mutual fund that invests exclusively in high-quality, short-term securities that are issued or guaranteed by the U.S. government or by U.S. government agencies and instrumentalities. The fair value of the investment in this type has been determined using the NAV per share of the investment.
b. Mutual Funds. This type includes investments in three open-end mutual funds that invest in specific asset categories including investment-grade bonds, high-yield bonds and real estate stocks. The fair value of the investments in this type has been determined using the NAV per share of the investment.
c. Real Estate Funds. This type includes eighteen real estate funds that invest primarily in commercial real estate. The fair values of the investments in this type have been determined using the NAV per share (or its equivalent) of the portfolio’s ownership interest in partners’ capital. These investments can never be redeemed from the funds. Distributions from each fund will be received as the underlying investments of the funds are liquidated. It is expected that the underlying assets of the funds will be liquidated over the next 20 years. Because it is not probable that any individual investment will be sold, the fair value of each individual investment has been determined using the NAV per share (or its equivalent) of the portfolio’s ownership interest in partners’ capital. d. Private Equity Funds. This type includes thirteen private equity funds that invest primarily in leveraged buyouts. The fair values of the investments in this type have been determined using the NAV per share (or its equivalent) of the portfolio’s ownership interest in partners’ capital. These investments can never be redeemed from the funds. Distributions from each fund will be received as the underlying investments of the funds are liquidated. It is expected that the underlying assets of the funds will be liquidated over the next 20 years. Because it is not probable that any individual investment will be sold, the fair value of each individual investment has been determined using the NAV per share (or its equivalent) of the portfolio’s ownership interest in partners’ capital. e. Other Funds. This type includes one other alternative investment that is a hybrid private equity hedge fund that invests primarily in a broad range of debt, debt-related, and real estate-related investments. The fair value of the investment has been determined using the NAV per share (or its equivalent) of the portfolio’s ownership interest in partners’ capital. This investment can never be redeemed from the fund. Distributions from the fund will be received as the underlying investments of the fund are liquidated. It is expected that the underlying assets of the fund will be liquidated over the next year. Because it is not
26

probable that any individual investment will be sold, the fair value of each individual investment has been determined using the NAV per share (or its equivalent) of the portfolio’s ownership interest in partners’ capital.
5. Rate of Return: The percentage rates of return for fiscal year 2021 for the School and Public Lands, Dakota Cement Trust,
Education Enhancement Trust, and Health Care Trust portfolios were 17.6%, 17.5%, 17.8%, and 17.3%, respectively. The percentages were derived using the net-of-fee time-weighted rate of return calculation and the geometric linking of those returns.
6. Derivatives: Derivatives are generally defined as contracts whose values depend on, or derive from, the value of an
underlying asset, reference rate, or index. The School and Public Lands, Dakota Cement Trust, Education Enhancement Trust, and Health Care Trust portfolios may be exposed to various derivative products through the investment management of the SDIC and its external managers. During fiscal year 2021, no derivative instruments were utilized by SDIC in the internally-managed portfolios.
7. Statutorily Required Distributions: The cash income received from investments in the School and Public Lands portfolio is received and
deposited into the trust fund. Annual distributions of the receipted income are distributed to the permanent school and other educational and charitable funds administered by the Commissioner of School and Public Lands.
The cash income from investments in the Dakota Cement Trust portfolio is received and deposited into the
trust fund. By June 30th, annual distributions of four percent of the lesser of the average fair value of the sixteen most recent calendar quarter ends as of the prior December 31st or the fair value as of the prior December 31st are made from the Dakota Cement Trust to the State General Fund.
The cash income from investments in the Education Enhancement Trust and Health Care Trust portfolios is
received and deposited into the respective trust funds. At the beginning of each fiscal year, amounts equal to four percent of the average fair value at the end of the sixteen most recent calendar quarter ends as of the prior December 31st are transferred from the Education Enhancement Trust and the Health Care Trust portfolios to the State General Fund. The transfer amount cannot invade the principal of either trust.
8. Commitments:
As of June 30, 2021, the School and Public Lands, Dakota Cement Trust, Education Enhancement Trust, and Health Care Trust portfolios had uncalled capital commitments to private equity and real estate limited partnerships funds. The commitments may be called at the discretion of the general partner or may never be called. As capital is called, it is funded from capital and earnings returned by the limited partnerships or from other assets. Approximate uncalled capital commitments as of June 30, 2021 were as follows:
School & Public Lands Portfolio
Dakota Cement Trust Portfolio
Education Enhancement Trust Portfolio
Health Care
Trust Portfolio
Real Estate Funds $ 24,265,893 $ 24,851,115 $ 45,598,056 $ 10,855,704
Private Equity Funds 13,254,288 13,673,445 25,191,183 5,980,199
Total $ 37,520,181 $ 38,524,560 $ 70,789,239 $ 16,835,903
27