Embed Size (px)
Citation preview
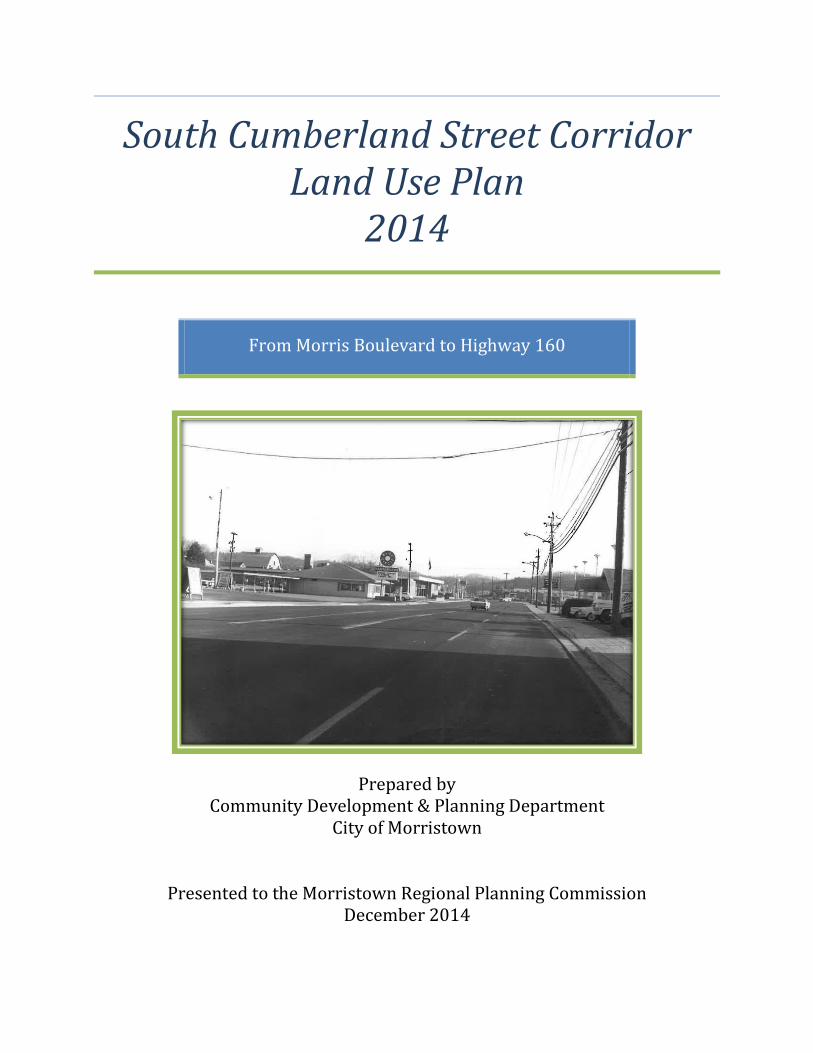
South Cumberland Street Corridor Land Use Plan
2014
From Morris Boulevard to Highway 160
Prepared by Community Development & Planning Department
City of Morristown
Presented to the Morristown Regional Planning Commission December 2014
2
Acknowledgements:
Morristown City Council Mr. Danny Thomas, Mayor
Mr. Gary Chesney Mr. Bob Garrett Mr. Chris Bivens Mr. Paul LeBel Ms. Kay Senter
Mr. Dennis Alvis
City Administrator, Mr. Tony Cox Asst. City Administrator, Mr. Ralph “Buddy” Fielder
Morristown Regional Planning Commission
Mr. Jim Beelaert, Chairman Mr. Bill Thompson
Mr. Ken Smith Mr. Danny Thomas, Mayor
Ms. Rose Parella Ms. Katy Tindall Klose
Mr. Bob Garrett, Councilman Mr. Wayne Nesmith
Mr. Terry Ball
Prepared By:
Morristown Planning Department Director: Mr. Alan C. Hartman, AICP
Ms. Lori Matthews Ms. Logan Engle
Mr. Rich DesGroseilliers Mr. Tracy Stroud Ms. Sherry Knight
Ms. Kat Morilak
City Center 100 W. 1st North Street
P.O. Box 1499 Morristown, TN 37814
www.mymorristown.com
December 2014
3
Table of Contents
Acknowledgements Table of Contents List of Figures Forward Introduction Goals The Study Area The Case for Land Use Planning Models of Urban Development Land Use and Zoning The Natural Environment Characteristics of the Population and Economy Special Needs of the Study Area Conclusion Recommendations Appendix A Wilbur Smith Associates Traffic Study (2008) Relevant Notes Appendix B Traffic Information and Counts Appendix C Future Land Use Plan (2000-2010) Appendix D Ambition 2030 (2012) Relevant Notes Appendix E Sidewalk Master Plan Appendix F Greenway Master Plan Appendix G Citizen Input
4
Appendix H Development Activity Report Appendix I Community Appearance Committee Appendix J Capital Improvement Projects Cost Estimates Appendix K Disclaimer Statement Appendix L Severance Statement References

5
List of Figures
Figure 1 Figure 2 Figure 3 Figure 4 Figure 5 Figure 6
6
Forward
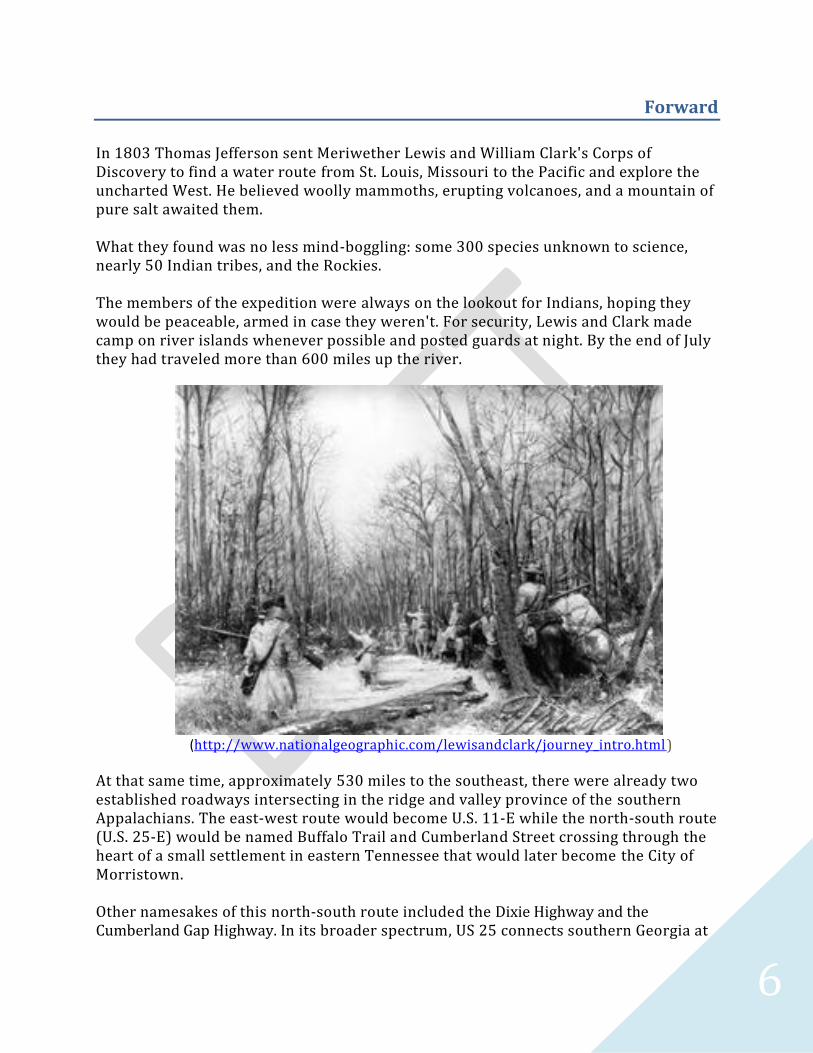
In 1803 Thomas Jefferson sent Meriwether Lewis and William Clark's Corps of Discovery to find a water route from St. Louis, Missouri to the Pacific and explore the uncharted West. He believed woolly mammoths, erupting volcanoes, and a mountain of pure salt awaited them. What they found was no less mind-boggling: some 300 species unknown to science, nearly 50 Indian tribes, and the Rockies. The members of the expedition were always on the lookout for Indians, hoping they would be peaceable, armed in case they weren't. For security, Lewis and Clark made camp on river islands whenever possible and posted guards at night. By the end of July they had traveled more than 600 miles up the river.
(http://www.nationalgeographic.com/lewisandclark/journey_intro.html)
At that same time, approximately 530 miles to the southeast, there were already two established roadways intersecting in the ridge and valley province of the southern Appalachians. The east-west route would become U.S. 11-E while the north-south route (U.S. 25-E) would be named Buffalo Trail and Cumberland Street crossing through the heart of a small settlement in eastern Tennessee that would later become the City of Morristown. Other namesakes of this north-south route included the Dixie Highway and the Cumberland Gap Highway. In its broader spectrum, US 25 connects southern Georgia at
7
Brunswick near the Atlantic Ocean to the Ohio River at Covington, KY with Morristown lying at the approximate center of this linear passage. For many years travelers passed through Morristown, often staying the night at accommodating lodges and motels along the highway. Many businesses grew along the route as this became a local hotspot for commercial development, eventually earning the nickname of “Radio Center” as the areas first radio broadcasting station was located there. Time and progress eventually caught up with the highway and the route was relocated and widened into a four-lane, divided highway a short distance east of the original passage. This enabled the route to accommodate higher volumes of traffic and cargo shipped by larger trucks. Most recently, the newer route that passes through Morristown received the National Scenic Byways designation in 2006 as the East Tennessee Crossings Byway. Eventually, the rerouting of the major thoroughfare away from the town center of Morristown had an impact. Those businesses along the historic route began to change in use, filter-down, change ownership and decline in appearance. Today, South Cumberland Street, or State Route 343, serves as a connector street from the downtown area of Morristown to other high-volume four-lane divided highways that take travelers in out of the City to Interstate 81 which serves the eastern portion of the United States as a north-south corridor. Some traditional businesses remain, however, much of the current landscape is predominated by used car lots, auto repair and caters to a multi-ethnic culture. ,
8
Introduction
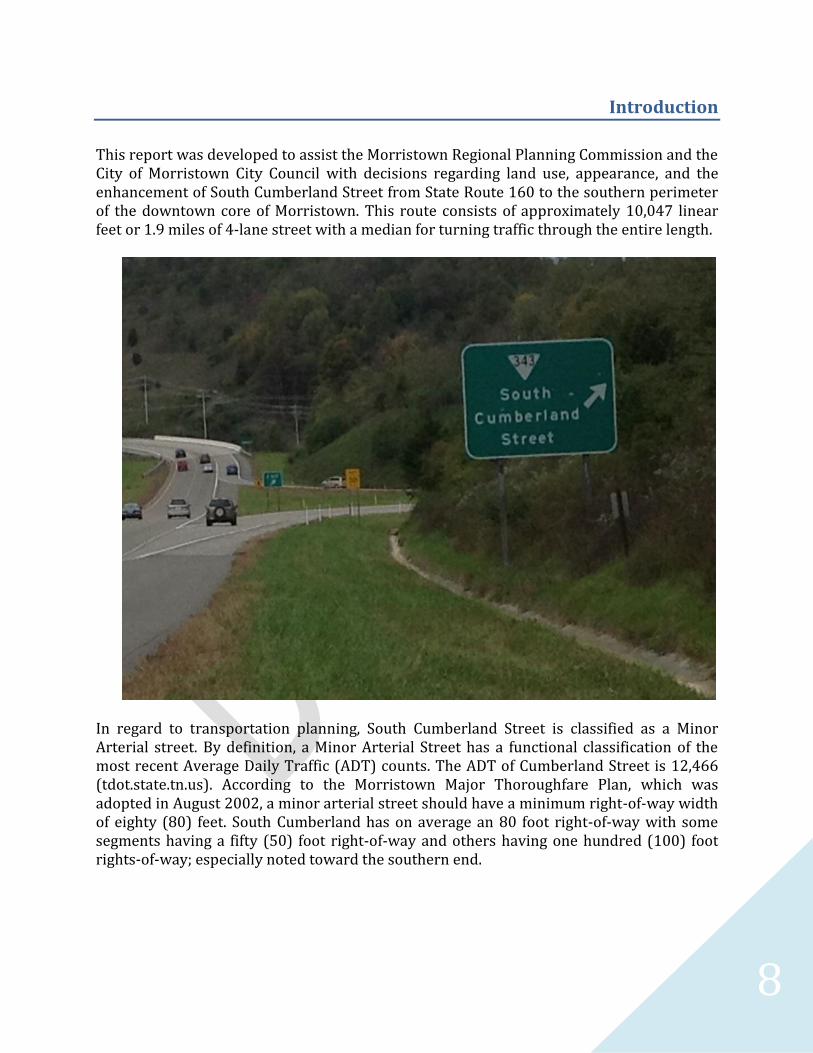
This report was developed to assist the Morristown Regional Planning Commission and the City of Morristown City Council with decisions regarding land use, appearance, and the enhancement of South Cumberland Street from State Route 160 to the southern perimeter of the downtown core of Morristown. This route consists of approximately 10,047 linear feet or 1.9 miles of 4-lane street with a median for turning traffic through the entire length.
In regard to transportation planning, South Cumberland Street is classified as a Minor Arterial street. By definition, a Minor Arterial Street has a functional classification of the most recent Average Daily Traffic (ADT) counts. The ADT of Cumberland Street is 12,466 (tdot.state.tn.us). According to the Morristown Major Thoroughfare Plan, which was adopted in August 2002, a minor arterial street should have a minimum right-of-way width of eighty (80) feet. South Cumberland has on average an 80 foot right-of-way with some segments having a fifty (50) foot right-of-way and others having one hundred (100) foot rights-of-way; especially noted toward the southern end.
9
Goals
The goals of this study are as follows:
1. Define the geographical boundaries of the study area.
2. Examine the natural and man-made environment of the study area.
3. Examine the general characteristics of the population within the study area.
4. Review the historical development of the area.
5. Investigate the current land use and development trends within the study area.
6. Review recent plans and studies involving the study area.
7. Consider future development of the study area.
8. Consider the concerns of citizens and local officials regarding the study area.
9. Recommend a strategic plan to address the concers of citizens and local officials.
10
The Study Area
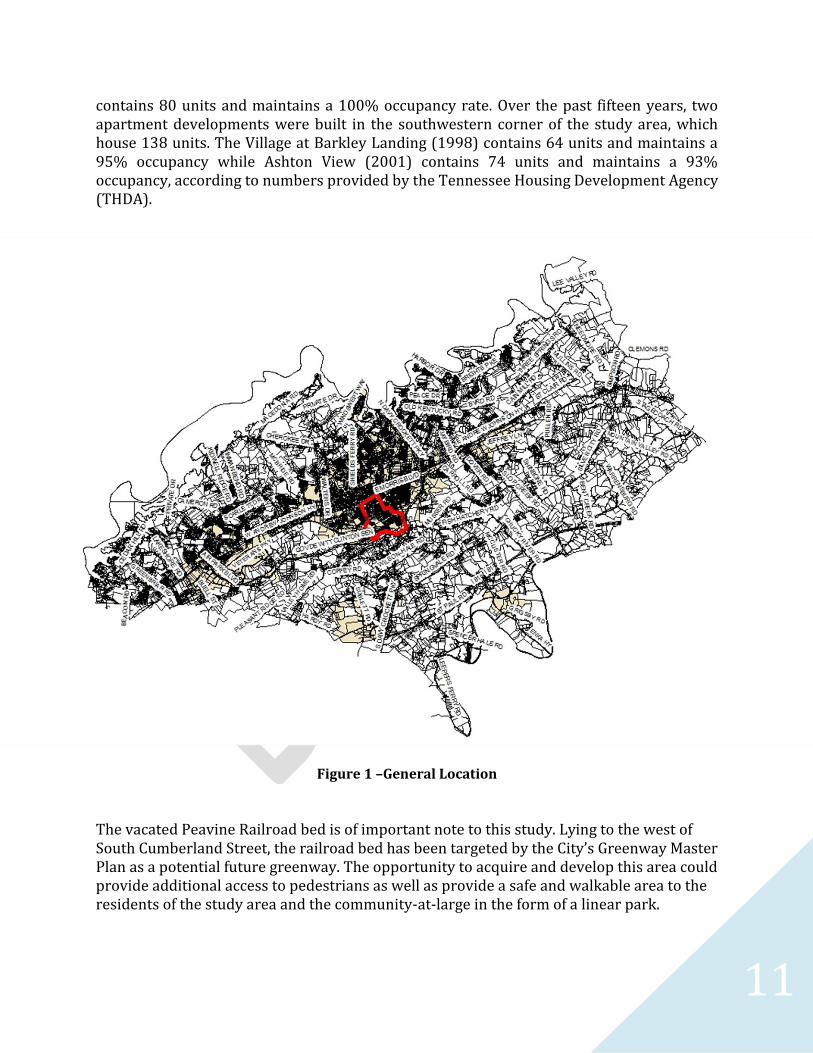
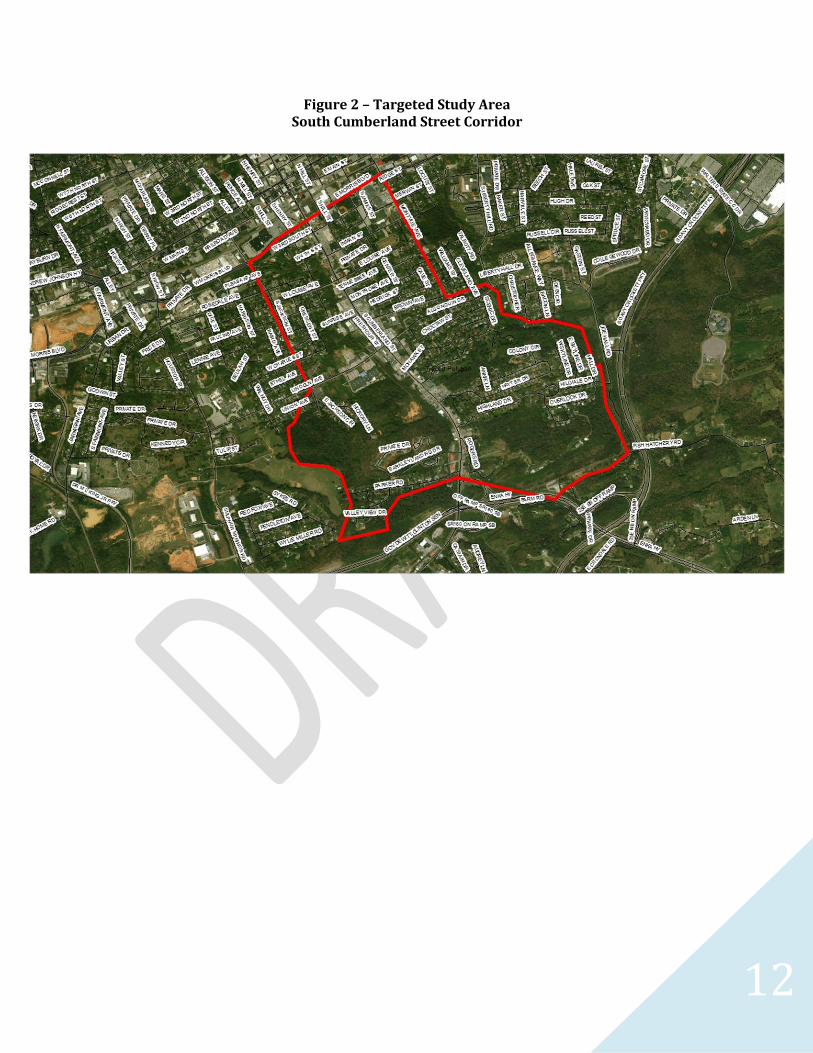
The South Cumberland Street Corridor Land Use Plan comprises a geographical area that is bounded by West Morris Boulevard to the north, South Jackson Street to the west, Montvue Avenue to the east, and Highway 160 to the south. The boundary’s limits were more specifically defined by selecting census blocks from the 2010 United States census included within this area. This choice was made to provide the actual boundary to that city planning staff would be able to get the most accurate statistical data available. As a result of the varied shapes of census blocks, the boundary is not clearly defined by streets or public rights-of-way throughout the southernmost portion of the study area. The census block boundaries are formed in this area by natural topographic and geographical landmarks, such as streams, ridge lines, etc. The whole of the study area boundary is roughly six hundred and fifty (650) acres in size with only eight percent (8%) having any building on it, whether residential or commercial. Within the boundary of the study area, there are approximately fifty-two (52) total acres of building footprint. The study area possesses several sites that show its importance throughout the history of the City’s development. The study area contains three schools (Lincoln Heights Elementary School, Lincoln Heights Middle School, and Morristown-Hamblen East High School) as well as one of the city’s two post offices. Additionally, a handful of churches dot the landscape of the study area. The corridor is intensely commercial and almost all of the parcels adjacent to SR 343, or South Cumberland Street, are zoned Intermediate Business, one of the city’s most intensely commercial zones. As a result, many commercial developments line the roadway including, most notably, the “Radio Center” shopping center. The “Radio Center” designation was borne from the area’s being home to Morristown’s first radio station and is the moniker is still used today to identify the area, particularly to those who experienced the area’s initial development throughout the 1950s and 1960s. Most recently, commercial development has centered upon automotive-related businesses, including automotive sales lots, automotive parts stores, and repair shops. A glance at the landscape highlights this area’s emphasis and initial development during the motor age of the 1950s. In addition, multiple vacant or partially-vacant shopping center structures await redevelopment in this area.
The area’s commercial development has been bolstered by a variety of residential developments surrounding the main corridor of South Cumberland Street. These subdivisions include Cherokee Hills (1950s), The Colonies (1980s), Sherwood Forest (1960s), Rolling Hills (1960s), and Cumberland Heights (1960s). In addition to single-family residential homes, approximately 300+ apartments are contained within the boundaries of the study area. Lincoln Manor, developed in 1973,
11
contains 80 units and maintains a 100% occupancy rate. Over the past fifteen years, two apartment developments were built in the southwestern corner of the study area, which house 138 units. The Village at Barkley Landing (1998) contains 64 units and maintains a 95% occupancy while Ashton View (2001) contains 74 units and maintains a 93% occupancy, according to numbers provided by the Tennessee Housing Development Agency (THDA).
Figure 1 –General Location
The vacated Peavine Railroad bed is of important note to this study. Lying to the west of South Cumberland Street, the railroad bed has been targeted by the City’s Greenway Master Plan as a potential future greenway. The opportunity to acquire and develop this area could provide additional access to pedestrians as well as provide a safe and walkable area to the residents of the study area and the community-at-large in the form of a linear park.
12
Figure 2 – Targeted Study Area South Cumberland Street Corridor
13
The Case for Land Use Planning
Land Use Planning
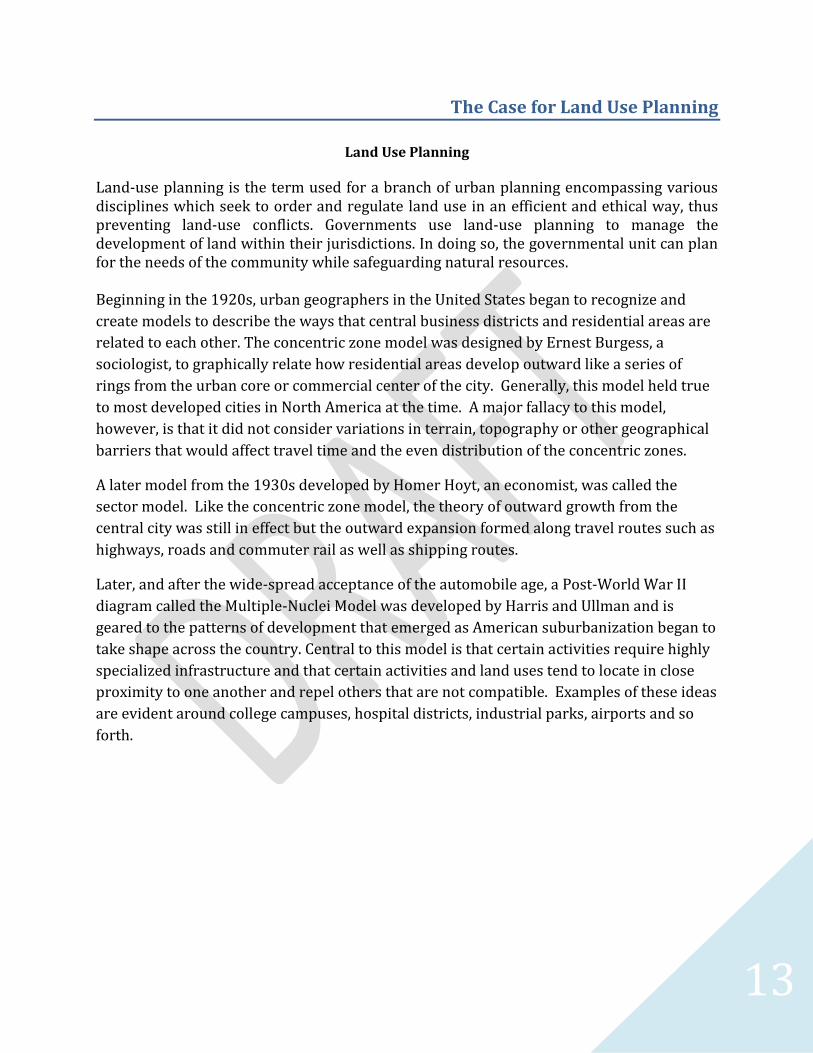
Land-use planning is the term used for a branch of urban planning encompassing various disciplines which seek to order and regulate land use in an efficient and ethical way, thus preventing land-use conflicts. Governments use land-use planning to manage the development of land within their jurisdictions. In doing so, the governmental unit can plan for the needs of the community while safeguarding natural resources. Beginning in the 1920s, urban geographers in the United States began to recognize and
create models to describe the ways that central business districts and residential areas are
related to each other. The concentric zone model was designed by Ernest Burgess, a
sociologist, to graphically relate how residential areas develop outward like a series of
rings from the urban core or commercial center of the city. Generally, this model held true
to most developed cities in North America at the time. A major fallacy to this model,
however, is that it did not consider variations in terrain, topography or other geographical
barriers that would affect travel time and the even distribution of the concentric zones.
A later model from the 1930s developed by Homer Hoyt, an economist, was called the
sector model. Like the concentric zone model, the theory of outward growth from the
central city was still in effect but the outward expansion formed along travel routes such as
highways, roads and commuter rail as well as shipping routes.
Later, and after the wide-spread acceptance of the automobile age, a Post-World War II
diagram called the Multiple-Nuclei Model was developed by Harris and Ullman and is
geared to the patterns of development that emerged as American suburbanization began to
take shape across the country. Central to this model is that certain activities require highly
specialized infrastructure and that certain activities and land uses tend to locate in close
proximity to one another and repel others that are not compatible. Examples of these ideas
are evident around college campuses, hospital districts, industrial parks, airports and so
forth.
14
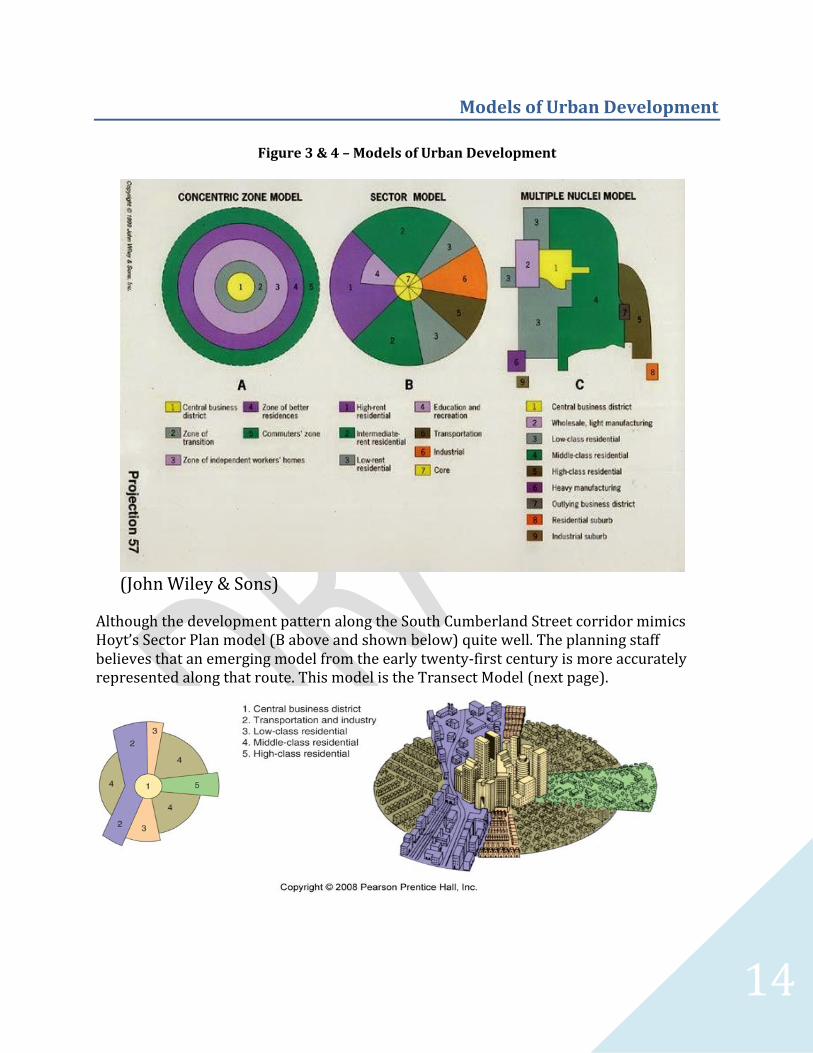
Models of Urban Development
Figure 3 & 4 – Models of Urban Development
(John Wiley & Sons)
Although the development pattern along the South Cumberland Street corridor mimics Hoyt’s Sector Plan model (B above and shown below) quite well. The planning staff believes that an emerging model from the early twenty-first century is more accurately represented along that route. This model is the Transect Model (next page).
15
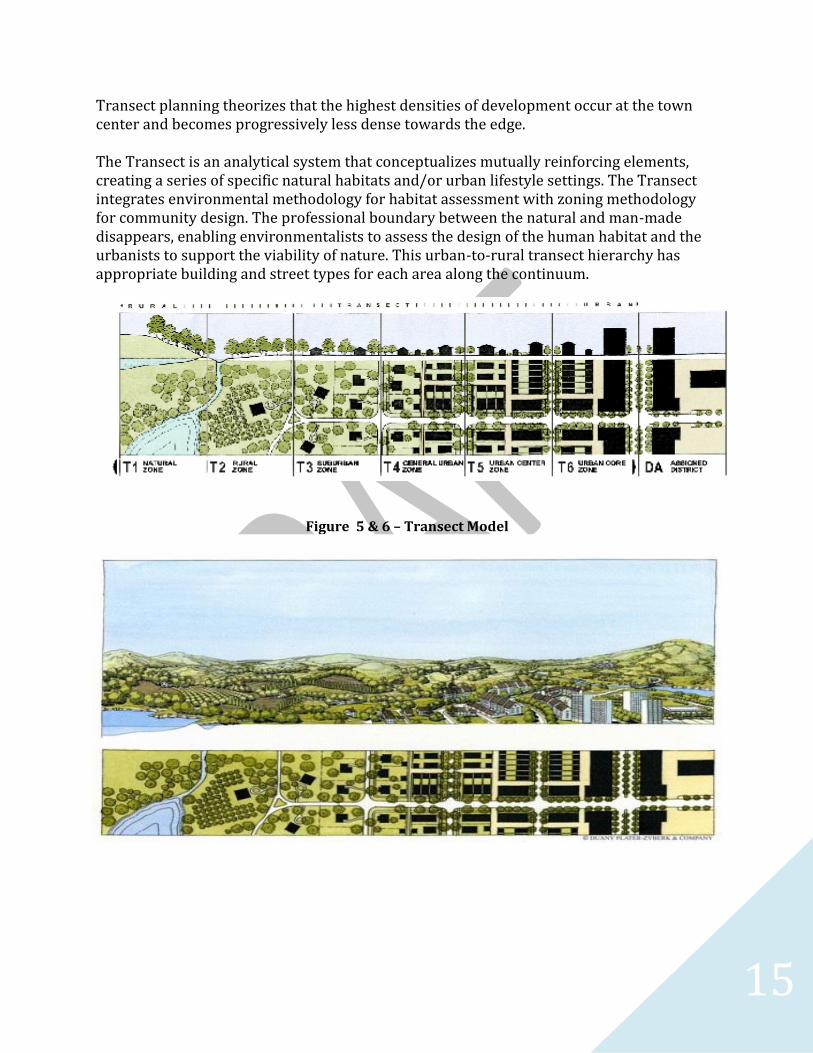
Transect planning theorizes that the highest densities of development occur at the town center and becomes progressively less dense towards the edge. The Transect is an analytical system that conceptualizes mutually reinforcing elements, creating a series of specific natural habitats and/or urban lifestyle settings. The Transect integrates environmental methodology for habitat assessment with zoning methodology for community design. The professional boundary between the natural and man-made disappears, enabling environmentalists to assess the design of the human habitat and the urbanists to support the viability of nature. This urban-to-rural transect hierarchy has appropriate building and street types for each area along the continuum.
Figure 5 & 6 – Transect Model
16
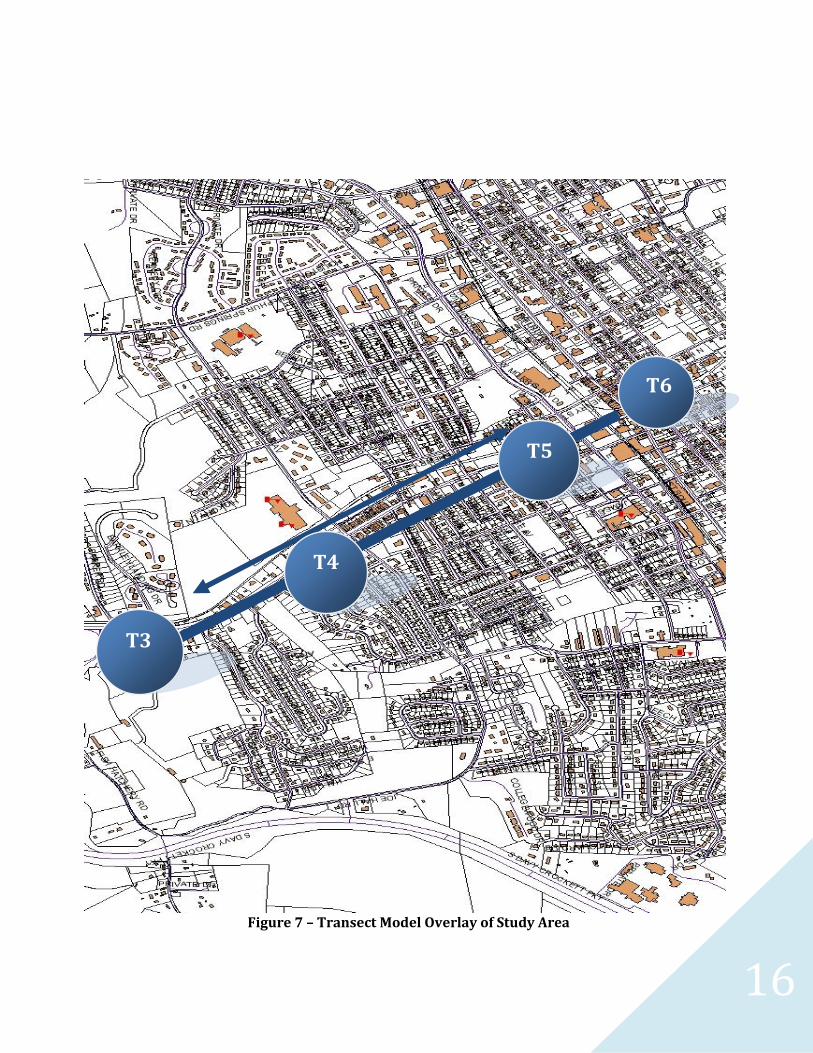
Figure 7 – Transect Model Overlay of Study Area
T6
T3
T5
T4
17
Land Use and Zoning
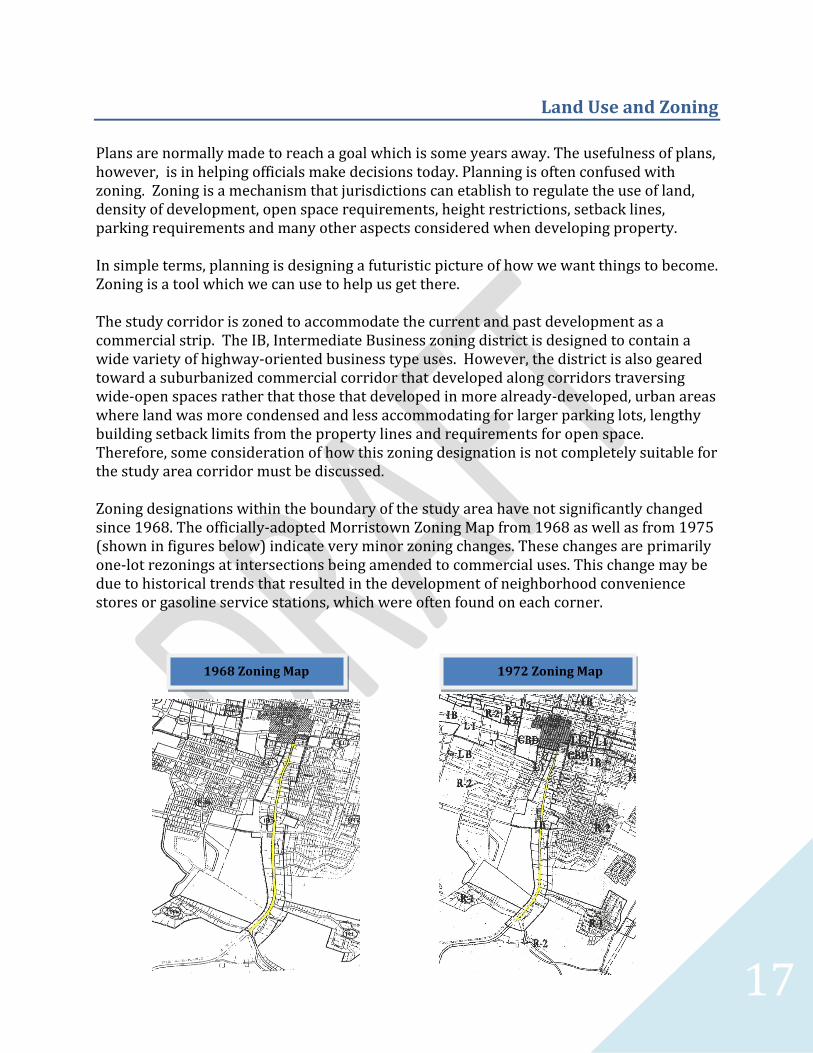
Plans are normally made to reach a goal which is some years away. The usefulness of plans, however, is in helping officials make decisions today. Planning is often confused with zoning. Zoning is a mechanism that jurisdictions can etablish to regulate the use of land, density of development, open space requirements, height restrictions, setback lines, parking requirements and many other aspects considered when developing property. In simple terms, planning is designing a futuristic picture of how we want things to become. Zoning is a tool which we can use to help us get there. The study corridor is zoned to accommodate the current and past development as a commercial strip. The IB, Intermediate Business zoning district is designed to contain a wide variety of highway-oriented business type uses. However, the district is also geared toward a suburbanized commercial corridor that developed along corridors traversing wide-open spaces rather that those that developed in more already-developed, urban areas where land was more condensed and less accommodating for larger parking lots, lengthy building setback limits from the property lines and requirements for open space. Therefore, some consideration of how this zoning designation is not completely suitable for the study area corridor must be discussed. Zoning designations within the boundary of the study area have not significantly changed since 1968. The officially-adopted Morristown Zoning Map from 1968 as well as from 1975 (shown in figures below) indicate very minor zoning changes. These changes are primarily one-lot rezonings at intersections being amended to commercial uses. This change may be due to historical trends that resulted in the development of neighborhood convenience stores or gasoline service stations, which were often found on each corner.
1968 Zoning Map 1972 Zoning Map
18
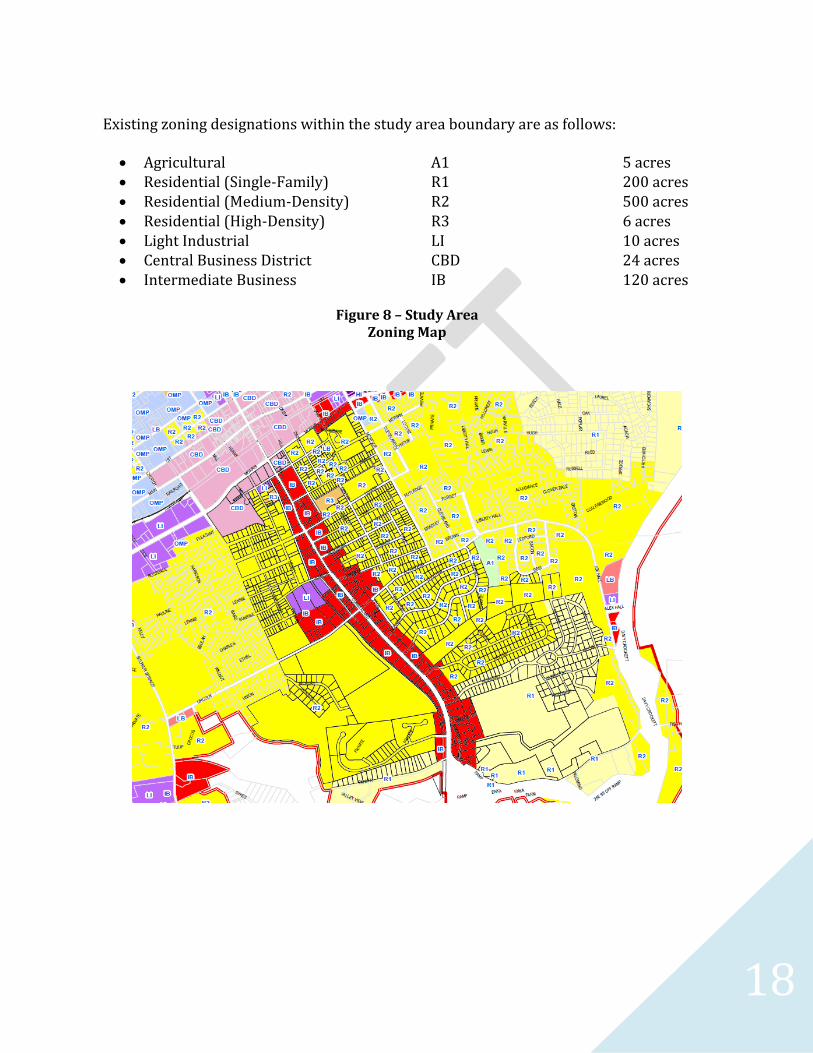
Existing zoning designations within the study area boundary are as follows:
Agricultural A1 5 acres Residential (Single-Family) R1 200 acres Residential (Medium-Density) R2 500 acres Residential (High-Density) R3 6 acres Light Industrial LI 10 acres Central Business District CBD 24 acres Intermediate Business IB 120 acres
Figure 8 – Study Area
Zoning Map
19
The Natural Environment
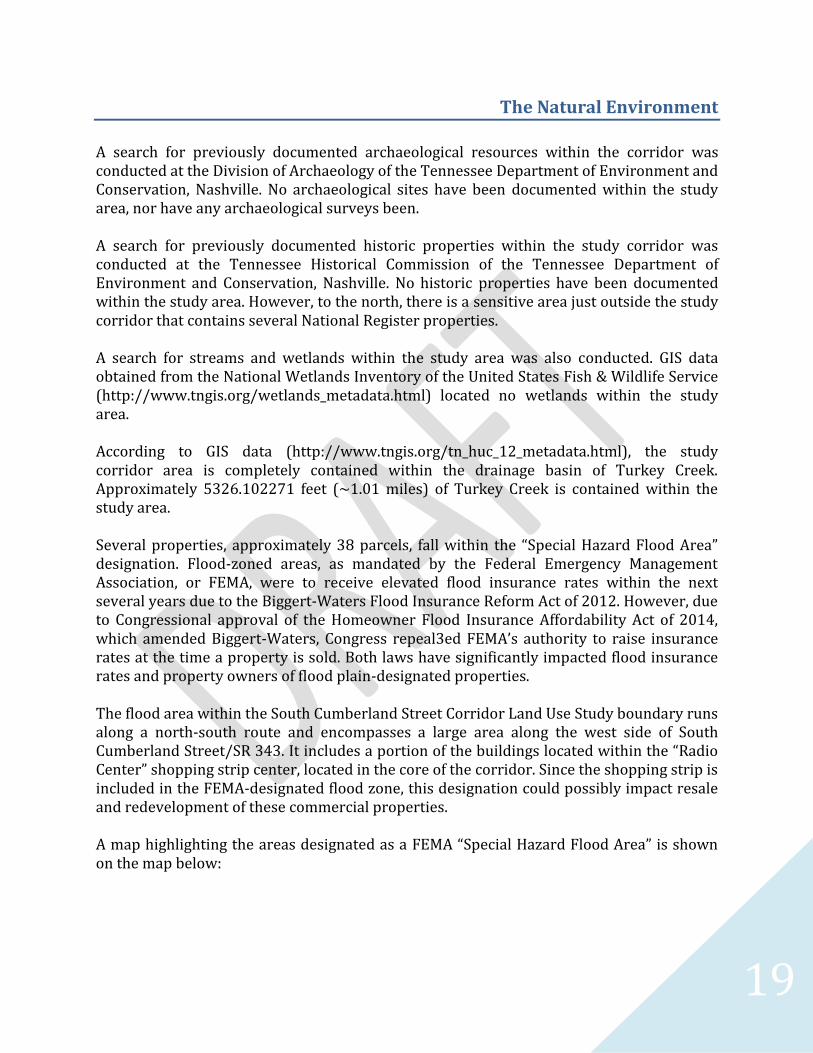
A search for previously documented archaeological resources within the corridor was conducted at the Division of Archaeology of the Tennessee Department of Environment and Conservation, Nashville. No archaeological sites have been documented within the study area, nor have any archaeological surveys been. A search for previously documented historic properties within the study corridor was conducted at the Tennessee Historical Commission of the Tennessee Department of Environment and Conservation, Nashville. No historic properties have been documented within the study area. However, to the north, there is a sensitive area just outside the study corridor that contains several National Register properties. A search for streams and wetlands within the study area was also conducted. GIS data obtained from the National Wetlands Inventory of the United States Fish & Wildlife Service (http://www.tngis.org/wetlands_metadata.html) located no wetlands within the study area. According to GIS data (http://www.tngis.org/tn_huc_12_metadata.html), the study corridor area is completely contained within the drainage basin of Turkey Creek. Approximately 5326.102271 feet (~1.01 miles) of Turkey Creek is contained within the study area. Several properties, approximately 38 parcels, fall within the “Special Hazard Flood Area” designation. Flood-zoned areas, as mandated by the Federal Emergency Management Association, or FEMA, were to receive elevated flood insurance rates within the next several years due to the Biggert-Waters Flood Insurance Reform Act of 2012. However, due to Congressional approval of the Homeowner Flood Insurance Affordability Act of 2014, which amended Biggert-Waters, Congress repeal3ed FEMA’s authority to raise insurance rates at the time a property is sold. Both laws have significantly impacted flood insurance rates and property owners of flood plain-designated properties. The flood area within the South Cumberland Street Corridor Land Use Study boundary runs along a north-south route and encompasses a large area along the west side of South Cumberland Street/SR 343. It includes a portion of the buildings located within the “Radio Center” shopping strip center, located in the core of the corridor. Since the shopping strip is included in the FEMA-designated flood zone, this designation could possibly impact resale and redevelopment of these commercial properties. A map highlighting the areas designated as a FEMA “Special Hazard Flood Area” is shown on the map below:
20
Figure 9 – Targeted Study Area Flood Plain Map
Soils of Hamblen County
There are approximately 14 different soil types within Hamblen County (General Soil Map, Hamblen County, Tennessee, July 1978). The soils are two (2) feet deep or greater in most areas of the county, and are usually clayey or cherty. There are some loamy soils to the southern and eastern sections of Hamblen County. The soils (and their description) most commonly found within Morristown are (based on General Soil Map, Hamblen County, Tennessee, July 1978):
21
Fullerton-Clarksville-Bolton: Cherty, well-drained soils found on hilly and steep topography, generally more than 5 feet thick on top of dolomitic bedrock.
Dunmore-Fullerton: Clayey, well-drained soils found on rolling topography, generally more than 5 feet thick on top of dolomitic bedrock.
Dunmore-Dewey: Clayey, well-drained soils found on rolling topography, generally more than 5 feet thick on dolomitic bedrock. Decatur-Dewey: Clayey, well-drained soils found on low rounded hills, generally more than 5 feet thick on dolomitic bedrock. Talbott-Rock Outcrop: Clayey, well-drained soils generally less than 4 feet thick found on limestone bedrock and rock outcrops on low hills and in the valleys. Dunmore-Groseclose: Clayey, well-drained soils that are approximately 3 feet or greater in thickness that are on top of rolling topographic beds of limestone and shale.
Seismology of East Tennessee
Currently, East Tennessee does have some seismic activity. East Tennessee is within a level VI of the Mercalli Intensity Scale, where a level I has the lowest seismic activity and a level XII has the highest seismic intensity level (Templeton and Spencer, 1980, 4). Figure 4 shown on the next page illustrates the isoseismal lines of Tennessee based on the New Madrid Earthquake on December 16, 1811. At the level VI, there is the possibility of doors shaking, stationary vehicles rocking back and forth, and it could possibly shake humans. There has been an increase of earthquakes reported in East Tennessee since the early 1900s, however, this is attributed to the increase in population. The actual number of earthquakes may not have been increased, but because of the higher population within the region, more people are able to witness the seismic activity and report it to the appropriate authorities (Templeton and Spencer, 1980, 6).
Fault lines, like the valley and ridges, generally run in a northeast to southwest direction. The main fault line within Hamblen County is the Rocky Valley Fault. The Dumplin Valley Fault extends into Hamblen County from Jefferson County (Debuchananne and Richardson, 1956, 177).
Hydrology
Tennessee is within three (3) groundwater regions, which are from east to west: (1) Piedmont and Blue Ridge, (2) Nonglaciated Central Region, and (3) Atlantic and Gulf Coastal Plain (Fetter, 1988, 310-315). Hamblen County is within the Nonglaciated Central Region.

22
Groundwater flow within the Nonglaciated Central Region generally is inconsistent based on the rationale that most rocks are calcareous (limestones and dolostones) which tends to be cavernous and does not hold water very long (Wilson, 1982, 28). The Knox Dolomite does however provide groundwater to many parts of eastern Tennessee (Fetter, 1988, 314).
23
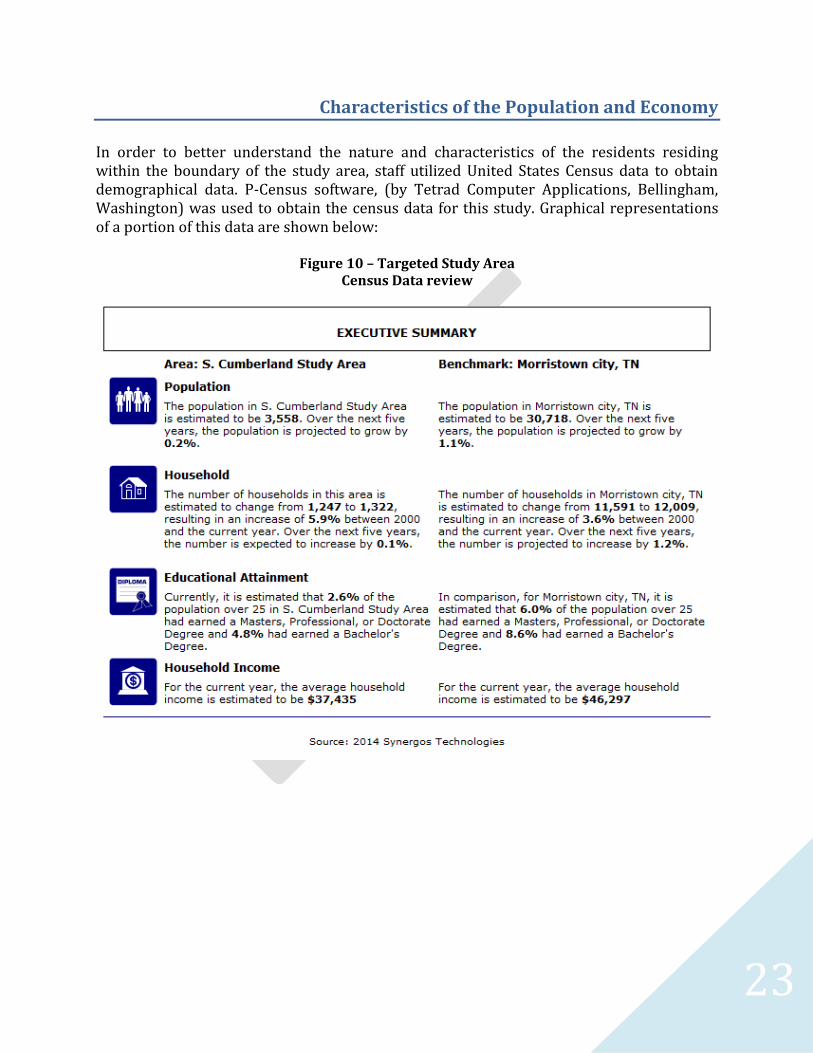
Characteristics of the Population and Economy
In order to better understand the nature and characteristics of the residents residing within the boundary of the study area, staff utilized United States Census data to obtain demographical data. P-Census software, (by Tetrad Computer Applications, Bellingham, Washington) was used to obtain the census data for this study. Graphical representations of a portion of this data are shown below:
Figure 10 – Targeted Study Area Census Data review
24
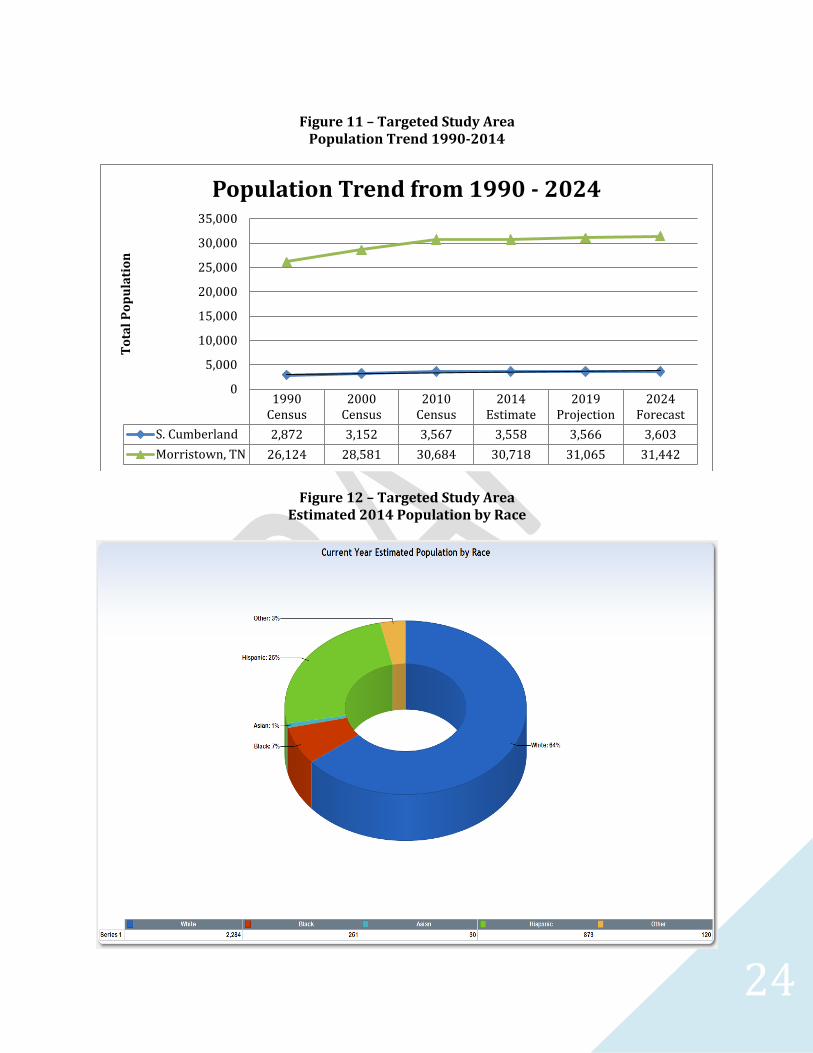
Figure 11 – Targeted Study Area
Population Trend 1990-2014
Figure 12 – Targeted Study Area Estimated 2014 Population by Race
1990Census
2000Census
2010Census
2014Estimate
2019Projection
2024Forecast
S. Cumberland 2,872 3,152 3,567 3,558 3,566 3,603
Morristown, TN 26,124 28,581 30,684 30,718 31,065 31,442
0
5,000
10,000
15,000
20,000
25,000
30,000
35,000
To
tal
Po
pu
lati
on
Population Trend from 1990 - 2024
25
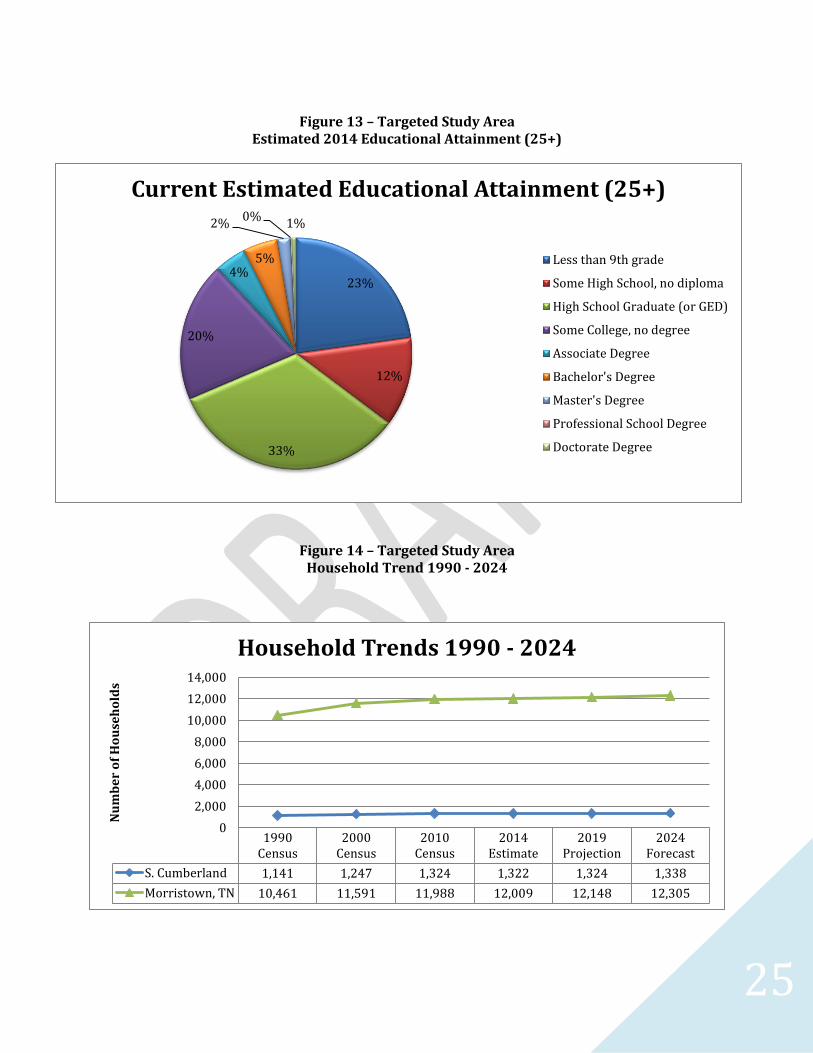
23%
12%
33%
20%
4% 5%
2% 0%
1%
Current Estimated Educational Attainment (25+)
Less than 9th grade
Some High School, no diploma
High School Graduate (or GED)
Some College, no degree
Associate Degree
Bachelor's Degree
Master's Degree
Professional School Degree
Doctorate Degree
1990Census
2000Census
2010Census
2014Estimate
2019Projection
2024Forecast
S. Cumberland 1,141 1,247 1,324 1,322 1,324 1,338
Morristown, TN 10,461 11,591 11,988 12,009 12,148 12,305
0
2,000
4,000
6,000
8,000
10,000
12,000
14,000
Nu
mb
er
of
Ho
use
ho
lds
Household Trends 1990 - 2024
Figure 13 – Targeted Study Area
Estimated 2014 Educational Attainment (25+)
Figure 14 – Targeted Study Area Household Trend 1990 - 2024
26
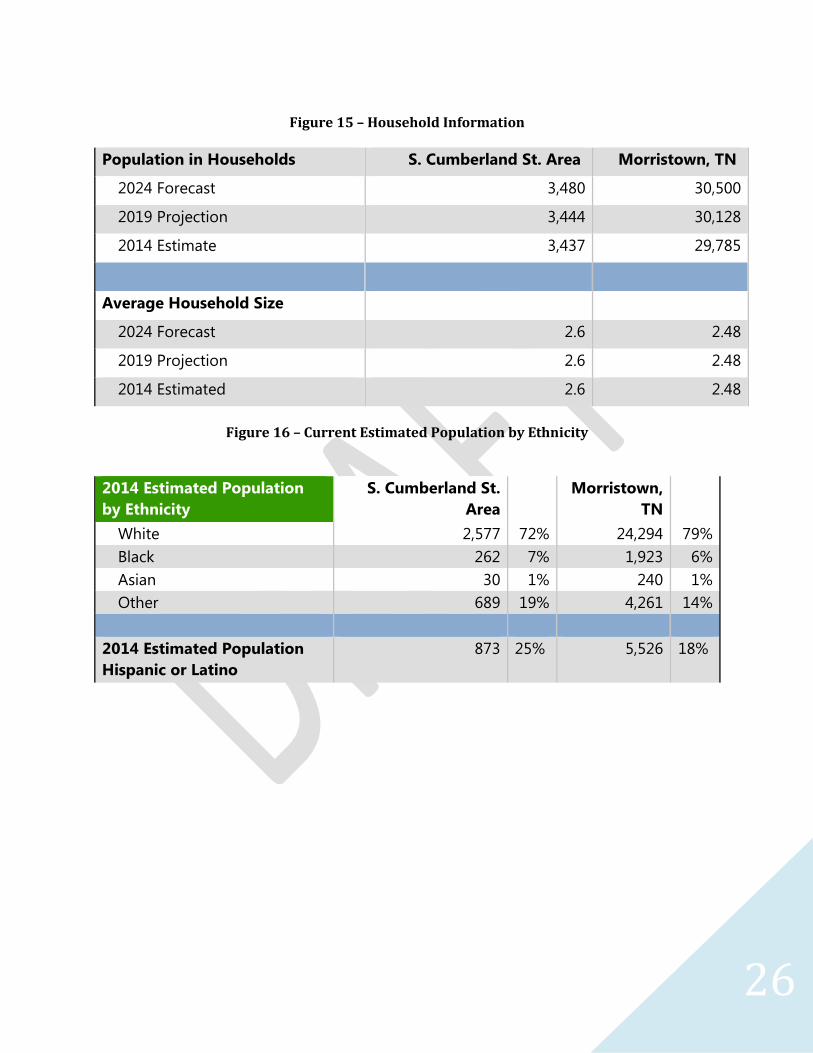
Figure 15 – Household Information
Population in Households S. Cumberland St. Area Morristown, TN
2024 Forecast 3,480 30,500
2019 Projection 3,444 30,128
2014 Estimate 3,437 29,785
Average Household Size
2024 Forecast 2.6 2.48
2019 Projection 2.6 2.48
2014 Estimated 2.6 2.48
Figure 16 – Current Estimated Population by Ethnicity
2014 Estimated Population
by Ethnicity
S. Cumberland St.
Area
Morristown,
TN
White 2,577 72% 24,294 79%
Black 262 7% 1,923 6%
Asian 30 1% 240 1%
Other 689 19% 4,261 14%
2014 Estimated Population
Hispanic or Latino
873 25% 5,526 18%
27
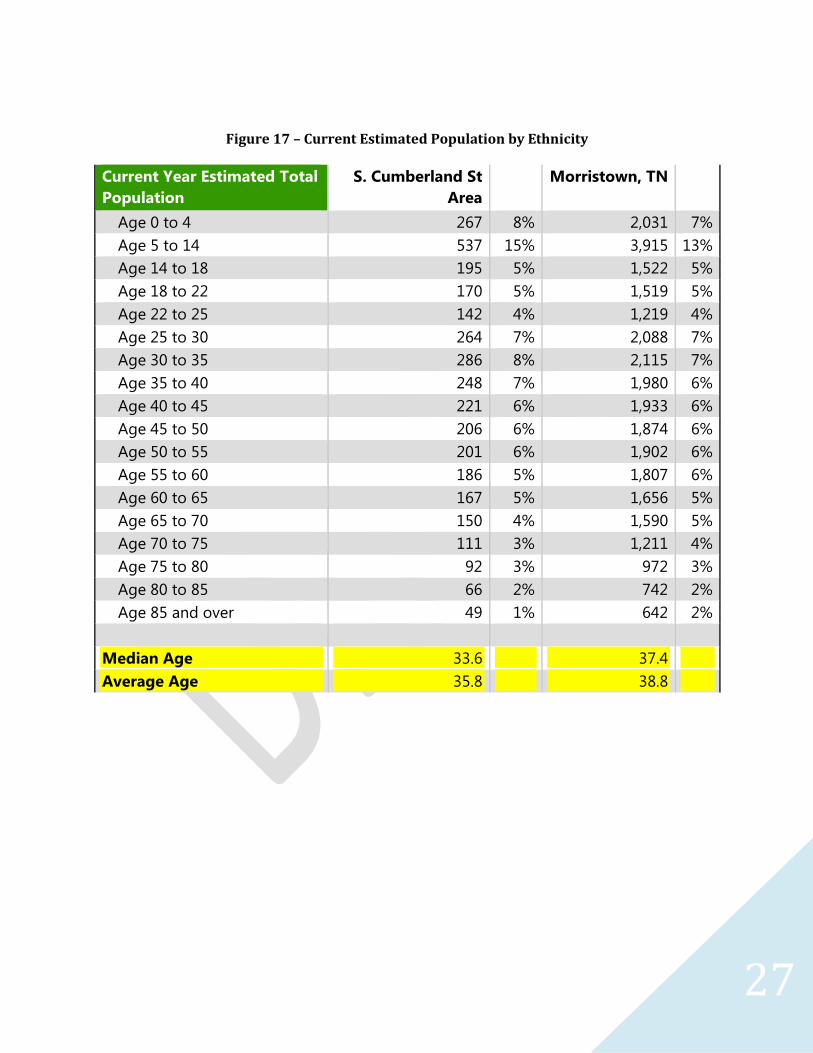
Figure 17 – Current Estimated Population by Ethnicity
Current Year Estimated Total
Population
S. Cumberland St
Area
Morristown, TN
Age 0 to 4 267 8% 2,031 7%
Age 5 to 14 537 15% 3,915 13%
Age 14 to 18 195 5% 1,522 5%
Age 18 to 22 170 5% 1,519 5%
Age 22 to 25 142 4% 1,219 4%
Age 25 to 30 264 7% 2,088 7%
Age 30 to 35 286 8% 2,115 7%
Age 35 to 40 248 7% 1,980 6%
Age 40 to 45 221 6% 1,933 6%
Age 45 to 50 206 6% 1,874 6%
Age 50 to 55 201 6% 1,902 6%
Age 55 to 60 186 5% 1,807 6%
Age 60 to 65 167 5% 1,656 5%
Age 65 to 70 150 4% 1,590 5%
Age 70 to 75 111 3% 1,211 4%
Age 75 to 80 92 3% 972 3%
Age 80 to 85 66 2% 742 2%
Age 85 and over 49 1% 642 2%
Median Age 33.6 37.4
Average Age 35.8 38.8
28
Special Needs of the Study Area
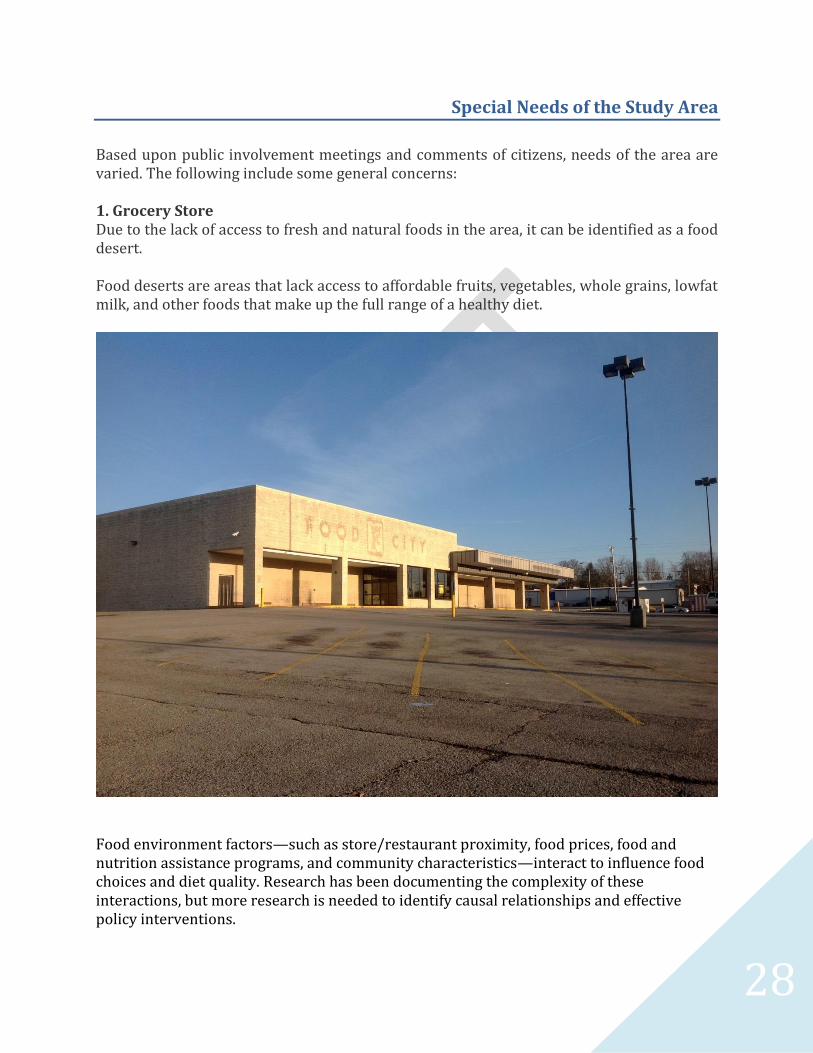
Based upon public involvement meetings and comments of citizens, needs of the area are varied. The following include some general concerns: 1. Grocery Store Due to the lack of access to fresh and natural foods in the area, it can be identified as a food desert. Food deserts are areas that lack access to affordable fruits, vegetables, whole grains, lowfat milk, and other foods that make up the full range of a healthy diet.
Food environment factors—such as store/restaurant proximity, food prices, food and nutrition assistance programs, and community characteristics—interact to influence food choices and diet quality. Research has been documenting the complexity of these interactions, but more research is needed to identify causal relationships and effective policy interventions.
29
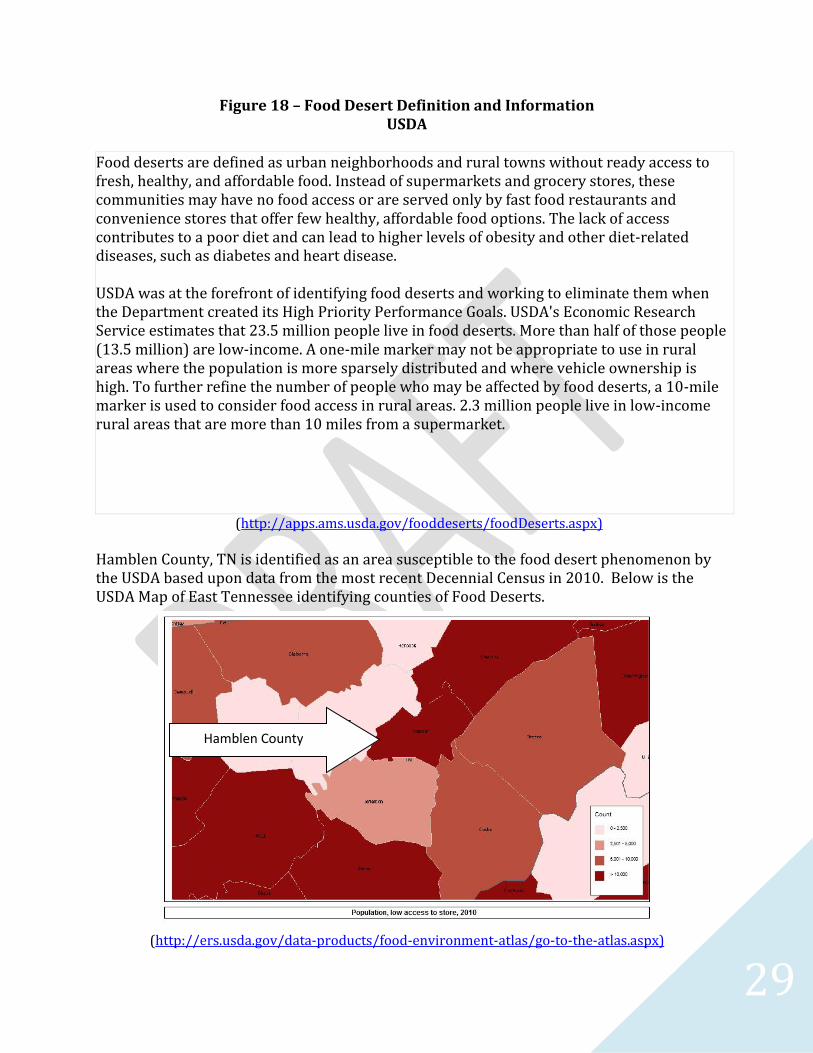
Figure 18 – Food Desert Definition and Information USDA
Food deserts are defined as urban neighborhoods and rural towns without ready access to fresh, healthy, and affordable food. Instead of supermarkets and grocery stores, these communities may have no food access or are served only by fast food restaurants and convenience stores that offer few healthy, affordable food options. The lack of access contributes to a poor diet and can lead to higher levels of obesity and other diet-related diseases, such as diabetes and heart disease.
USDA was at the forefront of identifying food deserts and working to eliminate them when the Department created its High Priority Performance Goals. USDA's Economic Research Service estimates that 23.5 million people live in food deserts. More than half of those people (13.5 million) are low-income. A one-mile marker may not be appropriate to use in rural areas where the population is more sparsely distributed and where vehicle ownership is high. To further refine the number of people who may be affected by food deserts, a 10-mile marker is used to consider food access in rural areas. 2.3 million people live in low-income rural areas that are more than 10 miles from a supermarket.
(http://apps.ams.usda.gov/fooddeserts/foodDeserts.aspx)
Hamblen County, TN is identified as an area susceptible to the food desert phenomenon by the USDA based upon data from the most recent Decennial Census in 2010. Below is the USDA Map of East Tennessee identifying counties of Food Deserts.
(http://ers.usda.gov/data-products/food-environment-atlas/go-to-the-atlas.aspx)
Hamblen County
30
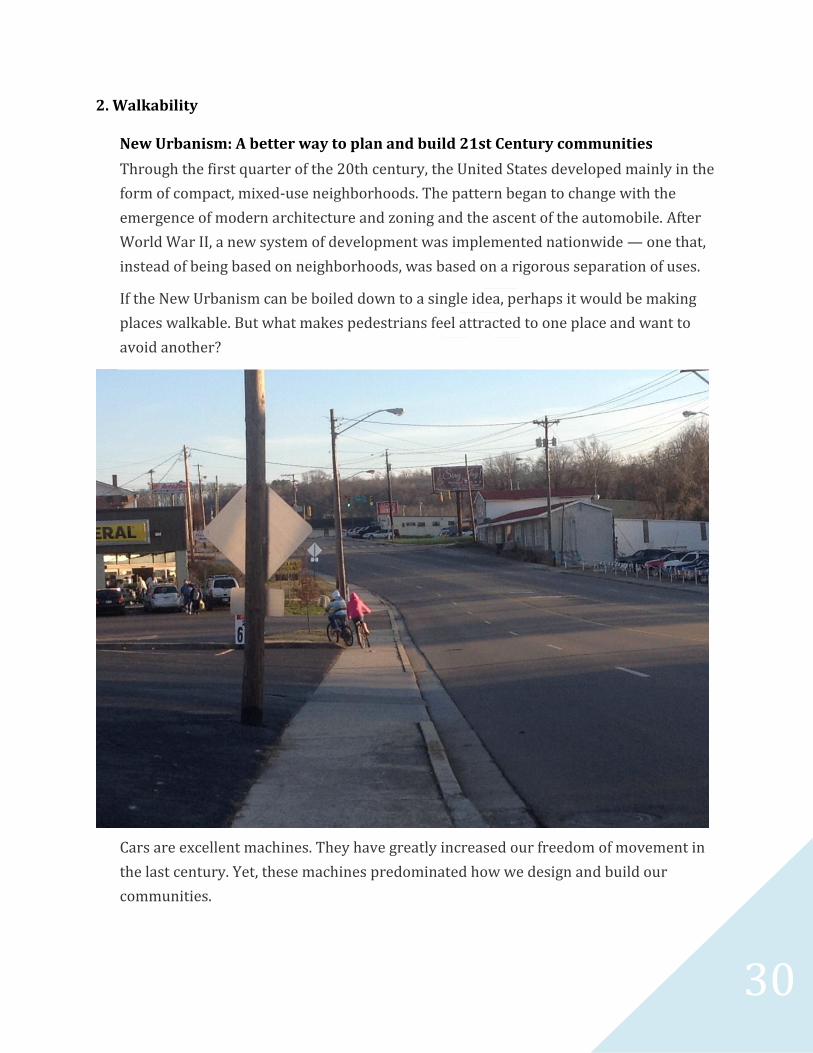
2. Walkability
New Urbanism: A better way to plan and build 21st Century communities
Through the first quarter of the 20th century, the United States developed mainly in the
form of compact, mixed-use neighborhoods. The pattern began to change with the
emergence of modern architecture and zoning and the ascent of the automobile. After
World War II, a new system of development was implemented nationwide — one that,
instead of being based on neighborhoods, was based on a rigorous separation of uses.
If the New Urbanism can be boiled down to a single idea, perhaps it would be making
places walkable. But what makes pedestrians feel attracted to one place and want to
avoid another?
Cars are excellent machines. They have greatly increased our freedom of movement in
the last century. Yet, these machines predominated how we design and build our
communities.
31
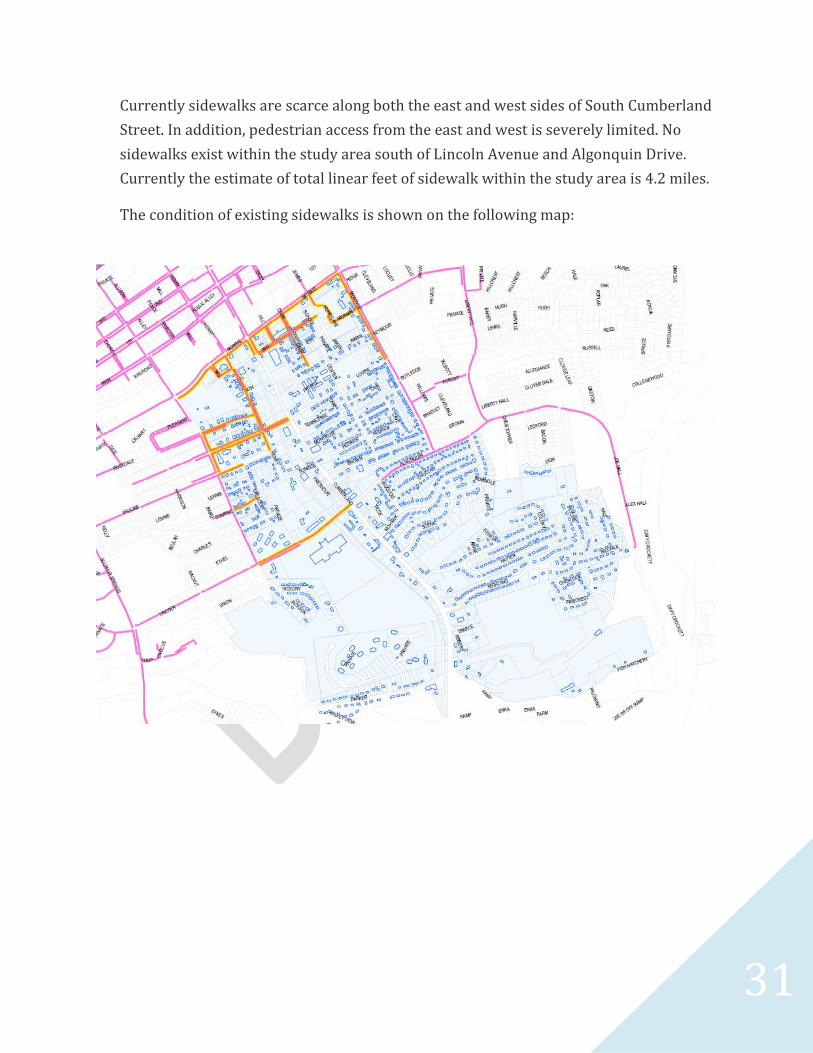
Currently sidewalks are scarce along both the east and west sides of South Cumberland
Street. In addition, pedestrian access from the east and west is severely limited. No
sidewalks exist within the study area south of Lincoln Avenue and Algonquin Drive.
Currently the estimate of total linear feet of sidewalk within the study area is 4.2 miles.
The condition of existing sidewalks is shown on the following map:
32
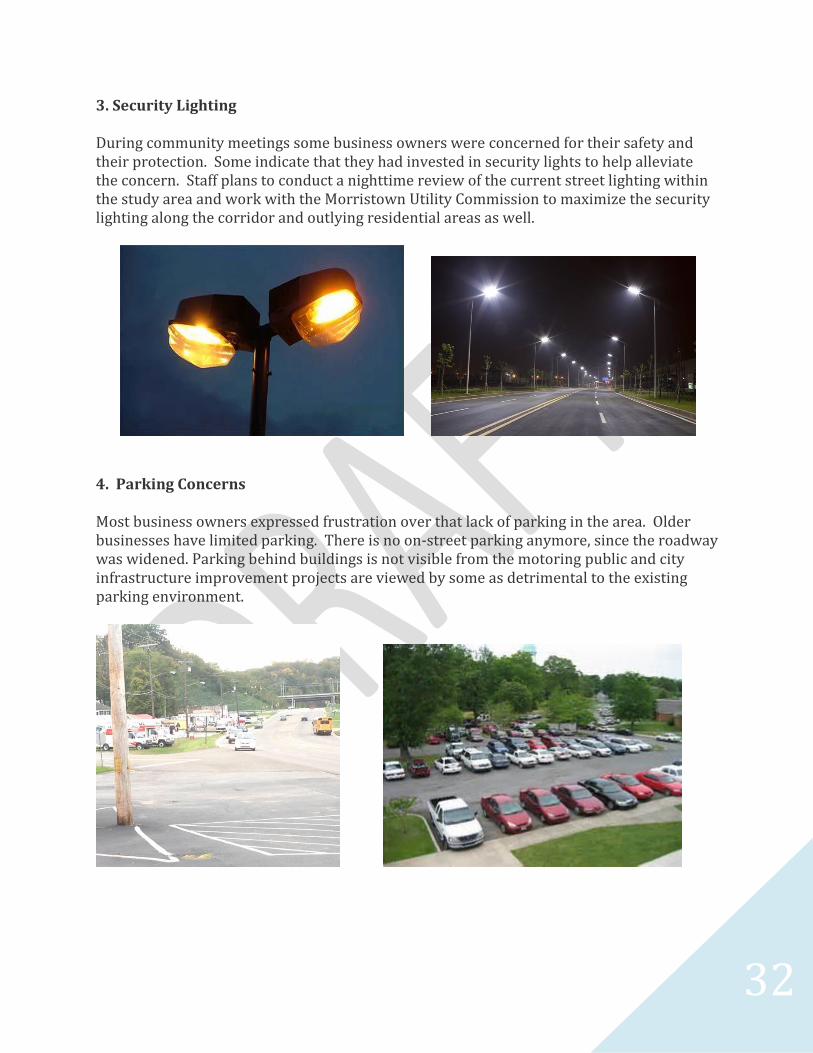
3. Security Lighting During community meetings some business owners were concerned for their safety and their protection. Some indicate that they had invested in security lights to help alleviate the concern. Staff plans to conduct a nighttime review of the current street lighting within the study area and work with the Morristown Utility Commission to maximize the security lighting along the corridor and outlying residential areas as well.
4. Parking Concerns Most business owners expressed frustration over that lack of parking in the area. Older businesses have limited parking. There is no on-street parking anymore, since the roadway was widened. Parking behind buildings is not visible from the motoring public and city infrastructure improvement projects are viewed by some as detrimental to the existing parking environment.
33
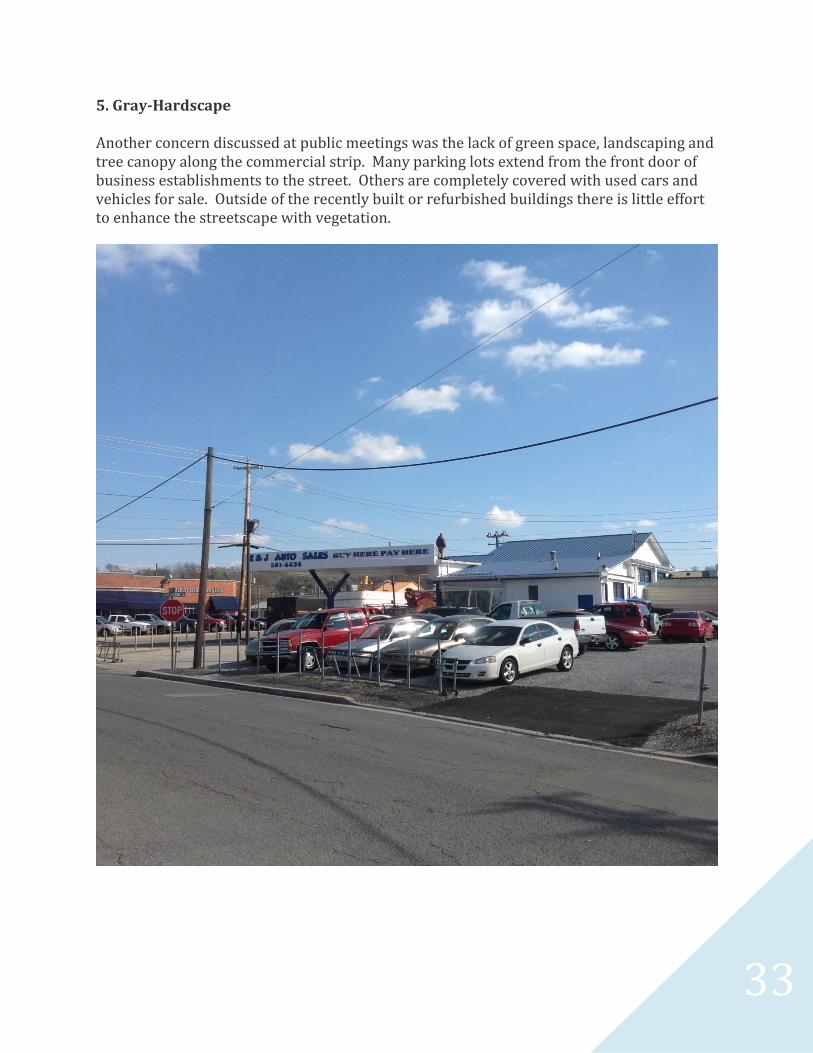
5. Gray-Hardscape Another concern discussed at public meetings was the lack of green space, landscaping and tree canopy along the commercial strip. Many parking lots extend from the front door of business establishments to the street. Others are completely covered with used cars and vehicles for sale. Outside of the recently built or refurbished buildings there is little effort to enhance the streetscape with vegetation.
34
Recommendations
Establish the neighborhood as a revitalization zone and find incentives to upgrade
the corridor appearance. Consider an overlay zoning district for the area addressing setbacks, parking, signs, etc. in the T6, T5, and T4 zones of the Transect model of the study area.
Seek funding opportunities for the redevelopment of the area to improve appearance and walkability.
Enable the property-owners and residents of the area to develop a property-owners association to communicate common issues and strategies for addressing various issues.
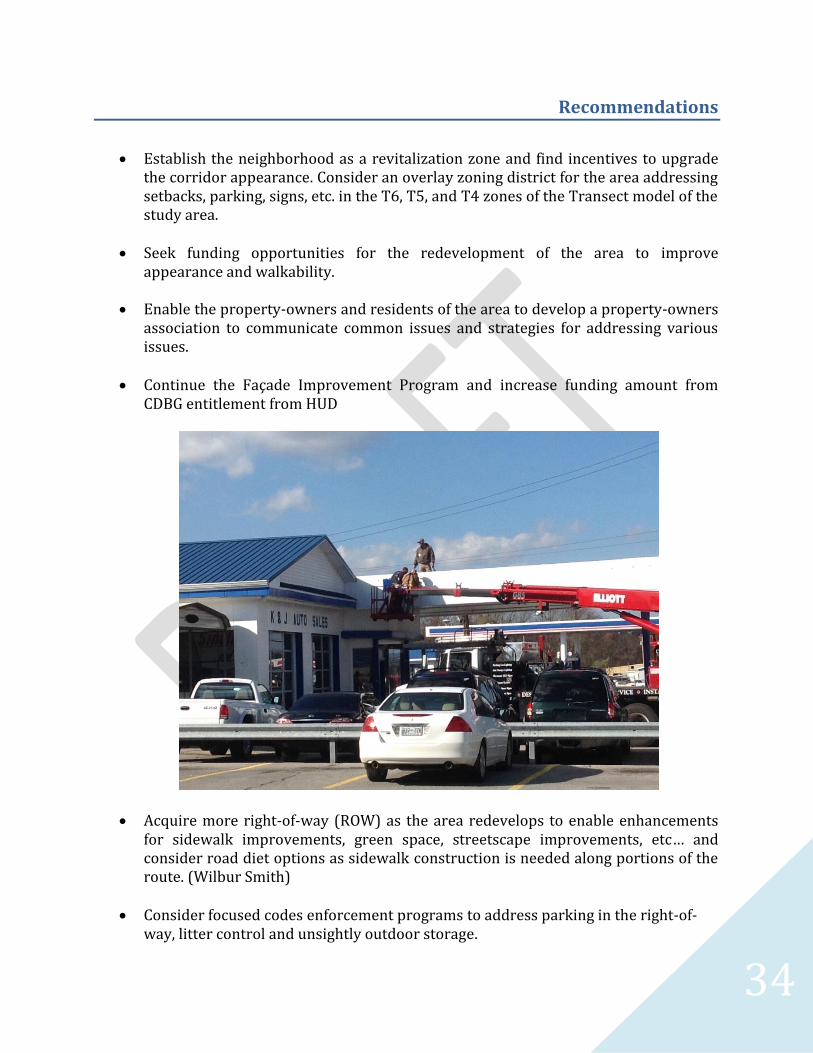
Continue the Façade Improvement Program and increase funding amount from
CDBG entitlement from HUD
Acquire more right-of-way (ROW) as the area redevelops to enable enhancements for sidewalk improvements, green space, streetscape improvements, etc… and consider road diet options as sidewalk construction is needed along portions of the route. (Wilbur Smith)
Consider focused codes enforcement programs to address parking in the right-of-
way, litter control and unsightly outdoor storage.
35
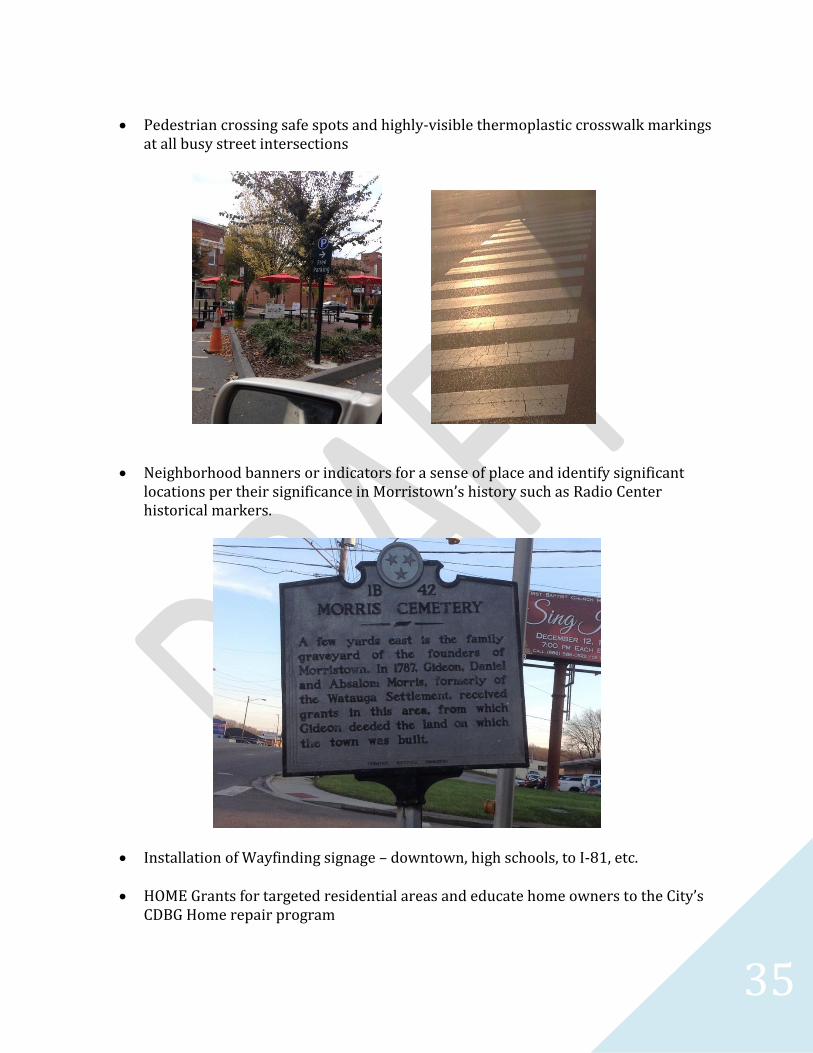
Pedestrian crossing safe spots and highly-visible thermoplastic crosswalk markings
at all busy street intersections
Neighborhood banners or indicators for a sense of place and identify significant
locations per their significance in Morristown’s history such as Radio Center historical markers.
Installation of Wayfinding signage – downtown, high schools, to I-81, etc.
HOME Grants for targeted residential areas and educate home owners to the City’s CDBG Home repair program
36
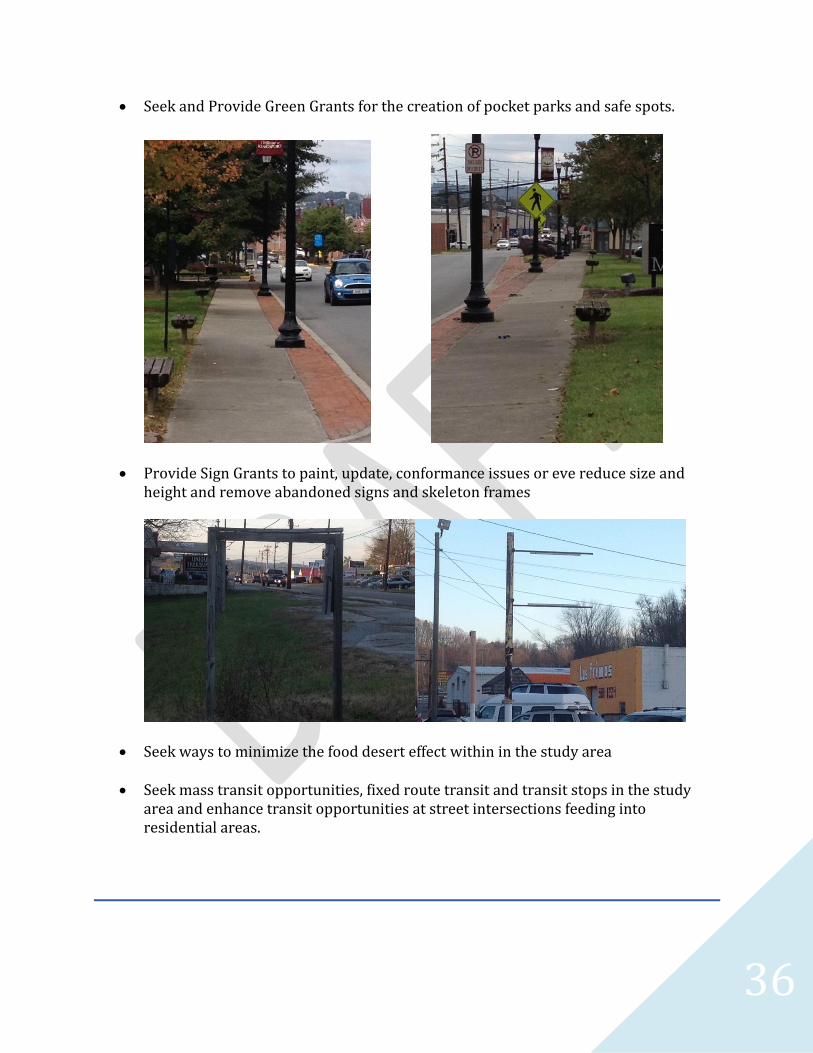
Seek and Provide Green Grants for the creation of pocket parks and safe spots.
Provide Sign Grants to paint, update, conformance issues or eve reduce size and
height and remove abandoned signs and skeleton frames
Seek ways to minimize the food desert effect within in the study area Seek mass transit opportunities, fixed route transit and transit stops in the study
area and enhance transit opportunities at street intersections feeding into residential areas.
37
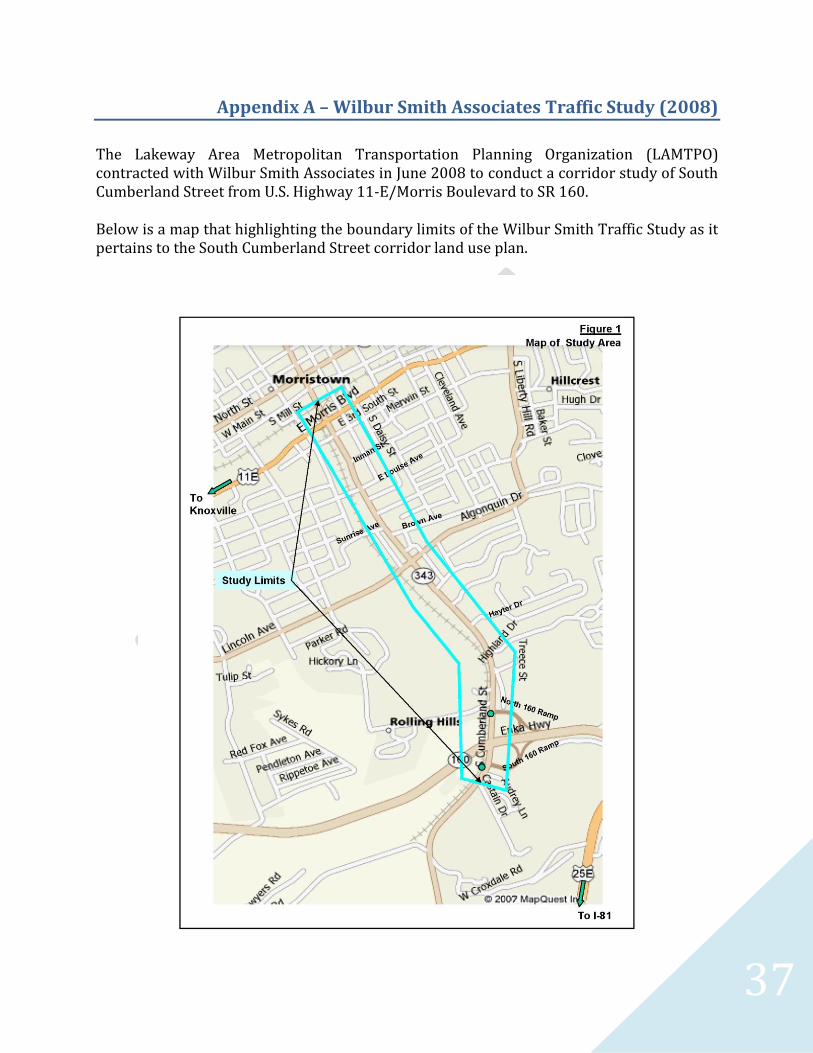
Appendix A – Wilbur Smith Associates Traffic Study (2008)
The Lakeway Area Metropolitan Transportation Planning Organization (LAMTPO) contracted with Wilbur Smith Associates in June 2008 to conduct a corridor study of South Cumberland Street from U.S. Highway 11-E/Morris Boulevard to SR 160. Below is a map that highlighting the boundary limits of the Wilbur Smith Traffic Study as it pertains to the South Cumberland Street corridor land use plan.
38
Key Issues Key issues within the corridor include traffic operations at intersections, safety, pedestrian accommodation, and effectiveness of access. The consultant assembled various data including field reviews of roadway geometry and traffic control devices, turning movement counts, and review of traffic accident histories. Capacity analyses were also conducted for the study intersections and the study corridors. Based on these analyses, the following actions were recommended by Wilbur Smith Associates:
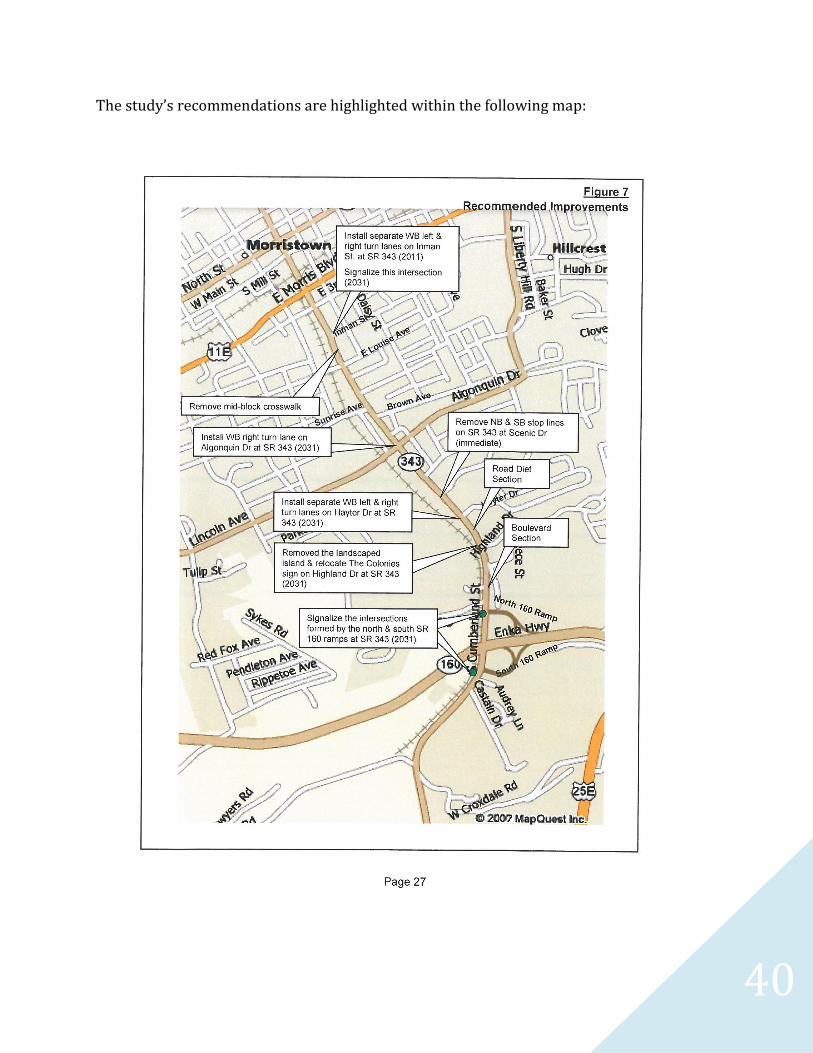
Short-Term Recommendations: These improvements are either currently warranted or will be warranted by the 2011 and should be implemented immediately. • Remove the mid-block crossing on SR 343 (South Cumberland Street) that is located
north of E. Louise Avenue, near the former Food City grocery store. Consequently, install new crosswalk pavement markings at Inman Street and improve handicap ramps.
• Remove the stop lines on northbound and southbound SR 343 at Scenic Drive.
• Install separate westbound left and right turn lanes on Inman Street at SR 343. • Provide signal coordination for the corridor. • Improve and refurbish pavement markings at SR 160 ramps. Long-Term Recommendations: It is anticipated that these improvements will be warranted by the year 2031. Traffic conditions should be periodically monitored and evaluated to determine the appropriate time to implement these improvements. • Signalize the intersection of SR 343 and Inman Street. Separate westbound left and
right turn lanes should also be installed on Inman Street, as identified in the short-term improvements.
• Install westbound right turn lane on Algonquin Drive at SR 343. • Install separate westbound left and right turn lanes on Hayter Drive at SR 343. As part
of this improvement, the sign located in the middle of Hayter Drive should be relocated outside of the right-of-way.
• Improve the intersection of SR 343 and Highland Drive to eliminate the landscaped
island on Highland Drive. The sign that is currently located in the median should be
39
relocated outside of the right-of-way. Separate westbound left and right turn lanes should continue to be provided on Highland Drive at SR 343.
• Signalize the intersection of SR 343 and the north SR 160 ramp. • Signalize the intersection of SR 343 and the south 160 ramp. • Implement “Road Diet” concept with landscaping from just south of Montrose Avenue
to Hayter Drjve and boulevard “gateway” section with landscaping from Hayter Drive to SR 160 ramps.
•Continue to update signal coordination with improved technologies, including updated
coordination plans and possible traffic responsive technology implantation. On-Going Access Management Recommendations: Coordinate with Morristown staff to establish access management policies through the modification of the City’s subdivision regulations and design standards, through a corridor overlay, or through other ordinance tools. These policies should be crafted to advance access management principles and may include the following: • Definition or expansion of the City’s functional classification system to identify the
appropriate level of access control that should be provided on any given street. • Creation of a greater variety of street types with varying design standards to promote
interconnection of streets and businesses away from the arterial roadway. • Establishing controls on the number of driveways per lot, minimum lot frontage, and
the location and spacing of driveways. • Promoting internal connection of lots and outparcels and consolidation of driveways
through joint access. • Requiring traffic access and impact studies for new developments or changes in
existing developments likely to generate substantially higher traffic volumes.
40
The study’s recommendations are highlighted within the following map:
41
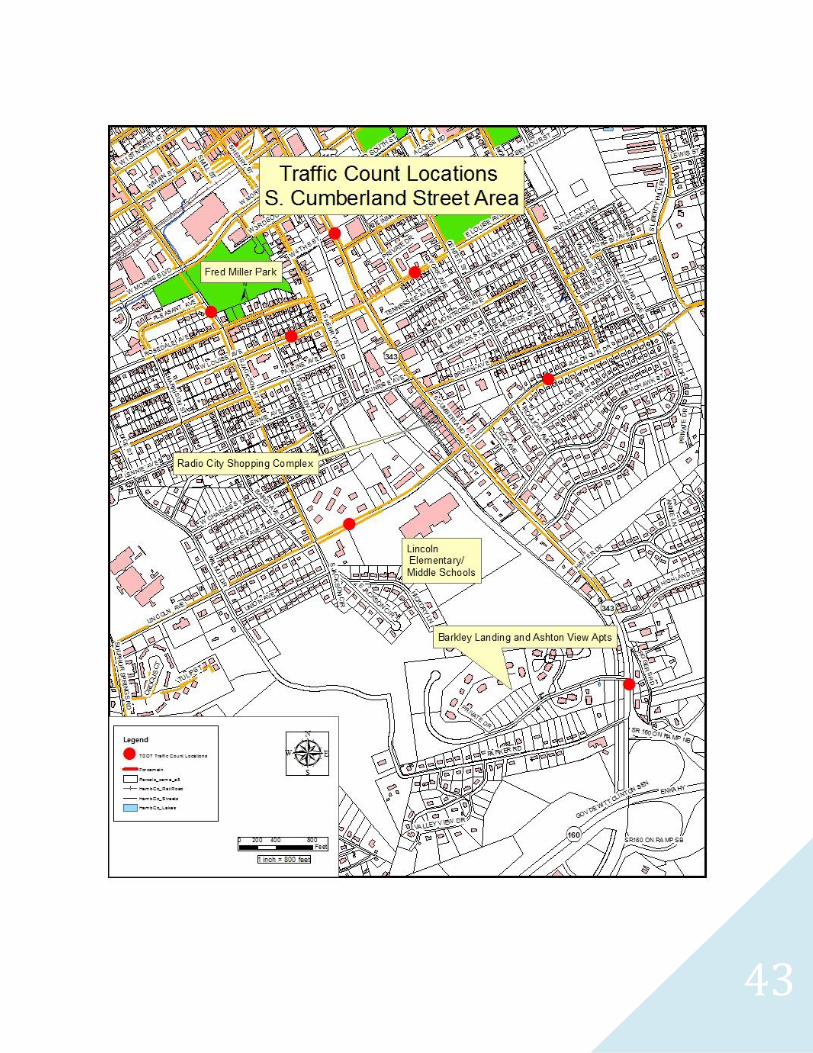
Appendix B – Traffic Information and Counts
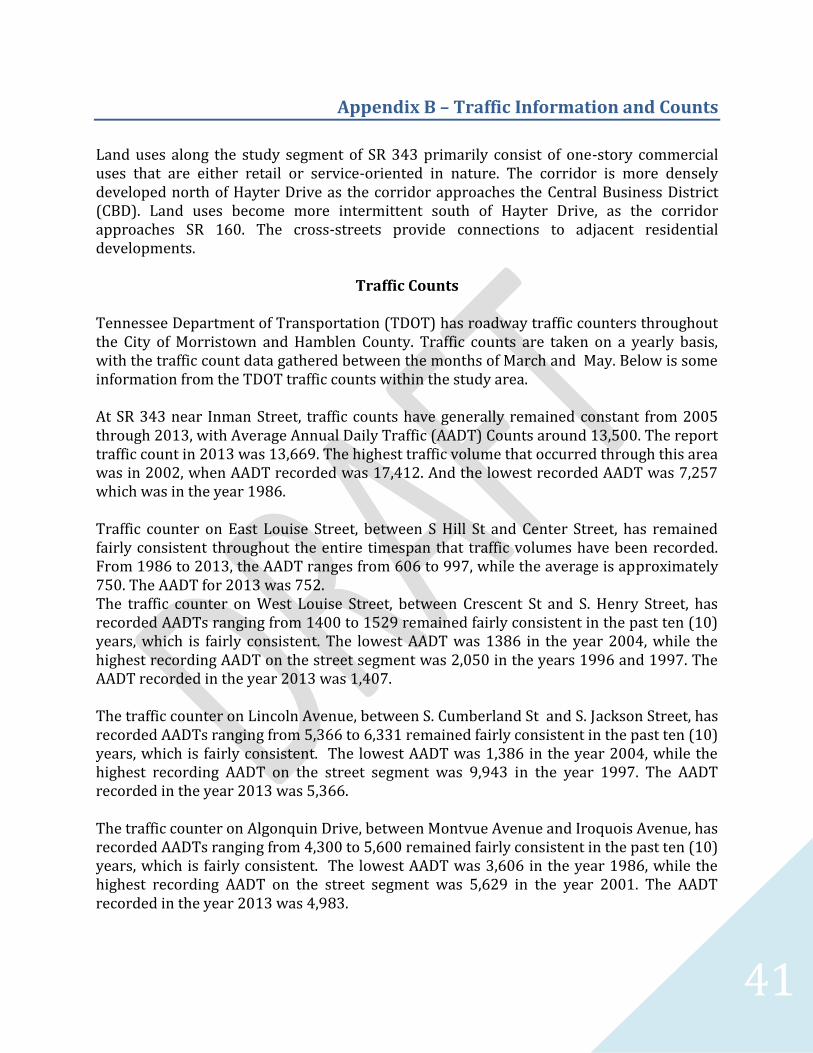
Land uses along the study segment of SR 343 primarily consist of one-story commercial uses that are either retail or service-oriented in nature. The corridor is more densely developed north of Hayter Drive as the corridor approaches the Central Business District (CBD). Land uses become more intermittent south of Hayter Drive, as the corridor approaches SR 160. The cross-streets provide connections to adjacent residential developments.
Traffic Counts
Tennessee Department of Transportation (TDOT) has roadway traffic counters throughout the City of Morristown and Hamblen County. Traffic counts are taken on a yearly basis, with the traffic count data gathered between the months of March and May. Below is some information from the TDOT traffic counts within the study area. At SR 343 near Inman Street, traffic counts have generally remained constant from 2005 through 2013, with Average Annual Daily Traffic (AADT) Counts around 13,500. The report traffic count in 2013 was 13,669. The highest traffic volume that occurred through this area was in 2002, when AADT recorded was 17,412. And the lowest recorded AADT was 7,257 which was in the year 1986. Traffic counter on East Louise Street, between S Hill St and Center Street, has remained fairly consistent throughout the entire timespan that traffic volumes have been recorded. From 1986 to 2013, the AADT ranges from 606 to 997, while the average is approximately 750. The AADT for 2013 was 752. The traffic counter on West Louise Street, between Crescent St and S. Henry Street, has recorded AADTs ranging from 1400 to 1529 remained fairly consistent in the past ten (10) years, which is fairly consistent. The lowest AADT was 1386 in the year 2004, while the highest recording AADT on the street segment was 2,050 in the years 1996 and 1997. The AADT recorded in the year 2013 was 1,407. The traffic counter on Lincoln Avenue, between S. Cumberland St and S. Jackson Street, has recorded AADTs ranging from 5,366 to 6,331 remained fairly consistent in the past ten (10) years, which is fairly consistent. The lowest AADT was 1,386 in the year 2004, while the highest recording AADT on the street segment was 9,943 in the year 1997. The AADT recorded in the year 2013 was 5,366. The traffic counter on Algonquin Drive, between Montvue Avenue and Iroquois Avenue, has recorded AADTs ranging from 4,300 to 5,600 remained fairly consistent in the past ten (10) years, which is fairly consistent. The lowest AADT was 3,606 in the year 1986, while the highest recording AADT on the street segment was 5,629 in the year 2001. The AADT recorded in the year 2013 was 4,983.
42
The traffic counter on S. Jackson Street, between Pleasant Avenue and Rosedale Avenue, has recorded AADTs ranging from 2,925 to 3,697 remained fairly consistent in the past ten (10) years, which is fairly consistent. However, traffic counts have fallen in each of the past four (4) years, from 3,319 in the year 2010 to 2,925 in the year 2013. This is unusual as Fred Miller Park, one of Morristown’s main city parks, is adjacent to this segment of S. Jackson Street.
The traffic counter on S. Cumberland Street, between Barkley Landing Drive and SR160, has recorded AADTs ranging from 11,600 to 12,800 remained fairly consistent in the past ten (10) years, which is fairly consistent. The lowest AADT was 9,239 in the year 1995, while the highest recording AADT on the street segment was 14,273 in the year 1990. The AADT recorded in the year 2013 was 12,419.
43
44
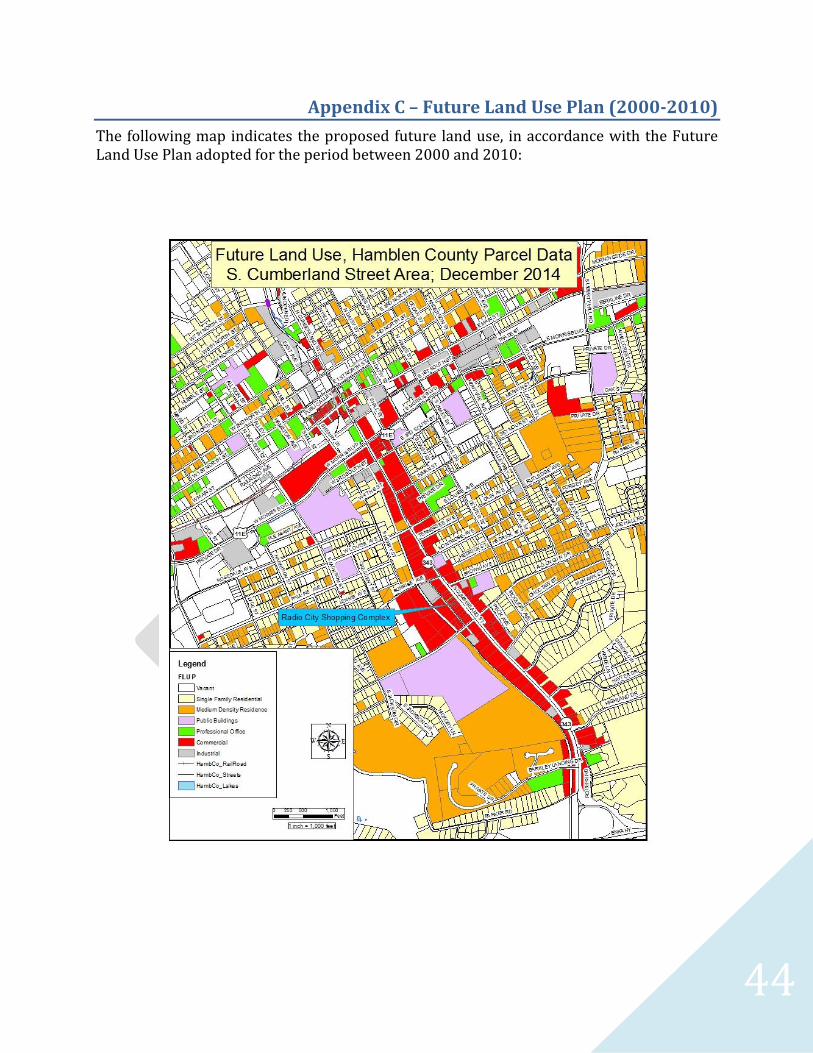
Appendix C – Future Land Use Plan (2000-2010)
The following map indicates the proposed future land use, in accordance with the Future Land Use Plan adopted for the period between 2000 and 2010:

45
Appendix D – Ambition 2030
Ambition 2030 is a general and comprehensive visioning plan, officially adopted by resolution by the Morristown Regional Planning Commission on April 9, 2013. This plan outlines goals for community development, surveys existing conditions, and provides a land use and character plan for the community as well as a transportation and thoroughfare plan. The most relevant goals of the Ambition 2030 to the South Cumberland Street Corridor Land Use Study are listed below: Goal #1 Improved Traffic Flow within the City of Morristown that provides the necessary infrastructure to support existing and new development.
Objectives Action Strategies 1. Shared Access between Developments
a. Require access roads during site plan approval 2. Predict Future Traffic Flow
a. In conjunction with the Lakeway Area Metropolitan Planning Organization, review the Thoroughfare Plan.
b. Consult the Thoroughfare Plan when reviewing all new developments 3. Isolate Major thoroughfare rights-of-way to ease expansion of main corridor
roads. a. In conjunction with the Lakeway Area Metropolitan Planning Organization,
review the Thoroughfare Plan. b. Consult the Thoroughfare Plan when reviewing all new developments
Goal #2 Create Recreation Opportunities in all areas of the Community and ensure that these balance against future commercial and residential development.
Objectives Action Strategies 1. Sidewalks and Pocket Parks Available in all areas of the City
a. Create a sidewalk program that allows commercial developments where sidewalks do not logically or topographically work to place those funds within the program to be placed at another site within the city where sidewalks would be of great benefit.
b. Continue the greenway program and applying for grants to further the Greenway Master Plan.
2. Promote and establish open space areas with any new development a. Offer incentive zoning within additional districts for development that
incorporates quality of life amenities
46
b. Review each new development for the impact upon existing recreation and quality of life services
c. Require developments that may cause a severe negative impact on the recreation and quality of life service to provide some type of amends.
3. Balances of the Quality of Living items against future development in relation to the community.
a. Offer incentive zoning within additional districts for development that incorporates quality of life amenities
b. Review each new development for the impact upon existing recreation and quality of life services
c. Require developments that may cause a severe negative impact on the recreation and quality of life service to provide some type of amends.
Goal #3 Improved Gateway Corridors encouraging tourism and representing the character of the City of Morristown
Objectives Action Strategies 1. Corridor Study for Each Main Corridor within the Planning Region.
a. Focus on one Corridor at a time to encourage revitalization of the area b. Develop realistic goals for each corridor and evaluate each new development
along the corridor for compliance with the Corridor Study. 2. Removal of Automobile Graveyards
a. Revisions of the zoning map which removes uses not appropriate for gateway corridors to other areas of the planning region.
b. Incentive zoning that will encourage automobile graveyards to locate within other parts of the city.
3. Clearance of Blighted residential and commercial structures a. Enforcement of existing zoning ordinances and the building code. b. Combining with other agencies and organizations such as Keep America
Beautiful, The Morristown Tree Board, and the Chamber of Commerce to educate and encourage the removal of blighted features and benefits of creating character within Gateway Corridors and throughout the City.
47
Appendix E – Sidewalk Master Plan
Morristown Sidewalk Master Plan
The Morristown Regional Planning Commission reviewed the existing sidewalk policies and plans regarding sidewalk development within the regional planning area in the City of Morristown. Currently the regulations are a “one size fits all” standard to cover the entire city. The commission has compromised the regulations on a case-by-case basis over the past but has not been as successful as possible in creating the beginnings of a walkable community with the current policies. After review of several innovative policies that have been implemented in other communities, the Morristown Regional Planning Commission began to review potential sidewalk districts. The Morristown Regional Planning Commission created a Sidewalk Master Plan to prepare the community for a true network of pedestrian movement and eliminate the general sidewalk standard by creating productive sidewalks that allow for connectivity within the community. This Plan broke the City of Morristown into 7 sidewalk districts. The South Cumberland Street Corridor is within the High School Sidewalk District. The following items should be taken into consideration during the sidewalk evaluation process:
Set up a hierarchy of needed sidewalks within the community
Evaluate each sidewalk to determine the feasibility of construction and
affordability
Continue to follow the Greenway Master Plan and connect to existing trails
Review the Connectivity within the sidewalk and pedestrian system within
the City of Morristown
Propose areas for crosswalks to create safe pedestrian movements along
heavily traversed streets
Propose Sidewalks to Connect to the following:
o Downtown Area
o Schools
o Hospitals
o Shopping Areas
o Parks
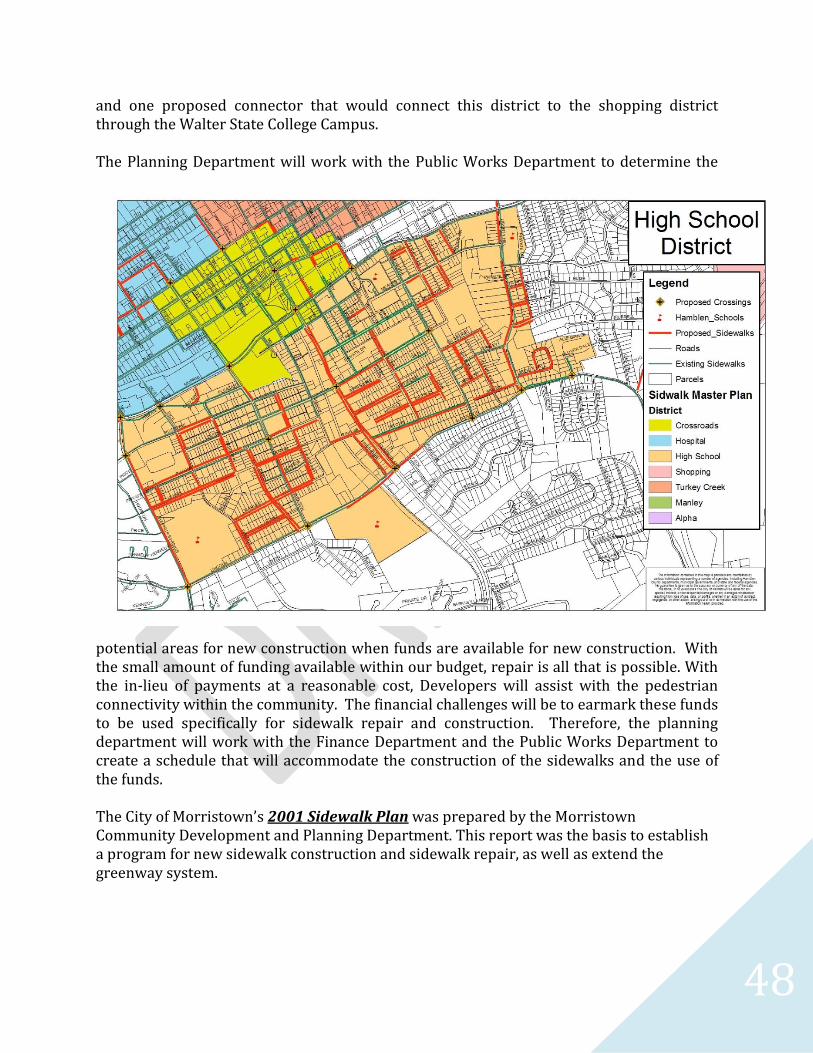
The High School District
The High School District encompasses the two high schools and several commercial and residential areas. This area also includes the City’s first greenway trail and several parks. This is the largest walking district and currently the most widely used district. Both of the high schools routinely utilize the existing sidewalks and trails for access and recreation purposes. This district includes a proposed 86 sidewalks, 10 proposed major crosswalks,
48
and one proposed connector that would connect this district to the shopping district through the Walter State College Campus.
The Planning Department will work with the Public Works Department to determine the
potential areas for new construction when funds are available for new construction. With the small amount of funding available within our budget, repair is all that is possible. With the in-lieu of payments at a reasonable cost, Developers will assist with the pedestrian connectivity within the community. The financial challenges will be to earmark these funds to be used specifically for sidewalk repair and construction. Therefore, the planning department will work with the Finance Department and the Public Works Department to create a schedule that will accommodate the construction of the sidewalks and the use of the funds. The City of Morristown’s 2001 Sidewalk Plan was prepared by the Morristown Community Development and Planning Department. This report was the basis to establish a program for new sidewalk construction and sidewalk repair, as well as extend the greenway system.
49
Provisions that apply to new streets in Morristown are as follows:
Sidewalks shall be required if the development is off of a principal arterial, minor arterial or collector street as classified in the current Transportation Plan.
Sidewalks shall be required if the development lies within ½ mile of a school. Sidewalks shall be required if the development is within ½ mile of existing
sidewalks. Sidewalks measuring four feet in width are required on one side of all new local
streets, and sidewalks measuring five feet in width shall be installed on all other streets that require sidewalks.
The developer shall install, or post a bond as with all other subdivision improvements, all required sidewalks and greenways if shown on the Greenway Master Plan. These facilities shall be designed according to the specifications in the Greenway Master Plan.
50
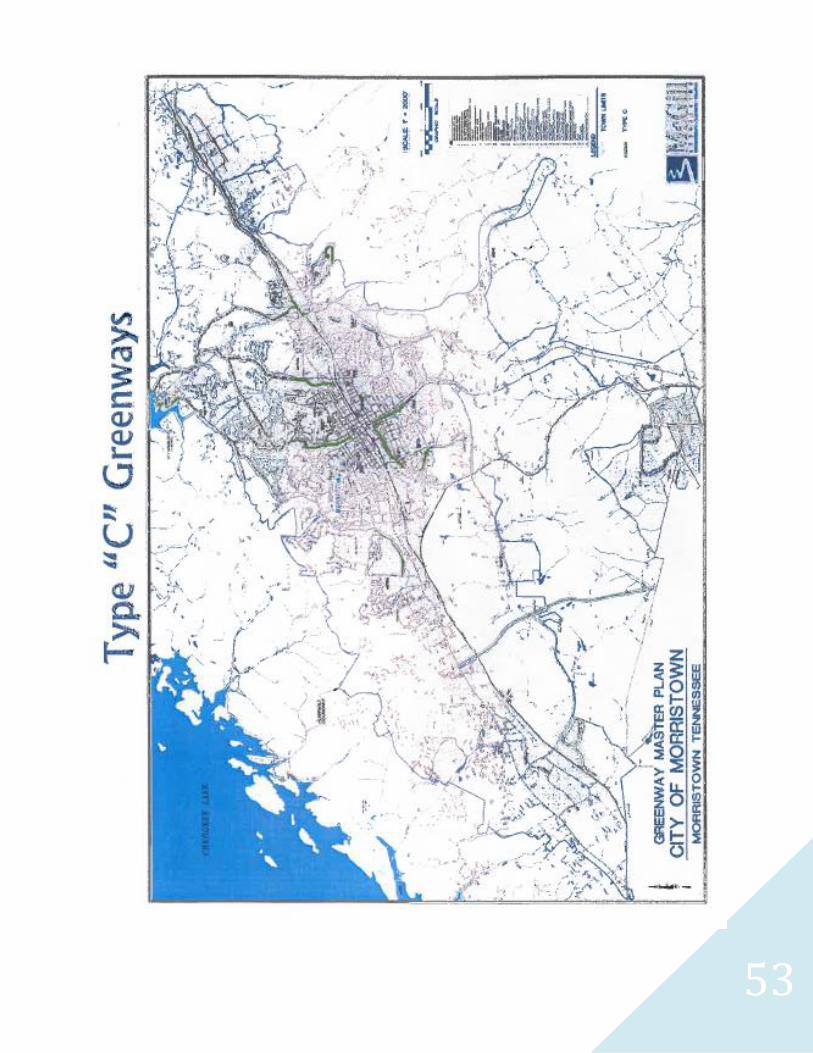
Appendix F – Greenway Master Plan
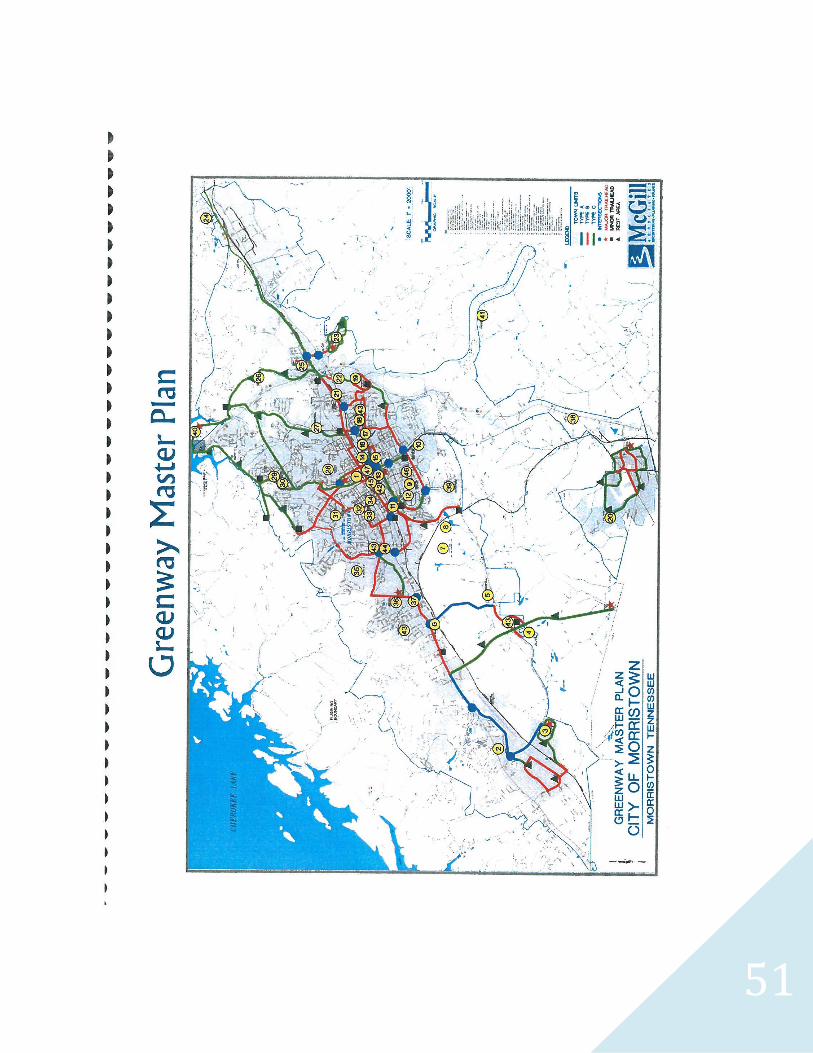
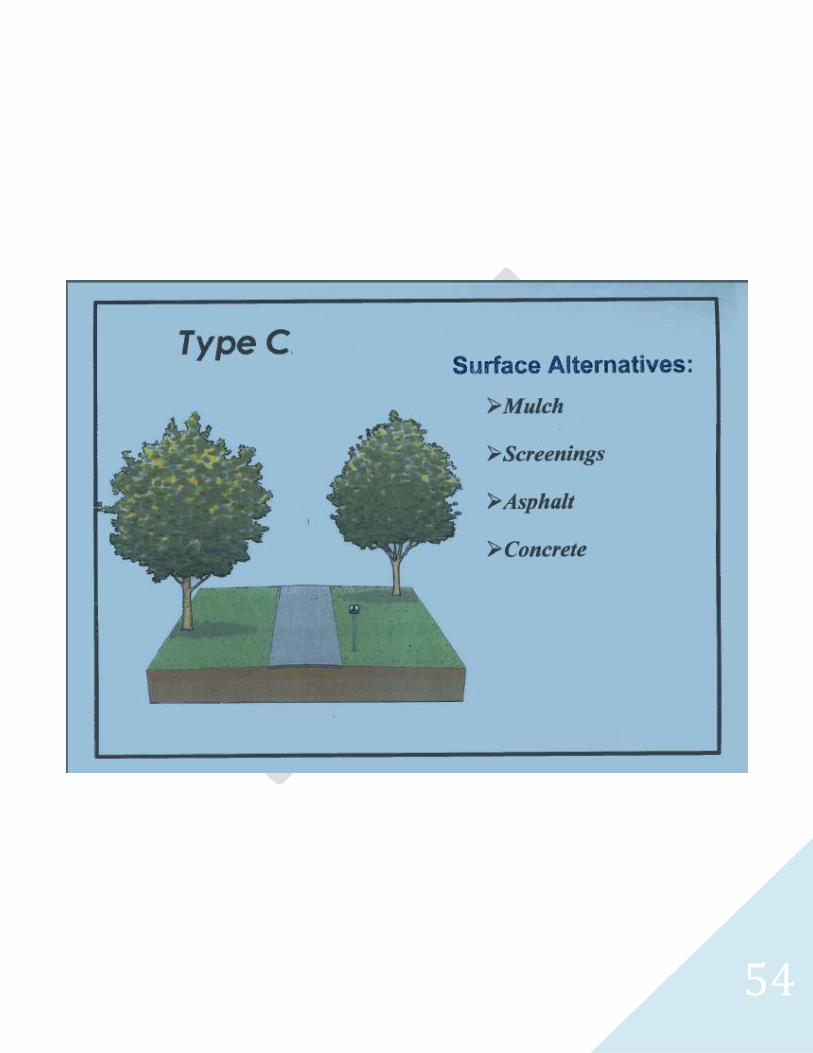
Morristown Greenway Master Plan In March 2002, the City of Morristown commissioned McGill Associates to conduct a study of potential greenways within its planning boundaries. What was once the initial greenway study for the Turkey Creek Sanitary Sewer Interceptor project evolved into the City’s Greenway Master Plan. The plan involved the collaborated efforts of residents, city staff and area stakeholders to develop the most useful, enjoyable and attractive greenway system for pedestrians and bicyclists in the area. Many existing destinations and points of interest for pedestrian and bicyclists use served as the initial step to begin the actual planning process for the greenway routes. The master plan resulted in three major greenway route classifications consisting of Type A (on-road facility), Type B (on-road facility with sidewalks), and Type C (traditional off-road facility exclusively for non-motorized traffic). It also included design criteria and implementation strategies for incorporating the plan into overall goals of the City. According to the Greenway Master Plan, some existing streets with curbs and sidewalk should receive bicycle route signage only (Type B1). These streets are:
Inman Street from Daisy Street to Montvue Avenue Montvue Avenue from Inman Street to Mervin Street Daisy Street from Morris Boulevard to Inman Street East 3rd South Street from Fred Miller Park to Daisy Street
Type B2 Greenways are defined as roadways with existing wide lanes and sidewalk, to be re-striped with bike lanes and bike route signage. These streets are:
Lincoln Avenue from Sulphur Springs Road to South Cumberland Street Algonquin Avenue from South Cumberland Street to Joe Hall Road
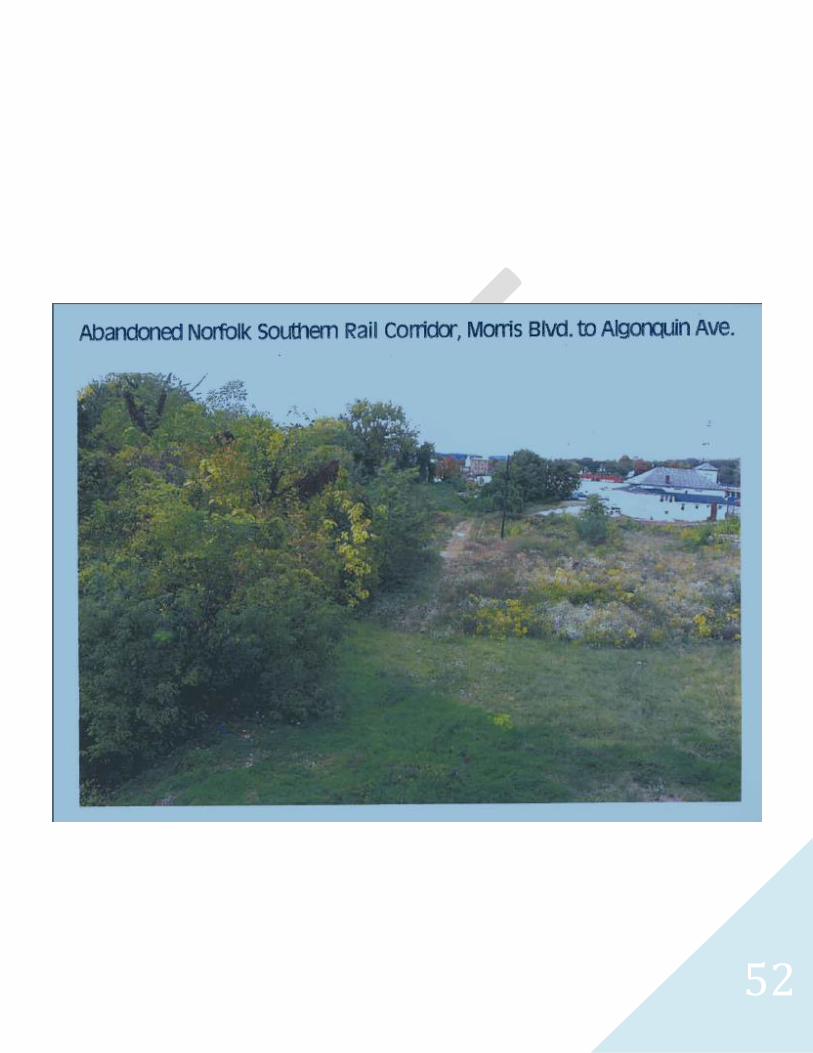
Insert B1 and B2 greenway pictures Type C Greenways are new multipurpose greenway, away from existing roadways. These areas include:
Abandoned Norfolk Southern rail corridor (runs north-south from Morris Boulevard to Algonquin Avenue)
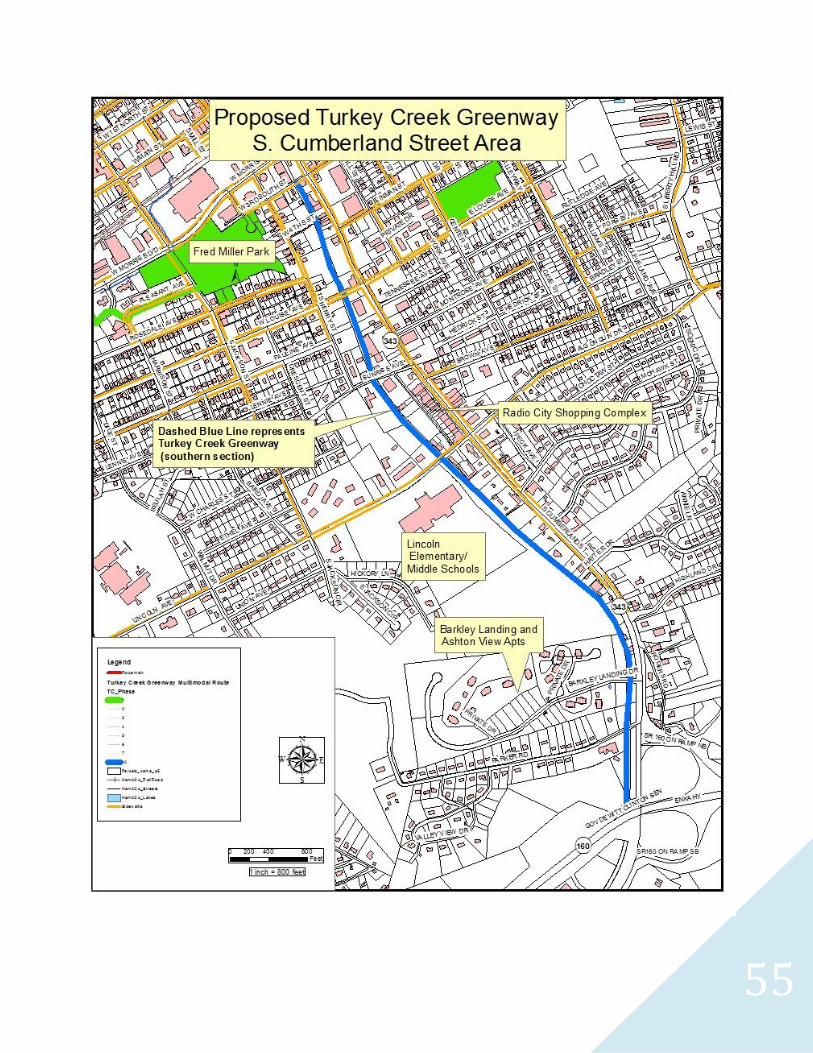
In the South Cumberland Street area, it is recommended that the greenway trail run from SR Highway 160 towards SR 11E/Morris Boulevard, with a connection heading westward to Fred Miller Park. The greenway would be a multimodal path that would follow the existing old abandoned railroad right-of-way (ROW) and/or existing sewer-line easements. This trail can then be connected to the existing sidewalk system. It should be noted that sections of the railroad right-of-way had been acquired by the adjacent property owners; thus, additional deed research and land surveying will be needed to determine the exact location of the greenway trail.
51
52
53
54
55
56
Appendix G – Citizen Input
In order to better gauge the needs of the South Cumberland Street area, the Planning Department held a series of public meetings. Meetings were held July 22, August 26, September 23, and October 28, 2014. The purpose of these meetings was to explain the ongoing façade grant program to business owners in that area as well as to gain greater input as to the needs and potential opportunities for this area. Several recommendations and suggestions were made by members of the public, drawing attention to a number of current weaknesses. Most concerns centered on safety hazards, particularly for pedestrians. The South Cumberland Street area has few sidewalks; most current sidewalks are located at major intersections near Morris Boulevard and Lincoln Avenue. As a result, many pedestrians who traverse the area walk along curbing and in parking lots, causing additional safety concern. The lack of usable sidewalk inhibits pedestrian travel in this area. Another safety concern of note is a lack of sufficient lighting. Many citizens expressed worry regarding crime and felt that increased lighting would help to mitigate some of the vagrancy and vandalism that has been prevalent in and around the Radio Center shopping center. Some property owners have added exterior lighting to the rear facades of their structures, which, according to them, has curtailed some of this type of activity. It is their hope that additional and better placed lighting would make patrons feel safer, increasing economic activity along this gateway district. Some citizens indicated deteriorating road and sidewalk conditions as well as insufficient parking as problems for this area. Most parking areas are quite small, indicating the era in which they were built. As many of these developments were constructed during the 1950s and 1960s, parking is limited and, in many instances, is not sufficient for both customers and employees. Even when additional off-site parking has been offered, it is often unused due to the aforementioned safety concerns (lack of sidewalks, insufficient lighting, etc.), which require greater pedestrian activity from these lots to the structures. In turn, many business and property owners believe that this lack of parking discourages business. In addition, many have expressed concerns regarding a lack of landscaping and “green space” within the South Cumberland Street area, particularly along the commercially-zoned strip of SR 343. Due to the orientation of the structures, the size of the parcels, and the building setbacks, often lots are paved from street curb to building. Many of these structures are fronted by parking lots and strips. The prevalence of concrete and asphalt paving has resulted in an industrialized environment that is perceived by many to be unsightly and unfriendly to business. “Greening” these paved areas aesthetically may invigorate the corridor, resulting in a more invigorating and verdant landscape. When taking these comments into consideration, it becomes apparent that the era in which this area has developed has made modern-day pedestrian travel and any effort to develop in the new urbanism pattern a struggle. Safety is also a concern of many doing business

57
along this corridor. Little lighting and landscaping makes the corridor seem bleak and unsafe, which has affected the types of businesses attracted to this area. Often, building setbacks are much closer to the road than what is allowable within today’s zoning ordinance, which places utility poles immediately adjacent to the roadway with little space for sidewalks and green space. This confined right of way poses a hazard to pedestrians and cyclists attempting to traverse this area.
58
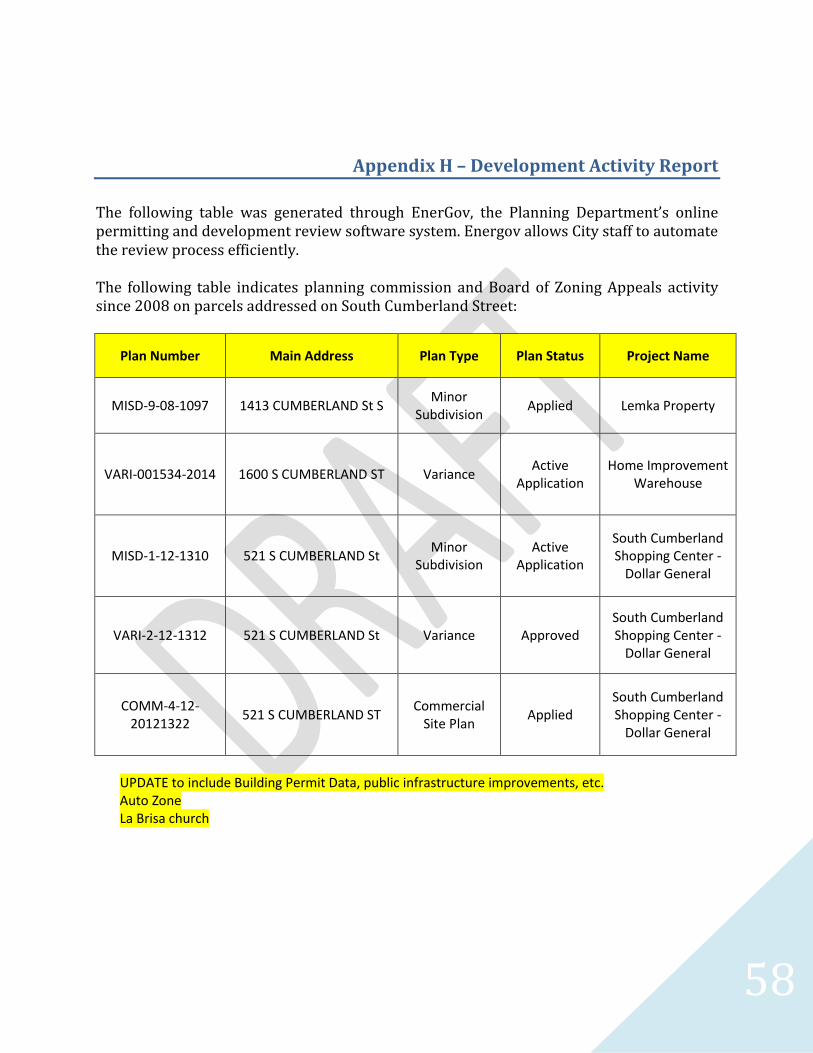
Appendix H – Development Activity Report
The following table was generated through EnerGov, the Planning Department’s online permitting and development review software system. Energov allows City staff to automate the review process efficiently. The following table indicates planning commission and Board of Zoning Appeals activity since 2008 on parcels addressed on South Cumberland Street:
Plan Number Main Address Plan Type Plan Status Project Name
MISD-9-08-1097 1413 CUMBERLAND St S Minor
Subdivision Applied Lemka Property
VARI-001534-2014 1600 S CUMBERLAND ST Variance Active
Application Home Improvement
Warehouse
MISD-1-12-1310 521 S CUMBERLAND St Minor
Subdivision Active
Application
South Cumberland Shopping Center -
Dollar General
VARI-2-12-1312 521 S CUMBERLAND St Variance Approved South Cumberland Shopping Center -
Dollar General
COMM-4-12-20121322
521 S CUMBERLAND ST Commercial
Site Plan Applied
South Cumberland Shopping Center -
Dollar General
UPDATE to include Building Permit Data, public infrastructure improvements, etc. Auto Zone La Brisa church
59
Appendix I – Community Appearance Action Plan
The Morristown Community Appearance Action Plan (CAAP) was initially developed in 2013 in order to identify practical, strategic ways to preserve and improve the community’s aesthetic appearance. The Action Plan was intended to serve as a workbook for elected officials, municipal advisory boards and staff, civic organizations, students, volunteers, and all citizens in addressing beautification issues within the city. Currently two committees have been formed to continue developing strategies and implementation of the CAAP. One of these is a staff committee, comprising of members of city administration, public works, community development and planning, codes enforcement, police, and fire. The second is an administrative advisory board comprised of various citizen leaders. These two groups are seeking to ensure that the Action Plan is implemented successfully. Seven topic areas were identified as important existing issues within the community. These
topic areas were prioritized in the following order:
1. Property Maintenance
2. Roadways
3. Attitudes
4. Curb Appeal
5. Downtown
6. Signage
7. Industry
As indicated in the findings and recommendations of the South Cumberland Street Corridor
Land Use Study, many of the CAAPs’ goals overlap, particularly in regard to property and
roadway maintenance as well as bolstering curb appeal.
Overlapping goals include:
Improving street lighting where needed
Engaging citizens in the plan process
Repairing damaged infrastructure, such as streets and sidewalks
Improving community directional signage
Enforcing temporary sign time limits and removal
Encouraging better sign practices on private property
Define and improve signage at major community entry points
60
Implement quality landscaping as a signage complement at major
community entry points
Expand greenway network
Plant trees along existing greenways and roads
Establish neighborhood associations
More information regarding the Community Appearance Action Plan and its subsequent
2014 report card can be obtained from the Planning Department.
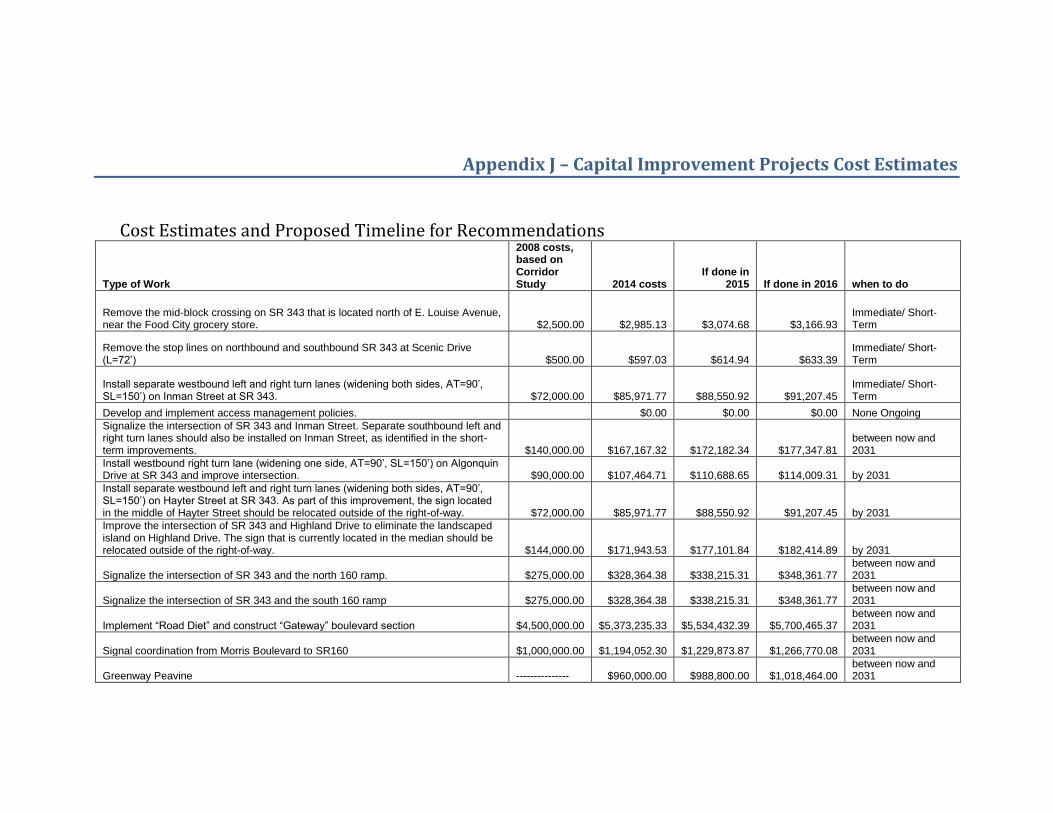
Appendix J – Capital Improvement Projects Cost Estimates
Cost Estimates and Proposed Timeline for Recommendations
Type of Work
2008 costs, based on Corridor Study 2014 costs
If done in 2015 If done in 2016 when to do
Remove the mid-block crossing on SR 343 that is located north of E. Louise Avenue, near the Food City grocery store. $2,500.00 $2,985.13 $3,074.68 $3,166.93
Immediate/ Short-Term
Remove the stop lines on northbound and southbound SR 343 at Scenic Drive (L=72’) $500.00 $597.03 $614.94 $633.39
Immediate/ Short-Term
Install separate westbound left and right turn lanes (widening both sides, AT=90’, SL=150’) on Inman Street at SR 343. $72,000.00 $85,971.77 $88,550.92 $91,207.45
Immediate/ Short-Term
Develop and implement access management policies. $0.00 $0.00 $0.00 None Ongoing
Signalize the intersection of SR 343 and Inman Street. Separate southbound left and right turn lanes should also be installed on Inman Street, as identified in the short-term improvements. $140,000.00 $167,167.32 $172,182.34 $177,347.81
between now and 2031
Install westbound right turn lane (widening one side, AT=90’, SL=150’) on Algonquin Drive at SR 343 and improve intersection. $90,000.00 $107,464.71 $110,688.65 $114,009.31 by 2031
Install separate westbound left and right turn lanes (widening both sides, AT=90’, SL=150’) on Hayter Street at SR 343. As part of this improvement, the sign located in the middle of Hayter Street should be relocated outside of the right-of-way. $72,000.00 $85,971.77 $88,550.92 $91,207.45 by 2031
Improve the intersection of SR 343 and Highland Drive to eliminate the landscaped island on Highland Drive. The sign that is currently located in the median should be relocated outside of the right-of-way. $144,000.00 $171,943.53 $177,101.84 $182,414.89 by 2031
Signalize the intersection of SR 343 and the north 160 ramp. $275,000.00 $328,364.38 $338,215.31 $348,361.77 between now and 2031
Signalize the intersection of SR 343 and the south 160 ramp $275,000.00 $328,364.38 $338,215.31 $348,361.77 between now and 2031
Implement “Road Diet” and construct “Gateway” boulevard section $4,500,000.00 $5,373,235.33 $5,534,432.39 $5,700,465.37 between now and 2031
Signal coordination from Morris Boulevard to SR160 $1,000,000.00 $1,194,052.30 $1,229,873.87 $1,266,770.08 between now and 2031
Greenway Peavine --------------- $960,000.00 $988,800.00 $1,018,464.00 between now and 2031
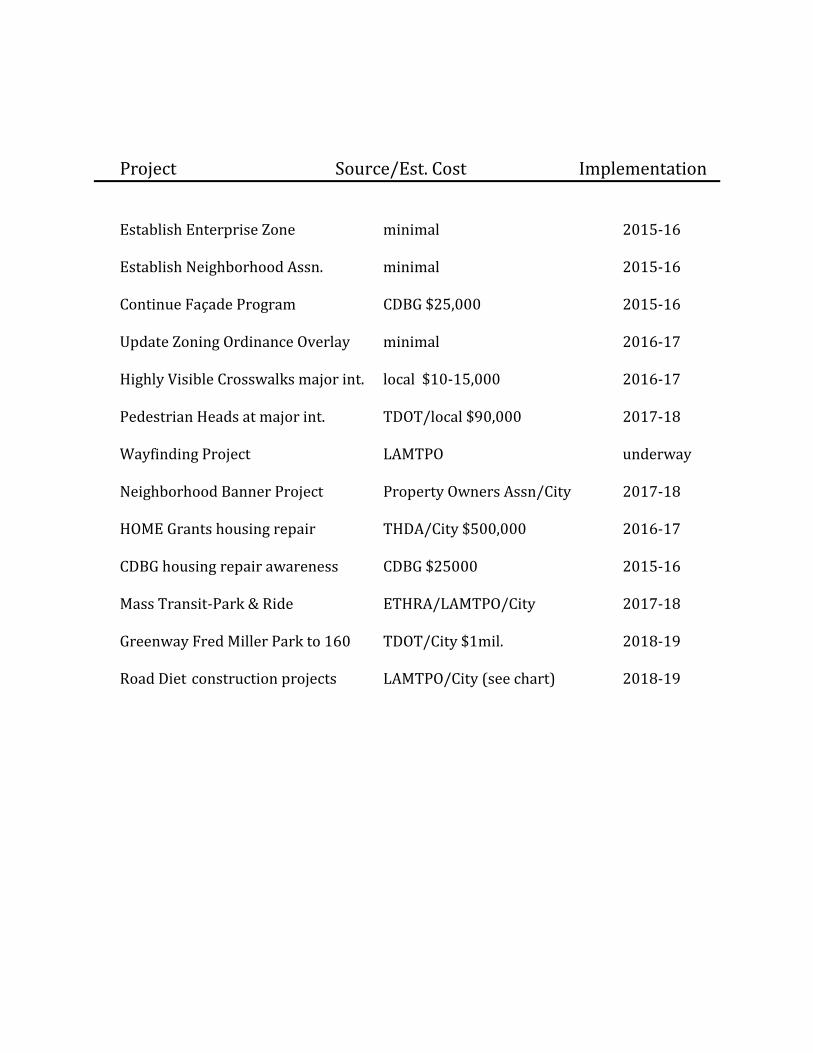
Project Source/Est. Cost Implementation Establish Enterprise Zone minimal 2015-16 Establish Neighborhood Assn. minimal 2015-16 Continue Façade Program CDBG $25,000 2015-16 Update Zoning Ordinance Overlay minimal 2016-17 Highly Visible Crosswalks major int. local $10-15,000 2016-17 Pedestrian Heads at major int. TDOT/local $90,000 2017-18 Wayfinding Project LAMTPO underway Neighborhood Banner Project Property Owners Assn/City 2017-18 HOME Grants housing repair THDA/City $500,000 2016-17 CDBG housing repair awareness CDBG $25000 2015-16 Mass Transit-Park & Ride ETHRA/LAMTPO/City 2017-18 Greenway Fred Miller Park to 160 TDOT/City $1mil. 2018-19 Road Diet construction projects LAMTPO/City (see chart) 2018-19
2
Appendix K – Disclaimer Statement
Disclaimer Statement
The maps, charts, images, and associated data included in this document have been compiled by the Morristown Planning Department for this study only. The City of Morristown in no way accepts liability or responsibility for any damages which may result from the improper interpretation or use of the information contained herein.
3
Appendix L – Severance Statement
Severance Statement
The maps, charts, images and associated data included in this document have been compiled by the Morristown Planning Department for this study only. The information herein should preclude any adopted plan for the land use within the study area. This study is advisory in nature. It in no means replaces any adopted ordinance for regulating the use of land either currently in effect or adopted in the future.
4
References
http://www.nationalgeographic.com/lewisandclark/ http://ers.usda.gov/FoodAtlas/ New Urbanism Transect Modeling Central Place Theory Sector Modeling Homer Hoyt Wilbur Smith Study Ambition 2030 Eisner, Gallion and Eisnor, The Urban Pattern, Sixth Ed. 1993, Van Nostrand Reinhold, New York, NY
http://www.tngis.org/tn_huc_12_metadata.html General Soil Map, Hamblen County, Tennessee, July 1978 Templeton and Spencer, 1980, 6 Debuchananne and Richardson, 1956, 177 Wilson, 1982, 28 Fetter, 1988, 314 Incomplete