Embed Size (px)
Citation preview
SOUTH CAROLINA SCHOOL BOARDS
ASSOCIATIONDecember 3, 2016
Sonesta HotelHilton Head Island
Presentation Outline
■ Demographics
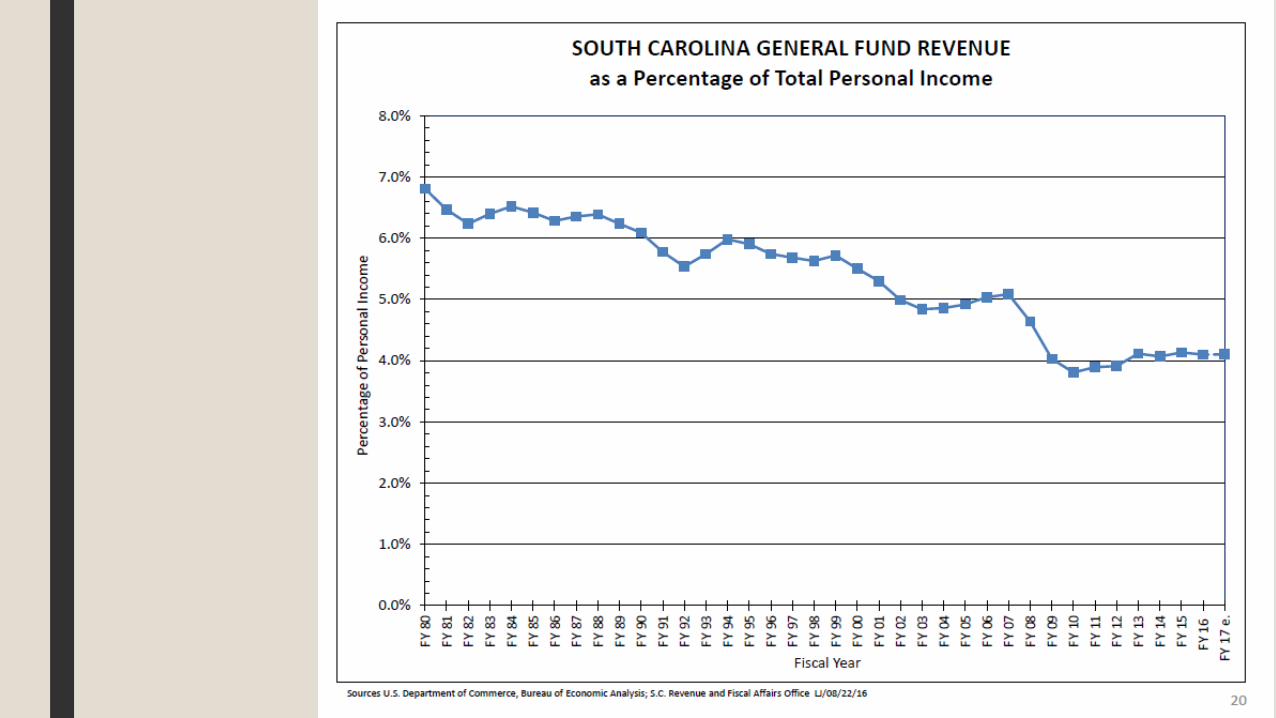
■ Total Personal Income and General Fund Revenue
■ Fiscal Year 2015-16 Close Out
■ Transportation Infrastructure Funding
■ Public Education, EFA & Abbeville Lawsuit
■ Pensions
■ Fiscal Year 2017-18 Budget Outlook
2

DEMOGRAPHICS
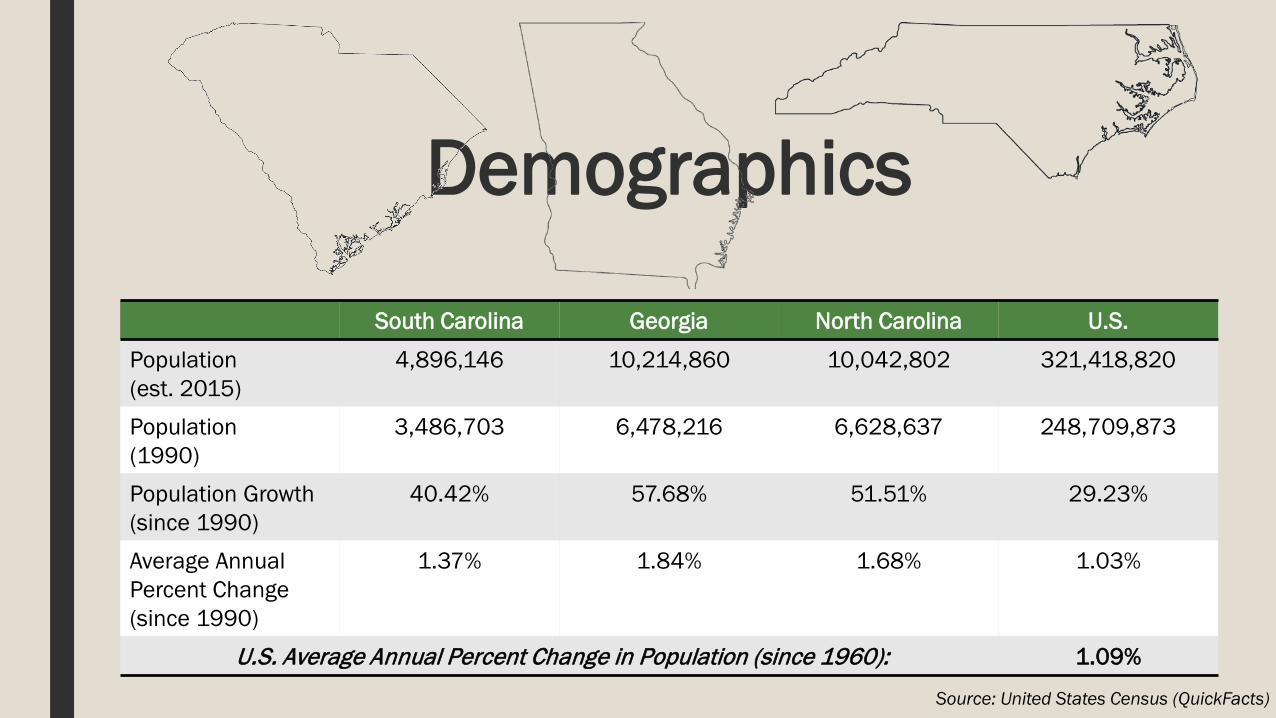
Demographics
South Carolina Georgia North Carolina U.S.
Population(est. 2015)
4,896,146 10,214,860 10,042,802 321,418,820
Population(1990)
3,486,703 6,478,216 6,628,637 248,709,873
Population Growth (since 1990)
40.42% 57.68% 51.51% 29.23%
Average Annual Percent Change(since 1990)
1.37% 1.84% 1.68% 1.03%
U.S. Average Annual Percent Change in Population (since 1960): 1.09%
Source: United States Census (QuickFacts)
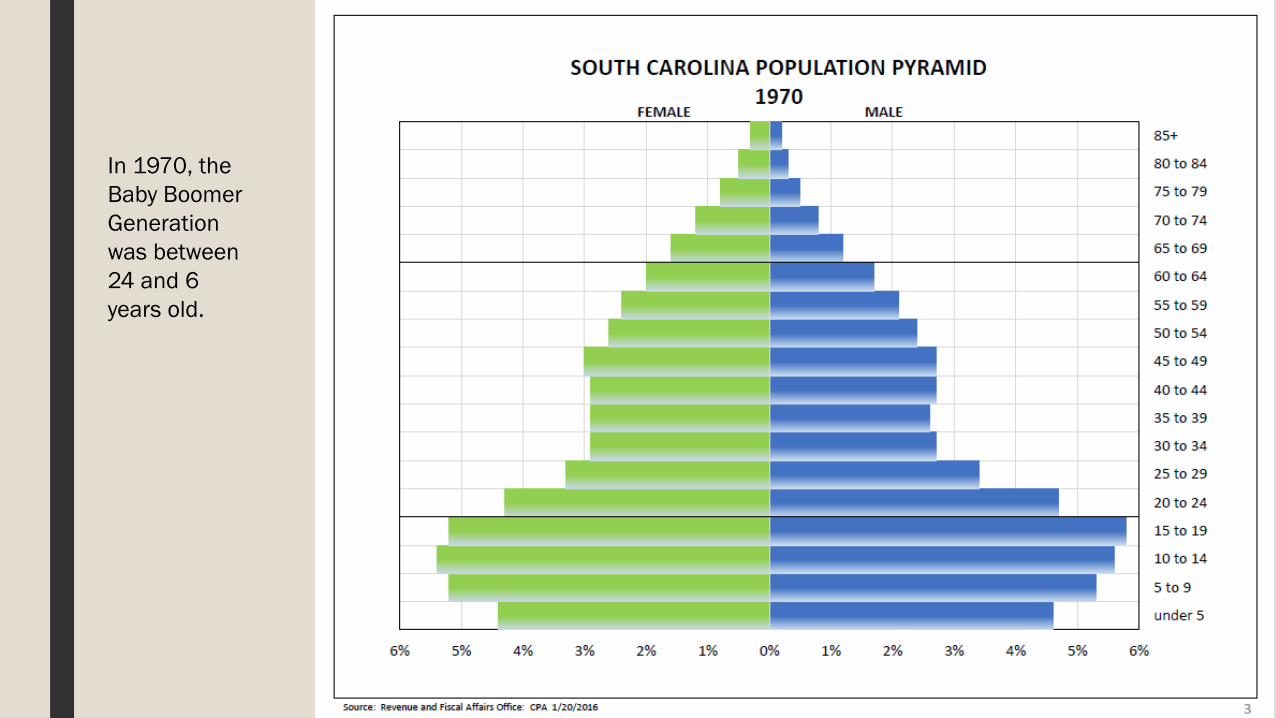
In 1970, the Baby Boomer Generation was between 24 and 6 years old.
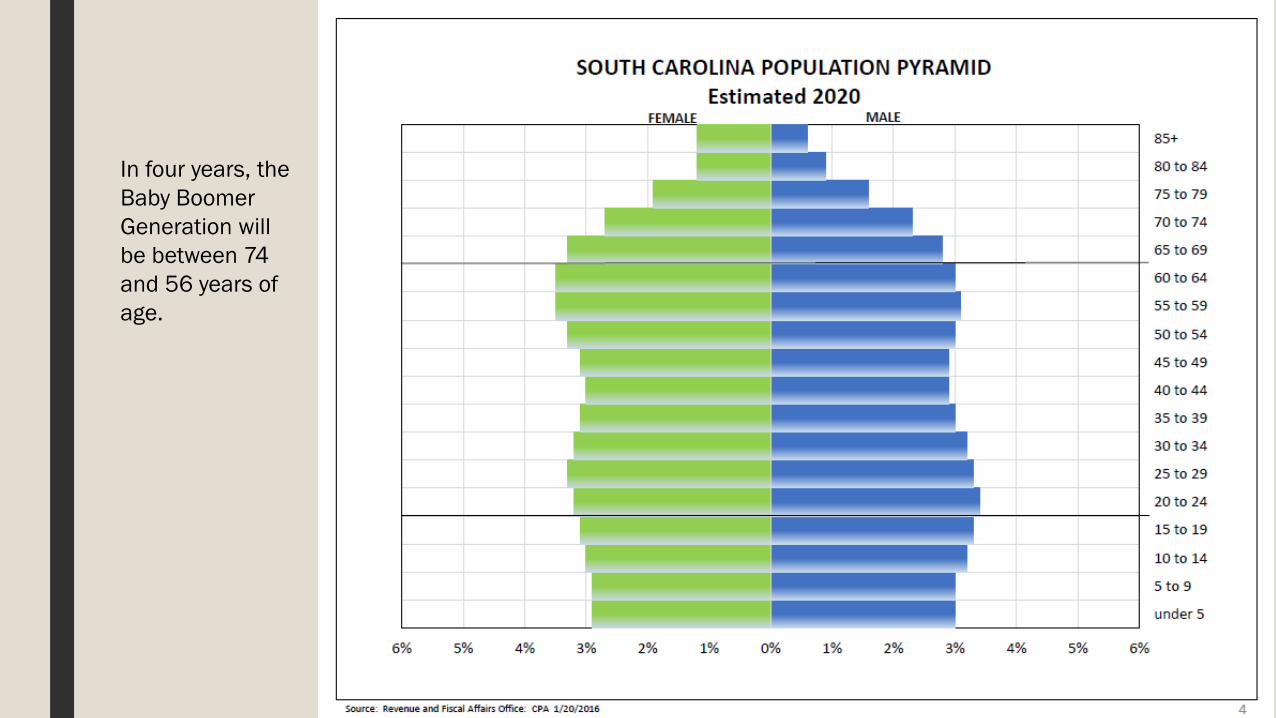
In four years, the Baby Boomer Generation will be between 74 and 56 years of age.
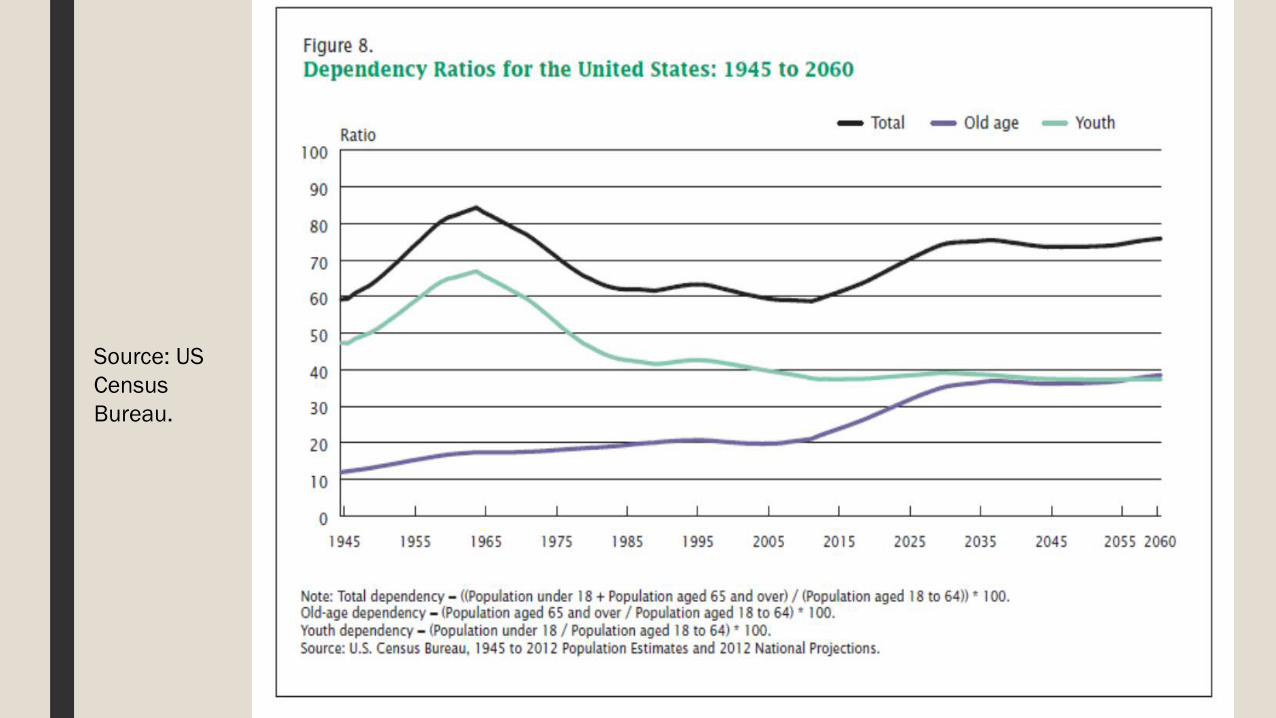
Source: US Census Bureau.
WAPO, Samuelson - Are Aging and the Economic Slowdown Linked? August 22, 2016
■ We’ve known for decades, of course, that the retirement of the huge baby-boom generation — coupled with low birthrates — would make the United States an older society. Similarly, we’ve known that this would squeeze the federal budget. Social Security and Medicare spending would grow rapidly, intensifying pressures to cut other programs, raise taxes or accept large budget deficits. All this has come to pass.
■ But the study goes a giant step further, (co-authored by economists Nicole Maestas of Harvard Medical School and Kathleen Mullen and David Powell of the Rand Corp.) claiming that the very fact that the United States is an aging society weakens economic growth. “The fraction of the United States population age 60 or over will increase by 21 percent between 2010 and 2020,” says the study. This aging shaves 1.2 percentage points off the economy’s present annual growth rate, the study estimates.
8
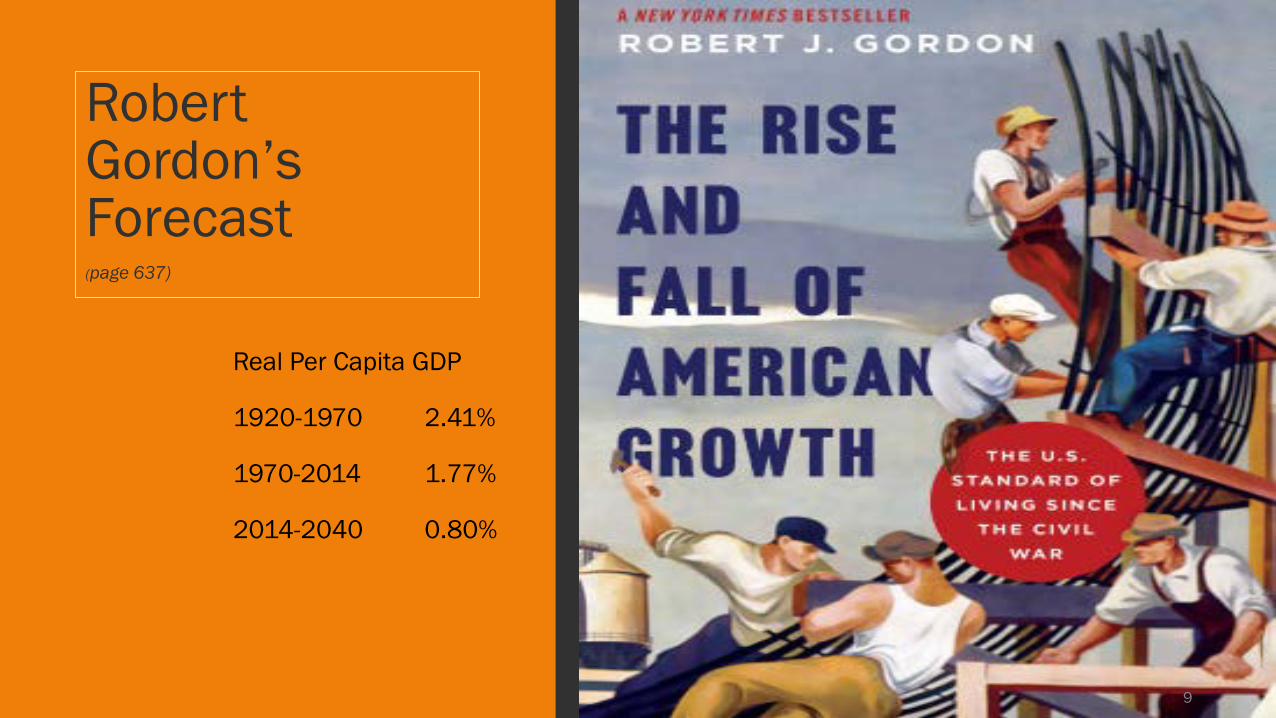
Robert Gordon’s Forecast(page 637)
Real Per Capita GDP
1920-1970 2.41%
1970-2014 1.77%
2014-2040 0.80%
9
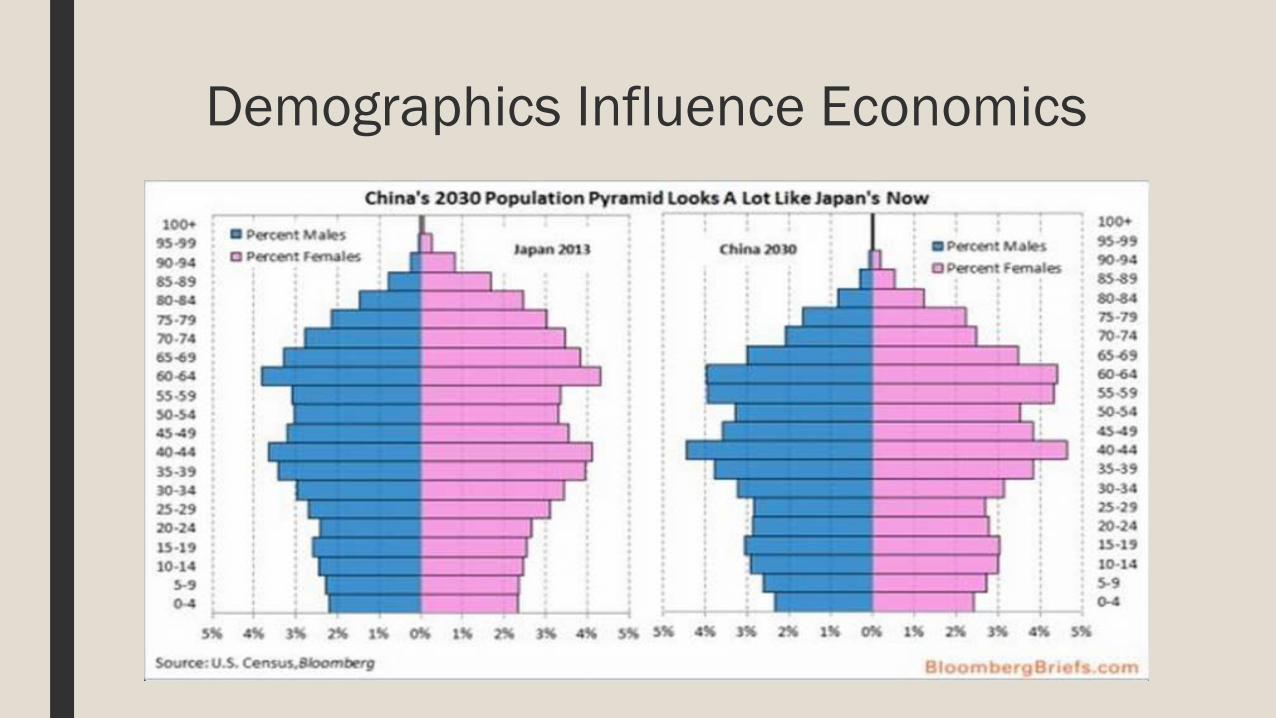
Demographics Influence Economics

“Demography is
destiny.”
This quote is generally attributed to the French sociologist Auguste Comte (1798-1857).
Google “Disruptive Demographics” by Dr. Jim Johnson of UNC-CH.
TOTAL PERSONAL INCOME & GENERAL
FUND REVENUE
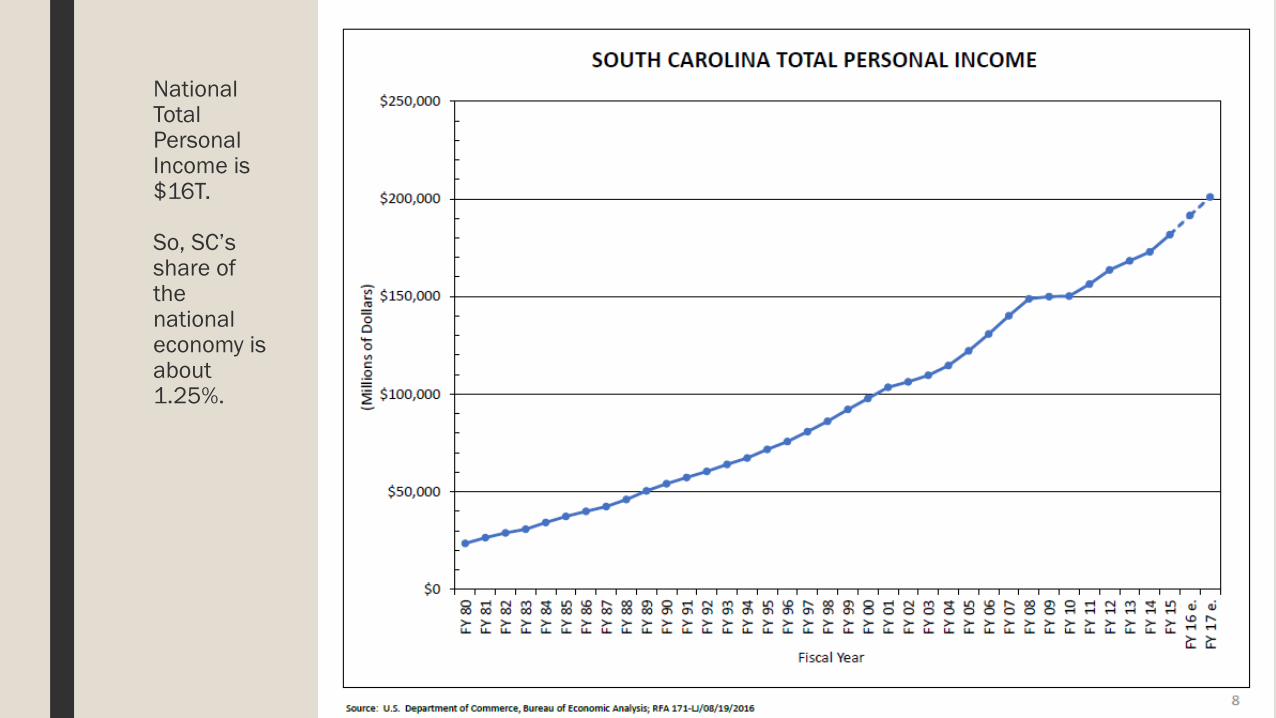
National Total Personal Income is $16T.
So, SC’s share of the national economy is about 1.25%.
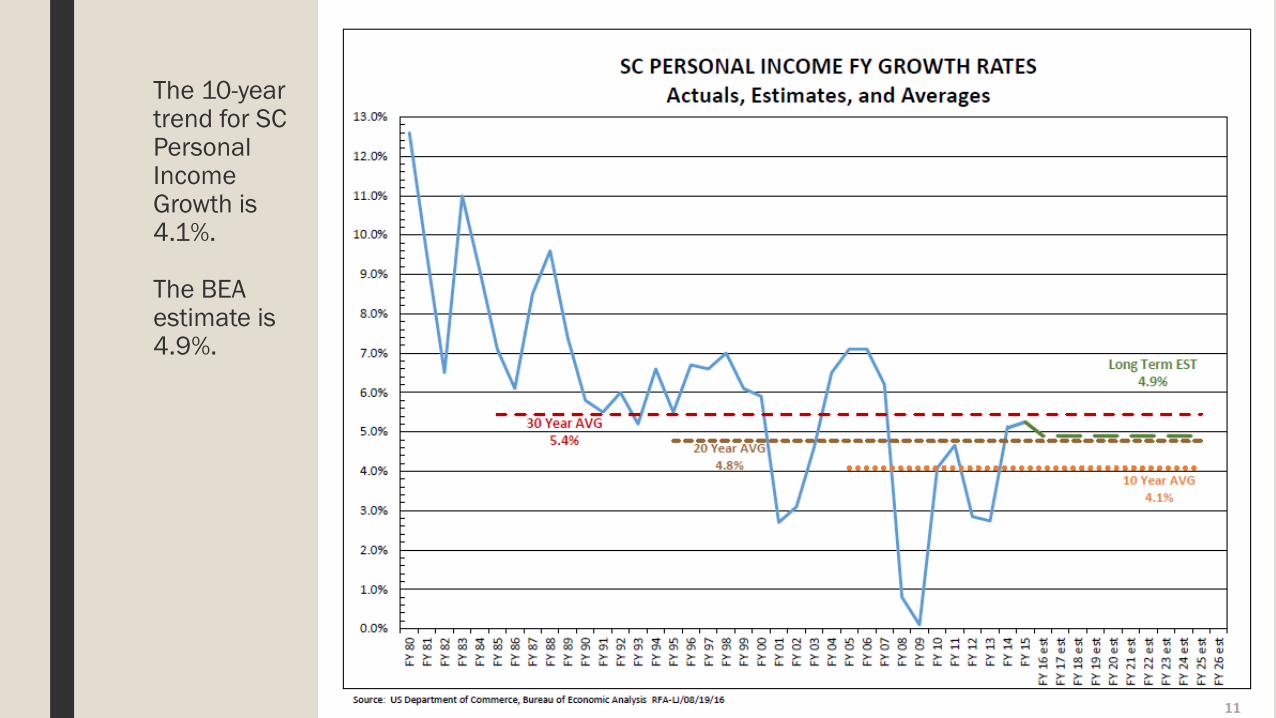
The 10-year trend for SC Personal Income Growth is 4.1%.
The BEA estimate is 4.9%.
15
0
1,000,000,000
2,000,000,000
3,000,000,000
4,000,000,000
5,000,000,000
6,000,000,000
7,000,000,000
8,000,000,000
9,000,000,000
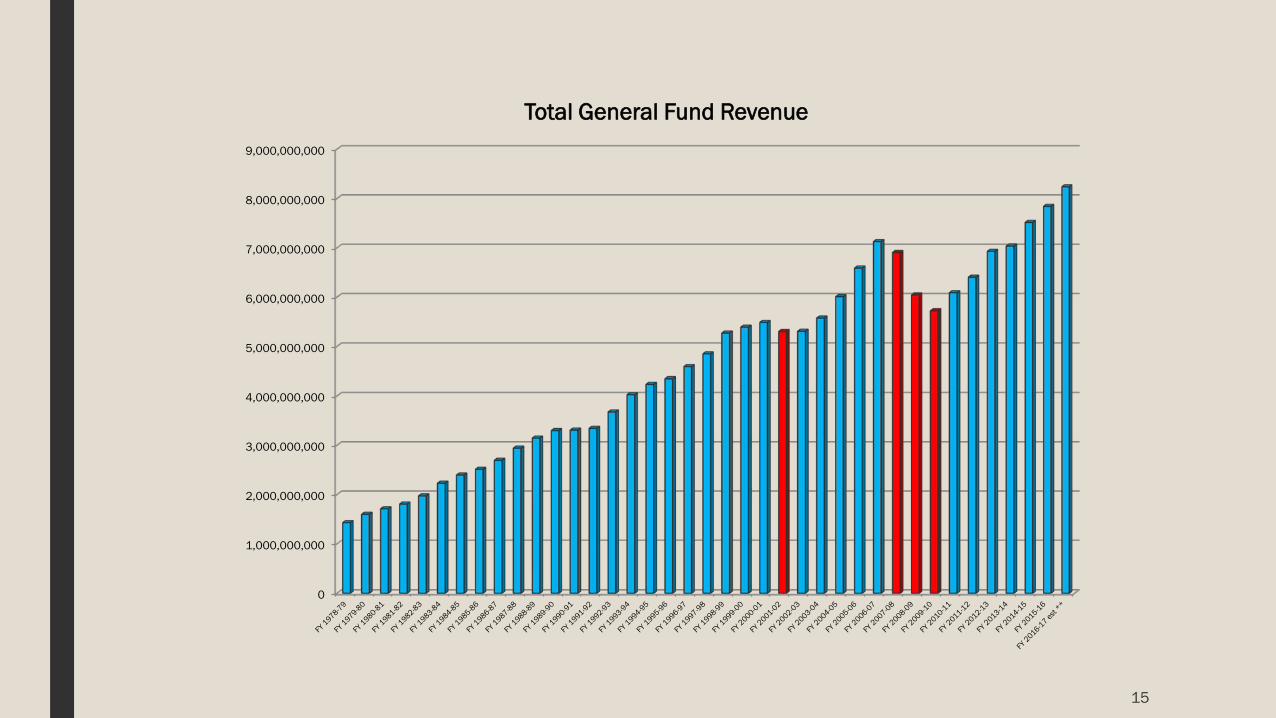
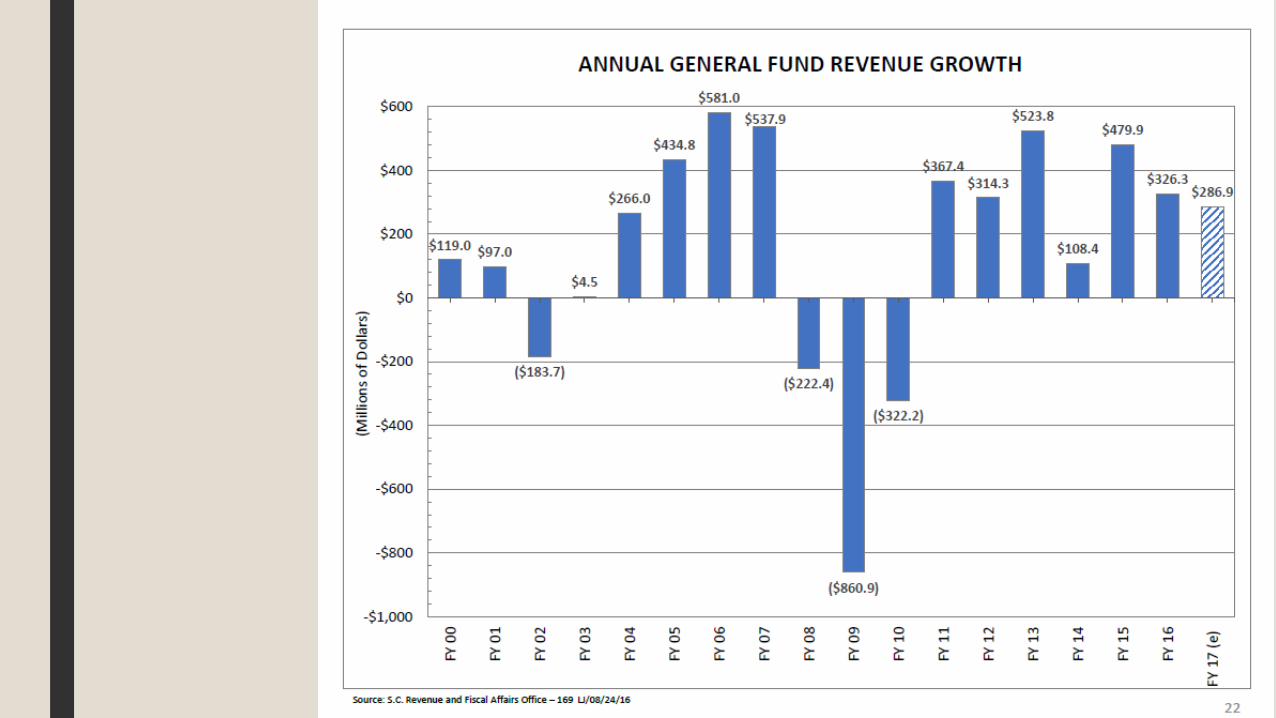
Total General Fund Revenue

FISCAL YEAR 2015-16 FINANCIAL CLOSE-OUT
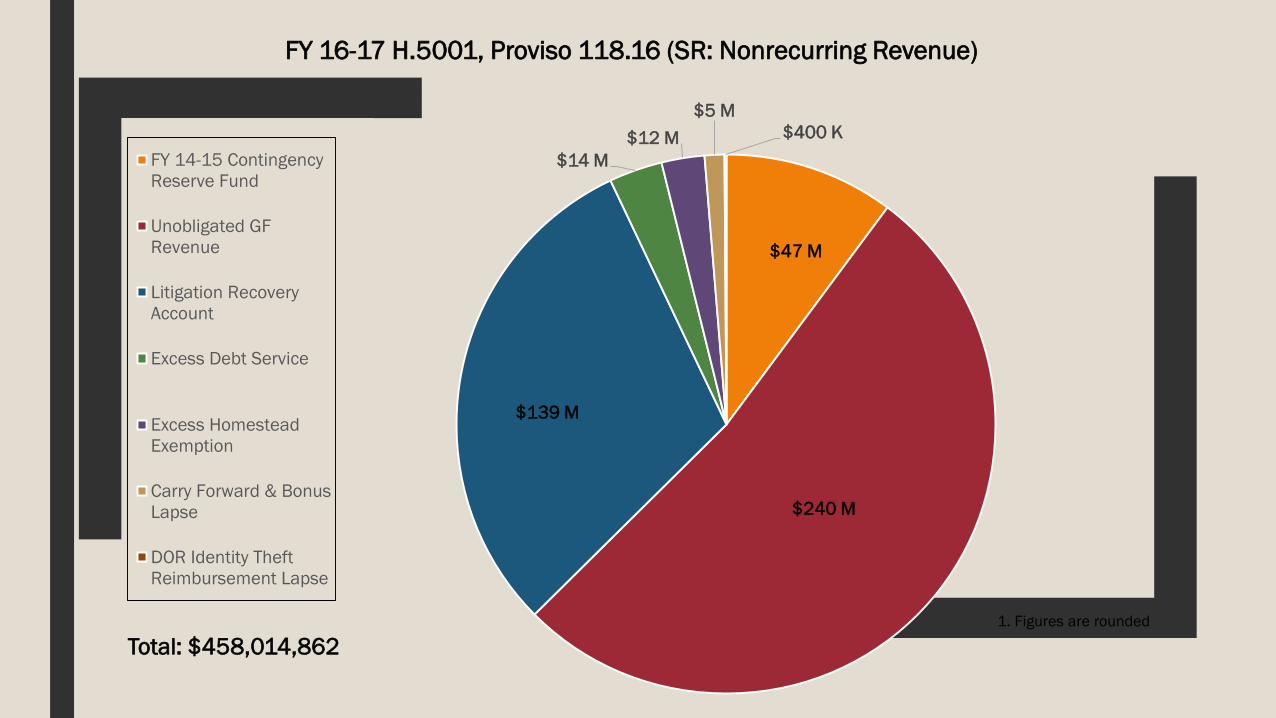
$14 M$12 M
$5 M$400 K
FY 14-15 ContingencyReserve Fund
Unobligated GFRevenue
Litigation RecoveryAccount
Excess Debt Service
Excess HomesteadExemption
Carry Forward & BonusLapse
DOR Identity TheftReimbursement Lapse
$240 M
$139 M
$47 M
Total: $458,014,862
FY 16-17 H.5001, Proviso 118.16 (SR: Nonrecurring Revenue)
1. Figures are rounded
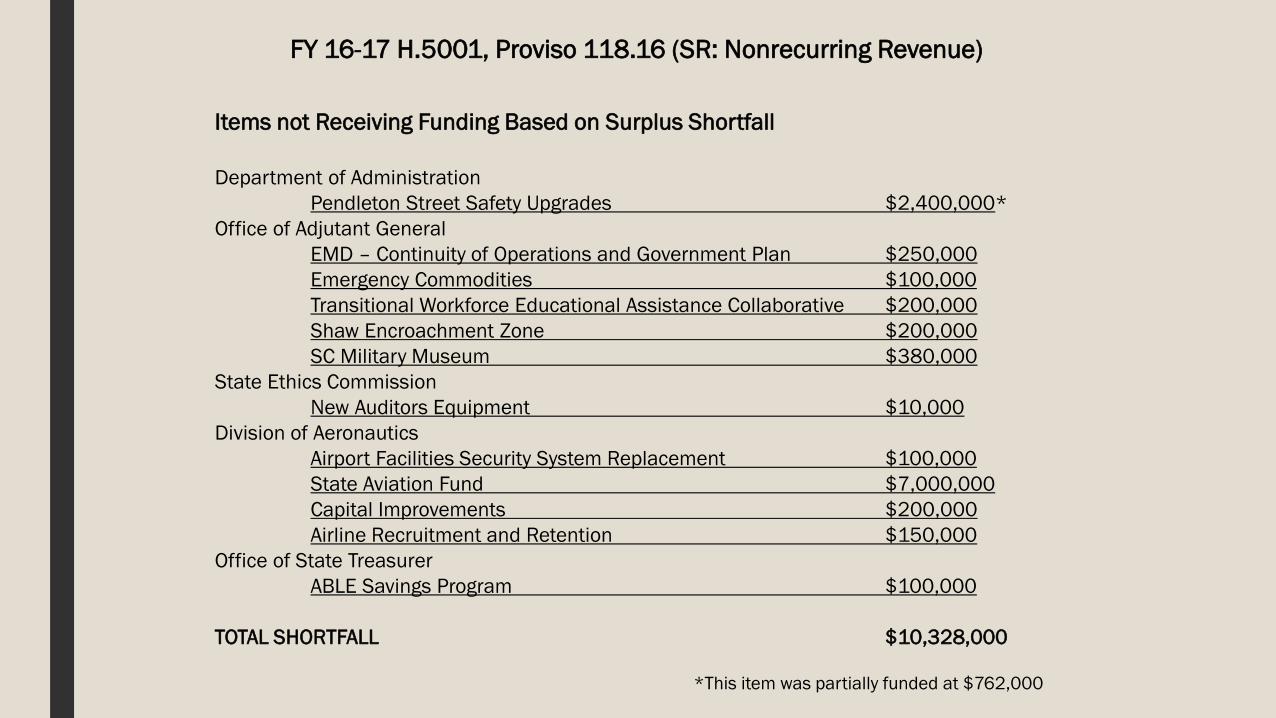
FY 16-17 H.5001, Proviso 118.16 (SR: Nonrecurring Revenue)
Items not Receiving Funding Based on Surplus Shortfall
Department of AdministrationPendleton Street Safety Upgrades $2,400,000*
Office of Adjutant GeneralEMD – Continuity of Operations and Government Plan $250,000Emergency Commodities $100,000Transitional Workforce Educational Assistance Collaborative $200,000Shaw Encroachment Zone $200,000SC Military Museum $380,000
State Ethics CommissionNew Auditors Equipment $10,000
Division of AeronauticsAirport Facilities Security System Replacement $100,000State Aviation Fund $7,000,000Capital Improvements $200,000Airline Recruitment and Retention $150,000
Office of State TreasurerABLE Savings Program $100,000
TOTAL SHORTFALL $10,328,000
*This item was partially funded at $762,000
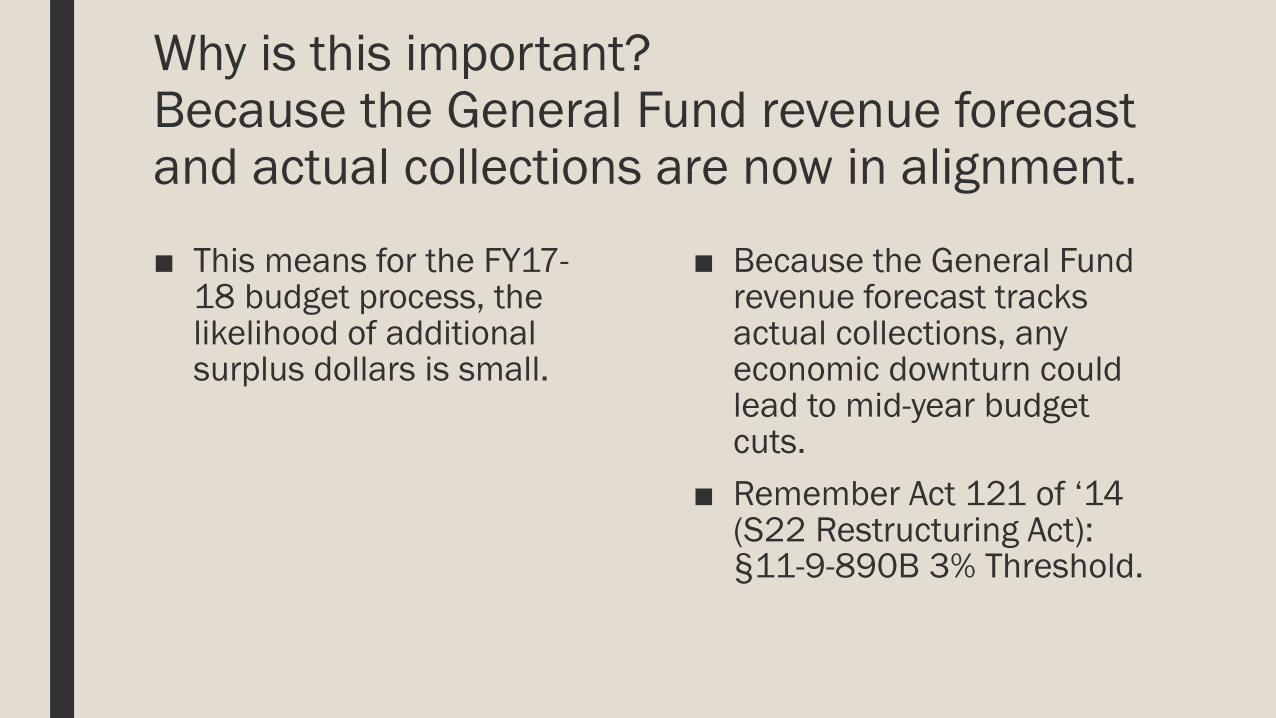
Why is this important?Because the General Fund revenue forecast and actual collections are now in alignment.
■ This means for the FY17-18 budget process, the likelihood of additional surplus dollars is small.
■ Because the General Fund revenue forecast tracks actual collections, any economic downturn could lead to mid-year budget cuts.
■ Remember Act 121 of ‘14 (S22 Restructuring Act): §11-9-890B 3% Threshold.
TRANSPORTATION INFRASTRUCTURE
FUNDING
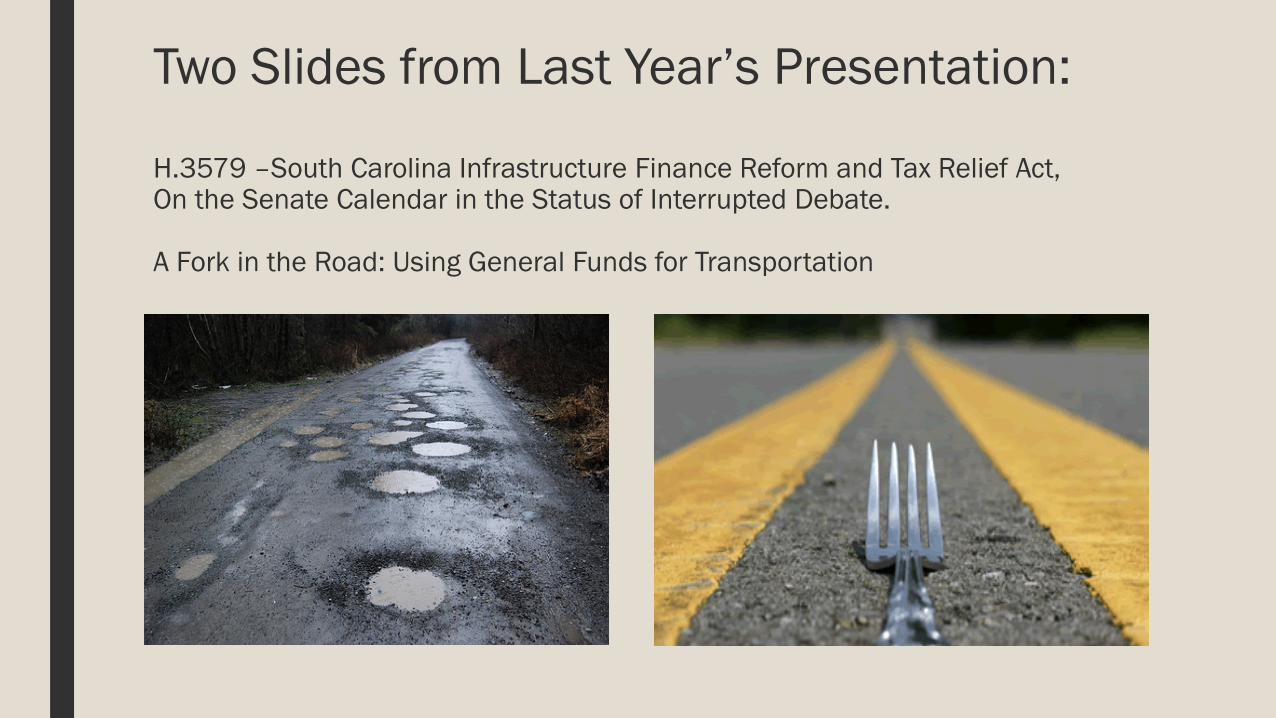
Two Slides from Last Year’s Presentation:
H.3579 –South Carolina Infrastructure Finance Reform and Tax Relief Act,On the Senate Calendar in the Status of Interrupted Debate.
A Fork in the Road: Using General Funds for Transportation
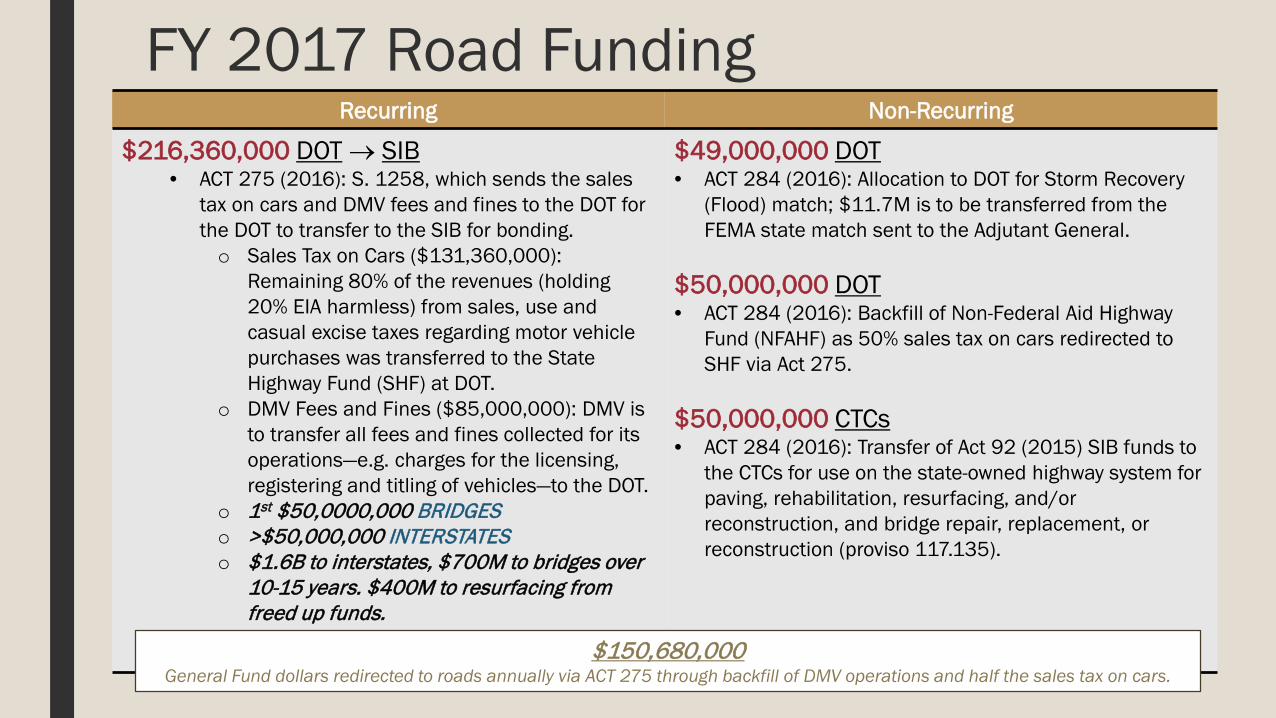
FY 2017 Road FundingRecurring Non-Recurring
$216,360,000 DOT → SIB• ACT 275 (2016): S. 1258, which sends the sales
tax on cars and DMV fees and fines to the DOT for the DOT to transfer to the SIB for bonding. o Sales Tax on Cars ($131,360,000):
Remaining 80% of the revenues (holding20% EIA harmless) from sales, use and casual excise taxes regarding motor vehicle purchases was transferred to the StateHighway Fund (SHF) at DOT.
o DMV Fees and Fines ($85,000,000): DMV is to transfer all fees and fines collected for its operations—e.g. charges for the licensing, registering and titling of vehicles—to the DOT.
o 1st $50,0000,000 BRIDGESo >$50,000,000 INTERSTATESo $1.6B to interstates, $700M to bridges over
10-15 years. $400M to resurfacing from freed up funds.
$49,000,000 DOT• ACT 284 (2016): Allocation to DOT for Storm Recovery
(Flood) match; $11.7M is to be transferred from the FEMA state match sent to the Adjutant General.
$50,000,000 DOT• ACT 284 (2016): Backfill of Non-Federal Aid Highway
Fund (NFAHF) as 50% sales tax on cars redirected to SHF via Act 275.
$50,000,000 CTCs• ACT 284 (2016): Transfer of Act 92 (2015) SIB funds to
the CTCs for use on the state-owned highway system for paving, rehabilitation, resurfacing, and/or reconstruction, and bridge repair, replacement, or reconstruction (proviso 117.135).
$150,680,000 General Fund dollars redirected to roads annually via ACT 275 through backfill of DMV operations and half the sales tax on cars.
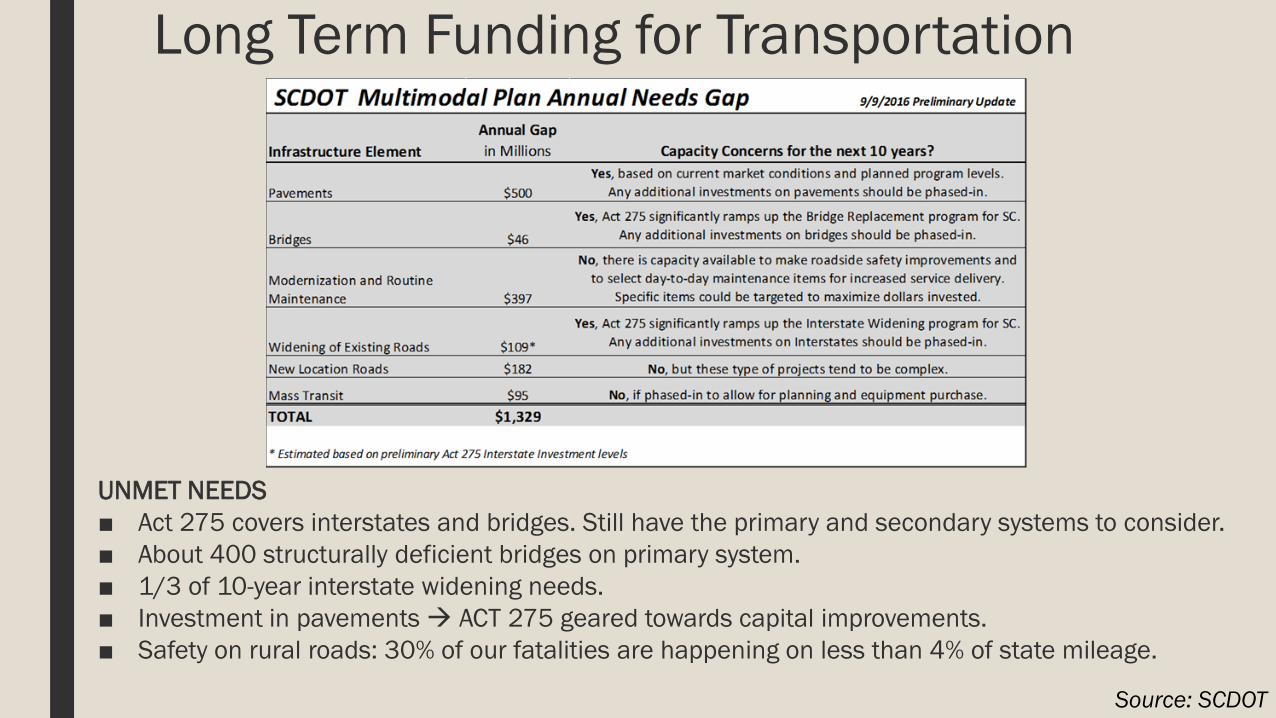
Long Term Funding for Transportation
UNMET NEEDS■ Act 275 covers interstates and bridges. Still have the primary and secondary systems to consider. ■ About 400 structurally deficient bridges on primary system.■ 1/3 of 10-year interstate widening needs. ■ Investment in pavements ACT 275 geared towards capital improvements.■ Safety on rural roads: 30% of our fatalities are happening on less than 4% of state mileage.
Source: SCDOT
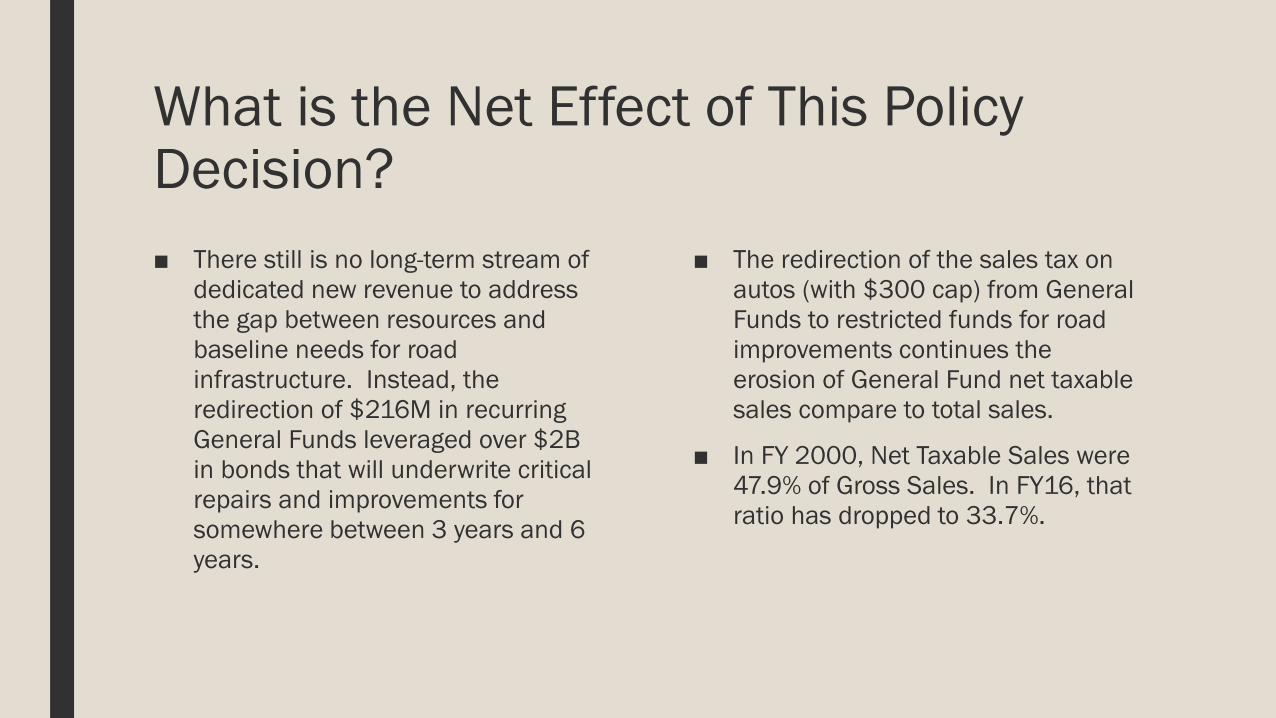
What is the Net Effect of This Policy Decision?■ There still is no long-term stream of
dedicated new revenue to address the gap between resources and baseline needs for road infrastructure. Instead, the redirection of $216M in recurring General Funds leveraged over $2Bin bonds that will underwrite critical repairs and improvements for somewhere between 3 years and 6 years.
■ The redirection of the sales tax on autos (with $300 cap) from General Funds to restricted funds for road improvements continues the erosion of General Fund net taxable sales compare to total sales.
■ In FY 2000, Net Taxable Sales were 47.9% of Gross Sales. In FY16, that ratio has dropped to 33.7%.

PUBLIC EDUCATION, EFA AND ABBEVILLE
LAWSUIT
29
1,539
1,562
1,604
1,651
1,652
1,718
1,778
1,839
1,879
1,937
2,012
2,073
2,133
2,201
2,234
2,290
2,367
2,476
2,578
2,687
2,720
2,790
2,790
2,771
2,742
2,801
2,933
1,539
1,562
1,585
1,581
1,619
1,684
1,760
1,839
1,879
1,937
2,012
2,073
2,033
1,777
1,852
2,290
2,367
2,476
2,578
2,034
1,630
1,880
2,012
2,101
2,120
2,220
2,350
1,000
1,200
1,400
1,600
1,800
2,000
2,200
2,400
2,600
2,800
3,000
91 92 93 94 95 96 97 97 99 00 01 02 03 04 05 06 07 08 09 10 11 12 13 14 15 16 17
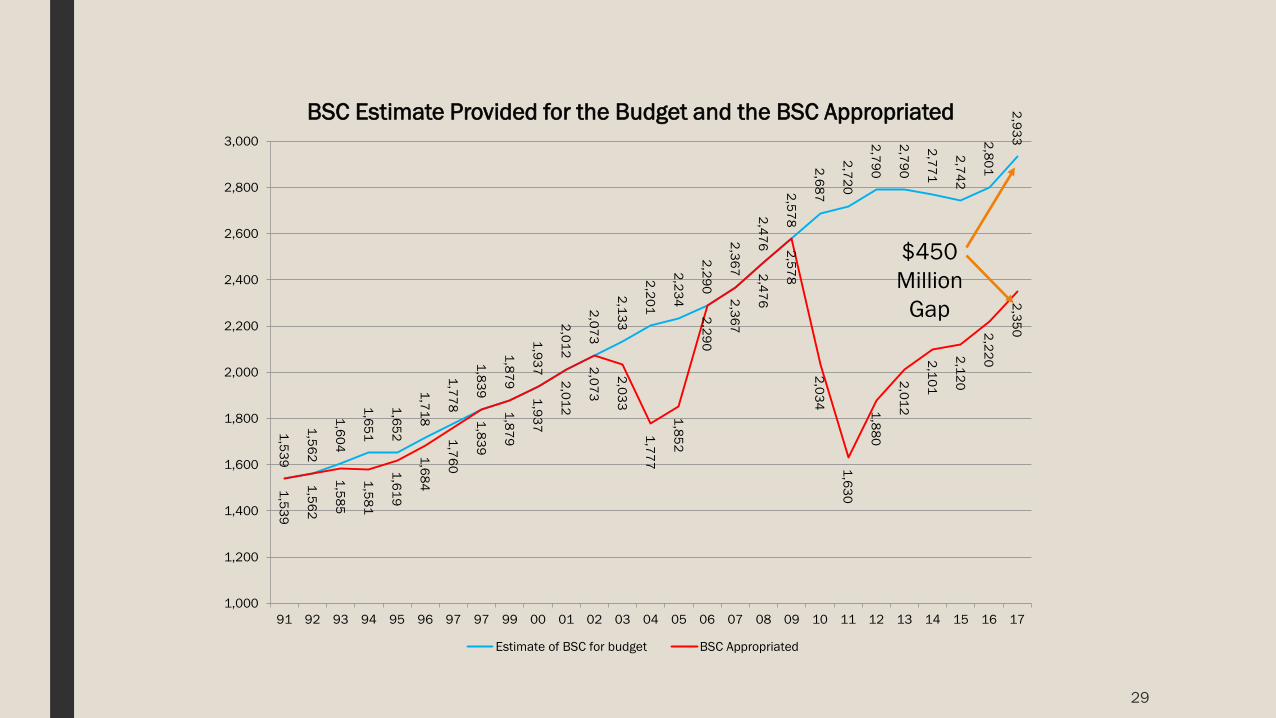
BSC Estimate Provided for the Budget and the BSC Appropriated
Estimate of BSC for budget BSC Appropriated
$450 Million
Gap
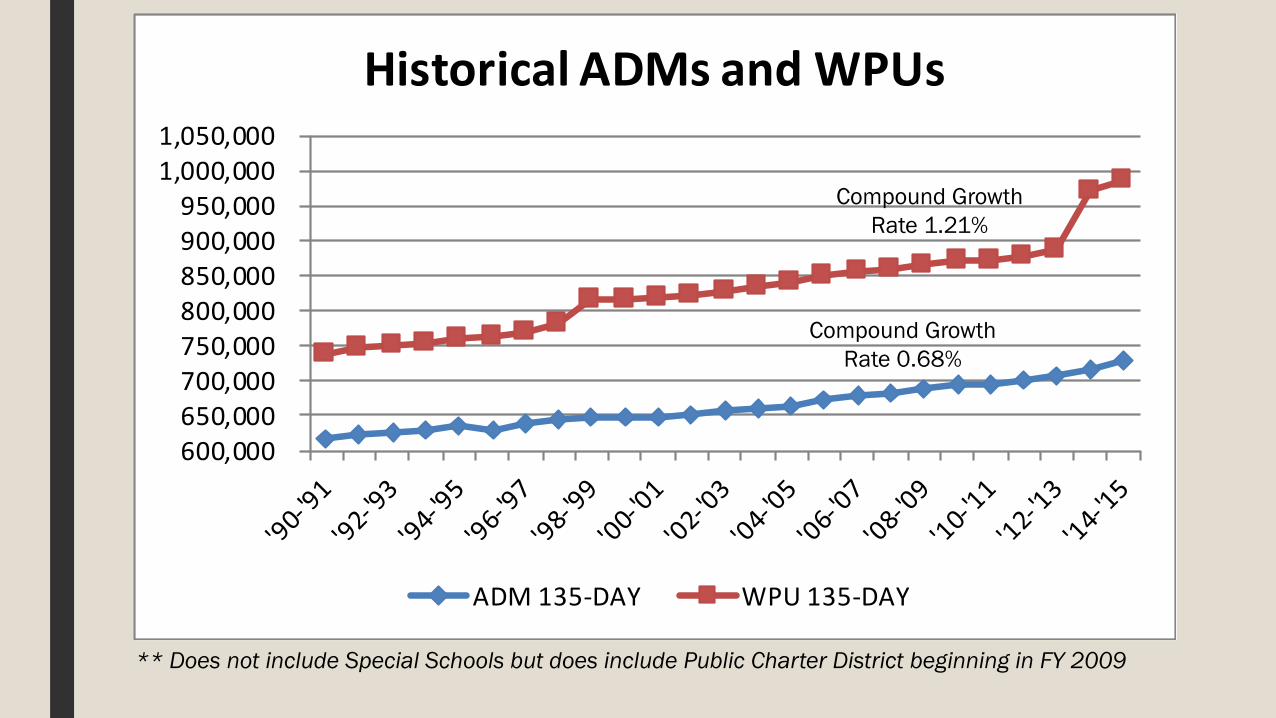
600,000 650,000 700,000 750,000 800,000 850,000 900,000 950,000
1,000,000 1,050,000
Historical ADMs and WPUs
ADM 135-DAY WPU 135-DAY
** Does not include Special Schools but does include Public Charter District beginning in FY 2009
Compound Growth Rate 1.21%
Compound Growth Rate 0.68%
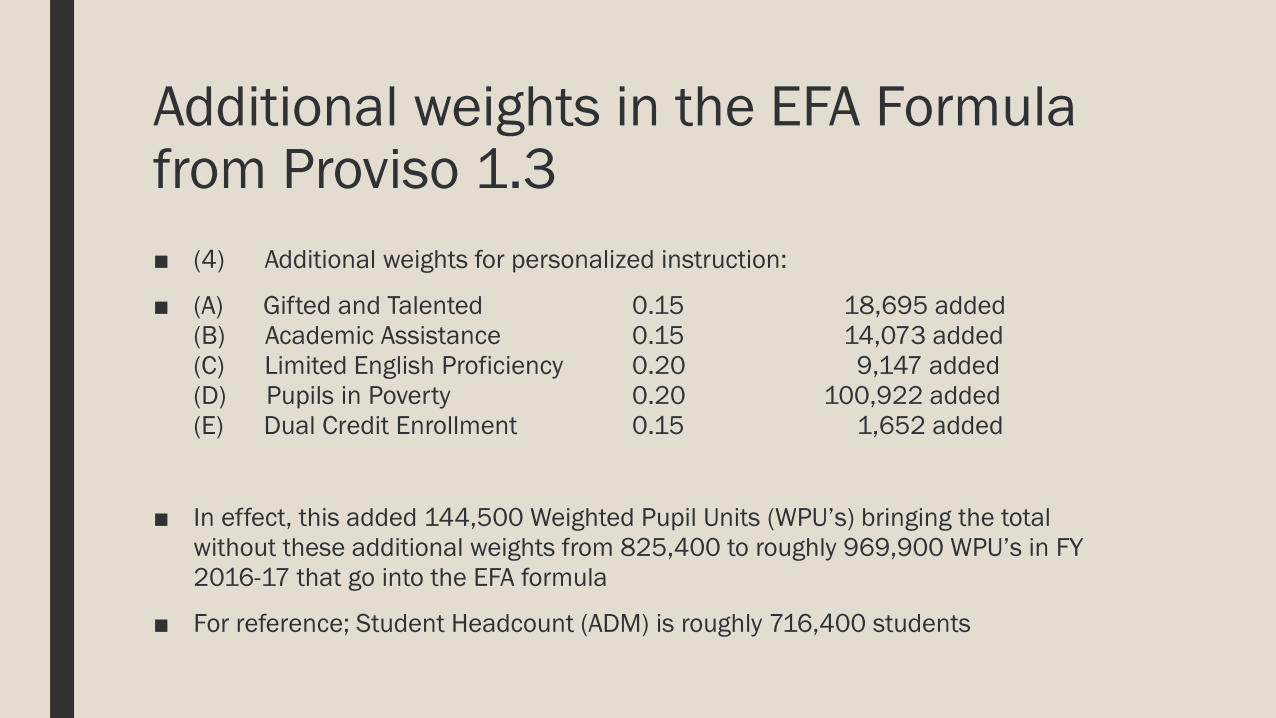
Additional weights in the EFA Formulafrom Proviso 1.3■ (4) Additional weights for personalized instruction:
■ (A) Gifted and Talented 0.15 18,695 added(B) Academic Assistance 0.15 14,073 added(C) Limited English Proficiency 0.20 9,147 added(D) Pupils in Poverty 0.20 100,922 added(E) Dual Credit Enrollment 0.15 1,652 added
■ In effect, this added 144,500 Weighted Pupil Units (WPU’s) bringing the total without these additional weights from 825,400 to roughly 969,900 WPU’s in FY 2016-17 that go into the EFA formula
■ For reference; Student Headcount (ADM) is roughly 716,400 students
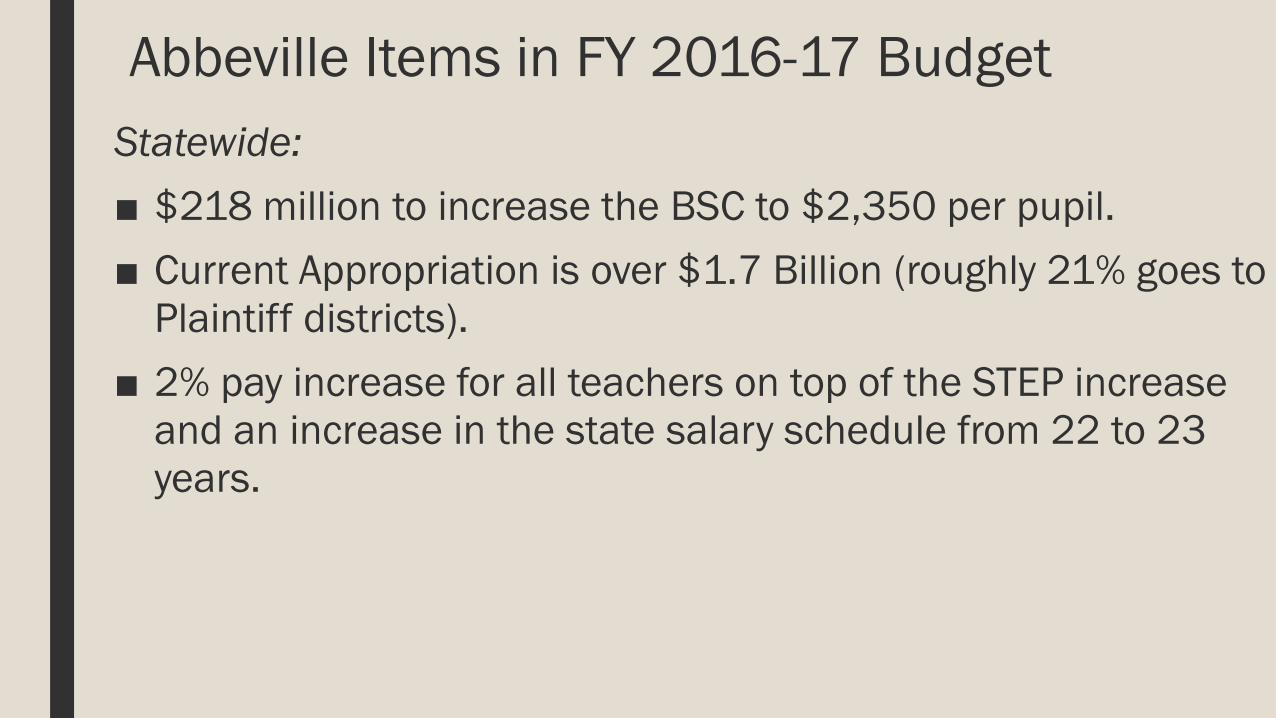
Abbeville Items in FY 2016-17 BudgetStatewide:■ $218 million to increase the BSC to $2,350 per pupil.■ Current Appropriation is over $1.7 Billion (roughly 21% goes to
Plaintiff districts).■ 2% pay increase for all teachers on top of the STEP increase
and an increase in the state salary schedule from 22 to 23 years.
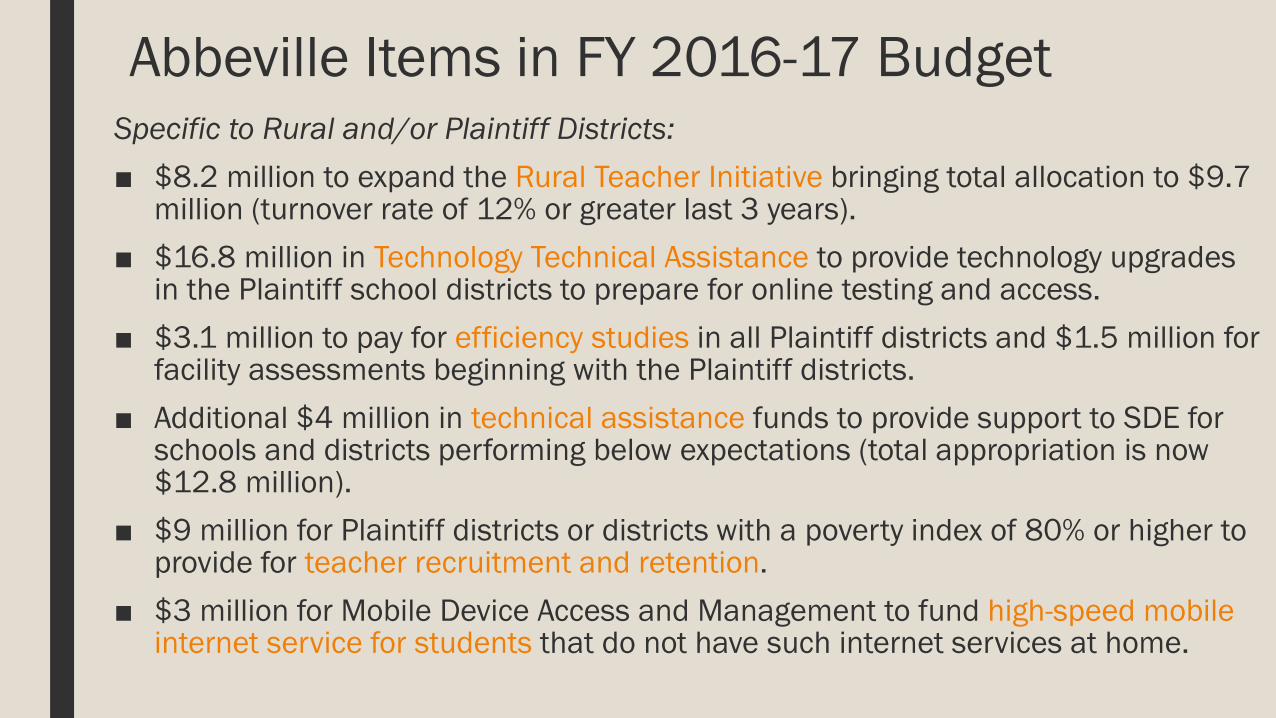
Abbeville Items in FY 2016-17 BudgetSpecific to Rural and/or Plaintiff Districts:■ $8.2 million to expand the Rural Teacher Initiative bringing total allocation to $9.7
million (turnover rate of 12% or greater last 3 years).■ $16.8 million in Technology Technical Assistance to provide technology upgrades
in the Plaintiff school districts to prepare for online testing and access.■ $3.1 million to pay for efficiency studies in all Plaintiff districts and $1.5 million for
facility assessments beginning with the Plaintiff districts.■ Additional $4 million in technical assistance funds to provide support to SDE for
schools and districts performing below expectations (total appropriation is now $12.8 million).
■ $9 million for Plaintiff districts or districts with a poverty index of 80% or higher to provide for teacher recruitment and retention.
■ $3 million for Mobile Device Access and Management to fund high-speed mobile internet service for students that do not have such internet services at home.
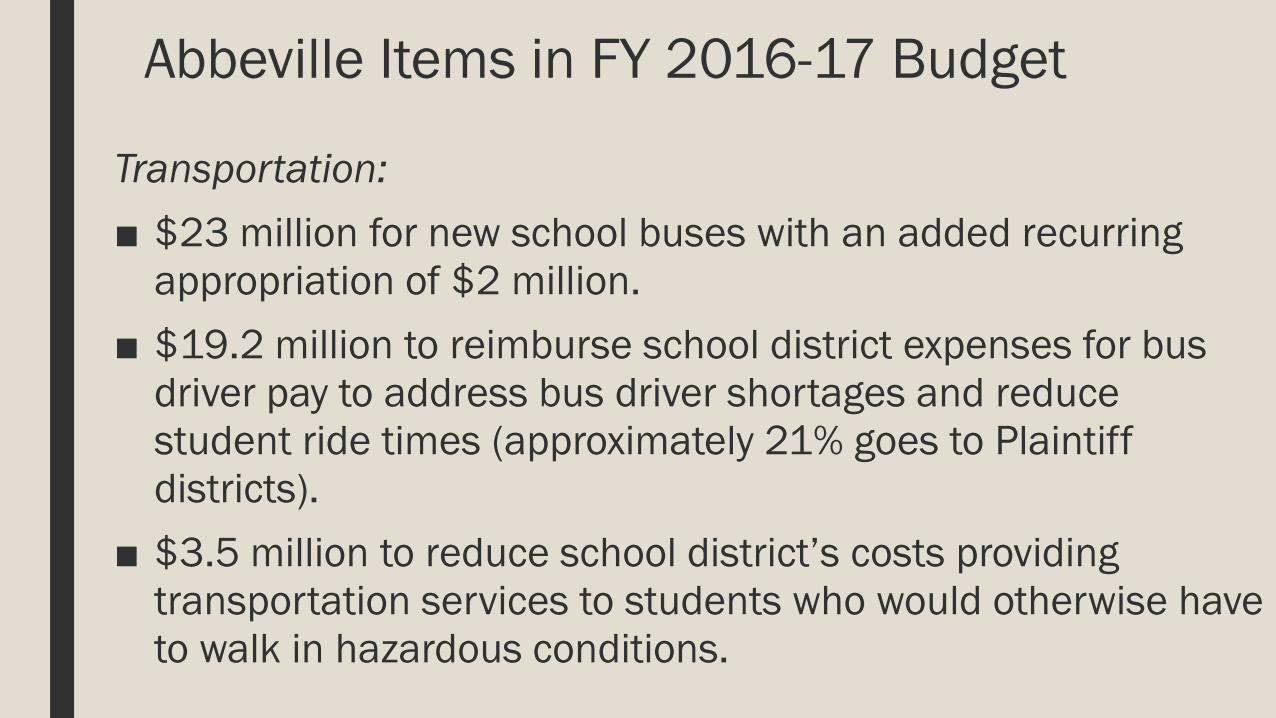
Abbeville Items in FY 2016-17 Budget
Transportation:■ $23 million for new school buses with an added recurring
appropriation of $2 million.■ $19.2 million to reimburse school district expenses for bus
driver pay to address bus driver shortages and reduce student ride times (approximately 21% goes to Plaintiff districts).
■ $3.5 million to reduce school district’s costs providing transportation services to students who would otherwise have to walk in hazardous conditions.

PENSIONS
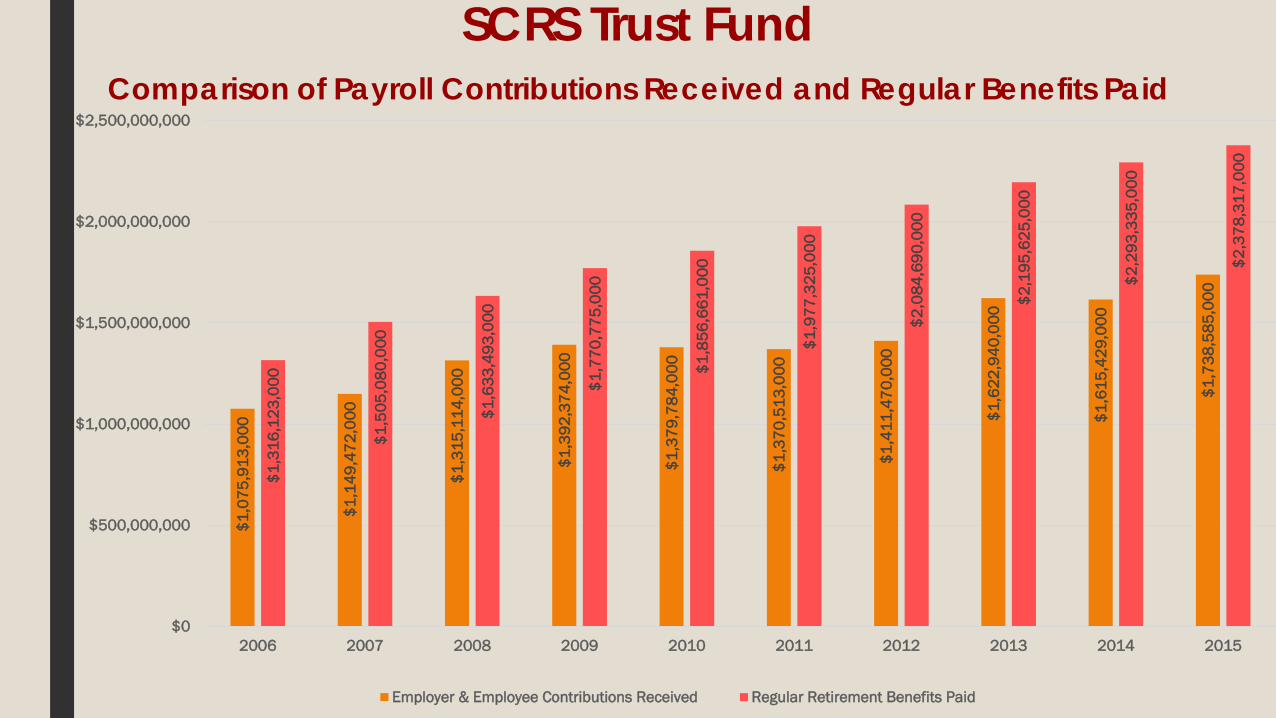
SCRS Trust Fund Comparison of Payroll Contributions Received and Regular Benefits Paid
$1,0
75,9
13,0
00
$1,1
49,4
72,0
00
$1,3
15,1
14,0
00
$1,3
92,3
74,0
00
$1,3
79,7
84,0
00
$1,3
70,5
13,0
00
$1,4
11,4
70,0
00
$1,6
22,9
40,0
00
$1,6
15,4
29,0
00
$1,7
38,5
85,0
00
$1,3
16,1
23,0
00
$1,5
05,0
80,0
00
$1,6
33,4
93,0
00
$1,7
70,7
75,0
00
$1,8
56,6
61,0
00
$1,9
77,3
25,0
00
$2,0
84,6
90,0
00
$2,1
95,6
25,0
00
$2,2
93,3
35,0
00
$2,3
78,3
17,0
00
$0
$500,000,000
$1,000,000,000
$1,500,000,000
$2,000,000,000
$2,500,000,000
2006 2007 2008 2009 2010 2011 2012 2013 2014 2015
Employer & Employee Contributions Received Regular Retirement Benefits Paid
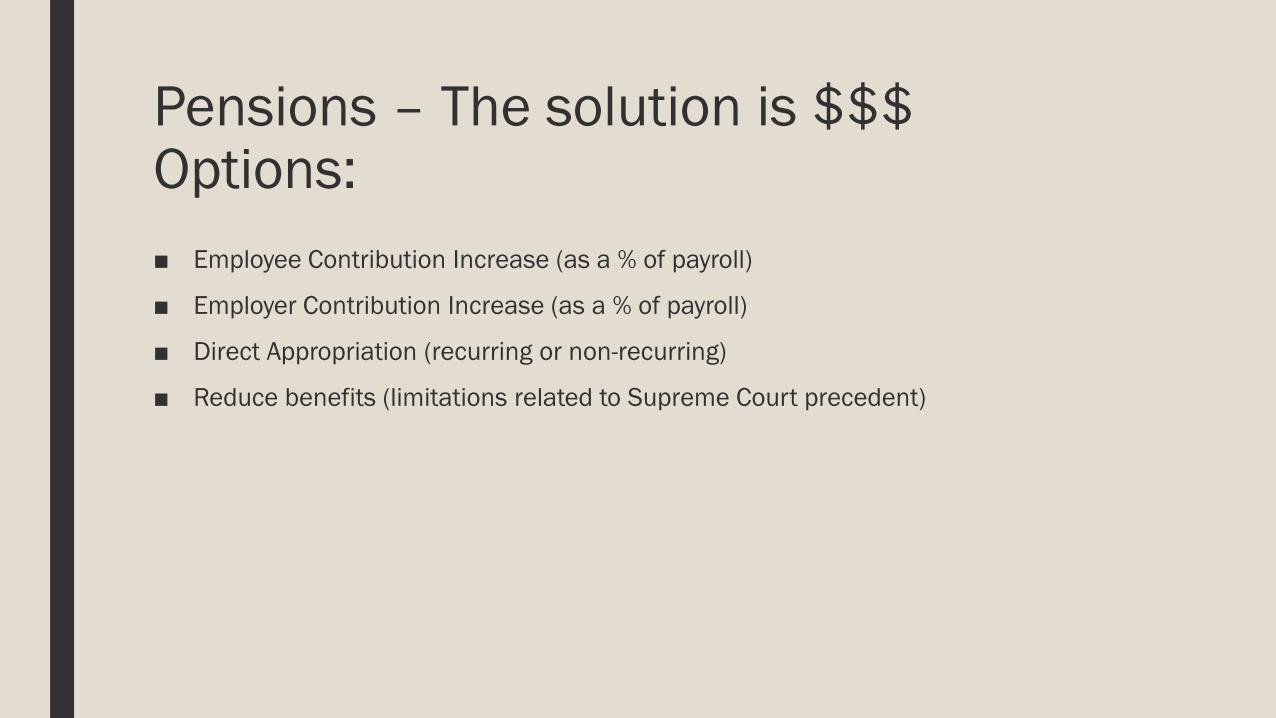
Pensions – The solution is $$$Options:■ Employee Contribution Increase (as a % of payroll)
■ Employer Contribution Increase (as a % of payroll)
■ Direct Appropriation (recurring or non-recurring)
■ Reduce benefits (limitations related to Supreme Court precedent)
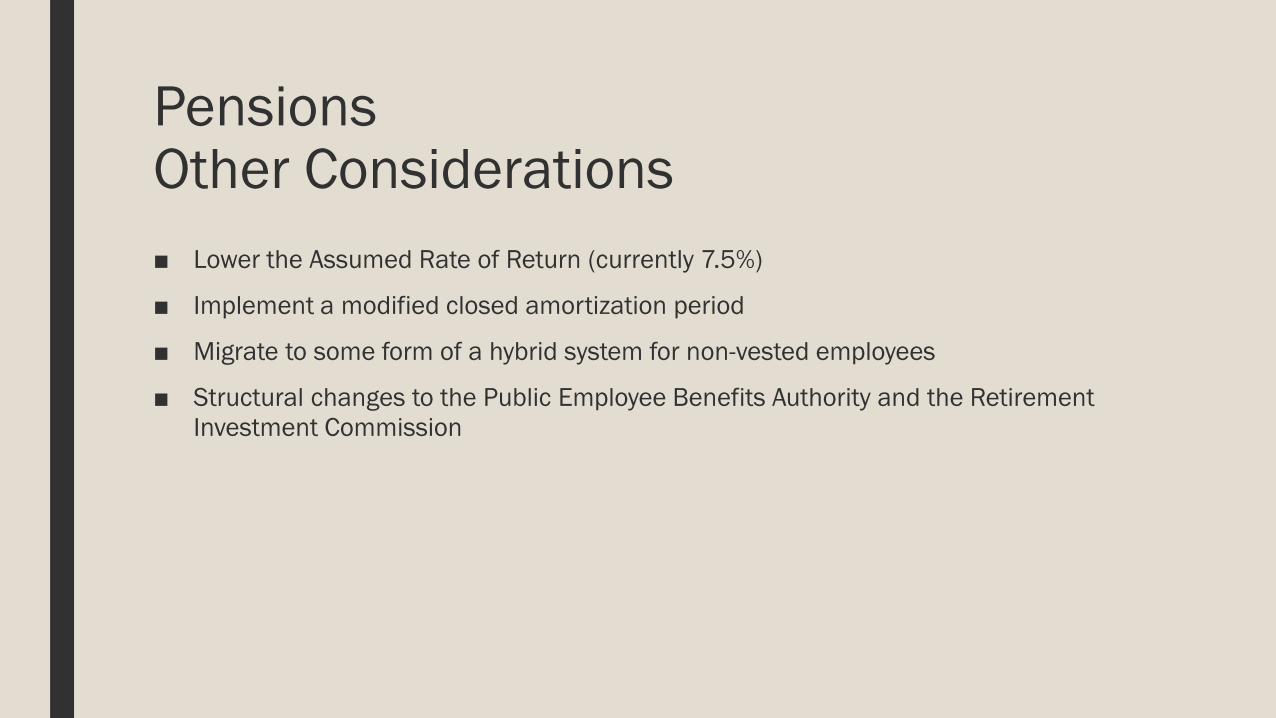
PensionsOther Considerations■ Lower the Assumed Rate of Return (currently 7.5%)
■ Implement a modified closed amortization period
■ Migrate to some form of a hybrid system for non-vested employees
■ Structural changes to the Public Employee Benefits Authority and the Retirement Investment Commission
FISCAL YEAR 17-18 BUDGET OUTLOOK
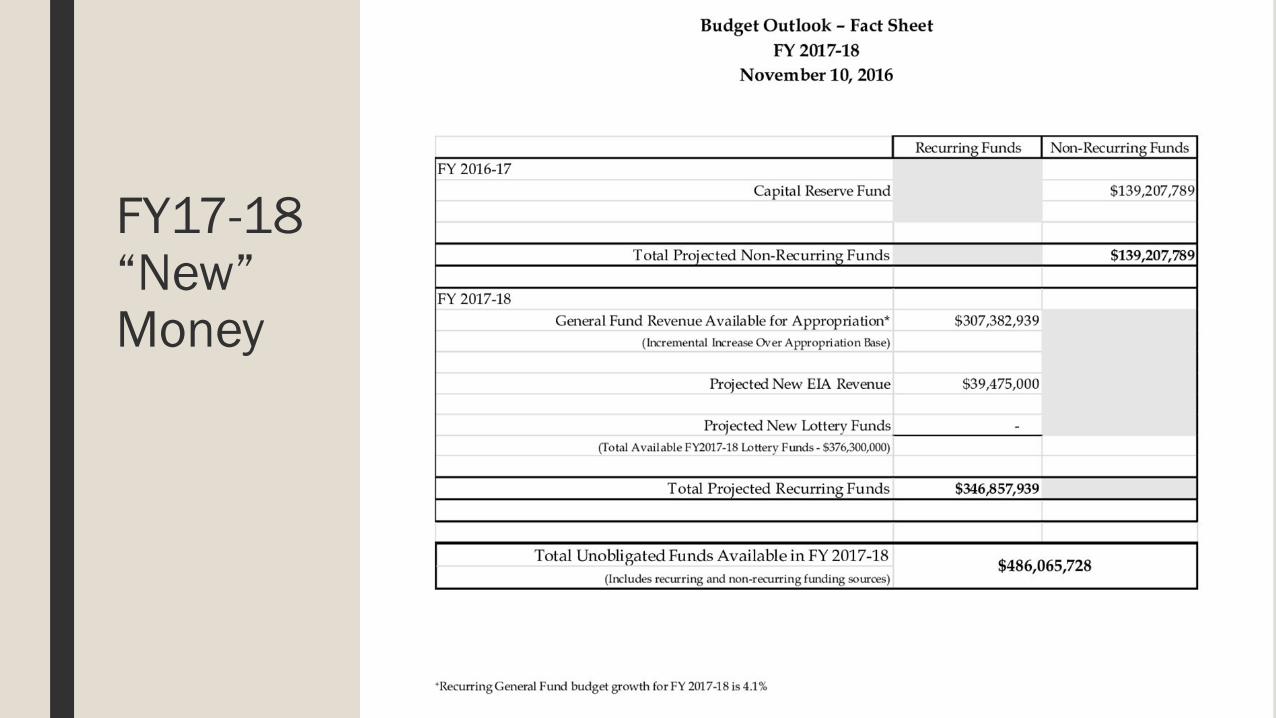
FY17-18“New” Money
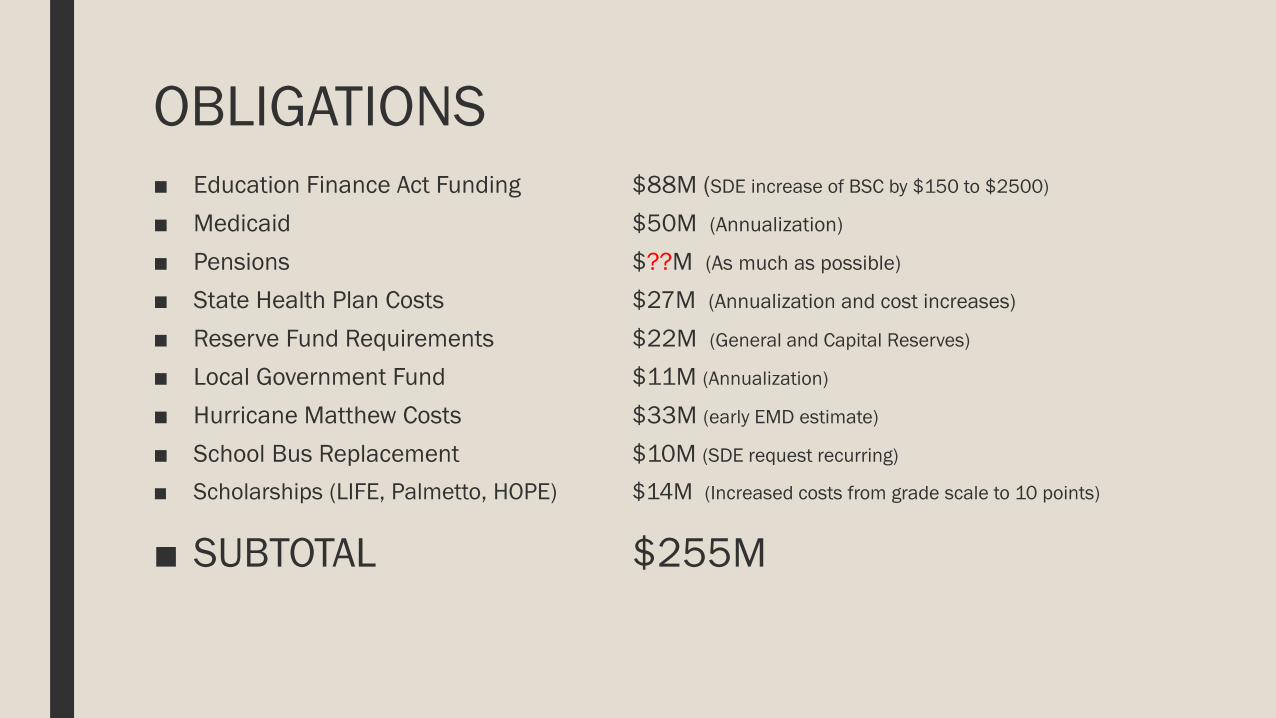
OBLIGATIONS■ Education Finance Act Funding $88M (SDE increase of BSC by $150 to $2500)
■ Medicaid $50M (Annualization)
■ Pensions $??M (As much as possible)
■ State Health Plan Costs $27M (Annualization and cost increases)
■ Reserve Fund Requirements $22M (General and Capital Reserves)
■ Local Government Fund $11M (Annualization)
■ Hurricane Matthew Costs $33M (early EMD estimate)
■ School Bus Replacement $10M (SDE request recurring)
■ Scholarships (LIFE, Palmetto, HOPE) $14M (Increased costs from grade scale to 10 points)
■ SUBTOTAL $255M
Conclusion
■ The FY16-17 budget process could be characterized as the “Year of Plenty.” This was due to a number of one-time occurrences but primarily due to a downward bias in the revenue forecasting error. In FY17-18, the revenue forecasting error is erased.
■ As a result, the $307M in “new” recurring General Fund revenue above the previous year’s appropriation base is the return of the norm. So, FY17-18 will be a “back to basics” budget year.
Questions?My email address is:[email protected]

![PREFACE - Columbus County, North CarolinaEach year, North Carolina elections are administered by the North Carolina State Board of Elections [State Board], the 100 county boards of](https://img.pdfslide.us/doc/110x75/604a1758d07145124e534eb3/preface-columbus-county-north-each-year-north-carolina-elections-are-administered.jpg)