Embed Size (px)
Citation preview

+0.4%
-0.2% -0.2%
-1.1%
-4.7%
+2.2%
-4.6%
+4.5%
+1.2%
Bloomberg
S.C. Stock Index
rose 7.82 points in May, closing at 182.02 for the month..
U.S. Bureau of Economic Analysis
State Personal Income
increased to $208.0 billion in the 1st quarter of 2018.
U.S. Bureau of Labor Statistics
Nonfarm Employmentincreased by 13,400 net non-seasonally adjusted jobs from the prior month.
U.S. Bureau of Labor Statistics
Labor Forcedecreased by 5,635 to 2,317,929, seasonally-adjusted, in May. U.S. Bureau of Labor Statistics
Unemployment Rate
improved to 4.0 percent, seasonally-adjusted, in May.
U.S. Bureau of Labor Statistics
Manufacturing Weekly Hoursfell 0.4 hours to 43.4 hours in May from the prior month, as revised. (revised).
The Conference Board Help Wanted Online Index
Available Online Job Postingsdecreased by 2,900 positions in May to a seasonally-adjusted 58,300 job postings.
South Carolina Association of Realtors
Median Home Sales Price Sales Pricerose $4,474 from the prior month to $205,709 for May.
U.S. Census Bureau
Residential Building Permits Permitsfell by 147 permits from the prior month to 3,072 in May.
KEY S.C. INDICATORS
Income Employment
Real Estate
Volume 11 | Issue 5 | June 2018
ECONOMIC OUTLOOK
About S.C. Commerce's Research Division The Research Division is a highly-skilled, multidisciplinary team of professionals thatcollects, examines and disseminates data to support economic development in SouthCarolina. The division furnishes information to companies considering an investmentin the state and produces rigorous analysis for stakeholders of all kinds.
Those who wish to receive S.C. Commerce’s monthly Economic Outlook can e-mail [email protected].
The Conference Board's national Leading Economic Index rose 0.2 percent in May to 109.5, continuing a long growth trendyet showing signs of moderation. Solid growth is expected for 2018, as index readings over 100 forecast expansion of theeconomy.
- Brandon Wilkerson
Source: S.C. Department of Commerce
The South Carolina Leading Index (SCLI) fell 0.18points last month, ending with a value of 102.523,following revisions.
Key metrics dipped slightly in May. The number ofissued housing permits dropped 4.6 percent, andpermit valuation dropped 11.9 percent. Averageweekly manufacturing hours were also down (-1.1percent), and initial claims for unemploymentinsurance rose 4.3 percent month-over-month. TheDow Jones Composite Average fell 0.9 percent.
9596979899
100101102103104105
Dec
-11
Mar
-12
Jun
-12
Sep
-12
Dec
-12
Mar
-13
Jun
-13
Sep
-13
Dec
-13
Mar
-14
Jun
-14
Sep
-14
Dec
-14
Mar
-15
Jun
-15
Sep
-15
Dec
-15
Mar
-16
Jun
-16
Sep
-16
Dec
-16
Mar
-17
Jun
-17
Sep
-17
Dec
-17
Mar
-18
South Carolina Leading Index

Industry SectorApril
2018Previous Month
Previous
Year
% Change
Month Ago
% Change Year
Ago
Goods Producing 348,500 347,700 348,500 0.23% 0.00%
Natural Resources and Mining 4,400 4,400 4,400 0.00% 0.00%Construction 101,300 100,300 99,100 1.00% 2.22%
Manufacturing 242,800 243,000 245,000 -0.08% -0.90%
Service Providing 1,788,600 1,776,000 1,748,100 0.71% 2.32%
Trade, Transportation, and Utilities 406,500 401,700 402,200 1.19% 1.07%
Information 27,700 27,800 26,200 -0.36% 5.73%Finance 101,500 100,500 100,000 1.00% 1.50%
Professional and Business Services 282,100 278,800 273,600 1.18% 3.11%
Educational and Health Services 252,700 252,400 245,800 0.12% 2.81%
Leisure and Hospitality 268,200 264,700 256,700 1.32% 4.48%
Other Services 79,000 78,700 74,000 0.38% 6.76%
Total Private 1,766,200 1,752,300 1,727,000 0.79% 2.27%
Government 370,900 371,400 369,600 -0.13% 0.35%
Total Nonfarm 2,137,100 2,123,700 2,096,600 0.63% 1.93%Source: U.S. Department of Labor, Bureau of Labor Statistics
Weekly Initial Claims for Unemployment Insurance
+2.9%
2
Source: U.S. Department of Labor, Bureau of Labor Statistics
The average number of initial reported claims forunemployment insurance in the state increased inMay. The average for the month was 2,244 weeklyinitial claims, up 4.3 percent month-over-month. Fourof the six largest MSAs reported higher claims versusApril, including Florence (+15.7 percent); Columbia(+15.2 percent); Charleston (+6.0 percent); andGreenville (+4.2 percent). Spartanburg (-5.8 percent)and Myrtle Beach (-1.8 percent) both reported fewerclaims.
1.0
2.0
3.0
150
200
250
300
350
400
450
500
SC
Cla
iman
ts (
Th
ou
san
ds)
US
Cla
iman
ts (
Th
ou
san
ds)
South Carolina United States
South Carolina’s total non-seasonally adjusted, nonfarm employment rose by 13,400 net jobs to 2,137,100 in May, a 0.6percent increase from revised April numbers and 1.9 percent higher than one year ago. Most sectors reported net job gains forthe month, with Trade, Transportation, and Utilities (+4,800) leading the way. Other sectors with net gains of 1,000 jobs ormore were Leisure and Hospitality (+3,500); Professional and Business Services (+3,300); Construction (+1,000); and Finance(+1,000). Sectors reporting a net job loss included Government (-500); Manufacturing (-200); and Information (-100). Comparedto one year ago, the state economy added 40,500 nonfarm jobs.
Average Hourly Earnings
Weekly Unemployment Claims
These charts present the average hourly earnings of all employees in private industry, based on a monthly national survey of businesses. The data are not seasonally adjusted.
Source: US Department of Labor, Bureau of Labor Statistics.
South Carolina Charleston MSA Columbia MSA Greenville MSA
$19.00
$20.00
$21.00
$22.00
$23.00
$24.00
$25.00
$26.00
Dec
15
Ma
r 16
Jun
16
Sep
16
Dec
16
Ma
r 17
Jun
17
Sep
17
Dec
17
Ma
r 18
$23.56
$21.00
$22.00
$23.00
$24.00
$25.00
$26.00
$27.00
Dec
15
Ma
r 16
Jun
16
Sep
16
Dec
16
Ma
r 17
Jun
17
Sep
17
Dec
17
Ma
r 18
$25.89
$19.00
$20.00
$21.00
$22.00
$23.00
$24.00
$25.00
Dec
15
Ma
r 16
Jun
16
Sep
16
Dec
16
Ma
r 17
Jun
17
Sep
17
Dec
17
Ma
r 18
$23.54
$18.00
$19.00
$20.00
$21.00
$22.00
$23.00
$24.00
Dec
15
Ma
r 16
Jun
16
Sep
16
Dec
16
Ma
r 17
Jun
17
Sep
17
Dec
17
Ma
r 18
$22.84
South Carolina EmploymentNon-Seasonally Adjusted Wage and Salary Employment

* Thousands of US dollars. Source: S.C. Association of Realtors, RealtyTrac, U.S. Census.
Source: U.S. Census Source: U.S. Department of Labor Source: The Conference Board Help Wanted Online Index
Source: South Carolina Department of Revenue Source: Bloomberg Source: U.S. Department of Labor
*Twenty-Foot Equivalent Units. Source: SC Ports Authority Source: U.S. Census Source: Foreign Trade Division, U.S. Census
3
Residential Building Permits Average Hourly Earnings (Private Sector) Jobs Available Online
Retail Sales
Port of Charleston Personal Income Export Activity
Weekly Manufacturing Hours WorkedSC Stock Index
0
2
4
6
8
10
201
4Q3
201
4Q4
201
5Q1
201
5Q2
201
5Q3
201
5Q4
201
6Q1
201
6Q2
201
6Q3
201
6Q4
201
7Q1
201
7Q2
201
7Q3
201
7Q4
201
8Q1
US
$ (
bil
lio
ns)
Business Activity
In May, the number of building permits issued in South Carolina for new residential construction fell 4.6 percent to 3,072.However, this figure was 8.6 percent higher year-to-date than the same point in 2017. Valuation for the permits fell 11.9percent month-over-month but was 9.7 percent higher year-to-date versus 2017. Total closings rose 17.1 percent comparedto April, and the median sales price rose 2.2 percent. Foreclosure activity decreased 5.2 percent compared to the same pointlast year. Total closings were up across the board for the six top MSAs, with Spartanburg (+26.6 percent) and Greenville (+22.1percent) reporting the largest increases.
Income and Output
7891011121314151617181920212223242526
300320340360380400420440460480500
Ap
r 17
May
17
Jun
17
Jul 1
7
Au
g 17
Sep
17
Oct
17
No
v 17
Dec
17
Jan
18
Feb
18
Mar
18
US
$ (
bill
ion
s)
United States South Carolina
SC
$ (
bill
ion
s)
0
1
2
3
4
0
20
40
60
80
100
120
140
May17
Jun17
Jul17
Aug17
Sep17
Oct17
Nov17
Dec17
Jan18
Feb18
Mar18
Apr18
May18
United States South Carolina
US
Un
its
(th
ou
san
ds)
SC U
nit
s (t
ho
usa
nd
s)
30,000
50,000
70,000
90,000
110,000
Jul 1
7
Au
g 17
Sep
17
Oct
17
No
v 1
7
Dec
17
Jan
18
Feb
18
Mar
18
Ap
r 18
May
18
Vo
lum
e (
TEU
s*)
Export Import
38
40
42
44
Sep
16
No
v 1
6
Jan
17
Mar
17
May
17
Jul 1
7
Sep
17
No
v 1
7
Jan
18
Mar
18
May
18
United States South Carolina
Ho
urs
182.0
85
105
125
145
165
185
May
16
Jul 1
6
Sep
16
No
v 16
Jan
17
Mar
17
May
17
Jul 1
7
Sep
17
No
v 17
Jan
18
Mar
18
May
18
SC In
dex
Val
ue*
*Represents publicly-traded companies headquartered in SC.
30
40
50
60
70
2,000
3,000
4,000
5,000
6,000
Dec
13
Mar
14
Jun
14
Sep
14
Dec
14
Mar
15
Jun
15
Sep
15
Dec
15
Mar
16
Jun
16
Sep
16
Dec
16
Mar
17
Jun
17
Sep
17
Dec
17
Mar
18
United States South Carolina
US
Job
s (t
ho
usa
nd
s)
SC
Jo
bs
(th
ou
san
ds)
143
163
183
203
12.0
13.0
14.0
15.0
16.0
17.0
201
5Q3
201
5Q4
201
6Q1
201
6Q2
201
6Q3
201
6Q4
201
7Q1
201
7Q2
201
7Q3
201
7Q4
201
8Q1
SC $
(b
illio
ns)
United States South Carolina
US
$ (
tril
lio
ns)
$23.56
$18.00$18.50$19.00$19.50$20.00$20.50$21.00$21.50$22.00$22.50$23.00$23.50$24.00$24.50
Sep
15
No
v 15
Jan
16
Mar
16
May
16
Jul 1
6
Sep
16
No
v 16
Jan
17
Mar
17
May
17
Jul 1
7
Sep
17
No
v 17
Jan
18
Mar
18
Month CurrentPrevious
Year
% Change
Year Ago2018 YTD 2017 YTD
% Change
YTD
Clos ings May 8,145 7,716 5.6% 32,577 30,894 5.4%
Median Sales Price* May $205.7 $192.2 7.0% $199.9 $185.0 8.1%
Foreclosures May 1,743 1,838 -5.2% 8,716 9,854 -11.5%
Res identia l Bui lding Permits -Total May 3,072 3,086 -0.5% 15,047 13,853 8.6%
Res identia l Bui lding Permits -Valuation* May $653,952 $697,122 -6.2% $3,486,549 $3,179,030 9.7%
Real Estate & Business Activity
Charleston MSA Columbia MSA Florence MSA
Greenville MSA Myrtle Beach MSA Spartanburg MSA
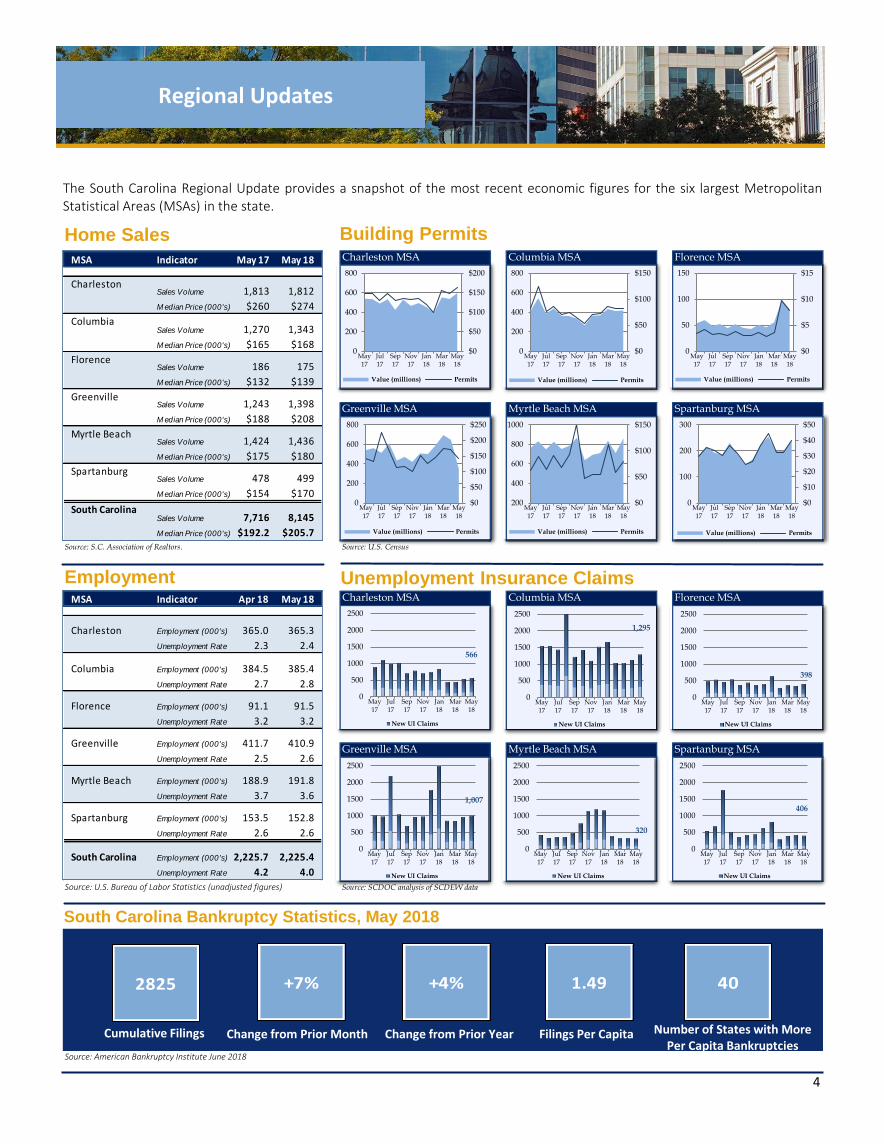
Source: S.C. Association of Realtors. Source: U.S. Census
South Carolina Metropolitan Statistical Areas Charleston MSA Columbia MSA Florence MSA
Greenville MSA Myrtle Beach MSA Spartanburg MSA
Source: U.S. Bureau of Labor Statistics (unadjusted figures) Source: SCDOC analysis of SCDEW data
Source: American Bankruptcy Institute June 2018
4
Home Sales
Employment
Building Permits
$0
$10
$20
$30
$40
$50
0
100
200
300
May17
Jul17
Sep17
Nov17
Jan18
Mar18
May18
Value (millions) Permits
$0
$50
$100
$150
$200
0
200
400
600
800
May17
Jul17
Sep17
Nov17
Jan18
Mar18
May18
Value (millions) Permits
$0
$50
$100
$150
0
200
400
600
800
May17
Jul17
Sep17
Nov17
Jan18
Mar18
May18
Value (millions) Permits
$0
$5
$10
$15
0
50
100
150
May17
Jul17
Sep17
Nov17
Jan18
Mar18
May18
Value (millions) Permits
$0
$50
$100
$150
$200
$250
0
200
400
600
800
May17
Jul17
Sep17
Nov17
Jan18
Mar18
May18
Value (millions) Permits
$0
$50
$100
$150
200
400
600
800
1000
May17
Jul17
Sep17
Nov17
Jan18
Mar18
May18
Value (millions) Permits
Unemployment Insurance Claims
The South Carolina Regional Update provides a snapshot of the most recent economic figures for the six largest MetropolitanStatistical Areas (MSAs) in the state.
566
0
500
1000
1500
2000
2500
May17
Jul17
Sep17
Nov17
Jan18
Mar18
May18
New UI Claims
South Carolina Bankruptcy Statistics, May 2018
1,295
0
500
1000
1500
2000
2500
May17
Jul17
Sep17
Nov17
Jan18
Mar18
May18
New UI Claims
398
0
500
1000
1500
2000
2500
May17
Jul17
Sep17
Nov17
Jan18
Mar18
May18
New UI Claims
1,007
0
500
1000
1500
2000
2500
May17
Jul17
Sep17
Nov17
Jan18
Mar18
May18
New UI Claims
320
0
500
1000
1500
2000
2500
May17
Jul17
Sep17
Nov17
Jan18
Mar18
May18
New UI Claims
406
0
500
1000
1500
2000
2500
May17
Jul17
Sep17
Nov17
Jan18
Mar18
May18
New UI Claims
Cumulative Filings Filings Per CapitaChange from Prior Month Number of States with More Per Capita Bankruptcies
Change from Prior Year
MSA Indicator Apr 18 May 18
Charleston Employment (000's) 365.0 365.3
Unemployment Rate 2.3 2.4
Columbia Employment (000's) 384.5 385.4
Unemployment Rate 2.7 2.8
Florence Employment (000's) 91.1 91.5
Unemployment Rate 3.2 3.2
Greenville Employment (000's) 411.7 410.9
Unemployment Rate 2.5 2.6
Myrtle Beach Employment (000's) 188.9 191.8
Unemployment Rate 3.7 3.6
Spartanburg Employment (000's) 153.5 152.8
Unemployment Rate 2.6 2.6
South Carolina Employment (000's) 2,225.7 2,225.4
Unemployment Rate 4.2 4.0
MSA Indicator May 17 May 18
CharlestonSales Volume 1,813 1,812
M edian Price (000's) $260 $274
ColumbiaSales Volume 1,270 1,343
M edian Price (000's) $165 $168
FlorenceSales Volume 186 175
M edian Price (000's) $132 $139
GreenvilleSales Volume 1,243 1,398
M edian Price (000's) $188 $208
Myrtle BeachSales Volume 1,424 1,436
M edian Price (000's) $175 $180
SpartanburgSales Volume 478 499
M edian Price (000's) $154 $170
South CarolinaSales Volume 7,716 8,145
M edian Price (000's) $192.2 $205.7
2825 +7% +4% 1.49
Regional Updates
40