Embed Size (px)
Citation preview
1
MERRILL LYNCH TMT CONFERENCEMERRILL LYNCH TMT CONFERENCE
JUNE 3, 2009JUNE 3, 2009

2
� Statements contained in this document, particularly those concerning forecasts on future M6 Group performances, are forward-looking statements that are potentially subject to various risks and uncertainties.
� Any reference to M6 Group past performances should not be interpreted as an indicator of future performances.
� The content of this document must not be considered as an offer document or a solicitation to buy or sell M6 Group shares.
DisclaimerDisclaimer
3
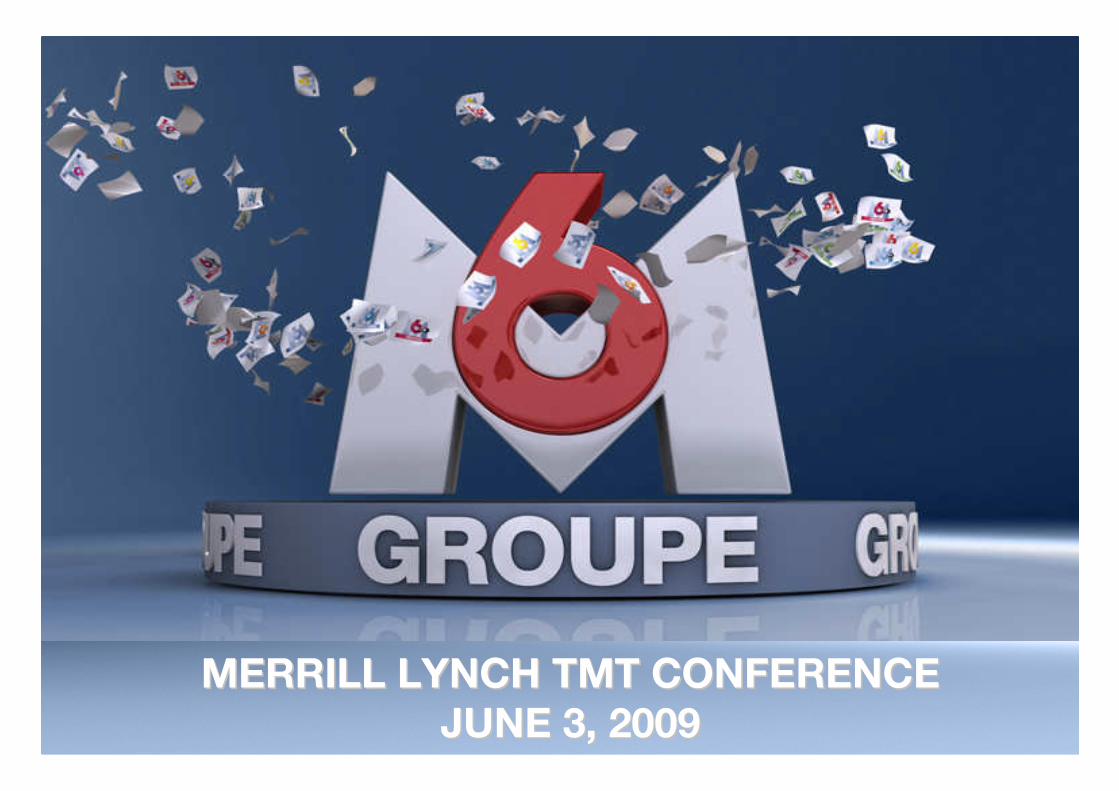
Audience Fragmentation(2008 vs. 2007)
Digitisation is accelerating
� Analogue : -6,2 pps
� DTT : +5,3 pps
� Cable & DTH : +0,9 pps
DTT equipped households(2008 vs. 2007)
2007 2008
19.7 % 35.0 %
A
DTT coverage, August 2008
In a In a fastfast changingchanging environmentenvironment ……
Structural changes
� Change in audience shares (4+)
Multichannel households (i.e. digitally equipped)
2008
75.0 %� driven by DTT and DSL
4
10.3%
-2.5%
9.7%8.6%
5.6%
7.5%
4.3%3.0%
0.6%
3.1%
0.9%
-4.6%
-9.5%
-0.1%
-4.0%
3.1%
6.2%
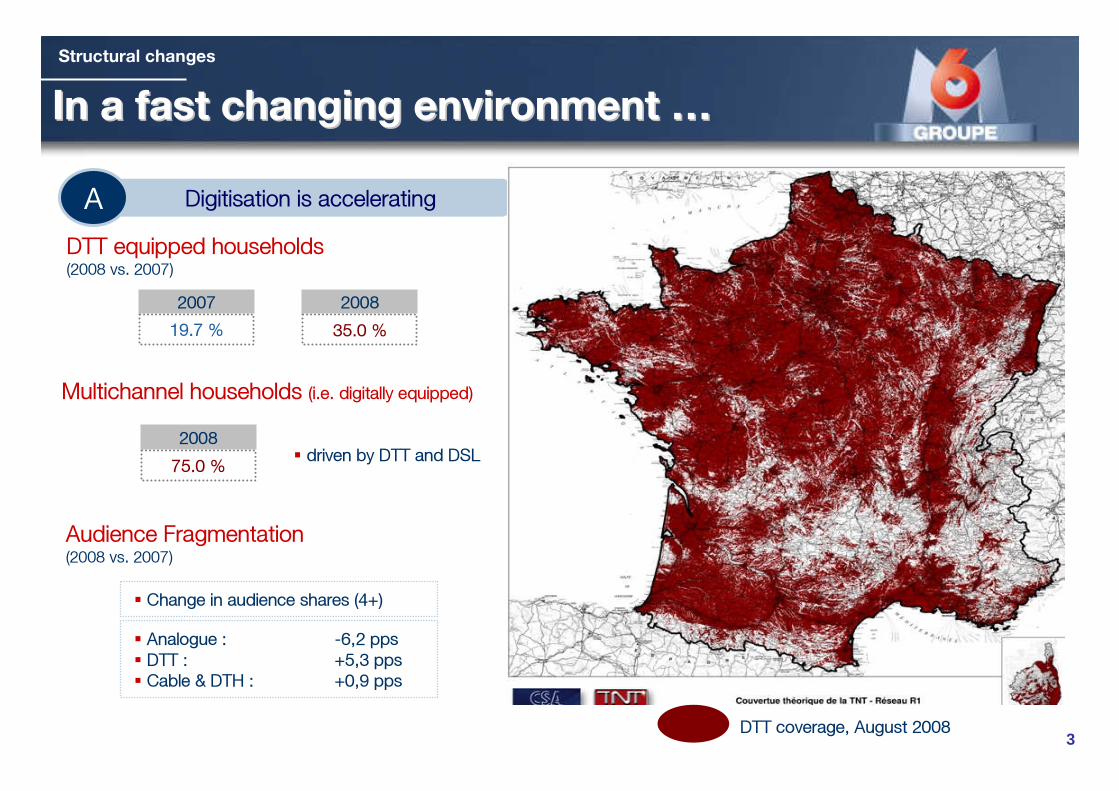
A depressed multimedia advertising market (gross data, source TNS MI)B
2008 H2 slowdown
Feb. Mar. June Sept. Dec.
20082007
Jan. Apr. May July Aug. Oct. Nov.
� Analogue : -8.5 %
� DTT : +101.2 %
� CabSat : -4.3 %
…… and and facingfacing toughtough marketmarket conditionsconditions……
Cyclical issues
TV ad market (gross) 2008
2009 YTD
Feb. Mar.Jan. Apr.
+4.1% -4.3%
2009 downturn

5
2008 EBITA down due to programme investments2008 consolidated sales were flat
…… a a resilienceresilience reflectingreflecting the Group the Group strongstrong positionposition
Group Performance in 2008
1 2
Growth drivers in diversification Audiences & Ratings records43
Revenue : 1354.9 M€
� M6 advertising revenue down -2.6% vs. – 7.0 % for
its market segment
� Other revenue offset the decrease
o Digital channels growth
o New diversification businesses
EBITA : 194.0 M€
Strong Financials5
� A profitable group
� A net cash position at year-end 2008 and a put option on C+ France stake (Feb’ 2010)
� Top audience of the year : 13.2 m viewers
� Records in Access Prime Time
� FY : 1.8 % national audience share (4+)
X 2 compared to 2007
� M6 channel contribution down due to Euro 2008 broadcast
� Digital channels strongly increasing their contribution
� Diversification & audio rights almost stable contribution
� Contribution of acquisitions : Mistergooddeal.com
and Cyréalis
� Innovative developments : M6 mobile by Orange, Catch’up TV

6
185.0229.0
133.4
205.5171.4
142.3
152.8
137.7
169.1
156.0
Q1 2008 Q2 2008 Q3 2008 Q4 2008 Q1 2009
Non advertising revenueMultimedia advertising revenue
Q1 2009 flat Q1 2009 flat consolidatedconsolidated group revenue group revenue
Group performance – Q1 2009
327.3
381.8
271.1
374.6
327.4
Q1 2008YoY changeNon ad revenueMultimedia ad revenue
-10.3%+3.0%
Q2 2008+0.3%+4.8%
Q3 2008-1.4%-0.5%
Q4 2008+4.4%-2.8%
In M€
Total
FY 2008-1.8%+1.3%
Q1 2009+9.6%-7.4%
Total revenue -3.3% +3.0% -1.0% +0.4% -0.1% =
FY 2008
1354.9
602.0
752.9
7
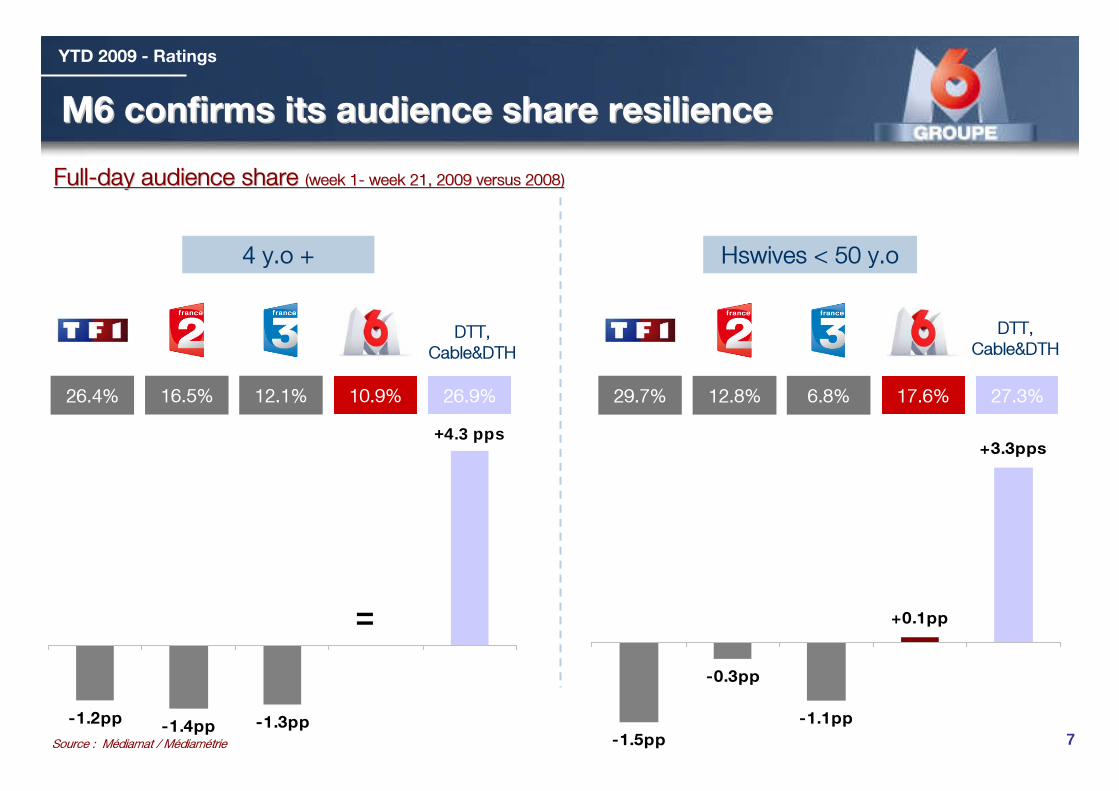
+4.3 pps
-1.3pp-1.4pp-1.2pp
DTT,
Cable&DTH
26.4% 16.5% 12.1% 10.9% 26.9%
+0.1pp
+3.3pps
-1.5pp
-0.3pp
-1.1pp
29.7% 12.8% 6.8% 17.6% 27.3%
4 y.o +
YTD 2009 - Ratings
Hswives < 50 y.o
Source : Médiamat / Médiamétrie
FullFull--dayday audience audience shareshare ((weekweek 11-- weekweek 21, 2009 versus 2008)21, 2009 versus 2008)
=
M6 M6 confirmsconfirms itsits audience audience shareshare resilienceresilience
DTT,
Cable&DTH

8-1.3pp-1.4pp
-1.0pp
+3.8pps
+0.3pp
27.8% 16.0% 12.6% 11.8% 24.5%
-1.0pp
-0.5pp
-1.2pp
+2.8pps
+0.3pp
31.1% 11.9% 6.6% 19.6% 25.1%
Source : Médiamat / Médiamétrie
12:00 am12:00 am-- 12:00 pm audience 12:00 pm audience shareshare changes changes ((weekweek 11-- weekweek 21, 2009 versus 2008)21, 2009 versus 2008)
4 y.o + Hswives < 50 y.o
DTT,
Cable&DTH
DTT,
Cable&DTH
YTD 2009 - Ratings
M6 M6 confirmsconfirms itsits audience audience shareshare resilienceresilience

9
Success of Access Prime Time
Audience Audience shareshare HwivesHwives < 50 < 50 y.oy.o
Source : Médiamat / Médiamétrie
New records on popular formats (audience share in %)
A A widewide range of range of successfulsuccessful programmingprogramming
M6 M6 isis the the leadingleading channelchannel in in accessaccessprime time on prime time on HwivesHwives <50 <50 sincesince
SeptemberSeptember 20082008
Nouvel enchaNouvel enchaîînement nement dd’’accessaccess
17.718.4
27.8 27.2
15.5 16.922.3
25.1
4 y.o + 4 y.o +H<50 H<50
2008
2009
3.8M° 3.7M°4.1M° 4.3M°
2009 - Ratings
21.7
29.4
18.2
14.313.413.9
15.8
28.6 28.9 29.8 28.3
Q1 2007 Q2 2007 Q3 2007 Q4 2007 Q1 2008 Q2 2008 Q3 2008 Q4 2008 Q1 2009 Apr-09 May-09
05:40 pm 05:40 pm –– 07:40 pm07:40 pmNew line up of programmesNew line up of programmes

10
1.11.2
1.3
1.6 1.61.7
1.81.9
22.1
2.32.2
2.32.2
2.32.4
1.51.5
2.4
1.4
1.10.90.90.9
0.81.0
0.70.5
0.40.4
0.10.3
2 0 05
J a n- M a
r c hA p r
i l - J un e
S e pt - O
c tN o v
- D ec
J a n- M a
r c h
A p ri l 0 7 M a y 0 7
J u ne 0 7
J u l y 0 7
A u gu s t
0 7S e p
t e mb e r
0 7O c t
o b er 0 7
N o ve m
b e r 0 7
D e ce m
b e r 0 7
J a nu a r
y 08
F e br u a
r y 08
M a rc h 0
8
A p ri l 0 8 M a y 0 8
J u ne 0 8
J u l y 0 8
A u gu s t
0 8S e p
t e mb e r
0 8O c t
o b er 0 8
N o ve m
b e r 0 8
D e ce m
b e r 0 8
J a nu a r
y 09
F e br u a
r y 09
M a rc h 0
9
A p r- 0 9
0 1 /0 5 /
2 0 09 t o
d a te
National audience National audience shareshare on 4 on 4 y.oy.o + (in %)+ (in %)
W9 W9 coco--leader of DTTleader of DTT
2009 - Ratings
2008 average audience share: 1.8 %
x2
Co-leader of DTT

11
W9 W9 leadingleading DTT DTT channelchannel on commercial on commercial targetstargets
2009 - Ratings
3.6%3.3%
4.7%4.9%
3.3%3.5%
3.7%
3.2%
2.6% 2.7%2.5%
2.9%2.6%
2.4%2.6%
2.2%
15-49 y.o 25-49 y.o 15-34 y.o 15-24 y.o Hwives < 50 Hwiv es withchildren
Men 15-49y.o
25-49 y.oABC+
Source : Médiamétrie / fichier Mediaplanning March-April 2009
5th French channel
5th French channel
6th Frenchchannel
6th Frenchchannel
5th French channel
5th French channel
6th Frenchchannel
6th Frenchchannel
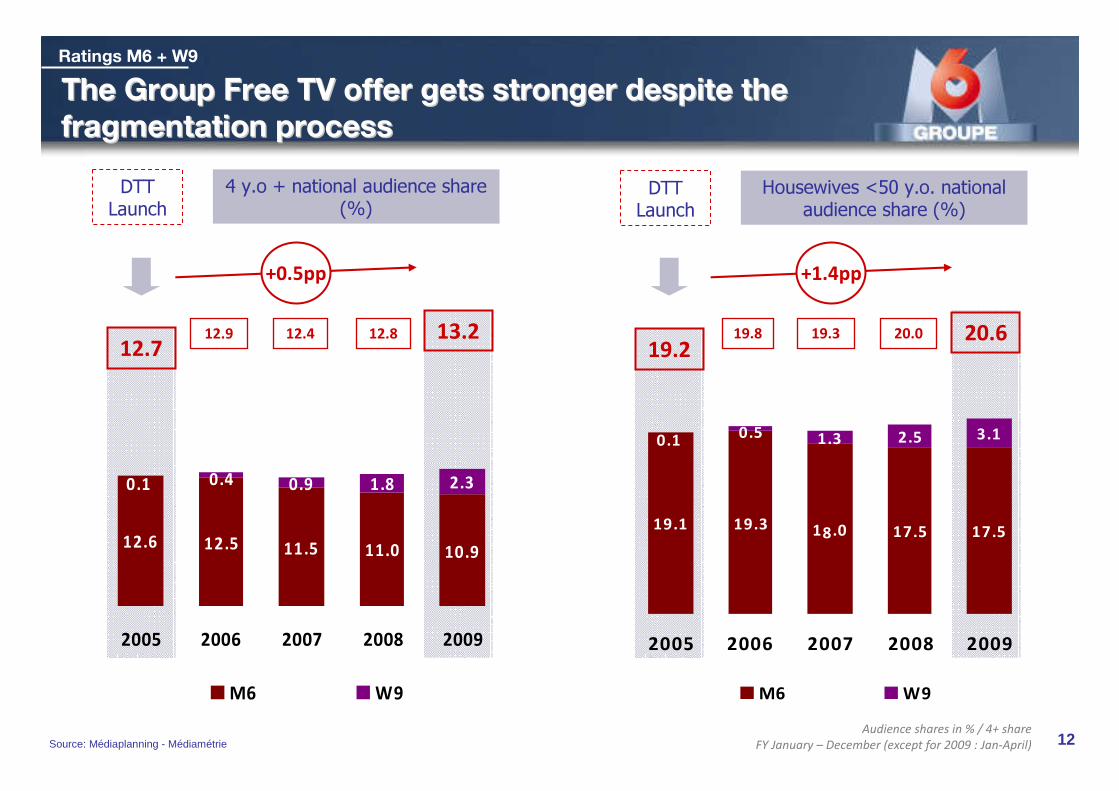
12Audience shares in % / 4+ share
FY January – December (except for 2009 : Jan-April)Source: Médiaplanning - Médiamétrie
12.712.9 12.4 12.8
+0.5pp
13.219.2
19.8 19.3 20.0 20.6
The Group Free TV The Group Free TV offeroffer getsgets strongerstronger despitedespite the the
fragmentation fragmentation processprocess
Ratings M6 + W9
DTT Launch
+1.4pp
DTT Launch
4 y.o + national audience share(%)
Housewives <50 y.o. national audience share (%)
0.9 1.8 2.3
12.6 12.5 11.5 11.0 10.9
0.1 0.4
2005 2006 2007 2008 2009
M6 W9
1.3 2.5 3.1
17.517.518.019.319.1
0.50.1
2005 2006 2007 2008 2009
M6 W9

13
Beginning of 2009 drop is driven by historical channels
2009 Advertising trends
1,702,368
1,436,742
Gross + Net**** M6 / TF1 (gross + gross restated) / Canal + / France 2 / France 3 / France 5
221,979
370,881
225,632212,983
Jan-April 2008 Jan-April 2009 Jan-April 2008 Jan-April 2009 Jan-April 2008 Jan-April 2009
2 150
(265)
+148 (12)
2 020
�Analogue** : -15.6 % � DTT : +67.1 % � Cable&DTH : -5.6 %
-6.0% - 130 M€
Gross data, Jan-April 2009, source TNS MI
Analogue
DTTCable&DTH
Gross TV ad marketJan-April 2008
Gross TV ad marketJan-April 2009
In ‘000 €
In M€

14
A strategy related to the core business
Sport Rights
Audiovisual
Rights
Broadcasting
Historical Free TV
Free DTT
Pay TV channels
Maximise advertising
yield
Channels’ grid optimisation- Home Shopping
- Call TV
Non linear &
New media
Upstream Core business Downstream
Diversification & audiovisual rights

15
A strategy related to the core business
Diversification & audiovisual rights
36.3
86.7
273.2
78.5
90.4
0.1
24.8
8.9
5.6
3.0
FY 2008 revenues
Audiovisual rightsF.C.G.B.
Distance SellingE-commerce and Home
Shopping
InteractivityInteractions (merchandising)
FY 2008 EBITA
Total : 565.1 M€ Total : 42.3 M€

16
Launched in March 2008, M6 Replay is already the leading catch’up TV offer in France
Over 90 million of
videos views since
the launch of the
offer
Each week, over
a hundred of new
programmes
available
Over 1.5 million
Unique Visitor every
month
10 million of
videos
viewed every
month
Most efficient
advertising media
on the Internet
Diversification & Audiovisual rights
M6 Replay, French leadership on Catch’Up TV
16

17
2009 strengths and challenges
Television: flexibility to capitalise on
Deteriorating advertising environment Flexibility potential of M6 programming costs
due to the cost of the Euro-
+
Renegotiation of contracts, enhanced cost
control+
Savings generated by the end of regional news+
DTT positioning, audience level dynamics+
Diversification and audiovisual rights: optimising their contribution to profit
Additional tax on advertising revenue-
Group: stable workforce
Deteriorating advertising and
economic environment-
Priority given to profitability vs. sales cautious
procurement managementCPC revenue and subscription/license-
based model
Good start of the year: "Twilight"
Selectivity, development of licenses (Marvel)
+
+
+
+
2009 stakes & savings plan
Cost savings
~ 47 M€
~ 5 to 10 M€
Cost savings
Mainlyvariable
costs
~ 52 to 57 M€