Embed Size (px)
Citation preview
(Link to Table of Contents)
South Carolina Commission on Higher Education
A CLOSER LOOK AT PUBLIC HIGHER EDUCATION
IN SOUTH CAROLINA
Institutional Effectiveness, Accountability, and Performance
JANUARY 2007
1333 Main Street, Suite 200Columbia, South Carolina 29201 Tel: 803-737-2260 http://www.che.sc.gov

(blank page)

Gail M. Morrison Executive Director
January 12, 2007 Dear Governor Sanford and Members of the General Assembly:
As South Carolina’s only source of comprehensive comparative data on institutional performance on legislated institutional effectiveness measures, A Closer Look at Public Higher Education in South Carolina: Institutional Effectiveness, Accountability, and Performance provides a unique view of the state’s public higher education system. The inclusion of historical data on institutional performance, also unique to this document, allows for the evaluation of current performance and change in the context of past performance. In addition to the data contained within this document, links are provided to the institutions’ mission statements, institutional effectiveness reports, Title II Teacher Education data reports, and Performance Funding ratings. These data and the linked documents are provided to help inform your deliberations as you consider higher education issues from the state perspective.
In taking this "Closer Look" at higher education, the Commission furthers its primary goal of supporting and coordinating efforts to meet the educational and workforce demands of the people of South Carolina. In compliance with Section 59-101-350 of the South Carolina Code of Laws, 1976, as amended, I respectfully submit the following report to the members of the General Assembly.
Sincerely, Gail M. Morrison Interim Executive Director
1333 Main St. Suite 200 Columbia, S.C. 29201 Tel: 803-737-2260 Fax: 803-737-2297 Web: www.che.sc.gov

(blank page)

A CLOSER LOOK AT PUBLIC HIGHER EDUCATION IN SOUTH CAROLINA
Institutional Effectiveness, Accountability, and Performance
A Publication of the South Carolina Commission on Higher Education
Division of Academic Affairs & Licensing R. Lynn Kelley, Acting Director
Gail M. Morrison Interim Executive Director
South Carolina Commission on Higher Education
T. Michael Raley, Editor
1333 Main St., Suite 200 Contributing Editor: Columbia, SC 29201 Julie Carullo ([email protected]) 803.737.2260 Phone 803.737.2297 Fax http://www.che.sc.gov

(blank page)

COMMISSION MEMBERS
Layton R. McCurdy, Chair
Governor’s Appointment at Large
John T. Bowden, Jr. Governor’s Appointment Ex-Officio Institutional
Cynthia C. Mosteller Governor’s Appointment at Large
Douglas R. Forbes Governor’s Appointment at Large
Daniel Ravenel 1st Congressional District Representative
Hood Temple 6th Congressional District Representative
James R. Sanders 5th Congressional District Representative
Bettie Rose Horne 3rd Congressional District Representative
Kenneth B. Wingate Governor’s Appointment at Large
Raghu Korrapati 2nd Congressional District Representative
J. Neal Workman, Jr. Governor’s Appointment Ex-Officio Institutional
Louis B. Lynn Governor’s Appointment Ex-Officio Institutional
Mitchell Zais Governor’s Appointment Ex-Officio without vote
Private Sector President
Vacant 4th Congressional District Representative
Acknowledgement The South Carolina Commission on Higher Education extends its sincere gratitude to the institutional representatives who played an essential role in the publication of this report

(blank page)

i
TABLE OF CONTENTS Index of Charts and Tables iii Introduction 1
Institutional Effectiveness Reporting 2
South Carolina Performance Funding System for Higher Education 3
Strategic Plan for Higher Education in South Carolina 5
Section 1 Mission Focus 11
Review of Programs 13
Curricula Offered at Institutions 16
Institutional Mission Statements * 20
Academic Programs to Provide a Technologically Skilled Workforce 21
Section 2 Quality of Faculty 23
Academic and Other Credentials of Professors and Instructors 25
Compensation of Faculty 28
Section 3 Classroom Quality 33
Courses Taught by Full-Time and Part-Time Faculty and by 36 Graduate Assistants*
Accreditation of Degree-Granting Programs * 38
Student Performance on Teacher Education Exams 41
Teacher Education Graduates in Critical Shortage Areas 42
Teacher Education Graduates Who are Minority 42
Assessment Information for the Institution’s Title II of the 43 Federal Higher Education Act of 1998 Report
Section 4 Institutional Cooperation and Collaboration 45
Section 5 Administrative Efficiency 51
Section 6 Entrance Requirements 55
Qualifications of Entering Freshmen 58

ii
TABLE OF CONTENTS, continued
Success of Students in Developmental Courses* 59
Sources of First-Time Degrees for Graduate Students* 59
Admission Standards 61
Section 7 Graduates' Achievements 65
Performance Funding Graduation Rates 67
Southern Regional Education Board Graduation Rates 71
Student Performance on Professional Examinations * 73
National and South Carolina Pass Rates on Professional Examinations * 80
Overall Pass Rates on Professional Examinations for SC’s Public Institutions 82
Scores of Graduates on Post-Undergraduate Professional, Graduate, or Employment-Related Examinations and Certification Tests 83
Number of Graduates Who Continued Their Education 85
Section 8 User-Friendliness of the Institution 87
Undergraduate Transfers * 90
Enrollment by Race * 91
Accessibility to the Institution of All Citizens of the State 92
Section 9 Research Funding 101
Student Involvement in Research * 104
Financial Support for Teacher Education 106
Amount of Public and Private Sector Grants 108
Section 10 Campus-Based Assessment * 109
2005 Summary Reports on Institutional Websites 112
Section 11 Institutional Performance Rating Process 115
Institutional Ratings for 2004-2005 Performance Year 117
Appendix 1 Success of Transfer Students 118

iii
Index of Charts and Tables Section 1 Mission Focus
Table 1.1 Programs Reviewed During the Academic Year 14
Table 1.2 Program Status at Technical Colleges 15
Table 1.3 Curricula Offered to Achieve Mission 17
Figure 1.1 Performance Indicator 1B-Curricula Offered to Achieve Mission 19
Section 2 Quality of Faculty
Figure 2.1 Percent of Full-Time Faculty with Terminal Degrees in the Primary 25 Teaching Area
Figure 2.2 Percent Teaching in the Fall Who Meet Minimum SACS Degree 27 Criteria for Credentials
Figure 2.3 Compensation of Faculty 28
Section 3 Classroom Quality
Table 3.1 Courses Taught by Full-Time and Part-Time Faculty and by Graduate 37 Assistants
Figure 3.1 Indicator 3D-Accreditation of Degree-Granting Programs 38
Table 3.2 Accreditation of Degree-Granting Programs 40
Figure 3.2 Percentage of Students Passing the PRAXIS Specialty Area Exam 41
Figure 3.3 Percent of Teacher Education graduates in Critical Shortage Areas 42
Figure 3.4 Percent of Teacher Graduates Who are Minority 43
Section 4 Institutional Cooperation and Collaboration
Figure 4.1 Institutional Collaboration and Cooperation 47
Section 6 Entrance Requirements
Figure 6.1 SAT/ACT Scores, High School Rank and GPA of Student Body 58
Table 6.1 Sources of First-Time Degrees for Graduate Students 59
Table 6.2 Applications and Admission Offers, SC Public Senior Institutions 61
Figure 6.2 Percent of Applicants Offered Admission who Accepted and Enrolled 62

iv
Index of Charts and Tables, continued
Figure 6.3 Average SAT/ACT Combined Scores of all First-Time Entering 62 Freshmen
Section 7 Graduates' Achievements
Figure 7.1 Graduation Rates (Performance Funding) 68
Figure 7.2 Graduation Within 150% of Program Time (GRS Rate), Regional Campuses and Technical Colleges 70
Table 7.1 Southern Regional Education Board States Compared to South Carolina 71
Table 7.2 Student Performance on Professional Examinations 73
Table 7.3 National and South Carolina Pass Rates on Professional Examinations 80
Table 7.4 Percentage of Students Who Pass Certification Examinations 82
Figure 7.3 Results of Professional Examinations (Performance Funding) 83
Figure 7.4 Number of Graduates Who Continued Their Education 85
Section 8 User-Friendliness of the Institution
Table 8.1 First-Time, Full-Time Undergraduate Transfers 90
Table 8.2 Percent Change in Minority Enrollment, Fall 1999 to Fall 2004 91
Figure 8.1 Percent of Headcount Undergraduate Students who are Citizens of 92 South Carolina who are Minority
Figure 8.2 Retention of Minorities who are South Carolina Citizens and Identified 94 as Degree-Seeking Undergraduate Students
Figure 8.3 Percent of Headcount Graduate Students Enrolled at the Institution Who 97 are Minority
Figure 8.4 Percent of Headcount Teaching Faculty who are Minority 98
Section 9 Research Funding
Table 9.1 Student Involvement in Research - Graduate Students 104
Table 9.2 Student Involvement in Research - Undergraduate Students 105
Figure 9.1 Financial Support for Reform in Teacher Education 107

Introduction
1
INTRODUCTION The following publication provides a closer look at data reported annually by South Carolina's public institutions of higher education as part of institutional effectiveness reporting and as part of the process of performance funding. Prior to the January 2000 edition, this document was entitled "Minding Our P's and Q's: Indications of Productivity and Quality in South Carolina Public Colleges and Universities." In January 2000, the South Carolina Commission on Higher Education (CHE) substantially revised this publication in efforts to provide a source guide integrating data reported by the state's public colleges and universities in fulfillment of legislative requirements. The CHE integrated institutional effectiveness data reporting with performance data measured pursuant to Section 59-103-30 and Section 59-103-45 of the South Carolina Code of Laws, 1976, as amended, to determine institutional funding levels. Data related to the funding process reflect the 2003-2004 performance year, which resulted in ratings given to institutions in Spring 2004 for the purpose of determining the allocation of FY 2004-2005 state appropriations. Historical performance data are displayed if available. Detailed information related to the performance funding process in South Carolina is available on the CHE's website at http://www.che.sc.gov. Throughout this publication, data are displayed on the 33 public institutions of higher education within groupings of institutions or sectors that have common missions as identified in Act 359 of 1996. However, due to the uniqueness in mission of each individual institution, the reader is cautioned against drawing conclusions and making comparisons solely based on the figures and tables found in this report. What will you find in this report? Eleven sections highlight various aspects of higher education. Notations in the "Table of Contents" clearly identify components of this publication that are part of reporting requirements of Section 59-101-350, or what has become commonly referred to as "Act 255" data. Where appropriate, comments in the text explain how these required data elements are utilized as part of annual performance funding measurements. Sections 1 - 9 reflect the nine "critical success factors" identified by the General Assembly for South Carolina's public colleges and universities (Section 59-103-30). Data from both institutional effectiveness and performance funding reporting are combined in these sections. Often the data is presented by type of institution or sector, as identified in the legislation. The four sectors of institutions as defined in legislation are: Research Universities,
Four-Year Colleges and Universities, Two-Year Institutions-Branches of the University of South Carolina, and State Technical and Comprehensive Education System.
The CHE maintains historical data on institutions and, when appropriate, three years of data are presented for comparison.
Introduction
2
Section 10, "Campus-Based Assessment," includes a summary of other institutional effectiveness reporting and the web addresses where detailed institutional reports are located. Section 11 contains a link to the institutions’ performance ratings. Institutional Effectiveness Reporting Pursuant to Section 59-101-350 of the South Carolina Code of Laws, 1976, as amended, the CHE is required to report specific higher education data "in a readable format so as to easily compare with peer institutions in South Carolina." This report must be submitted to the Governor and the General Assembly prior to January 15th of each year. This information is included throughout the publication and integrated with performance funding measures when applicable. The information regarding institutional effectiveness reporting required by Section 59-101-350 is found below. Four-Year Institutions • The number and percentage of accredited programs and the number and percentage of programs
eligible for accreditation; • The number and percentage of undergraduate and graduate students who completed their degree
program; • The percent of lower division instructional courses taught by full-time faculty, part-time faculty,
and graduate assistants; • The percent and number of students enrolled in remedial courses and the number of students
exiting remedial courses and successfully completing entry-level curriculum courses; • The percent of graduate and upper division undergraduate students participating in sponsored
research programs; • Placement data on graduates; • The percent change in the enrollment rate of students from minority groups and the change in the
total number of minority students enrolled over the past five years; • The percent of graduate students who received undergraduate degrees at the institution, within the
State, within the United States, and from other nations; • The number of full-time students who have transferred from a two-year, post-secondary institution
and the number of full-time students who have transferred to two-year, post-secondary institutions; • Student scores on professional examinations with detailed information on state and national means,
passing scores, and pass rates, as available, and with information on such scores over time, and the number of students taking each exam;
• Assessment information for the institution's Title II of the Federal Higher Education Act of 1998 report that collects and analyzes data on applicant qualifications and the performance of the candidates and graduates;
• Appropriate information relating to each institution's role and mission to include policies and procedures to ensure that academic programs support the economic development needs in the State by providing a technologically skilled workforce;

Introduction
3
• Any information required by the commission in order for it to measure and determine the institution's standard of achievement in regard to the performance indicators for quality academic success enumerated in Section 59-103-30.
Two-Year Institutions • The number and percentage of accredited programs and the number and percentage of programs
eligible for accreditation; • The number and percentage of undergraduate students who completed their degree program; • The percent of courses taught by full-time faculty members, part-time faculty, and graduate
assistants; • Placement rate on graduates; • The percent change in the enrollment rate of students from minority groups, the number of
minority students enrolled and the change in the total number of minority students enrolled over the past five years;
• The number of students who have transferred into a four-year, post-secondary institution and the number of students who have transferred from four-year, post-secondary institutions;
• Appropriate information relating to the institution's role and mission to include policies and procedures to ensure that academic programs support the economic development needs in the State by providing a technologically skilled workforce;
• Any information required by the commission in order for it to measure and determine the institution's standard of achievement in regard to the performance indicators for quality academic success enumerated in Section 59-103-30.
South Carolina's Performance Funding System for Higher Education Act 359 of 1996, commonly referred to as the "Performance Funding Legislation," dramatically changed the responsibilities of the South Carolina Commission on Higher Education (CHE) concerning how public institutions of higher education are funded. The legislation required that the CHE allocate state appropriations to South Carolina's public institutions of higher education based on their performance in nine areas or "critical success factors." The General Assembly identified several performance indicators that could be used, if applicable to a particular type of institution, in assessing institutions' successes in achieving performance in each of the areas. In all, 37 performance indicators spread across the nine critical success factors are specified. The CHE was assigned the responsibility of developing and implementing a system for basing funding on institutional performance and for defining how each of the specified indicators would be measured. The General Assembly provided for a 3-year phase-in period for implementing a system to provide for available state funding to be allocated based on institutional performance. In compliance with its legislative mandate, the CHE, in cooperation with South Carolina's higher education institutions and other stakeholders in the state's public higher education system, developed a system for determining institutions' funding based on performance across the nine critical success factors using the 37 performance indicators as applicable. The system for determining funding has two major components: 1) a determination of financial needs for the institution and 2) a process for rating the institution based on performance across the indicators.

Introduction
4
The first component, the determination of need (Mission Resource Requirement), identifies the total amount of money an institution should receive based on nationally and regionally comparable costs for institutions of similar mission, size and complexity of programs and by the prior year's level of appropriation. The second component, the performance rating, is determined by assessing whether or not the institution meets, exceeds, or falls short of standards for each indicator. Standards are set either for the individual institution or for institutions within the same sector and are approved annually by the CHE. Each year, the institution is rated on its success in meeting the standards on each of the indicators. These ratings are totaled and expressed as an average score for the institution. Higher scoring institutions with receive a proportionally greater share of available state funding. The CHE is in its 10th year of implementation and is continually working to refine and improve the performance measurement of South Carolina's public higher education institutions. As might be expected, in the ten years since the passage of Act 359 of 1996, the CHE has made revisions and refinements to the overall system as well as to various measures as strengths and weaknesses have been identified. Details related to scoring and measurement of indicators have varied each year, making comparisons across performance rating years difficult. Performance Year 6 (2001-2002) saw the most extensive changes to date in the measurement of the nine Critical Success Factors designated in Act 359. The changes, approved by the CHE in February, 2001, were based on three general experience-based lessons: • There is a common core of critical indicators which is applicable to all sectors. Indicators in this
core are measured every year for all institutions. • There are indicators which are mission-specific to the different sectors defined by the Legislature.
Sector specific measures have been defined for these indicators. • Some indicators were either duplicate measures of similar data; measures of indicators that, once
achieved, were unlikely to change on a year-to-year basis; or measures that would be more effective if they were combined.
This edition of A Closer Look at Public Higher Education in South Carolina reflects these changes in the performance funding measures. The CHE publishes a Performance Funding Workbook that outlines, in detail, all of the performance indicators, how they have been defined, and to whom they apply. The workbook is provided as a guide to be used by institutions. It is also useful to others interested in the performance funding system in South Carolina as it details the measurement and rating system in its entirety. The workbook is published annually and is available on the CHE website (www.che.sc.gov). Development of Standards In Performance Year 5 (2000-01 to impact FY 2001-02 state allocations) the CHE approved sector specific common standards that the CHE staff together with institutional representatives had

Introduction
5
developed. A range of acceptable performance was determined for each indicator. Institutions performing within the range earn a rating of "Achieves," equal to a numerical score of "2." Performance that is above the range earns a rating of "Exceeds," equal to a numerical score of "3," and performance below the range earns a rating of "Does Not Achieve," equal to a numerical score of "1." (Two indicators, 5D and 7F, reverse the direction.) The standards allow for a broad range of performance to achieve the standard and a demanding level of performance to exceed the standard. An institution's performance on an indicator in the range of "Does Not Achieve" or "Achieves" could receive an additional 0.5 performance point if its performance showed significant improvement over its past average performance, as approved by the CHE. The percentage improvement standard varies by indicator, reflecting the type of data being measured. In most cases, an institution must show either a 3% or 5% improvement of the average performance over the past three years. These standards were reviewed after three years have remained in place through Performance Year 9, covered by this report. The scoring standards are based, where possible, on peer data. When peer data is not available, standards have been based on the best available data, including national and state data. If directly comparable data were unavailable at the time standards were developed, estimated data based on sources that may not be directly comparable were considered. When applicable, figures and tables in this document state the standard necessary for an institution to receive a score of "Achieves." Strategic Plan for Higher Education in South Carolina In the spring of 2001, the Commission initiated the process of revising the South Carolina's strategic plan for public higher education. Through a series of meetings of the Planning Advisory Council, and with input from all areas of higher education, the Council of Presidents and the Commission, a plan was developed and refined. The plan was approved by the Commission on January 10, 2002. It is currently under review by the Commission and a committee of institutional presidents. The text of the approved plan follows.
Vision South Carolina's system of public and private higher education will address the needs of the state by
• Creating a well-educated citizenry, • Raising the standard of living of South Carolinians, • Improving the quality of life, • Meeting changing work force needs, • Creating economic development opportunities, • Positioning the state to be competitive in a global economy, and • Fashioning a new generation of public sector and private sector leaders.

Introduction
6
Introduction During the last decade, the state has made significant strides in improving the quality of and access to higher education. The technical colleges have earned a well-deserved reputation for the excellence of their technical and occupational programs and for their responsiveness to the needs of business. They have also positioned themselves to serve as an entry point into higher education for increasing numbers of students. The state's technical colleges and two-year regional campuses have provided greater access to a wide array of university programs at sites across the state. The four-year institutions have developed new programs and strengthened their academic offerings. The state's research universities have expanded their graduate and high technology offerings, increased their admission criteria, and garnered greater external support for research and technology. Yet the growth in state support for higher education has been at best modest, straining public college and university resources. All of South Carolina's higher education institutions, both public and private, have struggled to achieve greater efficiencies and have shifted increasing percentages of their spending to support academic programs. As a result, they operate on lean administrative budgets that are well below national averages for per-student expenditures. Even so, colleges and universities have had to raise tuition and fees, causing students and their parents to pay a higher price for higher education. Tuition charges for the state's public colleges and universities are consistently among the highest in the sixteen-state southeast region. Help has come from the state in the form of dramatic increases in scholarship assistance for those students who qualify. Those who do not qualify, however, face a widening gap between costs and their ability to pay. The prospect of tuition assistance for students enrolled at two-year institutions can provide an avenue into higher education for many of these students but poses problems for the two-year institutions in meeting potential enrollment increases. Tuition covers only 25% of the operational cost per student. With projected enrollment increases of up to 20%, long-term funding for the two-year campuses must take the gap between tuition and costs into account. Adding to the enrollment pressure is a projected increase in the number of high school graduates and an increase in the percentage of these graduates who will be prepared for college. More traditional and non-traditional students will expect to matriculate in the state's colleges and universities. This projected enrollment growth also increases the pressure for additional capital projects to accommodate the greater number of students. Faced with greater demand for services and fewer state resources, the state's colleges and universities are finding it difficult to compete with the best institutions in other states. South Carolina's best college teachers are tempted to leave the state for higher paying positions in more supportive environments. The best researchers are attracted to research universities in other states that provide better equipment and facilities and greater opportunities to collaborate on cutting-edge projects.

Introduction
7
Clearly, in South Carolina more state resources are needed for higher education. At the same time, state budget projections point to several years of belt-tightening, with possible reductions in allocations for state colleges and universities. Even after this period of budget adjustments, the state will face continued competing demands for limited resources. Social services, early childhood education, K-12 education, health care, prisons, roads, and other needs will crowd the legislative agenda. As a result, in South Carolina the prospects for adequate state funding for colleges and universities are not good. In this environment of constricted resources and increasing demands, higher education in South Carolina finds itself at a crossroads. If the state is to compete nationally and globally, it must have a well-educated citizenry capable of working productively and sustaining and enjoying a higher quality of life. Yet, South Carolina is a small state and a comparatively poor one. If it is to provide high quality higher education opportunities, it has significant challenges to overcome. Adversity can lead to positive outcomes. South Carolina can meet its challenges in higher education, but to do so it must marshal its resources and launch a concerted and collaborative effort to focus those resources strategically. Policy makers need to establish priorities and work to have them funded. Institutions need to "work smart" to make up for what they lack in resources. The state must make smart choices for the future of its citizens. In this environment, the following strategic plan sets forth the strategic directions for higher education in South Carolina. Environmental Factors As South Carolina moves resolutely through the first decade of the twenty-first century, it must be prepared to negotiate the following demographic and environmental realities that will affect higher education:
• South Carolina's population increased by 15.1% for 1990-2000, compared to the national
percentage change of 13.2%, which will cause increased demands for access to higher education;
• The college-going rate for South Carolina high school graduates has increased from
51.9% in 1989 to 61.8% in 1999, adding to the increased population of college-bound students;
• Minorities represent only 26% of the population attending college in South Carolina,
compared to 33% of the total population of the state, and receive less than 15% of the state scholarship dollars, underscoring disparities in college attendance rates and scholarship support;
• The state lottery is projected to cover the cost of tuition at the state's two-year colleges,
providing opportunities for students but also straining campus resources;

Introduction
8
• State funding for higher education has declined from 16.5% of the state's budget in 1990
to 15.3% in 2000, and shortfalls in revenue projections and competing demands for state resources make it likely this figure will decline further;
• Workforce shortages are increasing in such fields as information technology,
manufacturing technology, nursing, and teaching, suggesting the need to target educational resources to meet workforce demands;
• While the state population will continue to increase, growth will be uneven, leaving
predominantly rural areas of the state without the benefit of economic development and exacerbating the gap between local tax revenues and local needs for services; and,
• Despite economic gains, South Carolina (82.5%) ranks last among its neighboring states
of North Carolina (91.1%), Virginia (104.4%), Georgia (95.8%), and Florida (97.3%) in percentage of national average per capita income.
These and other demographic and environmental factors make it clear that South Carolina must act promptly and strategically to strengthen key aspects of its higher education system. Strategic Goals To meet the challenges to higher education in South Carolina, the state's public and private colleges and universities and the Commission on Higher Education need to join forces to advance a common agenda. The needs of the state will not be met by fragmented or redundant efforts. The following three strategic initiatives-to increase access to higher education, to develop a nationally competitive research agenda, and to create collaborative partnerships-provide common ground upon which the state's colleges and universities can address the state's needs. 1. Expand Educational Opportunities for South Carolina Citizens As South Carolina takes steps to increase the number high school graduates who are prepared for college, the higher education community needs to develop strategies to accommodate an increased number of students. Particular emphasis should be placed on meeting the needs of traditionally under-served populations including first generation college students, minorities, students from low-income families, and adult learners. Students who have not traditionally thought of attending college should be encouraged to do so. All qualified students should feel empowered to enroll in college, to upgrade their skills and increase their knowledge, to progress from two-year colleges to four-year colleges and universities if they have the ability and desire, and to access continuing educational opportunities throughout their lives. The following goals are identified to provide increased educational opportunities for South Carolina's citizens:

Introduction
9
A. Expand services and promote innovative approaches to reach traditionally underserved populations, including adult learners and minority students;
B. Promote development of distance education courses and programs and virtual library resources to reach students who may not be able to access traditional educational programs;
C. Increase need-based grants and other scholarship resources to provide increased opportunities for lower income students; and
D. Improve articulation of two-year and four-year programs to facilitate transfer of students and increase access to baccalaureate programs.
2. Invest in Research for Economic Development and a Better Quality of Life A cornerstone of economic development is high-level, globally competitive research. Investments in cutting edge research in engineering, health sciences, physical sciences, information systems, environmental sciences, and similar fields yield dividends many times over. Top quality research activity attracts top caliber faculty, who in turn attract funded support from federal agencies such as the National Institutes of Health and the National Science Foundation as well as private research support from industries ranging from pharmaceuticals to software and e-business firms to state-of-the-art manufacturing. New and expanding industries locate in states where research is taking place, creating jobs and stimulating higher educational levels in the population. Much as the Research Triangle has stimulated economic development in North Carolina, so too can research investment in South Carolina spur greater economic growth and benefit the people of the state. Such development takes conscious planning and strategic implementation and should be reflected in the state's strategic plan for higher education. It also takes a commitment to invest the state's resources in ways that will benefit the state exponentially in years to come. The following strategic goals are identified to strengthen the state's investment in higher education research for economic development and a better quality of life:
A. Create a state incentive system to encourage institutions to recruit nationally recognized faculty who can develop and/or strengthen graduate research programs.
B. Designate focus areas for research and graduate program excellence and provide funding incentives for them to attain national and international standing.
C. Support and develop research directed at the economic, social and educational infrastructure of the state drawing from shared data sources and collaborative efforts with other state agencies and private entities.
D. Create programs to strengthen the quality of teaching and learning as the foundation for the state's future scholars and researchers.

Introduction
10
3. Increase Cooperation and Collaboration for Efficiency and Quality At one time higher education might have taken place in an "ivory tower" divorced from other institutions and other concerns. That clearly is no longer the case. In an age of rapidly increasing needs for a more highly educated citizenry, and in an age, too, when there are strong competing demands for the state's resources and real limits on available state funding, it is incumbent on higher education to seek and to expand cooperative relationships. Greater cooperation and coordination between preK-12 education and higher education can lead to shared use of resources, more closely meshed educational planning, better trained teachers and administrators, more closely linked academic programs, better prepared students entering colleges, and the development of effective data bases to track student progress and assess the effectiveness of education in meeting the state's needs. Likewise, enhanced collaboration with business and industry can insure that economic development needs are met, that educational programs remain on the cutting edge of technological advances, and that education is grounded in real world experiences for students and faculty. Finally, increased cooperation among colleges, universities, state agencies, and non-profit entities can result in demonstrable efficiencies and increased quality. The following strategic goals provide an agenda of increased collaborative activity for higher education in South Carolina:
A. Develop collaborative programs with the business community, state agencies, and non-
profit corporations to enhance economic development and the quality of life.
B. Increase both the use of and the technology for sharing data and systems among higher education institutions and with other state agencies and the private sector.
C. Form partnerships with school districts and state agencies to enhance the preparation and continuing training of teachers, the quality of education in the state's public schools, the preparation for school of the state's children, and the support available to students while they are in K-12 schools.
D. Collaborate with local communities and state and local governments to improve the training of health and social service professionals and the delivery of public health and welfare programs.

Section 1 – Mission Focus
11
Section 1 Mission Focus

Section 1 – Mission Focus
12
(blank page)

Section 1 – Mission Focus
13
MISSION FOCUS The first critical success factor listed in Act 359 of 1996 is “Mission Focus.” The relevant performance funding indicators for this critical success factor are:
1B - Curricula Offered to Achieve Mission; 1C - Approval of Mission Statement; 1D/E - Adoption of a Strategic Plan to Support the Mission Statement; Attainment of Goals of the Strategic Plan.
The General Assembly in Act 359 of 1996 has determined the following missions for each sector:
Research institutions
• college-level baccalaureate education, master's, professional, and doctor of philosophy degrees which lead to continued education or employment;
• research through the use of government, corporate, nonprofit-organization grants, or state resources, or both;
• public service to the State and the local community; Four-year colleges and universities
• college-level baccalaureate education and selected master's degrees which lead to employment or continued education, or both, except for doctoral degrees currently being offered;
• limited and specialized research; • public service to the State and the local community;
Two-year institutions - branches of the University of South Carolina
• college-level pre-baccalaureate education necessary to confer associates' degrees which lead to continued education at a four-year or research institution;
• public service to the State and the local community;
State technical and comprehensive education system • all post-secondary vocational, technical, and occupational diploma and associate degree
programs leading directly to employment or maintenance of employment and associate degree programs which enable students to gain access to other post-secondary education;
• up-to-date and appropriate occupational and technical training for adults; • special school programs that provide training for prospective employees for prospective and
existing industry in order to enhance the economic development of South Carolina; • public service to the State and the local community; • continue to remain technical, vocational, or occupational colleges with a mission as stated
above and primarily focused on technical education and the economic development of the State.
Review of Programs The Commission on Higher Education (CHE), through its Division of Academic Affairs, has reviewed existing academic programs to ensure the quality and integrity of degree-granting programs in the public higher education sector. In its broadest context, program review serves as an instrument for gauging the health of the state’s academic programs as well as a strategic planning device for determining the present and future needs of specific discipline areas (i.e., new program development)

Section 1 – Mission Focus
14
throughout South Carolina. Program review was incorporated into performance funding for the first time during the 1999-2000 performance year as part of Indicator 1B – Curricula Offered to Achieve Mission, which is detailed following the discussion regarding program review. Program Review of Senior-Level Institutions The CHE has placed programs at the senior institutions it reviews on eight-year cycles. The cycles were developed in consultation with the chief academic officers of the colleges and universities and are categorized using broad descriptors (e.g., English, Life Sciences, Physical Sciences). Measuring the success of academic programs has been a complex and multifaceted task which requires funding support. Due to budget constraints, program review other than of teacher education programs has not been conducted since 2000- 2001. The following table outlines the disciplines that have been reviewed for the senior institutions over the last 8 years. Table 1.1 Programs Reviewed During the Academic Year as Part of CHE’s Program Review Process, SC Public 4-Year Institutions Source: CHE Academic Affairs Division
Academic Year Classification SC Public 4-Year Institutions with Programs in the Area Listed at Left 1999-2000 Business Clemson, USC Columbia, The Citadel, Coastal Carolina, College of Charleston, Francis Marion,
Lander, SC State, USC Aiken, USC Spartanburg, Winthrop Foreign Languages Clemson, USC Columbia, The Citadel, College of Charleston, Francis Marion, Lander, SC State,
USC Spartanburg, Winthrop Home Economics SC State, Winthrop Nursing Clemson, USC Columbia, MUSC, Lander, SC State, USC Aiken, USC Spartanburg
2000-2001 Computer Science Clemson, USC Columbia, the Citadel, Coastal Carolina, College of Charleston, Francis Marion, Lander, SC State, USC Spartanburg, Winthrop,
Engineering and Engineering Tech
Clemson, USC Columbia, The Citadel, Francis Marion, SC State
2001-2002
2002-2003 2003-2004 Education USC Columbia, USC Upstate1, Winthrop, Coastal Carolina, SC State, USC Aiken
2004-2005 Education Clemson, College of Charleston , Francis Marion, Lander, The Citadel
1 Formerly USC Spartanburg

Section 1 – Mission Focus
15
Program Review of the USC Regional Campuses and the Technical College System This review begins with associate degree programs found in the University of South Carolina’s regional campuses and then proceeds to the much larger and more varied set of associate degree programs offered in the State’s 16 technical colleges. The procedures for this annual review require each program’s productivity to be evaluated in terms of enrollment, number of graduates, and percent of graduates placed in a related job or continuing their studies full-time. The purpose is twofold: 1) to ensure that programs to be continued are responsive to employment trends and meet minimum standards; and 2) to identify programs which need to be strengthened. Two-Year Institutions-Regional Campuses of USC All of the 4 two-year regional campuses of USC offer the Associate of Arts/Associate of Science degree programs. Each of the AA/AS programs at these campuses is enrolling and graduating students in satisfactory numbers. Based on the CHE’s “Annual Evaluation of Associate Degree Programs Report,” FY 2002-2003, the number of degree completers in these programs is satisfactory. Of the two-year regional campuses of USC, only USC Lancaster offers applied two-year technical degrees. Additional programs at USC Lancaster include nursing (joint program with York Tech), criminal justice, and business. Since a merger of two under-performing business related programs at the campus in June 1995, the combined business program has met the criterion for “good” for both enrollments and graduation rates. State Technical and Comprehensive Education System This review is administered and reported to the CHE by the State Board for Technical and Comprehensive Education each year. All of the institutions’ associate degree programs are rated and placed in a category, as shown below, based on enrollment, number of graduates, and percentage of graduates placed in a related job or continuing their studies full-time. The following criteria apply:
1) Each program must produce at least 6 graduates during the evaluation year or an average of at least 6 graduates over the most recent 3-year period;
2) At the most recent Fall term, each program must enroll at least 16 students who generate 12 full-time equivalents; and
3) At least 50% of the graduates available for job placement must be placed in a job related to their education or continue their education on a full-time basis.
Programs that fail to meet the above criteria must be canceled, suspended, or put on probation unless their continuation is justified to the CHE. Table 1.2 Program Status at Technical Colleges
Institution Good Good-Justified Probation Suspended Canceled 2002 2003 2004 2002- 2003 2004 2002 2003 2004 2002 2003 2004 2002 2003 2004 Aiken 13 12 12 - - - 3 3 - 1 2 3 - - -
Central Carolina 16 15 13 - 1 - 2 - 1 - - 1 - - -
Denmark 11 10 8 - - - - 1 1 - - - - - -
Florence-Darlington
22 23 22 - 1 - 4 2 3 - - - 1 2 -
Greenville 34 34 32 - - - 1 1 - 2 2 1 - - 1

Section 1 – Mission Focus
16
Institution Good Good-Justified Probation Suspended Canceled 2002 2003 2004 2002- 2003 2004 2002 2003 2004 2002 2003 2004 2002 2003 2004
Horry-Georgetown
20 20 19 - - - 1 1 - 2 1 - - 1 -
Midlands 26 24 24 1 2 1 2 1 2 3 4 1 - - 2
Northeastern 9 9 8 - - - 1 1 - - - - - - -
Orangeburg-Calhoun
17 18 17 - - - 1 - 1 - 1 - - 2 1
Piedmont 21 21 21 - - - 1 1 - - - - - - -
Spartanburg 21 23 21 - - - 3 - - 1 2 1 1 2 -
TCL 11 9 9 - - - 1 3 - - - 1 - - -
Tri-County 18 19 20 - - - 3 2 - - - - - - -
Trident 28 29 26 1 1 1 3 2 4 - - - - 1 -
Williamsburg 5 6 3 - - - 1 - 1 - - - - - -
York 20 19 19 - - - - 1 - - - - - - -
Total 292 291 274 2 5 2 26 19 13 10 12 8 2 8 4
Curricula Offered at Institutions Performance Funding Indicator 1B – Curricula Offered to Achieve Mission is based on the institution’s approved mission statement and measures as the percentage of “degree programs” which:
1) are appropriate to the degree-level authorized for the institution by the CHE and Act 359 of 1996
2) support the institutions’ goals, purpose, and objectives as defined in the approved mission statement; and
3) have received “full approval” in the most recent CHE review of that program. This data for this indicator are under review as of January 14, 2007. The following discussion and Table 1.3 refer to the previous year’s data and are included as an indication of the institutions’ status as of the publication of this document. There is no reason to anticipate major changes in status with the updated data. Research and Teaching Sector Institutions: The measure applies to MUSC and 4-year institutions, as a scored indicator in which a resulting percentage is determined and that percentage is scored against numeric standards of achievement as approved by the CHE. All three criteria listed in the above measure apply. For the past performance year, institutions with performance from 95% to 99%, or all but one program not meeting each criteria, earned a score of “Achieves” or “2.” Degree Programs are those approved by the CHE as listed in the Inventory of Academic Programs as of February 2005, for purposes of determining Year 9 (2004-05) performance. To determine performance, degree programs are counted at the level of the degree designation (e.g., BA, BS, MA, and PhD). Degree programs offered at multiple sites by an institution are counted once. For example, an institution offers a BS in French at its campus and another off-site location, the BS in French is counted as one program. An exception to this general rule is made when CHE program reviews are conducted at the "option-level" of a degree. In such cases, each option reviewed is counted. For example, if an institution offers a BA degree in Secondary Education with options in English, History and Social Studies and the areas were reviewed separately, then the 3, not 1, degree programs would be counted. However, if the Secondary Education degree program were reviewed as

Section 1 – Mission Focus
17
a whole, then it would count as one program. To date, this exception has applied primarily to teacher education programs. CHE Program Reviews considered here apply to MUSC and 4-year institutions. Reviews since 1995-96 and the status of those reviews as of March 2005 are considered. The results of past reviews updated to the current status based on actions taken by institutions and approved by CHE for addressing cases are included as well as the initial result of reviews completed since the last performance measurement. The resulting numbers and percentages shown in the following table (Table 1.3) for Indicator 1B are based on the Inventory of Academic Programs and program review activity as of the year assessed. Table 1.3 Curricula Offered to Achieve Mission Source: Data compiled based on data from CHE Division of Academic Affairs Inventory of Programs and Annual Program Review as of May, 2005
Research and Teaching Sector Institutions # Meeting
Each Criterion
Total # of Programs
% Meeting Each
Criterion # meeting criterion 3*
Yr 9 Performance
# meeting criterion
1
# meeting criterion
2
()= number of programs with full approval of
number reviewed
Clemson 207 207 100% 207 207 207 (127 of 127)
USC Columbia 317 319 99% 319 319 317 (194 of 196)
MUSC 43 43 100% 43 43 43 (25 of 25)
The Citadel 43 44 98% 44 44 43 (30 of 31) Coastal Carolina University 28 45 62% 28 28 28 (11 of 28)
College of Charleston 139 139 100% 139 139 139 (91 of 91)
Francis Marion University 56 56 100% 56 56 56 (36 of 36)
Lander University 44 44 100% 44 44 44 (21 of 21)
SC State University 77 87 89% 87 87 77 (62 of 72)
USC Aiken 30 30 100% 30 30 30 (17 of 17)
USC Beaufort ** 12 12 100% 12 12 12 (0 of 0)
USC Upstate 45 50 90% 50 50 45 (28 of 33)
Winthrop University 90 90 100% 90 90 90 (64 of 64)
* "# Meeting Criterion 3" include those with full approval plus all programs not reviewed to date. The bracketed information, to the right of the number indicating the number of programs meeting the criteria, indicates the "# of programs reviewed with full approval" of the "# of programs reviewed."
**USC Beaufort was approved as a four-year degree granting institution in July 2002.

Section 1 – Mission Focus
18
Note: Recommendations for the National Council for the Accreditation of Teacher Education Review of Programs at the University of South Carolina - Columbia, University of South Carolina - Upstate, and Winthrop were considered by the Commission at its July 8, 2004 meeting. The results for these institutions have been included. Additionally, such reviews were completed for Coastal Carolina University, South Carolina State University and University of South Carolina - Aiken, and the results were considered by CHE on May 5, 2005
Because program review for the two-year public institutions is quantitative rather than qualitative in nature, part 3 of indicator 1B does not apply to the regional campuses of USC or the technical colleges. For these institutions, performance on Indicator 1B is assessed by determining the percentage of programs offered by an institution meeting the first two criteria. Those at 100% earn compliance on this indicator.
2-Year Institutions # Meeting all Criteria
Total # of Programs
Compliance If All Programs Meet Applicable Criteria
Yr 9 Performance
USC Lancaster 5 5 Compliance
USC Salkehatchie 2 2 Compliance
USC Sumter 2 2 Compliance
USC Union 2 2 Compliance Aiken Tech 20 20 Compliance
Central Carolina Tech 17 17 Compliance
Denmark Tech 11 11 Compliance
Florence-Darlington Tech 27 27 Compliance
Greenville Tech 34 34 Compliance
Horry-Georgetown Tech 27 27 Compliance Midlands Tech 31 31 Compliance
Northeastern Tech 9 9 Compliance
Orangeburg-Calhoun Tech 23 23 Compliance
Piedmont Tech 24 24 Compliance
Spartanburg Community College* 21 21 Compliance
Tech Coll. of the Low Country 15 15 Compliance
Tri-County Tech 20 20 Compliance
Trident Tech 32 32 Compliance
Williamsburg Tech 5 5 Compliance
York Tech 21 21 Compliance
*Formerly Spartanburg Technical College

Section 1 – Mission Focus
19
Curricula Offered to Achieve Mission
0%25%50%75%
100%
% o
f Pro
gram
s M
eetin
g C
riter
ia
2003-2004 100% 100% 100%
2004-2005 100% 99% 100%
2005-2006* - - -
Clemson USC Columbia M USC
Figure 1.1 Performance Indicator 1B – Curricula Offered to Achieve Mission
Source: Data based on data from CHE Division of Academic Affairs Inventory of Programs and Annual Program Review
Research Institutions – For Year 10 (2005-06) scores, a performance level of 95% - 99% or, if <95%, all but 1 meeting the criteria was required in order to score “Achieves.” Teaching Institutions – For Year 10 (2005-06) scores, a performance level of 95% - 99%, or if <95%, all but one meeting the criteria was required in order to score “Achieves.” This was a scored indicator for USC Beaufort in Year 8 (2003 -2004), with a score of “Achieves (2)” based on having 3-8 programs approved.
Curricula Offered to Achieve Mission
0%
25%
50%
75%
100%
% o
f Pro
gram
s M
eetin
gC
riter
ia
2003-2004 98% 100% 100% 100% 100% 99% 100% - 100% 100%
2004-2005 98% 62% 100% 100% 100% 89% 100% 100% 90% 100%
2005-2006* - - - - - - - - - -
The Citadel Coastal Carolina
College of Charleston
Francis M arion Univ.
Lander University
SC State Univ.
USC Aiken U.S.C. - Beaufort
USC Upstate**
Winthrop University
*Data under review. The inventory and program status will be updated next in spring 2007. ** Formerly USC Spartanburg. Two-year Regional Campuses of USC and Technical Colleges – Indicator 1B is a compliance indicator for these institutions. All scored in compliance in Year 10 (2005-06) and the two previous years. Indicator 1C – Mission Statements Each institution currently has a Commission on Higher Education (CHE) approved mission statement, as required by Indicator 1C – Approval of Mission Statement. Revised statements are reviewed by the CHE for approval as they are submitted by the institutions. Each institution’s mission statement, as approved by the CHE, can be accessed through the web pages listed below or through the CHE’s web site at http://www.che.sc.gov.

Section 1 – Mission Focus
20
Institutional Mission Statements Research Institutions Clemson University http://www.clemson.edu/welcome/quickly/missin/index.htm Medical University of South Carolina http://www.edserv.musc.edu/musc_mission/ University of South Carolina-Columbia http://kudzu.ipr.sc.edu/mission/ Four-Year Colleges and Universities The Citadel http://citadel.edu/r3/about/values/mission.shtml Coastal Carolina University http://www.coastal.edu/about/mission.html College of Charleston http://www.cofc.edu/trustee/mission.html Francis Marion University http://www.fmarion.edu/about/Mission Lander University http://www.lander.edu/mission.html South Carolina State University http://www.scsu.edu/AboutSCSU/Mission.htm USC-Aiken http://www.usca.edu/aboutusca/mission.html USC-Beaufort http://www.sc.edu/beaufort/academicaffairs/institutionaleffect/missions.shtml USC-Upstate http://www.uscupstate.edu/about_upstate/facts.asp Winthrop University http://www.winthrop.edu/president/mission.htm Regional Campuses USC-Lancaster http://kudzu.ipr.sc.edu/mission/ USC-Salkehatchie http://kudzu.ipr.sc.edu/mission/ USC-Sumter http://kudzu.ipr.sc.edu/mission/ USC-Union http://kudzu.ipr.sc.edu/mission/
State Technical and Comprehensive Education System Aiken Technical College http://www.atc.edu/theCollege_vision.htm Central Carolina Technical College http://www.cctech.edu/about/mission.asp Denmark Technical College http://www.denmarktech.edu/mission.htm Florence-Darlington Technical College http://www.fdtc.edu/AboutUs/mission/default.asp Greenville Technical College http://www.greenvilletech.com/alumni_and_friends/mission.html Horry-Georgetown Technical College http://www.hgtc.edu/welcome/mission.htm Midlands Technical College http://midlandstech.edu/mission.htm Northeastern Technical College http://www.netc.edu/GeneralInfo1.html#anchor275101 Orangeburg-Calhoun Technical College* http://www.octech.edu/octech/aboutus/mission.asp Piedmont Technical College http://www.ptc.edu/about_ptc/mission.htm Spartanburg Community College http://www.sccsc.edu/Mission.asp Technical College of the Lowcountry http://www.tcl.edu/mission.asp Tri-County Technical College http://www.tctc.edu/visitors_media/college_information/mission.html Trident Technical College http://www.tridenttech.edu/261.htm Williamsburg Technical College http://www.wiltech.edu/mission.htm York Technical College http://www.yorktech.com/ie/ytcMission.htm *Formerly Spartanburg Technical College

Section 1 – Mission Focus
21
Indicator 1D/E – Adoption of a Strategic Plan to Support the Mission Statement: Attainment of Goals of the Strategic Plan Performance Indicator. This indicator is defined for each institution through the submission of individual goals by the institutions and their approval by the Commission. Each institution sets annual performance criteria for scoring purposes for the three-year goal. Academic Programs to Provide a Technologically Skilled Workforce
In 2001, the South Carolina Legislature amended Section 59-101-350 of the South Carolina Code of Laws, 1976, as amended, to include the following as an Institutional Effectiveness reporting requirement.
Appropriate information relating to the institution's role and mission to include policies and procedures to ensure that academic programs support the economic development needs in the State by providing a technologically skilled workforce. (added text underlined.)
The institutions of the state have included a section relating to the above requirement in their Institutional Effectiveness Reports. Links to these reports are found in Section 10 of this document.

Section 1 – Mission Focus
22
(blank page)

Section 2 – Quality of Faculty
23
Section 2 Quality of Faculty

Section 2 – Quality of Faculty
24
(blank page)

Section 2 – Quality of Faculty
25
Percent of Full-Time Faculty with Terminal Degrees
0.0%25.0%50.0%75.0%
100.0%
Fall 2003 97.6% 95.4% 99.2%
Fall 2004 96.2% 95.7% 99.2%
Fall 2005* 97.6% 90.6% 99.1%
Clemson USC Columbia M USC
QUALITY OF FACULTY The second critical success factor in performance funding looks at the quality of faculty at South Carolina's public institutions. Indicators used to assess this factor in Year 10 are:
2A - Academic and Other Credentials of Professors and Instructors; 2D - Compensation of Faculty;
Academic and Other Credentials of Professors and Instructors Indicator 2A, “Academic and Other Credentials of Professors and Instructors,” is a measure of the academic credentials of faculty. Prior to Year 6, the measure of 2A consisted of multiple subparts, each considering credentials of faculty teaching undergraduates. In Year 6, the measure was redefined to provide a better focus for each sector. Research, Teaching, and Regional Campuses Sector Institutions are measured on the percentage of full-time faculty with a terminal degree in their primary teaching area. Technical Colleges are measured on the percentage of faculty teaching in the Fall who meet minimum SACS criteria for credentials. Standards of achievement vary across the sectors and are indicated in the charts below. Additional detail and definitions can be found in the Performance Funding Workbook, Revised October 2004: http://www.che.sc.gov/Finance/Perf_Fund/Yr9WorkBook_Rev.htm. Figure 2.1 Percent of Full-Time Faculty with Terminal Degrees in the Primary Teaching Area Source: CHEMIS and Institutional Reports to CHE Research Universities 2A - Percentage of full-time faculty with terminal degrees in the primary teaching area.
For Year 10 (2005-06) , a standard of 75 - 84% earned a score of "Achieves" for 2A. This indicator does not include Instructors for the Research and Teaching sectors.

Section 2 – Quality of Faculty
26
Percent of Full-Time Faculty with Terminal Degrees
0.0%25.0%50.0%75.0%
100.0%
Fall 2003 95.1% 90.6% 90.0% 87.7% 86.3% 86.3% 93.9% 85.7% 97.5% 89.4%
Fall 2004 90.7% 88.1% 88.6% 88.6% 86.7% 93.4% 94.3% 89.3% 93.2% 89.6%
Fall 2005* 94.1% 89.9% 88.7% 87.7% 85.4% 95.7% 93.5% 87.5% 96.6% 92.4%
The Citadel Coastal Carolina
College of Charleston
Francis M arion
Lander University
SC State Univ.
USC Aiken USC Beaufort
USC Upstate*
Winthrop University
Percent of Full-Time Faculty with Terminal Degrees
0.0%
25.0%
50.0%
75.0%
100.0%
Fall 2003 65.2% 70.6% 82.1% 62.5%
Fall 2004 62.5% 64.7% 82.1% 57.1%
Fall 2005* 60.0% 76.5% 80.0% 75.0%
USC Lancaster USC Salkehatchie USC Sumter USC Union
Four-Year Colleges and Universities 2A - Percentage of full-time faculty with terminal degrees in the primary teaching area. For Year 10 (2005-06) , a standard of 70 - 84% earned a score of "Achieves" for 2A. This indicator does not include Instructors for the Research and Teaching sectors.
*Formerly USC Spartanburg Two-Year Institutions-Regional Campuses of USC
2A - Percentage of full-time faculty, including Instructors, with terminal degrees in the primary teaching area. For Year 10 (2005-06), a standard of 60-74% earned a score of "Achieves."

Section 2 – Quality of Faculty
27
Percent of Full-Time Faculty Meeting SACS Criteria
0.0%25.0%50.0%75.0%
100.0%
Fall 2003 100.0% 100.0% 100.0% 100.0% 100.0% 100.0% 100.0% 100.0%
Fall 2004 100.0% 99.7% 100.0% 100.0% 100.0% 100.0% 100.0% 100.0%
Fall 2005* 100.0% 100.0% 100.0% 100.0% 100.0% 100.0% 100.0% 100.0%
Orangeburg-Calhoun
Piedmont Tech Spartanburg CC*
Tech Coll. of LowCountry
Tri-County Tech
Trident Tech Williamsburg Tech
York Tech
Technical College System Figure 2.2 – Indicator 2A- Percentage Teaching in the Fall Who Meet Minimum SACS Degree Criteria for Credentials
For Year 10 (2005-06) , a standard of 98-99.9%, or all but one meeting criteria, earned a score of
"Achieves."
Percent of Full-Time Faculty Meeting SACS Criteria
0.0%25.0%50.0%75.0%
100.0%
Fall 2003 100.0% 100.0% 100.0% 100.0% 100.0% 100.0% 100.0% 100.0%
Fall 2004 100.0% 100.0% 100.0% 100.0% 100.0% 100.0% 100.0% 100.0%
Fall 2005* 100.0% 100.0% 100.0% 100.0% 99.7% 100.0% 99.8% 100.0%
Aiken Tech Central Carolina
Denmark Tech
Florence-Darlington
Greenville Tech
Horry-Georgetown
M idlands Tech
Northeastern Tech
*Formerly Spartanburg Technical College

Section 2 – Quality of Faculty
28
Compensation of Faculty - Asst. Professors
$0$20,000$40,000$60,000$80,000
Ave
rage
Sal
ary
Fall 2003 $56,143 $58,423 $65,362
Fall 2004 $60,213 $62,675 $70,355
Fall 2005* $62,495 $61,276 $71,372
Clemson USC Columbia M USC
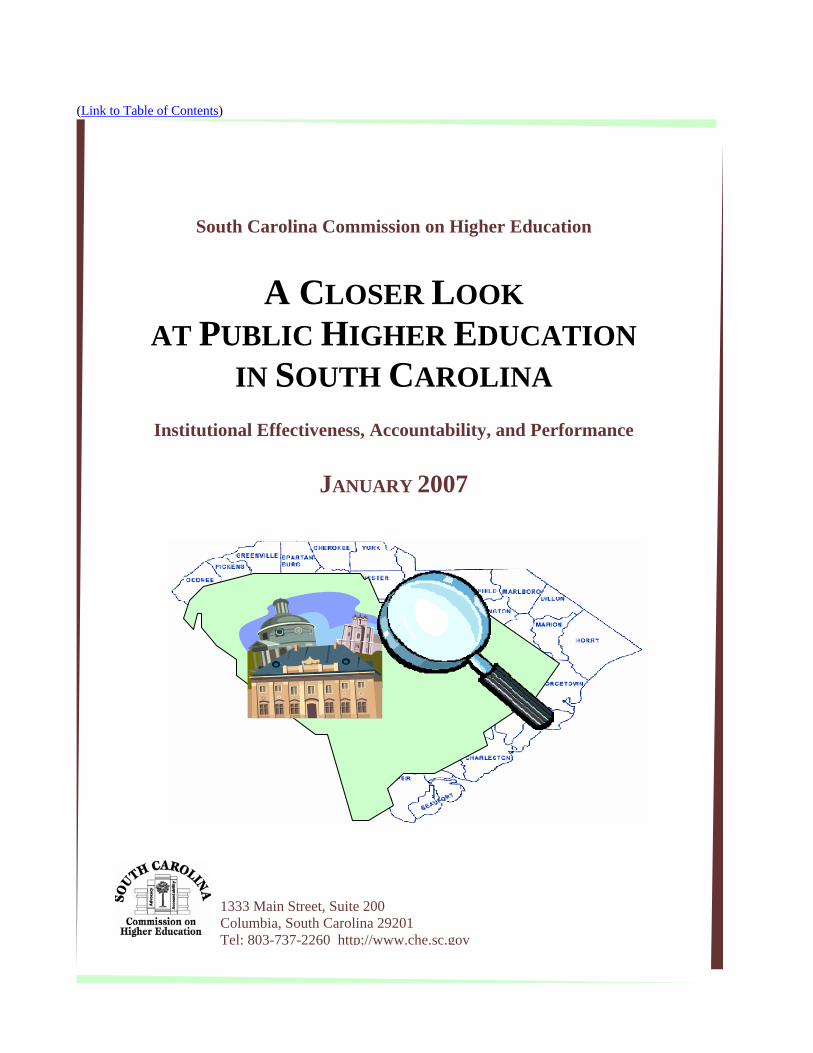
Compensation of Faculty Indicator 2D – Compensation of Faculty as a measure of average faculty salaries. For research and teaching sector institutions, the average by rank for the ranks of professor, associate professor, and assistant professor is measured. A score is earned for each rank average. These individual scores are averaged to produce the indicator score earned. Standards of achievement are listed in the figures below detailing the average by rank for research and teaching institutions. For the Two-Year Campuses of USC and for the Technical Colleges, the average faculty salary data are displayed. Indicator 2D measures the average faculty salary for each two-year institution. The regional campuses of USC are assessed based on the overall average salary due to the low numbers of faculty at the various ranks. In the State Technical and Comprehensive Education System, faculty rank does not apply, so technical colleges are assessed on average faculty salary. Full-time faculty includes those whose annual salary is not zero, who have an employment status of full-time and a primary responsibility of instruction (greater than 50% of assigned time). For medicine and dentistry, salaries less than or equal to $40,000 are excluded. For technical colleges, unclassified continuing education program coordinators are included. Average salary is defined as nine to ten month salaries or eleven to twelve month salaries converted to nine month salaries. Salaries for basic and clinical medicine are not converted. For Year 10 (2005-06), Fall 2005 data were considered. Figure 2.3 Indicator 2D – Compensation of Faculty Source: IPEDS Salaries Survey (9-month contract basis) Assistant Professors, Research Universities
For Year 10 (2005-06) ratings, "Achieves" ranges were: $42,773 - $50,740 for Clemson, $44,718 - $53,047 for USC Columbia, and $54,028 –$ 64,091 for MUSC.

Section 2 – Quality of Faculty
29
Compensation of Faculty - Assoc. Professors
$0$20,000$40,000
$60,000$80,000
$100,000
Ave
rage
Sal
ary
Fall 2003 $64,342 $65,860 $75,690
Fall 2004 $67,217 $69,501 $81,637
Fall 2005* $69,760 $69,367 $82,331
Clemson USC Columbia M USC
Compensation of Faculty - Asst. Professors
$0
$20,000
$40,000
$60,000
Ave
rage
Sal
ary
Fall 2003 $47,148 $44,887 $45,268 $42,672 $41,897 $44,375 $43,641 $42,679 $42,461 $45,908
Fall 2004 $48,957 $48,248 $47,196 $44,937 $43,937 $47,811 $45,473 $44,224 $44,287 $47,433
Fall 2005* $52,627 $51,395 $49,596 $47,265 $46,679 $49,066 $48,372 $47,803 $47,334 $50,621
The Cit adelCoast al
Carolina Univ.College of
Charlest onFrancis
Marion Univ.Lander
Universit ySC St at e
Univ.USC Aiken USC Beauf ort USC Upst at e*
Wint hrop Universit y
Assistant Professors, Four-Year Colleges and Universities For Year 10 (2005-06) ratings, the "Achieves" range was $36,840 - $43,701 for Four-Year Colleges and Universities.
*Formerly USC Spartanburg Associate Professors, Research Universities
For Year 10 (2005-06) ratings, "Achieves" ranges were: $50,643- $60,075 for Clemson, $52,038 - $61,730 for USC Columbia, and $62,855 - $74,562 for MUSC.
Associate Professors, Four-Year Colleges and Universities For Year 10 (2005-06) ratings, the "Achieves" range was $44,787 - $53,129 for Four-Year Colleges and Universities
Compensation of Faculty - Assoc. Professors
$0$20,000$40,000$60,000$80,000
Ave
rage
Sal
ary
Fall 2003 $55,885 $53,937 $53,901 $53,524 $51,007 $51,394 $51,849 $50,542 $51,695 $54,456
Fall 2004 $60,986 $56,615 $57,400 $56,514 $52,552 $56,815 $54,798 $52,665 $53,519 $57,919
Fall 2004 $64,425 $59,385 $60,165 $57,201 $52,603 $58,297 $58,375 $53,393 $55,057 $60,168
The Cit adelCoast al
Carolina College of
Char lest onFrancis
Mar ion Univ.Lander
Universit ySC St at e
Univ.USC Aiken
USC Beauf ort
USC Upst at e*Wint hrop
Universit y
*Formerly USC Spartanburg

Section 2 – Quality of Faculty
30
Compensation of Faculty - Professors
$0$20,000$40,000$60,000$80,000
$100,000
Ave
rage
Sal
ary
Fall 2003 $85,956 $91,164 $104,180
Fall 2004 $90,644 $96,045 $109,415
Fall 2005* $94,641 $98,275 $113,575
Clemson USC Columbia M USC
Compensation of Faculty - Professors
$0$20,000$40,000$60,000$80,000
$100,000
Ave
rage
Sal
ary
Fall 2003 $67,072 $62,281 $68,135 $59,298 $57,008 $55,282 $63,915 $57,114 $60,819 $62,403
Fall 2004 $74,514 $68,471 $71,298 $61,215 $58,422 $62,599 $66,002 $62,865 $61,430 $65,448
Fall 2005* $77,745 $71,845 $75,055 $66,422 $58,640 $64,848 $69,035 $61,982 $65,709 $69,727
The Citadel Coastal Carolina
College of Charleston
Francis M arion
Lander University
SC State Univ.
USC Aiken USC Beaufort
USC Upstate*
Winthrop University
Compensation of Faculty - Full Time Faculty
$0$15,000$30,000$45,000$60,000
Ave
rage
Sal
ary
Fall 2003 $48,548 $43,705 $48,297 $44,793
Fall 2004 $51,074 $46,281 $50,316 $45,924
Fall 2005* $50,822 $49,023 $51,660 $50,277
USC Lancaster USC Salkehatchie USC Sumter USC Union
Professors, Research Universities For Year 10 (2005-06) ratings, "Achieves" ranges were $69,558 - $82,514 for Clemson, $71,798 - $85,171 for USC Columbia, and $79,965 - $94,858 for MUSC.
Professors, Four-Year Colleges and Universities For Year 10 (2005-06) ratings, the "Achieves" range was $56,164 - $66,624 for Four-Year Colleges and Universities
*Formerly USC Spartanburg Two-Year Institutions-Branches of USC The data below represent the average full-time faculty salary over the last three years.
For Year 10 (2005-06) ratings, an "Achieves" range of $35,687- $45,156 applied.

Section 2 – Quality of Faculty
31
Compensation of Faculty - Full Time Faculty
$0$15,000$30,000$45,000$60,000
Ave
rage
Sal
ary
Fall 2003 $37,914 $38,516 $40,672 $41,190 $38,827 $40,588 $30,513 $41,390
Fall 2004 $39,819 $40,201 $41,161 $42,437 $39,587 $42,057 $30,712 $43,363
Fall 2005* $40,975 $41,711 $42,418 $45,676 $41,512 $43,767 $32,166 $44,719
Orangeburg-Calhoun
Piedmont Tech
Spartanburg CC*
Tech Coll. o f LowCountry
Tri-County Tech
Trident Tech Williamsburg Tech
York Tech
State Technical and Comprehensive Education System The data below represent the average of all full-time faculty over the last three years. The technical colleges do not have faculty rank. For Year 10 (2005-06) ratings, an "Achieves" range of $34,188 - $43,260 applied.
Compensation of Faculty - Full Time Faculty
$0$15,000$30,000$45,000$60,000
Ave
rage
Sal
ary
Fall 2003 $41,990 $39,220 $34,867 $40,642 $40,756 $40,407 $41,338 $34,168
Fall 2004 $44,971 $40,357 $35,113 $43,395 $41,495 $43,134 $43,281 $35,390
Fall 2005* $46,767 $42,123 $36,667 $45,737 $42,703 $44,904 $45,425 $35,972
Aiken Tech Central Caro lina
Denmark Tech
Florence-Darlington
Greenville Tech
Horry-Georgetown
M idlands Tech
Northeastern Tech
*Formerly Spartanburg Technical College

Section 2 – Quality of Faculty
32
(blank page)

Section 3 – Classroom Quality
33
Section 3 Classroom Quality

Section 3 – Classroom Quality
34
(blank page)

Section 3 – Classroom Quality
35
CLASSROOM QUALITY This section presents a group of tables and performance funding indicators designed to give a picture of the overall quality of the classroom experience in South Carolina’s institutions of higher education. Table 3.1, required by Act 255, as amended, indicates the number and percentage of course sections taught by full-time faculty, part-time faculty and graduate assistants. Data on national accreditation of specific academic degree programs are provided in Table 3.2, which summarizes the number of programs at each institution that are eligible for accreditation based on a CHE-approved list of agencies and programs and the number of those that are accredited. Some accrediting bodies (e.g., education and public health) accredit schools or units within the institutions, while others (e.g., business and engineering) accredit individual programs within the school or unit. The numbers seen in Table 3.2 reflect the number of accrediting agencies that acknowledge one or more programs at the institutions. The process of accreditation involves an external review based on national standards typically pertaining to the curriculum, faculty, students, resources and overall administration of the program; therefore, attainment of such accreditation is often considered an indication of overall program quality. However, some institutional administrators intentionally choose not to pursue accreditation for an accreditable program because the cost to do so is considered too high. In performance funding, institutions are measured on the percentage of accredited programs, with the standard for an “Achieves” being 90 – 99%, or all but one program accredited. Measurement details for each institution are displayed in Section 11. Institutional performance on this indicator for Performance Year 10 (2005-06) is shown in Figure 3.1. Each Teaching Sector institution is expected to attain accreditation by the National Council for Accreditation of Teacher Education (NCATE). Performance funding indicator 3E-Institutional Emphasis on Quality Teacher Education and Reform encompasses this accreditation measure within subpart 3E1-Program Quality, NCATE Accreditation. To earn credit, attainment of initial accreditation and maintaining such accreditation once achieved are expected. As of June 30, 2000, all public teacher education programs in South Carolina were accredited by NCATE, and remain so. Beginning in Year 6, the Research Sector is no longer included in Indicator 3E. However, their education programs also meet NCATE standards and are accredited. This accreditation is also included as part of indicator 3D-Accreditation of Programs. Also as part of Indicator 3E-Institutional Emphasis on Quality of Teacher Education and Reform, Teaching Sector institutions are measured on the success of their graduates on teacher certification exams (3E2) and on producing teaching graduates who can fill critical shortages - both for specific subject areas (3E3a) and for minority teachers (3E3b). These data are displayed in Figures 3.2 – 3.4.

Section 3 – Classroom Quality
36
Courses Taught by Full-Time and Part-Time Faculty and by Graduate Assistants Provided here are data across all four sectors on the type of instructional personnel used to teach Lower Division sections during Fall 2005. Full-time Faculty are those personnel at the institution who were identified as full-time at the institution, had primary responsibility (over 50%) for instruction, and had a reported salary on CHEMIS. This definition captures faculty that were included under the Salaries, Tenure, and Fringe Benefit report. For the technical colleges, unclassified continuing education program coordinators are counted as faculty. Lower Division here represents those courses that were coded in the CHEMIS course file as Remedial or Lower Division, including courses offered for credit toward the first and second year of an associates degree program and technical/vocational degrees offered below the baccalaureate level. TABLE 3.1 LOCATED ON THE NEXT PAGE

Section 3 – Classroom Quality
37
TABLE 3.1 - Courses Taught by Full-Time and Part-Time Faculty and by Graduate Assistants
Fall 2005
Institutions TOTALLOWER
DIVISION # % # % # %SECTIONS
Research UniversitiesClemson 1,967 1,178 59.9% 444 22.6% 345 17.5%USC Columbia 1,849 984 53.2% 535 28.9% 330 17.8%2005 Research Subtotal 3,816 2,162 56.7% 979 25.7% 675 17.7%
Four-Year Colleges and UniversitiesThe Citadel 442 266 60.2% 176 39.8% 0 0.0%Coastal Carolina 914 525 57.4% 389 42.6% 0 0.0%College of Charleston 1,474 926 62.8% 548 37.2% 0 0.0%Francis Marion 554 447 80.7% 107 19.3% 0 0.0%Lander 449 344 76.6% 105 23.4% 0 0.0%SC State 614 469 76.4% 145 23.6% 0 0.0%USC Aiken 416 280 67.3% 136 32.7% 0 0.0%USC Beaufort 210 112 53.3% 98 46.7% 0 0.0%USC Upstate* 522 265 50.8% 257 49.2% 0 0.0%Winthrop 903 456 50.5% 447 49.5% 0 0.0%2005 Four-Year Subtotals 6,498 4,090 62.9% 2,408 37.1% 0 0.0%
Two-Year Branches of USCUSC Lancaster 208 129 62.0% 79 38.0% 0 0.0%USC Salkehatchie 121 59 48.8% 62 51.2% 0 0.0%USC Sumter 181 125 69.1% 53 29.3% 3 1.7%USC Union 56 30 53.6% 26 46.4% 0 0.0%2005 Two-Year Subtotals 566 343 60.6% 220 38.9% 3 0.5%
Technical CollegesAiken 441 266 60.3% 175 39.7% 0 0.0%Central Carolina 501 371 74.1% 130 25.9% 0 0.0%Denmark 234 188 80.3% 46 19.7% 0 0.0%Florence-Darlington 950 577 60.7% 373 39.3% 0 0.0%Greenville 2,166 1,353 62.5% 813 37.5% 0 0.0%Horry-Georgetown 961 632 65.8% 329 34.2% 0 0.0%Midlands 1,720 961 55.9% 759 44.1% 0 0.0%Northeastern 350 202 57.7% 148 42.3% 0 0.0%Orangeburg-Calhoun 485 404 83.3% 81 16.7% 0 0.0%Piedmont 1,264 696 55.1% 568 44.9% 0 0.0%Spartanburg 777 443 57.0% 334 43.0% 0 0.0%TCL 304 227 74.7% 77 25.3% 0 0.0%Tri-County 795 387 48.7% 408 51.3% 0 0.0%Trident 1,810 1,132 62.5% 678 37.5% 0 0.0%Williamsburg 195 86 44.1% 109 55.9% 0 0.0%York 815 498 61.1% 317 38.9% 0 0.0%2005 Technical College Subtotals 13,768 8,423 61.2% 5,345 38.8% 0 0.0%
LOWER DIVISION SECTIONS TAUGHT BYFaculty Graduate Assistants
Full Time Part Time
*Formerly USC Spartanburg

Section 3 – Classroom Quality
38
Indicator 3D – Accreditation of Degree-Granting Programs This indicator is used in assessing program accreditation in the performance funding system. Details regarding accreditation as applicable to performance funding are found in Section 11. Since April, 2002, institutions are assessed in performance funding on percentage of accredited programs. It should be noted that CHE policy provides an institution five years to attain full accreditation after a new program is added at an institution and provides the same length of time to gain accreditation of an existing program when an agency is added to the list of accrediting bodies recognized by CHE. For additional information, see our website at http://www.che.sc.gov and go to "Academic Affairs and Licensing." For USC Beaufort, this was a compliance indicator during the transition from two to four-year status, based on satisfactory progress toward SACS accreditation as a four-year institution. The following charts show accreditation percentages used in Year 10 (2005-06) performance funding ratings. Figure 3.1 Indicator 3D - Accreditation of Degree-Granting Programs
Source: Institutional reports
The “Achieves” range in effect for all institutions was 90% to 99%, or all but one program, for ratings in Spring 2006. Research Institutions Teaching Institutions
Accreditation of Degree Granting Programs
0%
25%
50%
75%
100%
% o
f Acc
redi
tabl
e P
rogr
ams
Accr
edite
d
Spring 2003 75% 80% 88% 80% 88% 71% 100% - 100% 100%
Spring 2004 75% 80% 88% 80% 88% 93% 100% - 100% 100%
Spring 2005 75% 80% 88% 80% 88% 93% 100% 100% 100% 100%
The Citadel Coastal Carolina
College of Charleston
Francis M arion
Lander University
SC State Univ.
USC Aiken USC Beaufort*
USC Upstate**
Winthrop University
*USC Beaufort had no programs eligible for accreditation prior to Spring 2005 **Formerly USC Spartanburg
Accreditation of Degree Granting Programs
0%25%50%75%
100%
% o
f Acc
redi
tabl
e
Prog
ram
s A
ccre
dite
d
Spring 2003 100% 100% 100%
Spring 2004 100% 100% 100%
Spring 2005 100% 100% 100%
Clemson USC Columbia M USC

Section 3 – Classroom Quality
39
Accreditation of Degree Granting Programs
0%25%50%75%
100%
% o
f Acc
redi
tabl
e P
rogr
ams
Acc
redi
ited
Spring 2003 100% 100% 100% 100% 100% 100% 100% 100%
Spring 2004 100% 100% 100% 100% 100% 100% 100% 100%
Spring 2005 100% 100% 100% 100% 100% 100% 100% 100%
Orangeburg-Calhoun
Piedmont Tech
Spartanburg CC*
Tech Coll. of LowCountry
Tri-County Tech
Trident Tech Williamsburg Tech
York Tech
In Year 10 (2005-06), the Citadel, College of Charleston, and Francis Marion had all but one program accredited. Two-Year Branch Campuses of USC – The only branch campus having programs eligible for accreditation is USC Lancaster. Both of its programs are accredited. Technical Colleges
Accreditation of Degree Granting Programs
0%25%50%75%
100%
% o
f Acc
redi
tabl
e P
rogr
ams
Acc
redi
ted
Spring 2003 75% 100% 100% 100% 100% 100% 100% 0%
Spring 2004 75% 100% 100% 92% 100% 100% 100% 0%
Spring 2005 83% 100% 100% 100% 100% 100% 100% 0%
Aiken Tech Central Carolina Tech
Denmark Tech Florence-Darlington
Greenville Tech
Horry-Georgetown
M idlands Tech
Northeastern Tech
*Formerly Spartanburg Technical College Year 10 (2005-06) Accreditation Data and Table In addition to reporting the performance levels on accreditation for the most recent scored performance year, the law requires that institutions report their current program accreditation status. The following table (Table 3.2) gives accreditation information submitted by the institutions on August 1, 2006. This information will be updated in the Spring of 2007 for performance indicator 3D. The reader may note that, due to the use of updated data for performance funding calculations, numbers on institutional ratings reports may differ from those displayed in this table. The numbers presented in Table 3.2 (next page) reflect a count of the number of agencies for which the institution has one or more programs accredited.

Section 3 – Classroom Quality
40
Areas Eligible for Accreditation
Areas with one or More Programs Accredited % Accredited
Research UniversitiesClemson* 15 15 100%USC - Columbia 27 27 100%MUSC 16 16 100%
Teaching UniversitiesThe Citadel 4 3 75%Coastal Carolina Univ. 5 4 80%College of Charleston 8 7 88%Francis Marion Univ. 6 5 83%Lander University* 7 6 86%SC State Univ. 14 13 93%USC - Aiken 4 4 100%USC - Beaufort* 2 0 Programs approved 2004USC-Upstate** 5 5 100%Winthrop University 14 14 100%
Two-Year Branches of USC
USC - Lancaster 2 2 100%USC - SalkehatchieUSC - SumterUSC - Union
Technical CollegesAiken Tech 6 5 83%Central Carolina Tech 6 6 100%Denmark Tech 3 3 100%Florence-Darlington 11 11 100%Greenville Tech 16 16 100%Horry-Georgetown Tech 12 9 75%Midlands Tech 14 14 100%Northeastern Tech 2 0 0%Orangeburg-Calhoun 7 7 100%Piedmont Tech 10 10 100%Spartanburg CC*** 9 9 100%Tech Coll. of LowCountry 6 6 100%Tri-County Tech 10 10 100%Trident Tech 14 14 100%Williamsburg Tech 1 1 100%York Tech 9 9 100%
Total 265 251 95%
*These institutions have one or more programs within the five-year window for accreditation.**Formerly USC Spartanburg***Formerly Spartanburg Technical College
As of June 30, 2006
Table 3.2 Accreditation of Degree-Granting Programs. Source: Institutional IE Reports to CHE

Section 3 – Classroom Quality
41
Percentage of Students Passing Praxis II Specialty Area
0.0%25.0%50.0%75.0%
100.0%
2002-03 80.7% 91.1% 93.2% 88.7% 89.5% 100.0% 87.7% - 79.7% 94.3%
2003-04 79.4% 85.7% 92.2% 98.5% 73.8% 100.0% 91.0% - 87.6% 91.2%
2004-05 80.2% 86.0% 94.2% 64.1% 63.6% 100.0% 92.6% - 85.2% 95.5%
The CitadelCoastal Caro lina
College of Charleston
Francis M arion
Lander University
SC State Univ.
USC AikenUSC
Beaufort*USC
Upstate**Winthrop University
Student Performance on Teacher Education Examinations Performance Funding Indicator 3E, Subpart 3E2a measures the percentage of students who pass the PRAXIS II Professional Learning and Teaching (PLT) exam. As of 2000-01, graduating teacher education students are not required to take this exam immediately upon graduation, but are given a three-year window to take and pass the exam. Differing institutional policies on test-taking by new graduates led to test-taking rates that vary widely, causing a situation in which charting the institutional passing rates would lead to meaningless comparisons. This indicator has been deferred since 2001. Data on prior years are reported in the 2001 edition of A Closer Look. Performance Funding Indicator 3E, Subpart 3E2b measures the percentage of students who pass the PRAXIS II Specialty Area Exams. These exams are required of all graduates. In Year 6, this indicator was identified as the mission focused measure for teaching sector institutions. Clemson and USC Columbia continue to report the data as part of Indicator 7D. Four-Year Colleges and Universities The chart below represents the percent teacher education students at each institution who passed Specialty Area Examinations during the year indicated. Since 1999-2000 these have been based on the PRAXIS II exam. In previous years they were primarily based on the National Teachers Examination. The annual reporting timeframe is April 1 – March 31. It should be noted that the pass rates for the Praxis II exam are based on all student takers rather than first time takers as on other certification exams reported in Section 7 of this document. Although Clemson and USC Columbia are not included in this indicator, their education graduates take the same exams. For 2004-2005, Clemson’s students had a pass rate of 86.0% and USC Columbia’s students had a pass rate of 88.2%. Figure 3.2 Percentage of Students in Teacher Education Programs Who Pass the PRAXIS
II Specialty Area Exams. Source: Institutional IE Reports to CHE The “Achieves” range for this indicator was 75% - 89% for Performance Year 10 (2005-06)
* Does not apply ** Formerly USC Spartanburg

Section 3 – Classroom Quality
42
Percentage of Graduates in Critical Shortage Areas
0%25%50%75%
100%
2002-03 11% 9% 14% 20% 20% 38% 7% - 12% 42%
2003-04 10% 19% 23% 48% 25% 31% 13% - 15% 43%
2004-05* - - - - - - - - - -
The CitadelCoastal Caro lina
College of Charleston
Francis M arion
Lander University
SC State Univ.
USC AikenUSC
Beaufort*USC
Upstate**Winthrop University
Performance Funding Indicator 3E (Subparts 3a and 3b), Teacher Education Graduates in Critical Shortage Areas, assesses two critical needs areas for teachers: 1) the number of graduates in state critical shortage areas; and 2) minority graduates from teacher preparation programs. These measures apply only to Teaching Sector institutions. Critical shortage areas are those determined by the South Carolina Department of Education based on state need and for purposes of loan repayments. Data for the percent of graduates in critical shortage areas for the past three years are shown below in Figure 3.3. The critical shortage areas have changed over the years as teacher shortages have increased. For performance funding, those areas identified in 2000 have been used. These are: Art, Business Education, English/Language Arts, Family and Consumer Science (Home Economics), Foreign Languages (French, German, Latin, and Spanish), Industrial Technology, Library Science, Mathematics, Science (all areas), Music (Choral), and Special Education (all areas including speech pathology, occupational, and physical therapy). Figure 3.3 – Four-Year Colleges and Universities, Graduates in Critical Shortage Areas Source: Institutional IE Reports to CHE The percentage of graduates in critical shortage areas for each institution is shown for each of the academic years represented. The “Achieves” range for past years was 20% - 34%. This measure was deferred for Year 10 (2005-06).
* Does not apply ** Formerly USC Spartanburg Teacher Education Graduates Who are Minority Minority Teacher Education Graduates, as defined in the Performance Funding Workbook for Year 10 (2005-06), for the years shown include African-American, American Indian/Alaskan Native, Asian or Pacific Islander, and Hispanic students who graduated from public institutions in teacher education. (Figure 3.4, next page)

Section 3 – Classroom Quality
43
Figure 3.4 – Four-Year Colleges and Universities, Percent of Teacher Education Graduates Who are Minority Source: Institutional Reports to CHE The percentage of graduates from teacher education programs who are minority is represented below. The “Achieves” range for past years was 10% - 20%. This measure was deferred for Year 10.
(2005-06). * Does not apply ** Formerly USC Spartanburg Assessment Information for the Institution’s Title II of the Federal Higher Education Act of 1998 Report In 2001, the South Carolina Legislature amended Section 59-101-350 of the South Carolina Code of Laws, 1976, to include the following as an institutional effectiveness reporting requirement. • Assessment information for the institution’s Title II of the Federal Higher Education Act of 1998
report that collects and analyzes data on applicant qualifications and the performance of the candidates and graduates;
A link to South Carolina Title II summary information, maintained by the SC Department of Education (SDE), is http://www.title2.org/title2dr/StateHome.asp. Tabular data showing institutions’ performance on various requirements of Title II reporting will be posted by the SDE, but are not yet available. These tables will include information on all South Carolina teaching institutions, to include private institutions. Links to the Title II reports of the individual institutions can be found below. It should be noted that the data for the most recent Title II reports have not been approved by the SC Department of Education at the time of publication. Institutions were given the choice by the department of either posting the current data with caveats about lack of approval or not posting their new data until the approval process is complete. 2005 Title II Reports on Institutional Websites Clemson University http://www.title2.org/title2dr/default.asp University of South Carolina-Columbia http://www.ed.sc.edu/ The Citadel http://www.citadel.edu/academicaffairs/index.html Coastal Carolina University http://www.coastal.edu/effect/iereports.html College of Charleston http://irp.cofc.edu/titleii/ Francis Marion University http://www.fmarion.edu/about/reports/article-1999962554c-
1999305553.htm
Percentage of Teacher Education Graduates who are Minority
0%25%50%75%
100%
2002-03 26% 1% 12% 31% 4% 91% 17% - 12% 23%
2003-04 25% 7% 11% 20% 14% 93% 11% - 15% 24%
2004-05 - - - - - - - - - -
The Citadel Coastal Carolina Univ.
College of Charleston
Francis M arion Univ.
Lander University
SC State Univ.
USC Aiken USC Beaufort*
USC Upstate**
Winthrop University

Section 3 – Classroom Quality
44
Lander University http://www.lander.edu/education/title2.html South Carolina State University http://ir.scsu.edu/TitleII.htm USC-Aiken http://www.usca.edu/education/title2.html USC-Beaufort N/A USC-Upstate http://www.uscupstate.edu/about_upstate/planning/titleII.asp Winthrop University http://coe.winthrop.edu/title2/results.htm

Section 4 – Institutional Cooperation and Collaboration
45
Section 4 Institutional Cooperation and Collaboration

Section 4 – Institutional Cooperation and Collaboration
46
(blank page)

Section 4 – Institutional Cooperation and Collaboration
47
Research Collaboration
0
50
100
Num
ber o
f Col
labo
rativ
e Pr
ojec
ts
2000-01 44 44 44
2001-02 46 46 46
2002-03 56 56 56
2003-04 60 60 60
Clemson USC Columbia M USC
Institutional Cooperation and Collaboration Indicator 4A was deferred for all institutions in Year 10 (2005-2006). The definitions and charts that follow are for previous Performance Funding years. Indicators 4A – Sharing and use of Technology, Programs, Equipment, Supplies and Source Matter within the Institution, with Other Institutions and with the Business Community and 4B – Cooperation and Collaboration with Private Industry, were scored as compliance indicators based on institutional reporting of activities in Performance Year 3. Given the nature of these indicators and the high level of compliance, they were put on a three-year scoring cycle, and were not scored in Years 4 and 5. During Year 5, the Commission approved continuing, for Year 6 and beyond, a revised measure of institutional cooperation and collaboration as a scored indicator tailored to each sector. As described in the following excerpt from the “Performance Funding Workbook for Year 7,(p II, 83)”
Effective Year 7, measures and standards for each of the sectors were approved on September 5, 2002 (Research, Regional Campuses, and Technical Colleges) and on November 7, 2002 (Teaching). The research sector measure focuses on enhancing collaborative research within the sector and is intended to be followed for 5 years (Years 6-10). The teaching sector measure focuses on program advisory boards and program internships/co-ops to improve the cooperation and collaboration between the sector and the profit and non-profit sectors and is intended to be followed over 4 years (Years 7-10). The regional campuses sector measure focuses on strengthening the campuses community outreach efforts with the private and public sectors and is intended as a 4 year measure (Years 6-9). The technical colleges measure focuses on strengthening technical college program advisory committees through enhanced involvement of business, industry and community representatives and is intended as a 3 year measure (Years 7-9)
It is important that the reader refer to the current Performance Funding Workbook, http://www.che.sc.gov/Finance/Perf_Fund/Yr9WorkBook_Rev.htm (pages II 83 - II 113), to find information on the components and scoring of this indicator. Figure 4.1 Institutional Collaboration and Cooperation Source: Performance Funding Reports from Institutions Research - To enhance collaborative research within the Research Sector including the development and use of an integrated faculty and grants database system. This indicator measures the change in the number of collaborative research projects compared to the average of the previous three years. The range for “Achieves” in Year 9 (2004-05) was 44-48 collaborative projects. The Research Institutions have increased the number of collaborative projects from 29 in 1999-2000 to 60 in 2003-2004.

Section 4 – Institutional Cooperation and Collaboration
48
Collaboration w ith Business, Education, Health and Welfare
-
1
2
3
4
2001-02 4 4 2 3 3 4 3 4 4 4
2002-03 4 4 3 4 3 4 3 4 4 4
2003-04 4 4 3 4 3 4 3 3 4 4
The Cit adelCoast al
Carolina College of
Charlest onFrancis
Marion Univ.Lander
Universit ySC St at e
Univ.USC Aiken
USC Beauf ort
USC Upst at e*Wint hrop
Universit y
Percentage of Community Outreach Best Practices Met
0.0%20.0%40.0%60.0%80.0%
100.0%
2001-02 87.5% 100.0% 85.0% 100.0%
2002-03 96.0% 100.0% 100.0% 100.0%
2003-04 98.3% 100.0% 100.0% 100.0%
USC Lancaster USC Salkehatchie USC Sumter USC Union
Teaching – Cooperation and Collaboration with Business and Industry and PreK-12 Education, Health and Welfare as assessed by using a four-part measure in which compliance on each part will be determined and institutions scored relative to the number of the parts for which they are in compliance. The measure focuses on membership on program advisory boards as a means to assess and improve the cooperation and collaboration between the teaching institutions and the profit and non-profit sectors. The “Achieves” range in effect for Academic Year 2003-04 was 2-3 parts in compliance.
*Formerly USC Spartanburg
Regional Campuses of USC This indicator assesses the strength of the community outreach efforts of the USC regional campuses by determining the percentage of best practice criteria that are utilized. The range for “Achieves” in Year 9 (2004-05) was 85% to 95%.

Section 4 – Institutional Cooperation and Collaboration
49
Percentage of Best Practices Met
0.0%20.0%40.0%60.0%80.0%
100.0%
2001-02 95.2% 98.8% 100.0% 100.0% 99.0% 95.6% 89.9% 96.7%
2002-03 95.2% 100.0% 100.0% 96.2% 97.7% 95.8% 98.6% 100.0%
2003-04 95.2% 100.0% 100.0% 100.0% 97.1% 98.2% 100.0% 96.7%
Aiken Tech Central Carolina
Denmark Tech
Florence-Darlington
Greenville Tech
Horry-Georgetown
M idlands Tech
Northeastern Tech
Percentage of Best Practices Met
0.0%20.0%40.0%60.0%80.0%
100.0%
2001-02 96.2% 97.9% 85.6% 97.2% 72.9% 95.3% 83.3% 86.7%
2002-03 98.6% 100.0% 97.9% 96.2% 93.3% 99.3% 83.3% 100.0%
2003-04 95.8% 100.0% 95.6% 100.0% 94.4% 98.0% 94.4% 100.0%
Orangeburg-Calhoun
Piedmont Tech
Spartanburg Tech
Tech Coll. of LowCountry
Tri-County Tech
Trident Tech Williamsburg Tech
York Tech
Technical Colleges – For the Technical Sector, this indicator focuses on strengthening technical college program advisory committees through enhanced involvement of business, industrial, and community representatives. Each Technical College is assessed as to the strength of its advisory committees by determining the percentage of best practices criteria that are met by an institution’s advisory committees. The range for “Achieves” in Year 9 (2004-05) was 80% to 95% of criteria met.

Section 4 – Institutional Cooperation and Collaboration
50
(blank page)

Section 5 - Administrative Efficiency
51
Section 5 Administrative Efficiency

Section 5 - Administrative Efficiency
52
(blank page)

Section 5 - Administrative Efficiency
53
ADMINISTRATIVE EFFICIENCY
This performance indicator (5A) was deferred due to changes in federal reporting requirements for financial data. These changes affect all public higher education institutions, making comparisons to past data invalid. The changes are of such a nature as to render “administrative efficiency” as defined in the past impossible to evaluate. The indicator is under revision for future years. For definitions and standards used in past years, see pp. 133-135 of the September 2000 Performance Funding workbook. Past performance on indicator 5A as previously defined can be found in the publication A Closer Look at Public Higher Education in South Carolina – January 2003.

Section 5 - Administrative Efficiency
54
(Blank Page)

Section 6 – Entrance Requirements
55
Section 6 Entrance Requirements

Section 6 – Entrance Requirements
56
(blank page)

Section 6 – Entrance Requirements
57
ENTRANCE REQUIREMENTS The Commission on Higher Education (CHE) collects data on institutions’ entrance requirements, preparation of entering freshmen, and developmental course offerings. Portions of these data are used in performance funding evaluations for Critical Success Factor 6. Effective in Year 6 (2001-02), Indicator 6A - SAT and ACT Scores of Entering Freshmen, and 6B – High School Standing, Grade Point Averages (GPA) were combined in a single indicator measuring entrance credentials of first-time entering freshmen. This indicator applies to the Research Sector (except MUSC), the Teaching Sector, and Two-Year Regional Campuses of USC. A comparable measure has been implemented for MUSC. See Figure 6.1 for additional details and data. Data on SAT and ACT scores and high school rank and GPAs (Figure 6.1) indicate a general increase in admission standards for research universities and a mixed outcome for four-year colleges and universities and two-year regional campuses of USC. Act 255 of 1992, as amended, requires information to be reported on the “percent of graduate students who received undergraduate degrees at the institutions, within the State, within the United States, and from other nations.” This information can be found in Table 6.1, with three years of data shown. Admission standards for South Carolina’s public in-state institutions are addressed more thoroughly in Table 6.2, and Figures 6.3 and 6.4. The data excerpted here are from a report on admissions standards that is prepared annually by the Commission’s Division of Academic Affairs and can be accessed at www.che.sc.gov. A summary of the report is provided in the illustrations named above.

Section 6 – Entrance Requirements
58
SAT/ACT Scores and High School Rank and GPA of Student Body
0.0%25.0%50.0%75.0%
100.0%
% M
eetin
g PF
Crit
eria
Fall 03 99.1% 99.1%
Fall 04 99.3% 99.2%
Fall 05* 99.1% 99.4%
Clemson USC Columbia
SAT/ACT Scores and High School Rank and GPA of Student Body
0.0%
25.0%
50.0%
75.0%
100.0%
% M
eetin
g PF
Crit
eria
Fall 03 92.8% 85.6% 99.6% 76.9% 90.4% 47.3% 82.5% 54.4% 85.1% 97.7%
Fall 04 88.9% 86.7% 99.5% 75.3% 82.1% 49.9% 87.9% 66.5% 87.6% 98.2%
Fall 05* 87.9% 86.4% 99.4% 78.5% 83.7% 46.8% 89.3% 63.0% 85.9% 98.4%
The Citadel Coastal Carolina
College of Charleston
Francis M arion Univ.
Lander University
SC State Univ.
USC Aiken USC Beaufort
USC Upstate*
Winthrop University
Qualifications of Entering Freshmen Performance Indicator 6A/B– SAT Scores of the Student Body/High School Standing, Grade Point Average, and Activities of the Student Body measures the percentage of first-time freshmen who meet or exceed Commission-approved target scores on the SAT or ACT, high school grade point average, or high school class standing. The composite SAT and ACT scores for all first-time entering freshmen test takers including provisional students are considered. The data shown below are representative of SAT scores of 1000 and higher and ACT scores of 21 and higher, a GPA of at least 3.0 on a 4.0 scale, or class standing in the top 30%. A comparable version of this measure was approved for MUSC beginning in Year 6. For MUSC, first-time entering graduate and first professional entering credentials are assessed. Scores on the Medical College Admissions Test (MCAT-26.6), Dental Admission Test (DAT-34), Pharmacy College Admission Test (PCAT-200), Graduate Record Exam (GRE-1587 for all three parts), Graduate Management Admissions Test (GMAT-521), college GPA (at least 3.0 on a 4 point scale), and class standing (top 30%) are considered. The range for “Achieves” is 70% to 85%, and MUSC had 96.0% of its entering first-time graduate students and first professionals meeting the criteria in Year 9 (2004-05). The measure was deferred for MUSC in Year 10 (2005-06). This measure is not applicable to the Technical College Sector. Figure 6.1 – SAT/ACT Scores and High School Rank and GPA of Student Body Source: CHEMIS Data Research Universities For Fall 2005 data, an “Achieves” range of 75% to 89.9% applied for Clemson and USC Columbia. Four-Year Colleges and Universities For Fall 2005 data, an “Achieves” range of 50% to 79.9% applied.
*Formerly USC Spartanburg

Section 6 – Entrance Requirements
59
Two-Year Institutions-Regional Campuses of USC For Fall 2005 data, an “Achieves” range of 20% to 49.9% applied. Success of Students in Developmental Courses Students are usually enrolled in developmental courses because they have been determined by the institution to lack certain skills that are needed for college level work. None of the research or teaching universities provide such courses. Several senior institutions contract with a nearby technical college to offer some developmental courses. Students who complete such courses at technical colleges are not included in this report. Sources of First-Time Degrees for Graduate Students The following table summarizes the data on the sources of undergraduate degrees for first-time, degree-seeking graduates at the state’s public institutions. Two years of data are shown in the table. Table 6.1 (Next Page) Source: CHEMIS Data
SAT/ACT Scores and High School Rank and GPA of Student Body
0.0%25.0%50.0%75.0%
100.0%
% M
eetin
g PF
Crit
eria
Fall 03 54.3% 31.4% 55.4% 34.4%
Fall 04 46.2% 39.1% 57.7% 35.7%
Fall 05* 45.9% 35.7% 54.0% 30.9%
USC Lancaster USC Salkehatchie USC Sumter USC Union

Section 6 – Entrance Requirements
60
Institution Year
# % # % # % # % # %
Clemson Fall 03 807 188 23.30% 130 16.11% 252 31.23% 187 23.17% 50 6.20%
Fall 04 752 140 18.62% 107 14.23% 238 31.65% 165 21.94% 102 13.56%
Fall 05 745 185 24.83% 118 15.84% 249 33.42% 128 17.18% 65 8.72%
USC Columbia Fall 03 775 0 0.00% 109 14.06% 612 78.97% 54 6.97% 0 0.00%
Fall 04* 864 215 24.88% 211 24.42% 302 34.95% 33 3.82% 103 11.92%
Fall 05* 888 0 0.00% 98 11.04% 37 4.17% 0 0.00% 753 84.80%
MUSC Fall 03 282 0 0.00% 53 18.79% 220 78.01% 0 0.00% 9 3.19%
Fall 04 316 0 0.00% 41 12.97% 269 85.13% 0 0.00% 6 1.90%
Fall 05 341 0 0.00% 47 13.78% 289 84.75% 0 0.00% 5 1.47%
Sector Totals Fall 03 1864 188 10.09% 292 15.67% 1084 58.15% 241 12.93% 59 3.17%
Fall 04 1932 355 18.37% 359 18.58% 809 41.87% 198 10.25% 211 10.92%
Fall 05 1974 185 9.37% 263 13.32% 575 29.13% 128 6.48% 823 41.69%
Four-Year Colleges & Universities
Citadel Fall 03 178 17 9.55% 94 52.81% 49 27.53% 1 0.56% 17 9.55%
Fall 04 236 12 5.08% 102 43.22% 84 35.59% 1 0.42% 37 15.68%
Fall 05 190 11 5.79% 97 51.05% 68 35.79% 2 1.05% 12 6.32%
Coastal Carolina Fall 03 69 0 0.00% 36 52.17% 18 26.09% 0 0.00% 15 21.74%
Fall 04 55 0 0.00% 24 43.64% 21 38.18% 0 0.00% 10 18.18%
Fall 05 79 0 0.00% 31 39.24% 29 36.71% 0 0.00% 19 24.05%
Coll. Of Charleston Fall 03 187 52 27.81% 33 17.65% 98 52.41% 4 2.14% 0 0.00%
Fall 04 134 34 25.37% 31 23.13% 65 48.51% 4 2.99% 0 0.00%
Fall 05 157 42 26.75% 43 27.39% 69 43.95% 3 1.91% 0 0.00%
Francis Marion Fall 03 42 18 42.86% 18 42.86% 6 14.29% 0 0.00% 0 0.00%
Fall 04 26 11 42.31% 11 42.31% 4 15.38% 0 0.00% 0 0.00%
Fall 05 47 18 38.30% 22 46.81% 7 14.89% 0 0.00% 0 0.00%
Lander Fall 03 31 5 16.13% 25 80.65% 1 3.23% 0 0.00% 0 0.00%
Fall 04 10 6 60.00% 3 30.00% 1 10.00% 0 0.00% 0 0.00%
Fall 05 8 4 50.00% 3 37.50% 0 0.00% 0 0.00% 1 12.50%
SC State Fall 03 117 14 11.97% 5 4.27% 2 1.71% 0 0.00% 96 82.05%
Fall 04 88 4 4.55% 3 3.41% 2 2.27% 0 0.00% 79 89.77%
Fall 05 151 13 8.61% 10 6.62% 2 1.32% 0 0.00% 126 83.44%
USC Aiken Fall 03 14 0 0.00% 2 14.29% 12 85.71% 0 0.00% 0 0.00%
Fall 04 12 0 0.00% 6 50.00% 0 0.00% 0 0.00% 6 50.00%
Fall 05 11 0 0.00% 2 18.18% 0 0.00% 0 0.00% 9 81.82%
USC Upstate** Fall 03 1 0 0.00% 1 0.00% 0 0.00% 0 0.00% 0 0.00%
Fall 04 N/A N/A #VALUE! N/A #VALUE! N/A #VALUE! N/A #VALUE! N/A 0.00%
Fall 05 1 0 0.00% 0 0.00% 1 0.00% 0 0.00% 0 0.00%
Winthrop Fall 03 258 73 28.29% 73 28.29% 98 37.98% 9 3.49% 5 1.94%
Fall 04 261 77 29.50% 62 23.75% 107 41.00% 7 2.68% 8 3.07%
Fall 05 231 77 33.33% 47 20.35% 100 43.29% 7 3.03% 0 0.00%
Sector Totals Fall 03 897 179 19.96% 287 32.00% 284 31.66% 14 1.56% 133 14.83%
Fall 04 822 144 17.52% 242 29.44% 284 34.55% 12 1.46% 140 17.03%
Fall 05 875 165 18.86% 255 29.14% 276 31.54% 12 1.37% 167 19.09%
Research Universities
First-time, Degree-seeking
Graduate Enrollment
Undergraduate Degrees Were Received From :
Reporting Institution Other SC Institutions Other U.S. Institutions Non-U.S. Institutions Unknown
* USC Columbia revised its reporting methodology for the Fall 2004 cohort. **Formerly USC Spartanburg

Section 6 – Entrance Requirements
61
Fall 2005 Fall 2004 Fall 2003
Applications Received
Number Offered
Admission
Percent Offered
Admission
Applications Received
Number Offered
Admission
Percent Offered
Admission
Applications Received
Number Offered
Admission
Percent Offered
Admission
Clemson 12,463 7,154 57.4% 10,620 7,287 68.6% 11,419 6,945 60.8%USC Columbia 13,023 8,813 67.7% 12,379 8,344 67.4% 12,815 8,257 64.4%
25,486 15,967 62.7% 22,999 15,631 68.0% 24,234 15,202 62.7%
Citadel 1,912 1,500 78.5% 2,173 1,718 79.1% 1,919 1,286 67.0%Coastal 5,427 4,017 74.0% 5,059 3,679 72.7% 4,527 3,208 70.9%Coll of Charleston 8,219 5,438 66.2% 8,076 5,238 64.9% 7,006 4,536 64.7%Francis Marion 2,524 1,804 71.5% 2,179 1,658 76.1% 2,057 1,565 76.1%Lander 1,853 1,345 72.6% 1,733 1,471 84.9% 1,958 1,549 79.1%SC State 3,383 2,759 81.6% 4,364 2,308 52.9% 2,558 2,045 79.9%USC Aiken 2,071 1,244 60.1% 1,779 978 55.0% 1,649 1,065 64.6%USC Beaufort 464 404 87.1% 318 288 90.6% 307 273 88.9%USC Upstate* 2,296 1,605 69.9% 2,249 1,484 66.0% 1,962 1,379 70.3%Winthrop 4,303 2,985 69.4% 3,617 2,452 67.8% 3,972 2,632 66.3%
Total 32,452 23,101 71.2% 31,547 21,274 67.4% 27,915 19,538 70.0%
57,938 39,068 67.4% 54,546 36,905 67.7% 52,149 34,740 66.6%
Research Institutions
Total for SC Senior Institutions
Total
Four-Yr Colleges and Universities
Admission Standards Annually, SC public institutions of higher education report to the Commission on Higher Education (CHE) on admission standards for first-time entering freshmen. The Division of Academic Affairs compiles a report, “Annual Report on Admission Standards for First-Time Entering Freshmen,” based on information submitted from institutions. A copy of the full report can be found at http://www.che.sc.gov/ and then selecting the Division of Academic Affairs. Some of the data reported include high school course prerequisites for college admission taken by applicants, SAT/ACT scores of applicants, provisional admissions, and applications, acceptance and enrollment. Table 6.2 details the number and percent of students who applied for and were offered admission at each public senior institution. Table 6.2 Applications and Admission Offers, SC Senior Public Institutions Source: CHE’s “Annual Report on Admission Standards for First-time Entering Freshmen”
*Formerly USC Spartanburg

Section 6 – Entrance Requirements
62
Percentage of Applicants Offered Admission who Subsequently Accepted and Enrolled
0%
20%
40%
60%
80%
100%
Fall 2003 42% 40% 42% 43% 40% 41% 49% 35% 40% 53% 51% 60% 41%
Fall 2004 41% 41% 41% 33% 36% 37% 45% 45% 42% 63% 62% 45% 41%
Fall 2005 40% 41% 42% 39% 37% 37% 45% 43% 37% 49% 61% 47% 34%
Total ClemsonUSC
ColumbiaCitadel Coastal
Coll o f Charlesto
Francis M arion
Lander SC State USC AikenUSC
BeaufortUSC
Upstate*Winthrop
Figure 6.2 Percent of Applicants Offered Admission who Subsequently Accepted and Enrolled Source: CHE’s “Annual Report on Admission Standards for First-time Entering Freshmen”
*Formerly USC Spartanburg Figure 6.3 shows a comparison of the average SAT or ACT combined scores of first-time entering freshmen for each institution for 2002, 2003, and 2004. In order to calculate the average, ACT scores are converted to SAT equivalents using the ACT/SAT Concordance tables. All entering freshmen including foreign, provisional, and students over 22 years old are included. The data in Figure 6.3 are reviewed annually by the CHE as part of its annual report on admission standards of first-time entering freshmen. Figure 6.3 Average SAT/ACT Combined Scores of All First-time Entering Freshmen for 4- and 2-year SC Public Institutions Source: From CHEMIS Research Universities *Excluding MUSC
SA T / A C T C o mbined Sco res o f F irst- t ime Entering F reshmen
0200400600800
1000120014001600
Com
bine
d SA
T/A
CT
Ave
rage
Fall 03 1168 1201 1142
Fall 04 1171 1191 1147
Fall 05 1188 1222 1161
All Research Inst it ut ions* Clemson USC Columbia

Section 6 – Entrance Requirements
63
SAT/ACT Combined Scores of First-time Entering Freshmen
0200400600800
1000120014001600
Com
bine
d SA
T/A
CT
Ave
rage
Fall 03 1031 1100 1038 1159 944 981 821 977 956 967 1047
Fall 04 1024 1071 1032 1162 948 961 830 977 954 1003 1051
Fall 05 1028 1085 1041 1164 953 961 822 992 943 999 1071
All 4-Yr Comprehen
Citadel Coastal Coll of Chas
Francis M arion
Lander SC State USC Aiken USC Beaufort
USC Upstate*
Winthrop
Teaching Universities
* Formerly USC Spartanburg Two-Year Regional Campuses of USC
SA T / A C T C o mbined Sco res o f F irst - t ime Entering F reshmen
0200400600800
1000120014001600
Com
bine
d SA
T/A
CT
Ave
rage
Fall 03 894 887 843 949 863
Fall 04 899 945 830 839 871
Fall 05 889 883 855 929 860
All Regional Campuses
USC Lancast erUSC
Salkehat chieUSC Sumt er USC Union

Section 6 – Entrance Requirements
64
(blank page)

Section 7 – Graduates’ Achievements
65
Section 7 Graduates’ Achievements

Section 7 – Graduates’ Achievements
66
(blank page)

Section 7 – Graduates’ Achievements
67
GRADUATES’ ACHIEVEMENTS The Commission on Higher Education (CHE) evaluates graduates’ achievements based on graduation rates (Performance Indicator 7A), scores on licensure and professional examinations (Performance Indicators 3E2a, 3E2b, and 7D), and, for the regional campuses of USC, the regional campus sector focused measure, 7E, Number of Graduates Who Continued Their Education. This measure, developed in Year 6, is a cohort-based measure of the percentage of students who earn a baccalaureate degree within six years from a four-year degree granting institution. This past year, the graduation rate measure remained the same for the USC Columbia, Clemson, teaching institutions, and regional campuses. A measure of graduation rates of graduate students was implemented for MUSC in Year 6 (2001-2002). This measure captures the percentage of first-time, full-time graduate students, except those in Ph. D. programs, and first professional students who complete graduate degree programs within a specified timeframe. For applicability in upcoming years, the Commission worked with two-year institutions in defining an expanded graduation rate measure better focused on the mission of South Carolina’s regional campuses and technical colleges. The measure is cohort-based, assessing graduation within 150% of normal program time, transfer-out within 150% of normal program time or continued enrollment following 150% of normal program time. The measure uses the same cohort of students as defined in graduation rate information presented on the following pages. During Year 6, baseline data were collected and measurement definitions were refined. The measures are presented by Sector in Figure 7.1. For additional information on degrees awarded, undergraduate and graduate, in South Carolina, the reader is referred to the CHE’s publication “Higher Education Statistical Abstract for South Carolina.” A copy of the 2006 edition and several past years are available on-line by selecting “Publications” on the Commission’s home page. Performance Funding Graduation Rate For Performance Funding Indicator 7A – Graduation Rates, institutions are assessed based on the percentage of first-time, full-time, degree-seeking undergraduate freshmen receiving degrees within 150% of normal time. Generally, 150% of normal program time is three years for a two-year degree and six years for a four-year degree. Shown below are data from IPEDS The reader should note that Figure 7.1 shows graduation results for students in cohorts entering in Fall 1997, 1998, and 1999 for four-year institutions and cohorts entering in Fall 2000, 2001, and 2002 for two-year institutions. Data for the 1999 and 2002 cohorts are comparable to the percents displayed for graduation within six years or 150% of normal time for the four-year institutions and within 150% of program time for the two-year institutions. A comparable indicator applied to MUSC was deferred for Year 10 (2005-2006).

Section 7 – Graduates’ Achievements
68
Graduation Rate, 150% of Program Time
0.0%25.0%50.0%75.0%
100.0%
F97 Cohort 72.0% 61.2% 92.3%
F98 Cohort 72.2% 63.9% 93.5%
F99 Cohort 75.1% 65.0% -
Clemson USC Columbia MUSC
Graduation Rate, 150% of Program Time
0.0%25.0%50.0%75.0%
100.0%
F97 Cohort 71.4% 36.6% 55.2% 38.1% 45.7% 48.6% 44.6% - 34.9% 54.8%
F98 Cohort 65.7% 39.8% 57.3% 42.0% 42.9% 52.8% 40.0% - 41.3% 56.1%
F99 Cohort 64.9% 43.1% 57.5% 37.4% 48.4% 46.8% 44.0% - 40.0% 59.8%
The Cit adelCoast al
Carolina College of
Charlest onFrancis
Marion Univ.Lander
Universit ySC St at e
Univ.USC Aiken
USC Beauf ort *
USC Upst at e**
Wint hrop Universit y
Figure 7.1 - Performance Funding Indicator 7A – Graduation Rates Source: CHEMIS Data Research Universities
The figure displayed at left represents the percentage of first-time, full-time, degree-seeking undergraduate freshmen receiving degrees within 150% of program time. The range for an “Achieves” for the 1999 cohort was 64% to 67% for Clemson and 53% to 61% for USC. These ranges were based on national peer data for each.
Four-Year Colleges and Universities The figure below displays the percentage of first-time, full-time, degree-seeking undergraduate freshmen receiving degrees at each four-year college and university within 150% of program time. The “Achieves” range for the 1999 cohort for these institutions was 36% to 49%. This range was based on data available from comparable four-year institutions.
*This measure does not apply to USC Beaufort during its transition to four-year status – see Indicator 7E. **Formerly USC Spartanburg

Section 7 – Graduates’ Achievements
69
Success Rate
0.0%25.0%50.0%75.0%
100.0%
F00 Cohort 69.0% 62.8% 52.3% 66.7%
F01 Cohort 61.2% 66.7% 66.9% 56.4%
F02 Cohort 66.7% 59.3% 68.2% 69.6%
USC Lancast er USC Salkehat chie USC Sumt er USC Union
Success Rate
0.0%25.0%50.0%75.0%
100.0%
F00 Cohort 47.0% 44.6% 52.9% 33.8% 54.7% 48.3% 28.6% 39.8%
F01 Cohort 46.2% 53.1% 43.2% 48.1% 52.7% 54.1% 40.0% 38.4%
30.3% 35.9% 38.0% 39.9% 38.1% 53.4% 33.7% 28.9% 40.4%
Orangeburg-Calhoun
Piedmont TechSpart anburg
CC*Tech Coll. of LowCount ry
Tr i-Count y Tech
Trident TechWilliamsburg
TechYork Tech
Two-Year Institutions-Regional Campuses of USC (Success Rate) The table at right displays those first-time, full-time, degree-seeking undergraduate freshmen graduating within 150% of normal program time, transferred out within 150% of normal program time or continued enrollment following 150% of normal program time. The “Achieves” range for the 2002 cohort for these institutions was 50% to 65%. Not all institutions reported additional data on out-of-state transfers and so the recent data may not be comparable to past years. State Technical and Comprehensive Education System (Success Rate) The figures below represent the percent of first-time, full-time, degree-seeking undergraduate freshmen who graduated within 150% of normal program time, transferred out within 150% of normal program time or continued enrollment following 150% of normal program time. The “Achieves” range for the 2002 cohort for these institutions was 30% to 45%. Not all institutions reported additional data on out-of-state transfers and so the recent data may not be comparable to past years.
*Formerly Spartanburg Technical College
Success Rate
0.0%25.0%50.0%75.0%
100.0%
F00 Cohort 39.1% 39.3% 29.3% 39.5% 43.1% 51.3% 47.1% 46.5%
F01 Cohort 42.3% 36.1% 34.9% 38.1% 42.4% 50.1% 49.9% 45.3%
F02 Cohort 30.3% 36.6% 30.7% 41.4% 41.9% 43.0% 48.1% 37.3%
Aiken TechCent ral
Carolina TechDenmark Tech
Florence-Darlingt on
Greenville TechHorry-
Georget own Midlands Tech
Nort heast ern Tech

Section 7 – Graduates’ Achievements
70
Graduation Rate, 150% of Program Time
0.0%25.0%50.0%75.0%
100.0%
F00 Cohort 21.0% 22.7% 21.7% 11.0% 18.3% 12.8% 16.7% 11.5%
F01 Cohort 21.0% 24.3% 24.2% 16.7% 18.2% 11.5% 20.0% 10.6%
F02 Cohort 16.0% 17.6% 17.6% 20.5% 16.9% 9.1% 14.5% 10.1%
Orangeburg-Calhoun
Piedmont TechSpart anburg
CC*Tech Coll. of LowCount ry
Tri-Count y Tech
Trident TechWilliamsburg
TechYork Tech
Figure 7.2 – Graduation Within 150% of Program Time (GRS Rate), Regional Campuses of USC and Technical Colleges. These charts present the GRS graduation rates for the Regional and Technical College sectors. These data were not used in calculating performance scores. Regional Campuses Technical Colleges
*Formerly Spartanburg Technical College
Graduation Rate, 150% of Program Time
0.0%25.0%50.0%75.0%
100.0%
F00 Cohort 36.3% 24.1% 13.5% 42.4%
F01 Cohort 28.9% 23.1% 8.0% 27.3%
F02 Cohort 26.9% 20.7% 6.1% 37.5%
USC - Lancast er USC - Salkehat chie USC - Sumt er USC - Union
Graduation Rate, 150% of Program Time
0.0%25.0%50.0%75.0%
100.0%
F00 Cohort 9.6% 7.5% 16.1% 13.7% 9.3% 23.9% 9.6% 10.4%
F01 Cohort 8.8% 10.5% 20.4% 9.5% 8.6% 21.1% 11.3% 20.5%
F02 Cohort 9.8% 8.9% 16.0% 14.3% 9.8% 17.1% 9.9% 10.8%
Aiken TechCent ral
Carolina TechDenmark Tech
Florence-Darlingt on
Greenville TechHorry-
Georget own Midlands Tech
Nort heast ern Tech

Section 7 – Graduates’ Achievements
71
Graduation Rate – Research, Teaching, and Two-Year Institutions (Southern Regional Education Board) Southern Regional Education Board States Compared to South Carolina South Carolina is a member of the Southern Regional Education Board (SREB), which is comprised of 16 states in the southeast. The SREB collects data on an annual basis on various types of information from all member institutions and publishes it in their “SREB State Data Exchange.” The following table (7.1) on graduation rates is taken from the December, 2006, publication. Table 7.1 - Southern Regional Education Board States Compared to South Carolina
Source: 2005 SREB State Data Exchange
Student Progression Rates,Full-Time, First-Time, Bachelor's Seeking Undergraduates1
All Public Four-Year Colleges and Universities, 1999 Cohort
Percent of Total First-Time
Freshmen in Cohort
Student Progression Rate2
Percent Completing a Bachelor's at
Institution of Initial Enrollment
Percent Still Enrolled at
Institution of Initial Enrollment
Percent Transfers All Other Total
SREB states 94 73 52 5 15 27 100
Alabama 94 56 49 7 44 100Arkansas 96 70 39 6 25 30 100Delaware 98 65 65 35 100Florida 93 73 59 5 9 27 100Georgia 91 78 48 7 22 22 100Kentucky 82 65 46 7 13 35 100Louisiana 94 60 36 7 17 40 100Maryland 98 66 59 3 4 34 100Mississippi 99 53 48 5 47 100North Carolina 99 77 59 3 14 23 100Oklahoma 85 79 46 6 27 21 100South Carolina 98 76 60 2 15 24 100Tennessee 96 68 46 10 12 32 100Texas 94 83 55 6 22 17 100Virginia 98 83 65 3 15 17 100West Virginia 80 64 45 5 14 36 1001 The SREB student progression rate includes completers, those still enrolled and transfers from the cohort within 150 percent of normal time. Members of the initial cohort who are deceased, totally and permanently disabled, left school to serve in the armed forces or the federal foreign aid service such as the Peace Corps, or who left school to serve on an official church mission are subtracted from the cohort before percentages are calculated. Members of the initial cohort who completed only an award below the baccalaureate level and those who completed a bachelor's but not within 150 percent of normal time are not counted in the columns shown.2Within 150 percent of normal time.

Section 7 – Graduates’ Achievements
72
Graduation Rate – Senior and Two-Year Institutions - Southern Regional Education Board (cont.)
Student Progression Rates,Full-Time, First-Time, Degree or Certificate Seeking Undergraduates,1
All Public Two-Year, 2002 Cohort
Percent of Total First-Time
Freshmen in Cohort
Student Progression Rate2
Percent Completing a Degree/ Certificate at Institution of Initial
Enrollment
Percent Still Enrolled at
Institution of Initial Enrollment
Percent Transfers All Other Total
SREB states 54 48 17 13 17 52 100
Alabama 76 43 19 24 57 100Arkansas 61 53 20 16 17 47 100Delaware 58 10 10 90 100Florida 56 59 31 15 12 41 100
Georgia 72 54 15 12 27 46 100Kentucky 68 65 35 22 8 35 100Louisiana 65 39 6 10 24 61 100Maryland 57 56 8 22 26 44 100
Mississippi — — — — — — —North Carolina 36 27 18 9 73 100Oklahoma 59 51 18 11 22 49 100South Carolina 68 45 13 18 14 55 100
Tennessee 78 44 12 17 15 56 100Texas 46 48 11 16 21 52 100Virginia 62 44 14 18 11 56 100West Virginia 80 30 9 12 9 70 1001 The SREB student progression rate includes completers, those still enrolled and transfers from the cohort within 150 percent of normal time. Members of the initial cohort who are deceased, totally and permanently disabled, left school to serve in the armed forces or the federal foreign aid service such as the Peace Corps, or who left school to serve on an official church mission are subtracted from the cohort before percentages are calculated. Members of the initial cohort who completed only an award below the baccalaureate level and those who completed a bachelor's but not within 150 percent of normal time are not counted in the columns shown.2Within 150 percent of normal time.

Section 7 – Graduates’ Achievements
73
Student Performance on Professional Examinations The following tables (7.2 - 7.4) summarize graduates’ performances on various professional examinations. These examinations are designed to measure minimum knowledge necessary for licensing or to practice in the designated profession. Institutions are required to report data on first-time test takers (with the exception of the PRAXIS Series, which includes all test takers) for the set time period. The Commission on Higher Education (CHE) obtains comparable data (when available) on national and state pass rates for each exam reported. These data are displayed in Table 7.3. The following table lists data from each institution on individual exams taken between April 1 – March 31 of the years reported. For Performance Funding Indicator 7D – Scores of Graduates on Post-Undergraduate Professional, Graduate, or Employment-Related Examinations and Certification Tests, data displayed in Table 7.2 are collapsed by CHE to provide a single overall passing average for institutions as shown in Table 7.4. Table 7.2 – Student Performance on Professional Examinations by Exam by Year for SC’s Public Institutions Source: Institutional IE Reports to CHE The following table lists data from each institution on individual exams taken between April 1 – March 31 of the years reported. Exam data from the most recent three-year period are included. Data for exams reported in timeframes not corresponding to the April-March period (e.g., “Jan-Jun 2004” or “ongoing during 2002 or 2003”) were included as data reported from April to December of the year reported. Some historical information has been updated to reflect verified data. Exams taken between April 1 and March 31 of year listed
2005-2006 2004-2005 2003-2004
Exam Title Institution # # % # # % # # %
Tested Passing Passing Tested Passing Passing Tested Passing Passing
ACC National Certif. Exam. in Nurse Midwifery MUSC 9 9 100.0% 2 1 50.0% 5 5 100.0%
Aircraft Maintenance - Airframe Greenville Tech 1 1 100.0% 1 1 100.0% 4 4 100.0%
Trident Tech 26 26 100.0% 14 14 100.0% 2 2 100.0%
Aircraft Maintenance - General Greenville Tech 3 3 100.0% 2 2 100.0% 5 5 100.0%
Trident Tech 26 26 100.0% 14 14 100.0% 2 2 100.0%
Aircraft Maintenance - Powerplant Greenville Tech 5 5 100.0% 4 4 100.0% 2 2 100.0%
Trident Tech 26 26 100.0% 14 14 100.0% 2 2 100.0%
American Bd of Cardiovascular Perfusion Exam Part 1 (PBSE) MUSC 4 4 100.0% 4 4 100.0% 11 11 100.0%
American Bd of Cardiovascular Perfusion Exam Part II (CAPE) MUSC 2 2 100.0% 5 5 100.0% 6 6 100.0%
Barbering Denmark Tech 1 1 100.0% 4 4 100.0% 9 9 100.0%

Section 7 – Graduates’ Achievements
74
Exams taken between April 1 and March 31 of year listed
2005-2006 2004-2005 2003-2004
Exam Title Institution # # % # # % # # %
Tested Passing Passing Tested Passing Passing Tested Passing Passing
Certification Exam. For Entry Level Respiratory Therapy Practitioners (CRTT) Florence-Darlington 8 7 87.5% 9 7 77.8% 8 8 100.0%
Greenville Tech 14 10 71.4% 10 10 100.0% 7 4 57.1%
Midlands Tech 11 11 100.0% 7 6 85.7%
Orangeburg-Calhoun 14 11 78.6% 8 6 75.0% 5 3 60.0%
Piedmont Tech 12 12 100.0%
Spartanburg CC5 9 8 88.9% 11 7 63.6%
Tri-County Tech 13 9 69.2% 15 8 53.3% 10 3 30.0%
Trident Tech 12 11 91.7% 11 8 72.7% 5 5 100.0%
Certified Medical Assistant Exam. Central Carolina 2 2 100.0% 4 4 100.0% 7 7 100.0%
Midlands Tech 10 9 90.0% 4 4 100.0% 4 3 75.0%
Orangeburg-Calhoun 4 3 75.0% 7 4 57.1%
Spartanburg CC5 13 11 84.6% 12 11 91.7% 7 7 100.0%
Tri-County Tech 14 13 92.9% 10 7 70.0% 10 6 60.0%
Trident Tech 23 21 91.3% 22 20 90.9% 12 11 91.7%
Certified Occupational Therapy Assistant (COTA) Greenville Tech 11 10 90.9% 14 12 85.7% 18 16 88.9%
Trident Tech 14 13 92.9% 3 3 100.0% 6 4 66.7%
Clinical Laboratory Scientist/Generalist, NCA MUSC
Clinical Laboratory Technician, NCA Greenville Tech
Trident Tech
Cosmetology Examination Denmark Tech 4 4 100.0% 12 8 66.7% 11 8 72.7%
Florence-Darlington 16 16 100.0% 22 22 100.0%
Tech Coll of Low Ctry 11 11 100.0% 16 15 93.8% 17 16 94.1%
Trident Tech 13 13 100.0% 20 18 90.0% 13 12 92.3%
Williamsburg Tech 4 4 100.0% 2 2 100.0% 2 2 100.0%
Council on Certification of Nurse Anesthetists Exam. USC-Columbia
MUSC 20 19 95.0% 20 19 95.0% 19 19 100.0%
Emergency Medical Technician - NREMT Basic Greenville Tech 32 25 78.1% 28 19 67.9% 26 20 76.9%
Emergency Medical Technician - NREMT Intermediate Greenville Tech 41 28 68.3% 28 22 78.6% 25 19 76.0%
Emergency Medical Technician - NREMT Paramedic Greenville Tech 41 31 75.6% 14 13 92.9% 10 7 70.0%

Section 7 – Graduates’ Achievements
75
Exams taken between April 1 and March 31 of year listed
2005-2006 2004-2005 2003-2004
Exam Title Institution # # % # # % # # %
Tested Passing Passing Tested Passing Passing Tested Passing Passing
Medical Laboratory Technician, ASCP Florence-Darlington 5 5 100.0% 4 4 100.0% 5 5 100.0%
Greenville Tech 5 5 100.0% 7 5 71.4% 9 8 88.9%
Midlands Tech 8 7 87.5% 5 5 100.0% 6 6 100.0%
Orangeburg-Calhoun 6 6 100.0% 6 5 83.3% 6 6 100.0%
Spartanburg CC5 7 7 100.0% 12 12 100.0% 7 6 85.7%
Tri-County Tech 10 8 80.0% 13 13 100.0% 12 11 91.7%
Trident Tech 5 5 100.0% 8 8 100.0% 6 4 66.7%
York Tech 5 5 100.0%
Medical Technologist, ASCP MUSC
Multi-State Pharmacy Jurisprudence Exam (MPJE) USC-Columbia 105 95 90.5% 114 102 89.5% 89 73 82.0%
MUSC 98 89 90.8% 42 41 97.6% 86 76 88.4%
National Board Dental Exam. Part I MUSC 58 56 96.6% 52 49 94.2% 51 44 86.3%
National Board Dental Exam. Part II MUSC 52 51 98.1% 50 47 94.0% 46 43 93.5%
National Bd for Dental Hygiene Exam. Florence-Darlington 15 14 93.3% 15 14 93.3% 12 12 100.0%
Greenville Tech 32 31 96.9% 26 20 76.9% 40 35 87.5%
Horry-Georgetown 16 16 100.0% 16 12 75.0% 24 17 70.8%
Midlands Tech 20 20 100.0% 24 24 100.0% 21 20 95.2%
Trident Tech 23 20 87.0% 24 23 95.8% 21 20 95.2%
York Tech 9 8 88.9% 15 15 100.0% 9 8 88.9%
National Council Licensure Exam.-Practical Nurse Aiken Tech 17 15 88.2% 20 19 95.0%
Central Carolina 14 13 92.9% 23 23 100.0% 11 11 100.0%
Florence-Darlington 93 90 96.8% 82 81 98.8% 82 81 98.8%
Greenville Tech 48 46 95.8% 68 67 98.5% 70 68 97.1%
Horry-Georgetown 23 22 95.7% 93 85 91.4% 21 21 100.0%
Midlands Tech 51 51 100.0% 61 61 100.0% 52 51 98.1%
Northeastern 1 20 17 85.0% 14 12 85.7% 14 13 92.9%
Orangeburg-Calhoun 30 29 96.7% 29 26 89.7% 28 25 89.3%
Piedmont Tech 70 65 92.9% 65 54 83.1% 71 59 83.1%
Spartanburg CC5 36 34 94.4% 34 27 79.4%
Tech Coll of Low Ctry 22 22 100.0% 10 10 100.0% 10 10 100.0%
Tri-County Tech 34 32 94.1% 26 26 100.0% 22 22 100.0%
Trident Tech 24 24 100.0% 33 33 100.0% 38 38 100.0%
York Tech 13 13 100.0% 14 14 100.0% 12 12 100.0%

Section 7 – Graduates’ Achievements
76
Exams taken between April 1 and March 31 of year listed
2005-2006 2004-2005 2003-2004
Exam Title Institution # # % # # % # # %
Tested Passing Passing Tested Passing Passing Tested Passing Passing
National Council Licensure Exam.- Registered Nurse (BSN) Clemson 99 82 82.8% 116 97 83.6%
93 86 92.5%
USC-Columbia 95 91 95.8% 87 68 78.2% 76 67 88.2%
MUSC 123 116 94.3% 99 99 100.0% 69 62 89.9%
Lander 27 25 92.6% 21 21 100.0% 22 21 95.5%
SC State 10 5 50.0% 15 4 26.7% 6 4 66.7%
USC-Aiken 60 53 88.3% 55 50 90.9% 41 33 80.5%
USC-Upstate 144 112 77.8% 106 91 85.8% 104 98 94.2%
National Council Licensure Exam.- Registered Nurse (ADN)
USC-Lancaster / York Tech 2 12 12 100.0% 13 12 92.3% 15 12 80.0%
***USC-Lancaster only Central Carolina 53 46 86.8% 55 51 92.7% 46 42 91.3%
Florence-Darlington 122 99 81.1% 136 108 79.4% 102 93 91.2%
Greenville Tech 221 200 90.5% 225 209 92.9% 123 114 92.7%
Horry-Georgetown 55 41 74.5% 14 14 100.0% 72 68 94.4%
Midlands Tech 112 105 93.8% 90 88 97.8% 122 114 93.4%
Orangeburg-Calhoun 40 40 100.0% 37 37 100.0% 41 40 97.6%
Piedmont Tech 54 47 87.0% 59 45 76.3% 55 47 85.5%
Tech Coll of Low Ctry 40 38 95.0% 39 34 87.2% 32 32 100.0%
Tri-County Tech 72 61 84.7% 79 49 62.0% 57 54 94.7%
Trident Tech 110 105 95.5% 165 139 84.2% 153 118 77.1%
York Tech 20 17 85.0% 24 23 95.8% 27 27 100.0%
National Physical Therapist Licensing Exam. (PT) MUSC 45 28 62.2%
65 47 72.3%
National Physical Therapist Assistant Exam (PTA) Greenville Tech 28 26 92.9% 35 28 80.0% 22 18 81.8%
Midlands Tech 10 10 100.0% 8 7 87.5% 2 2 100.0%
Trident Tech 13 13 100.0% 14 11 78.6%
Neonatal Nurse Practitioner Exam. MUSC
North American Pharmacist Licensure Exam. (NAPLEX) USC-Columbia 116 110 94.8% 67 66 98.5%
65 63 96.9%
MUSC 63 58 92.1% 49 48 98.0%
52 47 90.4%
Nuclear Medicine Technology, ARRT Midlands Tech 13 13 100.0% 9 9 100.0% 6 6 100.0%
Horry-Georgetown 1 1 100.0%
Nuclear Medicine Technology Certification Board Exam. Midlands Tech 16 16 100.0% 16 16 100.0%
16 16 100.0%
Nurse Aid Competency Evaluation Program (NACEP) Orangeburg-Calhoun 18 18 100.0% 8 8 100.0% 13 13 100.0%
Tech Coll of Low Ctry 27 24 88.9%

Section 7 – Graduates’ Achievements
77
Exams taken between April 1 and March 31 of year listed
2005-2006 2004-2005 2003-2004
Exam Title Institution # # % # # % # # %
Tested Passing Passing Tested Passing Passing Tested Passing Passing
Physician Assistant National Certifying Exam. MUSC 44 44 100.0% 41 36 87.8%
21 19 90.5%
Praxis Series II: Principles of Learning & Teaching (K-6) Clemson 164 141 86.0% 197 180 91.4%
147 138 93.9%
USC-Columbia 51 45 88.2% 16 15 93.8%
19 16 84.2%
These scores will not be Coastal Carolina 15 13 86.7% 8 4 50.0%
4 3 75.0%
used for performance. Coll. of Charleston 28 25 89.3% 28 21 75.0%
23 21 91.3%
funding scoring in Year 10 Francis Marion 21 18 85.7% 27 22 81.5%
21 18 85.7%
Lander 12 11 91.7% 6 3 50.0%
6 5 83.3%
SC State
USC-Aiken 18 12 66.7% 9 8 88.9%
2 1 50.0%
USC-Upstate 51 40 78.4% 38 25 65.8%
51 41 80.4%
Winthrop 107 98 91.6% 109 91 83.5%
127 116 91.3%
Praxis Series II: Principles of Learning & Teaching (5-9) Clemson 44 37 84.1% 27 21 77.8%
3 3 100.0%
These scores will not be USC-Columbia 6 3 50.0% 3 1 33.3%
2 2 100.0%
used for performance. Coastal Carolina 2 2 100.0%
funding scoring in Year 10 Coll. of Charleston 6 5 83.3% 3 3 100.0%
3 2 66.7%
Francis Marion 1 1 100.0%
1 1 100.0%
Lander 1 0 0.0% 1 0 0.0%
USC-Aiken 2 2 100.0%
USC-Upstate 14 11 78.6% 7 5 71.4%
2 1 50.0%
Winthrop 3 3 100.0% 3 1 33.3%
Praxis Series II: Principles of Learning & Teaching (7-12) Clemson 120 96 80.0% 88 71 80.7%
64 42 65.6%
These scores will not be USC-Columbia 33 31 93.9% 11 8 72.7%
14 14 100.0%
used for performance. The Citadel 11 9 81.8% 4 3 75.0%
3 1 33.3%
funding scoring in Year 10 Coastal Carolina 2 2 100.0% 2 2 100.0%
2 2 100.0%
Coll. Of Charleston 6 6 100.0%
5 5 100.0%
Francis Marion 3 3 100.0% 10 9 90.0%
3 0 0.0%
Lander 5 5 100.0% 1 1 100.0%
1 1 100.0%
SC State
USC-Aiken 5 4 80.0% 1 1 100.0%
USC-Upstate 13 10 76.9% 9 5 55.6%
9 4 44.4%
Winthrop 35 30 85.7% 62 54 87.1%
61 56 91.8%
PRAXIS Series II: Subject Assessment/Specialty Area Tests Clemson 708 614 86.7% 672 584 86.9% 525 485 92.4%
USC-Columbia 442 411 93.0% 443 432 97.5%
476 454 95.4%
The Citadel 134 115 85.8% 111 89 80.2%
141 112 79.4%
Coastal Carolina 253 220 87.0% 179 154 86.0%
140 120 85.7%
Coll. of Charleston 427 402 94.1% 429 404 94.2%
448 413 92.2%

Section 7 – Graduates’ Achievements
78
Exams taken between April 1 and March 31 of year listed
2005-2006 2004-2005 2003-2004
Exam Title Institution # # % # # % # # %
Tested Passing Passing Tested Passing Passing Tested Passing Passing
Francis Marion 132 118 89.4% 103 66 64.1%
68 67 98.5%
Lander 24 18 75.0% 33 21 63.6%
61 45 73.8%
SC State 34 34 100.0% 45 45 100.0%
48 48 100.0%
USC-Aiken 166 132 79.5% 135 125 92.6%
155 141 91.0%
USC-Upstate 273 238 87.2% 271 231 85.2%
259 227 87.6%
Winthrop 486 456 93.8% 377 360 95.5%
386 352 91.2%
PRAXIS- Specialty Area (Speech-Language Path.) MUSC 24 23 95.8% 17 17 100.0%
14 14 100.0%
Radiography Exam., ARRT Florence-Darlington 15 13 86.7% 17 16 94.1%
15 14 93.3%
Greenville Tech 26 25 96.2% 19 19 100.0%
25 24 96.0%
Horry-Georgetown 16 13 81.3% 20 17 85.0%
11 10 90.9%
Midlands Tech 11 11 100.0% 11 11 100.0%
9 9 100.0%
Orangeburg-Calhoun 17 17 100.0% 14 12 85.7%
5 3 60.0%
Piedmont Tech 16 14 87.5% 10 8 80.0%
12 11 91.7%
Spartanburg CC5 8 8 100.0% 10 10 100.0%
7 7 100.0%
Tech of the Lowcountry 11 11 100.0%
Trident Tech 18 10 55.6% 17 13 76.5%
20 14 70.0%
York Tech 9 9 100.0% 10 10 100.0%
13 13 100.0%
Registered Health Information Technician (Formerly Accredited Record Technician) Florence-Darlington 4 2 50.0%
Greenville Tech 3 3 100.0% 4 4 100.0%
Midlands Tech 8 4 50.0% 5 5 100.0%
6 4 66.7%
Registry Exam. For Advanced Respiratory Therapy Practitioners (RRT) - Clinical Simulation (previously known as "Respiratory Care Adv.-Clinical Simulation") Florence-Darlington
Greenville Tech 11 8 72.7% 6 6 100.0% 4 3 75.0%
Midlands Tech 11 11 100.0% 11 11 100.0%
6 6 100.0%
Orangeburg-Calhoun 1 1 100.0%
Piedmont Tech 2 2 100.0% 11 11 100.0%
2 2 100.0%
Spartanburg CC5 8 7 87.5% 12 7 58.3%
5 3 60.0%
Trident Tech
Registry Exam. for Advanced Respiratory Therapy Practitioners (RRT) - Written Registry Florence-Darlington
Greenville Tech 11 9 81.8% 6 6 100.0% 3 3 100.0%
Midlands Tech 11 11 100.0%
5 5 100.0%
Orangeburg-Calhoun 1 1 100.0%
Piedmont Tech 2 2 100.0%
12 12 100.0%
Spartanburg CC5 12 7 58.3% 10 6 60.0%
7 5 71.4%

Section 7 – Graduates’ Achievements
79
Exams taken between April 1 and March 31 of year listed
2005-2006 2004-2005 2003-2004
Exam Title Institution # # % # # % # # %
Tested Passing Passing Tested Passing Passing Tested Passing Passing
South Carolina Board of Law Examination USC-Columbia 497 410 82.5% 445 373 83.8%
201 164 81.6%
Cytotechnology (ASCP) In 2001-2002,changedfrom "Specialist in Cytotechnology." MUSC 10 10 100.0% 13 13 100.0% 6 6 100.0%
SRTA Regional Exam. for Dental Hygienists Florence-Darlington 15 14 93.3% 10 10 100.0% 15 14 93.3%
Greenville Tech 21 20 95.2% 57 55 96.5% 25 23 92.0%
Horry-Georgetown 16 15 93.8% 16 14 87.5%
Midlands Tech 41 39 95.1% 21 20 95.2% 20 18 90.0%
Trident Tech 45 45 100.0% 21 21 100.0%
York Tech 9 9 100.0% 15 15 100.0%
State Board Dental Exam-SRTA Exam MUSC 49 40 81.6% 48 32 66.7% 52 33 63.5%
Surgical Technologist National Certifying Exam. Central Carolina Tech 5 3 60.0%
4 2 50.0%
Florence-Darlington 7 5 71.4% 13 9 69.2%
10 8 80.0%
Greenville Tech 5 3 60.0% 6 5 83.3%
3 3 100.0%
Midlands Tech 8 8 100.0% 3 3 100.0%
4 4 100.0%
Piedmont Tech
Spartanburg CC5 14 14 100.0% 16 15 93.8%
13 13 100.0%
Tri-County Tech 8 5 62.5% 0
6 4 66.7%
US Medical Licensing Exam. - Step I USC-Columbia 78 74 94.9% 74 72 97.3% 67 57 85.1%
MUSC 138 133 96.4% 147 136 92.5% 134 126 94.0%
US Medical Licensing Exam. - Step II USC-Columbia 80 80 100.0% 66 65 98.5%
MUSC 139 135 97.1% 139 128 92.1% 138 127 92.0%
Veterinary Technician National Examination Tri-County Tech 15 8 53.3% 13 11 84.6% 12 12 100.0%
Trident Tech 12 10 83.3%
12 11 91.7%
8 7 87.5% 1 USC Upstate was formerly USC Spartanburg 2 Joint nursing program with USC Lancaster and York Tech 3 These examinations make up Indicator 3E2a for Teaching Sector institutions. For an explanation of their deferral from use as a performance indicator, see the description of Indicator 3E2a on page 41. 4 These examinations make up Indicator 3E2b for Teaching Sector institutions 5Formerly Spartanburg Technical College

Section 7 – Graduates’ Achievements
80
National and South Carolina Pass Rates on Professional Examinations The following table lists national and South Carolina pass rates of graduates and/or prospective graduates on professional and certification examinations. Data reported are generally derived from the same time frame as requested from the institutions – April 1 – March 31 – and have been compiled from agency reports to the CHE. For data that may have crossed over the April – March reporting period or for a change in exam title, a footnote is provided at the end of the table. Calendar year reports that do not correspond to the April – March timeframe are included in the April – December time period for the appropriate year (e.g., Jan. - June 1997 summary data are included in 1997-98 data). Some agencies do not maintain national or state pass rates and thus cannot report them to the CHE. In these cases, “NA” is listed. An empty space is left when an agency did not respond to CHE requests by the printing of this report. Each exam listed has been reported by state institutions at least once in the past. Some historical information has been updated to reflect verified data. Table 7.3 - National and South Carolina Pass Rates on Professional Examinations Source: Examination agencies’ reports to CHE Exam Title 2005-2006 2004-2005 2003-2004
National SC National SC National SC ACC National Certification Exam in Nurse Midwifery 90 N/A 50% Accredited Record Technician See Registered Health Information Technician Aircraft Maintenance-Airframe 93% 100% 92% 100% 100% Aircraft Maintenance-General 89% 100% 91% 100% 100% Aircraft Maintenance-Powerplant 91% 100% 90% 100% 100% American Bd. of Cardiovascular Perfusion Exam - Part I (PBSE) 70% 100% 100% 100% American Bd. of Cardiovascular Perfusion Exam - Part II (CAPE) 76% 100% 100% 100% Barbering 52% 100% 100% 100% Certification Exam. for Entry Level Respiratory Therapy Practitioners (CRTT)
85% 69% 65% Certified Medical Assistant Exam. 68% 89% 85% 85% Certified Occupational Therapist Assistant (COTA) 89% 92% 88% 83% Cosmetology Examination 79% 100% 90% 88% Council on Certification of Nurse Anesthetists Exam. 95% 95% 100% Cytotechnology (ASCP) In 2001-2002,changedfrom "Specialist in Cytotechnology." 100% 100% Emergency Medical Technician - NREMT Basic 65% 78% 64% 68% 77% Emergency Medical Technician - NREMT Intermediate 62% 68% 56% 79% 76% Emergency Medical Technician - NREMT Paramedic 65% 76% 64% 93% 70% Medical Laboratory Technician ASCP 94% 95% 90% Multi-state Pharmacy Jurisprudence Exam (MPJE) 91% 92% 85% National Board Dental Exam. Part I 97% 94% 86% National Board Dental Exam. Part II 98% 94% 95% National Board for Dental Hygiene Exam.
95% 90% 96% National Council Licensure Exam - Practical Nurse 88% 96% 95% 94%

Section 7 – Graduates’ Achievements
81
National Council Licensure Exam - Registered Nurse (ADN) 87% 89% 87% 90% National Council Licensure Exam - Registered Nurse (BSN) 87% 86% 91% National Physical Therapist Licensing Exam. (PT) 71% 62% - 72% National Physical Therapist Licensing Exam. (PT Asst.) 89% 96% 81% 82% North American Pharmacist Licensure Exam 94% 98% 94% Nuclear Medicine Technology AART
92% 100% 100% 100% Nuclear Medicine Technology Certification Bd. Exam. 100% 100% 100% Nurse Aid Competency Evaluation Program 100% 91% 100% Occupational Therapy, Registered (OTR)
87% 100% 93% 97% Physician Assistant National Certifying Exam. (PANCE) 91% 100% 88% 91% Praxis Series II: Subject Assessment/Specialty Area Tests 90% 90% 91% Praxis Series II: Subject Assessment/Specialty Area Tests (Speech Path)
96% 100% 100% Radiography Exam ARRT 89% 89% 89% 91% 90% Registered Health Information Technician 71% 60% 100% 80% Registry Exam. For Advanced Respiratory Therapy Practitioners (RRT) - Clinical Simulation 88% 88% 83% Registry Exam. For Advanced Respiratory Therapy Practitioners (RRT) - Written Registry 81% 75% 93% South Carolina Board of Law Examination N/A 83% N/A 84% N/A 82% SRTA Regional Exam. for Dental Hygienists 97% 96% 94% State Board Dental Exam.-SRTA Exam. (previously known "SC Board of Dentistry")
N/A 82% N/A 67% N/A 64% Surgical Technologist National Certifying Exam 83.3 64% 81% 85% US Medical Licensing Exam. - Step I 96% 94% 91% US Medical Licensing Exam. - Step II 97% 94% 93% 94% Veterinary Technician National Exam 67% 88% 95%
1Based on pass rates reported by public colleges.

Section 7 – Graduates’ Achievements
82
Overall Pass Rates on Professional Examinations by Year for SC’s Public Institutions Table 7.4 - Percentage of Students Who Pass Certification Examinations Source: Institutional Effectiveness Reports
N/A – Institution had no students take an examination in this time frame. *Formerly USC Spartanburg
2005-06 2004-05 2003-04 2002 - 032004-05 to
2005-062003-04 to
2004-05 2002-03 to
2005-06
Clemson 86.2% 86.4% 92.4% 89.5% -0.2% -6.0% -3.3%USC Columbia 89.3% 96.3% 90.7% 90.9% -7.0% 5.6% -1.6%MUSC 93.2% 92.8% 88.7% 89.6% 0.4% 4.1% 3.6%
Citadel 85.8% 80.2% 78.5% 80.7% 5.6% 1.7% 5.1%Coastal Carolina 87.0% 86.0% 85.7% 91.1% 1.0% 0.3% -4.1%College of Charleston 94.1% 94.2% 92.2% 93.2% -0.1% 2.0% 0.9%Francis Marion 89.4% 64.1% 98.5% 88.7% 25.3% -34.4% 0.7%Lander 84.3% 77.8% 79.5% 91.8% 6.5% -1.7% -7.5%SC State 88.6% 81.7% 96.3% 82.7% 6.9% -14.6% 5.9%USC Aiken 81.9% 92.1% 88.8% 84.8% -10.2% 3.3% -2.9%USC Beaufort N/A N/A N/A N/AUSC Upstate* 83.9% 85.4% 89.3% 89.2% -1.5% -3.9% -5.3%Winthrop 93.8% 95.5% 91.2% 94.3% -1.7% 4.3% -0.5%
USC Lancaster 100.0% 92.3% 80.0% 84.6% 7.7% 12.3% 15.4%USC Salkehatchie N/A N/A N/A N/A N/A N/A N/AUSC Sumter N/A N/A N/A N/A N/A N/A N/AUSC Union N/A N/A N/A N/A N/A N/A N/A
Technical CollegesAiken N/A 88.2% 95.0% 75.8% -6.8%Central Carolina 88.4% 93.1% 91.2% 89.3% -4.7% 1.9% -0.9%Denmark 100.0% 75.0% 85.0% 93.9% 25.0% -10.0% 6.1%Florence-Darlington 88.3% 88.0% 94.4% 94.1% 0.3% -6.4% -5.8%Greenville 87.5% 90.5% 89.4% 88.1% -3.0% 1.1% -0.6%Horry-Georgetown 84.9% 89.4% 90.6% 89.7% -4.5% -1.2% -4.8%Midlands 95.6% 98.2% 94.6% 96.7% -2.6% 3.6% -1.1%Northeastern 85.0% 85.7% 92.9% 93.3% -0.7% -7.2% -8.3%Orangeburg-Calhoun 96.2% 89.9% 91.8% 92.0% 6.3% -1.9% 4.2%Piedmont 91.0% 81.4% 86.2% 83.1% 9.6% -4.8% 7.9%Spartanburg 87.1% 88.0% 82.4% 88.6% -0.9% 5.6% -1.5%Tech Coll. of LowCountry 97.6% 90.2% 98.3% 93.4% 7.4% -8.1% 4.2%Tri-County 81.9% 73.1% 86.8% 82.0% 8.8% -13.7% -0.1%Trident 94.4% 89.1% 87.3% 91.5% 5.3% 1.8% 2.9%Williamsburg 100.0% 100.0% 100.0% N/A 0.0% 0.0% N/AYork 93.8% 98.7% 98.4% 92.5% -4.9% 0.3% 1.3%
Two-year Branch Campuses
Percentage Passing Examinations taken from April 1 to March 31
Difference
Research Institutions
Teaching Institutions

Section 7 – Graduates’ Achievements
83
Results of Professional Examinations
0.0%25.0%50.0%75.0%
100.0%
Pass
Rat
e
2002-03 89.5% 90.9% 89.6%
2003-04 92.4% 90.7% 88.7%
2004-05 86.4% 90.7% 92.8%
Clemson USC Columbia MUSC
Results of Professional Examinations
0.0%25.0%50.0%75.0%
100.0%125.0%
Pass
Rat
e
2002-03 80.7% 91.1% 93.2% 88.7% 91.8% 82.7% 84.8% - 89.2% 94.3%
2003-04 79.4% 85.7% 92.2% 98.5% 79.5% 96.3% 88.8% - 89.3% 91.2%
2004-05 80.2% 86.0% 94.2% 64.1% 77.8% 81.7% 92.1% - 85.4% 95.5%
The Cit adelCoast al
Carolina College of
Charlest onFrancis
Marion Univ.Lander
Universit ySC St at e
Univ.*USC Aiken
USC Beauf ort *
USC Upst at e**
Wint hrop Universit y
Scores of Graduates on Post-Undergraduate Professional, Graduate, or Employment-Related Examinations and Certification Tests Indicator 7D, Scores of Graduates on Post-Undergraduate Professional, Graduate, or Employment-Related Examinations and Certification Tests, measures the overall percentage of students at an institution taking certification examinations who pass the examinations. The data are taken from the individual tests as reported by each institution and displayed in Table 7.3. Because of the wide variety in the number of students, programs and examinations across institutions as evident in Table 7.3, the reader is cautioned against making direct comparisons of the overall percentage passing across institutions. Some historical information has been updated to reflect verified data. This chart does not include results from the PRAXIS PLT exams or from the DANBE. Figure 7.3 – Results of Professional Examinations used for Performance Funding Indicator 7D The charts below indicate the Pass Rate used to determine Performance Funding scores earned by institutions on Indicator 7D for the 2002-03, 2003-04, and 2004-05 performance years. Data for these performance years come from the preceding April – March period. The range for an “Achieves” for these institutions for Year 10 (2005-06) performance funding was 75%-89%. Research Institutions Four-Year Colleges and Universities
*This indicator did not apply to USC Beaufort during its transition to four-year status ** Formerly USC Spartanburg

Section 7 – Graduates’ Achievements
84
Results of Professional Examinations
0.0%
25.0%
50.0%
75.0%
100.0%
Pass
Rat
e
2002-03 84.6%
2003-04 80.0%
2004-05 92.3%
USC Lancaster
Results of Professional Examinations
0.0%25.0%50.0%75.0%
100.0%
Pass
Rat
e
2002-03 75.8% 89.3% 93.9% 94.1% 88.1% 89.7% 96.7% 93.3%
2003-04 95.0% 91.2% 85.0% 94.4% 89.4% 90.6% 94.6% 92.9%
2004-05 88.2% 93.1% 75.0% 88.0% 90.5% 89.4% 98.2% 85.7%
Aiken TechCent ral
Carolina TechDenmark Tech
Florence-Darlingt on
Greenville Tech
Horry-Georget own
Midlands TechNort heast ern
Tech
Results of Professional Examinations
0.0%25.0%50.0%75.0%
100.0%
Pass
Rat
e
2002-03 92.0% 83.1% 88.6% 93.4% 82.0% 91.5% - 92.5%
2003-04 91.8% 86.2% 82.4% 98.3% 86.8% 83.9% 100.0% 98.4%
2004-05 89.9% 81.4% 88.0% 90.2% 73.1% 89.1% 100.0% 98.7%
Orangeburg-Calhoun
Piedmont TechSpart anburg
CC*Tech Coll. of LowCount ry
Tr i-Count y Tech
Trident TechWilliamsburg
TechYork Tech
Two-Year Regional Campuses of USC USC – Lancaster was the only one of the regional campuses to have programs in which students took professional examinations.
Technical College System
*Formerly Spartanburg Technical College

Section 7 – Graduates’ Achievements
85
Number of Graduates Who Continued Their Education Beginning in Performance Year 7 (2002-2003), an indicator was developed to recognize the unique role played by the Regional Campus sector in preparing and transferring students to the state’s four-year campuses. This indicator is defined as:
Percentage of first-time, full-time degree-seeking students who earn a baccalaureate degree within 150% of normal program time (6 years for a baccalaureate degree) from in-state public institutions or from other institutions provided appropriate documentation can be presented by the reporting regional campus. (Performance Funding Workbook, September 2002, p II 167.)
Figure 7.4 – Performance Funding Indicator 7E: Number of Graduates Who Continued Their Education The range for an “Achieves” is from 25% to 40%.
*USC Beaufort is included in this measure as part of its transition plan.
Percentage of Graduates Who Continued Their Education
0.0%20.0%40.0%60.0%80.0%
100.0%
1997 Cohort 38.1% 29.9% 23.8% 37.6% 28.6%
1998 Cohort 25.7% 33.3% 26.1% 31.6% 29.0%
1999 Cohort 16.8% 31.8% 21.8% 23.9% 34.5%
USC Beaufort*
USC Lancaster
USC Salkehatchie
USC Sumter USC Union

Section 7 – Graduates’ Achievements
86
(blank page)

Section 8 – User Friendliness of the Institution
87
Section 8 User-Friendliness of the Institution

Section 8 – User Friendliness of the Institution
88
(blank page)

Section 8 – User Friendliness of the Institution
89
USER-FRIENDLINESS OF THE INSTITUTION The user-friendliness of institutions is evaluated through performance funding based and institutional effectiveness requirements mandated through Act 255 of 1992, as amended. Table 8.1, “First-Time Undergraduate Transfers,” summarizes transfer data for first-time, full-time undergraduate students from and to different types of institutions in the state. This information is reported in fulfillment of institutional effectiveness reporting requirements. Table 8.2, “Enrollment by Race,” displays minority enrollment for Fall 2000 and Fall 2005 and the percent change over these years. The number of African-American students increased 18.2% and other minority students increased 37.6% during the period displayed, while the total higher education population growth was 12.3%. It should be noted that the greatest part of this increase in African-American students came in the Technical sector, but that all sectors other than Research showed increases. All three research universities showed a slight decline. Additional data on student enrollment and faculty are located in the CHE publication, “South Carolina Higher Education Statistical Abstract.” Performance Funding Indicator 8C – Accessibility to the Institutions of all Citizens of the State, has been defined such that institutions are measured each year on the percentage of undergraduate students who are South Carolina citizens who are minority; the annual retention of undergraduate students who are South Carolina citizens who are degree-seeking; the percent of minority graduate students enrolled; and the percentage of minority faculty. Data for the past three years for these performance funding measures are found in Figures 8.1 through 8.4. Details for the measurement of performance funding indicators are accessible on the web in the annual Performance Funding Workbook.

Section 8 – User Friendliness of the Institution
90
TRANSFERRING FROM:FT* PT** FT PT FT PT FT PT FT PT FT PT All
SC Public Senior InstitutionsFall 2002 725 86 28 12 521 446 150 41 3 1 1,427 586 2,013Fall 2003 738 86 28 13 714 565 125 48 4 2 1,609 714 2,323Fall 2004 762 66 31 21 765 628 176 51 2 0 1,736 766 2,502Fall 2005 827 75 52 9 817 633 115 39 3 1 1,814 757 2,571
SC 2-Yr Regional CampusesFall 2002 287 59 2 0 39 26 11 0 0 0 339 85 424Fall 2003 324 51 4 0 42 35 16 4 0 0 386 90 476Fall 2004 319 48 1 0 51 45 21 6 1 0 393 99 492Fall 2005 279 40 1 0 58 35 17 3 0 0 355 78 433
SC Technical CollegesFall 2002 1,365 401 43 53 396 383 418 112 2 6 2,224 955 3,179Fall 2003 1,509 371 38 32 421 504 371 151 29 7 2,368 1,065 3,433Fall 2004 1,583 345 45 54 553 514 570 167 10 2 2,761 1,082 3,843Fall 2005 1,448 351 53 38 499 567 398 150 6 3 2,404 1,109 3,513
SC Private Senior InstitutionsFall 2002 358 29 15 5 217 147 132 21 4 0 726 202 928Fall 2003 315 24 14 8 259 203 111 25 9 4 708 264 972Fall 2004 333 33 8 2 284 219 166 32 5 1 796 287 1,083Fall 2005 330 35 18 4 283 246 106 23 7 1 744 309 1,053
SC Private 2-Yr CollegesFall 2002 86 10 4 1 27 24 22 2 0 0 139 37 176Fall 2003 100 7 1 0 36 24 27 6 1 1 165 38 203Fall 2004 90 9 1 0 56 20 39 6 0 0 186 35 221Fall 2005 108 8 4 1 56 33 48 2 0 0 216 44 260
TOTAL Transfers within SCFall 2002 2,821 585 92 71 1,200 1,026 733 176 9 7 4,855 1,865 6,720Fall 2003 2,986 539 85 1,472 1,331 650 234 43 14 5,236 2,118 7,354Fall 2004 3,087 501 86 1,709 1,426 972 262 18 3 5,872 2,192 8,064Fall 2005 2,992 509 128 1,713 1,514 684 217 16 5 5,533 2,245 7,778
Out-of-StateFall 2002 1,480 264 22 21 857 1,021 499 48 12 2 2,870 1,356 4,226Fall 2003 1,469 257 25 29 890 1,222 452 70 11 2 2,847 1,580 4,427Fall 2004 1,551 219 22 25 954 1,267 529 76 8 1 3,064 1,588 4,652Fall 2005 1,494 219 39 25 932 1,300 463 46 7 2 2,935 1,592 4,527
Foreign Fall 2002 34 3 0 0 0 0 11 2 0 0 45 5 50Fall 2003 51 4 0 0 0 0 14 1 0 0 65 5 70Fall 2004 28 5 0 1 0 0 14 0 0 0 42 6 48Fall 2005 45 3 0 0 0 0 12 1 0 0 57 4 61
TOTAL (Transfers To)Fall 2002 4,335 852 114 92 2,057 2,047 1,243 226 21 9 7,770 3,226 10,996Fall 2003 4,506 800 110 29 2,362 2,553 1,116 305 54 16 8,148 3,703 11,851Fall 2004 4,666 725 108 26 2,663 2,693 1,515 338 26 4 8,978 3,786 12,764Fall 2005 4,531 731 167 25 2,645 2,814 1,159 264 23 7 8,525 3,841 12,366
2-Yr Private
InstitutionsTOTAL
(Transfers From)
TRANSFERRING TO SOUTH CAROLINA'S:2-Yr
Regional Institutions
Senior Public
InstitutionsTechnical Colleges
Senior Private Institutions
Undergraduate Transfers The following table summarizes transfer data for first-time, full-time undergraduate students over the past three years and shows that students continue to transfer among all sectors (public and private) and all levels (two- and four-year) of institutions. Table 8.1 First-Time, Full-Time Undergraduate Transfers Source: CHEMIS Data
*Full-time **Part-time

Section 8 – User Friendliness of the Institution
91
Enrollment by Race Headcount enrollment of African-American, Other Minority (i.e., all nonwhite students) and Total All Students is displayed for enrollment in Fall 1999 and Fall 2004. The percentage change in enrollment is computed for the five-year period. Additional data on enrollment in SC public institutions may be found on-line in the CHE “Higher Education Statistical Abstract for SC” at: http://www.che.sc.gov/. Table 8.2 - Percent Change in Minority Enrollment, Fall 2000 to Fall 2005 Source: CHEMIS Data
Headcount Enrollment Headcount Enrollment Percent Change,Fall 2000 Fall 2005 Fall 2000 to Fall 2005
INSTITUTION Afr-Amer.Other
Minority 1Total
Enrollment Afr-Amer.Other
Minority 1Total
Enrollment% Change Afr-Amer.
% Change Other
Minority
% Change Total
Enrollment
Research UniversitiesClemson 1,240 411 17,465 1,155 493 17,165 -6.9% 20.0% -1.7%USC-Columbia 3,831 965 23,728 3,616 1,247 27,065 -5.6% 29.2% 14.1%MUSC 2 275 123 2,346 204 184 2,499 -25.8% 49.6% 6.5%Total, Research 5,346 1,499 43,539 4,975 1,924 46,729 -6.9% 28.4% 7.3%Four-Year Colleges and UniversitiesCitadel 527 156 3,872 351 172 3,386 -33.4% 10.3% -12.6%Coastal Carolina 431 148 4,653 982 223 7,613 127.8% 50.7% 63.6%College of Charleston 881 314 11,129 875 392 11,332 -0.7% 24.8% 1.8%Francis Marion 1,065 60 3,567 1,591 97 4,008 49.4% 61.7% 12.4%Lander 527 38 2,935 624 63 2,703 18.4% 65.8% -7.9%SC State 4,167 34 4,525 4,240 32 4,446 1.8% -5.9% -1.7%USC Aiken 716 94 3,278 818 95 3,303 14.2% 1.1% 0.8%USC Beaufort 216 93 1,175 222 85 1,319 2.8% -8.6% 12.3%USC Upstate3 821 118 3,709 1,169 210 4,484 42.4% 78.0% 20.9%Winthrop 1,349 129 6,061 1,638 189 6,480 21.4% 46.5% 6.9%Total Public, Four-Year Coll. & Univ 10,700 1,184 44,904 12,510 1,558 49,074 16.9% 31.6% 9.3%Two-Year Institutions/Branches of USCUSC-Lancaster 142 11 837 257 22 1,084 81.0% 100.0% 29.5%USC-Salkehatchie 297 8 785 275 20 733 -7.4% 150.0% -6.6%USC-Sumter 304 50 1,173 269 64 1,020 -11.5% 28.0% -13.0%USC-Union 78 4 363 87 5 321 11.5% 25.0% -11.6%Total Two-Year Inst. of USC 821 73 3,158 888 111 3,158 8.2% 52.1% 0.0%State Tech. and Comprehensive Educ. SystemAiken 805 52 2,268 856 86 2,506 6.3% 65.4% 10.5%Central Carolina 1,068 68 2,546 1,578 88 3,244 47.8% 29.4% 27.4%Denmark 1,166 3 1,240 1,307 7 1,408 12.1% 133.3% 13.5%Florence-Darlington 1,679 55 3,814 1,870 68 4,241 11.4% 23.6% 11.2%Greenville 2,021 338 10,786 2,930 677 13,357 45.0% 100.3% 23.8%Horry-Georgetown 739 67 3,693 1,296 150 5,362 75.4% 123.9% 45.2%Midlands 3,107 351 9,702 3,887 532 10,779 25.1% 51.6% 11.1%Northeastern 365 29 982 476 32 1,043 30.4% 10.3% 6.2%Orangeburg-Calhoun 1,010 16 1,861 1,422 38 2,448 40.8% 137.5% 31.5%Piedmont 1,429 47 4,104 1,610 74 4,449 12.7% 57.4% 8.4%Spartanburg 819 107 3,030 1,202 195 4,409 46.8% 82.2% 45.5%TCL 766 81 1,776 777 89 1,689 1.4% 9.9% -4.9%Tri-County 435 68 3,612 715 105 4,645 64.4% 54.4% 28.6%Trident 2,677 496 10,246 3,177 529 11,407 18.7% 6.7% 11.3%Williamsburg 428 3 661 410 2 585 -4.2% -33.3% -11.5%York 904 134 3,597 1,010 160 4,153 11.7% 19.4% 15.5%Total State Tech. System 19,418 1,915 63,918 24,523 2,832 75,725 26.3% 47.9% 18.5%GRAND TOTAL 36,285 4,671 155,519 42,896 6,425 174,686 18.2% 37.6% 12.3%1 Includes American Indian or Alaskan Native, Asian or Pacific Islander, or Hispanic racial/ethnic designations. Does not include "Unknown" or "Non-Resident Aliens."2 Excludes medical and dental residents and interns3Formerly USC Spartanburg
Percent Change in Minority Enrollment, Fall 2000 to Fall 2005

Section 8 – User Friendliness of the Institution
92
Accessibility to the Institution of All Citizens of the State Performance Funding Indicator 8C – Accessibility to the Institution of All Citizens of the State, has four sub-parts.
8C1 - The percent of undergraduate headcount students who are citizens of South Carolina who are minority according to federal reporting definitions and are enrolled at an institution. (Figure 8.1) 8C2 - The Fall to Fall retention rate of minority, undergraduate students as defined in Part 1 of this measure, but limited to degree-seeking students. (Figure 8.2) 8C3 - The percent of headcount graduate students enrolled at an institution who are minority according to federal reporting definitions. (Figure 8.3) This part does not apply to two-year regional campuses of USC and the technical colleges. 8C4 - The percent of headcount teaching faculty who are minority. (Figure 8.4)
All institutions are measured on this indicator. Standards of achievement were developed based on Census population data. Additional information on these measures, including specific scoring ranges for individual institutions for Indicator 8C, can be found either in the Performance Funding Workbook or in past individual institutional Report Cards linked in Section 11. Figure 8.1 – 8C1, Percentage of Headcount Undergraduate Students who are Citizens of SC
who are Minority Source: IPEDS Research and Teaching Institutions In defining the standard for “Achieves” for the research and teaching institutions, the state’s population is considered. The standard set for these institutions in Year 10 (2005-06) is being within 75% to 100% of the overall state percentage of minority citizens above the age of 18, 28.7%, as estimated from US Census data in 1998. The range for “Achieves” for these institutions for Year 10 (2005-06) is 21% to 28% minority population. Higher percentages score “Exceeds.” Research Institutions
Percentage of Enrolled Undergraduate SC Citizens Who are Minority
0.0%25.0%50.0%75.0%
100.0%
% M
inor
ity S
tude
nts
Fall 2003 11.5% 22.5% 19.7%
Fall 2004 11.2% 21.8% 17.1%
Fall 2005* 11.2% 21.4% 16.2%
Clemson USC Columbia MUSC

Section 8 – User Friendliness of the Institution
93
Percentage of Enrolled Undergraduate SC Citizens Who are Minority
0.0%25.0%50.0%75.0%
100.0%
% M
inor
ity S
tude
nts
Fall 2003 14.5% 18.9% 16.3% 38.3% 23.0% 98.0% 23.5% 28.7% 30.7% 31.4%
Fall 2004 13.5% 20.5% 15.9% 43.8% 24.8% 98.2% 26.2% 27.9% 30.9% 32.4%
Fall 2005* 12.3% 20.4% 15.2% 45.8% 26.5% 98.3% 27.8% 23.7% 31.7% 33.3%
The Cit adelCoast al
Carolina College of
Charlest onFrancis
Marion Univ.Lander
Universit ySC St at e
Univ.USC Aiken
USC Beauf ort
USC Upst at e*
Wint hrop Universit y
Teaching Institutions
* Formerly USC Spartanburg Two-Year Regional Campuses of USC The standard set for a score of “Achieves” for these institutions is defined by the percentage of minority citizens above the age of 18 in their service area, as estimated by the US Census Bureau in 1998. The range for “Achieves” for these institutions, based on being within 75% of the service area minority population percentage, is unique to each. As a result, institutional comparisons cannot be made based solely on this chart. Specific past institutional standards on this indicator can be found in the institution’s report card, linked in Chapter 11 of this document.
Percentage of Enrolled Undergraduate SC Citizens Who are Minority
0.0%
25.0%
50.0%
75.0%
100.0%
% M
inor
ity S
tude
nts
Fall 2003 21.6% 44.4% 30.9% 17.9%
Fall 2004 25.7% 41.4% 32.9% 20.4%
Fall 2005* 26.2% 40.4% 33.1% 28.8%
USC Lancast er USC Salkehat chie USC Sumt er USC Union

Section 8 – User Friendliness of the Institution
94
Fall to Fall Retention Rate of Degree-Seeking SC Undergraduates who are Minority
0.0%25.0%50.0%75.0%
100.0%
Fall 2003 89.4% 86.0% 87.5%
Fall 2004 90.3% 86.8% 86.7%
Fall 2005* 89.6% 86.8% 71.4%
Clemson USC Columbia MUSC
Technical College System The standard set for a score of “Achieves” for these institutions is defined by the percentage of minority citizens above the age of 18 in their service area, as estimated by the US Census Bureau in 1998. The range for “Achieves” for these institutions, based on being within 75% of the service area minority population percentage, is unique to each. As a result, institutional comparisons cannot be made based solely on this chart. Specific past institutional standards on this indicator can be found in the institution’s report card, linked in Chapter 11 of this document.
*Formerly Spartanburg Technical College Figure 8.2 – 8C2, Retention of Minorities who are SC Citizens and Identified as Degree-Seeking Undergraduate Students Source: IPEDS Research Institutions The standard for these institutions for this measure is based on +/- 5% of the median overall student retention for all of the state’s 4-yr institutions. A median retention rate of 83.0% is the reference and represents median retention of the 2004 cohort in Fall 2005 for SC’s research and teaching universities. The range for a score of “Achieves” is 78.0 to 87.0%.
Percentage of Enrolled Undergraduate SC Citizens Who are Minority
0.0%25.0%50.0%75.0%
100.0%125.0%
% M
inor
ity S
tude
nts
Fall 2003 37.1% 51.5% 94.7% 46.2% 25.7% 28.5% 40.3% 44.8%
Fall 2004 35.6% 50.3% 95.8% 46.4% 27.7% 27.7% 40.9% 49.6%
Fall 2005* 33.5% 51.4% 93.5% 46.1% 26.7% 28.7% 41.2% 48.7%
Aiken TechCent ral
Carolina TechDenmark Tech
Florence-Darlingt on
Greenville Tech
Horry-Georget own
Midlands TechNort heast ern
Tech

Section 8 – User Friendliness of the Institution
95
Fall to Fall Retention Rate of Degree-Seeking SC Undergraduates who are Minority
0.0%25.0%50.0%75.0%
100.0%
Fall 2003 80.5% 78.2% 83.7% 78.6% 75.3% 82.5% 70.3% 50.7% 75.7% 84.3%
Fall 2004 80.9% 78.2% 86.3% 80.8% 76.4% 77.8% 73.9% 59.2% 76.1% 83.9%
Fall 2005* 83.3% 80.8% 86.4% 76.6% 74.8% 77.3% 72.4% 55.0% 78.9% 80.8%
The Citadel
Coastal Carolina
College of Charleston
Francis M arion
Lander University
SC State Univ.
USC Aiken USC Beaufort
USC Upstate*
Winthrop University
Teaching Institutions The standard for these institutions for this measure is based on +/- 5% of the median overall student retention of the state’s teaching institutions. A median retention rate of 78.8% is the reference and represents median retention of the 2004 cohort in Fall 2005 for SC’s teaching universities. The range for a score of “Achieves” is 74.0% to 82.0%.
* Formerly USC Spartanburg Two-Year Regional Campuses of USC The standard for these institutions for this measure is based on +/- 10% of the median overall student retention of the state’s regional campuses. A median retention rate of 52.7% is the reference and represents median retention of the 2004 cohort in Fall 2005 for USC’s regional campuses. The range for a score of “Achieves” is 47.0% to 57.0%.
Fall to Fall Retention Rate of Degree-Seeking SC Undergraduates who are Minority
0.0%
25.0%
50.0%
75.0%
100.0%
Fall 2003 55.9% 54.7% 49.4% 51.8%
Fall 2004 55.5% 46.8% 46.6% 60.9%
Fall 2005* 57.9% 49.8% 49.1% 60.3%
USC Lancast er USC Salkehat chie USC Sumt er USC Union

Section 8 – User Friendliness of the Institution
96
Fall to Fall Retention Rate of Degree-Seeking SC Undergraduates who are Minority
0.0%25.0%50.0%75.0%
100.0%
Fall 2003 59.4% 59.8% 56.7% 49.8% 57.8% 52.9% 57.8% 48.5%
Fall 2004 55.0% 53.0% 54.6% 50.0% 54.9% 52.6% 52.3% 48.9%
Fall 2005* 52.8% 53.0% 53.0% 47.6% 53.5% 51.5% 50.0% 48.2%
Orangeburg-Calhoun
Piedmont TechSpart anburg
CC*Tech Coll. of LowCount ry
Tri-Count y Tech
Trident TechWilliamsburg
TechYork Tech
Technical Colleges The standard for these institutions for this measure is based on +/- 10% of the median overall student retention of the state’s technical campuses. A median retention rate of 55.4% is the reference and represents median retention of the 2004 cohort in Fall 2005 for technical colleges. The range for a score of “Achieves” is 49.0% to 60.0%.
*Formerly Spartanburg Technical College
Fall to Fall Retention Rate of Degree-Seeking SC Undergraduates who are Minority
0.0%25.0%50.0%75.0%
100.0%
Fall 2003 49.2% 48.5% 52.3% 55.4% 53.9% 54.4% 53.2% 51.3%
Fall 2004 48.3% 51.1% 44.8% 55.9% 53.1% 50.5% 49.9% 55.2%
Fall 2005* 53.0% 53.1% 45.0% 53.2% 52.5% 56.1% 51.3% 52.2%
Aiken Tech Central Carolina Tech
Denmark Tech
Florence-Darlington
Greenville Tech
Horry-Georgetown
M idlands Tech
Northeastern Tech

Section 8 – User Friendliness of the Institution
97
Percentage of Graduate Students who are Minority
0.0%25.0%50.0%75.0%
100.0%
Fall 2003 21.6% 22.7% 14.1% 21.5% 8.5% 69.4% 9.7% 7.3% 21.3%
Fall 2004 19.6% 21.9% 13.7% 24.2% 15.1% 84.7% 9.6% 11.8% 18.8%
Fall 2005* 17.6% 21.4% 13.3% 26.6% 18.7% 83.2% 13.1% 13.3% 17.9%
The Citadel Coastal Carolina
College of Charleston
Francis M arion Univ.
Lander University
SC State Univ
USC Aiken USC Upstate*
Winthrop University
Figure 8.3 – 8C3, Percentage of Headcount Graduate Students Enrolled at the Institution who are Minority Source: IPEDS Research and Teaching Institutions The standard for this indicator is based on being at or within +/- 10% of US minority population with baccalaureate degrees. The reference used is 12% US minority population based on 1990 census data, “Educational attainment of persons 25 yrs and older.” The standard for a score of “Achieves” is 10% – 13 %. This part of Indicator 8C does not apply to the two-year regional campuses of USC or the technical colleges, which do not have equivalent programs. Research Teaching
* Formerly USC Spartanburg
Percentage of Graduate Students who are Minority
0.0%20.0%40.0%60.0%80.0%
100.0%
Fall 2003 7.6% 16.4% 15.7%
Fall 2004 8.2% 16.4% 15.6%
Fall 2005* 8.0% 16.5% 15.4%
Clemson USC Columbia M USC

Section 8 – User Friendliness of the Institution
98
Percentage of Teaching Faculty who are Minority
0.0%
25.0%
50.0%
75.0%
100.0%
Fall 2003 9.9% 10.8% 9.0%
Fall 2004 10.7% 11.5% 10.2%
Fall 2005 11.5% 11.6% 11.9%
Clemson USC Columbia MUSC
Percentage of Teaching Faculty who are Minority
0.0%25.0%50.0%75.0%
100.0%
Fall 2003 8.2% 6.4% 8.3% 5.9% 9.9% 72.0% 11.3% 7.9% 10.2% 9.9%
Fall 2004 6.4% 6.6% 9.1% 5.5% 8.4% 69.0% 11.2% 11.3% 12.2% 10.1%
Fall 2005 8.3% 7.4% 9.0% 7.7% 9.7% 77.3% 12.8% 10.2% 12.3% 10.3%
The Cit adelCoast al
Carolina College of Charlest on
Francis Marion Univ.
Lander Universit y
SC St at e Univ.
USC AikenUSC
Beauf ortUSC
Upst at e*Wint hrop
Universit y
Figure 8.4 – 8C4, Percentage of Headcount Teaching Faculty who are Minority Source: IPEDS Research Institutions, Teaching Institutions, and Regional Campuses “Teaching faculty” includes all those except graduate students who teach one or more credit courses in the Fall schedule. The standard for these three sectors is based on being at or within +/- 10% of US minority population with graduate degrees. The reference used is 11.9% US minority population with master’s and higher degrees based on 1990 census data, “Educational attainment of persons 25 yrs and older.” The standard for a score of “Achieves” for all three of these sectors is 10% to 13%. Research Institutions Teaching Institutions
* Formerly USC Spartanburg

Section 8 – User Friendliness of the Institution
99
Percentage of Teaching Faculty who are Minority
0.0%
25.0%
50.0%
75.0%
100.0%
Fall 2003 10.9% 19.0% 13.6% 12.0%
Fall 2004 10.0% 22.7% 13.8% 11.5%
Fall 2005 10.6% 25.0% 14.5% 8.7%
USC Lancast er USC Salkehat chie USC Sumt er USC Union
Percentage of Teaching Faculty who are Minority
0.0%25.0%50.0%
75.0%100.0%
Fall 2003 20.1% 12.4% 83.6% 15.7% 10.1% 9.5% 17.1% 11.9%
Fall 2004 14.6% 12.5% 83.3% 16.3% 10.5% 11.9% 18.6% 15.5%
Fall 2005 19.6% 12.7% 86.0% 18.2% 10.7% 12.8% 17.6% 16.5%
Aiken TechCent ral
Carolina TechDenmark Tech
Florence-Darlingt on
Greenville TechHorry-
Georget own Midlands Tech
Nort heast ern Tech
Percentage of Teaching Faculty who are Minority
0.0%25.0%
50.0%75.0%
100.0%
Fall 2003 26.4% 13.0% 13.2% 17.5% 9.8% 13.2% 15.1% 16.3%
Fall 2004 27.3% 15.1% 13.3% 19.1% 13.5% 14.6% 14.1% 17.2%
Fall 2005 29.9% 13.4% 13.7% 22.9% 14.2% 16.3% 22.7% 18.0%
Orangeburg-Calhoun
Piedmont TechSpart anburg
CC*Tech Coll. of LowCount ry
Tri-Count y Tech Trident TechWilliamsburg
TechYork Tech
Regional Campuses of USC
Technical Colleges – The standard for this indicator is based on being at or within +/- 10% of US minority population with baccalaureate degrees. The reference used is 12.0% US minority population based on 1990 census data, “Educational attainment of persons 25 yrs and older.” The standard for a score of “Achieves” for this sector is 10% to 13%.
*Formerly Spartanburg Technical College

Section 8 – User Friendliness of the Institution
100
(blank page)

Section 9 – Research Funding
101
Section 9 Research Funding

Section 9 – Research Funding
102
(blank page)

Section 10 – Campus-Based Assessment
103
RESEARCH FUNDING Information on research data includes student involvement in research, grants and awards expended in support of teacher training, and public and private sector research grant expenditures. Tables 9.1 and 9.2 summarize the number and percent of upper-division, degree-seeking undergraduate and graduate students, respectively, funded through grants who participate in sponsored research. These data are reported as required by Act 255, as amended. With regard to financial support for teacher training, Figure 9.1 displays expenditures by Clemson, USC Columbia, and the Teaching Sector institutions in the past year compared to the average of the previous three years for programs supporting teacher education. The data are used in performance funding Indicator 9A, Financial Support for Reform in Teacher Education. Figure 9.2 displays institutional performance on Indicator 9B – Amount of Public and Private Sector Grants, the expenditures of dollars from public and private research grants of the three research institutions in the most recent ended fiscal year compared to the average of similar expenditures for the prior three fiscal years. This indicator was deferred in Performance Year 7 and continues to be deferred due to changes in federal accounting practices which make data comparisons to previous years impossible.

Section 10 – Campus-Based Assessment
104
Student Involvement in Research The following tables (9.1 and 9.2) summarize the number and percentage of degree-seeking upper-division undergraduate and graduate students who have received funding through grant monies and thus have participated in sponsored research activities. It should be noted that many students who participate in non-sponsored research, or in externally funded projects which are not classified as research, are not reflected in the data presented below. Table 9.1 Student Involvement in Research – Graduate Students Source: CHEMIS Data and Institutional IE Reports
Graduate Involvement in Research
Institution Fall
Total Headcount Degree-seeking
Graduate Students Enrolled
Number Receiving
Stipends for Research
% Participating in Research
Change Over Prior Year in Enrollment
Change Over Prior Yr in # of Students
w/ Stipends
Research Universities Clemson 2003 2,825 699 24.7% 2004 2,896 658 22.7% 71 -41 2005 2,792 603 21.6% -104 -55 USC-Columbia 2003 5,666 745 13.1% 232 74 2004 5,549 676 12.2% -117 -69 2005 5,581 637 11.4% 32 -39 MUSC 2003 876 241 27.5% 2004 960 277 28.9% 84 36 2005 1,055 318 30.1% 95 41 Four-Year Colleges & Universities Citadel 2003 803 14 1.7% 2004 858 12 1.4% 55 -2 2005 806 6 0.7% -52 -6 Coastal Carolina 2003 97 4 4.1% 2004 84 2 2.4% -13 -2 2005 104 10 9.6% 20 8 Coll. of Chas. 2003 578 51 8.8% 2004 573 54 9.4% -5 3 2005 530 90 17.0% -43 36 Francis Marion 2003 212 0 0.0% 2004 243 0 0.0% 31 0 2005 255 0 0.0% 12 0 Lander 2003 66 0 0.0% 2004 53 8 15.1% -13 8 2005 35 0 0.0% -18 -8 0 SC State 2003 498 22 4.4% 2004 462 7 1.5% -36 -15

Section 10 – Campus-Based Assessment
105
Graduate Involvement in Research
Institution Fall
Total Headcount Degree-seeking
Graduate Students Enrolled
Number Receiving
Stipends for Research
% Participating in Research
Change Over Prior Year in Enrollment
Change Over Prior Yr in # of Students
w/ Stipends
2005 462 12 2.6% 0 5 USC-Aiken 2003 58 16 27.6% 2004 77 6 7.8% 19 -10 2005 81 2 2.5% 4 -4 USC-Beaufort 2003 N/A N/A N/A N/A N/A 2004 N/A N/A N/A N/A N/A 2005 N/A N/A N/A N/A N/A USC-Upstate* 2003 6 0 2004 4 0 0.0% -2 0 2005 10 0 0.0% 6 0 Winthrop 2003 721 0 2004 742 1 0.1% 21 1 2005 667 13 1.9% -75 12 Upper-Division, Degree-Seeking Undergraduate Students Undergraduate students are also involved in research efforts at public institutions. Presented below are data reflecting the involvement of upper-division (junior and senior level) degree-seeking students in such research. Although the percentages are much lower, these students can make significant contributions to on-going research at these institutions. Table 9.2 Student Involvement in Research – Undergraduate Students Source: CHEMIS Data and Institutional IE Reports
Upper-division, Degree-seeking Undergraduate Involvement in Research
Institution Fall
Total Headcount
Degree-seeking Upper-division
Students Enrolled
Number Receiving
Stipends for Research
% Participating in Research
Change Over Prior Year in Enrollment
Change Over Prior Yr in #
of Students w/ Stipends
Research Universities Clemson 2003 7,473 89 1.2% 2004 7,157 121 1.7% -316 32 2005 7,151 99 1.4% -6 -22 USC-Columbia 2003 7,756 35 0.5% 2004 8,535 23 0.3% 779 -12 2005 9,242 29 0.3% 707 6 MUSC 2003 319 75 23.5% 2004 352 68 19.3% 33 -7 2005 285 60 21.1% -67 -8

Section 10 – Campus-Based Assessment
106
Upper-division, Degree-seeking Undergraduate Involvement in Research
Institution Fall
Total Headcount
Degree-seeking Upper-division
Students Enrolled
Number Receiving
Stipends for Research
% Participating in Research
Change Over Prior Year in Enrollment
Change Over Prior Yr in #
of Students w/ Stipends
Four-Year Colleges & Universities Citadel 2003 933 25 2.7% 2004 896 23 2.6% -37 -2 2005 942 14 1.5% 46 -9 Coastal Carolina 2003 2,250 43 1.9% 2004 2,455 13 0.5% 205 -30 2005 2,650 29 1.1% 195 16 Coll. of Chas. 2003 4,692 66 1.4% 2004 4,758 61 1.3% 66 -5 2005 4,702 87 1.9% -56 26 Francis Marion 2003 1,248 0 0.0% 2004 1,337 3 0.2% 89 3 2005 1,421 2 0.1% 84 -1 Lander 2003 1,235 0 0.0% 2004 1,240 25 2.0% 5 25 2005 1,275 3 0.2% 35 -22 SC State 2003 1,501 65 4.3% 2004 1,460 34 2.3% -41 -31 2005 40 #DIV/0! -1,460 6 USC-Aiken 2003 1,511 41 2.7% 2004 1,449 40 2.8% -62 -1 2005 1,430 26 1.8% -19 -14 USC-Beaufort 2003 221 2004 293 0 0.0% 72 2005 328 1 0.3% 35 1 USC-Upstate 2003 1,973 4 0.2% 2004 2,066 18 0.9% 93 14 2005 2,123 95 4.5% 57 77 Winthrop 2003 2,488 0 0.0% 2004 2,590 11 0.4% 102 11 2005 2,649 19 0.7% 59 8

Section 10 – Campus-Based Assessment
107
Financial Support for Reform in Teacher Education
0.0%50.0%
100.0%150.0%200.0%
% In
crea
se O
ver 3
-Yea
r A
vera
ge
FY02/avg past 3 190.9% 146.6%
FY03/avg past 3 129.1% 220.1%
FY04/avg past 3 91.9% 124.6%
Clemson USC Columbia
Financial Support for Reform in Child and Adloscent Health
0.0%50.0%
100.0%150.0%200.0%
% In
crea
se O
ver 3
-Yea
r A
vera
ge
FY02/ avg past 3 187.3%
FY03/ avg past 3 179.5%
FY04/ avg past 3 232.8%
MUSC
Financial Support for Teacher Education In Year 10 (2005-06) performance funding year, Performance Indicator 9A – Financial Support for Reform in Teacher Education measured the amount of grants and awards expended to support teacher preparation or training, including applied research, professional development and training grants as compared to the average from the prior three years. Figure 9.1 shows the comparison in actual dollar amounts from FY 04 as compared to the average of expenditures in FYs 01, 02 and 03. Effective with Year 6 (2001-02), the Commission approved a comparable measure for MUSC to reflect its status as a free-standing health sciences center. The measure assesses MUSC’s expenditures of grants/awards in support of the improvement of the health of preK-12th grade students. It was a compliance indicator in Year 6 and was scored for the first time in Year 7. This measure does not apply to the Two-Year Institutions-Regional Campuses of USC, or the Technical College sector. Figure 9.1 – Financial Support for Reform in Teacher Education Source: Institutional Reports to CHE This indicator was deferred for Year 10 (2005-2006). The charts below show past performance. Performance for both sectors was assessed based on an “Achieves” range of 80 – 119%. Research Universities - FY03 grants and awards This chart displays the ratios of grants/awards expended on teacher education by the research universities in FY 04 to the average dollars of FY 01, 02, and 03. Medical University of South Carolina This chart displays the ratios of grants/awards expended on support of improvement in child and adolescent health by the MUSC in FY 04 to the average dollars of FY 01, 02, and 03.

Section 10 – Campus-Based Assessment
108
Financial Support for Reform in Teacher Education
0.0%
250.0%
500.0%
% In
crea
se O
ver 3
-Yea
r Ave
rage
FY02/avg past 3 164.7% 84.0% 157.8% 80.9% 111.8% 230.2% 107.7% - 129.4% 176.3%
FY03/avg past 3 84.5% 109.4% 118.7% 69.3% 120.6% 46.7% 109.9% - 311.7% 118.4%
FY04/avg past 3 108.1% 50.9% 104.7% 53.0% 99.7% 56.4% 101.6% - 300.1% 96.3%
The Citadel
Coastal Carolina
College of Charleston
Francis M arion
Lander University
SC State Univ.
USC Aiken USC Beaufort*
USC Upstate**
Winthrop University
Four-Year Colleges and Universities This chart displays the ratios of grants/awards expended on teacher education by the teaching universities FY 04 to the average dollars of FY 01, 02, and 03.
* This indicator is deferred for USC Beaufort pending development of teacher education programs. ** Formerly USC Spartanburg Amount of Public and Private Sector Grants This indicator was deferred in Year 7 and subsequent years due to changes in federal accounting practices.

Section 10 – Campus-Based Assessment
109
Section 10 Campus-Based Assessment

Section 10 – Campus-Based Assessment
110
(blank page)

Section 10 – Campus-Based Assessment
111
CAMPUS-BASED ASSESSMENT The institutions’ summary reports reveal an active on-going process of assessment at institutions that was encouraged by legislative requirements, the Commission on Higher Education (CHE), the requirements for the Southern Association of Colleges and Schools regional accreditation and also by some specialized accrediting bodies. Section 59-104-660 (B) of the South Carolina Code of Laws, 1976, as amended, requires that as part of each public post-secondary institution’s annual report to the CHE on institutional achievement, each institution must report on progress in developing assessment programs and on related information on student achievement. During 1997-98, the CHE streamlined reporting requirements in order to eliminate unnecessary duplication in reporting and to ensure reporting of data consistent with requirements of Act 359 of 1996. Many of the components listed below are not reported annually, but based on a pre-determined and approved schedule submitted by each institution. However, the assessment of these components is an on-going process. The summary reports for 2005-2006 were submitted electronically and are available through each institution’s website at the addresses that follow this summary. They can also be found through the CHE website. The reports include the following components:
General Education The goals of general education, which is one of the most difficult components of curriculum to assess, may be defined narrowly in terms of basic skills or extremely broadly to include understanding and integrating knowledge spanning the full range of the humanities, sciences, and social sciences combined with attitudes and behaviors which enable the graduate to function effectively in today’s complex society. In their assessment plans, institutions were asked to provide their definitions of general education, to indicate the methodologies for instruments they selected to assess the effectiveness of their general education, to list major findings or trends from their initial assessments, and to describe actions they have taken or plan to take to improve their general education programs as a result of the assessment process. While efforts to assess this component vary both in their complexity and their success, many institutions have already obtained findings that either reinforce what they are currently doing in their programs or enable them to make appropriate changes or improvements.
Majors or Concentrations Majors or concentrations provide students with specialized knowledge and skills. Because of the vast number of majors offered, institutions generally report on all of them over a four-year cycle. In their assessment plans for their majors, institutions are asked to list the majors on which they are reporting, to describe the various methods that are being used to assess each major and to highlight the findings and how they are being used for improvement. Examples of assessment methods being used by South Carolina’s public institutions include both commercial and locally-developed tests; portfolios; internal and external peer reviews; capstone courses; results of licensing and certification examinations; exit interviews; focus groups; student, graduate and employer surveys; classroom research; and matrix analysis of curriculum content. Many reports describe significant changes that are being made in curriculum and teaching effectiveness as a result of the assessment of majors.

Section 10 – Campus-Based Assessment
112
Academic Advising Academic Advising provides students with an understanding of their rights and responsibilities for completion of their degrees, programs and/or career preparation. Reports typically include information on student evaluations of services, special programs, changes, and student usage.
Achievement of Students Transferring from Two to Four Year Institutions Two-year public institutions report on this component every other year, when data on the academic performance of their former students are transferred from the four-year institutions back to the two-year institutions for examination and analysis. This report is included in the institutions’ 2005 Institutional Effectiveness reports. Procedures for Student Development Determining student growth and development throughout the college or university experience requires the application of multiple assessment procedures. All institutions were asked to assess their student services (e.g., financial aid, orientation, counseling, residence halls, and extracurricular activities) although some have chosen to cycle those assessments over several reporting years. Reports typically include descriptions of the services that have been evaluated, major findings, and any changes or improvements that have been made as a result of the assessments. In addition, most institutions are conducting pilot studies on the institutions’ effect on their students’ attitudes and behaviors, particularly as those attitudes affect academic and career success. While difficult to design, such studies respond to institutional mission statements that indicate intent to instill such values as civic responsibility, tolerance, cultural sensitivity, and ethical behavior.
Library Resources and Services Access to and use of appropriate library materials is a critical part of the learning process. In their summary reports, institutions indicate the results of assessments of their library services and collections. College and university librarians in South Carolina generally have done an outstanding job with these evaluations.
Please see the information below to obtain summary reports and the pre-approved reporting schedule for each institution. 2006 Summary Reports on Institutional Websites Research Universities Clemson http://www.clemson.edu/reports/index.htm USC Columbia http://kudzu.ipr.sc.edu/effectiveness/assessment/IEReports/ MUSC http://www.edserv.musc.edu/musc_ie_report_06/index.html Four-Year Colleges and Universities Citadel http://www.citadel.edu/academicaffairs/index.html Coastal Carolina http://www.coastal.edu/effect/assessment/iereports.html College of Charleston http://www.cofc.edu/~oap/insteffect.html Francis Marion http://www.fmarion.edu/about/iereports/article-1999962500c- Lander http://www.lander.edu/assessment/IE_Report_Page SC State http://ir.scsu.edu/IA/IE-2006.htm USC Aiken http://ie.usca.edu/assessment/IEReports/

Section 10 – Campus-Based Assessment
113
USC Beaufort* http://www.uscb.edu/a/Working_at_USCB/Offices/Institutional_Effectiveness_and_Research_IER/Assessment/IER_Reports USC Upstate http://www.uscupstate.edu/about_upstate/planning/institutional_assess.asp Winthrop http://www.winthrop.edu/assessment/IE/ Two-Year Institutions-Regional Campuses of USC All 4 Campuses http://kudzu.ipr.sc.edu/effectiveness/assessment/IEReports/ State Technical and Comprehensive Education System Aiken http://www.atc.edu/downloads/2006IESummary.pdf Central Carolina http://www.cctech.edu/about/evaluation/eval.asp Denmark http://www.denmarktech.edu/iereport2006.htm Florence-Darlington https://www.fdtc.edu/AboutUs/history/IEreports/default.asp Greenville http://www.greenvilletech.com/alumni_and_friends/institution_effectiveness.html Horry-Georgetown http://www.hgtc.edu/ir/iereports.htm Midlands http://www.midlandstech.edu/arp/account.htm Northeastern http://www.netc.edu/aboutus/institutional-effectiveness.html Orangeburg-Calhoun http://www.octech.edu/octech/aboutus/accountability.asp Piedmont http://www.ptc.edu/ie/Reports.htm Spartanburg CC*** http://www.scsc.edu/Institut%5FEffectiv%5FSum/ Tech of Lowcountry http://www.tcl.edu/officialReports.asp Tri-County http://www.tctc.edu/visitors_media/college_information/instdev/iesummary06.htm Trident http://www.tridenttech.edu/4310_8908.htm Williamsburg http://www.wiltech.edu/IE/IE%20homepage.htm York http://www.yorktech.com/CHE/REPORTS/CHE2006IE.htm *USC Beaufort was approved in 2002 to change its mission and status to “Four-Year Teaching Institution.” **Formerly USC Spartanburg ***Formerly Spartanburg Technical College

Section 10 – Campus-Based Assessment
114
(blank page)

Section 11 – Institutional Performance Ratings
115
Section 11 Institutional Performance Ratings (Performance Year 10, 2005-2006 impacting FY 2006-2007)

Section 11 – Institutional Performance Ratings
116
(blank page)

Section 11 – Institutional Performance Ratings
A Closer Look at Higher Education in South Carolina 117
INSTITUTIONAL PERFORMANCE RATINGS Institutional performance ratings from 2004-05 for fiscal year 2005-2006 are displayed on the CHE website for each of South Carolina’s public institutions of higher education. These ratings impacted each institution’s FY 2004-2005 state funding.
Beginning with Year 6, institutions are rated on a reduced set of indicators (13 or 14) that were selected for each sector to represent those most closely tied to its mission. The reduced set of indicators better focuses the system and reduces redundancy among the indicators. In reducing the number of measures impacting institutional scores, several indicator definitions were revised. This year three institutions – USC Columbia, Winthrop University, Orangeburg-Calhoun Technical College, Horry-Georgetown Technical College, and Midlands Technical College – were rated in the “Substantially Exceeds” category. As for the other institutions, 14 performed in the “Exceeds” category and 14 in the “Achieves” category. The overall average performance score of institutions in Year 9 was 2.63 of 3.0.
Note on Report Format: The ratings are posted as Adobe Acrobat files, with four pages for each institution. The first page provides a summary of overall performance and details about the institution itself including president’s name and contact information as well as “quick facts” including enrollment, type degrees offered, faculty and financial data. The pages that follow provide indicator-by-indicator performance details including current and three years of historical data for each indicator
The reader is cautioned against drawing comparisons between institutions in light of individual or overall performance scores due to the nature of the performance funding system employed in South Carolina. It should be kept in mind that there are differences in indicator definitions as well as differences in the applicability of indicators across sectors and institutions that make comparisons difficult. Also, as the reader will note, there is a great deal of variability across all institutions and within sectors as a portion of the institutions’ scores result from a measurement of annual institutional progress. Thus, under South Carolina’s performance funding system, the institution is largely in competition with itself and not with other institutions. As reflected on the rating sheets for each institution, those performing within the same overall performance category may be considered as performing similarly for purposes of allocating fiscal year appropriations.
2004-2005 INSTITUTIONAL REPORT CARDS
http://www.che.sc.gov/Finance/Perf_Fund/Perform/CollgRate/CollegeRatings.htm

Appendix 1 – Success of Transfer Students
A Closer Look at Higher Education in South Carolina 118

Appendix 1 – Success of Transfer Students
A Closer Look at Higher Education in South Carolina 119
Appendix 1 Success of Transfer Students

Appendix 1 – Success of Transfer Students
A Closer Look at Higher Education in South Carolina 120
Difference in G.P.A Student Credit Hours (G.P.A. of Senior Institution Transferred/Earned Native Student minus G.P.A. of
Number G.P.A* Number G.P.A* Transfer Student)
Clemson University 2 2.29 13,223 2.83 0.54College of Charleston 2 2.24 6621 2.97 0.73Winthrop University 10 1.78 4132 2.64 0.86TOTAL 14 1.92 23,976 2.84 0.92
*GPA represents that for Fall 2005, and is not a cumulative GPA
Transfer Academic Performance Report
time Native StudentsFall Term 2005
Fall 2005
Two-Year Institution Transferred From: LancasterTwo-Year College Senior Institution FirstTransfer Students
Fall Term 2005
Difference in G.P.A Student Credit Hours (G.P.A. of Senior Institution Transferred/Earned Native Student minus G.P.A. of
Number G.P.A* Number G.P.A* Transfer Student)
TOTAL 5 1.84 25,644 2.82 0.98
Transfer Students time Native StudentsFall Term 2005 Fall Term 2005
Two-Year Institution Transferred From: SalkehatchieTwo-Year College Senior Institution First
Every other year, the two-year institutions in the state are required to report on the success of students who transfer to a four-year institution in the state. As part of this measure, the state’s public four-year institutions report on the number of students transferring from each two-year institution, the number of credit hours accepted for transfer, and the average GPA of the transfer students in their first semester after transferring. In addition, the institution reports on the average GPA of its “native” students (those students who began at the institution as entering freshmen) with the same number of credit hours to give a standard against which transfer students can be measured. It is important to note that in many cases the number of transfer students from any individual two-year institution at a four-year institution might be very small. This is especially true for the smaller institutions, or when the four-year institution is geographically distant from the transferring two-year institution. This can lead to comparisons based on the GPAs of one or two students, giving a highly variable and suspect comparison. This should be taken into account when viewing this data. The tables below give an overview of the Success of transfer students for the Regional Campuses of USC and the Technical Colleges. Regional Campuses of USC
The number of students transferring to certain institutions was so small as to potentially allow identification of individual student GPAs. Individual institution data is therefore omitted.

Appendix 1 – Success of Transfer Students
A Closer Look at Higher Education in South Carolina 121
Difference in G.P.A Student Credit Hours (G.P.A. of Senior Institution Transferred/Earned Native Student minus G.P.A. of
Number G.P.A* Number G.P.A* Transfer Student)
Clemson University 3 1.75 13,223 2.83 1.08College of Charleston 2 3.13 6621 2.97 -0.16University 4 3.41 2179 2.53 -0.88University 2 3.45 2804 2.45 -1.00Winthrop University 4 3.39 4132 2.64 -0.75TOTAL 17 2.87 28,959 2.74 -0.13
Two-Year Institution Transferred From: SumterTwo-Year College Senior Institution FirstTransfer Students time Native Students
Fall Term 2005 Fall Term 2005
Difference in G.P.A Student Credit Hours (G.P.A. of Senior Institution Transferred/Earned Native Student minus G.P.A. of
Number G.P.A* Number G.P.A* Transfer Student)
Clemson University 2 2.35 13,223 2.83 0.48Lander University 3 1.51 1668 2.56 1.05TOTAL 7 2.25 22,196 2.73 0.48
Two-Year Institution Transferred From: UnionTwo-Year College Senior Institution FirstTransfer Students time Native Students
Fall Term 2005 Fall Term 2005
The number of students transferring to certain institutions was so small as to potentially allow identification of individual student GPAs. Data for those institutions is not shown, but is included in the total. USC Sumter is the only Regional Campus whose transfer students had an overall GPA higher than the native students in the institutions to which they transferred.
The number of students transferring to certain institutions was so small as to potentially allow
identification of individual student GPAs. Data for those institutions is not shown, but is included in the total.
Technical Colleges The chart on the next page shows the overall success of students transferring from the Technical Colleges. It includes detailed system-wide information rather than institution-specific data. For detailed institution information, use the links in Chapter 10 to access the institution’s Institutional Effectiveness report.

Appendix 1 – Success of Transfer Students
A Closer Look at Higher Education in South Carolina 122