Embed Size (px)
Citation preview
Page | 1
South Carolina Higher Education Statistical Abstract
2017 A Publication of the
South Carolina Commission on Higher Education
Mr. Jeffrey M. Schilz, Interim President and Executive Director
Mim Armour, Editor
This publication provides data concerning higher education in South Carolina. Suggestions for improvement in future editions are welcome. Send suggestions to:
Higher Education Statistical Abstract Suggestions Division of Fiscal Affairs 1122 Lady St., Suite 300
Columbia, SC 29201 [email protected]
Page | 2
South Carolina Commission on Higher Education
PREFACE AND ACKNOWLEDGMENTS Thirty-Ninth Edition
The South Carolina Higher Education Statistical Abstract is a comprehensive, single-source compilation of tables and graphs which report data frequently requested by the Governor, Legislators, college and university staff, other state government officials, and the general public. The 2017 edition of the Statistical Abstract marks the 39th year of this valuable publication.
This Abstract includes the most recent statistics on enrollment, degrees awarded, faculty, tuition and fees, funding, and other factual data. A glossary of terms is included in the appendix.
The Abstract would not have been possible without the assistance of the college and university institutional representatives’ completion of data for Commission reports and the federal Integrated Postsecondary Education Data System (IPEDS). The help and support of these individuals is extremely important to the Commission’s data collection process. Their assistance is greatly appreciated.
Jeffrey M. Schilz Interim President and Executive Director
Mr. Jeff Schilz Interim President and Executive Director
1122 Lady Street, Suite 300 Columbia, South Carolina 29201
http://www.che.sc.gov
Tel. 803-737-2260 Fax. 803-737-2297
Page | 3
South Carolina Higher Education
Statistical Abstract
2017
Available on the web at:
www.che.sc.gov
Page | 4
http://www.che.sc.gov/CHE_Docs/finance/abstract/Abstract-2016-web.pdf
I. Mission
The South Carolina Commission on Higher Education’s (CHE) mission is to ensure access to affordable,quality post-secondary education for South Carolina residents. The CHE supports the statutory mission forhigher education outlined in Section 59-103-15 of the South Carolina Code of Laws by promoting access,affordability and excellence.
II. Goals
As defined under the mission for higher education in the State of South Carolina, goals to be met are as follows:
A. High academic quality (Section 59-103-15(A)(2)(a))
B. Affordable and accessible education (Section 59-103-15(A)(2)(b))
C. Instructional excellence (Section 59-103-15(A)(2)(c))
D. Coordination and cooperation with public education (Section 59-103-15(A)(2)(d))
E. Cooperation among the General Assembly, Commission on Higher Education, the Council of Presidents ofState Institutions, institutions of higher learning, and the business community (Section 59-103-15(A)(2)(e))
F. Economic growth (Section 59-103-15(A)(2)(f))
G. Clearly defined missions of institutions (Section 59-103-15(A)(2)(g))
III. Roles and Functions
A. To provide pertinent information about higher education to parents and students. (13-1-1840, 59-59-190,59-103-65 through 180)
B. To review and approve new degree program proposals and evaluate the productivity of existing programs.(59-101-150, 59-103-20, 59-103-35)
C. To administer state, regional, and federal programs affecting South Carolina higher education. (59-114-40through 59-114-75)
D. To maintain a statewide planning and institutional effectiveness system. (59-103-30 through 59-103-45,59-104-610 through 59-104-660)
E. To monitor the implementation and evaluate the effectiveness of programs designed to provide minoritygroups with access to and equality of higher education opportunities. (59-25-55, Provisos 1A.6. and 11.2.of the Fiscal Year 2017-2018 Appropriations Bill H.3720)
F. To examine and license non-public educational institutions. (59-58-40)
Mission, Roles and Functions, and Goals of the Commission
Page | 5
Mission, Roles, Functions and Goals όContinuedύ G. To make recommendations by means of data collection, research, and studies to the Governor, S.C.
Department of Administration, S.C. Revenue and Fiscal Affairs Office, and the General Assembly regardingpolicies, roles, operations, and structure of South Carolina's higher education institutions. (59-11-75(A),59-101-350, 59-103-35 through 59-103-36, 59-103-45, 59-103-60 through 59-103-70, FY 17-18 Proviso11.22., Act 96 of 2017)
H. To maintain statewide higher education data collection. (59-53-40, 59-101-350, 59-104-20, 59-143-30, 59-149-40, 59-150-70, Provisos 1.17., 3.5., 11.17., 11.16., 83.6., and 117.72 of the Fiscal Year 2017-2018Appropriations Bill H.3720)
I. To establish procedures for the transferability of courses at the undergraduate level between and amongtwo-year and four-year institutions. (59-53-40 and 59-103-45)
J. To coordinate with the State Board of Education in determining minimum academic expectations andrequirements and approving appropriate secondary courses for prospective post-secondary students. (59-103-45(2))
K. To review minimum undergraduate admissions standards for in-state and out-of-state students. (59-103-45(3))
L. To reduce, expand, or consolidate, and beginning July 1, 1999, close any institution which does not meetthe standards of achievement enumerated in Section 59-103-30 of the Code of Laws of South Carolina, asamended. (59-103-45(5))
M. To review and approve each institutional mission statement to ensure it is within the overall mission ofthat particular type of institution and is within the overall mission of the state. (59-103-45)
N. To evaluate the financial health of our public colleges and universities to ensure that, given national andstate trends in higher education, current and proposed academic programs; construction andmaintenance projects, leases, and land purchases; and other activities of those institutions are viable andthat access, affordability, and excellence are sustainable. (2-47-40, 2-47-55, 11-51-125, 59-101-187, 59-101-340, 59-101-350, 59-103-30, 59-103-110)
O. To administer and provide oversight for a number of student financial aid programs including PalmettoFellows, LIFE, HOPE, Lottery Tuition Assistance, S.C. Need-based Grants, and the S.C. National GuardCollege Assistance Program. (59-104-20, 59-114-40, 59-142-20, 59-149-10, and 59-150-360 through 59-150-370)
P. To provide staff and support to the Smart State® Research Centers of Economic Excellence Program. (2-75-70, however, by Proviso 11.22. of the 2017-2018 Appropriations Bill H.3720, the board is sunsetting)
Q. To serve as the State Approving Agency (SAA) to evaluate educational/vocational institutions and trainingestablishments where veterans and others eligible for the GI Bill can receive those benefits. (38 CFR21.4150 through 38 CFR 21.4155)
R. To serve as the fiscal agent for the state electronic Library (PASCAL) system. (Proviso 3.4 of the Fiscal Year2017-2018 Appropriations Bill H.3720)
Page | 6
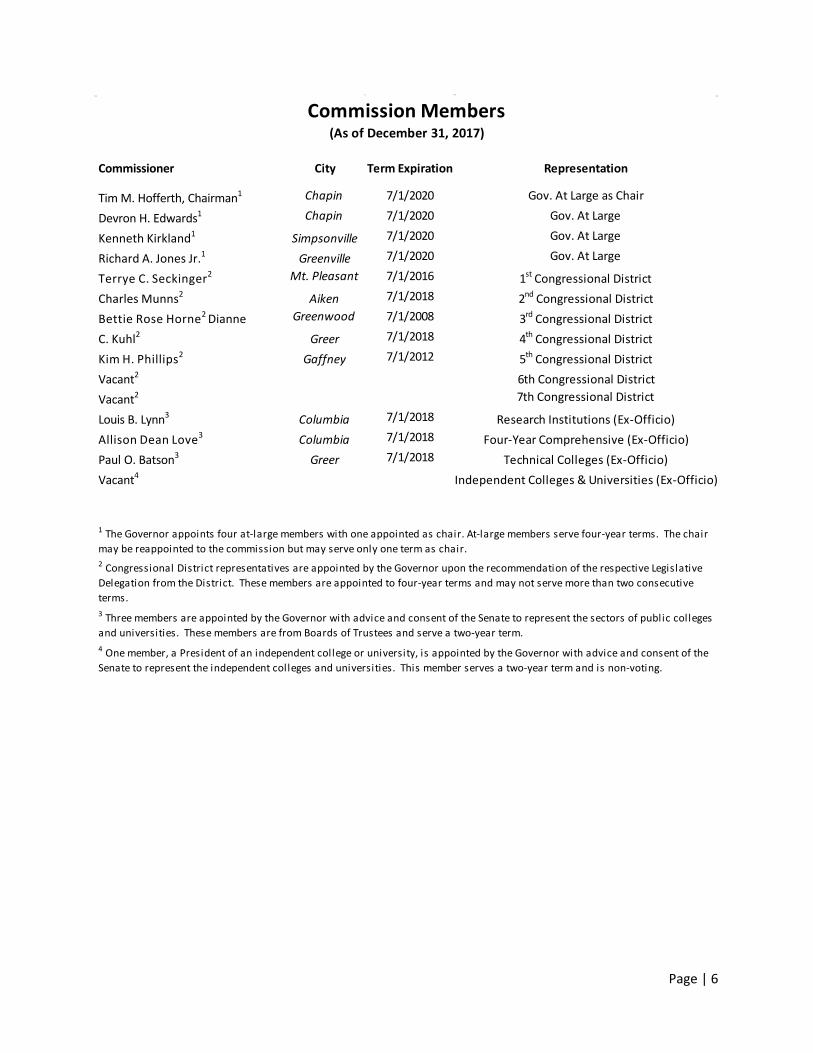
City Term Expiration Representation
Chapin 7/1/2020 Gov. At Large as ChairChapin 7/1/2020 Gov. At Large
Simpsonville 7/1/2020 Gov. At Large
Greenville 7/1/2020 Gov. At LargeMt. Pleasant 7/1/2016 1st Congressional District
Aiken 7/1/2018 2nd Congressional DistrictGreenwood 7/1/2008 3rd Congressional District
Greer 7/1/2018 4th Congressional DistrictGaffney 7/1/2012 5th Congressional District
6th Congressional District7th Congressional District
Columbia 7/1/2018 Research Institutions (Ex-Officio)Columbia 7/1/2018 Four-Year Comprehensive (Ex-Officio)
Greer 7/1/2018 Technical Colleges (Ex-Officio)
Commissioner
Tim M. Hofferth, Chairman1
Devron H. Edwards1
Kenneth Kirkland1
Richard A. Jones Jr.1
Terrye C. Seckinger2
Charles Munns2
Bettie Rose Horne2 Dianne C. Kuhl2
Kim H. Phillips2
Vacant2
Vacant2
Louis B. Lynn3
Allison Dean Love3
Paul O. Batson3
Vacant4 Independent Colleges & Universities (Ex-Officio)
Commission Members
1 The Governor appoints four at-large members with one appointed as chair. At-large members serve four-year terms. The chair may be reappointed to the commission but may serve only one term as chair.2 Congressional District representatives are appointed by the Governor upon the recommendation of the respective Legislative Delegation from the District. These members are appointed to four-year terms and may not serve more than two consecutive terms. 3 Three members are appointed by the Governor with advice and consent of the Senate to represent the sectors of public colleges and universities. These members are from Boards of Trustees and serve a two-year term.4 One member, a President of an independent college or university, is appointed by the Governor with advice and consent of the Senate to represent the independent colleges and universities. This member serves a two-year term and is non-voting.
(As of December 31, 2017)
Page|7
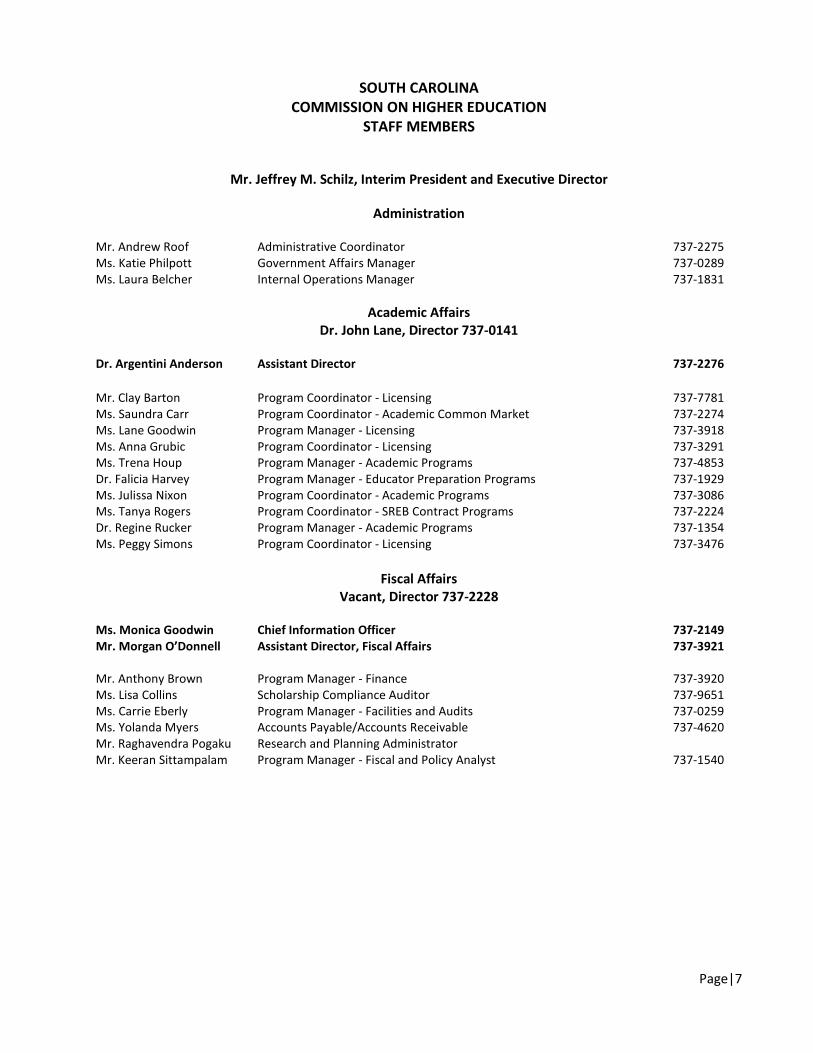
SOUTH CAROLINA COMMISSION ON HIGHER EDUCATION
STAFF MEMBERS
Mr. Jeffrey M. Schilz, Interim President and Executive Director
Administration
Mr. Andrew Roof Administrative Coordinator 737-2275Ms. Katie Philpott Government Affairs Manager 737-0289Ms. Laura Belcher Internal Operations Manager 737-1831
Academic Affairs Dr. John Lane, Director 737-0141
Dr. Argentini Anderson Assistant Director 737-2276
Mr. Clay Barton Program Coordinator - Licensing 737-7781Ms. Saundra Carr Program Coordinator - Academic Common Market 737-2274Ms. Lane Goodwin Program Manager - Licensing 737-3918Ms. Anna Grubic Program Coordinator - Licensing 737-3291Ms. Trena Houp Program Manager - Academic Programs 737-4853Dr. Falicia Harvey Program Manager - Educator Preparation Programs 737-1929Ms. Julissa Nixon Program Coordinator - Academic Programs 737-3086Ms. Tanya Rogers Program Coordinator - SREB Contract Programs 737-2224Dr. Regine Rucker Program Manager - Academic Programs 737-1354Ms. Peggy Simons Program Coordinator - Licensing 737-3476
Fiscal Affairs Vacant, Director 737-2228
Ms. Monica Goodwin Chief Information Officer 737-2149Mr. Morgan O’Donnell Assistant Director, Fiscal Affairs 737-3921
Mr. Anthony Brown Program Manager - Finance 737-3920Ms. Lisa Collins Scholarship Compliance Auditor 737-9651Ms. Carrie Eberly Program Manager - Facilities and Audits 737-0259Ms. Yolanda Myers Accounts Payable/Accounts Receivable 737-4620Mr. Raghavendra Pogaku Research and Planning Administrator Mr. Keeran Sittampalam Program Manager - Fiscal and Policy Analyst 737-1540
Page|8
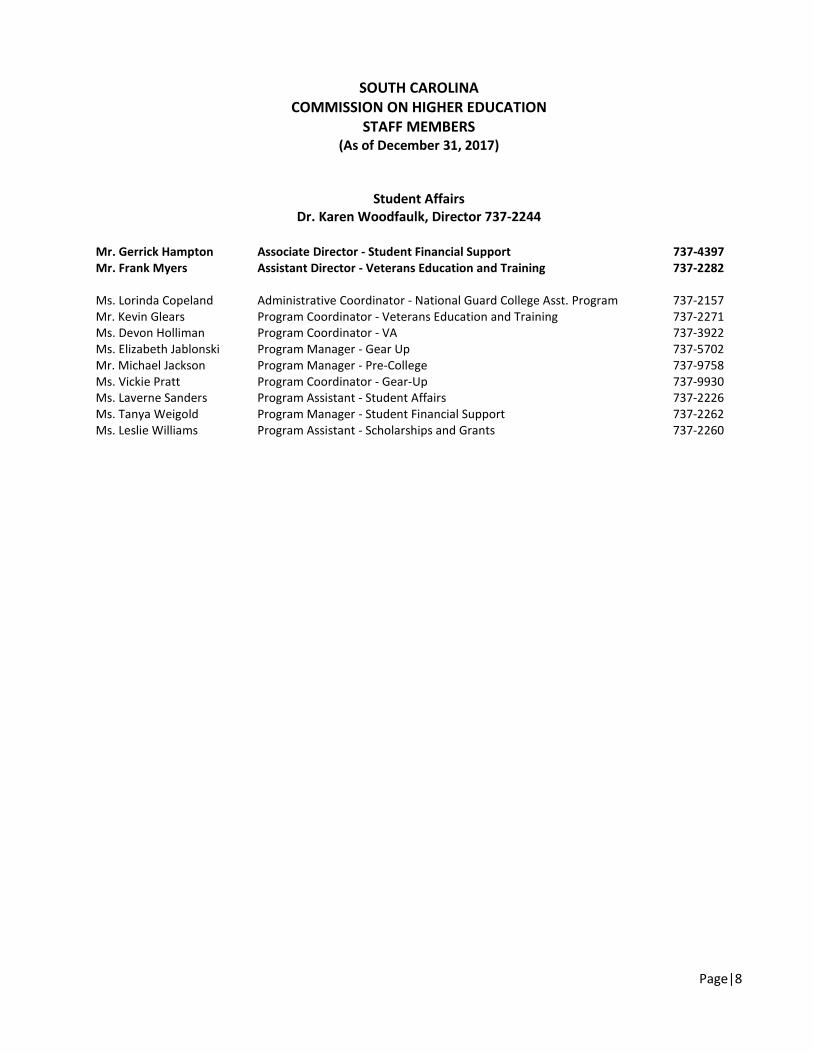
SOUTH CAROLINA COMMISSION ON HIGHER EDUCATION
STAFF MEMBERS (As of December 31, 2017)
Student Affairs Dr. Karen Woodfaulk, Director 737-2244
Mr. Gerrick Hampton Associate Director - Student Financial Support 737-4397 Mr. Frank Myers Assistant Director - Veterans Education and Training 737-2282 Ms. Lorinda Copeland Administrative Coordinator - National Guard College Asst. Program 737-2157 Mr. Kevin Glears Program Coordinator - Veterans Education and Training 737-2271 Ms. Devon Holliman Program Coordinator - VA 737-3922 Ms. Elizabeth Jablonski Program Manager - Gear Up 737-5702 Mr. Michael Jackson Program Manager - Pre-College 737-9758 Ms. Vickie Pratt Program Coordinator - Gear-Up 737-9930 Ms. Laverne Sanders Program Assistant - Student Affairs 737-2226 Ms. Tanya Weigold Program Manager - Student Financial Support 737-2262 Ms. Leslie Williams Program Assistant - Scholarships and Grants 737-2260
Page | 9
Table of Contents
South Carolina Facts at a Glance ................................................................................................................ 12
Locations of South Carolina Public Colleges and Universities .................................................................... 13
Locations of South Carolina Independent Colleges and Universities ......................................................... 14
Enrollment .................................................................................................................................................. 15
Ten-Year Analysis Total Full-Time Equivalent (FTE) Enrollment, Public Colleges and Universities ............ 16
Ten-Year Analysis Total Headcount Enrollment ......................................................................................... 19
Undergraduate Fall Enrollment – Public Colleges and Universities, Fall 2016 In-state/Out-of-state and Total Headcount Enrollment ............................................................................. 22
Opening Headcount Enrollment By Student Level, Geographic Origin & Enrollment Status, Fall 2016 ..................................................................................... 23
Opening Headcount Enrollment First-time Freshmen by State of Origin SC Public Research and Comprehensive Teaching Institutions, Fall 2016 .................................................. 30
Opening Headcount Enrollment First-time Freshmen by State of Origin SC Public Research and Comprehensive Teaching Institutions, Fall 2007 and 2012 through 2016 ........... 32
Opening Headcount Enrollment First-time Freshmen by County of Origin SC Public Research and Comprehensive Teaching Institutions, Fall 2016… ............................................... 33
Opening Headcount Enrollment First-time Freshmen by County of Origin SC Public Research and Comprehensive Teaching Institutions, Fall 2007, and 2012 through 2016 .......... 35
Opening Headcount Enrollment by Race and Gender, Fall 2016 ............................................................... 36
Retention of First-time, Full-time, Degree-Seeking Freshmen Public Institutions Fall 2015 to Fall 2016 .................................................................................................... 44
Retention Percentage of First-time, Full-time, Degree-Seeking Freshmen, Fall to Fall 2013 to 2014, 2014-2015, 2015 to 2016 ................................................................................. 46
Ten- Year and Five- Year Analysis, % Retained Fall 2007-08 and 2011-12 through 2015-16.....……...........47
Migration of First-Time Undergraduate Transfers .................................................................................... 49
Degrees Awarded ...................................................................................................................................... 59
Ten-Year Summary of Degrees Awarded, FY 2006-07 to 2015-16 ............................................................ 60
Total Degrees Awarded by Level, July 1, 2015 to June 30, 2016 ............................................................... 62
SC Public and Independent Institutions Total Degrees AwardedBy Race, Gender, & Academic Discipline, July 1, 2015, to June 30, 2016 .................................................. 65
Page | 10
Table of ContentsGraduation Rates ....................................................................................................................................... 73
Graduation Rates of SC Public Research and Comprehensive Teaching Institutions ................................ 74
Graduation Rates in a Two- Year Regional Campuses of USC and Technical Colleges ............................... 76
Success Rates of First-time, Full-time, Degree-Seeking Undergraduates of Four-year Institutions .......... 79
Success Rates of First-time, Full-time, Degree-Seeking Undergraduates of Two-year Institutions ........... 80
The SAT/ACT Programs .............................................................................................................................. 81
SAT Report Overview South Carolina Compared to National Data Fall 2016 ............................................. 82
First-Time Entering Freshmen With SAT/ACT Scores , Fall 2016 ................................................................ 84
Average SAT Scores SC First-Time Entering Freshmen By Public Institution Compared to National Average SAT Test-Takers, Fall 2016 ....................................................................... 90
Scholarships and Grants ............................................................................................................................. 91
South Carolina Scholarships and Grants ..................................................................................................... 92
Scholarship Disbursements, Academic Year 2016-2017 ............................................................................. 95
Scholarship Disbursements, Fall 2016 ........................................................................................................ 97
Fall 2015 Palmetto Fellows Recipients Retaining Palmetto Fellows Scholarships in Fall 2016 .................. 99
Fall 2015 First-Time Freshmen LIFE Recipients Retained with/without LIFE Sch., Fall 2016.................... 100
Fall 2015 LIFE Recipients by Student Level Retaining LIFE Scholarships, Fall 2016 .................................. 101
LIFE and Palmetto Fellows Scholarship Disbursements with Enhancements, Fall 2016 .......................... 102
HOPE Scholarship Recipients Retained in Fall 2016 with/without LIFE Scholarships………….……..………….104
South Carolina National Guard College Assistance Program, AY 2014-2015 and 2015-2016….….………..105
Tuition and Required Fees…………………….………………………………..………………………………………………………….107
Analysis of Full-Time Undergraduate Students Tuition and Required Fees inPublic Colleges and Universities Academic Year 2016-2017………….………………………………………………………108
Ten-Year Summary of Tuition and Required Fees for Full-Time, In-State Undergraduates Public Institutions, 2007-08 through 2016-17…..……………..…………………………..109
Ten-Year Summary of Tuition and Required Fees for Full-Time, Out-of-State Undergraduates Public Institutions, 2007-08 through 2016-17……….………………………………110
Undergraduate Student Tuition and Required Fees and Average Housing Costs Public Institutions, FY 2016-17………………………………………………………………….…………………………………………111
Page | 11
Table of Contents
Undergraduate Student Tuition and Required Fees and Average Housing Costs Independent Institutions, FY 2016-17……………………………………………………………….…….…………………………..112
Financial Appropriations .......................................................................................................................... 113
Ten-Year Comparison of the State Education Recurring Appropriations, FY 2007-08 to 2016-17 ........... 114
Lottery Appropriations for Higher Education, FY 2012-13 to 2016-17 .................................................... 116
Beginning Appropriations for State Scholarship and Grant Programs, FY 2012-13 to 2016-17 .............. 117
Facilities .................................................................................................................................................... 119
Assignable Area by Function Fall 2016 ..................................................................................................... 120
Summary of Facilities Utilization, Fall 2012, 2015, 2016 .......................................................................... 121
Square Feet by Classification, Fall 2016 .................................................................................................... 123
Number of Buildings by Age, Fall 2016 ..................................................................................................... 124
Comprehensive Permanent Improvement Plan (CPIP) Year hƴŜ Summary, FY 2016-17 ......................... 125
Faculty in Higher Education ..................................................................................................................... 127
Average Salaries of Full-Time Teaching Faculty, Fall 2016bƛƴŜπaƻƴǘƘ /ƻƴǘNJŀŎǘ .ŀǎƛǎ {/ tdzōƭƛŎ /ƻƭƭŜƎŜǎ ŀƴŘ ¦ƴƛǾŜNJǎƛǘƛŜǎ ............................................................. 128 Average Salaries of Full-Time Teaching Faculty by Discipline, Fall 2016, Nine-Month Contract Basis SC Public Colleges and Universities .............................................................. 129 Ten-Year Trend of the Average Salaries of Full-Time Teaching Faculty, Nine-Month Contract Basis, SC Public Colleges and Universities, Fall 2007 - 2016 ................................. 130 Full-Time Faculty by Race and Tenure, SC Public Colleges and Universities, Fall 2016 ............................ 131 Appendices Appendix 1: Types of Public Institutions in South Carolina by Mission .................................................... 135 Appendix 2: SC Commission on Higher Education Publications, Reports, and Brochures by Division ......136 Appendix 3: Acronyms and Terms Pertaining to Higher Education .......................................................... 138 Appendix 4: Public Colleges and Universities Board of Trustees Members ............................................. 141 Appendix 5: Glossary ................................................................................................................................ 143 Appendix 6: Explanation and Change in the Categories for Race/Ethnicity Reporting……………………….…148
Page | 12
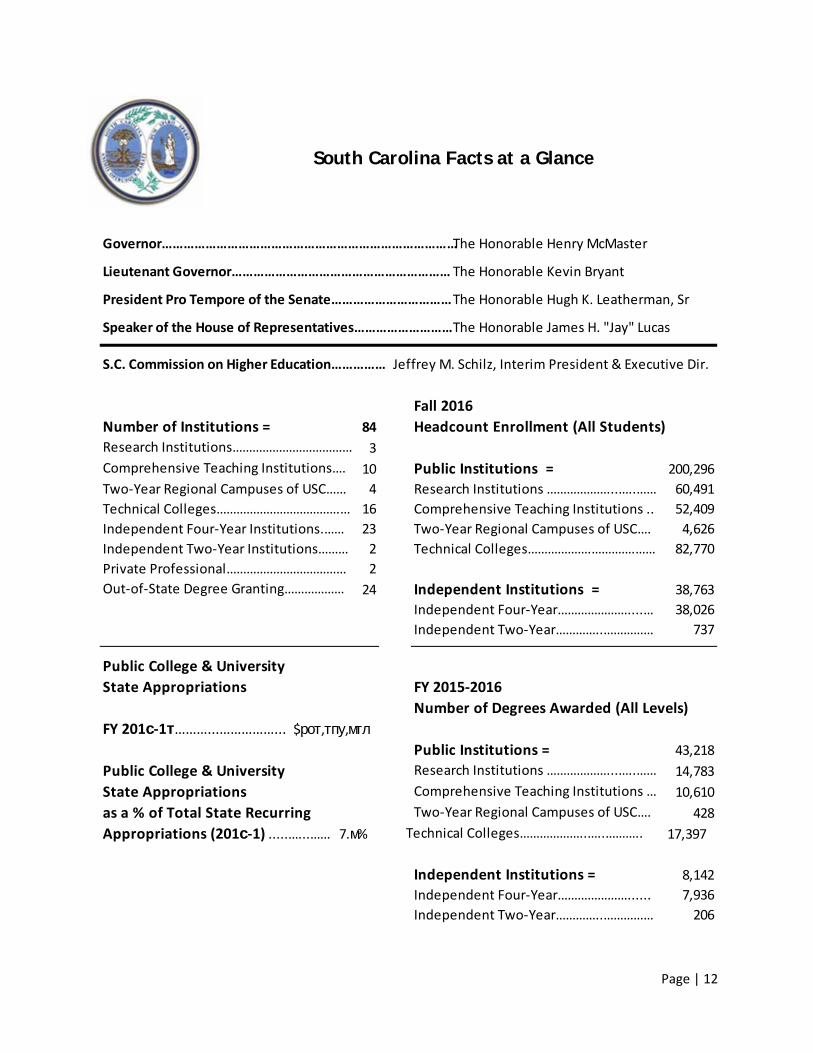
South Carolina Facts at a Glance
Governor………………………………………………………………………The Honorable Henry McMaster
Lieutenant Governor…………………………………………………… The Honorable Kevin Bryant
President Pro Tempore of the Senate……………………………The Honorable Hugh K. Leatherman, Sr
Speaker of the House of Representatives………………………The Honorable James H. "Jay" Lucas
S.C. Commission on Higher Education…………… Jeffrey M. Schilz, Interim President & Executive Dir.
Fall 2016
Number of Institutions = 84 Headcount Enrollment (All Students)
Research Institutions……………………………… 3Comprehensive Teaching Institutions…. 10 Public Institutions = 200,296Two‐Year Regional Campuses of USC…… 4 Research Institutions ………………...…..…… 60,491Technical Colleges……………………………….… 16 Comprehensive Teaching Institutions .. 52,409Independent Four‐Year Institutions.…… 23 Two‐Year Regional Campuses of USC…. 4,626Independent Two‐Year Institutions……… 2 Technical Colleges……………….………….…… 82,770Private Professional……………………………… 2Out‐of‐State Degree Granting……………… 24 Independent Institutions = 38,763
Independent Four‐Year…………………....… 38,026Independent Two‐Year…………..…………… 737
Public College & University
State Appropriations FY 2015‐2016
Number of Degrees Awarded (All Levels)
FY 201с‐1т………...……………...Public Institutions = 43,218
Public College & University Research Institutions ………………...…..…… 14,783State Appropriations Comprehensive Teaching Institutions … 10,610as a % of Total State Recurring Two‐Year Regional Campuses of USC…. 428Appropriations (201с‐1) .....…...…… 7.м% Technical Colleges………………..…..……….. 17,397
Independent Institutions = 8,142Independent Four‐Year…………………...... 7,936Independent Two‐Year…………..…………… 206
$рот,тпу,мтл
Page | 13
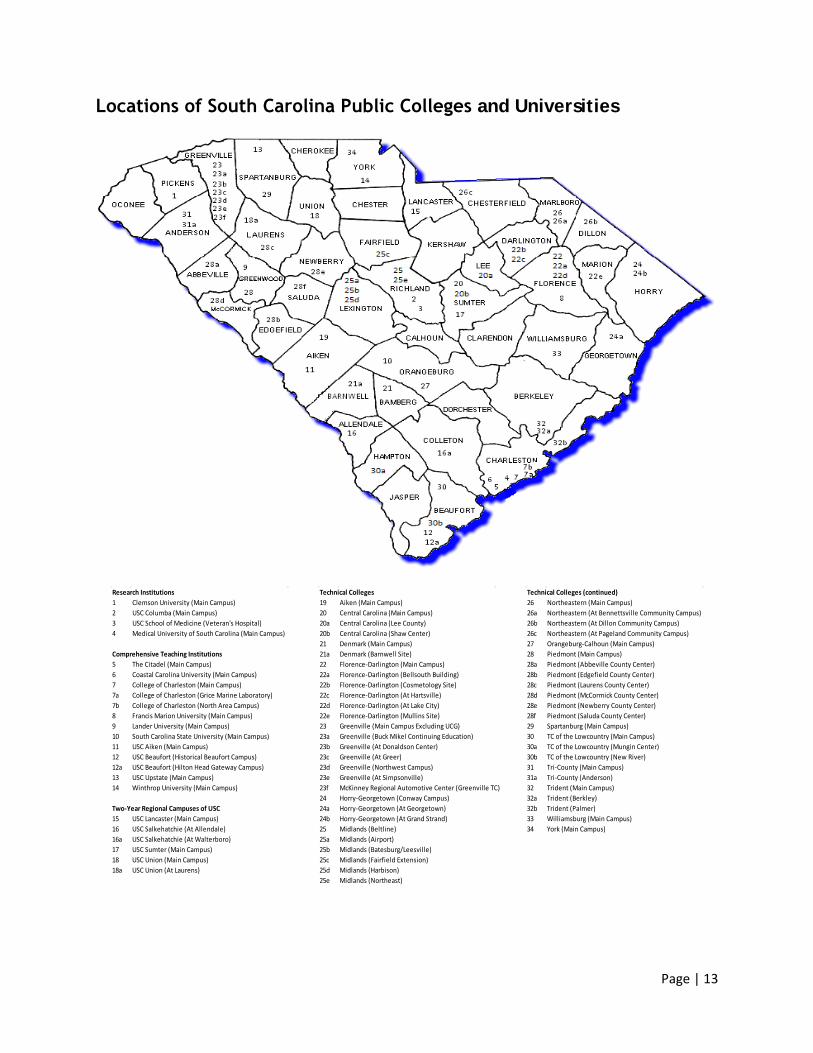
Locations of South Carolina Public Colleges and Universities
Technical Colleges Technical Colleges (continued)1 Clemson University (Main Campus) 19 Aiken (Main Campus) 26 Northeastern (Main Campus)2 USC Columba (Main Campus) 20 Central Carolina (Main Campus) 26a Northeastern (At Bennettsville Community Campus)3 USC School of Medicine (Veteran's Hospital) 20a Central Carolina (Lee County) 26b Northeastern (At Dillon Community Campus)4 Medical University of South Carolina (Main Campus) 20b Central Carolina (Shaw Center) 26c Northeastern (At Pageland Community Campus)
21 Denmark (Main Campus) 27 Orangeburg-Calhoun (Main Campus)21a Denmark (Barnwell Site) 28 Piedmont (Main Campus)
5 The Citadel (Main Campus) 22 Florence-Darlington (Main Campus) 28a Piedmont (Abbeville County Center)6 Coastal Carolina University (Main Campus) 22a Florence-Darlington (Bellsouth Building) 28b Piedmont (Edgefield County Center)7 College of Charleston (Main Campus) 22b Florence-Darlington (Cosmetology Site) 28c Piedmont (Laurens County Center)7a College of Charleston (Grice Marine Laboratory) 22c Florence-Darlington (At Hartsville) 28d Piedmont (McCormick County Center)7b College of Charleston (North Area Campus) 22d Florence-Darlington (At Lake City) 28e Piedmont (Newberry County Center)8 Francis Marion University (Main Campus) 22e Florence-Darlington (Mullins Site) 28f Piedmont (Saluda County Center)9 Lander University (Main Campus) 23 Greenville (Main Campus Excluding UCG) 29 Spartanburg (Main Campus)10 South Carolina State University (Main Campus) 23a Greenville (Buck Mikel Continuing Education) 30 TC of the Lowcountry (Main Campus)11 USC Aiken (Main Campus) 23b Greenville (At Donaldson Center) 30a TC of the Lowcountry (Mungin Center)12 USC Beaufort (Historical Beaufort Campus) 23c Greenville (At Greer) 30b TC of the Lowcountry (New River)12a USC Beaufort (Hilton Head Gateway Campus) 23d Greenville (Northwest Campus) 31 Tri-County (Main Campus)13 USC Upstate (Main Campus) 23e Greenville (At Simpsonville) 31a Tri-County (Anderson)14 Winthrop University (Main Campus) 23f McKinney Regional Automotive Center (Greenville TC) 32 Trident (Main Campus)
24 Horry-Georgetown (Conway Campus) 32a Trident (Berkley)Two-Year Regional Campuses of USC 24a Horry-Georgetown (At Georgetown) 32b Trident (Palmer)15 USC Lancaster (Main Campus) 24b Horry-Georgetown (At Grand Strand) 33 Williamsburg (Main Campus)16 USC Salkehatchie (At Allendale) 25 Midlands (Beltline) 34 York (Main Campus)16a USC Salkehatchie (At Walterboro) 25a Midlands (Airport)17 USC Sumter (Main Campus) 25b Midlands (Batesburg/Leesville)18 USC Union (Main Campus) 25c Midlands (Fairfield Extension)18a USC Union (At Laurens) 25d Midlands (Harbison)
25e Midlands (Northeast)
Research Institutions
Comprehensive Teaching Institutions
Page | 14
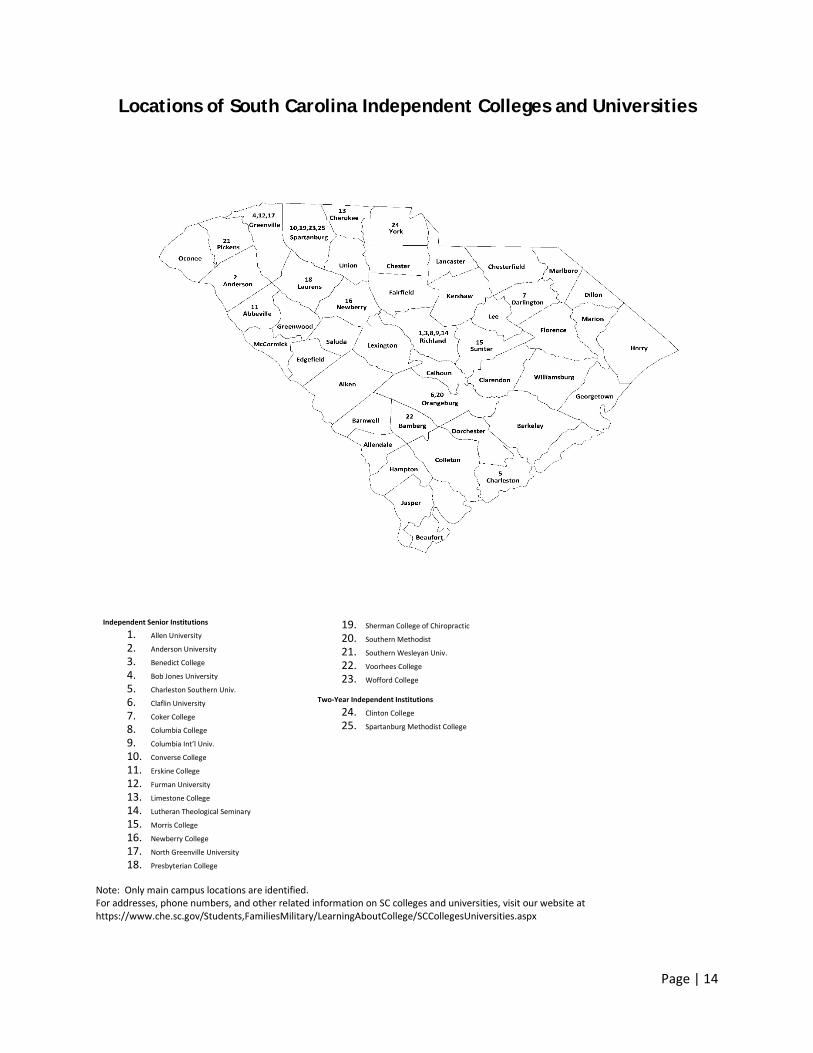
Locations of South Carolina Independent Colleges and Universities
Independent Senior Institutions
1. Allen University
2. Anderson University
3. Benedict College
4. Bob Jones University
5. Charleston Southern Univ.
6. Claflin University
7. Coker College
8. Columbia College
9. Columbia Int’l Univ.
10. Converse College
11. Erskine College
12. Furman University
13. Limestone College
14. Lutheran Theological Seminary
15. Morris College
16. Newberry College
17. North Greenville University
18. Presbyterian College
19. Sherman College of Chiropractic
20. Southern Methodist
21. Southern Wesleyan Univ.
22. Voorhees College
23. Wofford College
Two-Year Independent Institutions
24. Clinton College
25. Spartanburg Methodist College
Note: Only main campus locations are identified. For addresses, phone numbers, and other related information on SC colleges and universities, visit our website at https://www.che.sc.gov/Students,FamiliesMilitary/LearningAboutCollege/SCCollegesUniversities.aspx
Page | 15
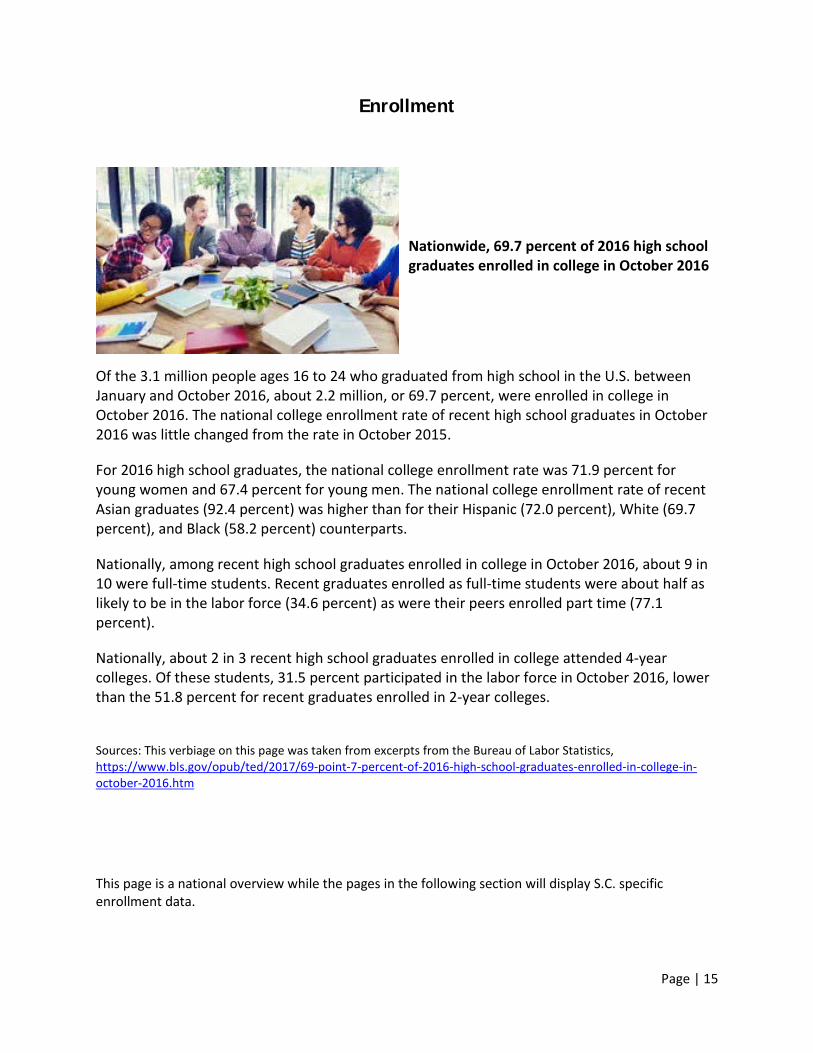
Enrollment
Nationwide, 69.7 percent of 2016 high school graduates enrolled in college in October 2016
Of the 3.1 million people ages 16 to 24 who graduated from high school in the U.S. between January and October 2016, about 2.2 million, or 69.7 percent, were enrolled in college in October 2016. The national college enrollment rate of recent high school graduates in October 2016 was little changed from the rate in October 2015.
For 2016 high school graduates, the national college enrollment rate was 71.9 percent for young women and 67.4 percent for young men. The national college enrollment rate of recent Asian graduates (92.4 percent) was higher than for their Hispanic (72.0 percent), White (69.7 percent), and Black (58.2 percent) counterparts.
Nationally, among recent high school graduates enrolled in college in October 2016, about 9 in 10 were full-time students. Recent graduates enrolled as full-time students were about half as likely to be in the labor force (34.6 percent) as were their peers enrolled part time (77.1 percent).
Nationally, about 2 in 3 recent high school graduates enrolled in college attended 4-year colleges. Of these students, 31.5 percent participated in the labor force in October 2016, lower than the 51.8 percent for recent graduates enrolled in 2-year colleges.
Sources: This verbiage on this page was taken from excerpts from the Bureau of Labor Statistics, https://www.bls.gov/opub/ted/2017/69-point-7-percent-of-2016-high-school-graduates-enrolled-in-college-in-october-2016.htm
This page is a national overview while the pages in the following section will display S.C. specific enrollment data.
Page | 16
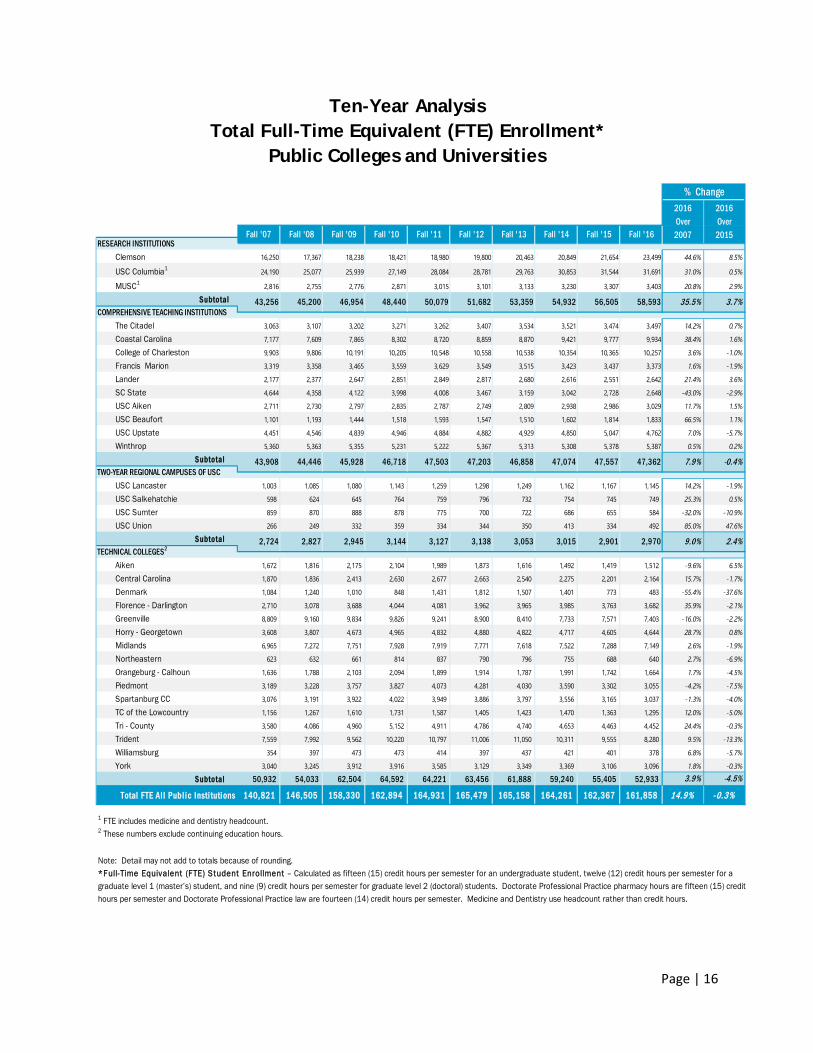
Ten-Year Analysis Total Full-Time Equivalent (FTE) Enrollment*
Public Colleges and Universities
Clemson 16,250 17,367 18,238 18,421 18,980 19,800 20,463 20,849 21,654 23,499 44.6% 8.5%
USC Columbia1 24,190 25,077 25,939 27,149 28,084 28,781 29,763 30,853 31,544 31,691 31.0% 0.5%
MUSC1 2,816 2,755 2,776 2,871 3,015 3,101 3,133 3,230 3,307 3,403 20.8% 2.9%
Subtotal
The Citadel 3,063 3,107 3,202 3,271 3,262 3,407 3,534 3,521 3,474 3,497 14.2% 0.7%
Coastal Carolina 7,177 7,609 7,865 8,302 8,720 8,859 8,870 9,421 9,777 9,934 38.4% 1.6%
College of Charleston 9,903 9,806 10,191 10,205 10,548 10,558 10,538 10,354 10,365 10,257 3.6% -1.0%
Francis Marion 3,319 3,358 3,465 3,559 3,629 3,549 3,515 3,423 3,437 3,373 1.6% -1.9%
Lander 2,177 2,377 2,647 2,851 2,849 2,817 2,680 2,616 2,551 2,642 21.4% 3.6%
SC State 4,644 4,358 4,122 3,998 4,008 3,467 3,159 3,042 2,728 2,648 -43.0% -2.9%
USC Aiken 2,711 2,730 2,797 2,835 2,787 2,749 2,809 2,938 2,986 3,029 11.7% 1.5%
USC Beaufort 1,101 1,193 1,444 1,518 1,593 1,547 1,510 1,602 1,814 1,833 66.5% 1.1%
USC Upstate 4,451 4,546 4,839 4,946 4,884 4,882 4,929 4,850 5,047 4,762 7.0% -5.7%
Winthrop 5,360 5,363 5,355 5,231 5,222 5,367 5,313 5,308 5,378 5,387 0.5% 0.2%
Subtotal
USC Lancaster 1,003 1,085 1,080 1,143 1,259 1,298 1,249 1,162 1,167 1,145 14.2% -1.9%
USC Salkehatchie 598 624 645 764 759 796 732 754 745 749 25.3% 0.5%
USC Sumter 859 870 888 878 775 700 722 686 655 584 -32.0% -10.9%
USC Union 266 249 332 359 334 344 350 413 334 492 85.0% 47.6%
Subtotal
Aiken 1,672 1,816 2,175 2,104 1,989 1,873 1,616 1,492 1,419 1,512 -9.6% 6.5%
Central Carolina 1,870 1,836 2,413 2,630 2,677 2,663 2,540 2,275 2,201 2,164 15.7% -1.7%
Denmark 1,084 1,240 1,010 848 1,431 1,812 1,507 1,401 773 483 -55.4% -37.6%
Florence - Darlington 2,710 3,078 3,688 4,044 4,081 3,962 3,965 3,985 3,763 3,682 35.9% -2.1%
Greenville 8,809 9,160 9,834 9,826 9,241 8,900 8,410 7,733 7,571 7,403 -16.0% -2.2%
Horry - Georgetown 3,608 3,807 4,673 4,965 4,832 4,880 4,822 4,717 4,605 4,644 28.7% 0.8%
Midlands 6,965 7,272 7,751 7,928 7,919 7,771 7,618 7,522 7,288 7,149 2.6% -1.9%
Northeastern 623 632 661 814 837 790 796 755 688 640 2.7% -6.9%
Orangeburg - Calhoun 1,636 1,788 2,103 2,094 1,899 1,914 1,787 1,991 1,742 1,664 1.7% -4.5%
Piedmont 3,189 3,228 3,757 3,827 4,073 4,281 4,030 3,590 3,302 3,055 -4.2% -7.5%
Spartanburg CC 3,076 3,191 3,922 4,022 3,949 3,886 3,797 3,556 3,165 3,037 -1.3% -4.0%
TC of the Lowcountry 1,156 1,267 1,610 1,731 1,587 1,405 1,423 1,470 1,363 1,295 12.0% -5.0%
Tri - County 3,580 4,086 4,960 5,152 4,911 4,786 4,740 4,653 4,463 4,452 24.4% -0.3%
Trident 7,559 7,992 9,562 10,220 10,797 11,006 11,050 10,311 9,555 8,280 9.5% -13.3%
Williamsburg 354 397 473 473 414 397 437 421 401 378 6.8% -5.7%
York 3,040 3,245 3,912 3,916 3,585 3,129 3,349 3,369 3,106 3,096 1.8% -0.3%
Subtotal 50,932 54,033 62,504 64,592 64,221 63,456 61,888 59,240 55,405 52,933 3.9% -4.5%
Total FTE Al l Publ ic Insti tutions 140,821 146,505 158,330 162,894 164,931 165,479 165,158 164,261 162,367 161,858 14.9% -0.3%
1 FTE includes medicine and dentistry headcount.2 These numbers exclude continuing education hours.
Note: Detail may not add to totals because of rounding.*Full-Time Equivalent (FTE) Student Enrollment – Calculated as fifteen (15) credit hours per semester for an undergraduate student, twelve (12) credit hours per semester for a graduate level 1 (master’s) student, and nine (9) credit hours per semester for graduate level 2 (doctoral) students. Doctorate Professional Practice pharmacy hours are fifteen (15) credithours per semester and Doctorate Professional Practice law are fourteen (14) credit hours per semester. Medicine and Dentistry use headcount rather than credit hours.
2,901 2,970 9.0% 2.4%TECHNICAL COLLEGES2
TWO-YEAR REGIONAL CAMPUSES OF USC
2,724 2,827 2,945 3,144 3,127 3,138 3,053 3,015
46,858 47,074 47,557 47,362 7.9% -0.4%43,908 44,446 45,928 46,718 47,503 47,203
56,505 58,593 35.5% 3.7%COMPREHENSIVE TEACHING INSTITUTIONS
51,682 53,359 54,932
Fall '13 Fall '14
43,256 45,200 46,954 48,440 50,079
% Change2016Over
2007
2016Over
2015Fall '07 Fall '08 Fall '09 Fall '10RESEARCH INSTITUTIONS
Fall '15 Fall '16Fall '11 Fall '12
Page | 17
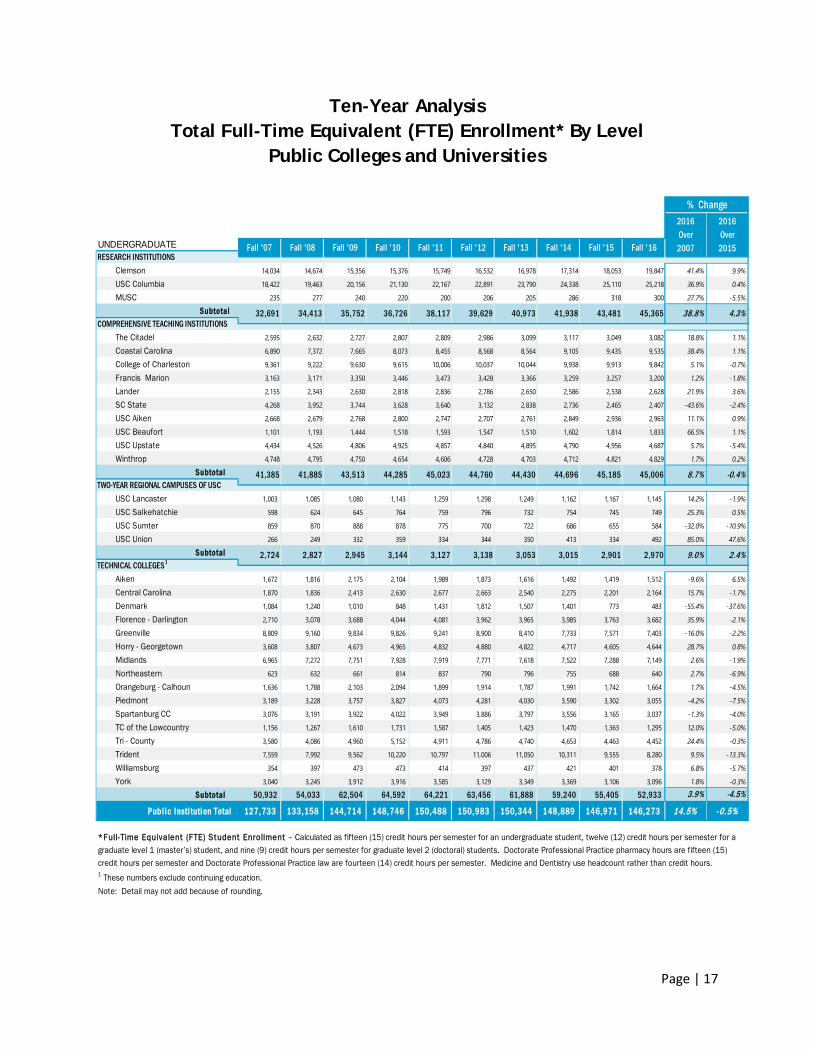
Ten-Year Analysis Total Full-Time Equivalent (FTE) Enrollment* By Level
Public Colleges and Universities
UNDERGRADUATE
Clemson 14,034 14,674 15,356 15,376 15,749 16,532 16,978 17,314 18,053 19,847 41.4% 9.9%
USC Columbia 18,422 19,463 20,156 21,130 22,167 22,891 23,790 24,338 25,110 25,218 36.9% 0.4%
MUSC 235 277 240 220 200 206 205 286 318 300 27.7% -5.5%
Subtotal
The Citadel 2,595 2,632 2,727 2,807 2,809 2,986 3,099 3,117 3,049 3,082 18.8% 1.1%
Coastal Carolina 6,890 7,372 7,665 8,073 8,455 8,568 8,564 9,105 9,435 9,535 38.4% 1.1%
College of Charleston 9,361 9,222 9,630 9,615 10,006 10,037 10,044 9,938 9,913 9,842 5.1% -0.7%
Francis Marion 3,163 3,171 3,350 3,446 3,473 3,428 3,366 3,259 3,257 3,200 1.2% -1.8%
Lander 2,155 2,343 2,630 2,818 2,836 2,786 2,650 2,586 2,538 2,628 21.9% 3.6%
SC State 4,268 3,952 3,744 3,628 3,640 3,132 2,838 2,736 2,465 2,407 -43.6% -2.4%
USC Aiken 2,668 2,679 2,768 2,800 2,747 2,707 2,761 2,849 2,936 2,963 11.1% 0.9%
USC Beaufort 1,101 1,193 1,444 1,518 1,593 1,547 1,510 1,602 1,814 1,833 66.5% 1.1%
USC Upstate 4,434 4,526 4,806 4,925 4,857 4,840 4,895 4,790 4,956 4,687 5.7% -5.4%
Winthrop 4,748 4,795 4,750 4,654 4,606 4,728 4,703 4,712 4,821 4,829 1.7% 0.2%
Subtotal
USC Lancaster 1,003 1,085 1,080 1,143 1,259 1,298 1,249 1,162 1,167 1,145 14.2% -1.9%
USC Salkehatchie 598 624 645 764 759 796 732 754 745 749 25.3% 0.5%
USC Sumter 859 870 888 878 775 700 722 686 655 584 -32.0% -10.9%
USC Union 266 249 332 359 334 344 350 413 334 492 85.0% 47.6%
Subtotal
Aiken 1,672 1,816 2,175 2,104 1,989 1,873 1,616 1,492 1,419 1,512 -9.6% 6.5%
Central Carolina 1,870 1,836 2,413 2,630 2,677 2,663 2,540 2,275 2,201 2,164 15.7% -1.7%
Denmark 1,084 1,240 1,010 848 1,431 1,812 1,507 1,401 773 483 -55.4% -37.6%
Florence - Darlington 2,710 3,078 3,688 4,044 4,081 3,962 3,965 3,985 3,763 3,682 35.9% -2.1%
Greenville 8,809 9,160 9,834 9,826 9,241 8,900 8,410 7,733 7,571 7,403 -16.0% -2.2%
Horry - Georgetown 3,608 3,807 4,673 4,965 4,832 4,880 4,822 4,717 4,605 4,644 28.7% 0.8%
Midlands 6,965 7,272 7,751 7,928 7,919 7,771 7,618 7,522 7,288 7,149 2.6% -1.9%
Northeastern 623 632 661 814 837 790 796 755 688 640 2.7% -6.9%
Orangeburg - Calhoun 1,636 1,788 2,103 2,094 1,899 1,914 1,787 1,991 1,742 1,664 1.7% -4.5%
Piedmont 3,189 3,228 3,757 3,827 4,073 4,281 4,030 3,590 3,302 3,055 -4.2% -7.5%
Spartanburg CC 3,076 3,191 3,922 4,022 3,949 3,886 3,797 3,556 3,165 3,037 -1.3% -4.0%
TC of the Lowcountry 1,156 1,267 1,610 1,731 1,587 1,405 1,423 1,470 1,363 1,295 12.0% -5.0%
Tri - County 3,580 4,086 4,960 5,152 4,911 4,786 4,740 4,653 4,463 4,452 24.4% -0.3%
Trident 7,559 7,992 9,562 10,220 10,797 11,006 11,050 10,311 9,555 8,280 9.5% -13.3%
Williamsburg 354 397 473 473 414 397 437 421 401 378 6.8% -5.7%
York 3,040 3,245 3,912 3,916 3,585 3,129 3,349 3,369 3,106 3,096 1.8% -0.3%
Subtotal 50,932 54,033 62,504 64,592 64,221 63,456 61,888 59,240 55,405 52,933 3.9% -4.5%
Publ ic Insti tution Total 127,733 133,158 144,714 148,746 150,488 150,983 150,344 148,889 146,971 146,273 14.5% -0.5%
1 These numbers exclude continuing education.Note: Detail may not add because of rounding.
*Full-Time Equivalent (FTE) Student Enrollment – Calculated as fifteen (15) credit hours per semester for an undergraduate student, twelve (12) credit hours per semester for agraduate level 1 (master’s) student, and nine (9) credit hours per semester for graduate level 2 (doctoral) students. Doctorate Professional Practice pharmacy hours are fifteen (15) credit hours per semester and Doctorate Professional Practice law are fourteen (14) credit hours per semester. Medicine and Dentistry use headcount rather than credit hours.
2,901 2,970 9.0% 2.4%TECHNICAL COLLEGES1
TWO-YEAR REGIONAL CAMPUSES OF USC
2,724 2,827 2,945 3,144 3,127 3,138 3,053 3,015
44,430 44,696 45,185 45,006 8.7% -0.4%41,385 41,885 43,513 44,285 45,023 44,760
43,481 45,365 38.8% 4.3%COMPREHENSIVE TEACHING INSTITUTIONS
39,629 40,973 41,938
Fall '13 Fall '14
32,691 34,413 35,752 36,726 38,117
% Change2016Over2007
2016Over
2015Fall '07 Fall '08 Fall '09 Fall '10RESEARCH INSTITUTIONS
Fall '15 Fall '16Fall '11 Fall '12
Page | 18
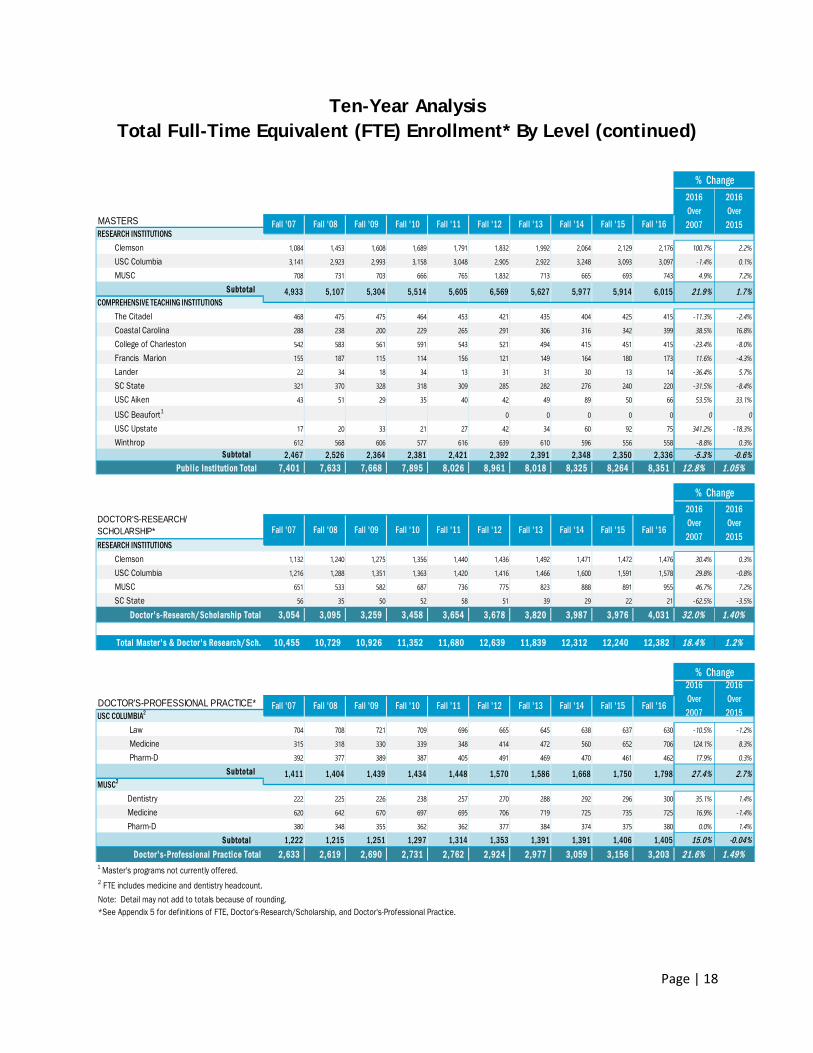
Ten-Year Analysis Total Full-Time Equivalent (FTE) Enrollment* By Level (continued)
MASTERS
Clemson 1,084 1,453 1,608 1,689 1,791 1,832 1,992 2,064 2,129 2,176 100.7% 2.2%
USC Columbia 3,141 2,923 2,993 3,158 3,048 2,905 2,922 3,248 3,093 3,097 -1.4% 0.1%
MUSC 708 731 703 666 765 1,832 713 665 693 743 4.9% 7.2%
Subtotal
The Citadel 468 475 475 464 453 421 435 404 425 415 -11.3% -2.4%
Coastal Carolina 288 238 200 229 265 291 306 316 342 399 38.5% 16.8%
College of Charleston 542 583 561 591 543 521 494 415 451 415 -23.4% -8.0%
Francis Marion 155 187 115 114 156 121 149 164 180 173 11.6% -4.3%
Lander 22 34 18 34 13 31 31 30 13 14 -36.4% 5.7%
SC State 321 370 328 318 309 285 282 276 240 220 -31.5% -8.4%
USC Aiken 43 51 29 35 40 42 49 89 50 66 53.5% 33.1%
USC Beaufort1 0 0 0 0 0 0 0
USC Upstate 17 20 33 21 27 42 34 60 92 75 341.2% -18.3%
Winthrop 612 568 606 577 616 639 610 596 556 558 -8.8% 0.3%Subtotal 2,467 2,526 2,364 2,381 2,421 2,392 2,391 2,348 2,350 2,336 -5.3% -0.6%
Publ ic Insti tution Total 7,401 7,633 7,668 7,895 8,026 8,961 8,018 8,325 8,264 8,351 12.8% 1.05%
DOCTOR'S-RESEARCH/SCHOLARSHIP*
Clemson 1,132 1,240 1,275 1,356 1,440 1,436 1,492 1,471 1,472 1,476 30.4% 0.3%
USC Columbia 1,216 1,288 1,351 1,363 1,420 1,416 1,466 1,600 1,591 1,578 29.8% -0.8%
MUSC 651 533 582 687 736 775 823 888 891 955 46.7% 7.2%
SC State 56 35 50 52 58 51 39 29 22 21 -62.5% -3.5%
Doctor's-Research/Scholarship Total 3,054 3,095 3,259 3,458 3,654 3,678 3,820 3,987 3,976 4,031 32.0% 1.40%
Total Master's & Doctor's Research/Sch. 10,455 10,729 10,926 11,352 11,680 12,639 11,839 12,312 12,240 12,382 18.4% 1.2%
DOCTOR'S-PROFESSIONAL PRACTICE*
Law 704 708 721 709 696 665 645 638 637 630 -10.5% -1.2%
Medicine 315 318 330 339 348 414 472 560 652 706 124.1% 8.3%
Pharm-D 392 377 389 387 405 491 469 470 461 462 17.9% 0.3%
Subtotal
Dentistry 222 225 226 238 257 270 288 292 296 300 35.1% 1.4%
Medicine 620 642 670 697 695 706 719 725 735 725 16.9% -1.4%
Pharm-D 380 348 355 362 362 377 384 374 375 380 0.0% 1.4%
Subtotal 1,222 1,215 1,251 1,297 1,314 1,353 1,391 1,391 1,406 1,405 15.0% -0.04%Doctor's-Professional Practice Total 2,633 2,619 2,690 2,731 2,762 2,924 2,977 3,059 3,156 3,203 21.6% 1.49%
1 Master's programs not currently offered.2 FTE includes medicine and dentistry headcount.Note: Detail may not add to totals because of rounding.
Fall '16
*See Appendix 5 for definitions of FTE, Doctor's-Research/Scholarship, and Doctor's-Professional Practice.
1,750 1,798 27.4% 2.7%MUSC2
Fall '11 Fall '12 Fall '13 Fall '14 Fall '15
1,411 1,404 1,439 1,434 1,448 1,570 1,586 1,668
RESEARCH INSTITUTIONS
% Change2016Over2007
2016Over2015
Fall '07 Fall '08 Fall '09 Fall '10
Fall '11 Fall '12 Fall '13 Fall '14 Fall '15 Fall '16
USC COLUMBIA2
% Change2016Over2007
2016Over2015
Fall '07 Fall '08 Fall '09 Fall '10
5,914 6,015 21.9% 1.7%COMPREHENSIVE TEACHING INSTITUTIONS
RESEARCH INSTITUTIONS
4,933 5,107 5,304 5,514 5,605 6,569 5,627 5,977
Fall '16
% Change2016Over2007
2016Over2015Fall '07 Fall '08 Fall '09 Fall '10 Fall '11 Fall '12 Fall '13 Fall '14 Fall '15
Page | 19
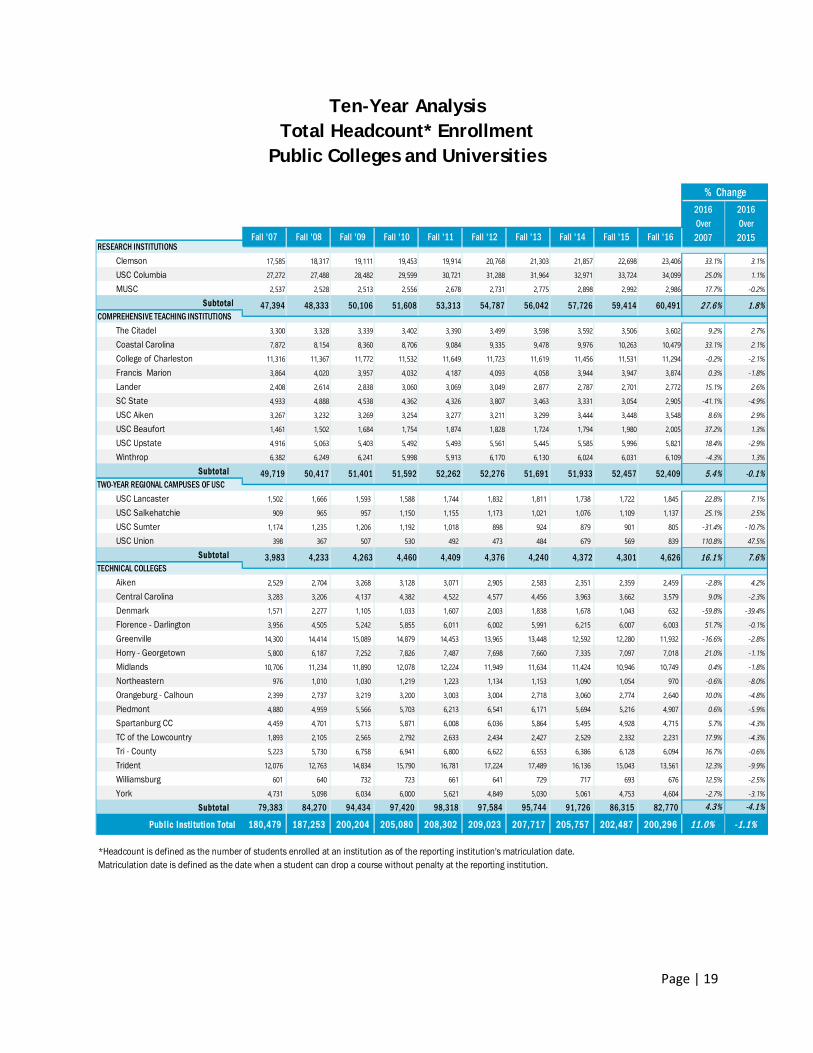
Ten-Year Analysis Total Headcount* Enrollment
Public Colleges and Universities
Clemson 17,585 18,317 19,111 19,453 19,914 20,768 21,303 21,857 22,698 23,406 33.1% 3.1%
USC Columbia 27,272 27,488 28,482 29,599 30,721 31,288 31,964 32,971 33,724 34,099 25.0% 1.1%
MUSC 2,537 2,528 2,513 2,556 2,678 2,731 2,775 2,898 2,992 2,986 17.7% -0.2%
Subtotal
The Citadel 3,300 3,328 3,339 3,402 3,390 3,499 3,598 3,592 3,506 3,602 9.2% 2.7%
Coastal Carolina 7,872 8,154 8,360 8,706 9,084 9,335 9,478 9,976 10,263 10,479 33.1% 2.1%
College of Charleston 11,316 11,367 11,772 11,532 11,649 11,723 11,619 11,456 11,531 11,294 -0.2% -2.1%
Francis Marion 3,864 4,020 3,957 4,032 4,187 4,093 4,058 3,944 3,947 3,874 0.3% -1.8%
Lander 2,408 2,614 2,838 3,060 3,069 3,049 2,877 2,787 2,701 2,772 15.1% 2.6%
SC State 4,933 4,888 4,538 4,362 4,326 3,807 3,463 3,331 3,054 2,905 -41.1% -4.9%
USC Aiken 3,267 3,232 3,269 3,254 3,277 3,211 3,299 3,444 3,448 3,548 8.6% 2.9%
USC Beaufort 1,461 1,502 1,684 1,754 1,874 1,828 1,724 1,794 1,980 2,005 37.2% 1.3%
USC Upstate 4,916 5,063 5,403 5,492 5,493 5,561 5,445 5,585 5,996 5,821 18.4% -2.9%
Winthrop 6,382 6,249 6,241 5,998 5,913 6,170 6,130 6,024 6,031 6,109 -4.3% 1.3%
Subtotal
USC Lancaster 1,502 1,666 1,593 1,588 1,744 1,832 1,811 1,738 1,722 1,845 22.8% 7.1%
USC Salkehatchie 909 965 957 1,150 1,155 1,173 1,021 1,076 1,109 1,137 25.1% 2.5%
USC Sumter 1,174 1,235 1,206 1,192 1,018 898 924 879 901 805 -31.4% -10.7%
USC Union 398 367 507 530 492 473 484 679 569 839 110.8% 47.5%
Subtotal
Aiken 2,529 2,704 3,268 3,128 3,071 2,905 2,583 2,351 2,359 2,459 -2.8% 4.2%
Central Carolina 3,283 3,206 4,137 4,382 4,522 4,577 4,456 3,963 3,662 3,579 9.0% -2.3%
Denmark 1,571 2,277 1,105 1,033 1,607 2,003 1,838 1,678 1,043 632 -59.8% -39.4%
Florence - Darlington 3,956 4,505 5,242 5,855 6,011 6,002 5,991 6,215 6,007 6,003 51.7% -0.1%
Greenville 14,300 14,414 15,089 14,879 14,453 13,965 13,448 12,592 12,280 11,932 -16.6% -2.8%
Horry - Georgetown 5,800 6,187 7,252 7,826 7,487 7,698 7,660 7,335 7,097 7,018 21.0% -1.1%
Midlands 10,706 11,234 11,890 12,078 12,224 11,949 11,634 11,424 10,946 10,749 0.4% -1.8%
Northeastern 976 1,010 1,030 1,219 1,223 1,134 1,153 1,090 1,054 970 -0.6% -8.0%
Orangeburg - Calhoun 2,399 2,737 3,219 3,200 3,003 3,004 2,718 3,060 2,774 2,640 10.0% -4.8%
Piedmont 4,880 4,959 5,566 5,703 6,213 6,541 6,171 5,694 5,216 4,907 0.6% -5.9%
Spartanburg CC 4,459 4,701 5,713 5,871 6,008 6,036 5,864 5,495 4,928 4,715 5.7% -4.3%
TC of the Lowcountry 1,893 2,105 2,565 2,792 2,633 2,434 2,427 2,529 2,332 2,231 17.9% -4.3%
Tri - County 5,223 5,730 6,758 6,941 6,800 6,622 6,553 6,386 6,128 6,094 16.7% -0.6%
Trident 12,076 12,763 14,834 15,790 16,781 17,224 17,489 16,136 15,043 13,561 12.3% -9.9%
Williamsburg 601 640 732 723 661 641 729 717 693 676 12.5% -2.5%
York 4,731 5,098 6,034 6,000 5,621 4,849 5,030 5,061 4,753 4,604 -2.7% -3.1%
Subtotal 79,383 84,270 94,434 97,420 98,318 97,584 95,744 91,726 86,315 82,770 4.3% -4.1%
Publ ic Insti tution Total 180,479 187,253 200,204 205,080 208,302 209,023 207,717 205,757 202,487 200,296 11.0% -1.1%
Fall '10 Fall '11 Fall '12 Fall '13 Fall '14RESEARCH INSTITUTIONS
Matriculation date is defined as the date when a student can drop a course without penalty at the reporting institution.*Headcount is defined as the number of students enrolled at an institution as of the reporting institution's matriculation date.
Fall '15
2016Over
2015
2016Over2007
% Change
Fall '16Fall '07 Fall '08 Fall '09
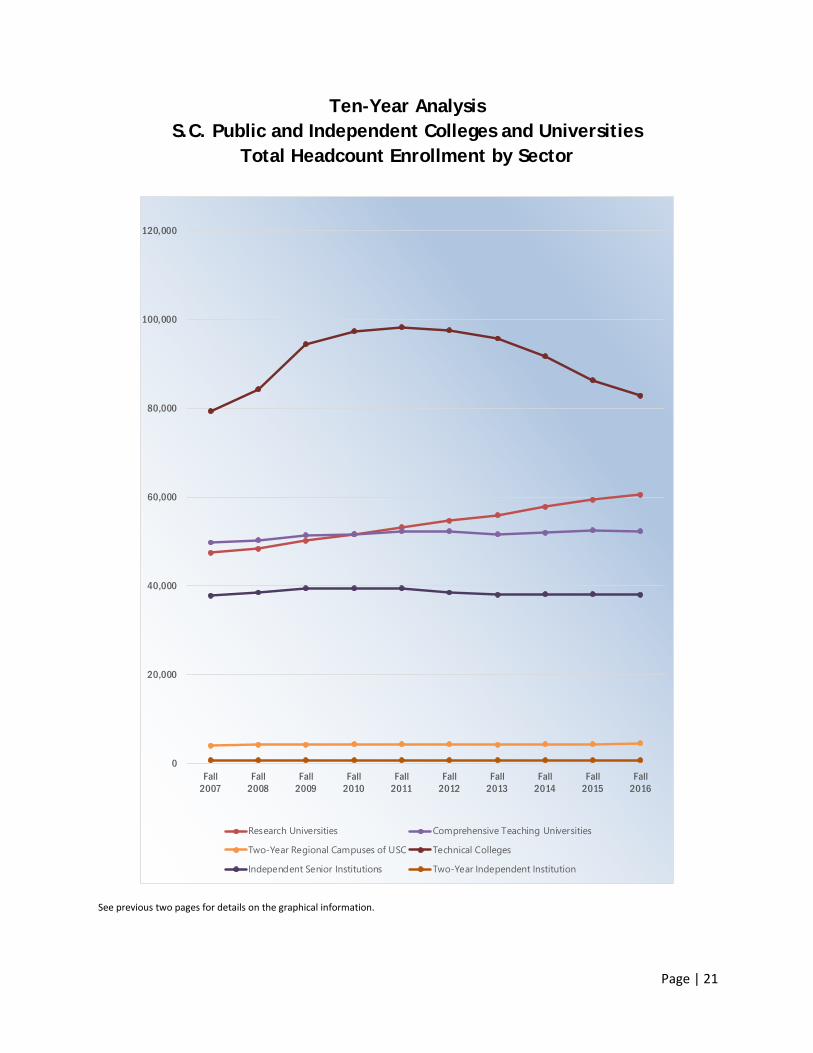
47,394 57,726 59,414 60,491 27.6%48,333 50,106 51,608 53,313 54,787 1.8%COMPREHENSIVE TEACHING INSTITUTIONS
49,719 50,417 51,401 51,592 52,262 52,276 51,691 51,933 52,457 52,409 5.4% -0.1%
56,042
16.1% 7.6%TECHNICAL COLLEGES
TWO-YEAR REGIONAL CAMPUSES OF USC
3,983 4,233 4,263 4,460 4,409 4,376 4,240 4,372 4,301 4,626
Page | 20
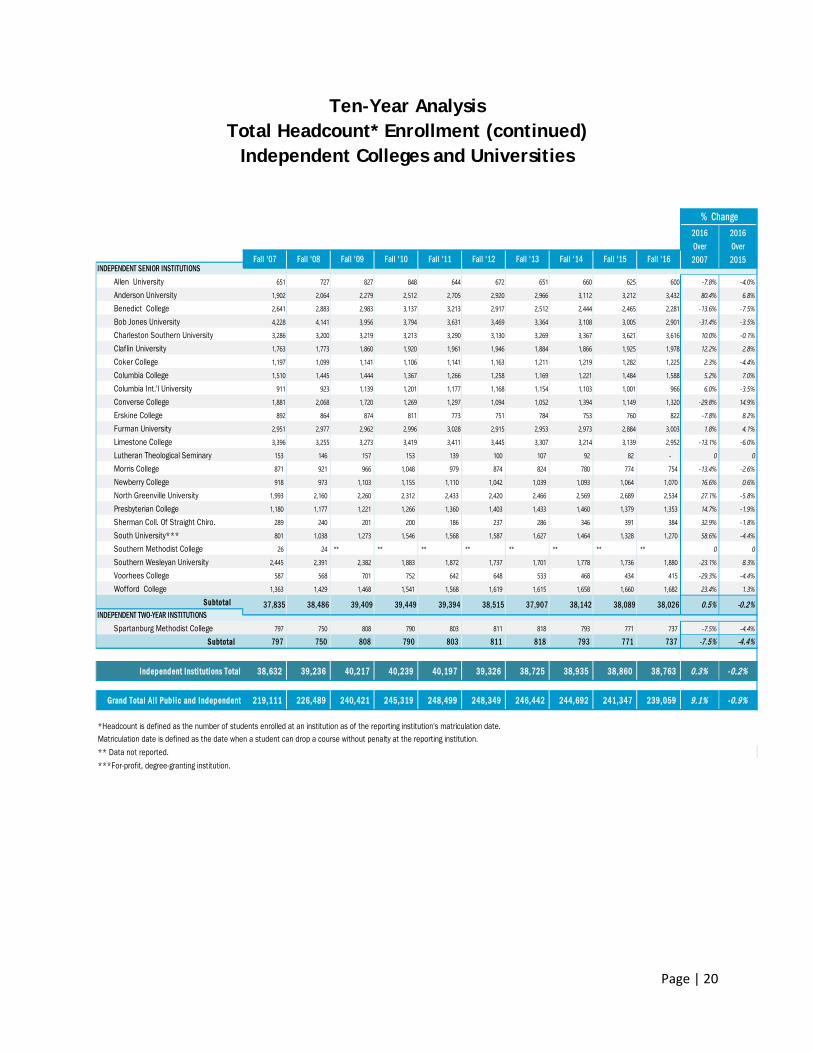
Ten-Year Analysis Total Headcount* Enrollment (continued)
Independent Colleges and Universities
Allen University 651 727 827 848 644 672 651 660 625 600 -7.8% -4.0%
Anderson University 1,902 2,064 2,279 2,512 2,705 2,920 2,966 3,112 3,212 3,432 80.4% 6.8%
Benedict College 2,641 2,883 2,983 3,137 3,213 2,917 2,512 2,444 2,465 2,281 -13.6% -7.5%
Bob Jones University 4,228 4,141 3,956 3,794 3,631 3,469 3,364 3,108 3,005 2,901 -31.4% -3.5%
Charleston Southern University 3,286 3,200 3,219 3,213 3,290 3,130 3,269 3,367 3,621 3,616 10.0% -0.1%
Claflin University 1,763 1,773 1,860 1,920 1,961 1,946 1,884 1,866 1,925 1,978 12.2% 2.8%
Coker College 1,197 1,099 1,141 1,106 1,141 1,163 1,211 1,219 1,282 1,225 2.3% -4.4%
Columbia College 1,510 1,445 1,444 1,367 1,266 1,258 1,169 1,221 1,484 1,588 5.2% 7.0%
Columbia Int.'l University 911 923 1,139 1,201 1,177 1,168 1,154 1,103 1,001 966 6.0% -3.5%
Converse College 1,881 2,068 1,720 1,269 1,297 1,094 1,052 1,394 1,149 1,320 -29.8% 14.9%
Erskine College 892 864 874 811 773 751 784 753 760 822 -7.8% 8.2%
Furman University 2,951 2,977 2,962 2,996 3,028 2,915 2,953 2,973 2,884 3,003 1.8% 4.1%
Limestone College 3,396 3,255 3,273 3,419 3,411 3,445 3,307 3,214 3,139 2,952 -13.1% -6.0%
Lutheran Theological Seminary 153 146 157 153 139 100 107 92 82 - 0 0
Morris College 871 921 966 1,048 979 874 824 780 774 754 -13.4% -2.6%
Newberry College 918 973 1,103 1,155 1,110 1,042 1,039 1,093 1,064 1,070 16.6% 0.6%
North Greenville University 1,993 2,160 2,260 2,312 2,433 2,420 2,466 2,569 2,689 2,534 27.1% -5.8%
Presbyterian College 1,180 1,177 1,221 1,266 1,360 1,403 1,433 1,460 1,379 1,353 14.7% -1.9%
Sherman Coll. Of Straight Chiro. 289 240 201 200 186 237 286 346 391 384 32.9% -1.8%
South University*** 801 1,038 1,273 1,546 1,568 1,587 1,627 1,464 1,328 1,270 58.6% -4.4%
Southern Methodist College 26 24 ** ** ** ** ** ** ** ** 0 0
Southern Wesleyan University 2,445 2,391 2,382 1,883 1,872 1,737 1,701 1,778 1,736 1,880 -23.1% 8.3%
Voorhees College 587 568 701 752 642 648 533 468 434 415 -29.3% -4.4%
Wofford College 1,363 1,429 1,468 1,541 1,568 1,619 1,615 1,658 1,660 1,682 23.4% 1.3%
Subtotal
Spartanburg Methodist College 797 750 808 790 803 811 818 793 771 737 -7.5% -4.4%
Subtotal 797 750 808 790 803 811 818 793 771 737 -7.5% -4.4%
Independent Insti tutions Total 38,632 39,236 40,217 40,239 40,197 39,326 38,725 38,935 38,860 38,763 0.3% -0.2%
Grand Total Al l Publ ic and Independent 219,111 226,489 240,421 245,319 248,499 248,349 246,442 244,692 241,347 239,059 9.1% -0.9%
** Data not reported.***For-profit, degree-granting institution.
*Headcount is defined as the number of students enrolled at an institution as of the reporting institution's matriculation date.Matriculation date is defined as the date when a student can drop a course without penalty at the reporting institution.
38,089 38,026 0.5%
Fall '15 Fall '16
-0.2%INDEPENDENT TWO-YEAR INSTITUTIONS
37,835 38,486 39,409 39,449 39,394 38,515 37,907 38,142
% Change2016Over
2007
2016Over
2015Fall '07 Fall '08 Fall '09 Fall '10INDEPENDENT SENIOR INSTITUTIONS
Fall '11 Fall '12 Fall '13 Fall '14
Page | 21
Ten-Year Analysis S.C. Public and Independent Colleges and Universities
Total Headcount Enrollment by Sector
See previous two pages for details on the graphical information.
0
20,000
40,000
60,000
80,000
100,000
120,000
Fall2007
Fall2008
Fall2009
Fall2010
Fall2011
Fall2012
Fall2013
Fall2014
Fall2015
Fall2016
Research Universities Comprehensive Teaching Universities
Two-Year Regional Campuses of USC Technical Colleges
Independent Senior Institutions Two-Year Independent Institution
Page | 22
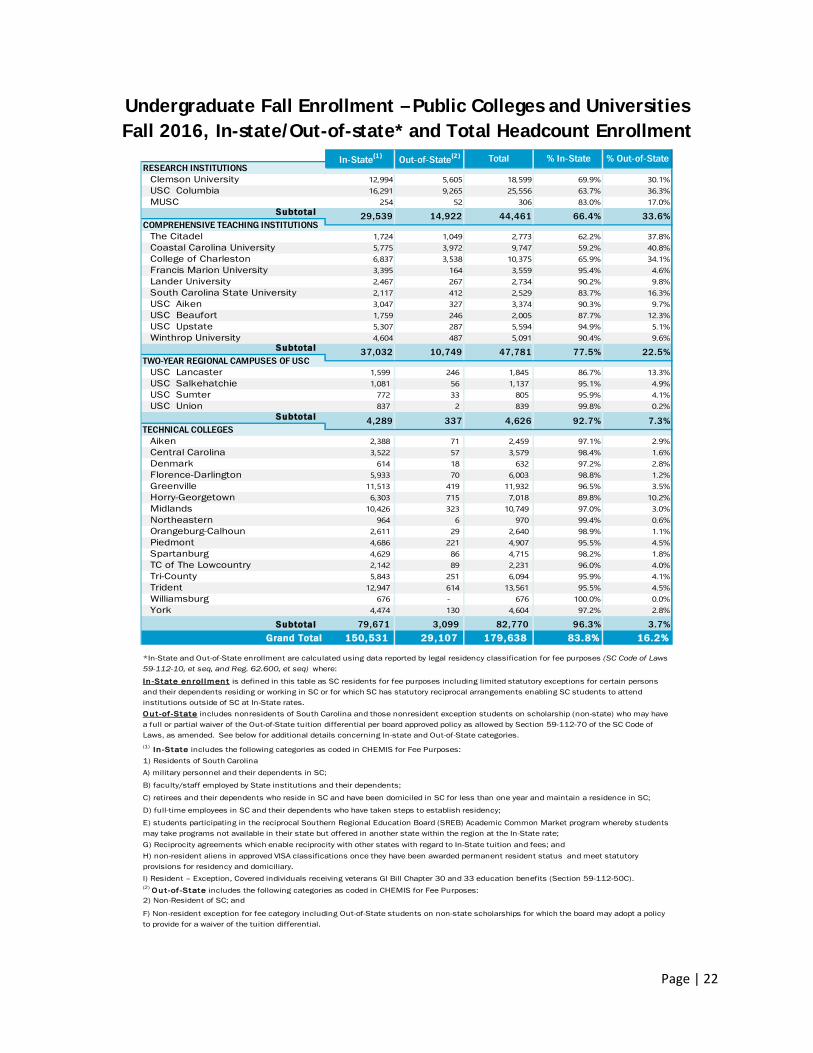
Undergraduate Fall Enrollment – Public Colleges and Universities Fall 2016, In-state/Out-of-state* and Total Headcount Enrollment
Clemson University 12,994 5,605 18,599 69.9% 30.1%USC Columbia 16,291 9,265 25,556 63.7% 36.3%MUSC 254 52 306 83.0% 17.0%
Subtotal
The Citadel 1,724 1,049 2,773 62.2% 37.8%Coastal Carolina University 5,775 3,972 9,747 59.2% 40.8%College of Charleston 6,837 3,538 10,375 65.9% 34.1%Francis Marion University 3,395 164 3,559 95.4% 4.6%Lander University 2,467 267 2,734 90.2% 9.8%South Carolina State University 2,117 412 2,529 83.7% 16.3%USC Aiken 3,047 327 3,374 90.3% 9.7%USC Beaufort 1,759 246 2,005 87.7% 12.3%USC Upstate 5,307 287 5,594 94.9% 5.1%Winthrop University 4,604 487 5,091 90.4% 9.6%
Subtotal
USC Lancaster 1,599 246 1,845 86.7% 13.3%USC Salkehatchie 1,081 56 1,137 95.1% 4.9%USC Sumter 772 33 805 95.9% 4.1%USC Union 837 2 839 99.8% 0.2%
Subtotal
Aiken 2,388 71 2,459 97.1% 2.9%Central Carolina 3,522 57 3,579 98.4% 1.6%Denmark 614 18 632 97.2% 2.8%Florence-Darlington 5,933 70 6,003 98.8% 1.2%Greenville 11,513 419 11,932 96.5% 3.5%Horry-Georgetown 6,303 715 7,018 89.8% 10.2%Midlands 10,426 323 10,749 97.0% 3.0%Northeastern 964 6 970 99.4% 0.6%Orangeburg-Calhoun 2,611 29 2,640 98.9% 1.1%Piedmont 4,686 221 4,907 95.5% 4.5%Spartanburg 4,629 86 4,715 98.2% 1.8%TC of The Lowcountry 2,142 89 2,231 96.0% 4.0%Tri-County 5,843 251 6,094 95.9% 4.1%Trident 12,947 614 13,561 95.5% 4.5%Williamsburg 676 - 676 100.0% 0.0%York 4,474 130 4,604 97.2% 2.8%
Subtotal 79,671 3,099 82,770 96.3% 3.7%Grand Total 150,531 29,107 179,638 83.8% 16.2%
1) Residents of South Carolina
I) Resident – Exception, Covered individuals receiving veterans GI Bill Chapter 30 and 33 education benefits (Section 59-112-50C).
A) military personnel and their dependents in SC;
TECHNICAL COLLEGES4,289 337 4,626 92.7% 7.3%
COMPREHENSIVE TEACHING INSTITUTIONS
37,032 10,749 47,781 77.5% 22.5%TWO-YEAR REGIONAL CAMPUSES OF USC
29,539 14,922 44,461 66.4% 33.6%
Out-of-State(2) Total % In-State % Out-of-StateRESEARCH INSTITUTIONS
F) Non-resident exception for fee category including Out-of-State students on non-state scholarships for which the board may adopt a policyto provide for a waiver of the tuition differential.
B) faculty/staff employed by State institutions and their dependents;
C) retirees and their dependents who reside in SC and have been domiciled in SC for less than one year and maintain a residence in SC;
D) full-time employees in SC and their dependents who have taken steps to establish residency;
E) students participating in the reciprocal Southern Regional Education Board (SREB) Academic Common Market program whereby studentsmay take programs not available in their state but offered in another state within the region at the In-State rate;G) Reciprocity agreements which enable reciprocity with other states with regard to In-State tuition and fees; and
In -State en rol lment is defined in this table as SC residents for fee purposes including limited statutory exceptions for certain personsand their dependents residing or working in SC or for which SC has statutory reciprocal arrangements enabling SC students to attend institutions outside of SC at In-State rates. Ou t -of -State includes nonresidents of South Carolina and those nonresident exception students on scholarship (non-state) who may have a full or partial waiver of the Out-of-State tuition differential per board approved policy as allowed by Section 59-112-70 of the SC Code of Laws, as amended. See below for additional details concerning In-state and Out-of-State categories.
*In-State and Out-of-State enrollment are calculated using data reported by legal residency classification for fee purposes (SC Code of Laws59-112-10, et seq, and Reg. 62.600, et seq) where:
(1) In -State includes the following categories as coded in CHEMIS for Fee Purposes:
H) non-resident aliens in approved VISA classifications once they have been awarded permanent resident status and meet statutoryprovisions for residency and domiciliary.
(2) Ou t -of -State includes the following categories as coded in CHEMIS for Fee Purposes:2) Non-Resident of SC; and
In-State(1)
Page | 23
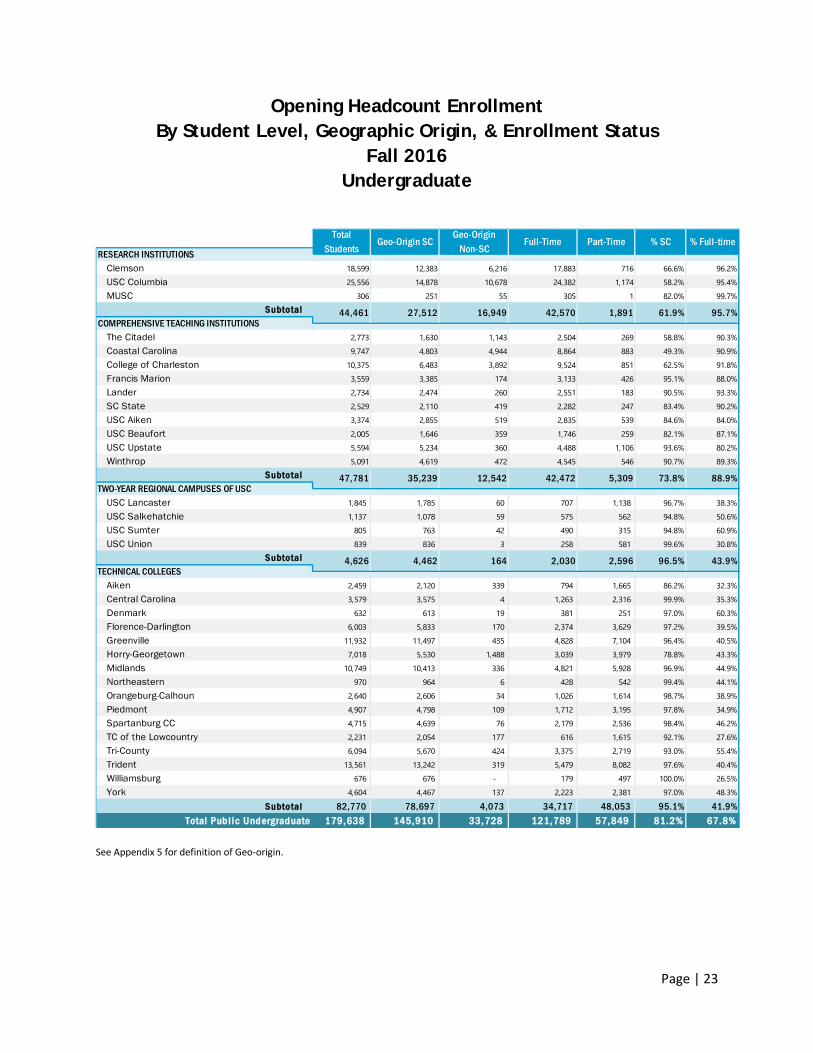
Opening Headcount Enrollment By Student Level, Geographic Origin, & Enrollment Status
Fall 2016 Undergraduate
See Appendix 5 for definition of Geo-origin.
Clemson 18,599 12,383 6,216 17,883 716 66.6% 96.2%
USC Columbia 25,556 14,878 10,678 24,382 1,174 58.2% 95.4%
MUSC 306 251 55 305 1 82.0% 99.7%
Subtotal
The Citadel 2,773 1,630 1,143 2,504 269 58.8% 90.3%
Coastal Carolina 9,747 4,803 4,944 8,864 883 49.3% 90.9%
College of Charleston 10,375 6,483 3,892 9,524 851 62.5% 91.8%
Francis Marion 3,559 3,385 174 3,133 426 95.1% 88.0%
Lander 2,734 2,474 260 2,551 183 90.5% 93.3%
SC State 2,529 2,110 419 2,282 247 83.4% 90.2%
USC Aiken 3,374 2,855 519 2,835 539 84.6% 84.0%
USC Beaufort 2,005 1,646 359 1,746 259 82.1% 87.1%
USC Upstate 5,594 5,234 360 4,488 1,106 93.6% 80.2%
Winthrop 5,091 4,619 472 4,545 546 90.7% 89.3%
Subtotal
USC Lancaster 1,845 1,785 60 707 1,138 96.7% 38.3%USC Salkehatchie 1,137 1,078 59 575 562 94.8% 50.6%
USC Sumter 805 763 42 490 315 94.8% 60.9%
USC Union 839 836 3 258 581 99.6% 30.8%Subtotal
Aiken 2,459 2,120 339 794 1,665 86.2% 32.3%
Central Carolina 3,579 3,575 4 1,263 2,316 99.9% 35.3%
Denmark 632 613 19 381 251 97.0% 60.3%
Florence-Darlington 6,003 5,833 170 2,374 3,629 97.2% 39.5%
Greenville 11,932 11,497 435 4,828 7,104 96.4% 40.5%Horry-Georgetown 7,018 5,530 1,488 3,039 3,979 78.8% 43.3%
Midlands 10,749 10,413 336 4,821 5,928 96.9% 44.9%
Northeastern 970 964 6 428 542 99.4% 44.1%
Orangeburg-Calhoun 2,640 2,606 34 1,026 1,614 98.7% 38.9%
Piedmont 4,907 4,798 109 1,712 3,195 97.8% 34.9%
Spartanburg CC 4,715 4,639 76 2,179 2,536 98.4% 46.2%
TC of the Lowcountry 2,231 2,054 177 616 1,615 92.1% 27.6%
Tri-County 6,094 5,670 424 3,375 2,719 93.0% 55.4%
Trident 13,561 13,242 319 5,479 8,082 97.6% 40.4%
Williamsburg 676 676 - 179 497 100.0% 26.5%
York 4,604 4,467 137 2,223 2,381 97.0% 48.3%
Subtotal 82,770 78,697 4,073 34,717 48,053 95.1% 41.9%Total Publ ic Undergraduate 179,638 145,910 33,728 121,789 57,849 81.2% 67.8%
% Full-timeRESEARCH INSTITUTIONS
44,461 27,512 16,949 42,570 1,891 61.9%
TotalStudents
Geo-Origin SCGeo-Origin
Non-SCFull-Time Part-Time % SC
95.7%COMPREHENSIVE TEACHING INSTITUTIONS
47,781 35,239 12,542 42,472 5,309 73.8% 88.9%TWO-YEAR REGIONAL CAMPUSES OF USC
4,626 4,462 164 2,030 2,596 96.5% 43.9%TECHNICAL COLLEGES
Page | 24
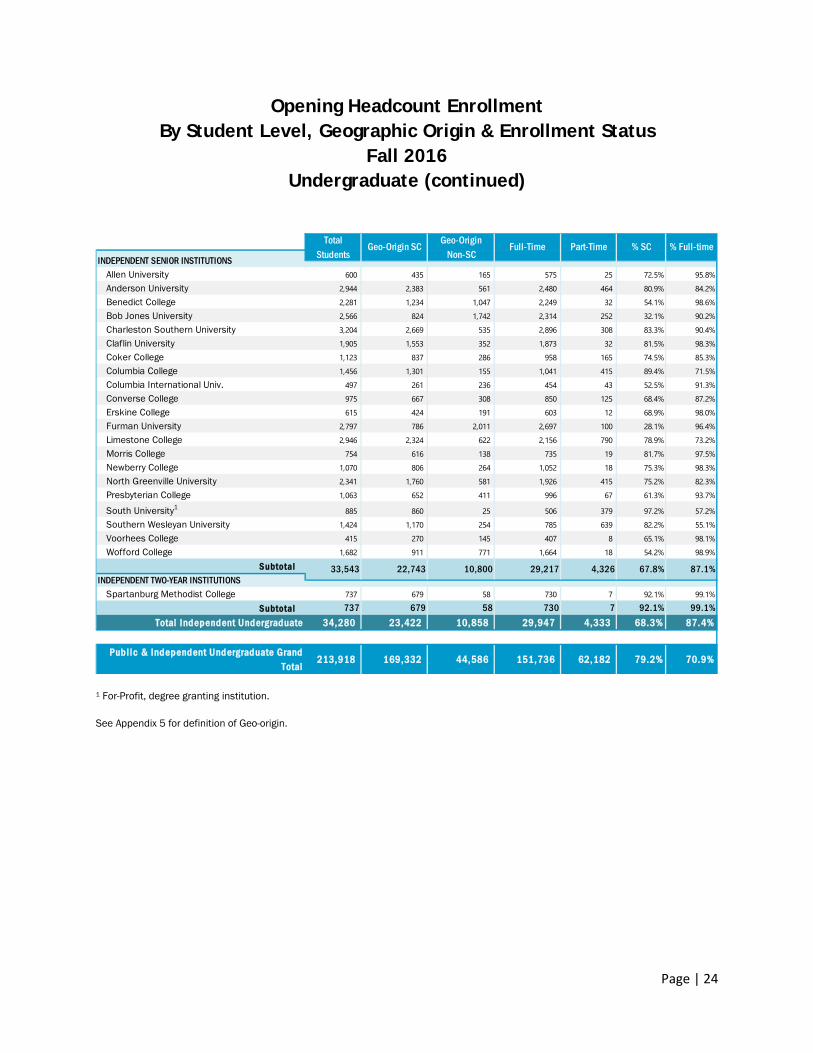
Opening Headcount Enrollment By Student Level, Geographic Origin & Enrollment Status
Fall 2016 Undergraduate (continued)
1 For-Profit, degree granting institution.
See Appendix 5 for definition of Geo-origin.
Allen University 600 435 165 575 25 72.5% 95.8%Anderson University 2,944 2,383 561 2,480 464 80.9% 84.2%Benedict College 2,281 1,234 1,047 2,249 32 54.1% 98.6%Bob Jones University 2,566 824 1,742 2,314 252 32.1% 90.2%Charleston Southern University 3,204 2,669 535 2,896 308 83.3% 90.4%Claflin University 1,905 1,553 352 1,873 32 81.5% 98.3%Coker College 1,123 837 286 958 165 74.5% 85.3%Columbia College 1,456 1,301 155 1,041 415 89.4% 71.5%Columbia International Univ. 497 261 236 454 43 52.5% 91.3%Converse College 975 667 308 850 125 68.4% 87.2%Erskine College 615 424 191 603 12 68.9% 98.0%Furman University 2,797 786 2,011 2,697 100 28.1% 96.4%Limestone College 2,946 2,324 622 2,156 790 78.9% 73.2%Morris College 754 616 138 735 19 81.7% 97.5%Newberry College 1,070 806 264 1,052 18 75.3% 98.3%North Greenville University 2,341 1,760 581 1,926 415 75.2% 82.3%
Presbyterian College 1,063 652 411 996 67 61.3% 93.7%
South University1 885 860 25 506 379 97.2% 57.2%Southern Wesleyan University 1,424 1,170 254 785 639 82.2% 55.1%Voorhees College 415 270 145 407 8 65.1% 98.1%Wofford College 1,682 911 771 1,664 18 54.2% 98.9%
Subtotal
Spartanburg Methodist College 737 679 58 730 7 92.1% 99.1%
Subtotal 737 679 58 730 7 92.1% 99.1%Total Independent Undergraduate 34,280 23,422 10,858 29,947 4,333 68.3% 87.4%
Publ ic & Independent Undergraduate Grand Total
213,918 169,332 44,586 151,736 62,182 79.2% 70.9%
Total Students
Geo-Origin SC Geo-OriginNon-SC
Full-Time Part-Time % SC % Full-timeINDEPENDENT SENIOR INSTITUTIONS
INDEPENDENT TWO-YEAR INSTITUTIONS33,543 22,743 10,800 29,217 4,326 67.8% 87.1%
Page | 25
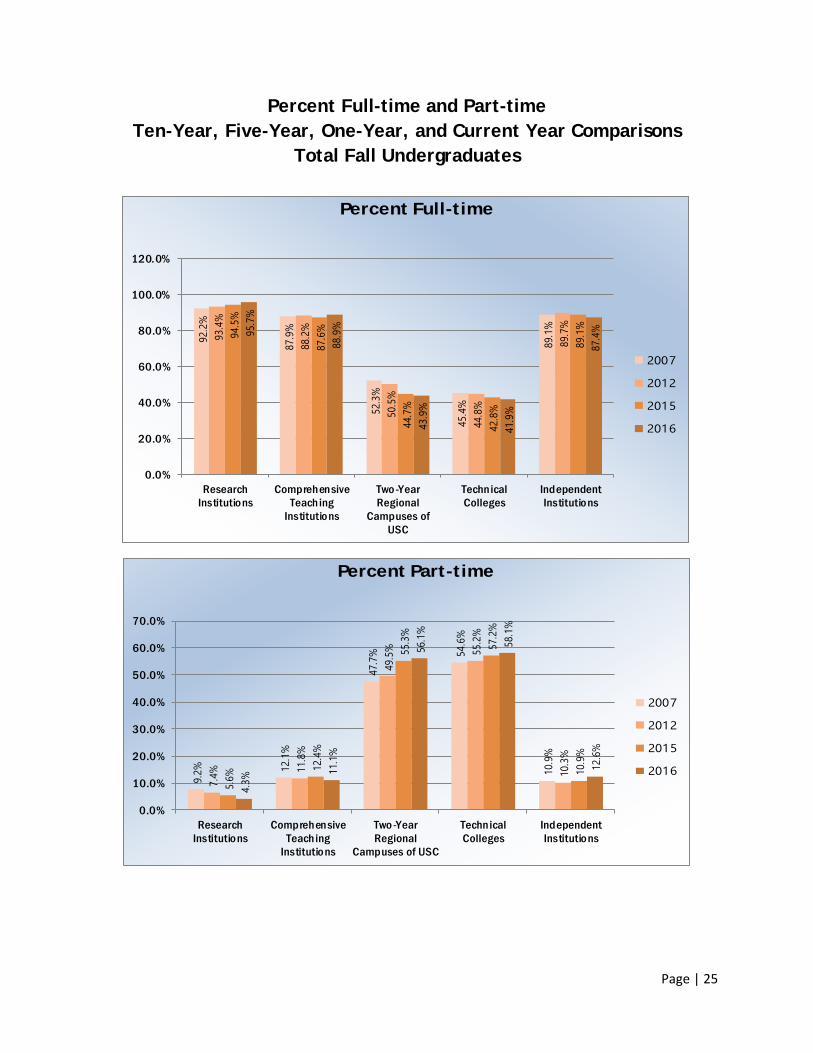
Percent Full-time and Part-time Ten-Year, Five-Year, One-Year, and Current Year Comparisons
Total Fall Undergraduates
9.2% 12.1%
47.7% 54
.6%
10.9%
7.4% 11.8%
49.5% 55
.2%
10.3%
5.6% 12
.4%
55.3% 57.2%
10.9%
4.3% 11
.1%
56.1% 58.1%
12.6%
0.0%
10.0%
20.0%
30.0%
40.0%
50.0%
60.0%
70.0%
ResearchInstitutions
ComprehensiveTeaching
Institutions
Two-YearRegional
Campuses of USC
TechnicalColleges
IndependentInstitutions
Percent Part-time
2007
2012
2015
2016
92.2%
87.9%
52.3%
45.4%
89.1%93.4%
88.2%
50.5%
44.8%
89.7%94.5%
87.6%
44.7%
42.8%
89.1%95.7%
88.9%
43.9%
41.9%
87.4%
0.0%
20.0%
40.0%
60.0%
80.0%
100.0%
120.0%
ResearchInstitutions
ComprehensiveTeaching
Institutions
Two-YearRegional
Campuses ofUSC
TechnicalColleges
IndependentInstitutions
Percent Full-time
2007
2012
2015
2016
Page | 26
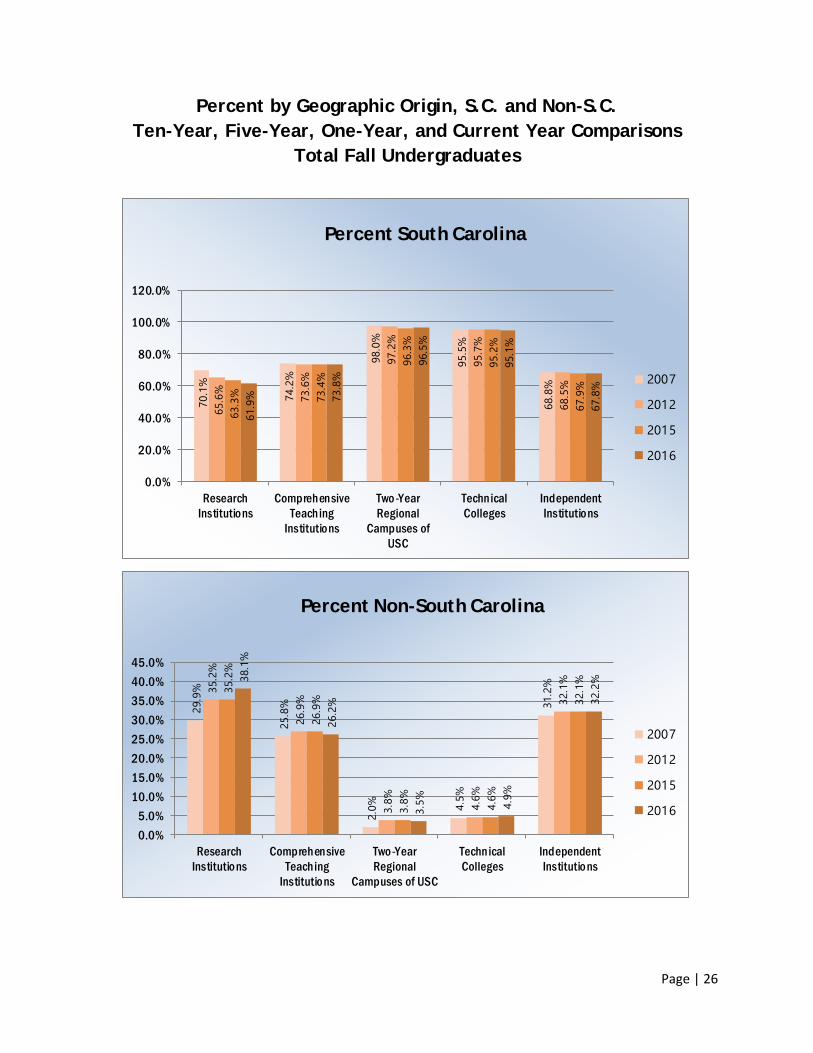
Percent by Geographic Origin, S.C. and Non-S.C. Ten-Year, Five-Year, One-Year, and Current Year Comparisons
Total Fall Undergraduates
29.9%
25.8%
2.0% 4.5%
31.2%35.2%
26.9%
3.8% 4.6%
32.1%
35.2%
26.9%
3.8% 4.6%
32.1%38.1%
26.2%
3.5% 4.9%
32.2%
0.0%
5.0%
10.0%
15.0%
20.0%
25.0%
30.0%
35.0%
40.0%
45.0%
ResearchInstitutions
ComprehensiveTeaching
Institutions
Two-YearRegional
Campuses of USC
TechnicalColleges
IndependentInstitutions
Percent Non-South Carolina
2007
2012
2015
2016
70.1%
74.2%
98.0%
95.5%
68.8%
65.6% 73.6%
97.2%
95.7%
68.5%
63.3% 73.4%
96.3%
95.2%
67.9%
61.9% 73.8%
96.5%
95.1%
67.8%
0.0%
20.0%
40.0%
60.0%
80.0%
100.0%
120.0%
ResearchInstitutions
ComprehensiveTeaching
Institutions
Two-YearRegional
Campuses ofUSC
TechnicalColleges
IndependentInstitutions
Percent South Carolina
2007
2012
2015
2016
Page | 27
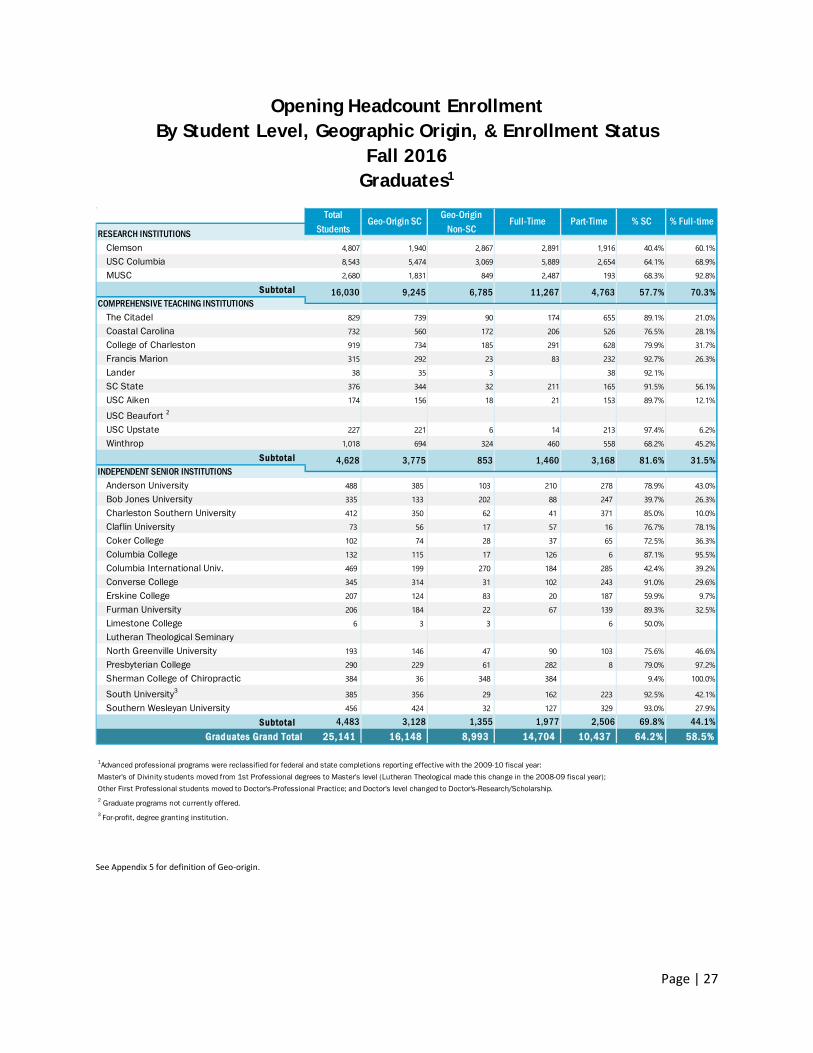
Opening Headcount Enrollment By Student Level, Geographic Origin, & Enrollment Status
Fall 2016 Graduates1
See Appendix 5 for definition of Geo-origin.
Clemson 4,807 1,940 2,867 2,891 1,916 40.4% 60.1%
USC Columbia 8,543 5,474 3,069 5,889 2,654 64.1% 68.9%
MUSC 2,680 1,831 849 2,487 193 68.3% 92.8%
Subtotal
The Citadel 829 739 90 174 655 89.1% 21.0%
Coastal Carolina 732 560 172 206 526 76.5% 28.1%
College of Charleston 919 734 185 291 628 79.9% 31.7%
Francis Marion 315 292 23 83 232 92.7% 26.3%
Lander 38 35 3 38 92.1%
SC State 376 344 32 211 165 91.5% 56.1%
USC Aiken 174 156 18 21 153 89.7% 12.1%
USC Beaufort 2
USC Upstate 227 221 6 14 213 97.4% 6.2%
Winthrop 1,018 694 324 460 558 68.2% 45.2%
Subtotal
Anderson University 488 385 103 210 278 78.9% 43.0%
Bob Jones University 335 133 202 88 247 39.7% 26.3%
Charleston Southern University 412 350 62 41 371 85.0% 10.0%
Claflin University 73 56 17 57 16 76.7% 78.1%
Coker College 102 74 28 37 65 72.5% 36.3%
Columbia College 132 115 17 126 6 87.1% 95.5%
Columbia International Univ. 469 199 270 184 285 42.4% 39.2%
Converse College 345 314 31 102 243 91.0% 29.6%
Erskine College 207 124 83 20 187 59.9% 9.7%
Furman University 206 184 22 67 139 89.3% 32.5%
Limestone College 6 3 3 6 50.0%
Lutheran Theological SeminaryNorth Greenville University 193 146 47 90 103 75.6% 46.6%
Presbyterian College 290 229 61 282 8 79.0% 97.2%
Sherman College of Chiropractic 384 36 348 384 9.4% 100.0%
South University3 385 356 29 162 223 92.5% 42.1%Southern Wesleyan University 456 424 32 127 329 93.0% 27.9%
Subtotal 4,483 3,128 1,355 1,977 2,506 69.8% 44.1%Graduates Grand Total 25,141 16,148 8,993 14,704 10,437 64.2% 58.5%
1Advanced professional programs were reclassified for federal and state completions reporting effective with the 2009-10 fiscal year: Master's of Divinity students moved from 1st Professional degrees to Master's level (Lutheran Theological made this change in the 2008-09 fiscal year); Other First Professional students moved to Doctor's-Professional Practice; and Doctor's level changed to Doctor's-Research/Scholarship. 2 Graduate programs not currently offered.3 For-profit, degree granting institution.
9,245 6,785 11,267 4,763
RESEARCH INSTITUTIONS
4,628 3,775 853 1,460 3,168 81.6% 31.5%
16,030
% Full-timeTotalStudents
Geo-Origin SC Geo-OriginNon-SC
Full-Time Part-Time % SC
COMPREHENSIVE TEACHING INSTITUTIONS
INDEPENDENT SENIOR INSTITUTIONS
57.7% 70.3%
Page | 28
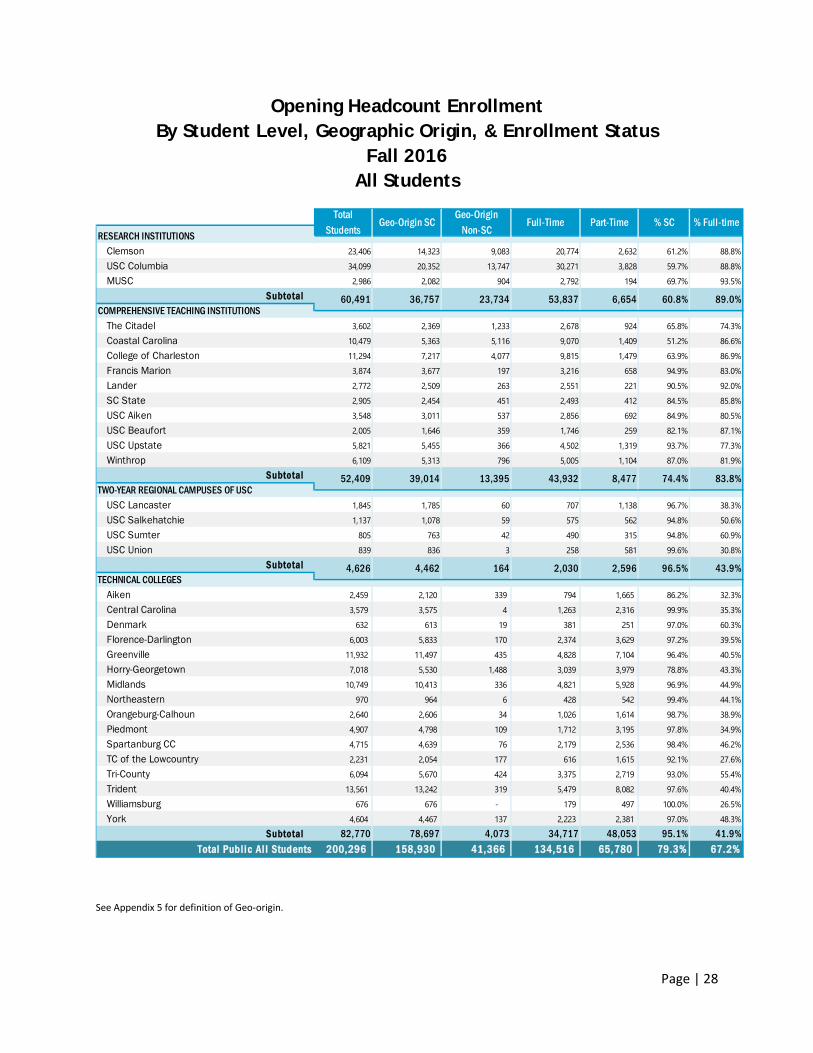
Opening Headcount Enrollment By Student Level, Geographic Origin, & Enrollment Status
Fall 2016 All Students
See Appendix 5 for definition of Geo-origin.
Clemson 23,406 14,323 9,083 20,774 2,632 61.2% 88.8%USC Columbia 34,099 20,352 13,747 30,271 3,828 59.7% 88.8%MUSC 2,986 2,082 904 2,792 194 69.7% 93.5%
Subtotal
The Citadel 3,602 2,369 1,233 2,678 924 65.8% 74.3%Coastal Carolina 10,479 5,363 5,116 9,070 1,409 51.2% 86.6%College of Charleston 11,294 7,217 4,077 9,815 1,479 63.9% 86.9%Francis Marion 3,874 3,677 197 3,216 658 94.9% 83.0%Lander 2,772 2,509 263 2,551 221 90.5% 92.0%SC State 2,905 2,454 451 2,493 412 84.5% 85.8%USC Aiken 3,548 3,011 537 2,856 692 84.9% 80.5%USC Beaufort 2,005 1,646 359 1,746 259 82.1% 87.1%USC Upstate 5,821 5,455 366 4,502 1,319 93.7% 77.3%Winthrop 6,109 5,313 796 5,005 1,104 87.0% 81.9%
Subtotal
USC Lancaster 1,845 1,785 60 707 1,138 96.7% 38.3%USC Salkehatchie 1,137 1,078 59 575 562 94.8% 50.6%USC Sumter 805 763 42 490 315 94.8% 60.9%USC Union 839 836 3 258 581 99.6% 30.8%
Subtotal
Aiken 2,459 2,120 339 794 1,665 86.2% 32.3%Central Carolina 3,579 3,575 4 1,263 2,316 99.9% 35.3%Denmark 632 613 19 381 251 97.0% 60.3%Florence-Darlington 6,003 5,833 170 2,374 3,629 97.2% 39.5%Greenville 11,932 11,497 435 4,828 7,104 96.4% 40.5%Horry-Georgetown 7,018 5,530 1,488 3,039 3,979 78.8% 43.3%Midlands 10,749 10,413 336 4,821 5,928 96.9% 44.9%Northeastern 970 964 6 428 542 99.4% 44.1%Orangeburg-Calhoun 2,640 2,606 34 1,026 1,614 98.7% 38.9%Piedmont 4,907 4,798 109 1,712 3,195 97.8% 34.9%Spartanburg CC 4,715 4,639 76 2,179 2,536 98.4% 46.2%TC of the Lowcountry 2,231 2,054 177 616 1,615 92.1% 27.6%Tri-County 6,094 5,670 424 3,375 2,719 93.0% 55.4%Trident 13,561 13,242 319 5,479 8,082 97.6% 40.4%Williamsburg 676 676 - 179 497 100.0% 26.5%York 4,604 4,467 137 2,223 2,381 97.0% 48.3%
Subtotal 82,770 78,697 4,073 34,717 48,053 95.1% 41.9%Total Publ ic Al l Students 200,296 158,930 41,366 134,516 65,780 79.3% 67.2%
RESEARCH INSTITUTIONS
TotalStudents
Geo-Origin SCGeo-Origin
Non-SCFull-Time Part-Time % SC % Full-time
60,491 36,757 23,734 53,837 6,654 60.8% 89.0%COMPREHENSIVE TEACHING INSTITUTIONS
52,409 39,014 13,395 43,932 8,477 74.4% 83.8%TWO-YEAR REGIONAL CAMPUSES OF USC
4,626 4,462 164 2,030 2,596 96.5% 43.9%TECHNICAL COLLEGES
Page | 29
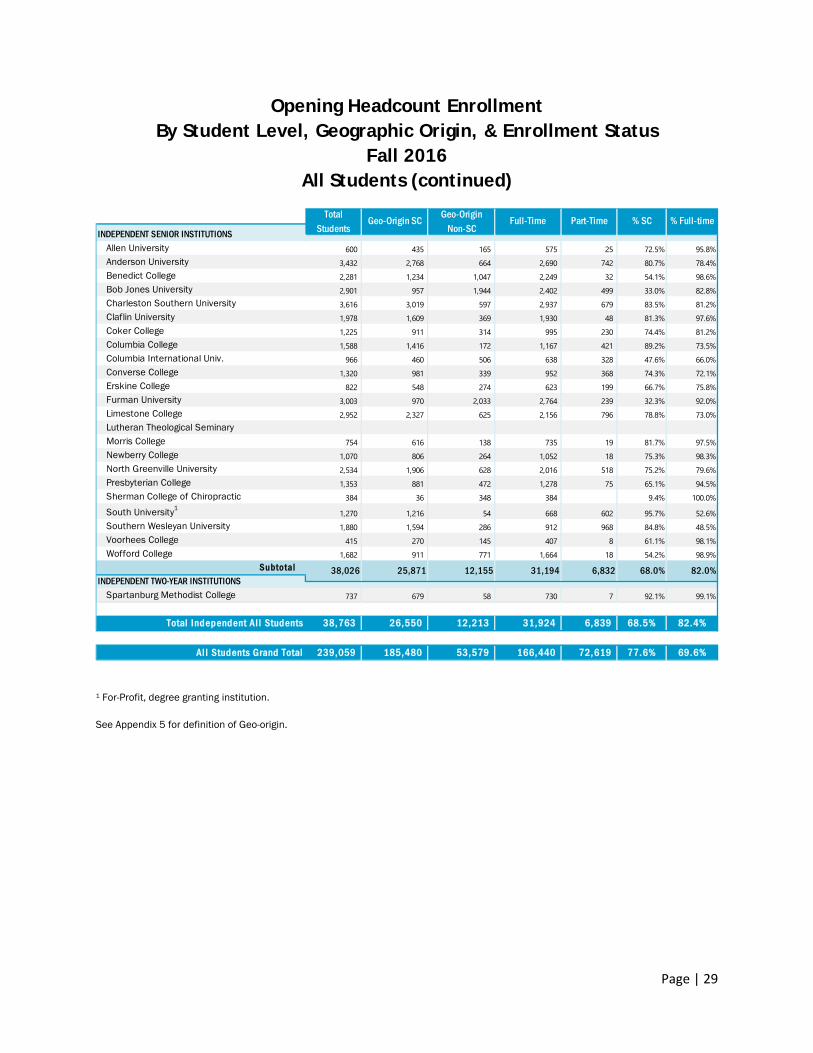
Opening Headcount Enrollment By Student Level, Geographic Origin, & Enrollment Status
Fall 2016 All Students (continued)
1 For-Profit, degree granting institution.
See Appendix 5 for definition of Geo-origin.
Allen University 600 435 165 575 25 72.5% 95.8%Anderson University 3,432 2,768 664 2,690 742 80.7% 78.4%Benedict College 2,281 1,234 1,047 2,249 32 54.1% 98.6%Bob Jones University 2,901 957 1,944 2,402 499 33.0% 82.8%Charleston Southern University 3,616 3,019 597 2,937 679 83.5% 81.2%Claflin University 1,978 1,609 369 1,930 48 81.3% 97.6%Coker College 1,225 911 314 995 230 74.4% 81.2%Columbia College 1,588 1,416 172 1,167 421 89.2% 73.5%Columbia International Univ. 966 460 506 638 328 47.6% 66.0%Converse College 1,320 981 339 952 368 74.3% 72.1%Erskine College 822 548 274 623 199 66.7% 75.8%Furman University 3,003 970 2,033 2,764 239 32.3% 92.0%Limestone College 2,952 2,327 625 2,156 796 78.8% 73.0%Lutheran Theological SeminaryMorris College 754 616 138 735 19 81.7% 97.5%Newberry College 1,070 806 264 1,052 18 75.3% 98.3%North Greenville University 2,534 1,906 628 2,016 518 75.2% 79.6%Presbyterian College 1,353 881 472 1,278 75 65.1% 94.5%Sherman College of Chiropractic 384 36 348 384 9.4% 100.0%South University1 1,270 1,216 54 668 602 95.7% 52.6%Southern Wesleyan University 1,880 1,594 286 912 968 84.8% 48.5%Voorhees College 415 270 145 407 8 61.1% 98.1%Wofford College 1,682 911 771 1,664 18 54.2% 98.9%
Subtotal
Spartanburg Methodist College 737 679 58 730 7 92.1% 99.1%
Total Independent Al l Students 38,763 26,550 12,213 31,924 6,839 68.5% 82.4%
All Students Grand Total 239,059 185,480 53,579 166,440 72,619 77.6% 69.6%
Part-Time % SC % Full-timeINDEPENDENT SENIOR INSTITUTIONS
INDEPENDENT TWO-YEAR INSTITUTIONS 38,026 25,871 12,155 31,194 6,832 68.0% 82.0%
TotalStudents
Geo-Origin SCGeo-Origin
Non-SCFull-Time

Page | 30
Opening Headcount Enrollment First-time Freshmen by State of Origin (Geographic Origin)
SC Public Research and Comprehensive Teaching Institutions Fall 2016
See Appendix 5 for definition of Geo-origin.
Alabama 15 8 2 3 3 1 1 1 34Alaska 1 1 1 3Arizona 1 2 1 1 1 1 7Arkansas 2 1 1 4California 29 20 11 6 23 1 5 1 1 1 2 100Colorado 18 9 2 4 9 1 1 44Connecticut 39 69 7 56 67 1 1 3 243Delaware 8 19 5 23 12 1 2 70District Of Columbia 1 2 1 8 7 19Florida 65 68 34 11 47 5 6 6 7 6 8 5 268Georgia 160 247 35 34 55 11 42 23 33 10 13 663Hawaii 2 1 1 1 1 6Idaho 0Illinois 50 81 8 17 21 1 1 2 1 1 183Indiana 11 16 1 7 6 1 1 3 1 47Iowa 1 1 2 1 1 6Kansas 3 4 3 4 3 1 18Kentucky 16 34 5 21 6 1 2 1 86Louisiana 6 4 2 1 7 20Maine 2 5 1 4 5 2 1 20Maryland 81 249 14 134 66 2 5 2 2 9 564Massachusetts 57 135 4 111 67 1 1 3 379Michigan 12 8 2 9 6 2 1 1 41Minnesota 8 7 5 4 1 2 27Mississippi 2 1 1 4Missouri 9 11 5 6 4 1 1 37Montana 0Nebraska 2 4 2 2 1 11Nevada 1 1 1 1 4New Hampshire 13 9 31 6 1 60New Jersey 119 270 16 141 87 2 2 6 3 2 4 652New Mexico 1 1New York 89 145 14 116 73 2 3 6 1 2 2 3 456North Carolina 224 487 52 105 115 11 4 18 9 3 9 27 1,064North Dakota 1 1Ohio 42 117 7 51 24 1 3 1 3 4 8 261Oklahoma 6 1 1 1 4 13Oregon 1 5 2 1 9Pennsylvania 72 197 13 140 75 3 1 2 2 7 4 516Puerto Rico 0Rhode Island 10 13 3 14 1 1 42South Carolina 2,282 2,391 401 988 1,374 686 563 517 529 397 694 952 11,774South Dakota 0Tennessee 38 47 13 12 26 1 1 3 1 142Texas 46 43 24 3 19 3 1 1 1 2 143Utah 2 1 1 2 6Vermont 2 4 9 9 1 25Virgin Islands 1 1 2Virginia 104 266 27 142 70 2 1 5 1 3 4 8 633Washington 3 2 3 2 1 1 2 1 15West Virginia 4 10 1 7 4 1 1 2 1 1 32Wisconsin 4 11 2 7 1 1 1 27Wyoming 0
APO (Foreign Service) 3 3 1 7Armed Forces 1 1Foreign Countries 17 62 9 25 16 13 9 23 7 11 16 208Unknown 3 19 3 3 3 6 37
Grand Total 3,684 5,110 734 2,249 2,349 729 608 628 623 487 762 1,072 19,035
State of OriginClemson WinthropLander State TotalUSC Upstate
USC Columbia
USC BeaufortThe
CitadelCoastal
CarolinaCollege of Charleston
FrancisMarion
SC State USC Aiken
Page | 31
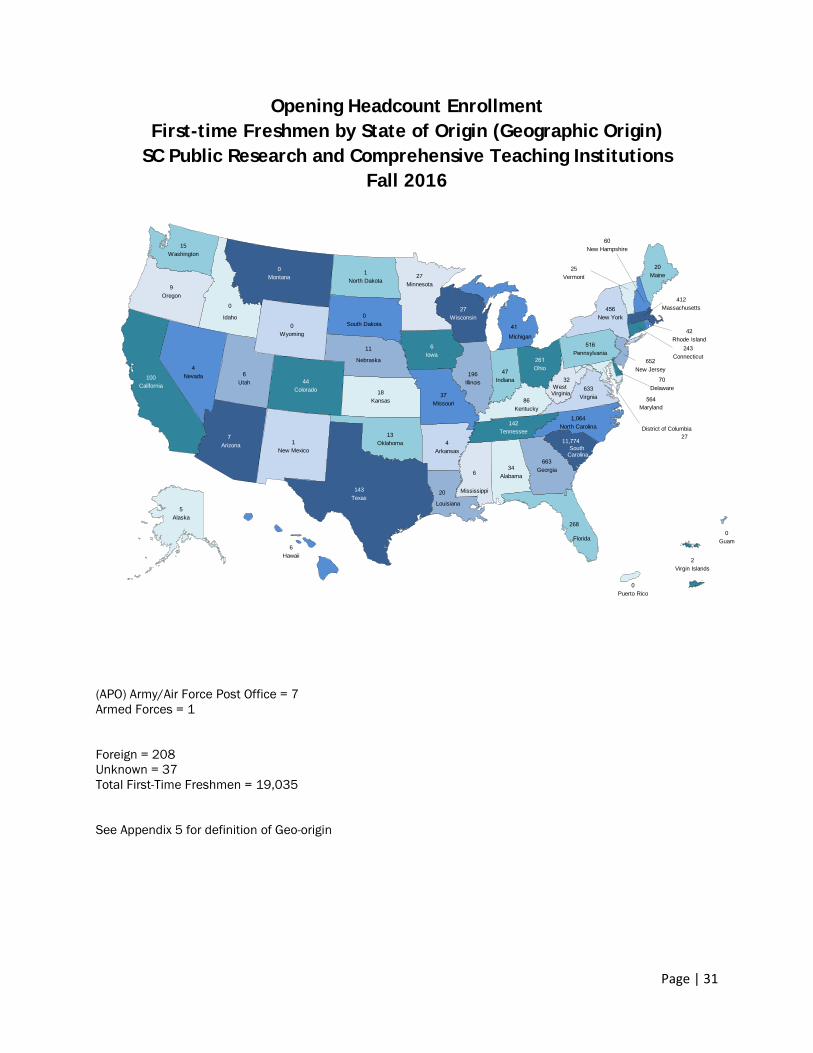
Opening Headcount Enrollment First-time Freshmen by State of Origin (Geographic Origin)
SC Public Research and Comprehensive Teaching Institutions Fall 2016
(APO) Army/Air Force Post Office = 7 Armed Forces = 1
Foreign = 208 Unknown = 37 Total First-Time Freshmen = 19,035
See Appendix 5 for definition of Geo-origin
1North Dakota
0Puerto Rico
0Wyoming
0Guam
0Montana
0South Dakota
2Virgin Islands
0
Idaho
5Alaska
6Iowa
11
Nebraska4
Nevada 6Utah
1New Mexico
9Oregon
4Arkansas
6Hawaii
6
Mississippi
13Oklahoma
18Kansas
15Washington
7Arizona
27District of Columbia
27Minnesota
20
Louisiana
27Wisconsin
47Indiana
25Vermont
37Missouri
32West
Virginia
20Maine
34Alabama
44Colorado
60New Hampshire
41Michigan
42Rhode Island
70Delaware
86Kentucky
100California
143Texas
142Tennessee
196Illinois
243Connecticut261
Ohio
268
Florida
412Massachusetts456
New York
516Pennsylvania
652New Jersey
633Virgnia 564
Maryland
663Georgia
1,064North Carolina
11,774South
Carolina
Page | 32
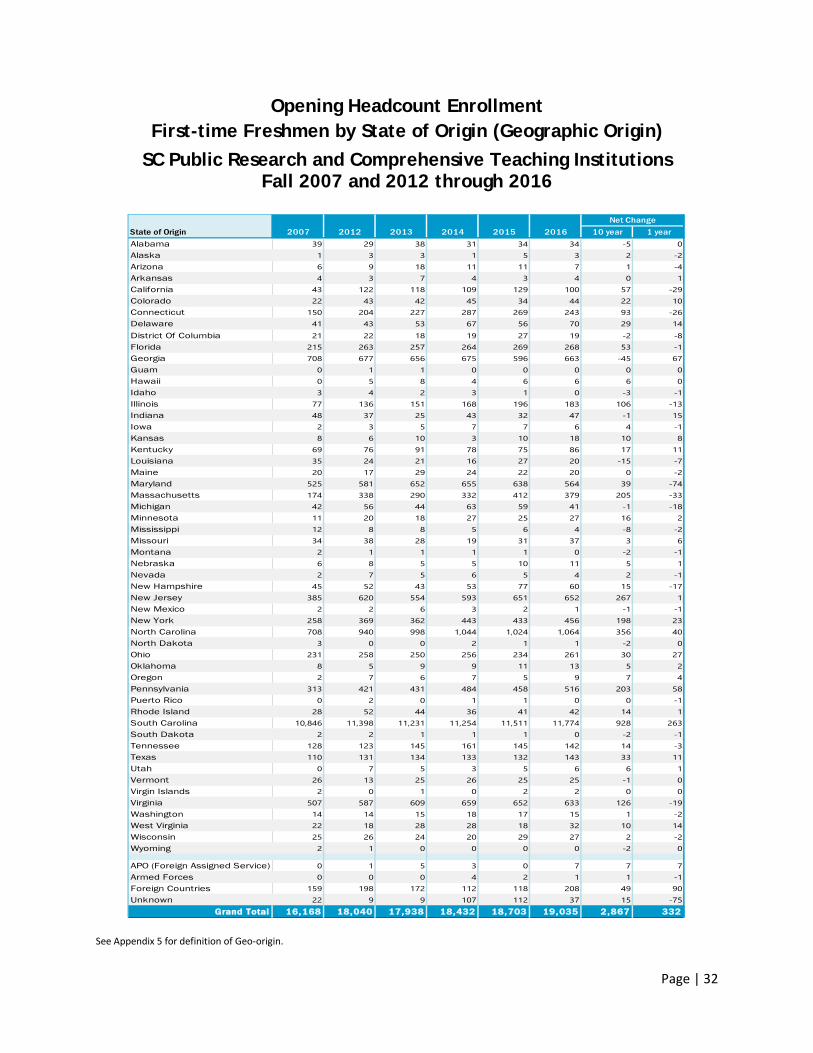
Opening Headcount Enrollment First-time Freshmen by State of Origin (Geographic Origin)
SC Public Research and Comprehensive Teaching Institutions Fall 2007 and 2012 through 2016
See Appendix 5 for definition of Geo-origin.
10 year 1 yearAlabama 39 29 38 31 34 34 -5 0Alaska 1 3 3 1 5 3 2 -2Arizona 6 9 18 11 11 7 1 -4Arkansas 4 3 7 4 3 4 0 1California 43 122 118 109 129 100 57 -29Colorado 22 43 42 45 34 44 22 10Connecticut 150 204 227 287 269 243 93 -26Delaware 41 43 53 67 56 70 29 14District Of Columbia 21 22 18 19 27 19 -2 -8Florida 215 263 257 264 269 268 53 -1Georgia 708 677 656 675 596 663 -45 67Guam 0 1 1 0 0 0 0 0Hawaii 0 5 8 4 6 6 6 0Idaho 3 4 2 3 1 0 -3 -1Illinois 77 136 151 168 196 183 106 -13Indiana 48 37 25 43 32 47 -1 15Iowa 2 3 5 7 7 6 4 -1Kansas 8 6 10 3 10 18 10 8Kentucky 69 76 91 78 75 86 17 11Louisiana 35 24 21 16 27 20 -15 -7Maine 20 17 29 24 22 20 0 -2Maryland 525 581 652 655 638 564 39 -74Massachusetts 174 338 290 332 412 379 205 -33Michigan 42 56 44 63 59 41 -1 -18Minnesota 11 20 18 27 25 27 16 2Mississippi 12 8 8 5 6 4 -8 -2Missouri 34 38 28 19 31 37 3 6Montana 2 1 1 1 1 0 -2 -1Nebraska 6 8 5 5 10 11 5 1Nevada 2 7 5 6 5 4 2 -1New Hampshire 45 52 43 53 77 60 15 -17New Jersey 385 620 554 593 651 652 267 1New Mexico 2 2 6 3 2 1 -1 -1New York 258 369 362 443 433 456 198 23North Carolina 708 940 998 1,044 1,024 1,064 356 40North Dakota 3 0 0 2 1 1 -2 0Ohio 231 258 250 256 234 261 30 27Oklahoma 8 5 9 9 11 13 5 2Oregon 2 7 6 7 5 9 7 4Pennsylvania 313 421 431 484 458 516 203 58Puerto Rico 0 2 0 1 1 0 0 -1Rhode Island 28 52 44 36 41 42 14 1South Carolina 10,846 11,398 11,231 11,254 11,511 11,774 928 263South Dakota 2 2 1 1 1 0 -2 -1Tennessee 128 123 145 161 145 142 14 -3Texas 110 131 134 133 132 143 33 11Utah 0 7 5 3 5 6 6 1Vermont 26 13 25 26 25 25 -1 0Virgin Islands 2 0 1 0 2 2 0 0Virginia 507 587 609 659 652 633 126 -19Washington 14 14 15 18 17 15 1 -2West Virginia 22 18 28 28 18 32 10 14Wisconsin 25 26 24 20 29 27 2 -2Wyoming 2 1 0 0 0 0 -2 0
APO (Foreign Assigned Service) 0 1 5 3 0 7 7 7Armed Forces 0 0 0 4 2 1 1 -1Foreign Countries 159 198 172 112 118 208 49 90Unknown 22 9 9 107 112 37 15 -75
Grand Total 16,168 18,040 17,938 18,432 18,703 19,035 2,867 332
Net ChangeState of Origin 2007 2012 2013 2014 2015 2016
Page | 33
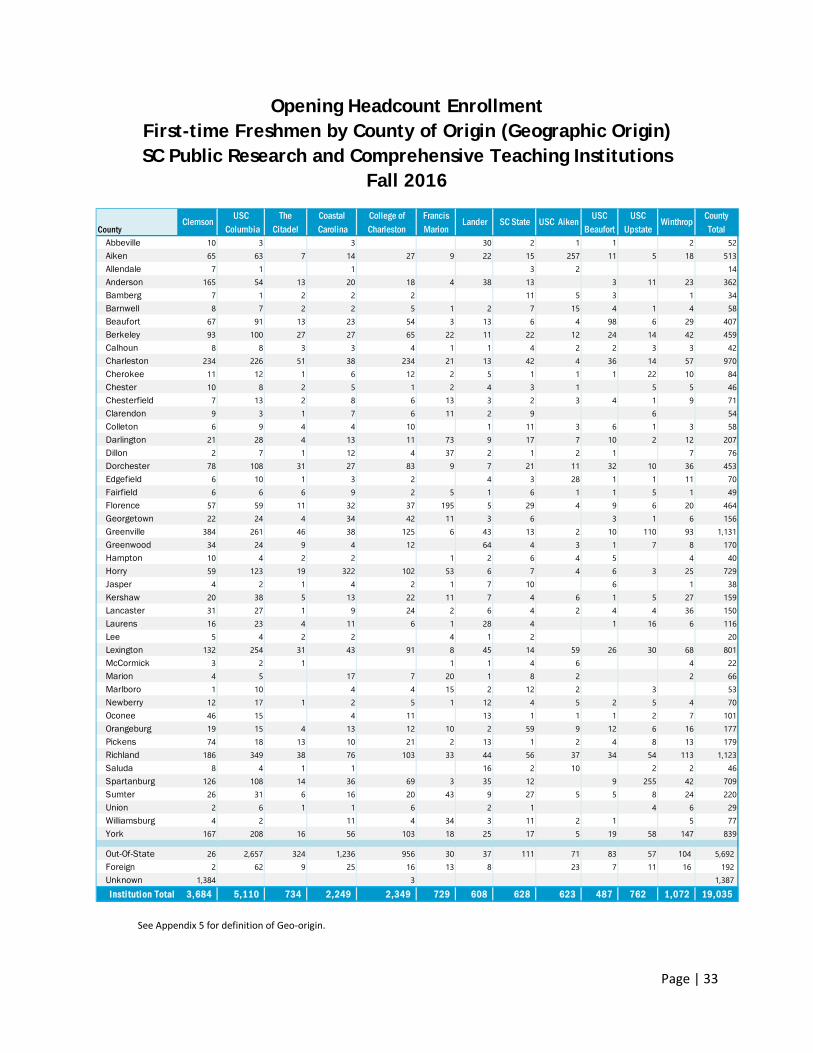
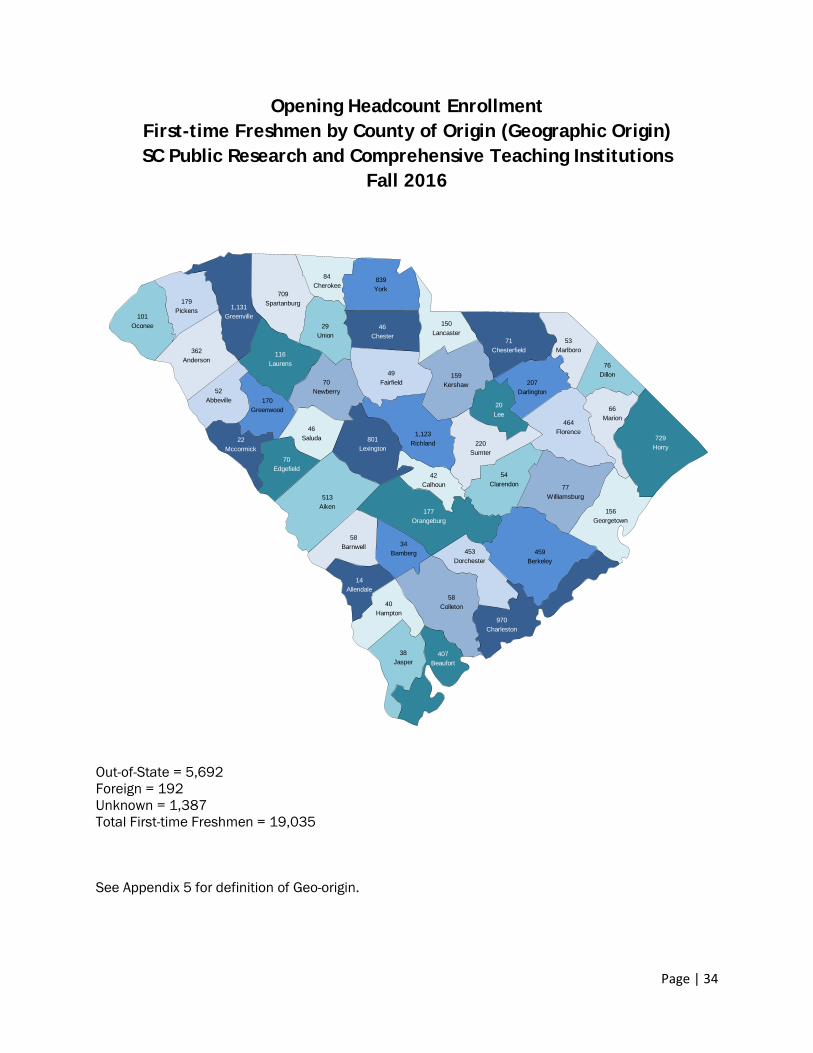
Opening Headcount Enrollment First-time Freshmen by County of Origin (Geographic Origin) SC Public Research and Comprehensive Teaching Institutions
Fall 2016
See Appendix 5 for definition of Geo-origin.
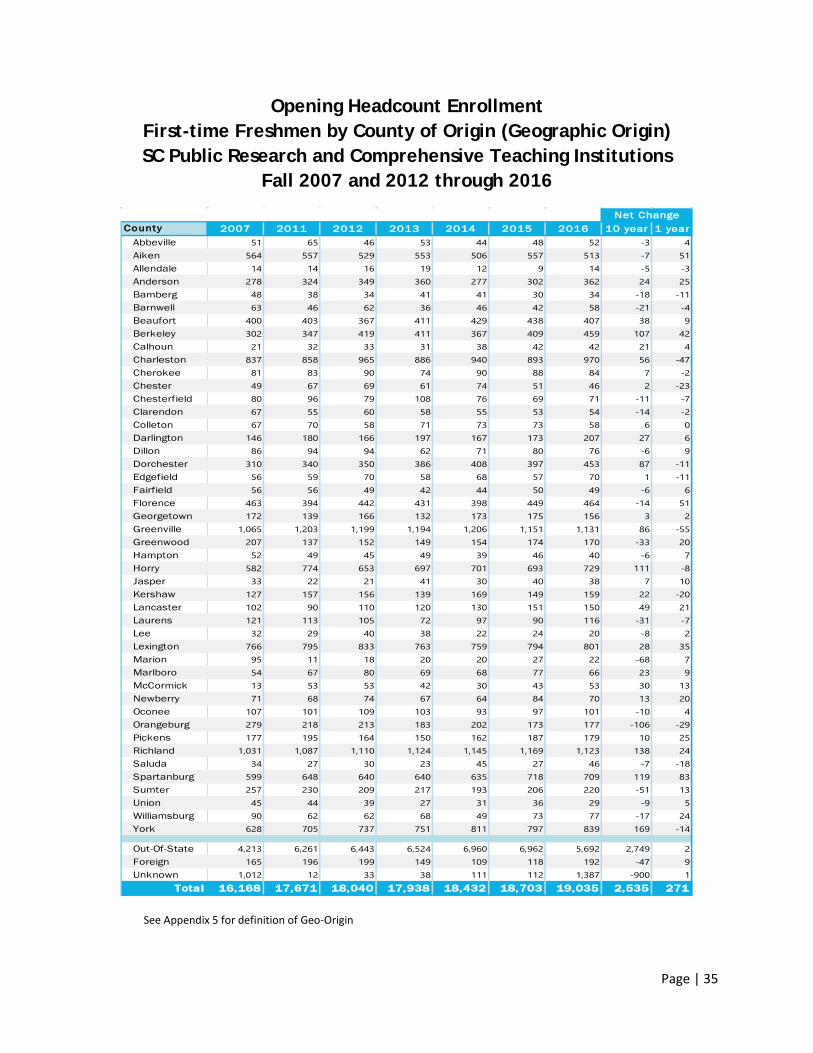
Abbeville 10 3 3 30 2 1 1 2 52Aiken 65 63 7 14 27 9 22 15 257 11 5 18 513Allendale 7 1 1 3 2 14Anderson 165 54 13 20 18 4 38 13 3 11 23 362Bamberg 7 1 2 2 2 11 5 3 1 34Barnwell 8 7 2 2 5 1 2 7 15 4 1 4 58Beaufort 67 91 13 23 54 3 13 6 4 98 6 29 407Berkeley 93 100 27 27 65 22 11 22 12 24 14 42 459Calhoun 8 8 3 3 4 1 1 4 2 2 3 3 42Charleston 234 226 51 38 234 21 13 42 4 36 14 57 970Cherokee 11 12 1 6 12 2 5 1 1 1 22 10 84Chester 10 8 2 5 1 2 4 3 1 5 5 46Chesterfield 7 13 2 8 6 13 3 2 3 4 1 9 71Clarendon 9 3 1 7 6 11 2 9 6 54Colleton 6 9 4 4 10 1 11 3 6 1 3 58Darlington 21 28 4 13 11 73 9 17 7 10 2 12 207Dillon 2 7 1 12 4 37 2 1 2 1 7 76Dorchester 78 108 31 27 83 9 7 21 11 32 10 36 453Edgefield 6 10 1 3 2 4 3 28 1 1 11 70Fairfield 6 6 6 9 2 5 1 6 1 1 5 1 49Florence 57 59 11 32 37 195 5 29 4 9 6 20 464Georgetown 22 24 4 34 42 11 3 6 3 1 6 156Greenville 384 261 46 38 125 6 43 13 2 10 110 93 1,131Greenwood 34 24 9 4 12 64 4 3 1 7 8 170Hampton 10 4 2 2 1 2 6 4 5 4 40Horry 59 123 19 322 102 53 6 7 4 6 3 25 729Jasper 4 2 1 4 2 1 7 10 6 1 38Kershaw 20 38 5 13 22 11 7 4 6 1 5 27 159Lancaster 31 27 1 9 24 2 6 4 2 4 4 36 150Laurens 16 23 4 11 6 1 28 4 1 16 6 116Lee 5 4 2 2 4 1 2 20Lexington 132 254 31 43 91 8 45 14 59 26 30 68 801McCormick 3 2 1 1 1 4 6 4 22Marion 4 5 17 7 20 1 8 2 2 66Marlboro 1 10 4 4 15 2 12 2 3 53Newberry 12 17 1 2 5 1 12 4 5 2 5 4 70Oconee 46 15 4 11 13 1 1 1 2 7 101Orangeburg 19 15 4 13 12 10 2 59 9 12 6 16 177Pickens 74 18 13 10 21 2 13 1 2 4 8 13 179Richland 186 349 38 76 103 33 44 56 37 34 54 113 1,123Saluda 8 4 1 1 16 2 10 2 2 46Spartanburg 126 108 14 36 69 3 35 12 9 255 42 709Sumter 26 31 6 16 20 43 9 27 5 5 8 24 220Union 2 6 1 1 6 2 1 4 6 29Williamsburg 4 2 11 4 34 3 11 2 1 5 77York 167 208 16 56 103 18 25 17 5 19 58 147 839
Out-Of-State 26 2,657 324 1,236 956 30 37 111 71 83 57 104 5,692 Foreign 2 62 9 25 16 13 8 23 7 11 16 192 Unknown 1,384 3 1,387
Insti tution Total 3,684 5,110 734 2,249 2,349 729 608 628 623 487 762 1,072 19,035
CountyClemson Lander WinthropUSC
ColumbiaThe
CitadelCoastal
CarolinaCollege ofCharleston
FrancisMarion
SC State USC Aiken CountyTotal
USC Beaufort
USC Upstate
Page | 34
Opening Headcount Enrollment First-time Freshmen by County of Origin (Geographic Origin) SC Public Research and Comprehensive Teaching Institutions
Fall 2016
Out-of-State = 5,692 Foreign = 192 Unknown = 1,387 Total First-time Freshmen = 19,035
See Appendix 5 for definition of Geo-origin.
14Allendale
66Marion
46Saluda
29Union
42Calhoun
58Barnwell
20Lee
34Bamberg
38Jasper
49Fairfield
22Mccormick
40Hampton
52Abbeville
54Clarendon
70Edgefield
46Chester
76Dillon
70Newberry
77Williamsburg
53Marlboro
58Colleton
116Laurens
84Cherokee
101Oconee
71Chesterfield
150Lancaster
156Georgetown
159Kershaw
170Greenwood
179Pickens
177Orangeburg
207Darlington
220Sumter
362Anderson
453Dorchester
407Beaufort
459Berkeley
464Florence
513Aiken
709Spartanburg
729Horry
839York
801Lexington
970Charleston
1,123Richland
1,131Greenville
Page | 35
Opening Headcount Enrollment First-time Freshmen by County of Origin (Geographic Origin) SC Public Research and Comprehensive Teaching Institutions
Fall 2007 and 2012 through 2016
See Appendix 5 for definition of Geo-Origin
County 2007 2011 2012 2013 2014 2015 2016 10 year 1 yearAbbeville 51 65 46 53 44 48 52 -3 4Aiken 564 557 529 553 506 557 513 -7 51Allendale 14 14 16 19 12 9 14 -5 -3Anderson 278 324 349 360 277 302 362 24 25Bamberg 48 38 34 41 41 30 34 -18 -11Barnwell 63 46 62 36 46 42 58 -21 -4Beaufort 400 403 367 411 429 438 407 38 9Berkeley 302 347 419 411 367 409 459 107 42Calhoun 21 32 33 31 38 42 42 21 4Charleston 837 858 965 886 940 893 970 56 -47Cherokee 81 83 90 74 90 88 84 7 -2Chester 49 67 69 61 74 51 46 2 -23Chesterfield 80 96 79 108 76 69 71 -11 -7Clarendon 67 55 60 58 55 53 54 -14 -2Colleton 67 70 58 71 73 73 58 6 0Darlington 146 180 166 197 167 173 207 27 6Dillon 86 94 94 62 71 80 76 -6 9Dorchester 310 340 350 386 408 397 453 87 -11Edgefield 56 59 70 58 68 57 70 1 -11Fairfield 56 56 49 42 44 50 49 -6 6Florence 463 394 442 431 398 449 464 -14 51Georgetown 172 139 166 132 173 175 156 3 2Greenville 1,065 1,203 1,199 1,194 1,206 1,151 1,131 86 -55Greenwood 207 137 152 149 154 174 170 -33 20Hampton 52 49 45 49 39 46 40 -6 7Horry 582 774 653 697 701 693 729 111 -8Jasper 33 22 21 41 30 40 38 7 10Kershaw 127 157 156 139 169 149 159 22 -20Lancaster 102 90 110 120 130 151 150 49 21Laurens 121 113 105 72 97 90 116 -31 -7Lee 32 29 40 38 22 24 20 -8 2Lexington 766 795 833 763 759 794 801 28 35Marion 95 11 18 20 20 27 22 -68 7Marlboro 54 67 80 69 68 77 66 23 9McCormick 13 53 53 42 30 43 53 30 13Newberry 71 68 74 67 64 84 70 13 20Oconee 107 101 109 103 93 97 101 -10 4Orangeburg 279 218 213 183 202 173 177 -106 -29Pickens 177 195 164 150 162 187 179 10 25Richland 1,031 1,087 1,110 1,124 1,145 1,169 1,123 138 24Saluda 34 27 30 23 45 27 46 -7 -18Spartanburg 599 648 640 640 635 718 709 119 83Sumter 257 230 209 217 193 206 220 -51 13Union 45 44 39 27 31 36 29 -9 5Williamsburg 90 62 62 68 49 73 77 -17 24York 628 705 737 751 811 797 839 169 -14
Out-Of-State 4,213 6,261 6,443 6,524 6,960 6,962 5,692 2,749 2Foreign 165 196 199 149 109 118 192 -47 9Unknown 1,012 12 33 38 111 112 1,387 -900 1
Total 16,168 17,671 18,040 17,938 18,432 18,703 19,035 2,535 271
Net Change
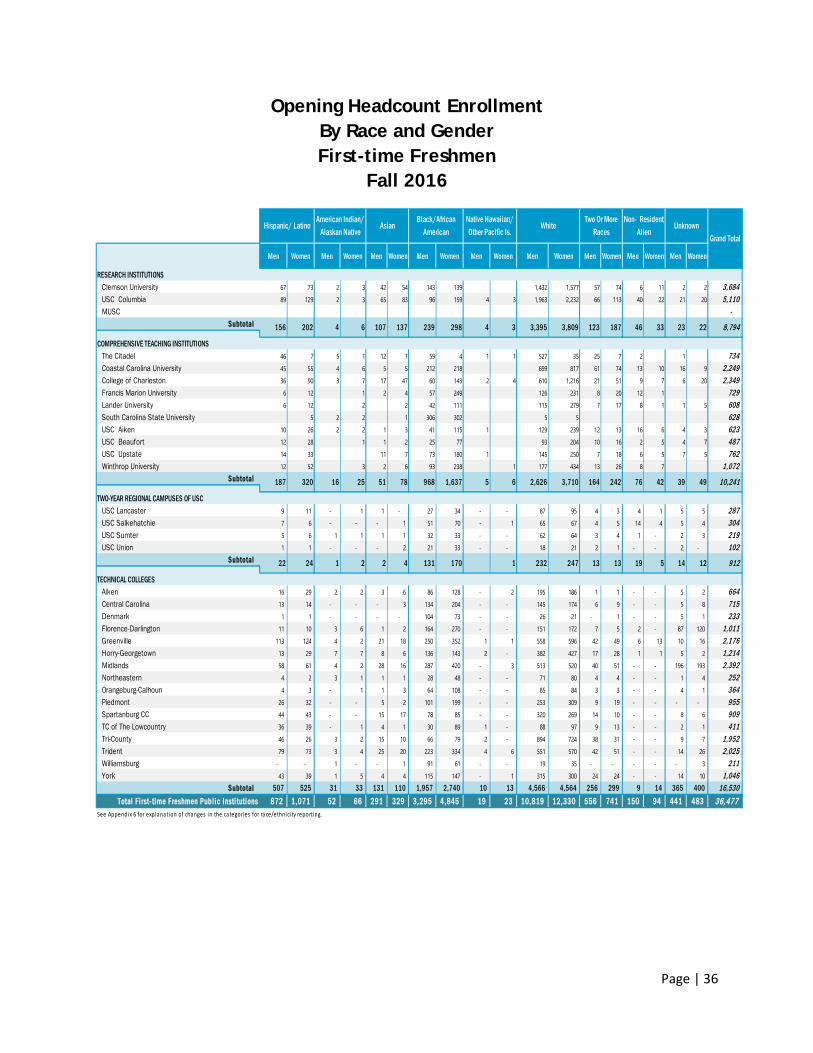
Page | 36
Opening Headcount Enrollment By Race and Gender First-time Freshmen
Fall 2016
Men Women Men Women Men Women Men Women Men Women Men Women Men Women Men Women Men Women
Clemson University 67 73 2 3 42 54 143 139 1,432 1,577 57 74 6 11 2 2 3,684 USC Columbia 89 129 2 3 65 83 96 159 4 3 1,963 2,232 66 113 40 22 21 20 5,110 MUSC -
Subtotal
The Citadel 46 7 5 1 12 1 59 4 1 1 527 35 25 7 2 1 734 Coastal Carolina University 45 55 4 6 5 5 212 218 699 817 61 74 13 10 16 9 2,249 College of Charleston 36 90 3 7 17 47 60 143 2 4 610 1,216 21 51 9 7 6 20 2,349 Francis Marion University 6 12 1 2 4 57 249 126 231 8 20 12 1 729 Lander University 6 12 2 2 42 111 115 279 7 17 8 1 1 5 608 South Carolina State University 5 2 2 1 306 302 5 5 628 USC Aiken 10 26 2 2 1 3 41 115 1 129 239 12 13 16 6 4 3 623 USC Beaufort 12 28 1 1 2 25 77 93 204 10 16 2 5 4 7 487 USC Upstate 14 33 11 7 73 180 1 145 250 7 18 6 5 7 5 762 Winthrop University 12 52 3 2 6 93 238 1 177 434 13 26 8 7 1,072
Subtotal
USC Lancaster 9 11 - 1 1 - 27 34 - - 87 95 4 3 4 1 5 5 287 USC Salkehatchie 7 6 - - - 1 51 70 - 1 65 67 4 5 14 4 5 4 304 USC Sumter 5 6 1 1 1 1 32 33 - - 62 64 3 4 1 - 2 3 219 USC Union 1 1 - - - 2 21 33 - - 18 21 2 1 - - 2 - 102
Subtotal
Aiken 16 29 2 2 3 6 86 128 - 2 195 186 1 1 - - 5 2 664 Central Carolina 13 14 - - - 3 134 204 - - 145 174 6 9 - - 5 8 715 Denmark 1 1 - - - - 104 73 - - 26 21 - 1 - - 5 1 233 Florence-Darlington 11 10 3 6 1 2 164 270 - - 151 172 7 5 2 - 87 120 1,011 Greenville 113 124 4 2 21 18 250 352 1 1 558 596 42 49 6 13 10 16 2,176 Horry-Georgetown 13 29 7 7 8 6 136 143 2 - 382 427 17 28 1 1 5 2 1,214 Midlands 58 61 4 2 28 16 287 420 - 3 513 520 40 51 - - 196 193 2,392 Northeastern 4 2 3 1 1 1 28 48 - - 71 80 4 4 - - 1 4 252 Orangeburg-Calhoun 4 3 - 1 1 3 64 108 - - 85 84 3 3 - - 4 1 364 Piedmont 26 32 - - 5 2 101 199 - - 253 309 9 19 - - - - 955 Spartanburg CC 44 43 - - 15 17 78 85 - - 320 269 14 10 - - 8 6 909 TC of The Lowcountry 36 39 - 1 4 1 30 89 1 - 88 97 9 13 - - 2 1 411 Tri-County 46 26 3 2 15 10 66 79 2 - 894 724 38 31 - - 9 7 1,952 Trident 79 73 3 4 25 20 223 334 4 6 551 570 42 51 - - 14 26 2,025 Williamsburg - - 1 - - 1 91 61 - - 19 35 - - - - - 3 211 York 43 39 1 5 4 4 115 147 - 1 315 300 24 24 - - 14 10 1,046
Subtotal 507 525 31 33 131 110 1,957 2,740 10 13 4,566 4,564 256 299 9 14 365 400 16,530 Total Fi rst-time Freshmen Publ ic Insti tutions 872 1,071 52 66 291 329 3,295 4,845 19 23 10,819 12,330 556 741 150 94 441 483 36,477
See Appendix 6 for explanation of changes in the categories for race/ethnici ty reporting.
10,241
912
2,626
12
8,79446
13
COMPREHENSIVE TEACHING INSTITUTIONS
187 320 16 25 51 78 968 1,637 5 6
TECHNICAL COLLEGES
TWO-YEAR REGIONAL CAMPUSES OF USC
22 24 1 2 2
Asian
23 22
76 42 39 49
19 5 14
3,710 164 242
247 13
156 202 4 6 107 137 239
UnknownNon- Resident
AlienTwo Or More
RacesWhite
Black/African American
American Indian/ Alaskan Native
Hispanic/ LatinoNative Hawaiian/ Other Pacific Is.
Grand Total
RESEARCH INSTITUTIONS
298 4 3 3,395 333,809 123 187
4 131 170 1 232
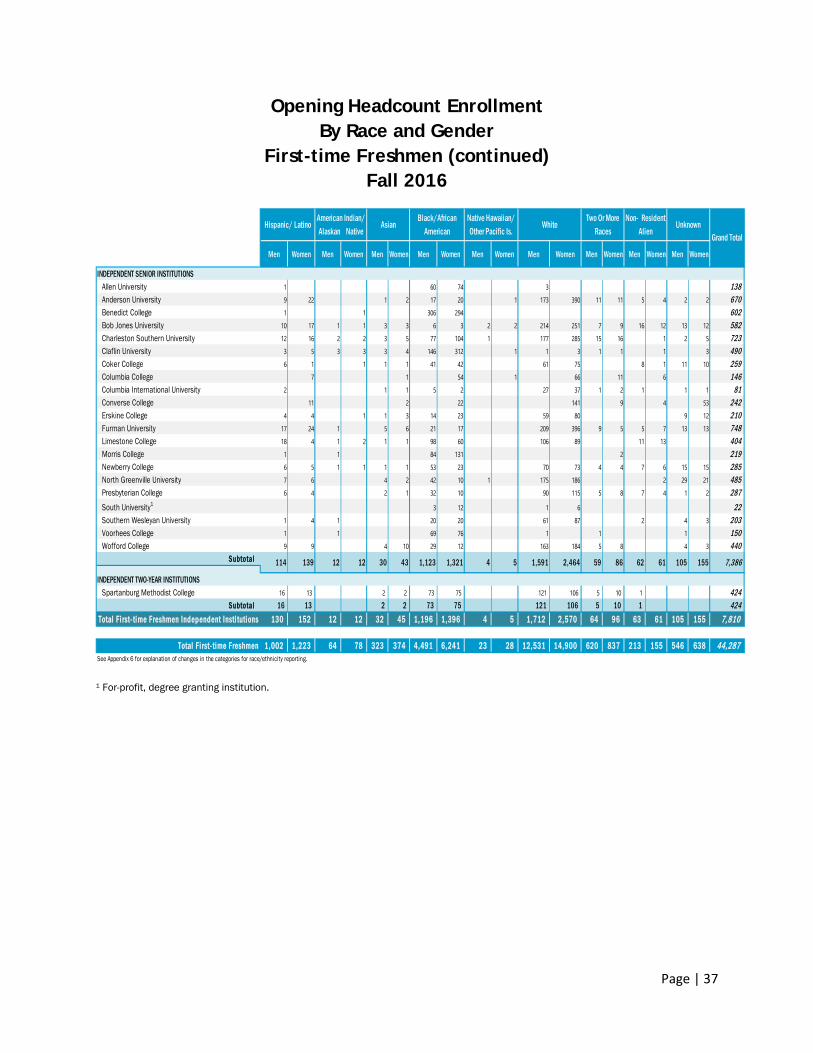
Page | 37
Opening Headcount Enrollment By Race and Gender
First-time Freshmen (continued) Fall 2016
1 For-profit, degree granting institution.
Men Women Men Women Men Women Men Women Men Women Men Women Men Women Men Women Men Women
INDEPENDENT SENIOR INSTITUTIONSAllen University 1 60 74 3 138 Anderson University 9 22 1 2 17 20 1 173 390 11 11 5 4 2 2 670 Benedict College 1 1 306 294 602 Bob Jones University 10 17 1 1 3 3 6 3 2 2 214 251 7 9 16 12 13 12 582 Charleston Southern University 12 16 2 2 3 5 77 104 1 177 285 15 16 1 2 5 723 Claflin University 3 5 3 3 3 4 146 312 1 1 3 1 1 1 3 490 Coker College 6 1 1 1 1 41 42 61 75 8 1 11 10 259 Columbia College 7 1 54 1 66 11 6 146 Columbia International University 2 1 1 5 2 27 37 1 2 1 1 1 81 Converse College 11 2 22 141 9 4 53 242 Erskine College 4 4 1 1 3 14 23 59 80 9 12 210 Furman University 17 24 1 5 6 21 17 209 396 9 5 5 7 13 13 748 Limestone College 18 4 1 2 1 1 98 60 106 89 11 13 404 Morris College 1 1 84 131 2 219 Newberry College 6 5 1 1 1 1 53 23 70 73 4 4 7 6 15 15 285 North Greenville University 7 6 4 2 42 10 1 175 186 2 29 21 485 Presbyterian College 6 4 2 1 32 10 90 115 5 8 7 4 1 2 287 South University1 3 12 1 6 22 Southern Wesleyan University 1 4 1 20 20 61 87 2 4 3 203 Voorhees College 1 1 69 76 1 1 1 150 Wofford College 9 9 4 10 29 12 163 184 5 8 4 3 440
Subtotal
Spartanburg Methodist College 16 13 2 2 73 75 121 106 5 10 1 424 Subtotal 16 13 2 2 73 75 121 106 5 10 1 424
Total Fi rst-time Freshmen Independent Insti tutions 130 152 12 12 32 45 1,196 1,396 4 5 1,712 2,570 64 96 63 61 105 155 7,810
Total Fi rst-time Freshmen 1,002 1,223 64 78 323 374 4,491 6,241 23 28 12,531 14,900 620 837 213 155 546 638 44,287 See Appendix 6 for explanation of changes in the categories for race/ethnicity reporting.
61 105 155 7,386
INDEPENDENT TWO-YEAR INSTITUTIONS
114 139 12 12 30 43 1,123 1,321 4 5 1,591 2,464 59 86 62
Native Hawaiian/ Other Pacific Is.
WhiteTwo Or More
RacesNon- Resident
AlienUnknownHispanic/ Latino
American Indian/ Alaskan Native
AsianBlack/African
American Grand Total
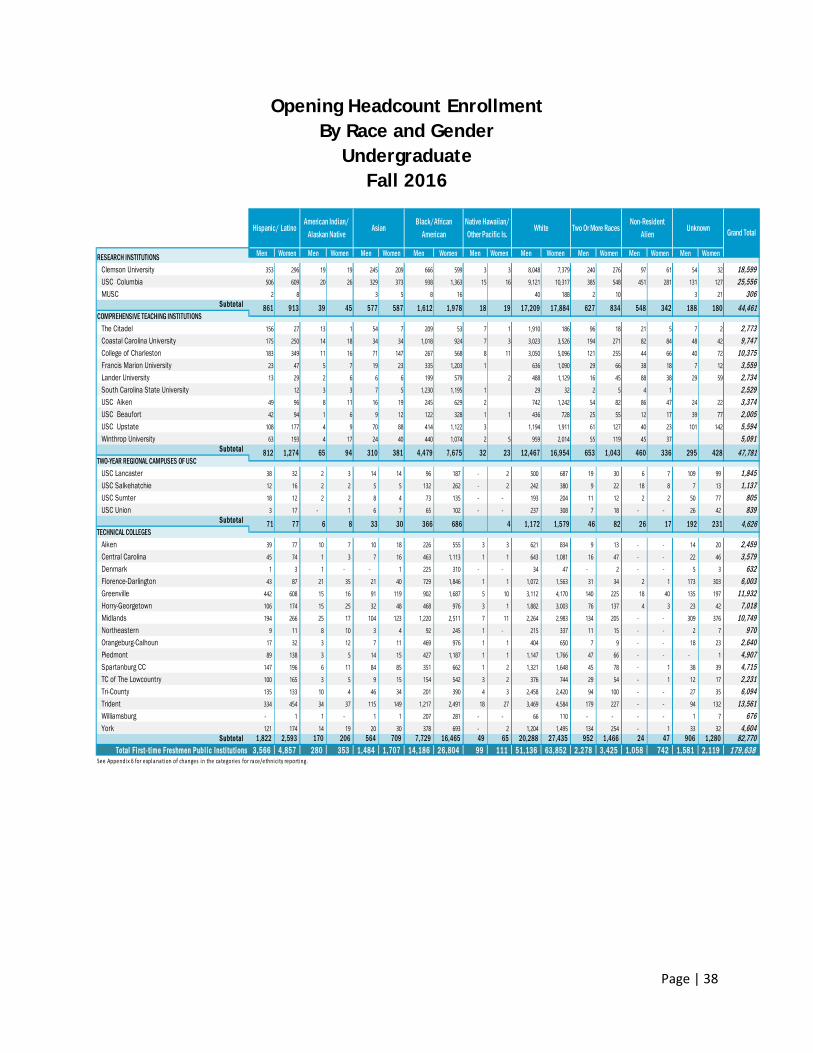
Page | 38
Opening Headcount Enrollment By Race and Gender
Undergraduate Fall 2016
Men Women Men Women Men Women Men Women Men Women Men Women Men Women Men Women Men Women
Clemson University 353 296 19 19 245 209 666 599 3 3 8,048 7,379 240 276 97 61 54 32 18,599 USC Columbia 506 609 20 26 329 373 938 1,363 15 16 9,121 10,317 385 548 451 281 131 127 25,556 MUSC 2 8 3 5 8 16 40 188 2 10 3 21 306
Subtotal
The Citadel 156 27 13 1 54 7 209 53 7 1 1,910 186 96 18 21 5 7 2 2,773 Coastal Carolina University 175 250 14 18 34 34 1,018 924 7 3 3,023 3,526 194 271 82 84 48 42 9,747 College of Charleston 183 349 11 16 71 147 267 568 8 11 3,050 5,096 121 255 44 66 40 72 10,375 Francis Marion University 23 47 5 7 19 23 335 1,203 1 636 1,090 29 66 38 18 7 12 3,559 Lander University 13 29 2 6 6 6 199 579 2 488 1,129 16 45 88 38 29 59 2,734 South Carolina State University 12 3 3 7 5 1,230 1,195 1 29 32 2 5 4 1 2,529 USC Aiken 49 96 8 11 16 19 245 629 2 742 1,242 54 82 86 47 24 22 3,374 USC Beaufort 42 94 1 6 9 12 122 328 1 1 436 728 25 55 12 17 39 77 2,005 USC Upstate 108 177 4 9 70 88 414 1,122 3 1,194 1,911 61 127 40 23 101 142 5,594 Winthrop University 63 193 4 17 24 40 440 1,074 2 5 959 2,014 55 119 45 37 5,091
Subtotal
USC Lancaster 38 32 2 3 14 14 96 187 - 2 500 687 19 30 6 7 109 99 1,845 USC Salkehatchie 12 16 2 2 5 5 132 262 - 2 242 380 9 22 18 8 7 13 1,137 USC Sumter 18 12 2 2 8 4 73 135 - - 193 204 11 12 2 2 50 77 805 USC Union 3 17 - 1 6 7 65 102 - - 237 308 7 18 - - 26 42 839
Subtotal
Aiken 39 77 10 7 10 18 226 555 3 3 621 834 9 13 - - 14 20 2,459 Central Carolina 45 74 1 3 7 16 463 1,113 1 1 643 1,081 16 47 - - 22 46 3,579 Denmark 1 3 1 - - 1 225 310 - - 34 47 - 2 - - 5 3 632 Florence-Darlington 43 87 21 35 21 40 729 1,846 1 1 1,072 1,563 31 34 2 1 173 303 6,003 Greenville 442 608 15 16 91 119 902 1,687 5 10 3,112 4,170 140 225 18 40 135 197 11,932 Horry-Georgetown 106 174 15 25 32 48 468 976 3 1 1,882 3,003 76 137 4 3 23 42 7,018 Midlands 194 266 25 17 104 123 1,220 2,511 7 11 2,264 2,983 134 205 - - 309 376 10,749 Northeastern 9 11 8 10 3 4 92 245 1 - 215 337 11 15 - - 2 7 970 Orangeburg-Calhoun 17 32 3 12 7 11 469 976 1 1 404 650 7 9 - - 18 23 2,640 Piedmont 89 138 3 5 14 15 427 1,187 1 1 1,147 1,766 47 66 - - - 1 4,907 Spartanburg CC 147 196 6 11 84 85 351 662 1 2 1,321 1,648 45 78 - 1 38 39 4,715 TC of The Lowcountry 100 165 3 5 9 15 154 542 3 2 376 744 29 54 - 1 12 17 2,231 Tri-County 135 133 10 4 46 34 201 390 4 3 2,458 2,420 94 100 - - 27 35 6,094 Trident 334 454 34 37 115 149 1,217 2,491 18 27 3,469 4,584 179 227 - - 94 132 13,561 Williamsburg - 1 1 - 1 1 207 281 - - 66 110 - - - - 1 7 676 York 121 174 14 19 20 30 378 693 - 2 1,204 1,495 134 254 - 1 33 32 4,604
Subtotal 1,822 2,593 170 206 564 709 7,729 16,465 49 65 20,288 27,435 952 1,466 24 47 906 1,280 82,770 Total Fi rst-time Freshmen Publ ic Insti tutions 3,566 4,857 280 353 1,484 1,707 14,186 26,804 99 111 51,136 63,852 2,278 3,425 1,058 742 1,581 2,119 179,638
See Appendix 6 for explanation of changes in the categories for race/ethnici ty reporting.
47,781
4,626231
295 428
Two Or More RacesNon-Resident
AlienUnknown
460 336
White
1,043TWO-YEAR REGIONAL CAMPUSES OF USC
71 77 6 8 30 366 686 4 1,172 1,579TECHNICAL COLLEGES
46 82 26 17 192
RESEARCH INSTITUTIONS
861 913 39 45 577 587 1,612 1,978 18 19 17,209 17,884 627 834COMPREHENSIVE TEACHING INSTITUTIONS
548 342 188 180
Grand Total
44,461
Hispanic/ LatinoAmerican Indian/
Alaskan NativeAsian
Black/African American
Native Hawaiian/ Other Pacific Is.
812 1,274 65 94 310 381 4,479 7,675 32 23
33
12,467 16,954 653
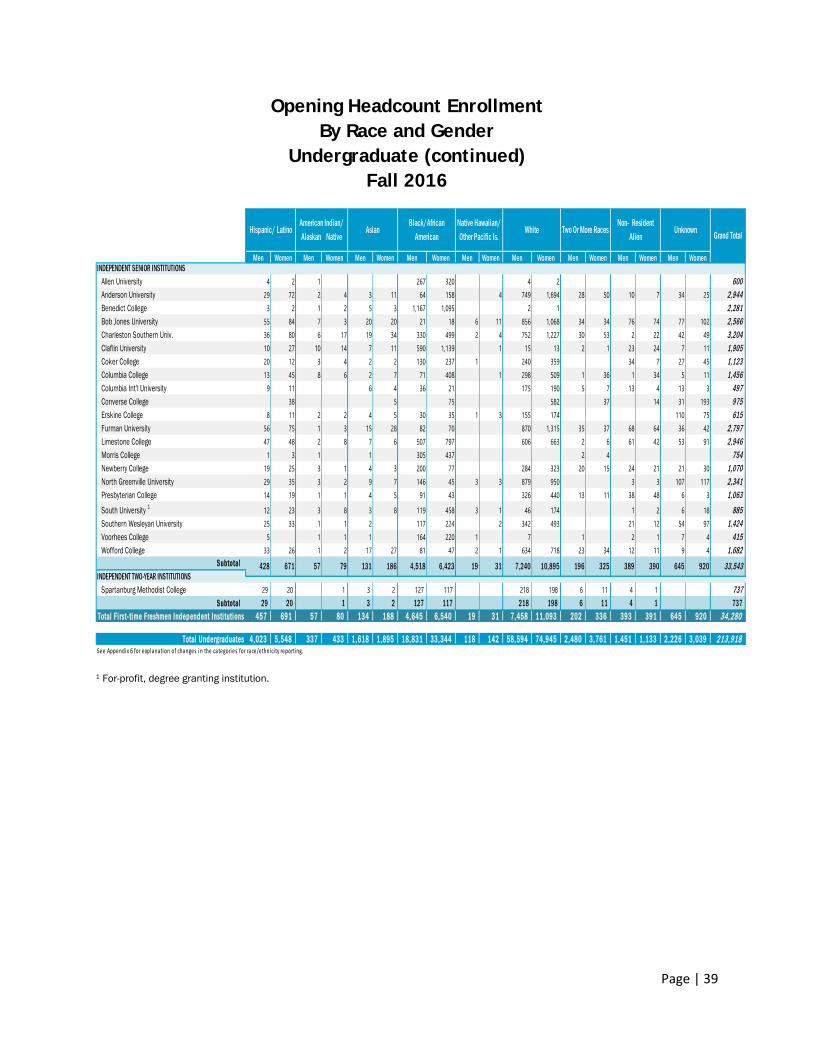
Page | 39
Opening Headcount Enrollment By Race and Gender
Undergraduate (continued) Fall 2016
1 For-profit, degree granting institution.
Men Women Men Women Men Women Men Women Men Women Men Women Men Women Men Women Men WomenINDEPENDENT SENIOR INSTITUTIONS
Allen University 4 2 1 267 320 4 2 600 Anderson University 29 72 2 4 3 11 64 158 4 749 1,694 28 50 10 7 34 25 2,944 Benedict College 3 2 1 2 5 3 1,167 1,095 2 1 2,281 Bob Jones University 55 84 7 3 20 20 21 18 6 11 856 1,068 34 34 76 74 77 102 2,566 Charleston Southern Univ. 36 80 6 17 19 34 330 499 2 4 752 1,227 30 53 2 22 42 49 3,204 Claflin University 10 27 10 14 7 11 590 1,139 1 15 13 2 1 23 24 7 11 1,905 Coker College 20 12 3 4 2 2 130 237 1 240 359 34 7 27 45 1,123 Columbia College 13 45 8 6 2 7 71 408 1 298 509 1 36 1 34 5 11 1,456 Columbia Int'l University 9 11 6 4 36 21 175 190 5 7 13 4 13 3 497 Converse College 38 5 75 582 37 14 31 193 975 Erskine College 8 11 2 2 4 5 30 35 1 3 155 174 110 75 615 Furman University 56 75 1 3 15 28 82 70 870 1,315 35 37 68 64 36 42 2,797 Limestone College 47 48 2 8 7 6 507 797 606 663 2 6 61 42 53 91 2,946 Morris College 1 3 1 1 305 437 2 4 754 Newberry College 19 25 3 1 4 3 200 77 284 323 20 15 24 21 21 30 1,070 North Greenville University 29 35 3 2 9 7 146 45 3 3 879 950 3 3 107 117 2,341 Presbyterian College 14 19 1 1 4 5 91 43 326 440 13 11 38 48 6 3 1,063 South University 1 12 23 3 8 3 8 119 458 3 1 46 174 1 2 6 18 885 Southern Wesleyan University 25 33 1 1 2 117 224 2 342 493 21 12 54 97 1,424 Voorhees College 5 1 1 1 164 220 1 7 1 2 1 7 4 415 Wofford College 33 26 1 2 17 27 81 47 2 1 634 718 23 34 12 11 9 4 1,682
Subtotal
Spartanburg Methodist College 29 20 1 3 2 127 117 218 198 6 11 4 1 737Subtotal 29 20 1 3 2 127 117 218 198 6 11 4 1 737
Total Fi rst-time Freshmen Independent Insti tutions 457 691 57 80 134 188 4,645 6,540 19 31 7,458 11,093 202 336 393 391 645 920 34,280
Total Undergraduates 4,023 5,548 337 433 1,618 1,895 18,831 33,344 118 142 58,594 74,945 2,480 3,761 1,451 1,133 2,226 3,039 213,918 See Appendix 6 for explanation of changes in the categories for race/ethnici ty reporting.
389 390 645 920 33,543INDEPENDENT TWO-YEAR INSTITUTIONS
428 671 57 79 131 186 4,518 6,423 19 31 7,240 10,895 196 325
Hispanic/ LatinoAmerican Indian/ Alaskan Native
AsianBlack/African
AmericanNative Hawaiian/ Other Pacific Is.
White Two Or More RacesNon- Resident
AlienUnknown Grand Total
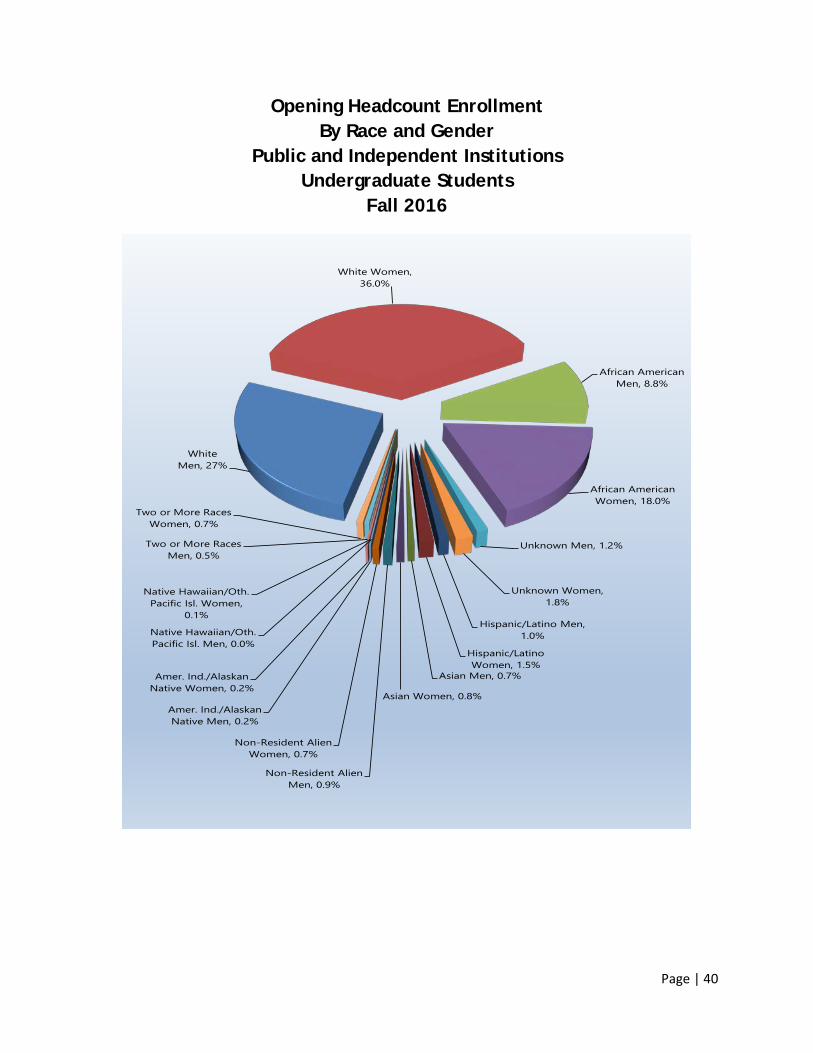
Page | 40
Opening Headcount Enrollment By Race and Gender
Public and Independent Institutions Undergraduate Students
Fall 2016
WhiteMen, 27%
White Women, 36.0%
African American Men, 8.8%
African American Women, 18.0%
Unknown Men, 1.2%
Unknown Women, 1.8%
Hispanic/Latino Men, 1.0%
Hispanic/Latino Women, 1.5%
Asian Men, 0.7%
Asian Women, 0.8%
Non-Resident Alien Men, 0.9%
Non-Resident Alien Women, 0.7%
Amer. Ind./Alaskan Native Men, 0.2%
Amer. Ind./Alaskan Native Women, 0.2%
Native Hawaiian/Oth. Pacific Isl. Men, 0.0%
Native Hawaiian/Oth. Pacific Isl. Women,
0.1%
Two or More Races Men, 0.5%
Two or More Races Women, 0.7%
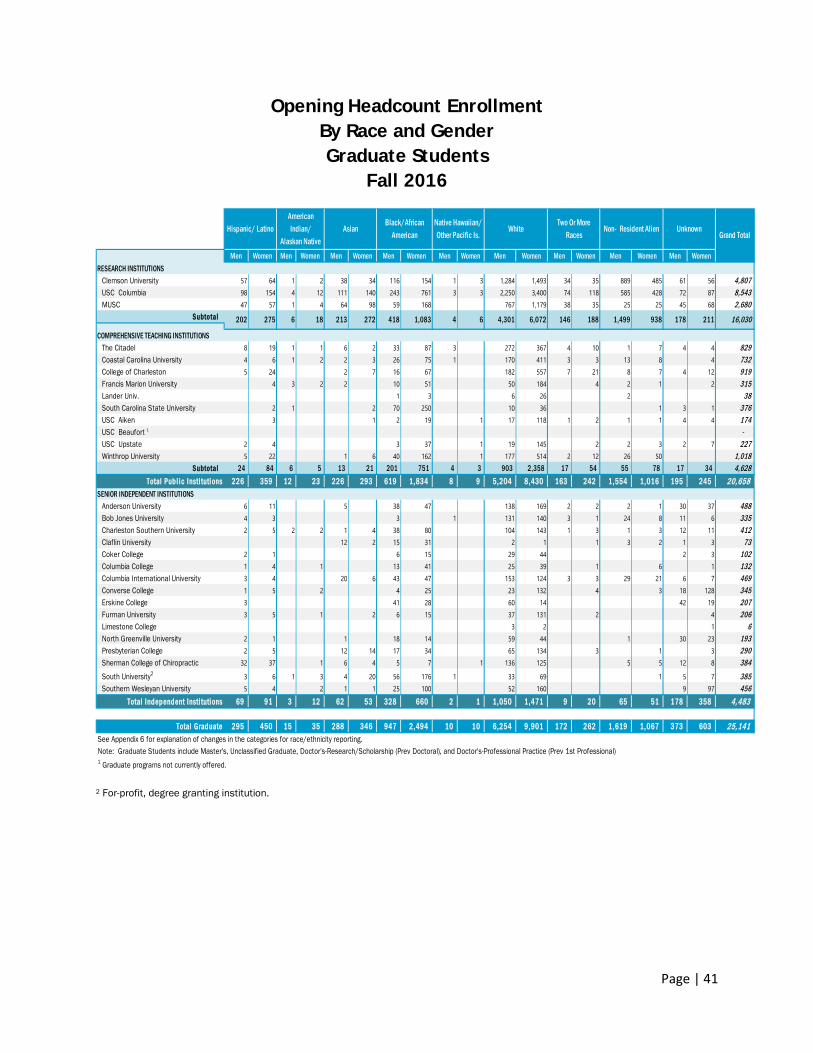
Page | 41
Opening Headcount Enrollment By Race and Gender Graduate Students
Fall 2016
2 For-profit, degree granting institution.
Men Women Men Women Men Women Men Women Men Women Men Women Men Women Men Women Men Women
Clemson University 57 64 1 2 38 34 116 154 1 3 1,284 1,493 34 35 889 485 61 56 4,807 USC Columbia 98 154 4 12 111 140 243 761 3 3 2,250 3,400 74 118 585 428 72 87 8,543 MUSC 47 57 1 4 64 98 59 168 767 1,179 38 35 25 25 45 68 2,680
Subtotal
The Citadel 8 19 1 1 6 2 33 87 3 272 367 4 10 1 7 4 4 829 Coastal Carolina University 4 6 1 2 2 3 26 75 1 170 411 3 3 13 8 4 732 College of Charleston 5 24 2 7 16 67 182 557 7 21 8 7 4 12 919 Francis Marion University 4 3 2 2 10 51 50 184 4 2 1 2 315 Lander Univ. 1 3 6 26 2 38 South Carolina State University 2 1 2 70 250 10 36 1 3 1 376 USC Aiken 3 1 2 19 1 17 118 1 2 1 1 4 4 174 USC Beaufort 1 - USC Upstate 2 4 3 37 1 19 145 2 2 3 2 7 227 Winthrop University 5 22 1 6 40 162 1 177 514 2 12 26 50 1,018
Subtotal 24 84 6 5 13 21 201 751 4 3 903 2,358 17 54 55 78 17 34 4,628 Total Publ ic Insti tutions 226 359 12 23 226 293 619 1,834 8 9 5,204 8,430 163 242 1,554 1,016 195 245 20,658
SENIOR INDEPENDENT INSTITUTIONSAnderson University 6 11 5 38 47 138 169 2 2 2 1 30 37 488 Bob Jones University 4 3 3 1 131 140 3 1 24 8 11 6 335 Charleston Southern University 2 5 2 2 1 4 38 80 104 143 1 3 1 3 12 11 412 Claflin University 12 2 15 31 2 1 1 3 2 1 3 73 Coker College 2 1 6 15 29 44 2 3 102 Columbia College 1 4 1 13 41 25 39 1 6 1 132 Columbia International University 3 4 20 6 43 47 153 124 3 3 29 21 6 7 469 Converse College 1 5 2 4 25 23 132 4 3 18 128 345 Erskine College 3 41 28 60 14 42 19 207 Furman University 3 5 1 2 6 15 37 131 2 4 206 Limestone College 3 2 1 6 North Greenville University 2 1 1 18 14 59 44 1 30 23 193 Presbyterian College 2 5 12 14 17 34 65 134 3 1 3 290 Sherman College of Chiropractic 32 37 1 6 4 5 7 1 136 125 5 5 12 8 384 South University2 3 6 1 3 4 20 56 176 1 33 69 1 5 7 385 Southern Wesleyan University 5 4 2 1 1 25 100 52 160 9 97 456
Total Independent Insti tutions 69 91 3 12 62 53 328 660 2 1 1,050 1,471 9 20 65 51 178 358 4,483
Total Graduate 295 450 15 35 288 346 947 2,494 10 10 6,254 9,901 172 262 1,619 1,067 373 603 25,141 See Appendix 6 for explanation of changes in the categories for race/ethnicity reporting.Note: Graduate Students include Master's, Unclassified Graduate, Doctor's-Research/Scholarship (Prev Doctoral), and Doctor's-Professional Practice (Prev 1st Professional)1 Graduate programs not currently offered.
COMPREHENSIVE TEACHING INSTITUTIONS
RESEARCH INSTITUTIONS
202 275 6 18 213 272 418 1,083
Grand TotalTwo Or More
RacesNon- Resident Alien Unknown
1,499 938 178 211146 1884 6 4,301 6,072 16,030
WhiteAsianBlack/African
AmericanHispanic/ Latino
American Indian/
Alaskan Native
Native Hawaiian/ Other Pacific Is.
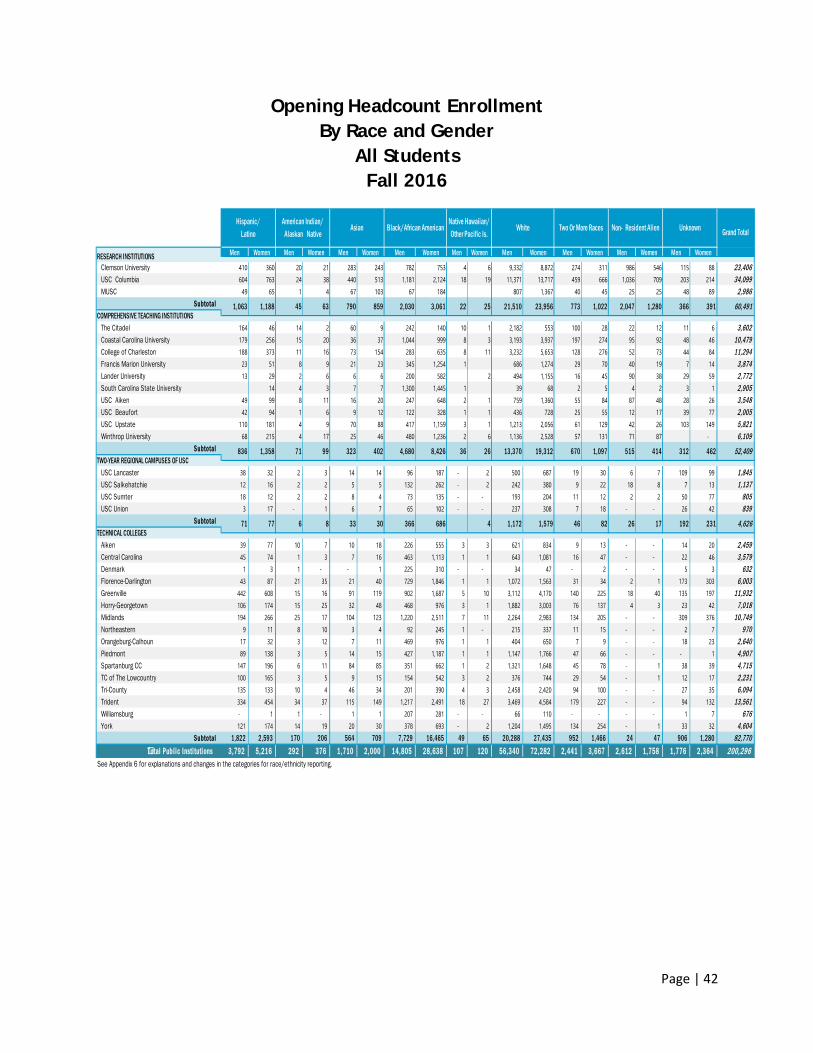
Page | 42
Opening Headcount Enrollment By Race and Gender
All Students Fall 2016
Men Women Men Women Men Women Men Women Men Women Men Women Men Women Men Women Men Women
Clemson University 410 360 20 21 283 243 782 753 4 6 9,332 8,872 274 311 986 546 115 88 23,406 USC Columbia 604 763 24 38 440 513 1,181 2,124 18 19 11,371 13,717 459 666 1,036 709 203 214 34,099 MUSC 49 65 1 4 67 103 67 184 807 1,367 40 45 25 25 48 89 2,986
Subtotal
The Citadel 164 46 14 2 60 9 242 140 10 1 2,182 553 100 28 22 12 11 6 3,602 Coastal Carolina University 179 256 15 20 36 37 1,044 999 8 3 3,193 3,937 197 274 95 92 48 46 10,479 College of Charleston 188 373 11 16 73 154 283 635 8 11 3,232 5,653 128 276 52 73 44 84 11,294 Francis Marion University 23 51 8 9 21 23 345 1,254 1 686 1,274 29 70 40 19 7 14 3,874 Lander University 13 29 2 6 6 6 200 582 2 494 1,155 16 45 90 38 29 59 2,772 South Carolina State University 14 4 3 7 7 1,300 1,445 1 39 68 2 5 4 2 3 1 2,905 USC Aiken 49 99 8 11 16 20 247 648 2 1 759 1,360 55 84 87 48 28 26 3,548 USC Beaufort 42 94 1 6 9 12 122 328 1 1 436 728 25 55 12 17 39 77 2,005 USC Upstate 110 181 4 9 70 88 417 1,159 3 1 1,213 2,056 61 129 42 26 103 149 5,821 Winthrop University 68 215 4 17 25 46 480 1,236 2 6 1,136 2,528 57 131 71 87 - 6,109
Subtotal
USC Lancaster 38 32 2 3 14 14 96 187 - 2 500 687 19 30 6 7 109 99 1,845 USC Salkehatchie 12 16 2 2 5 5 132 262 - 2 242 380 9 22 18 8 7 13 1,137 USC Sumter 18 12 2 2 8 4 73 135 - - 193 204 11 12 2 2 50 77 805 USC Union 3 17 - 1 6 7 65 102 - - 237 308 7 18 - - 26 42 839
Subtotal
Aiken 39 77 10 7 10 18 226 555 3 3 621 834 9 13 - - 14 20 2,459 Central Carolina 45 74 1 3 7 16 463 1,113 1 1 643 1,081 16 47 - - 22 46 3,579 Denmark 1 3 1 - - 1 225 310 - - 34 47 - 2 - - 5 3 632 Florence-Darlington 43 87 21 35 21 40 729 1,846 1 1 1,072 1,563 31 34 2 1 173 303 6,003 Greenville 442 608 15 16 91 119 902 1,687 5 10 3,112 4,170 140 225 18 40 135 197 11,932 Horry-Georgetown 106 174 15 25 32 48 468 976 3 1 1,882 3,003 76 137 4 3 23 42 7,018 Midlands 194 266 25 17 104 123 1,220 2,511 7 11 2,264 2,983 134 205 - - 309 376 10,749 Northeastern 9 11 8 10 3 4 92 245 1 - 215 337 11 15 - - 2 7 970 Orangeburg-Calhoun 17 32 3 12 7 11 469 976 1 1 404 650 7 9 - - 18 23 2,640 Piedmont 89 138 3 5 14 15 427 1,187 1 1 1,147 1,766 47 66 - - - 1 4,907 Spartanburg CC 147 196 6 11 84 85 351 662 1 2 1,321 1,648 45 78 - 1 38 39 4,715 TC of The Lowcountry 100 165 3 5 9 15 154 542 3 2 376 744 29 54 - 1 12 17 2,231 Tri-County 135 133 10 4 46 34 201 390 4 3 2,458 2,420 94 100 - - 27 35 6,094 Trident 334 454 34 37 115 149 1,217 2,491 18 27 3,469 4,584 179 227 - - 94 132 13,561 Williamsburg - 1 1 - 1 1 207 281 - - 66 110 - - - - 1 7 676 York 121 174 14 19 20 30 378 693 - 2 1,204 1,495 134 254 - 1 33 32 4,604
Subtotal 1,822 2,593 170 206 564 709 7,729 16,465 49 65 20,288 27,435 952 1,466 24 47 906 1,280 82,770 Total Publ ic Insti tutions 3,792 5,216 292 376 1,710 2,000 14,805 28,638 107 120 56,340 72,282 2,441 3,667 2,612 1,758 1,776 2,364 200,296
See Appendix 6 for explanations and changes in the categories for race/ethnicity reporting.
17 192 231TECHNICAL COLLEGES
1,172 1,579 46 82 2630 366 686 471 77 6 8 33 4,626
414 312 462TWO-YEAR REGIONAL CAMPUSES OF USC
13,370 19,312 670 1,097 515402 4,680 8,426 36 26836 1,358 71 99 323 52,409
366 391COMPREHENSIVE TEACHING INSTITUTIONS
23,956 773 1,022 2,047 1,2802,030 3,061 22 25 21,510
RESEARCH INSTITUTIONS
1,063 1,188 45 63 790 859
Grand Total
60,491
Two Or More Races Non- Resident Alien UnknownHispanic/
LatinoAmerican Indian/
Alaskan NativeAsian Black/African American
Native Hawaiian/ Other Pacific Is.
White
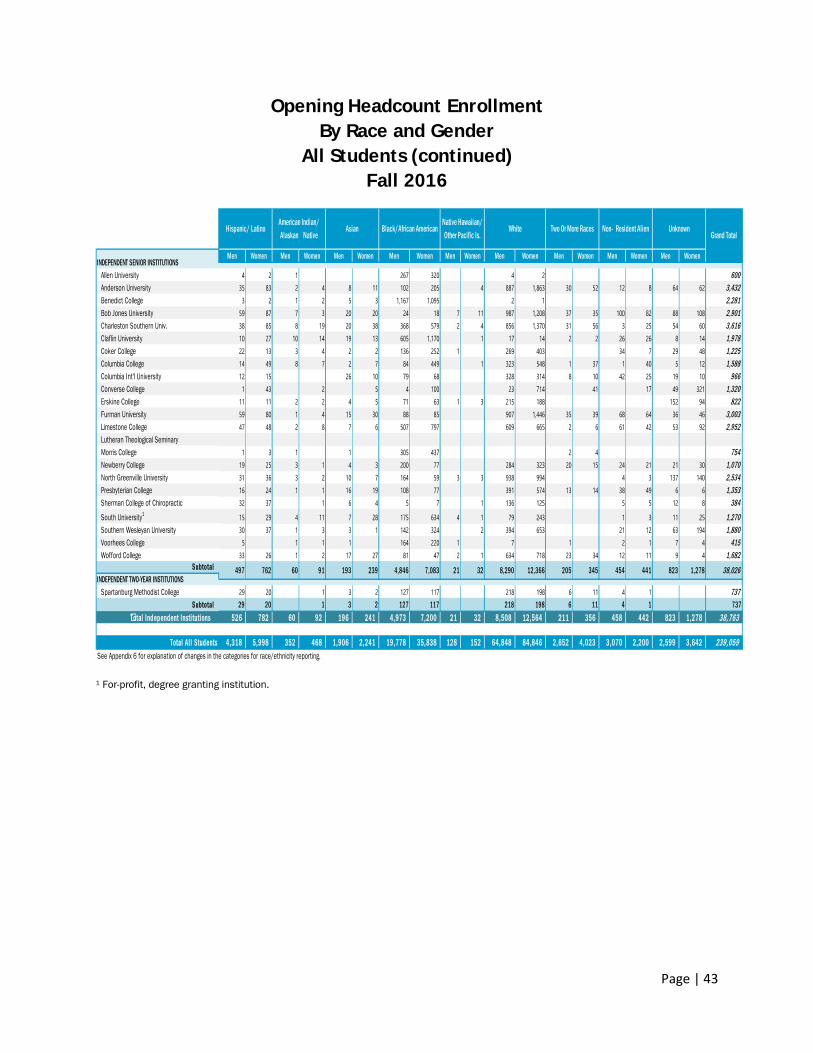
Page | 43
Opening Headcount Enrollment By Race and Gender
All Students (continued) Fall 2016
1 For-profit, degree granting institution.
Men Women Men Women Men Women Men Women Men Women Men Women Men Women Men Women Men Women
Allen University 4 2 1 267 320 4 2 600Anderson University 35 83 2 4 8 11 102 205 4 887 1,863 30 52 12 8 64 62 3,432Benedict College 3 2 1 2 5 3 1,167 1,095 2 1 2,281Bob Jones University 59 87 7 3 20 20 24 18 7 11 987 1,208 37 35 100 82 88 108 2,901Charleston Southern Univ. 38 85 8 19 20 38 368 579 2 4 856 1,370 31 56 3 25 54 60 3,616Claflin University 10 27 10 14 19 13 605 1,170 1 17 14 2 2 26 26 8 14 1,978Coker College 22 13 3 4 2 2 136 252 1 269 403 34 7 29 48 1,225Columbia College 14 49 8 7 2 7 84 449 1 323 548 1 37 1 40 5 12 1,588Columbia Int'l University 12 15 26 10 79 68 328 314 8 10 42 25 19 10 966Converse College 1 43 2 5 4 100 23 714 41 17 49 321 1,320Erskine College 11 11 2 2 4 5 71 63 1 3 215 188 152 94 822Furman University 59 80 1 4 15 30 88 85 907 1,446 35 39 68 64 36 46 3,003Limestone College 47 48 2 8 7 6 507 797 609 665 2 6 61 42 53 92 2,952Lutheran Theological SeminaryMorris College 1 3 1 1 305 437 2 4 754Newberry College 19 25 3 1 4 3 200 77 284 323 20 15 24 21 21 30 1,070North Greenville University 31 36 3 2 10 7 164 59 3 3 938 994 4 3 137 140 2,534Presbyterian College 16 24 1 1 16 19 108 77 391 574 13 14 38 49 6 6 1,353Sherman College of Chiropractic 32 37 1 6 4 5 7 1 136 125 5 5 12 8 384South University1 15 29 4 11 7 28 175 634 4 1 79 243 1 3 11 25 1,270Southern Wesleyan University 30 37 1 3 3 1 142 324 2 394 653 21 12 63 194 1,880Voorhees College 5 1 1 1 164 220 1 7 1 2 1 7 4 415Wofford College 33 26 1 2 17 27 81 47 2 1 634 718 23 34 12 11 9 4 1,682
Subtotal
Spartanburg Methodist College 29 20 1 3 2 127 117 218 198 6 11 4 1 737Subtotal 29 20 1 3 2 127 117 218 198 6 11 4 1 737
Total Independent Insti tutions 526 782 60 92 196 241 4,973 7,200 21 32 8,508 12,564 211 356 458 442 823 1,278 38,763
Total Al l Students 4,318 5,998 352 468 1,906 2,241 19,778 35,838 128 152 64,848 84,846 2,652 4,023 3,070 2,200 2,599 3,642 239,059 See Appendix 6 for explanation of changes in the categories for race/ethnicity reporting.
White Two Or More Races Non- Resident Alien Unknown
INDEPENDENT SENIOR INSTITUTIONS
Hispanic/ LatinoAmerican Indian/ Alaskan Native
Asian Black/African AmericanNative Hawaiian/ Other Pacific Is. Grand Total
INDEPENDENT TWO-YEAR INSTITUTIONS441 823 1,2788,290 12,366 205 345 454239 4,846 7,083 21 32497 762 60 91 193 38,026
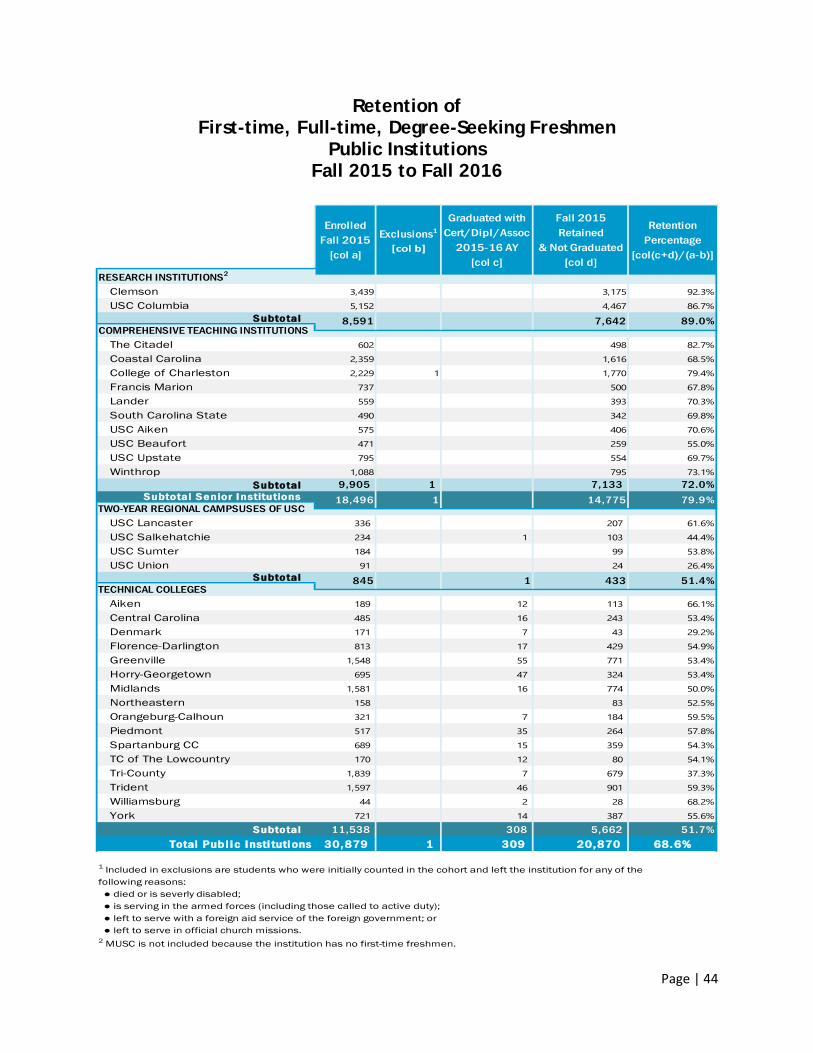
Page | 44
Retention of First-time, Full-time, Degree-Seeking Freshmen
Public Institutions Fall 2015 to Fall 2016
Clemson 3,439 3,175 92.3%
USC Columbia 5,152 4,467 86.7%Subtotal
The Citadel 602 498 82.7%
Coastal Carolina 2,359 1,616 68.5%
College of Charleston 2,229 1 1,770 79.4%
Francis Marion 737 500 67.8%
Lander 559 393 70.3%South Carolina State 490 342 69.8%
USC Aiken 575 406 70.6%
USC Beaufort 471 259 55.0%
USC Upstate 795 554 69.7%
Winthrop 1,088 795 73.1%Subtotal 9,905 1 7,133 72.0%
Subtotal Senior I nstitutions
USC Lancaster 336 207 61.6%
USC Salkehatchie 234 1 103 44.4%USC Sumter 184 99 53.8%USC Union 91 24 26.4%
Subtotal
Aiken 189 12 113 66.1%
Central Carolina 485 16 243 53.4%
Denmark 171 7 43 29.2%
Florence-Darlington 813 17 429 54.9%
Greenville 1,548 55 771 53.4%
Horry-Georgetown 695 47 324 53.4%
Midlands 1,581 16 774 50.0%
Northeastern 158 83 52.5%
Orangeburg-Calhoun 321 7 184 59.5%
Piedmont 517 35 264 57.8%
Spartanburg CC 689 15 359 54.3%
TC of The Lowcountry 170 12 80 54.1%
Tri-County 1,839 7 679 37.3%Trident 1,597 46 901 59.3%
Williamsburg 44 2 28 68.2%
York 721 14 387 55.6%Subtotal 11,538 308 5,662 51.7%
Total Publ ic Insti tutions 30,879 1 309 20,870 68.6%
1 Included in exclusions are students who were initially counted in the cohort and left the institution for any of thefollowing reasons: ● died or is severly disabled; ● is serving in the armed forces (including those called to active duty); ● left to serve with a foreign aid service of the foreign government; or ● left to serve in official church missions.2 MUSC is not included because the institution has no first-time freshmen.
Enrolled Fall 2015
[col a]
Exclusions1
[col b]
Graduated with Cert/Dipl/Assoc
2015-16 AY[col c]
Fall 2015 Retained
& Not Graduated[col d]
RetentionPercentage
[col(c+d)/(a-b)]
RESEARCH INSTITUTIONS2
COMPREHENSIVE TEACHING INSTITUTIONS
18,496 1 14,775 79.9%TWO-YEAR REGIONAL CAMPSUSES OF USC
8,591 7,642 89.0%
TECHNICAL COLLEGES845 1 433 51.4%
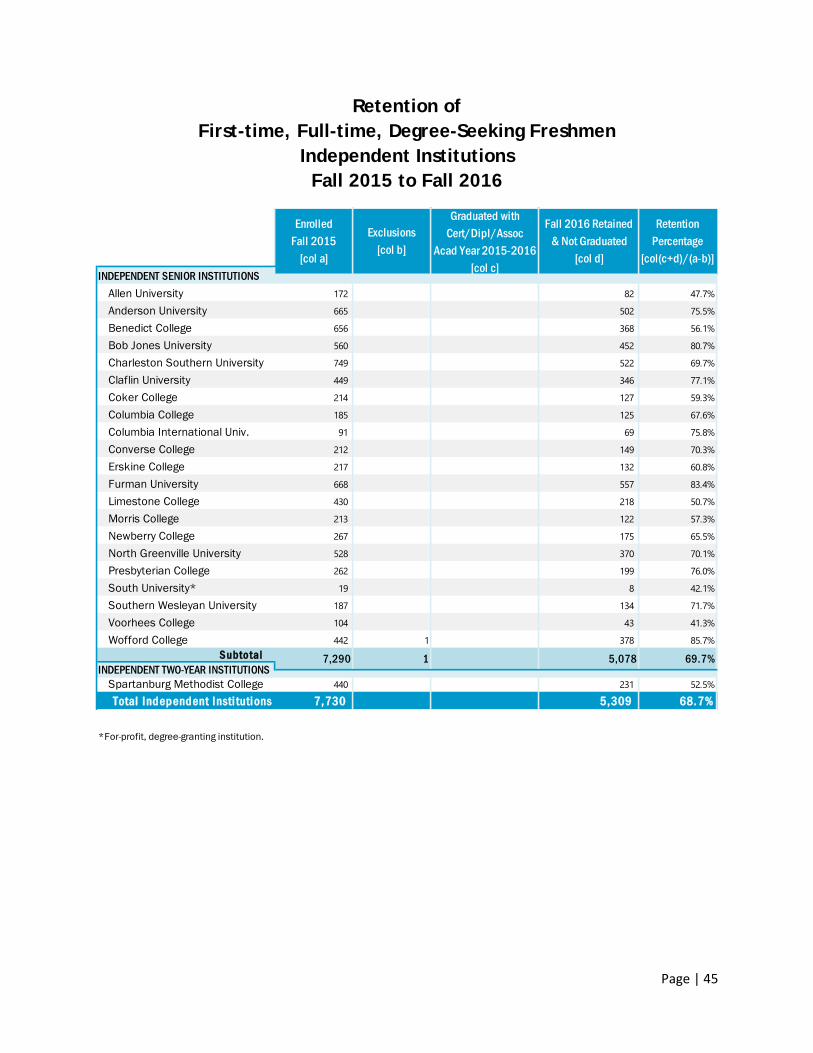
Page | 45
Retention of First-time, Full-time, Degree-Seeking Freshmen
Independent Institutions Fall 2015 to Fall 2016
Allen University 172 82 47.7%
Anderson University 665 502 75.5%
Benedict College 656 368 56.1%
Bob Jones University 560 452 80.7%
Charleston Southern University 749 522 69.7%
Claflin University 449 346 77.1%
Coker College 214 127 59.3%
Columbia College 185 125 67.6%
Columbia International Univ. 91 69 75.8%
Converse College 212 149 70.3%
Erskine College 217 132 60.8%
Furman University 668 557 83.4%
Limestone College 430 218 50.7%
Morris College 213 122 57.3%
Newberry College 267 175 65.5%
North Greenville University 528 370 70.1%
Presbyterian College 262 199 76.0%
South University* 19 8 42.1%
Southern Wesleyan University 187 134 71.7%
Voorhees College 104 43 41.3%
Wofford College 442 1 378 85.7%Subtotal
Spartanburg Methodist College 440 231 52.5%
Total Independent Insti tutions 7,730 5,309 68.7%
*For-profit, degree-granting institution.
INDEPENDENT TWO-YEAR INSTITUTIONS7,290 1 5,078 69.7%
INDEPENDENT SENIOR INSTITUTIONS
Enrolled Fall 2015
[col a]
Exclusions[col b]
Graduated with Cert/Dipl/Assoc
Acad Year 2015-2016[col c]
Fall 2016 Retained& Not Graduated
[col d]
RetentionPercentage
[col(c+d)/(a-b)]
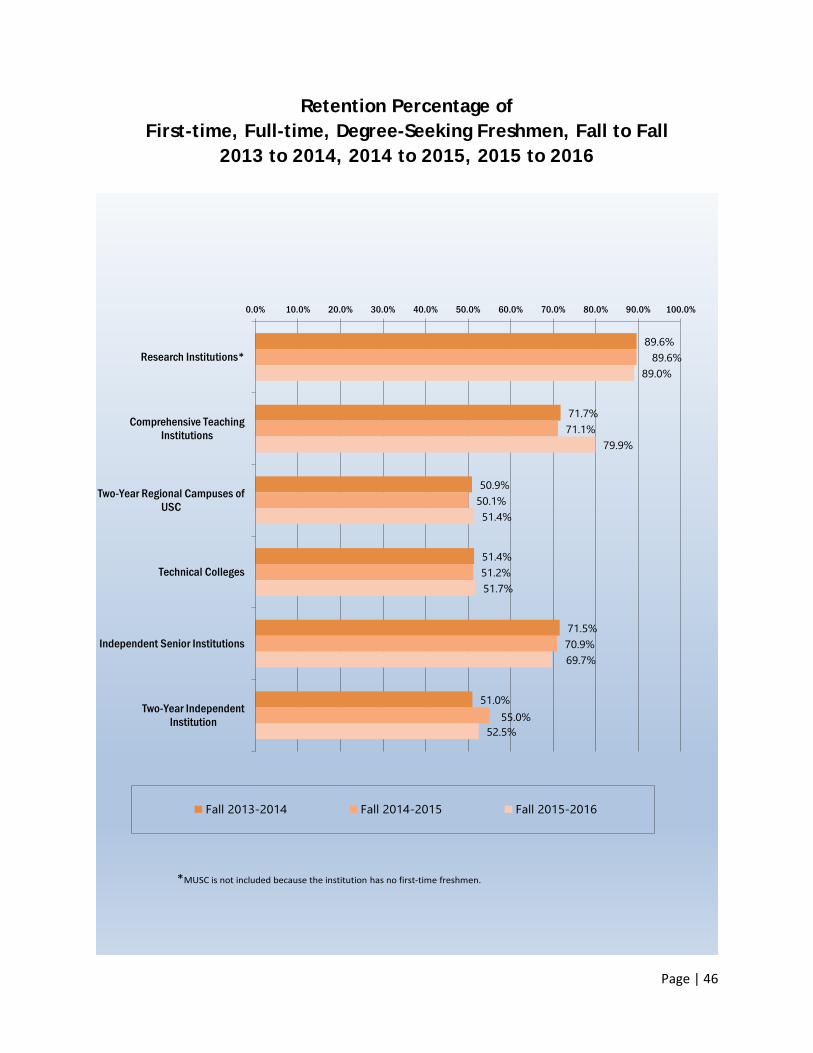
Page | 46
Retention Percentage of First-time, Full-time, Degree-Seeking Freshmen, Fall to Fall
2013 to 2014, 2014 to 2015, 2015 to 2016
89.6%
71.7%
50.9%
51.4%
71.5%
51.0%
89.6%
71.1%
50.1%
51.2%
70.9%
55.0%
89.0%
79.9%
51.4%
51.7%
69.7%
52.5%
0.0% 10.0% 20.0% 30.0% 40.0% 50.0% 60.0% 70.0% 80.0% 90.0% 100.0%
Research Institutions*
Comprehensive TeachingInstitutions
Two-Year Regional Campuses ofUSC
Technical Colleges
Independent Senior Institutions
Two-Year IndependentInstitution
Fall 2013-2014 Fall 2014-2015 Fall 2015-2016
*MUSC is not included because the institution has no first-time freshmen.
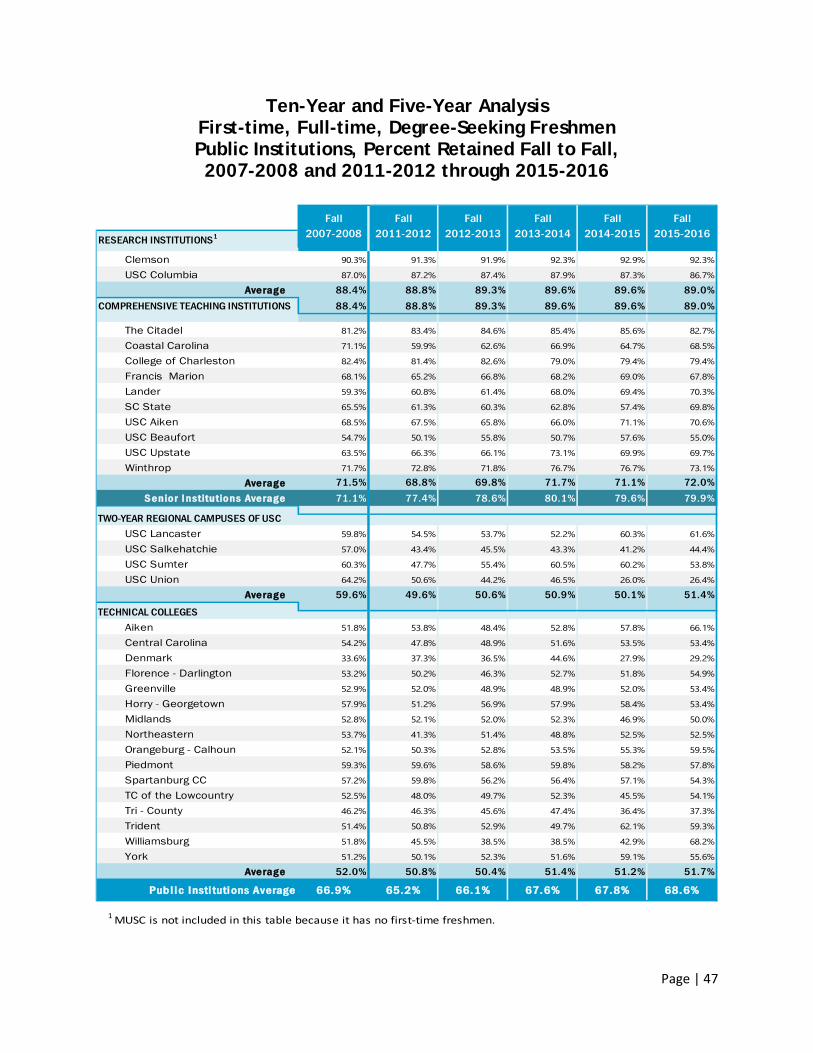
Page | 47
Ten-Year and Five-Year Analysis First-time, Full-time, Degree-Seeking Freshmen Public Institutions, Percent Retained Fall to Fall, 2007-2008 and 2011-2012 through 2015-2016
RESEARCH INSTITUTIONS1
Clemson 90.3% 91.3% 91.9% 92.3% 92.9% 92.3%
USC Columbia 87.0% 87.2% 87.4% 87.9% 87.3% 86.7%
Average 88.4% 88.8% 89.3% 89.6% 89.6% 89.0%COMPREHENSIVE TEACHING INSTITUTIONS 88.4% 88.8% 89.3% 89.6% 89.6% 89.0%
The Citadel 81.2% 83.4% 84.6% 85.4% 85.6% 82.7%
Coastal Carolina 71.1% 59.9% 62.6% 66.9% 64.7% 68.5%
College of Charleston 82.4% 81.4% 82.6% 79.0% 79.4% 79.4%
Francis Marion 68.1% 65.2% 66.8% 68.2% 69.0% 67.8%
Lander 59.3% 60.8% 61.4% 68.0% 69.4% 70.3%
SC State 65.5% 61.3% 60.3% 62.8% 57.4% 69.8%
USC Aiken 68.5% 67.5% 65.8% 66.0% 71.1% 70.6%
USC Beaufort 54.7% 50.1% 55.8% 50.7% 57.6% 55.0%
USC Upstate 63.5% 66.3% 66.1% 73.1% 69.9% 69.7%
Winthrop 71.7% 72.8% 71.8% 76.7% 76.7% 73.1%
Average 71.5% 68.8% 69.8% 71.7% 71.1% 72.0%Senior I nstitutions Average 71.1% 77.4% 78.6% 80.1% 79.6% 79.9%
USC Lancaster 59.8% 54.5% 53.7% 52.2% 60.3% 61.6%
USC Salkehatchie 57.0% 43.4% 45.5% 43.3% 41.2% 44.4%
USC Sumter 60.3% 47.7% 55.4% 60.5% 60.2% 53.8%
USC Union 64.2% 50.6% 44.2% 46.5% 26.0% 26.4%
Average 59.6% 49.6% 50.6% 50.9% 50.1% 51.4%
Aiken 51.8% 53.8% 48.4% 52.8% 57.8% 66.1%
Central Carolina 54.2% 47.8% 48.9% 51.6% 53.5% 53.4%
Denmark 33.6% 37.3% 36.5% 44.6% 27.9% 29.2%
Florence - Darlington 53.2% 50.2% 46.3% 52.7% 51.8% 54.9%
Greenville 52.9% 52.0% 48.9% 48.9% 52.0% 53.4%
Horry - Georgetown 57.9% 51.2% 56.9% 57.9% 58.4% 53.4%
Midlands 52.8% 52.1% 52.0% 52.3% 46.9% 50.0%
Northeastern 53.7% 41.3% 51.4% 48.8% 52.5% 52.5%
Orangeburg - Calhoun 52.1% 50.3% 52.8% 53.5% 55.3% 59.5%
Piedmont 59.3% 59.6% 58.6% 59.8% 58.2% 57.8%
Spartanburg CC 57.2% 59.8% 56.2% 56.4% 57.1% 54.3%
TC of the Lowcountry 52.5% 48.0% 49.7% 52.3% 45.5% 54.1%
Tri - County 46.2% 46.3% 45.6% 47.4% 36.4% 37.3%
Trident 51.4% 50.8% 52.9% 49.7% 62.1% 59.3%
Williamsburg 51.8% 45.5% 38.5% 38.5% 42.9% 68.2%
York 51.2% 50.1% 52.3% 51.6% 59.1% 55.6%
Average 52.0% 50.8% 50.4% 51.4% 51.2% 51.7%
Publ ic Insti tutions Average 66.9% 65.2% 66.1% 67.6% 67.8% 68.6%
1 MUSC is not included in this table because it has no first-time freshmen.
TECHNICAL COLLEGES
TWO-YEAR REGIONAL CAMPUSES OF USC
Fall 2015-2016
Fall 2007-2008
Fall 2011-2012
Fall 2012-2013
Fall 2013-2014
Fall 2014-2015
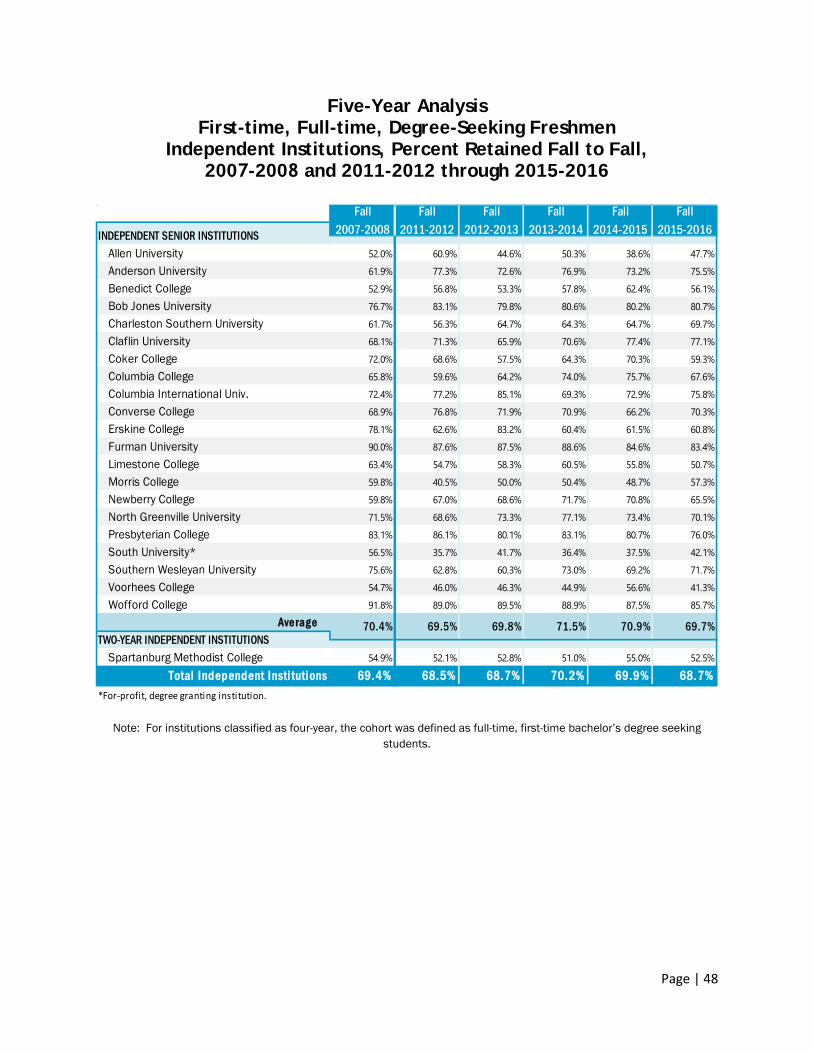
Page | 48
Five-Year Analysis First-time, Full-time, Degree-Seeking Freshmen
Independent Institutions, Percent Retained Fall to Fall, 2007-2008 and 2011-2012 through 2015-2016
Note: For institutions classified as four-year, the cohort was defined as full-time, first-time bachelor’s degree seekingstudents.
Allen University 52.0% 60.9% 44.6% 50.3% 38.6% 47.7%Anderson University 61.9% 77.3% 72.6% 76.9% 73.2% 75.5%Benedict College 52.9% 56.8% 53.3% 57.8% 62.4% 56.1%Bob Jones University 76.7% 83.1% 79.8% 80.6% 80.2% 80.7%Charleston Southern University 61.7% 56.3% 64.7% 64.3% 64.7% 69.7%Claflin University 68.1% 71.3% 65.9% 70.6% 77.4% 77.1%Coker College 72.0% 68.6% 57.5% 64.3% 70.3% 59.3%Columbia College 65.8% 59.6% 64.2% 74.0% 75.7% 67.6%Columbia International Univ. 72.4% 77.2% 85.1% 69.3% 72.9% 75.8%Converse College 68.9% 76.8% 71.9% 70.9% 66.2% 70.3%Erskine College 78.1% 62.6% 83.2% 60.4% 61.5% 60.8%Furman University 90.0% 87.6% 87.5% 88.6% 84.6% 83.4%Limestone College 63.4% 54.7% 58.3% 60.5% 55.8% 50.7%Morris College 59.8% 40.5% 50.0% 50.4% 48.7% 57.3%Newberry College 59.8% 67.0% 68.6% 71.7% 70.8% 65.5%North Greenville University 71.5% 68.6% 73.3% 77.1% 73.4% 70.1%Presbyterian College 83.1% 86.1% 80.1% 83.1% 80.7% 76.0%South University* 56.5% 35.7% 41.7% 36.4% 37.5% 42.1%Southern Wesleyan University 75.6% 62.8% 60.3% 73.0% 69.2% 71.7%Voorhees College 54.7% 46.0% 46.3% 44.9% 56.6% 41.3%Wofford College 91.8% 89.0% 89.5% 88.9% 87.5% 85.7%
Average
Spartanburg Methodist College 54.9% 52.1% 52.8% 51.0% 55.0% 52.5%
Total Independent Insti tutions 69.4% 68.5% 68.7% 70.2% 69.9% 68.7%*For-profit, degree granting institution.
69.8% 71.5%
Fall 2011-2012
Fall 2012-2013
Fall 2013-2014
Fall 2014-2015
TWO-YEAR INDEPENDENT INSTITUTIONS
INDEPENDENT SENIOR INSTITUTIONS
70.9%
Fall 2015-2016
69.7%
Fall 2007-2008
70.4% 69.5%
Page | 49
Migration of First-Time Undergraduate Transfers
The Integrated Postsecondary Education Data System (IPEDS) defines a transfer student as one entering the reporting institution for the first time but known to have previously attended a postsecondary institution at the same level (e.g., undergraduate, graduate). The student may transfer with or without credit.
The following pages show the detailed migration of students from one institution to another for Fall 2016.
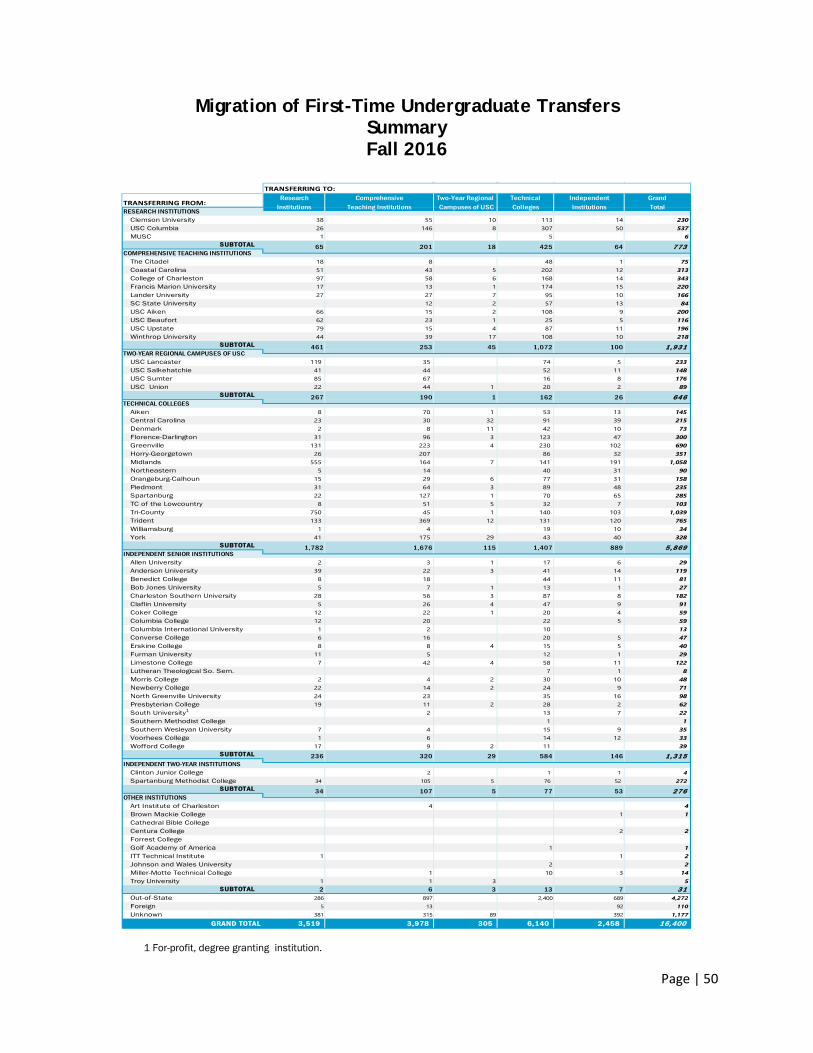
Page | 50
Migration of First-Time Undergraduate Transfers Summary Fall 2016
1 For-profit, degree granting institution.
TRANSFERRING FROM:
Clemson University 38 55 10 113 14 230USC Columbia 26 146 8 307 50 537MUSC 1 5 6
SUBTOTAL
The Citadel 18 8 48 1 75Coastal Carolina 51 43 5 202 12 313College of Charleston 97 58 6 168 14 343Francis Marion University 17 13 1 174 15 220Lander University 27 27 7 95 10 166SC State University 12 2 57 13 84USC Aiken 66 15 2 108 9 200USC Beaufort 62 23 1 25 5 116USC Upstate 79 15 4 87 11 196Winthrop University 44 39 17 108 10 218
SUBTOTAL
USC Lancaster 119 35 74 5 233 USC Salkehatchie 41 44 52 11 148 USC Sumter 85 67 16 8 176 USC Union 22 44 1 20 2 89
SUBTOTAL
Aiken 8 70 1 53 13 145 Central Carolina 23 30 32 91 39 215 Denmark 2 8 11 42 10 73 Florence-Darlington 31 96 3 123 47 300 Greenville 131 223 4 230 102 690 Horry-Georgetown 26 207 86 32 351 Midlands 555 164 7 141 191 1,058 Northeastern 5 14 40 31 90 Orangeburg-Calhoun 15 29 6 77 31 158 Piedmont 31 64 3 89 48 235 Spartanburg 22 127 1 70 65 285 TC of the Lowcountry 8 51 5 32 7 103 Tri-County 750 45 1 140 103 1,039 Trident 133 369 12 131 120 765 Williamsburg 1 4 19 10 34 York 41 175 29 43 40 328
SUBTOTAL
Allen University 2 3 1 17 6 29 Anderson University 39 22 3 41 14 119 Benedict College 8 18 44 11 81 Bob Jones University 5 7 1 13 1 27 Charleston Southern University 28 56 3 87 8 182 Claflin University 5 26 4 47 9 91 Coker College 12 22 1 20 4 59 Columbia College 12 20 22 5 59 Columbia International University 1 2 10 13 Converse College 6 16 20 5 47 Erskine College 8 8 4 15 5 40 Furman University 11 5 12 1 29 Limestone College 7 42 4 58 11 122 Lutheran Theological So. Sem. 7 1 8 Morris College 2 4 2 30 10 48 Newberry College 22 14 2 24 9 71 North Greenville University 24 23 35 16 98 Presbyterian College 19 11 2 28 2 62 South University1 2 13 7 22 Southern Methodist College 1 1 Southern Wesleyan University 7 4 15 9 35 Voorhees College 1 6 14 12 33 Wofford College 17 9 2 11 39
SUBTOTAL
Clinton Junior College 2 1 1 4 Spartanburg Methodist College 34 105 5 76 52 272
SUBTOTAL
Art Institute of Charleston 4 4Brown Mackie College 1 1Cathedral Bible College Centura College 2 2Forrest CollegeGolf Academy of America 1 1ITT Technical Institute 1 1 2Johnson and Wales University 2 2Miller-Motte Technical College 1 10 3 14Troy University 1 1 3 5
SUBTOTAL 2 6 3 13 7 31Out-of-State 286 897 2,400 689 4,272Foreign 5 13 92 110Unknown 381 315 89 392 1,177
GRAND TOTAL 3,519 3,978 305 6,140 2,458 16,400
5, 869
1, 931
TRANSFERRING TO:
65 201 18 425 64 773
GrandTotal
1,782 1,676 115 1,407 889
COMPREHENSIVE TEACHING INSTITUTIONS
TWO-YEAR REGIONAL CAMPUSES OF USC
TECHNICAL COLLEGES
INDEPENDENT SENIOR INSTITUTIONS
RESEARCH INSTITUTIONS
646
461 253
ResearchInstitutions
Comprehensive Teaching Institutions
Two-Year Regional Campuses of USC
Technical Colleges
IndependentInstitutions
267 190 1 162 26
45 1,072 100
INDEPENDENT TWO-YEAR INSTITUTIONS
OTHER INSTITUTIONS27634 107 5 77 53
236 320 29 584 146 1, 315
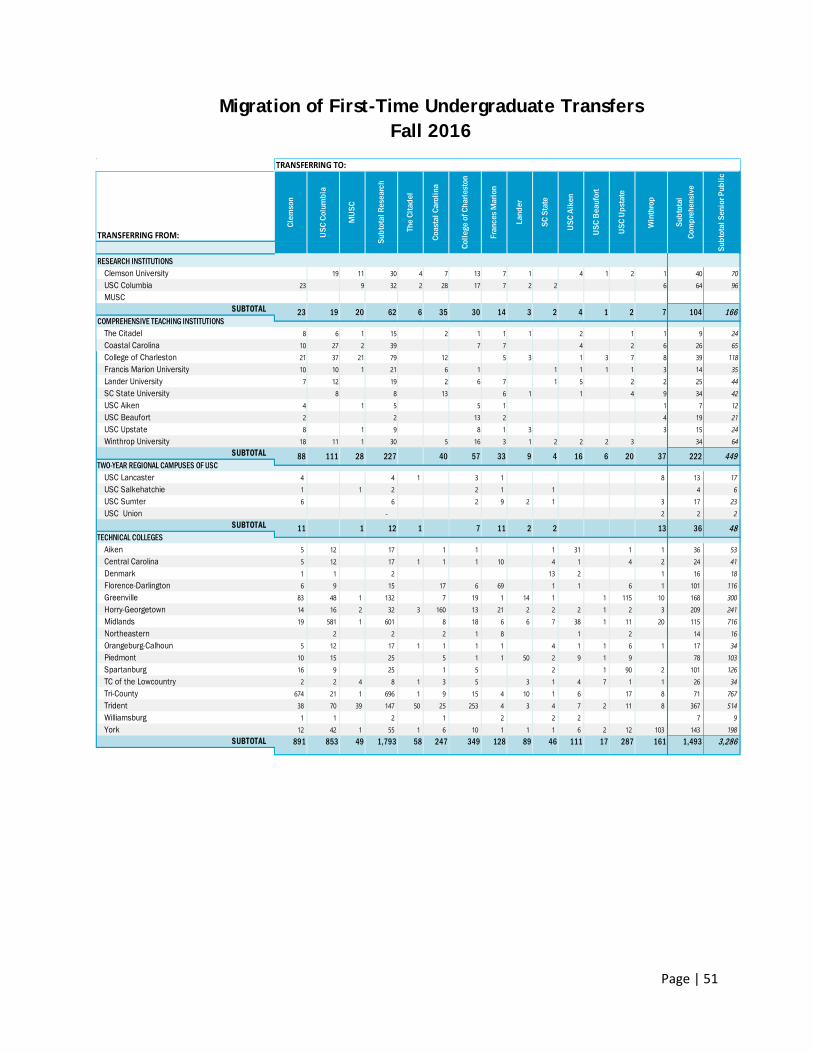
Page | 51
Migration of First-Time Undergraduate Transfers Fall 2016
TRANSFERRING FROM:
RESEARCH INSTITUTIONSClemson University 19 11 30 4 7 13 7 1 4 1 2 1 40 70USC Columbia 23 9 32 2 28 17 7 2 2 6 64 96MUSC
SUBTOTAL
The Citadel 8 6 1 15 2 1 1 1 2 1 1 9 24Coastal Carolina 10 27 2 39 7 7 4 2 6 26 65College of Charleston 21 37 21 79 12 5 3 1 3 7 8 39 118Francis Marion University 10 10 1 21 6 1 1 1 1 1 3 14 35Lander University 7 12 19 2 6 7 1 5 2 2 25 44SC State University 8 8 13 6 1 1 4 9 34 42USC Aiken 4 1 5 5 1 1 7 12USC Beaufort 2 2 13 2 4 19 21USC Upstate 8 1 9 8 1 3 3 15 24Winthrop University 18 11 1 30 5 16 3 1 2 2 2 3 34 64
SUBTOTAL
USC Lancaster 4 4 1 3 1 8 13 17 USC Salkehatchie 1 1 2 2 1 1 4 6 USC Sumter 6 6 2 9 2 1 3 17 23 USC Union - 2 2 2
SUBTOTAL
Aiken 5 12 17 1 1 1 31 1 1 36 53 Central Carolina 5 12 17 1 1 1 10 4 1 4 2 24 41 Denmark 1 1 2 13 2 1 16 18 Florence-Darlington 6 9 15 17 6 69 1 1 6 1 101 116 Greenville 83 48 1 132 7 19 1 14 1 1 115 10 168 300 Horry-Georgetown 14 16 2 32 3 160 13 21 2 2 2 1 2 3 209 241 Midlands 19 581 1 601 8 18 6 6 7 38 1 11 20 115 716 Northeastern 2 2 2 1 8 1 2 14 16 Orangeburg-Calhoun 5 12 17 1 1 1 1 4 1 1 6 1 17 34 Piedmont 10 15 25 5 1 1 50 2 9 1 9 78 103 Spartanburg 16 9 25 1 5 2 1 90 2 101 126 TC of the Lowcountry 2 2 4 8 1 3 5 3 1 4 7 1 1 26 34 Tri-County 674 21 1 696 1 9 15 4 10 1 6 17 8 71 767 Trident 38 70 39 147 50 25 253 4 3 4 7 2 11 8 367 514 Williamsburg 1 1 2 1 2 2 2 7 9 York 12 42 1 55 1 6 10 1 1 1 6 2 12 103 143 198
SUBTOTAL 891 853 49 1,793 58 247 349 128 89 46 111 17 287 161 1,493 3,286
7 104 1664 1 2
TRANSFERRING TO:
Clem
son
USC
Colu
mbi
a
MUS
C
Subt
otal
Res
earc
h
The
Cita
del
Coas
tal C
arol
ina
Colle
ge o
f Cha
rlest
on
Fran
ces M
ario
n
Land
er
SC S
tate
USC
Aike
n
USC
Beau
fort
USC
Upst
ate
Win
thro
p
Subt
otal
Co
mpr
ehen
sive
Subt
otal
Sen
ior P
ublic
14 3 2
9 4
23 19 20 62 6 35 30COMPREHENSIVE TEACHING INSTITUTIONS
6 20 37 222 449TWO-YEAR REGIONAL CAMPUSES OF USC
40 57 33 1688 111 28 227
13 36 48TECHNICAL COLLEGES
7 11 2 211 1 12 1
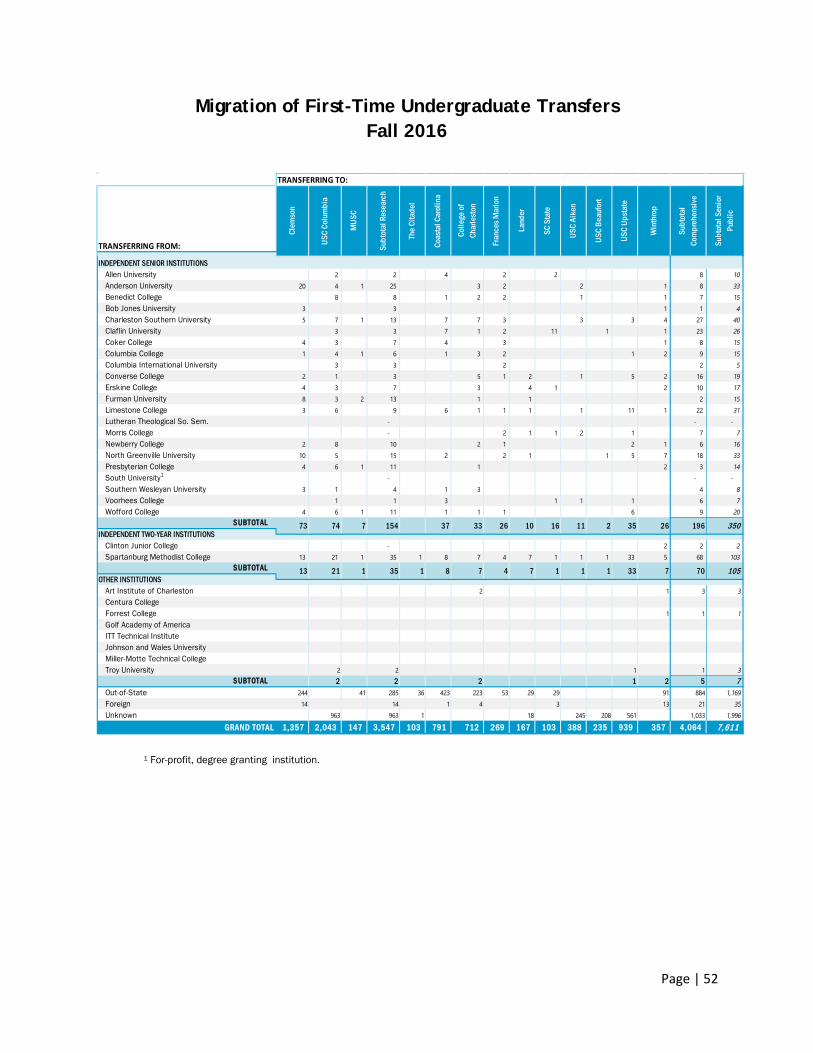
Page | 52
Migration of First-Time Undergraduate Transfers Fall 2016
1 For-profit, degree granting institution.
TRANSFERRING FROM:
INDEPENDENT SENIOR INSTITUTIONSAllen University 2 2 4 2 2 8 10 Anderson University 20 4 1 25 3 2 2 1 8 33 Benedict College 8 8 1 2 2 1 1 7 15 Bob Jones University 3 3 1 1 4 Charleston Southern University 5 7 1 13 7 7 3 3 3 4 27 40 Claflin University 3 3 7 1 2 11 1 1 23 26 Coker College 4 3 7 4 3 1 8 15 Columbia College 1 4 1 6 1 3 2 1 2 9 15 Columbia International University 3 3 2 2 5 Converse College 2 1 3 5 1 2 1 5 2 16 19 Erskine College 4 3 7 3 4 1 2 10 17 Furman University 8 3 2 13 1 1 2 15 Limestone College 3 6 9 6 1 1 1 1 11 1 22 31 Lutheran Theological So. Sem. - - - Morris College - 2 1 1 2 1 7 7 Newberry College 2 8 10 2 1 2 1 6 16 North Greenville University 10 5 15 2 2 1 1 5 7 18 33 Presbyterian College 4 6 1 11 1 2 3 14 South University1 - - - Southern Wesleyan University 3 1 4 1 3 4 8 Voorhees College 1 1 3 1 1 1 6 7 Wofford College 4 6 1 11 1 1 1 6 9 20
SUBTOTAL
Clinton Junior College - 2 2 2 Spartanburg Methodist College 13 21 1 35 1 8 7 4 7 1 1 1 33 5 68 103
SUBTOTAL
Art Institute of Charleston 2 1 3 3Centura College Forrest College 1 1 1Golf Academy of America ITT Technical Institute Johnson and Wales UniversityMiller-Motte Technical College Troy University 2 2 1 1 3
SUBTOTAL 2 2 2 1 2 5 7Out-of-State 244 41 285 36 423 223 53 29 29 91 884 1,169Foreign 14 14 1 4 3 13 21 35Unknown 963 963 1 18 245 208 561 1,033 1,996
GRAND TOTAL 1,357 2,043 147 3,547 103 791 712 269 167 103 388 235 939 357 4,064 7,611
7 70 105OTHER INSTITUTIONS
7 4 7 1 1 113 21 1 35 1 8 33
26 196 350INDEPENDENT TWO-YEAR INSTITUTIONS
3533 26 10 16 11 273 74 7 154 37
TRANSFERRING TO:
Clem
son
USC
Colu
mbi
a
MUS
C
Subt
otal
Res
earc
h
The
Cita
del
Coas
tal C
arol
ina
Colle
ge o
f Ch
arle
ston
Fran
ces M
ario
n
Land
er
SC S
tate
USC
Aike
n
USC
Beau
fort
USC
Upst
ate
Win
thro
p
Subt
otal
Co
mpr
ehen
sive
Subt
otal
Sen
ior
Publ
ic
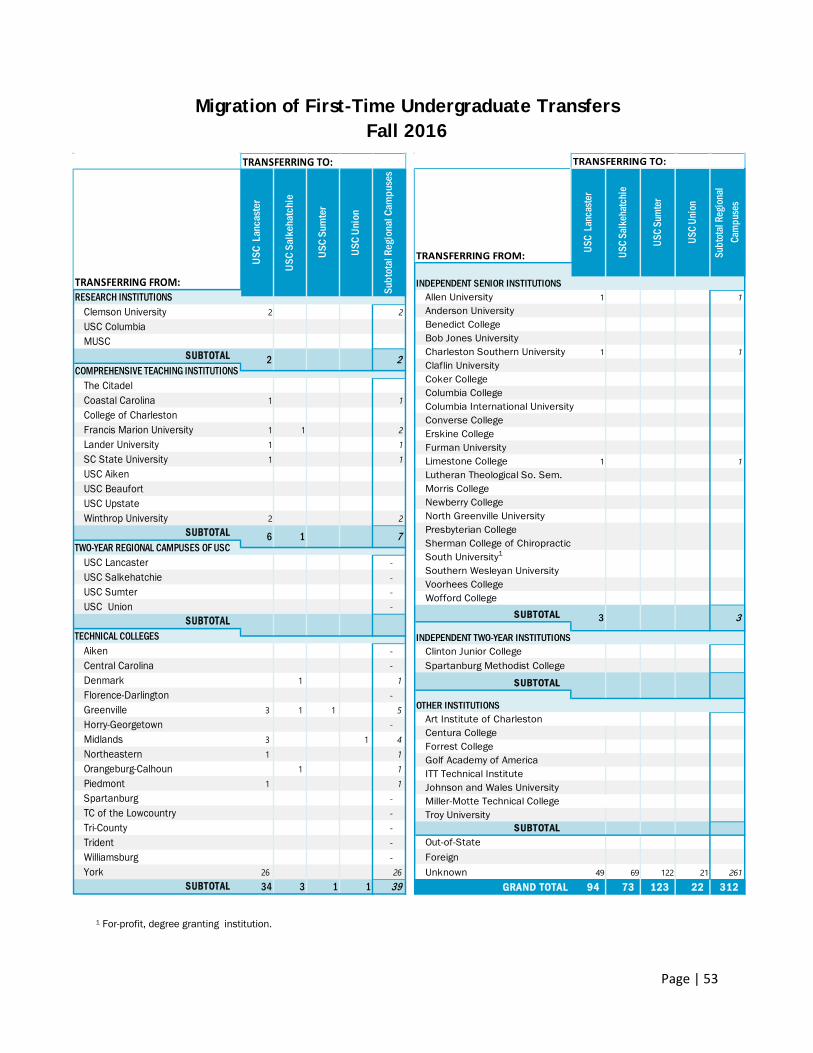
Page | 53
Migration of First-Time Undergraduate Transfers Fall 2016
1 For-profit, degree granting institution.
TRANSFERRING FROM:
Clemson University 2 2USC ColumbiaMUSC
SUBTOTAL
The CitadelCoastal Carolina 1 1College of CharlestonFrancis Marion University 1 1 2Lander University 1 1SC State University 1 1USC AikenUSC BeaufortUSC UpstateWinthrop University 2 2
SUBTOTAL
USC Lancaster - USC Salkehatchie - USC Sumter - USC Union -
SUBTOTAL
Aiken - Central Carolina - Denmark 1 1 Florence-Darlington - Greenville 3 1 1 5 Horry-Georgetown - Midlands 3 1 4 Northeastern 1 1 Orangeburg-Calhoun 1 1 Piedmont 1 1 Spartanburg - TC of the Lowcountry - Tri-County - Trident - Williamsburg - York 26 26
SUBTOTAL 34 3 1 1 39
TRANSFERRING TO:
USC
Lan
cast
er
USC
Salk
ehat
chie
USC
Sum
ter
USC
Unio
n
Subt
otal
Reg
iona
l Cam
puse
s
RESEARCH INSTITUTIONS
2 2COMPREHENSIVE TEACHING INSTITUTIONS
TWO-YEAR REGIONAL CAMPUSES OF USC
TECHNICAL COLLEGES
6 1 7
TRANSFERRING FROM:
Allen University 1 1Anderson UniversityBenedict CollegeBob Jones UniversityCharleston Southern University 1 1Claflin UniversityCoker CollegeColumbia CollegeColumbia International UniversityConverse CollegeErskine CollegeFurman UniversityLimestone College 1 1Lutheran Theological So. Sem.Morris CollegeNewberry CollegeNorth Greenville UniversityPresbyterian CollegeSherman College of ChiropracticSouth University1
Southern Wesleyan UniversityVoorhees CollegeWofford College
SUBTOTAL
Clinton Junior CollegeSpartanburg Methodist College
SUBTOTAL
Art Institute of Charleston Centura College Forrest CollegeGolf Academy of America ITT Technical Institute Johnson and Wales UniversityMiller-Motte Technical College Troy University
SUBTOTALOut-of-StateForeignUnknown 49 69 122 21 261
GRAND TOTAL 94 73 123 22 312
OTHER INSTITUTIONS
INDEPENDENT SENIOR INSTITUTIONS
3 3
INDEPENDENT TWO-YEAR INSTITUTIONS
USC
Lanc
aste
r
USC
Salk
ehat
chie
USC
Sum
ter
USC
Unio
n
Subt
otal
Reg
iona
l Ca
mpu
ses
TRANSFERRING TO:
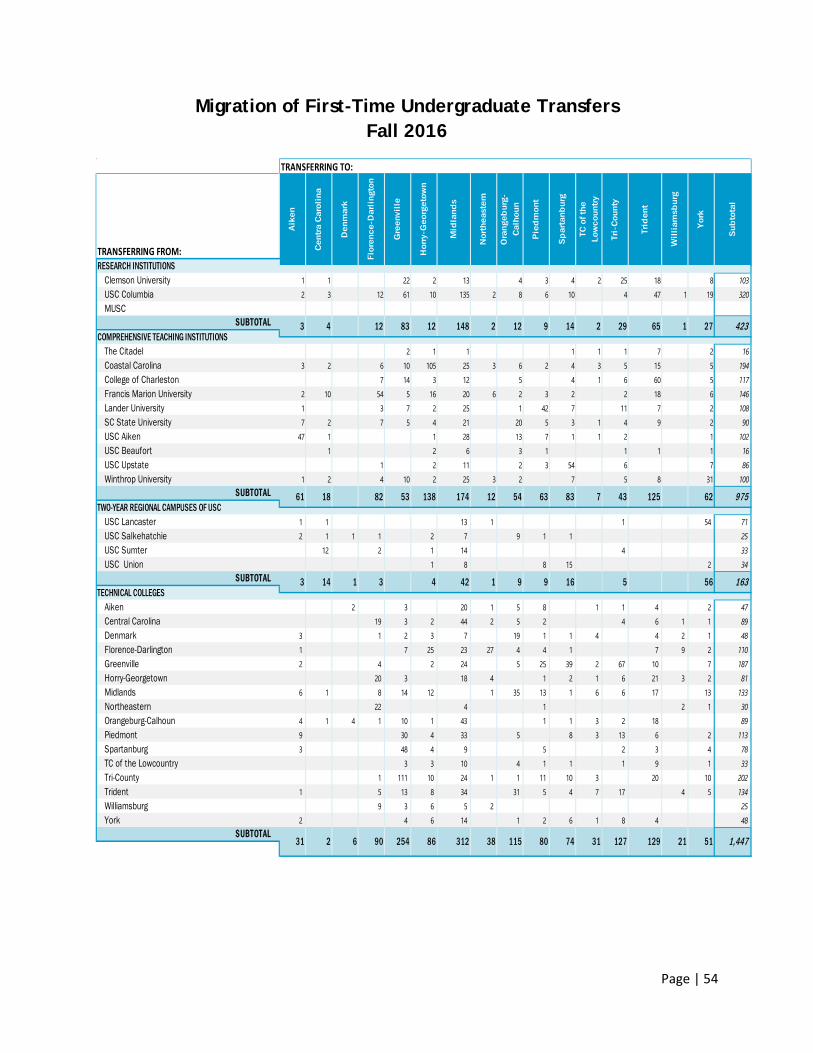
Page | 54
Migration of First-Time Undergraduate Transfers Fall 2016
TRANSFERRING FROM:
Clemson University 1 1 22 2 13 4 3 4 2 25 18 8 103USC Columbia 2 3 12 61 10 135 2 8 6 10 4 47 1 19 320MUSC
SUBTOTAL
The Citadel 2 1 1 1 1 1 7 2 16Coastal Carolina 3 2 6 10 105 25 3 6 2 4 3 5 15 5 194College of Charleston 7 14 3 12 5 4 1 6 60 5 117Francis Marion University 2 10 54 5 16 20 6 2 3 2 2 18 6 146Lander University 1 3 7 2 25 1 42 7 11 7 2 108SC State University 7 2 7 5 4 21 20 5 3 1 4 9 2 90USC Aiken 47 1 1 28 13 7 1 1 2 1 102USC Beaufort 1 2 6 3 1 1 1 1 16USC Upstate 1 2 11 2 3 54 6 7 86Winthrop University 1 2 4 10 2 25 3 2 7 5 8 31 100
SUBTOTAL
USC Lancaster 1 1 13 1 1 54 71 USC Salkehatchie 2 1 1 1 2 7 9 1 1 25 USC Sumter 12 2 1 14 4 33 USC Union 1 8 8 15 2 34
SUBTOTAL
Aiken 2 3 20 1 5 8 1 1 4 2 47 Central Carolina 19 3 2 44 2 5 2 4 6 1 1 89 Denmark 3 1 2 3 7 19 1 1 4 4 2 1 48 Florence-Darlington 1 7 25 23 27 4 4 1 7 9 2 110 Greenville 2 4 2 24 5 25 39 2 67 10 7 187 Horry-Georgetown 20 3 18 4 1 2 1 6 21 3 2 81 Midlands 6 1 8 14 12 1 35 13 1 6 6 17 13 133 Northeastern 22 4 1 2 1 30 Orangeburg-Calhoun 4 1 4 1 10 1 43 1 1 3 2 18 89 Piedmont 9 30 4 33 5 8 3 13 6 2 113 Spartanburg 3 48 4 9 5 2 3 4 78 TC of the Lowcountry 3 3 10 4 1 1 1 9 1 33 Tri-County 1 111 10 24 1 1 11 10 3 20 10 202 Trident 1 5 13 8 34 31 5 4 7 17 4 5 134 Williamsburg 9 3 6 5 2 25 York 2 4 6 14 1 2 6 1 8 4 48
SUBTOTAL
9 14 2
Tri-
Cou
nty
Trid
ent
Wil
liam
sbur
g
TRANSFERRING TO:
Aik
en
Cen
tra
Car
olin
a
Den
mar
k
Flor
ence
-Dar
ling
ton
Gre
envi
lle
Hor
ry-G
eorg
etow
n
York
Sub
tota
l
RESEARCH INSTITUTIONS
3 4 29 65 1 27 423COMPREHENSIVE TEACHING INSTITUTIONS
148 2 1212 83 12
Pie
dm
ont
Sp
arta
nbur
g
TC o
f the
Lo
wco
untr
y
Mid
land
s
Nor
thea
ster
n
Ora
ngeb
urg-
Cal
houn
43 125 62 975TWO-YEAR REGIONAL CAMPUSES OF USC
174 12 54 63 83 761 18 82 53 138
5 56 163TECHNICAL COLLEGES
42 1 9 9 163 14 1 3 4
127 129 21 51 1,447312 38 115 80 74 3131 2 6 90 254 86
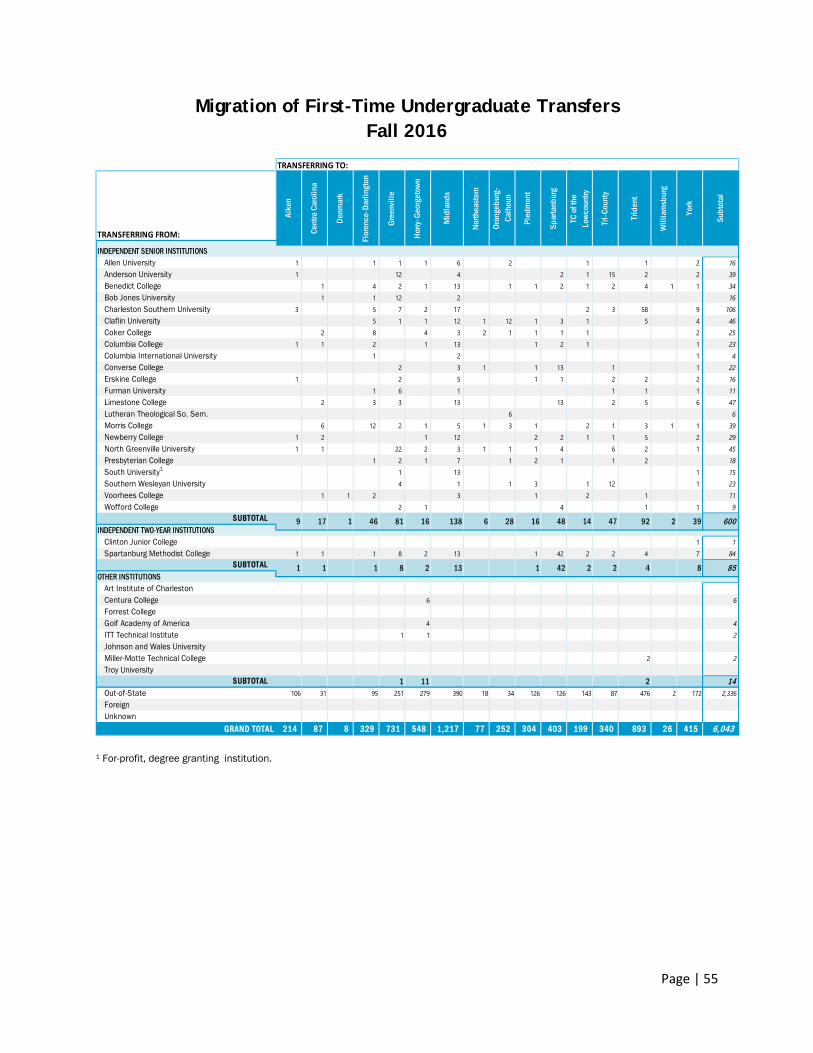
Page | 55
Migration of First-Time Undergraduate Transfers Fall 2016
1 For-profit, degree granting institution.
TRANSFERRING FROM:
INDEPENDENT SENIOR INSTITUTIONSAllen University 1 1 1 1 6 2 1 1 2 16 Anderson University 1 12 4 2 1 15 2 2 39 Benedict College 1 4 2 1 13 1 1 2 1 2 4 1 1 34 Bob Jones University 1 1 12 2 16 Charleston Southern University 3 5 7 2 17 2 3 58 9 106 Claflin University 5 1 1 12 1 12 1 3 1 5 4 46 Coker College 2 8 4 3 2 1 1 1 1 2 25 Columbia College 1 1 2 1 13 1 2 1 1 23 Columbia International University 1 2 1 4 Converse College 2 3 1 1 13 1 1 22 Erskine College 1 2 5 1 1 2 2 2 16 Furman University 1 6 1 1 1 1 11 Limestone College 2 3 3 13 13 2 5 6 47 Lutheran Theological So. Sem. 6 6 Morris College 6 12 2 1 5 1 3 1 2 1 3 1 1 39 Newberry College 1 2 1 12 2 2 1 1 5 2 29 North Greenville University 1 1 22 2 3 1 1 1 4 6 2 1 45 Presbyterian College 1 2 1 7 1 2 1 1 2 18 South University1 1 13 1 15 Southern Wesleyan University 4 1 1 3 1 12 1 23 Voorhees College 1 1 2 3 1 2 1 11 Wofford College 2 1 4 1 1 9
SUBTOTAL
Clinton Junior College 1 1 Spartanburg Methodist College 1 1 1 8 2 13 1 42 2 2 4 7 84
SUBTOTAL
Art Institute of Charleston Centura College 6 6Forrest CollegeGolf Academy of America 4 4ITT Technical Institute 1 1 2Johnson and Wales UniversityMiller-Motte Technical College 2 2Troy University
SUBTOTAL 1 11 2 14Out-of-State 106 31 95 251 279 390 18 34 126 126 143 87 476 2 172 2,336ForeignUnknown
GRAND TOTAL 214 87 8 329 731 548 1,217 77 252 304 403 199 340 893 26 415 6,043
2 4 8 85OTHER INSTITUTIONS
13 1 42 21 1 1 8 2
47 92 2 39 600INDEPENDENT TWO-YEAR INSTITUTIONS
138 6 28 16 48 149 17 1 46 81 16
TRANSFERRING TO:
Aike
n
Cent
ra C
arol
ina
Denm
ark
Flor
ence
-Dar
lingt
on
Trid
ent
Will
iam
sbur
g
York
Subt
otal
Gree
nvill
e
Horry
-Geo
rget
own
Mid
land
s
North
east
ern
Oran
gebu
rg-
Calh
oun
Pied
mon
t
Spar
tanb
urg
TC o
f the
Lo
wcou
ntry
Tri-C
ount
y
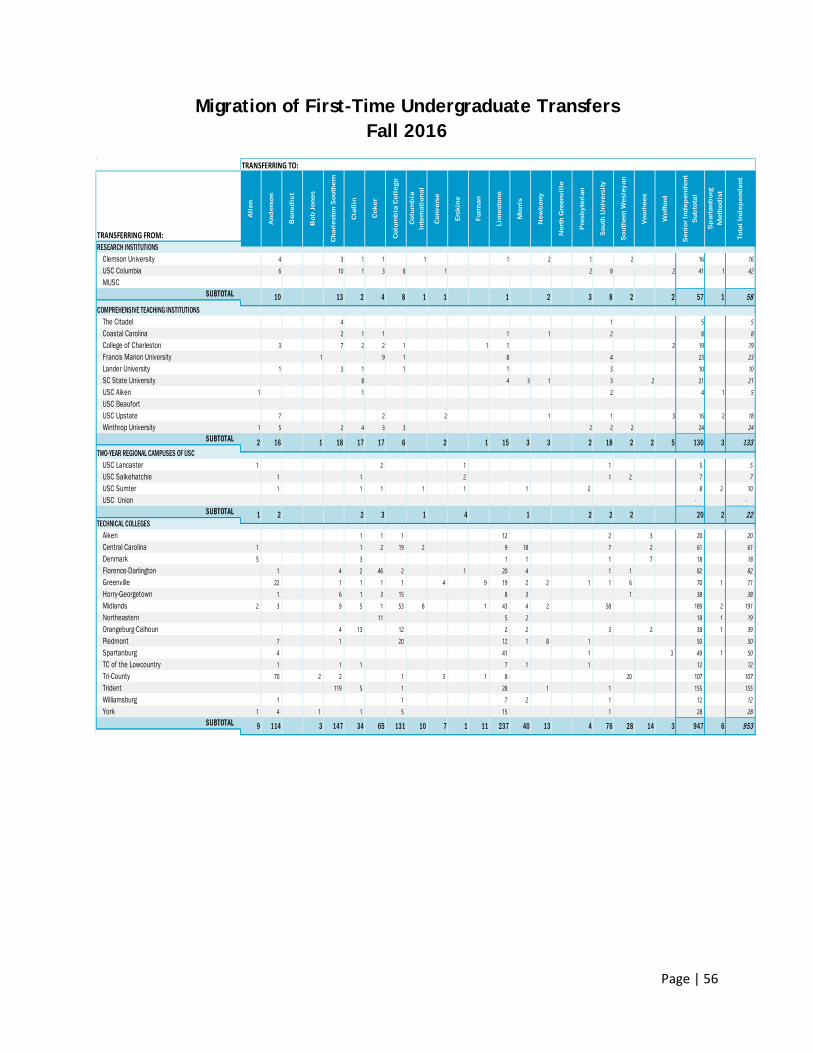
Page | 56
Migration of First-Time Undergraduate Transfers Fall 2016
TRANSFERRING FROM:
Clemson University 4 3 1 1 1 1 2 1 2 16 16USC Columbia 6 10 1 3 8 1 2 8 2 41 1 42MUSC
SUBTOTAL
COMPREHENSIVE TEACHING INSTITUTIONSThe Citadel 4 1 5 5Coastal Carolina 2 1 1 1 1 2 8 8College of Charleston 3 7 2 2 1 1 1 2 19 19Francis Marion University 1 9 1 8 4 23 23Lander University 1 3 1 1 1 3 10 10SC State University 8 4 3 1 3 2 21 21USC Aiken 1 1 2 4 1 5USC BeaufortUSC Upstate 7 2 2 1 1 3 16 2 18Winthrop University 1 5 2 4 3 3 2 2 2 24 24
SUBTOTAL
USC Lancaster 1 2 1 1 5 5 USC Salkehatchie 1 1 2 1 2 7 7 USC Sumter 1 1 1 1 1 1 2 8 2 10 USC Union - -
SUBTOTAL
Aiken 1 1 1 12 2 3 20 20 Central Carolina 1 1 2 19 2 9 18 7 2 61 61 Denmark 5 3 1 1 1 7 18 18 Florence-Darlington 1 4 2 46 2 1 20 4 1 1 82 82 Greenville 22 1 1 1 1 4 9 19 2 2 1 1 6 70 1 71 Horry-Georgetown 1 6 1 3 15 8 3 1 38 38 Midlands 2 3 9 5 1 53 8 1 43 4 2 58 189 2 191 Northeastern 11 5 2 18 1 19 Orangeburg-Calhoun 4 13 12 2 2 3 2 38 1 39 Piedmont 7 1 20 12 1 8 1 50 50 Spartanburg 4 41 1 3 49 1 50 TC of the Lowcountry 1 1 1 7 1 1 12 12 Tri-County 70 2 2 1 3 1 8 20 107 107 Trident 119 5 1 28 1 1 155 155 Williamsburg 1 1 7 2 1 12 12 York 1 4 1 1 5 15 1 28 28
SUBTOTAL
TWO-YEAR REGIONAL CAMPUSES OF USC
TRANSFERRING TO:
All
en
And
erso
n
Ben
edic
t
Bob
Jon
es
Cha
rles
ton
Sou
ther
n
Cla
flin
Cok
er
Col
umb
ia C
olle
ge
Col
umb
ia
Inte
rnat
iona
l
Con
vers
e
Ersk
ine
Furm
an
Lim
esto
ne
Mor
ris
New
ber
ry
Nor
th G
reen
vill
e
Pre
sbyt
eria
n
Sou
th U
nive
rsit
y
Sou
ther
n W
esle
yan
Voor
hees
Wof
ford
Sen
ior I
ndep
end
ent
Sub
tota
l
Sp
arta
nbur
g M
etho
dis
t
Tota
l Ind
epen
den
t
RESEARCH INSTITUTIONS
10 13 2 4 8 1 1 1 2 3 8 2 2 57 1 58
2 16 1 18 17 17 2 18 26 2 1 15 2 5 130 3 1333 3
1 2 2 3 1 4 1 2 2 2 20 2 22TECHNICAL COLLEGES
9 114 3 147 34 65 131 28 1410 7 1 11 237 40 3 947 6 95313 4 76
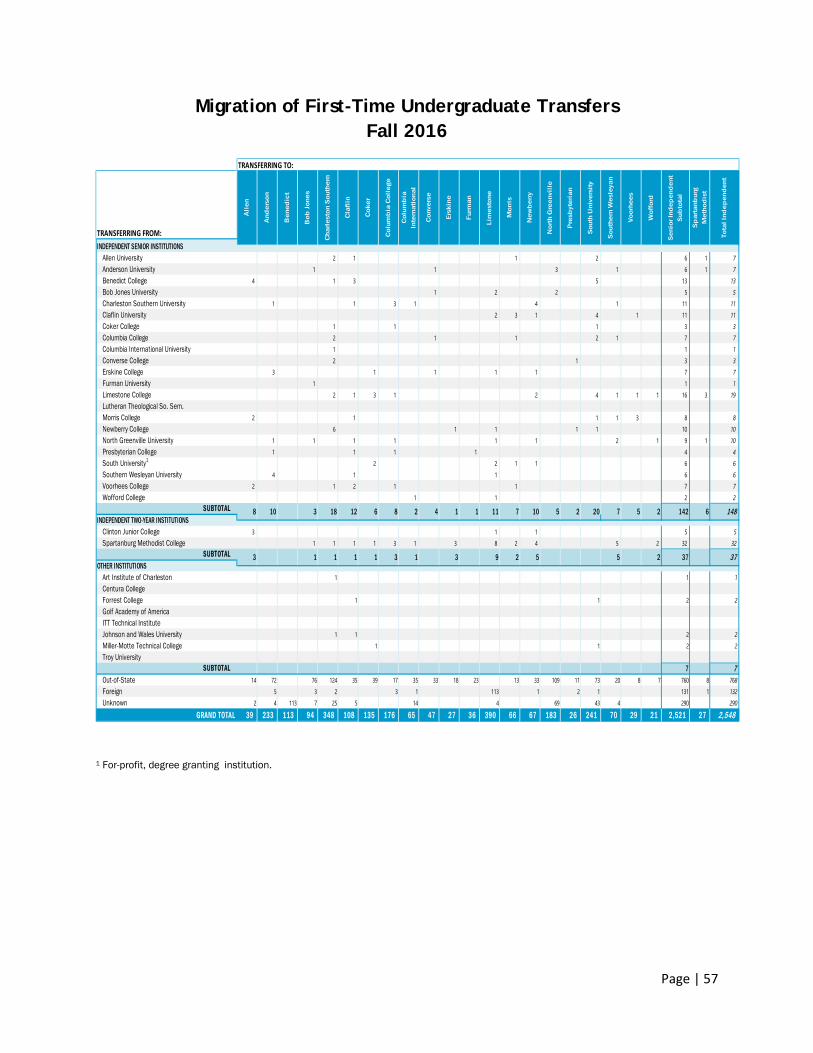
Page | 57
Migration of First-Time Undergraduate Transfers Fall 2016
1 For-profit, degree granting institution.
TRANSFERRING FROM:
Allen University 2 1 1 2 6 1 7Anderson University 1 1 3 1 6 1 7Benedict College 4 1 3 5 13 13Bob Jones University 1 2 2 5 5Charleston Southern University 1 1 3 1 4 1 11 11Claflin University 2 3 1 4 1 11 11Coker College 1 1 1 3 3Columbia College 2 1 1 2 1 7 7Columbia International University 1 1 1Converse College 2 1 3 3Erskine College 3 1 1 1 1 7 7Furman University 1 1 1Limestone College 2 1 3 1 2 4 1 1 1 16 3 19Lutheran Theological So. Sem.Morris College 2 1 1 1 3 8 8Newberry College 6 1 1 1 1 10 10North Greenville University 1 1 1 1 1 1 2 1 9 1 10Presbyterian College 1 1 1 1 4 4South University1 2 2 1 1 6 6Southern Wesleyan University 4 1 1 6 6Voorhees College 2 1 2 1 1 7 7Wofford College 1 1 2 2
SUBTOTAL
Clinton Junior College 3 1 1 5 5 Spartanburg Methodist College 1 1 1 1 3 1 3 8 2 4 5 2 32 32
SUBTOTAL
Art Institute of Charleston 1 1 1Centura College Forrest College 1 1 2 2Golf Academy of America ITT Technical Institute Johnson and Wales University 1 1 2 2Miller-Motte Technical College 1 1 2 2Troy University
SUBTOTAL 7 7Out-of-State 14 72 76 124 35 39 17 35 33 18 23 13 33 109 11 73 20 8 7 760 8 768Foreign 5 3 2 3 1 113 1 2 1 131 1 132Unknown 2 4 113 7 25 5 14 4 69 43 4 290 290
GRAND TOTAL 39 233 113 94 348 108 135 176 65 47 27 36 390 66 67 183 26 241 70 29 21 2,521 27 2,548
37OTHER INSTITUTIONS
51 3 9 2 2 373 1 1 1 1 3 5
2 20 7 51 1 11 7 10 5 2 142 6 148INDEPENDENT TWO-YEAR INSTITUTIONS
8 10 3 18 12 6 8 2 4
Wof
ford
Sen
ior I
ndep
end
ent
Sub
tota
l
Sp
arta
nbur
g M
etho
dis
t
Tota
l Ind
epen
den
t
INDEPENDENT SENIOR INSTITUTIONS
TRANSFERRING TO:
All
en
And
erso
n
Ben
edic
t
Bob
Jon
es
Cha
rles
ton
Sou
ther
n
Cla
flin
Cok
er
Col
umb
ia C
olle
ge
Col
umb
ia
Inte
rnat
iona
l
Con
vers
e
Ersk
ine
Furm
an
Lim
esto
ne
Mor
ris
New
ber
ry
Nor
th G
reen
vill
e
Pre
sbyt
eria
n
Sou
th U
nive
rsit
y
Sou
ther
n W
esle
yan
Voor
hees
Page | 58
Intentionally Blank
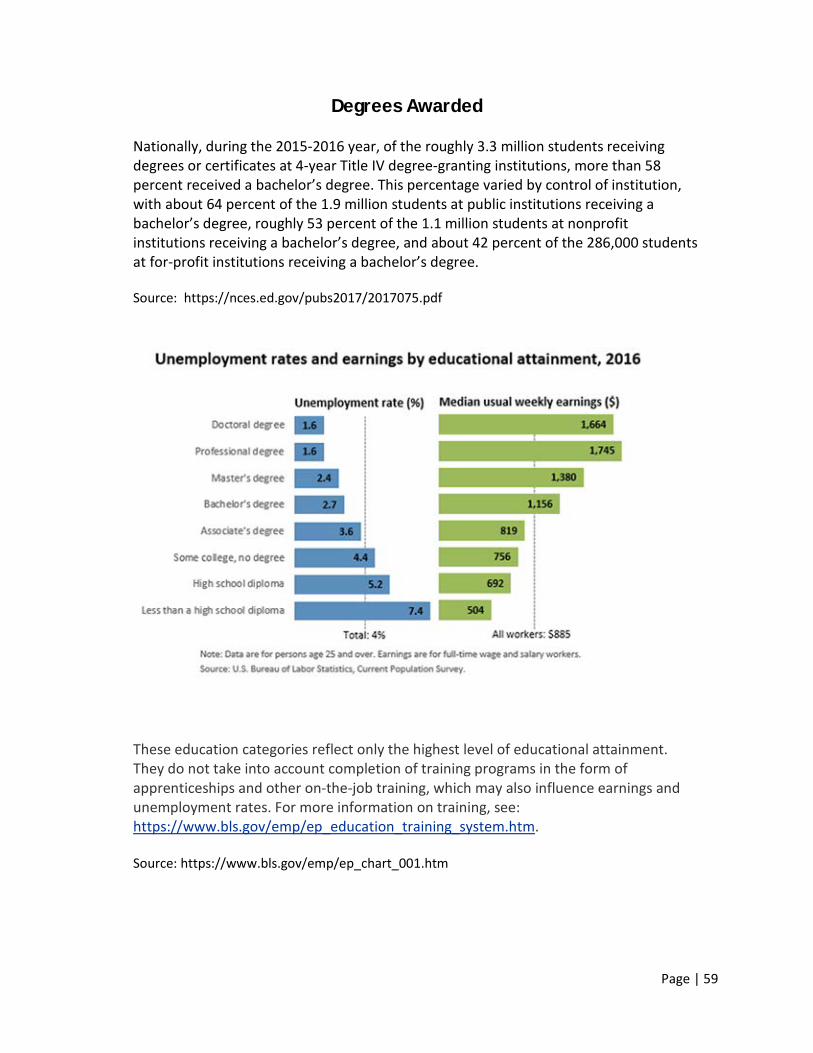
Page | 59
Degrees Awarded
Nationally, during the 2015-2016 year, of the roughly 3.3 million students receiving degrees or certificates at 4-year Title IV degree-granting institutions, more than 58 percent received a bachelor’s degree. This percentage varied by control of institution, with about 64 percent of the 1.9 million students at public institutions receiving a bachelor’s degree, roughly 53 percent of the 1.1 million students at nonprofit institutions receiving a bachelor’s degree, and about 42 percent of the 286,000 students at for-profit institutions receiving a bachelor’s degree. Source: https://nces.ed.gov/pubs2017/2017075.pdf
These education categories reflect only the highest level of educational attainment. They do not take into account completion of training programs in the form of apprenticeships and other on-the-job training, which may also influence earnings and unemployment rates. For more information on training, see: https://www.bls.gov/emp/ep_education_training_system.htm.
Source: https://www.bls.gov/emp/ep_chart_001.htm
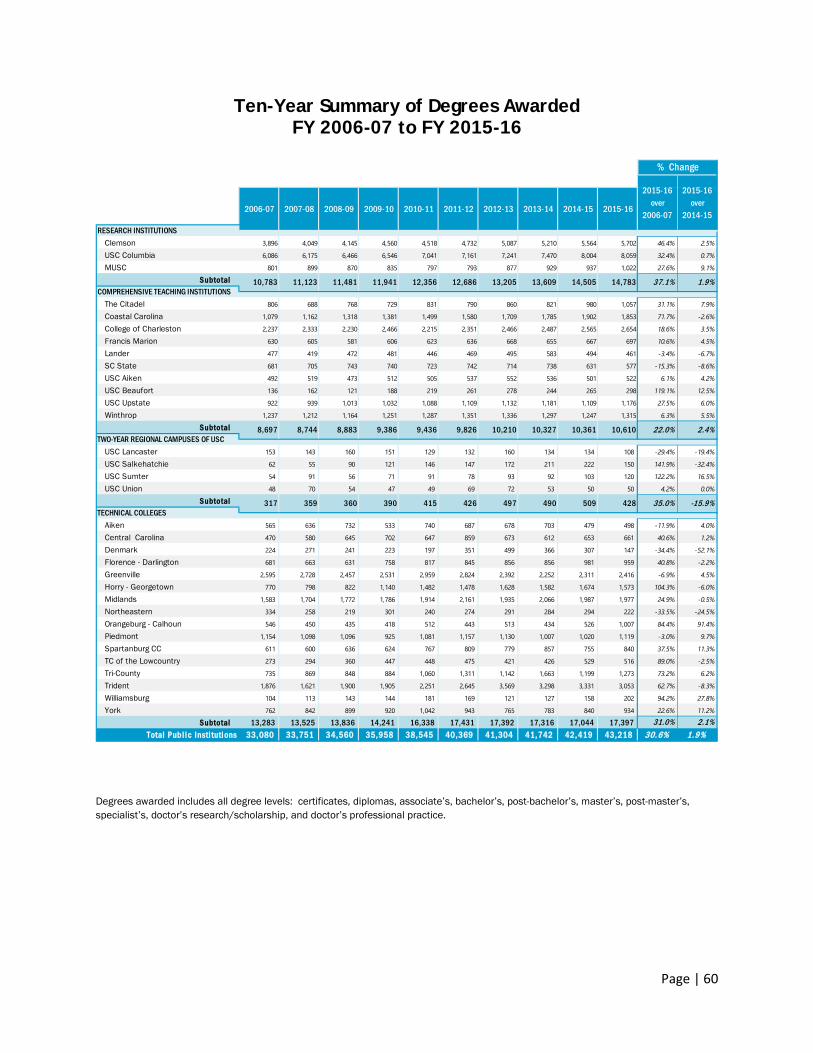
Page | 60
Ten-Year Summary of Degrees Awarded FY 2006-07 to FY 2015-16
Degrees awarded includes all degree levels: certificates, diplomas, associate’s, bachelor’s, post-bachelor’s, master’s, post-master’s, specialist’s, doctor’s research/scholarship, and doctor’s professional practice.
Clemson 3,896 4,049 4,145 4,560 4,518 4,732 5,087 5,210 5,564 5,702 46.4% 2.5%
USC Columbia 6,086 6,175 6,466 6,546 7,041 7,161 7,241 7,470 8,004 8,059 32.4% 0.7%
MUSC 801 899 870 835 797 793 877 929 937 1,022 27.6% 9.1%
Subtotal
The Citadel 806 688 768 729 831 790 860 821 980 1,057 31.1% 7.9%
Coastal Carolina 1,079 1,162 1,318 1,381 1,499 1,580 1,709 1,785 1,902 1,853 71.7% -2.6%
College of Charleston 2,237 2,333 2,230 2,466 2,215 2,351 2,466 2,487 2,565 2,654 18.6% 3.5%
Francis Marion 630 605 581 606 623 636 668 655 667 697 10.6% 4.5%
Lander 477 419 472 481 446 469 495 583 494 461 -3.4% -6.7%
SC State 681 705 743 740 723 742 714 738 631 577 -15.3% -8.6%
USC Aiken 492 519 473 512 505 537 552 536 501 522 6.1% 4.2%
USC Beaufort 136 162 121 188 219 261 278 244 265 298 119.1% 12.5%
USC Upstate 922 939 1,013 1,032 1,088 1,109 1,132 1,181 1,109 1,176 27.5% 6.0%
Winthrop 1,237 1,212 1,164 1,251 1,287 1,351 1,336 1,297 1,247 1,315 6.3% 5.5%
Subtotal
USC Lancaster 153 143 160 151 129 132 160 134 134 108 -29.4% -19.4%
USC Salkehatchie 62 55 90 121 146 147 172 211 222 150 141.9% -32.4%
USC Sumter 54 91 56 71 91 78 93 92 103 120 122.2% 16.5%
USC Union 48 70 54 47 49 69 72 53 50 50 4.2% 0.0%
Subtotal
Aiken 565 636 732 533 740 687 678 703 479 498 -11.9% 4.0%
Central Carolina 470 580 645 702 647 859 673 612 653 661 40.6% 1.2%
Denmark 224 271 241 223 197 351 499 366 307 147 -34.4% -52.1%
Florence - Darlington 681 663 631 758 817 845 856 856 981 959 40.8% -2.2%
Greenville 2,595 2,728 2,457 2,531 2,959 2,824 2,392 2,252 2,311 2,416 -6.9% 4.5%
Horry - Georgetown 770 798 822 1,140 1,482 1,478 1,628 1,582 1,674 1,573 104.3% -6.0%
Midlands 1,583 1,704 1,772 1,786 1,914 2,161 1,935 2,066 1,987 1,977 24.9% -0.5%
Northeastern 334 258 219 301 240 274 291 284 294 222 -33.5% -24.5%
Orangeburg - Calhoun 546 450 435 418 512 443 513 434 526 1,007 84.4% 91.4%
Piedmont 1,154 1,098 1,096 925 1,081 1,157 1,130 1,007 1,020 1,119 -3.0% 9.7%
Spartanburg CC 611 600 636 624 767 809 779 857 755 840 37.5% 11.3%
TC of the Lowcountry 273 294 360 447 448 475 421 426 529 516 89.0% -2.5%
Tri-County 735 869 848 884 1,060 1,311 1,142 1,663 1,199 1,273 73.2% 6.2%
Trident 1,876 1,621 1,900 1,905 2,251 2,645 3,569 3,298 3,331 3,053 62.7% -8.3%
Williamsburg 104 113 143 144 181 169 121 127 158 202 94.2% 27.8%
York 762 842 899 920 1,042 943 765 783 840 934 22.6% 11.2%
Subtotal 13,283 13,525 13,836 14,241 16,338 17,431 17,392 17,316 17,044 17,397 31.0% 2.1%Total Publ ic Insti tutions 33,080 33,751 34,560 35,958 38,545 40,369 41,304 41,742 42,419 43,218 30.6% 1.9%
35.0% -15.9%TECHNICAL COLLEGES
426 497 490 509 428317 359 360 390 415
COMPREHENSIVE TEACHING INSTITUTIONS
8,697 8,744 8,883 9,386 9,436 9,826 10,210 10,327 10,361 10,610 22.0% 2.4%TWO-YEAR REGIONAL CAMPUSES OF USC
2015-16over
2014-15
10,783 11,123 11,481 11,941 12,356 12,686 13,205 13,609 14,505 14,783 37.1% 1.9%
% Change
RESEARCH INSTITUTIONS
2006-07 2007-08 2008-09 2009-10 2010-11 2011-12 2012-13 2013-14 2014-15 2015-16
2015-16over
2006-07
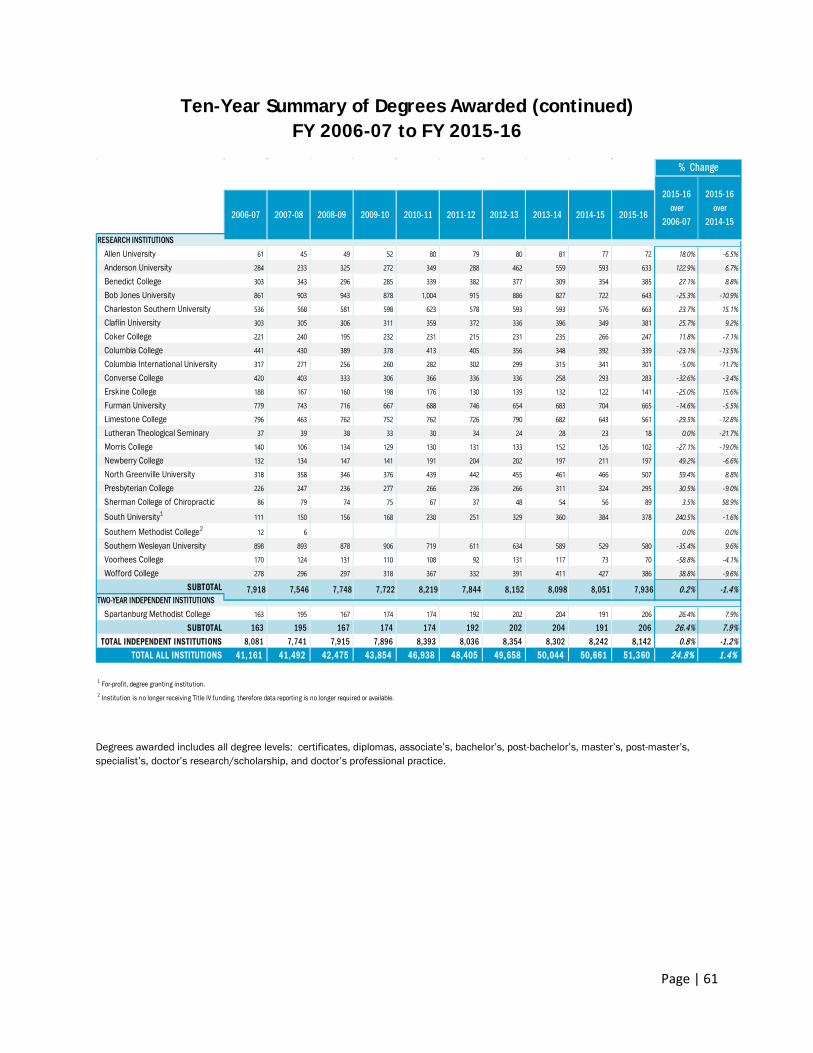
Page | 61
Ten-Year Summary of Degrees Awarded (continued) FY 2006-07 to FY 2015-16
Degrees awarded includes all degree levels: certificates, diplomas, associate’s, bachelor’s, post-bachelor’s, master’s, post-master’s, specialist’s, doctor’s research/scholarship, and doctor’s professional practice.
Allen University 61 45 49 52 80 79 80 81 77 72 18.0% -6.5%
Anderson University 284 233 325 272 349 288 462 559 593 633 122.9% 6.7%
Benedict College 303 343 296 285 339 382 377 309 354 385 27.1% 8.8%
Bob Jones University 861 903 943 878 1,004 915 886 827 722 643 -25.3% -10.9%
Charleston Southern University 536 568 581 598 623 578 593 593 576 663 23.7% 15.1%
Claflin University 303 305 306 311 359 372 336 396 349 381 25.7% 9.2%
Coker College 221 240 195 232 231 215 231 235 266 247 11.8% -7.1%
Columbia College 441 430 389 378 413 405 356 348 392 339 -23.1% -13.5%
Columbia International University 317 271 256 260 282 302 299 315 341 301 -5.0% -11.7%
Converse College 420 403 333 306 366 336 336 258 293 283 -32.6% -3.4%
Erskine College 188 167 160 198 176 130 139 132 122 141 -25.0% 15.6%
Furman University 779 743 716 667 688 746 654 683 704 665 -14.6% -5.5%
Limestone College 796 463 762 752 762 726 790 682 643 561 -29.5% -12.8%
Lutheran Theological Seminary 37 39 38 33 30 34 24 28 23 18 0.0% -21.7%
Morris College 140 106 134 129 130 131 133 152 126 102 -27.1% -19.0%
Newberry College 132 134 147 141 191 204 202 197 211 197 49.2% -6.6%
North Greenville University 318 358 346 376 439 442 455 461 466 507 59.4% 8.8%
Presbyterian College 226 247 236 277 266 236 266 311 324 295 30.5% -9.0%
Sherman College of Chiropractic 86 79 74 75 67 37 48 54 56 89 3.5% 58.9%
South University1 111 150 156 168 230 251 329 360 384 378 240.5% -1.6%
Southern Methodist College2 12 6 0.0% 0.0%
Southern Wesleyan University 898 893 878 906 719 611 634 589 529 580 -35.4% 9.6%
Voorhees College 170 124 131 110 108 92 131 117 73 70 -58.8% -4.1%
Wofford College 278 296 297 318 367 332 391 411 427 386 38.8% -9.6%
SUBTOTAL
Spartanburg Methodist College 163 195 167 174 174 192 202 204 191 206 26.4% 7.9%
SUBTOTAL 163 195 167 174 174 192 202 204 191 206 26.4% 7.9%TOTAL I NDEPENDENT I NSTI TUTI ONS 8,081 7,741 7,915 7,896 8,393 8,036 8,354 8,302 8,242 8,142 0.8% -1.2%
TOTAL ALL INSTITUTIONS 41,161 41,492 42,475 43,854 46,938 48,405 49,658 50,044 50,661 51,360 24.8% 1.4%
1 For-profit, degree granting institution.2 Institution is no longer receiving Title IV funding, therefore data reporting is no longer required or available.
% Change
2015-16over
2006-07
2015-16over
2014-152006-07 2007-08 2008-09 2009-10 2010-11 2011-12 2012-13
7,918 7,546 7,748 7,722 8,219TWO-YEAR INDEPENDENT INSTITUTIONS
-1.4%7,844 8,152 8,098 8,051 7,936 0.2%
2013-14 2014-15 2015-16
RESEARCH INSTITUTIONS
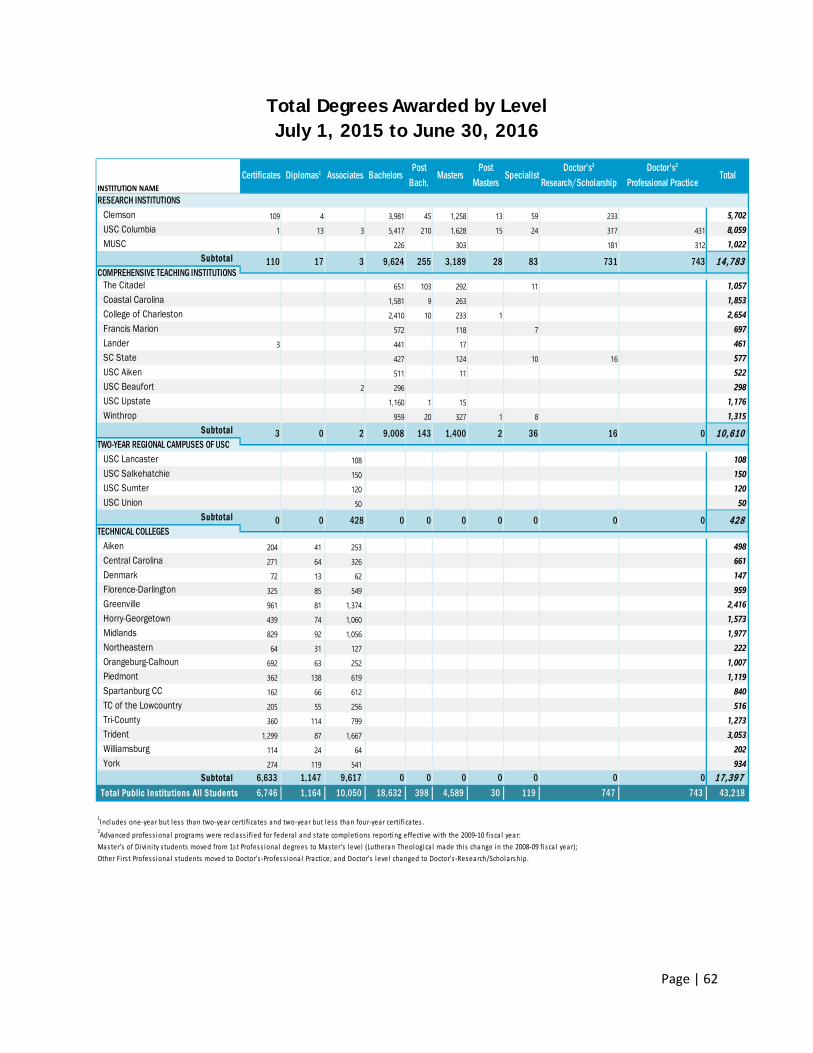
Page | 62
Total Degrees Awarded by Level July 1, 2015 to June 30, 2016
RESEARCH INSTITUTIONSClemson 109 4 3,981 45 1,258 13 59 233 5,702USC Columbia 1 13 3 5,417 210 1,628 15 24 317 431 8,059MUSC 226 303 181 312 1,022
Subtotal
The Citadel 651 103 292 11 1,057Coastal Carolina 1,581 9 263 1,853College of Charleston 2,410 10 233 1 2,654Francis Marion 572 118 7 697Lander 3 441 17 461SC State 427 124 10 16 577USC Aiken 511 11 522USC Beaufort 2 296 298USC Upstate 1,160 1 15 1,176Winthrop 959 20 327 1 8 1,315
Subtotal
USC Lancaster 108 108USC Salkehatchie 150 150USC Sumter 120 120USC Union 50 50
Subtotal
Aiken 204 41 253 498Central Carolina 271 64 326 661Denmark 72 13 62 147Florence-Darlington 325 85 549 959Greenville 961 81 1,374 2,416Horry-Georgetown 439 74 1,060 1,573Midlands 829 92 1,056 1,977Northeastern 64 31 127 222Orangeburg-Calhoun 692 63 252 1,007Piedmont 362 138 619 1,119Spartanburg CC 162 66 612 840TC of the Lowcountry 205 55 256 516Tri-County 360 114 799 1,273Trident 1,299 87 1,667 3,053Williamsburg 114 24 64 202York 274 119 541 934
Subtotal 6,633 1,147 9,617 0 0 0 0 0 0 0 17,397 Total Public I nstitutions All Students 6,746 1,164 10,050 18,632 398 4,589 30 119 747 743 43,218
1Includes one‐year but less than two‐year certi ficates and two‐year but less than four‐year certi fi ca tes .
2Advanced profess ional programs were reclass i fied for federa l and s tate completions reporting effective with the 2009‐10 fi sca l year:
Master's of Divini ty s tudents moved from 1st Profess ional degrees to Master's level (Lutheran Theologica l made thi s change in the 2008‐09 fi sca l year);
Other Fi rs t Profess ional s tudents moved to Doctor's ‐Profess iona l Practice; and Doctor's level changed to Doctor's ‐Research/Scholarship.
Total
14,783
10,610
Certificates Diplomas1 Associates Bachelors Masters SpecialistPost
Bach.Post
MastersDoctor's2
Research/ScholarshipDoctor's2
Professional Practice
428
3 0 2 9,008 143
0
110 17 3 9,624 255 3,189 28 83 731 743
1,400 2 36 16 0
INSTITUTION NAME
COMPREHENSIVE TEACHING INSTITUTIONS
TWO-YEAR REGIONAL CAMPUSES OF USC
TECHNICAL COLLEGES0 0 428 0 0 0 0 0 0
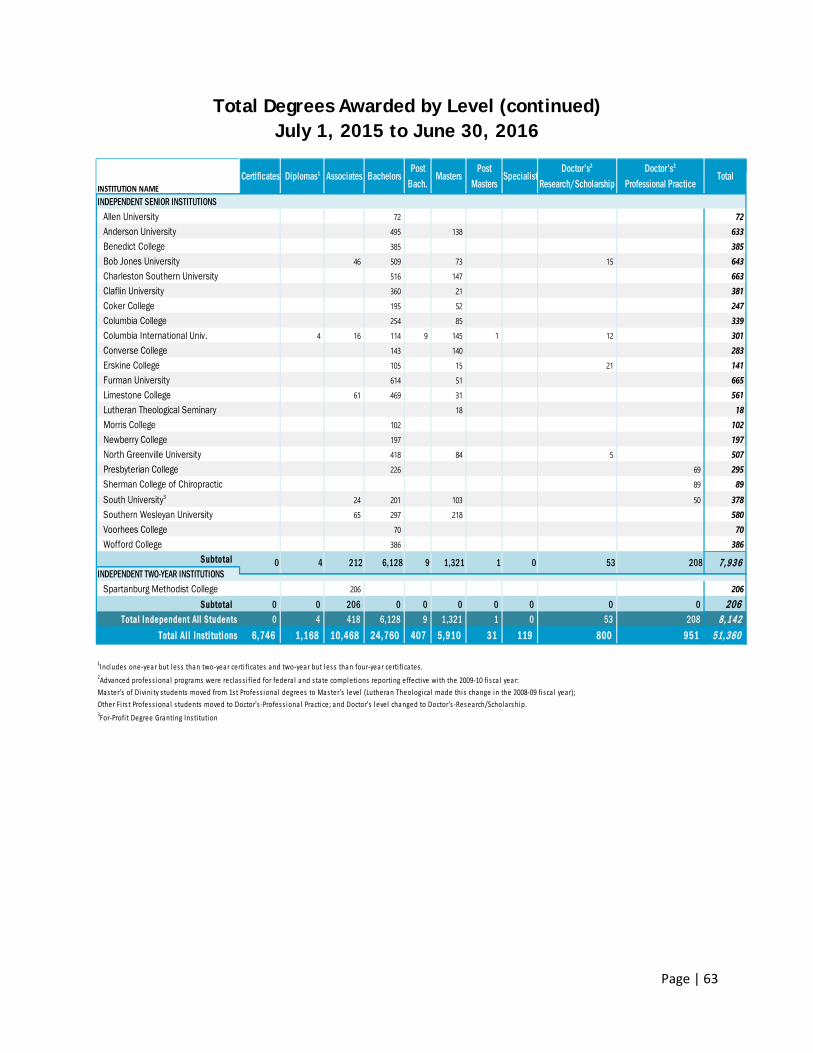
Page | 63
Total Degrees Awarded by Level (continued) July 1, 2015 to June 30, 2016
INDEPENDENT SENIOR INSTITUTIONSAllen University 72 72Anderson University 495 138 633Benedict College 385 385Bob Jones University 46 509 73 15 643Charleston Southern University 516 147 663Claflin University 360 21 381Coker College 195 52 247Columbia College 254 85 339Columbia International Univ. 4 16 114 9 145 1 12 301Converse College 143 140 283Erskine College 105 15 21 141Furman University 614 51 665Limestone College 61 469 31 561Lutheran Theological Seminary 18 18Morris College 102 102Newberry College 197 197North Greenville University 418 84 5 507Presbyterian College 226 69 295Sherman College of Chiropractic 89 89South University3 24 201 103 50 378Southern Wesleyan University 65 297 218 580Voorhees College 70 70Wofford College 386 386
Subtotal
Spartanburg Methodist College 206 206Subtotal 0 0 206 0 0 0 0 0 0 0 206
Total I ndependent All Students 0 4 418 6,128 9 1,321 1 0 53 208 8, 142Total Al l Insti tutions 6,746 1,168 10,468 24,760 407 5,910 31 119 800 951 51,360
1Includes one-year but less than two-year certi fi cates and two-year but less than four-year certi fi cates .2Advanced profess ional programs were reclass i fied for federa l and s tate completions reporting effective with the 2009-10 fi sca l year: Master's of Divini ty s tudents moved from 1st Profess ional degrees to Master's level (Lutheran Theologica l made this change in the 2008-09 fi sca l year); Other Fi rs t Profess ional s tudents moved to Doctor's -Profess ional Practice; and Doctor's level changed to Doctor's -Research/Scholarship. 3For-Profi t Degree Granting Insti tution
INSTITUTION NAME
Post Masters
212 6,128 9 1,321
Associates BachelorsPost
Bach.Masters
INDEPENDENT TWO-YEAR INSTITUTIONS0
SpecialistDoctor's2
Research/ScholarshipDoctor's2
Professional Practice
7, 936
Total
1 0 53 208
Certificates Diplomas1
4
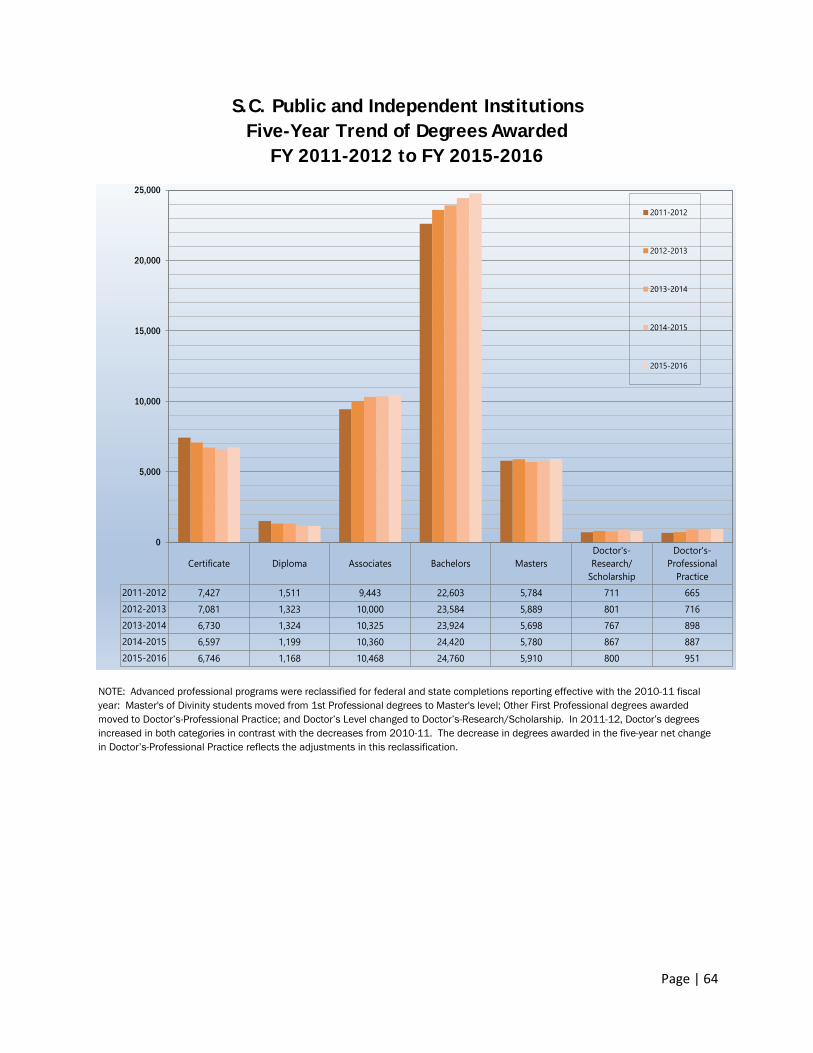
Page | 64
S.C. Public and Independent InstitutionsFive-Year Trend of Degrees Awarded
FY 2011-2012 to FY 2015-2016
NOTE: Advanced professional programs were reclassified for federal and state completions reporting effective with the 2010-11 fiscal year: Master's of Divinity students moved from 1st Professional degrees to Master's level; Other First Professional degrees awarded moved to Doctor’s-Professional Practice; and Doctor’s Level changed to Doctor’s-Research/Scholarship. In 2011-12, Doctor’s degrees increased in both categories in contrast with the decreases from 2010-11. The decrease in degrees awarded in the five-year net change in Doctor’s-Professional Practice reflects the adjustments in this reclassification.
Certificate Diploma Associates Bachelors MastersDoctor's-Research/
Scholarship
Doctor's-Professional
Practice2011-2012 7,427 1,511 9,443 22,603 5,784 711 6652012-2013 7,081 1,323 10,000 23,584 5,889 801 7162013-2014 6,730 1,324 10,325 23,924 5,698 767 8982014-2015 6,597 1,199 10,360 24,420 5,780 867 8872015-2016 6,746 1,168 10,468 24,760 5,910 800 951
0
5,000
10,000
15,000
20,000
25,000
2011-2012
2012-2013
2013-2014
2014-2015
2015-2016
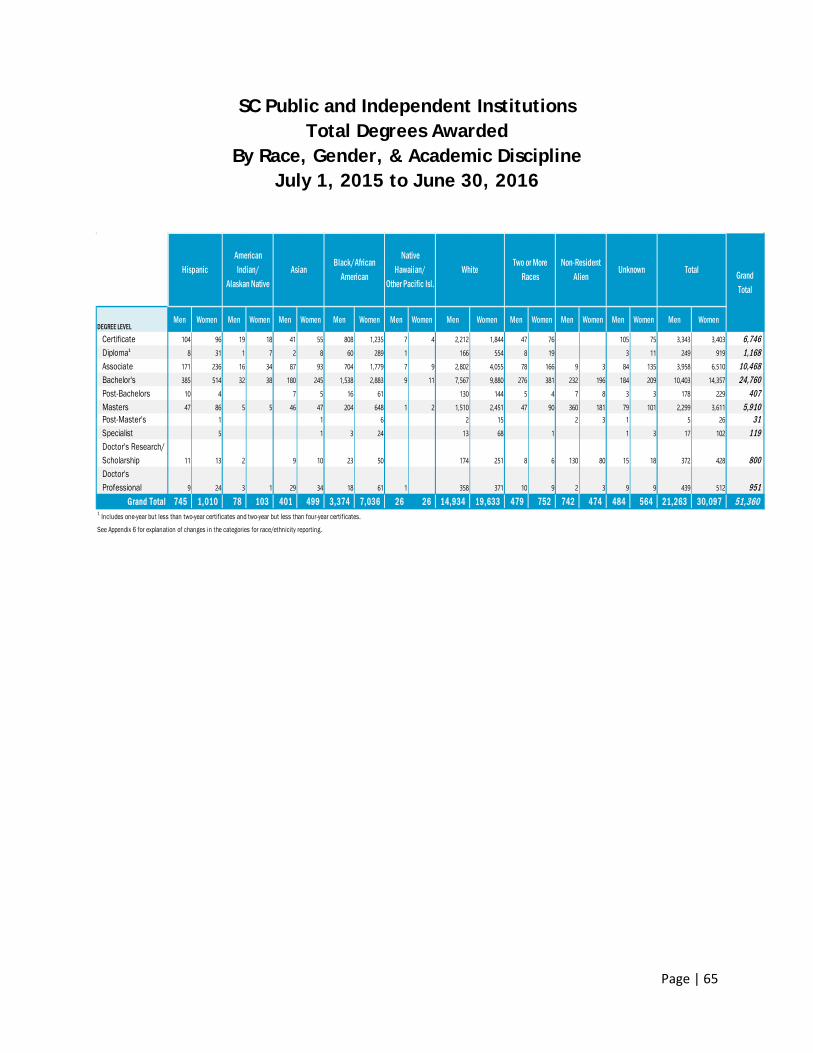
Page | 65
DEGREE LEVELMen Women Men Women Men Women Men Women Men Women Men Women Men Women Men Women Men Women Men Women
Certificate 104 96 19 18 41 55 808 1,235 7 4 2,212 1,844 47 76 105 75 3,343 3,403 6,746 Diploma1 8 31 1 7 2 8 60 289 1 166 554 8 19 3 11 249 919 1,168 Associate 171 236 16 34 87 93 704 1,779 7 9 2,802 4,055 78 166 9 3 84 135 3,958 6,510 10,468 Bachelor's 385 514 32 38 180 245 1,538 2,883 9 11 7,567 9,880 276 381 232 196 184 209 10,403 14,357 24,760 Post-Bachelors 10 4 7 5 16 61 130 144 5 4 7 8 3 3 178 229 407 Masters 47 86 5 5 46 47 204 648 1 2 1,510 2,451 47 90 360 181 79 101 2,299 3,611 5,910 Post-Master's 1 1 6 2 15 2 3 1 5 26 31 Specialist 5 1 3 24 13 68 1 1 3 17 102 119 Doctor's Research/Scholarship 11 13 2 9 10 23 50 174 251 8 6 130 80 15 18 372 428 800 Doctor's Professional 9 24 3 1 29 34 18 61 1 358 371 10 9 2 3 9 9 439 512 951
Grand Total 745 1,010 78 103 401 499 3,374 7,036 26 26 14,934 19,633 479 752 742 474 484 564 21,263 30,097 51,360 1 Includes one-year but less than two-year certificates and two-year but less than four-year certificates.
See Appendix 6 for explanation of changes in the categories for race/ethnicity reporting.
WhiteTwo or More
RacesNon-Resident
AlienUnknown Total Grand
Total
HispanicAmerican Indian/
Alaskan NativeAsian
Black/AfricanAmerican
Native Hawaiian/
Other Pacific Isl.
SC Public and Independent Institutions Total Degrees Awarded
By Race, Gender, & Academic Discipline July 1, 2015 to June 30, 2016
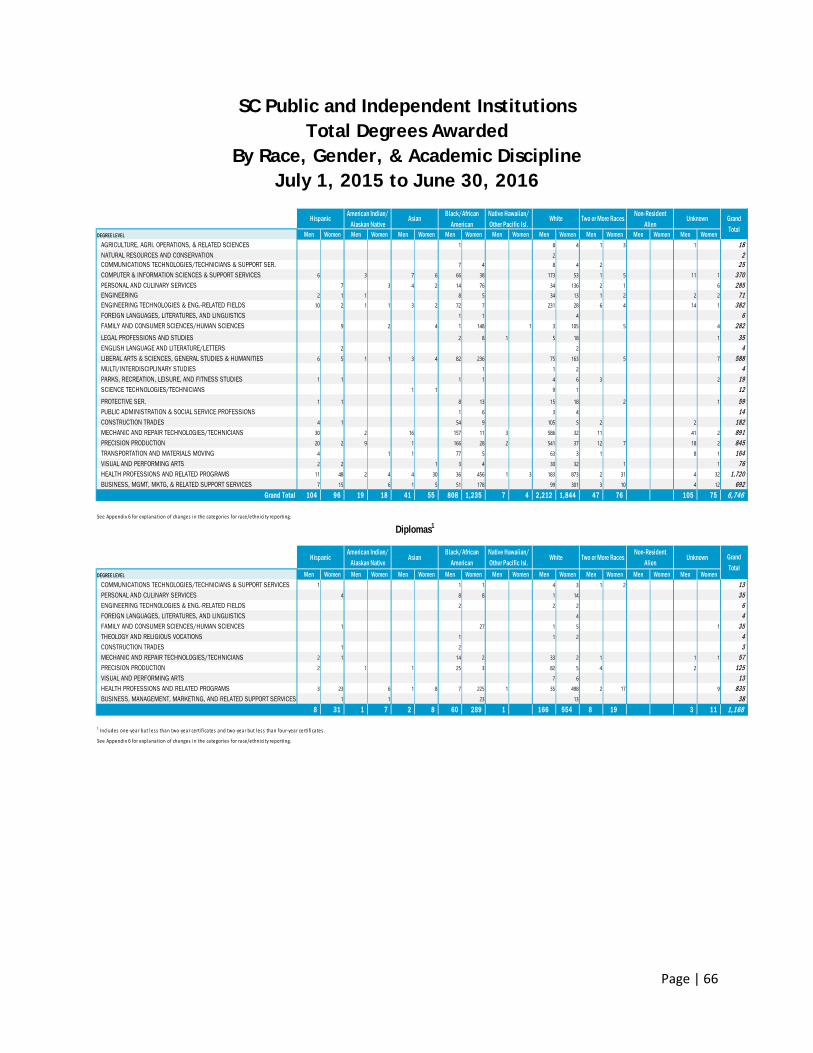
Page | 66
DEGREE LEVEL Men Women Men Women Men Women Men Women Men Women Men Women Men Women Men Women Men WomenAGRICULTURE, AGRI. OPERATIONS, & RELATED SCIENCES 1 8 4 1 3 1 18 NATURAL RESOURCES AND CONSERVATION 2 2 COMMUNICATIONS TECHNOLOGIES/TECHNICIANS & SUPPORT SER. 7 4 8 4 2 25 COMPUTER & INFORMATION SCIENCES & SUPPORT SERVICES 6 3 7 6 66 38 173 53 1 5 11 1 370 PERSONAL AND CULINARY SERVICES 7 3 4 2 14 76 34 136 2 1 6 285 ENGINEERING 2 1 1 8 5 34 13 1 2 2 2 71 ENGINEERING TECHNOLOGIES & ENG.-RELATED FIELDS 10 2 1 1 3 2 72 7 231 28 6 4 14 1 382 FOREIGN LANGUAGES, LITERATURES, AND LINGUISTICS 1 1 4 6 FAMILY AND CONSUMER SCIENCES/HUMAN SCIENCES 9 2 4 1 148 1 3 105 5 4 282 LEGAL PROFESSIONS AND STUDIES 2 8 1 5 18 1 35 ENGLISH LANGUAGE AND LITERATURE/LETTERS 2 2 4 LIBERAL ARTS & SCIENCES, GENERAL STUDIES & HUMANITIES 6 5 1 1 3 4 82 236 75 163 5 7 588 MULTI/INTERDISCIPLINARY STUDIES 1 1 2 4 PARKS, RECREATION, LEISURE, AND FITNESS STUDIES 1 1 1 1 4 6 3 2 19 SCIENCE TECHNOLOGIES/TECHNICIANS 1 1 9 1 12 PROTECTIVE SER. 1 1 8 13 15 18 2 1 59 PUBLIC ADMINISTRATION & SOCIAL SERVICE PROFESSIONS 1 6 3 4 14 CONSTRUCTION TRADES 4 1 54 9 105 5 2 2 182 MECHANIC AND REPAIR TECHNOLOGIES/TECHNICIANS 30 2 16 157 11 3 586 32 11 41 2 891 PRECISION PRODUCTION 20 2 9 1 166 28 2 541 37 12 7 18 2 845 TRANSPORTATION AND MATERIALS MOVING 4 1 1 77 5 63 3 1 8 1 164 VISUAL AND PERFORMING ARTS 2 2 1 3 4 30 32 1 1 76 HEALTH PROFESSIONS AND RELATED PROGRAMS 11 48 2 4 4 30 36 456 1 3 183 873 2 31 4 32 1,720 BUSINESS, MGMT, MKTG, & RELATED SUPPORT SERVICES 7 15 6 1 5 51 178 99 301 3 10 4 12 692
Grand Total 104 96 19 18 41 55 808 1,235 7 4 2,212 1,844 47 76 105 75 6,746
See Appendix 6 for explanation of changes in the categories for race/ethnici ty reporting.
DEGREE LEVEL Men Women Men Women Men Women Men Women Men Women Men Women Men Women Men Women Men WomenCOMMUNICATIONS TECHNOLOGIES/TECHNICIANS & SUPPORT SERVICES 1 1 1 4 3 1 2 13 PERSONAL AND CULINARY SERVICES 4 8 8 1 14 35 ENGINEERING TECHNOLOGIES & ENG.-RELATED FIELDS 2 2 2 6 FOREIGN LANGUAGES, LITERATURES, AND LINGUISTICS 4 4 FAMILY AND CONSUMER SCIENCES/HUMAN SCIENCES 1 27 1 5 1 35 THEOLOGY AND RELIGIOUS VOCATIONS 1 1 2 4 CONSTRUCTION TRADES 1 2 3 MECHANIC AND REPAIR TECHNOLOGIES/TECHNICIANS 2 1 14 2 33 2 1 1 1 57 PRECISION PRODUCTION 2 1 1 25 3 82 5 4 2 125 VISUAL AND PERFORMING ARTS 7 6 13 HEALTH PROFESSIONS AND RELATED PROGRAMS 3 23 6 1 8 7 225 1 35 498 2 17 9 835 BUSINESS, MANAGEMENT, MARKETING, AND RELATED SUPPORT SERVICES 1 1 23 13 38
8 31 1 7 2 8 60 289 1 166 554 8 19 3 11 1,168
1 Includes one-year but less than two-year certi fi cates and two-year but less than four-year certi fi cates .
See Appendix 6 for explanation of changes in the categories for race/ethnici ty reporting.
White
Hispanic American Indian/Alaskan Native
Asian Black/AfricanAmerican
Native Hawaiian/Other Pacific Isl.
White
HispanicAmerican Indian/
Alaskan NativeAsian
Black/AfricanAmerican
Native Hawaiian/Other Pacific Isl.
Diplomas1
Two or More RacesNon-Resident
AlienUnknown Grand
Total
Two or More Races Non-Resident Alien
Unknown Grand Total
SC Public and Independent Institutions Total Degrees Awarded
By Race, Gender, & Academic Discipline July 1, 2015 to June 30, 2016
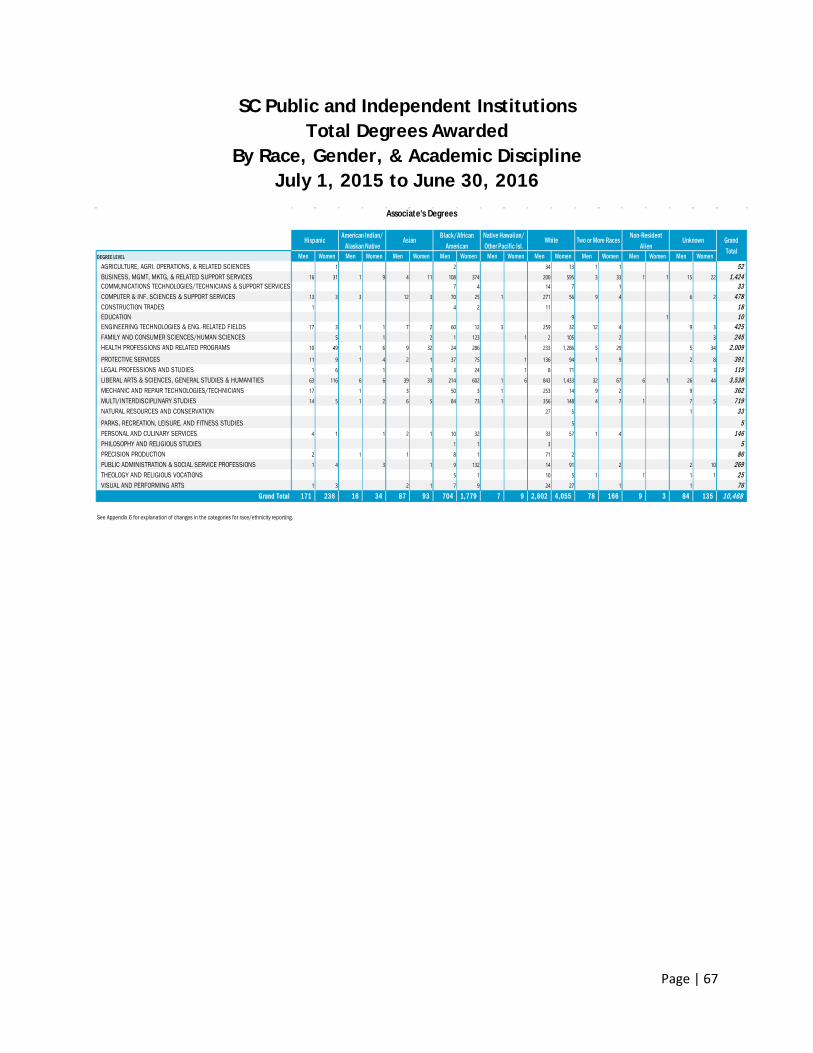
Page | 67
SC Public and Independent Institutions Total Degrees Awarded
By Race, Gender, & Academic Discipline July 1, 2015 to June 30, 2016
Associate's Degrees
DEGREE LEVEL Men Women Men Women Men Women Men Women Men Women Men Women Men Women Men Women Men WomenAGRICULTURE, AGRI. OPERATIONS, & RELATED SCIENCES 1 2 34 13 1 1 52 BUSINESS, MGMT, MKTG, & RELATED SUPPORT SERVICES 16 31 1 9 4 11 108 374 200 595 3 33 1 1 15 22 1,424 COMMUNICATIONS TECHNOLOGIES/TECHNICIANS & SUPPORT SERVICES 7 4 14 7 1 33 COMPUTER & INF. SCIENCES & SUPPORT SERVICES 13 3 3 12 3 70 25 1 271 56 9 4 6 2 478 CONSTRUCTION TRADES 1 4 2 11 18 EDUCATION 9 1 10 ENGINEERING TECHNOLOGIES & ENG.-RELATED FIELDS 17 3 1 1 7 2 60 12 3 259 32 12 4 9 3 425 FAMILY AND CONSUMER SCIENCES/HUMAN SCIENCES 5 1 2 1 123 1 2 105 2 3 245 HEALTH PROFESSIONS AND RELATED PROGRAMS 10 49 1 6 9 32 24 286 233 1,286 5 29 5 34 2,009 PROTECTIVE SERVICES 11 9 1 4 2 1 37 75 1 136 94 1 9 2 8 391 LEGAL PROFESSIONS AND STUDIES 1 6 1 1 3 24 1 8 71 3 119 LIBERAL ARTS & SCIENCES, GENERAL STUDIES & HUMANITIES 63 116 6 6 39 33 214 602 1 6 843 1,433 32 67 6 1 26 44 3,538 MECHANIC AND REPAIR TECHNOLOGIES/TECHNICIANS 17 1 3 50 3 1 253 14 9 2 9 362 MULTI/INTERDISCIPLINARY STUDIES 14 5 1 2 6 5 84 73 1 356 148 4 7 1 7 5 719 NATURAL RESOURCES AND CONSERVATION 27 5 1 33 PARKS, RECREATION, LEISURE, AND FITNESS STUDIES 5 5 PERSONAL AND CULINARY SERVICES 4 1 1 2 1 10 32 33 57 1 4 146 PHILOSOPHY AND RELIGIOUS STUDIES 1 1 3 5 PRECISION PRODUCTION 2 1 1 8 1 71 2 86 PUBLIC ADMINISTRATION & SOCIAL SERVICE PROFESSIONS 1 4 3 1 9 132 14 91 2 2 10 269 THEOLOGY AND RELIGIOUS VOCATIONS 5 1 10 5 1 1 1 1 25 VISUAL AND PERFORMING ARTS 1 3 2 1 7 9 24 27 1 1 76
Grand Total 171 236 16 34 87 93 704 1,779 7 9 2,802 4,055 78 166 9 3 84 135 10,468
See Appendix 6 for explanation of changes in the categories for race/ethnicity reporting.
Two or More Races Non-Resident Alien
Unknown Grand Total
Hispanic American Indian/Alaskan Native
Asian Black/AfricanAmerican
Native Hawaiian/Other Pacific Isl.
White
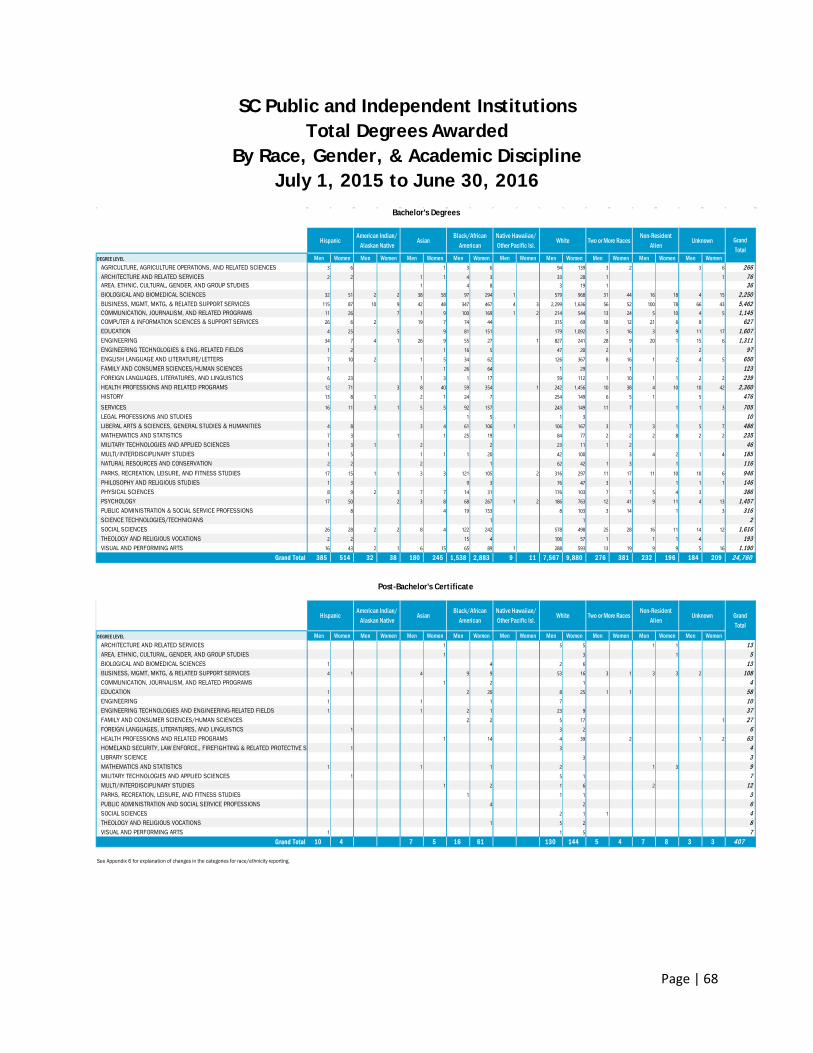
Page | 68
SC Public and Independent Institutions Total Degrees Awarded
By Race, Gender, & Academic Discipline July 1, 2015 to June 30, 2016
Bachelor's Degrees
DEGREE LEVEL Men Women Men Women Men Women Men Women Men Women Men Women Men Women Men Women Men WomenAGRICULTURE, AGRICULTURE OPERATIONS, AND RELATED SCIENCES 3 6 1 3 6 94 139 3 2 3 6 266 ARCHITECTURE AND RELATED SERVICES 2 2 1 1 4 3 33 28 1 1 76 AREA, ETHNIC, CULTURAL, GENDER, AND GROUP STUDIES 1 4 8 3 19 1 36 BIOLOGICAL AND BIOMEDICAL SCIENCES 32 51 2 2 38 58 97 294 1 579 968 31 44 16 18 4 15 2,250 BUSINESS, MGMT, MKTG, & RELATED SUPPORT SERVICES 115 87 10 9 42 48 347 467 4 3 2,299 1,636 56 52 100 78 66 43 5,462 COMMUNICATION, JOURNALISM, AND RELATED PROGRAMS 11 26 7 1 9 100 169 1 2 214 544 13 24 5 10 4 5 1,145 COMPUTER & INFORMATION SCIENCES & SUPPORT SERVICES 26 6 2 19 7 74 44 315 69 18 12 21 6 8 627 EDUCATION 4 25 5 9 81 151 179 1,092 5 16 3 9 11 17 1,607 ENGINEERING 34 7 4 1 26 9 55 27 1 827 241 28 9 20 1 15 6 1,311 ENGINEERING TECHNOLOGIES & ENG.-RELATED FIELDS 1 2 1 16 5 47 20 2 1 2 97 ENGLISH LANGUAGE AND LITERATURE/LETTERS 7 10 2 1 5 34 62 126 367 8 16 1 2 4 5 650 FAMILY AND CONSUMER SCIENCES/HUMAN SCIENCES 1 1 26 64 1 29 1 123 FOREIGN LANGUAGES, LITERATURES, AND LINGUISTICS 6 23 1 3 1 17 59 112 1 10 1 1 2 2 239 HEALTH PROFESSIONS AND RELATED PROGRAMS 12 71 3 8 40 59 354 1 242 1,456 10 38 4 10 10 42 2,360 HISTORY 13 8 1 2 1 24 7 254 149 6 5 1 5 476 SERVICES 16 11 3 1 5 5 92 157 243 149 11 7 1 1 3 705 LEGAL PROFESSIONS AND STUDIES 1 5 1 3 10 LIBERAL ARTS & SCIENCES, GENERAL STUDIES & HUMANITIES 4 8 3 4 61 106 1 106 167 3 7 3 1 5 7 486 MATHEMATICS AND STATISTICS 7 3 1 1 25 19 84 77 2 2 2 8 2 2 235 MILITARY TECHNOLOGIES AND APPLIED SCIENCES 1 3 1 2 2 23 11 1 2 46 MULTI/INTERDISCIPLINARY STUDIES 1 5 1 1 1 20 42 100 3 4 2 1 4 185 NATURAL RESOURCES AND CONSERVATION 2 2 2 1 62 42 1 3 1 116 PARKS, RECREATION, LEISURE, AND FITNESS STUDIES 17 15 1 1 3 3 121 105 2 316 297 11 17 11 10 10 6 946 PHILOSOPHY AND RELIGIOUS STUDIES 1 3 9 3 76 47 3 1 1 1 1 146 PHYSICAL SCIENCES 8 9 2 3 7 7 14 31 176 103 7 7 5 4 3 386 PSYCHOLOGY 17 50 2 3 8 68 267 1 2 186 763 12 41 9 11 4 13 1,457 PUBLIC ADMINISTRATION & SOCIAL SERVICE PROFESSIONS 8 4 19 153 8 103 3 14 1 3 316 SCIENCE TECHNOLOGIES/TECHNICIANS 1 1 2 SOCIAL SCIENCES 26 28 2 2 8 4 122 242 578 498 25 28 16 11 14 12 1,616 THEOLOGY AND RELIGIOUS VOCATIONS 2 2 15 4 106 57 1 1 1 4 193 VISUAL AND PERFORMING ARTS 16 43 2 1 6 15 65 89 1 288 593 13 19 9 9 5 16 1,190
Grand Total 385 514 32 38 180 245 1,538 2,883 9 11 7,567 9,880 276 381 232 196 184 209 24,760
DEGREE LEVEL Men Women Men Women Men Women Men Women Men Women Men Women Men Women Men Women Men WomenARCHITECTURE AND RELATED SERVICES 1 5 5 1 1 13 AREA, ETHNIC, CULTURAL, GENDER, AND GROUP STUDIES 1 3 1 5 BIOLOGICAL AND BIOMEDICAL SCIENCES 1 4 2 6 13 BUSINESS, MGMT, MKTG, & RELATED SUPPORT SERVICES 4 1 4 9 9 53 16 3 1 3 3 2 108 COMMUNICATION, JOURNALISM, AND RELATED PROGRAMS 1 2 1 4 EDUCATION 1 2 20 8 25 1 1 58 ENGINEERING 1 1 1 7 10 ENGINEERING TECHNOLOGIES AND ENGINEERING-RELATED FIELDS 1 1 2 1 23 9 37 FAMILY AND CONSUMER SCIENCES/HUMAN SCIENCES 2 2 5 17 1 27 FOREIGN LANGUAGES, LITERATURES, AND LINGUISTICS 1 3 2 6 HEALTH PROFESSIONS AND RELATED PROGRAMS 1 14 4 39 2 1 2 63 HOMELAND SECURITY, LAW ENFORCE., FIREFIGHTING & RELATED PROTECTIVE S 1 3 4 LIBRARY SCIENCE 3 3 MATHEMATICS AND STATISTICS 1 1 1 2 1 3 9 MILITARY TECHNOLOGIES AND APPLIED SCIENCES 1 5 1 7 MULTI/INTERDISCIPLINARY STUDIES 1 2 1 6 2 12 PARKS, RECREATION, LEISURE, AND FITNESS STUDIES 1 1 1 3 PUBLIC ADMINISTRATION AND SOCIAL SERVICE PROFESSIONS 4 2 6 SOCIAL SCIENCES 2 1 1 4 THEOLOGY AND RELIGIOUS VOCATIONS 1 5 2 8 VISUAL AND PERFORMING ARTS 1 1 5 7
Grand Total 10 4 7 5 16 61 130 144 5 4 7 8 3 3 407
See Appendix 6 for explanation of changes in the categories for race/ethnicity reporting.
Post-Bachelor's Certificate
White
HispanicAmerican Indian/
Alaskan NativeAsian
Black/AfricanAmerican
Native Hawaiian/Other Pacific Isl.
White
HispanicAmerican Indian/
Alaskan NativeAsian
Black/AfricanAmerican
Native Hawaiian/Other Pacific Isl.
Two or More RacesNon-Resident
AlienUnknown Grand
Total
Two or More RacesNon-Resident
AlienUnknown Grand
Total
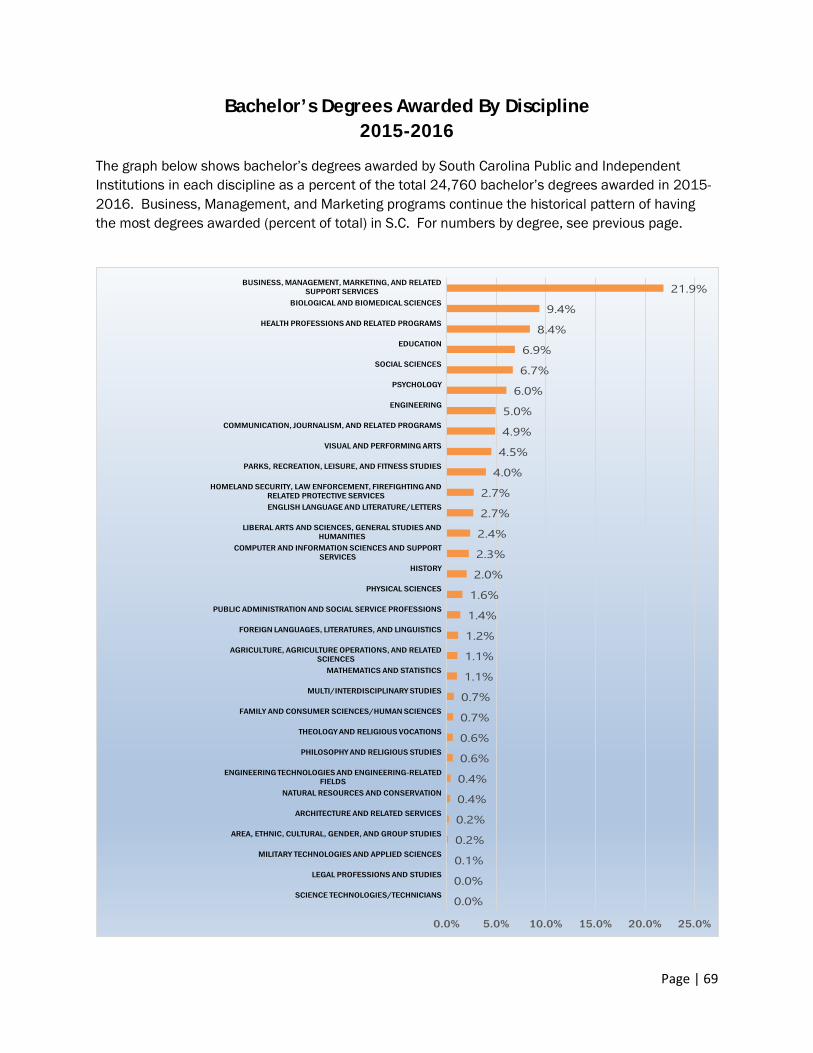
Page | 69
Bachelor’s Degrees Awarded By Discipline 2015-2016
The graph below shows bachelor’s degrees awarded by South Carolina Public and Independent Institutions in each discipline as a percent of the total 24,760 bachelor’s degrees awarded in 2015-2016. Business, Management, and Marketing programs continue the historical pattern of having the most degrees awarded (percent of total) in S.C. For numbers by degree, see previous page.
0.0%
0.0%
0.1%
0.2%
0.2%
0.4%
0.4%
0.6%
0.6%
0.7%
0.7%
1.1%
1.1%
1.2%
1.4%
1.6%
2.0%
2.3%
2.4%
2.7%
2.7%
4.0%
4.5%
4.9%
5.0%
6.0%
6.7%
6.9%
8.4%
9.4%
21.9%
0.0% 5.0% 10.0% 15.0% 20.0% 25.0%
SCIENCE TECHNOLOGIES/TECHNICIANS
LEGAL PROFESSIONS AND STUDIES
MILITARY TECHNOLOGIES AND APPLIED SCIENCES
AREA, ETHNIC, CULTURAL, GENDER, AND GROUP STUDIES
ARCHITECTURE AND RELATED SERVICES
NATURAL RESOURCES AND CONSERVATION
ENGINEERING TECHNOLOGIES AND ENGINEERING-RELATED FIELDS
PHILOSOPHY AND RELIGIOUS STUDIES
THEOLOGY AND RELIGIOUS VOCATIONS
FAMILY AND CONSUMER SCIENCES/HUMAN SCIENCES
MULTI/INTERDISCIPLINARY STUDIES
MATHEMATICS AND STATISTICS
AGRICULTURE, AGRICULTURE OPERATIONS, AND RELATED SCIENCES
FOREIGN LANGUAGES, LITERATURES, AND LINGUISTICS
PUBLIC ADMINISTRATION AND SOCIAL SERVICE PROFESSIONS
PHYSICAL SCIENCES
HISTORY
COMPUTER AND INFORMATION SCIENCES AND SUPPORT SERVICES
LIBERAL ARTS AND SCIENCES, GENERAL STUDIES AND HUMANITIES
ENGLISH LANGUAGE AND LITERATURE/LETTERS
HOMELAND SECURITY, LAW ENFORCEMENT, FIREFIGHTING AND RELATED PROTECTIVE SERVICES
PARKS, RECREATION, LEISURE, AND FITNESS STUDIES
VISUAL AND PERFORMING ARTS
COMMUNICATION, JOURNALISM, AND RELATED PROGRAMS
ENGINEERING
PSYCHOLOGY
SOCIAL SCIENCES
EDUCATION
HEALTH PROFESSIONS AND RELATED PROGRAMS
BIOLOGICAL AND BIOMEDICAL SCIENCES
BUSINESS, MANAGEMENT, MARKETING, AND RELATED SUPPORT SERVICES
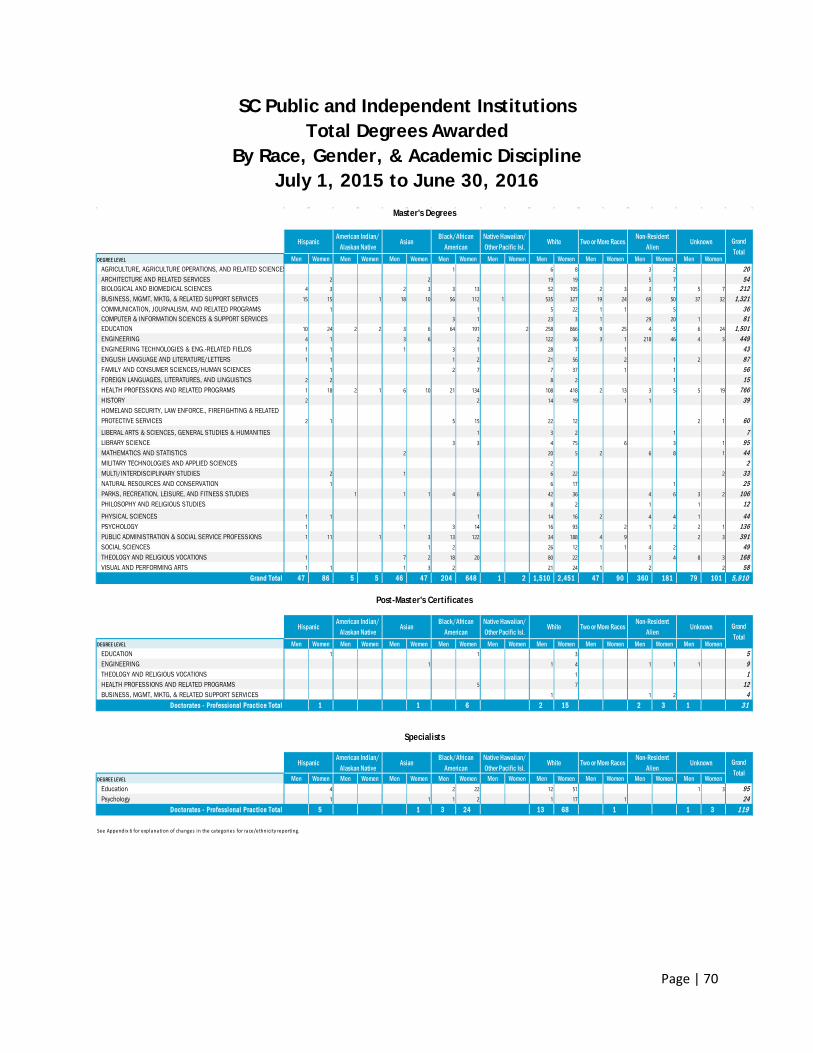
Page | 70
SC Public and Independent Institutions Total Degrees Awarded
By Race, Gender, & Academic Discipline July 1, 2015 to June 30, 2016
Master's Degrees
DEGREE LEVEL Men Women Men Women Men Women Men Women Men Women Men Women Men Women Men Women Men WomenAGRICULTURE, AGRICULTURE OPERATIONS, AND RELATED SCIENCES 1 6 8 3 2 20 ARCHITECTURE AND RELATED SERVICES 2 2 19 19 5 7 54 BIOLOGICAL AND BIOMEDICAL SCIENCES 4 3 2 3 3 13 52 105 2 3 3 7 5 7 212 BUSINESS, MGMT, MKTG, & RELATED SUPPORT SERVICES 15 15 1 18 10 56 112 1 535 327 19 24 69 50 37 32 1,321 COMMUNICATION, JOURNALISM, AND RELATED PROGRAMS 1 1 5 22 1 1 5 36 COMPUTER & INFORMATION SCIENCES & SUPPORT SERVICES 3 1 23 3 1 29 20 1 81 EDUCATION 10 24 2 2 3 6 64 191 2 258 866 9 25 4 5 6 24 1,501 ENGINEERING 4 1 3 6 2 122 36 3 1 218 46 4 3 449 ENGINEERING TECHNOLOGIES & ENG.-RELATED FIELDS 1 1 1 3 1 28 7 1 43 ENGLISH LANGUAGE AND LITERATURE/LETTERS 1 1 1 2 21 56 2 1 2 87 FAMILY AND CONSUMER SCIENCES/HUMAN SCIENCES 1 2 7 7 37 1 1 56 FOREIGN LANGUAGES, LITERATURES, AND LINGUISTICS 2 2 8 2 1 15 HEALTH PROFESSIONS AND RELATED PROGRAMS 1 18 2 1 6 10 21 134 108 418 2 13 3 5 5 19 766 HISTORY 2 2 14 19 1 1 39 HOMELAND SECURITY, LAW ENFORCE., FIREFIGHTING & RELATED PROTECTIVE SERVICES 2 1 5 15 22 12 2 1 60 LIBERAL ARTS & SCIENCES, GENERAL STUDIES & HUMANITIES 1 3 2 1 7 LIBRARY SCIENCE 3 3 4 75 6 3 1 95 MATHEMATICS AND STATISTICS 2 20 5 2 6 8 1 44 MILITARY TECHNOLOGIES AND APPLIED SCIENCES 2 2 MULTI/INTERDISCIPLINARY STUDIES 2 1 6 22 2 33 NATURAL RESOURCES AND CONSERVATION 1 6 17 1 25 PARKS, RECREATION, LEISURE, AND FITNESS STUDIES 1 1 1 4 6 42 36 4 6 3 2 106 PHILOSOPHY AND RELIGIOUS STUDIES 8 2 1 1 12 PHYSICAL SCIENCES 1 1 1 14 16 2 4 4 1 44 PSYCHOLOGY 1 1 3 14 16 93 2 1 2 2 1 136 PUBLIC ADMINISTRATION & SOCIAL SERVICE PROFESSIONS 1 11 1 3 13 122 34 188 4 9 2 3 391 SOCIAL SCIENCES 1 2 26 12 1 1 4 2 49 THEOLOGY AND RELIGIOUS VOCATIONS 1 7 2 18 20 80 22 3 4 8 3 168 VISUAL AND PERFORMING ARTS 1 1 1 3 2 21 24 1 2 2 58
Grand Total 47 86 5 5 46 47 204 648 1 2 1,510 2,451 47 90 360 181 79 101 5,910
DEGREE LEVEL Men Women Men Women Men Women Men Women Men Women Men Women Men Women Men Women Men WomenEDUCATION 1 1 3 5 ENGINEERING 1 1 4 1 1 1 9 THEOLOGY AND RELIGIOUS VOCATIONS 1 1 HEALTH PROFESSIONS AND RELATED PROGRAMS 5 7 12 BUSINESS, MGMT, MKTG, & RELATED SUPPORT SERVICES 1 1 2 4
Doctorates - Professional Practice Total 1 1 6 2 15 2 3 1 31
DEGREE LEVEL Men Women Men Women Men Women Men Women Men Women Men Women Men Women Men Women Men WomenEducation 4 2 22 12 51 1 3 95 Psychology 1 1 1 2 1 17 1 24
Doctorates - Professional Practice Total 5 1 3 24 13 68 1 1 3 119
See Appendix 6 for explanation of changes in the categories for race/ethnici ty reporting.
HispanicAmerican Indian/
Alaskan NativeAsian
Black/AfricanAmerican
Native Hawaiian/Other Pacific Isl.
HispanicAmerican Indian/
Alaskan NativeAsian
Black/AfricanAmerican
Native Hawaiian/Other Pacific Isl.
White
Two or More RacesNon-Resident
AlienUnknown Grand
Total
White
White
Post-Master's Certificates
Specialists
HispanicAmerican Indian/
Alaskan NativeAsian
Black/AfricanAmerican
Native Hawaiian/Other Pacific Isl.
Two or More RacesNon-Resident
AlienUnknown Grand
Total
Two or More RacesNon-Resident
AlienUnknown Grand
Total
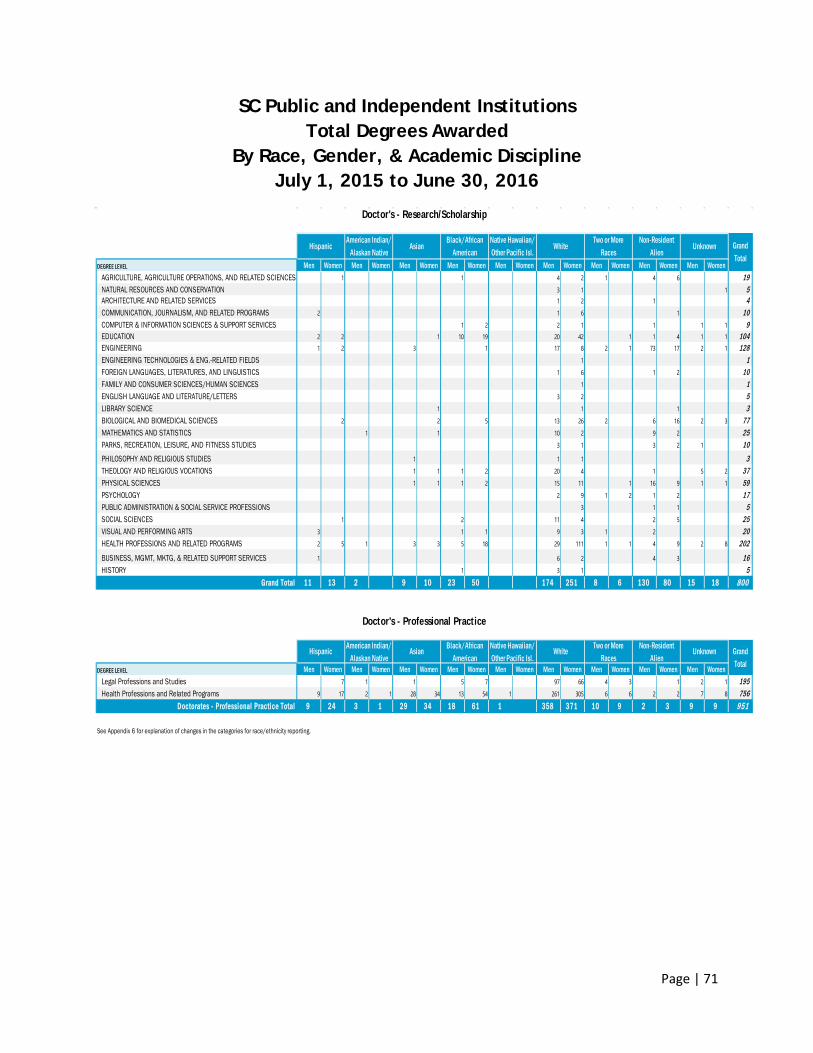
Page | 71
SC Public and Independent Institutions Total Degrees Awarded
By Race, Gender, & Academic Discipline July 1, 2015 to June 30, 2016
Doctor's - Research/Scholarship
DEGREE LEVEL Men Women Men Women Men Women Men Women Men Women Men Women Men Women Men Women Men WomenAGRICULTURE, AGRICULTURE OPERATIONS, AND RELATED SCIENCES 1 1 4 2 1 4 6 19 NATURAL RESOURCES AND CONSERVATION 3 1 1 5 ARCHITECTURE AND RELATED SERVICES 1 2 1 4 COMMUNICATION, JOURNALISM, AND RELATED PROGRAMS 2 1 6 1 10 COMPUTER & INFORMATION SCIENCES & SUPPORT SERVICES 1 2 2 1 1 1 1 9 EDUCATION 2 2 1 10 19 20 42 1 1 4 1 1 104 ENGINEERING 1 2 3 1 17 8 2 1 73 17 2 1 128 ENGINEERING TECHNOLOGIES & ENG.-RELATED FIELDS 1 1 FOREIGN LANGUAGES, LITERATURES, AND LINGUISTICS 1 6 1 2 10 FAMILY AND CONSUMER SCIENCES/HUMAN SCIENCES 1 1 ENGLISH LANGUAGE AND LITERATURE/LETTERS 3 2 5 LIBRARY SCIENCE 1 1 1 3 BIOLOGICAL AND BIOMEDICAL SCIENCES 2 2 5 13 26 2 6 16 2 3 77 MATHEMATICS AND STATISTICS 1 1 10 2 9 2 25 PARKS, RECREATION, LEISURE, AND FITNESS STUDIES 3 1 3 2 1 10 PHILOSOPHY AND RELIGIOUS STUDIES 1 1 1 3 THEOLOGY AND RELIGIOUS VOCATIONS 1 1 1 2 20 4 1 5 2 37 PHYSICAL SCIENCES 1 1 1 2 15 11 1 16 9 1 1 59 PSYCHOLOGY 2 9 1 2 1 2 17 PUBLIC ADMINISTRATION & SOCIAL SERVICE PROFESSIONS 3 1 1 5 SOCIAL SCIENCES 1 2 11 4 2 5 25 VISUAL AND PERFORMING ARTS 3 1 1 9 3 1 2 20 HEALTH PROFESSIONS AND RELATED PROGRAMS 2 5 1 3 3 5 18 29 111 1 1 4 9 2 8 202 BUSINESS, MGMT, MKTG, & RELATED SUPPORT SERVICES 1 6 2 4 3 16 HISTORY 1 3 1 5
Grand Total 11 13 2 9 10 23 50 174 251 8 6 130 80 15 18 800
DEGREE LEVEL Men Women Men Women Men Women Men Women Men Women Men Women Men Women Men Women Men WomenLegal Professions and Studies 7 1 1 5 7 97 66 4 3 1 2 1 195 Health Professions and Related Programs 9 17 2 1 28 34 13 54 1 261 305 6 6 2 2 7 8 756
Doctorates - Professional Practice Total 9 24 3 1 29 34 18 61 1 358 371 10 9 2 3 9 9 951
See Appendix 6 for explanation of changes in the categories for race/ethnicity reporting.
WhiteTwo or More
RacesNon-Resident
AlienUnknown
Doctor's - Professional Practice
Unknown Grand Total
Grand Total
Hispanic American Indian/Alaskan Native
Asian Black/AfricanAmerican
Native Hawaiian/Other Pacific Isl.
White Two or More Races
Non-Resident Alien
HispanicAmerican Indian/
Alaskan NativeAsian
Black/AfricanAmerican
Native Hawaiian/Other Pacific Isl.
Page | 72
Intentionally Blank
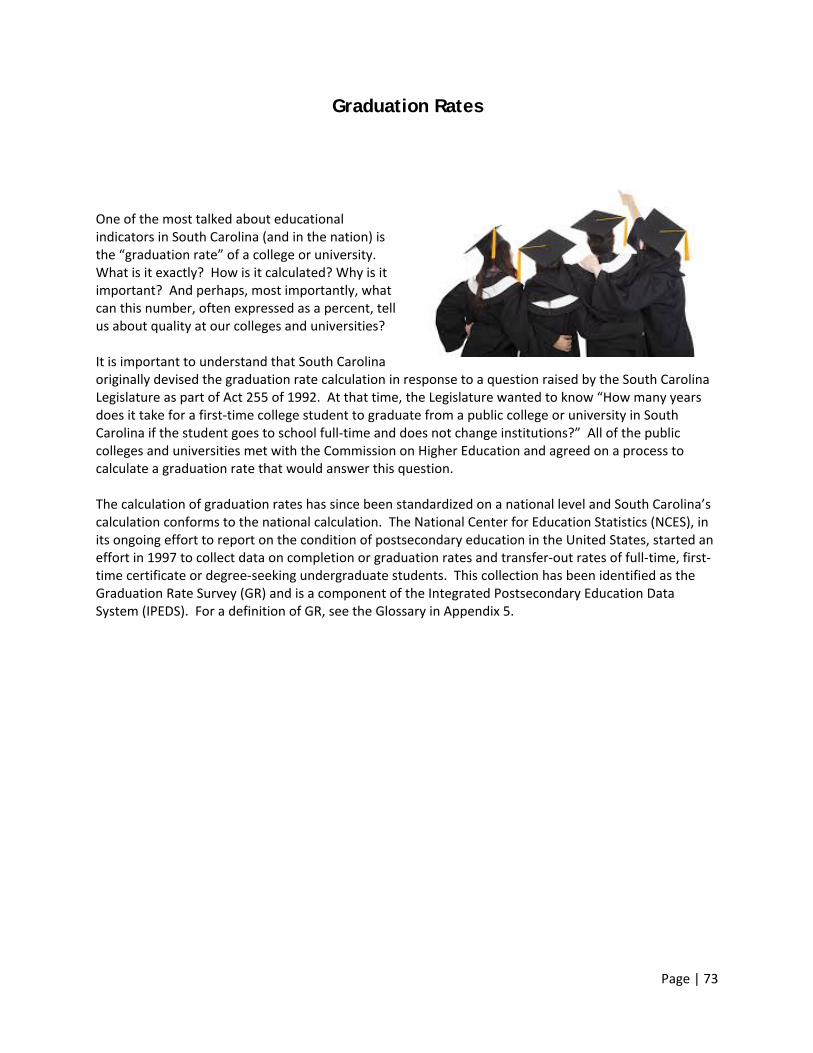
Page | 73
Graduation Rates
One of the most talked about educational indicators in South Carolina (and in the nation) is the “graduation rate” of a college or university. What is it exactly? How is it calculated? Why is it important? And perhaps, most importantly, what can this number, often expressed as a percent, tell us about quality at our colleges and universities?
It is important to understand that South Carolina originally devised the graduation rate calculation in response to a question raised by the South Carolina Legislature as part of Act 255 of 1992. At that time, the Legislature wanted to know “How many years does it take for a first-time college student to graduate from a public college or university in South Carolina if the student goes to school full-time and does not change institutions?” All of the public colleges and universities met with the Commission on Higher Education and agreed on a process to calculate a graduation rate that would answer this question. The calculation of graduation rates has since been standardized on a national level and South Carolina’s calculation conforms to the national calculation. The National Center for Education Statistics (NCES), in its ongoing effort to report on the condition of postsecondary education in the United States, started an effort in 1997 to collect data on completion or graduation rates and transfer-out rates of full-time, first-time certificate or degree-seeking undergraduate students. This collection has been identified as the Graduation Rate Survey (GR) and is a component of the Integrated Postsecondary Education Data System (IPEDS). For a definition of GR, see the Glossary in Appendix 5.
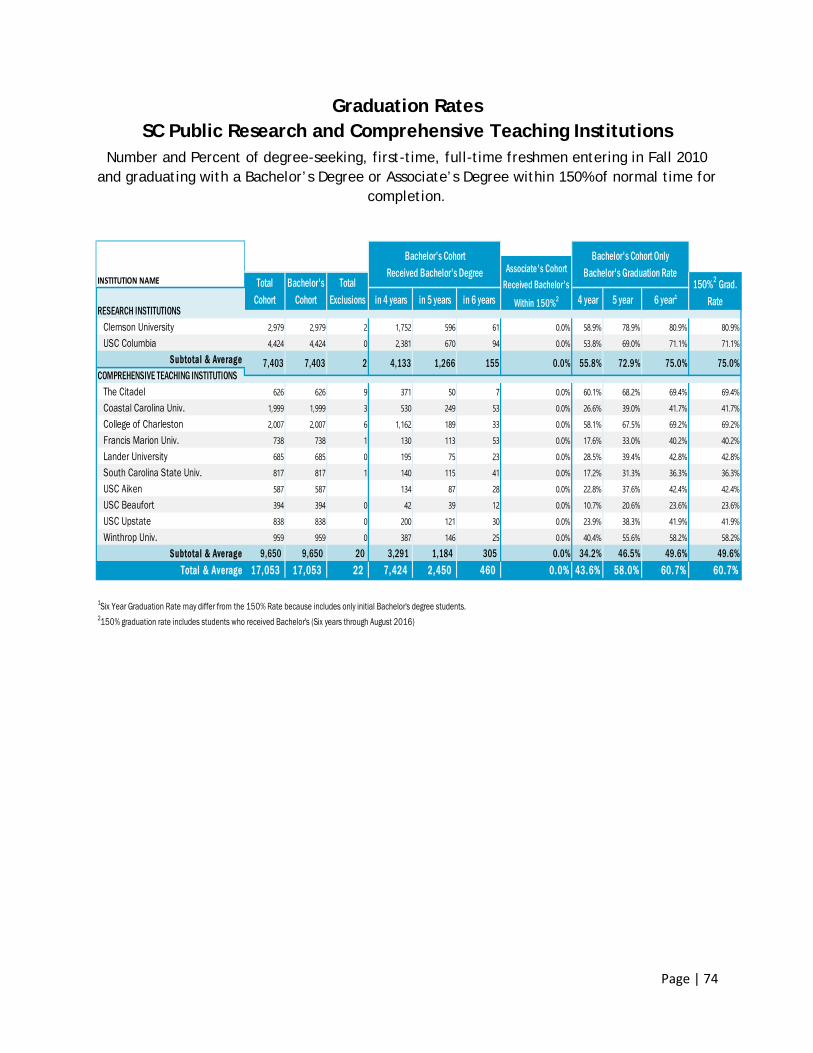
Page | 74
Graduation Rates SC Public Research and Comprehensive Teaching Institutions
Number and Percent of degree-seeking, first-time, full-time freshmen entering in Fall 2010 and graduating with a Bachelor’s Degree or Associate’s Degree within 150% of normal time for
completion.
INSTITUTION NAME
in 4 years in 5 years in 6 years 4 year 5 year 6 year1
Clemson University 2,979 2,979 2 1,752 596 61 0.0% 58.9% 78.9% 80.9% 80.9%
USC Columbia 4,424 4,424 0 2,381 670 94 0.0% 53.8% 69.0% 71.1% 71.1%
Subtotal & Average
The Citadel 626 626 9 371 50 7 0.0% 60.1% 68.2% 69.4% 69.4%
Coastal Carolina Univ. 1,999 1,999 3 530 249 53 0.0% 26.6% 39.0% 41.7% 41.7%
College of Charleston 2,007 2,007 6 1,162 189 33 0.0% 58.1% 67.5% 69.2% 69.2%
Francis Marion Univ. 738 738 1 130 113 53 0.0% 17.6% 33.0% 40.2% 40.2%
Lander University 685 685 0 195 75 23 0.0% 28.5% 39.4% 42.8% 42.8%
South Carolina State Univ. 817 817 1 140 115 41 0.0% 17.2% 31.3% 36.3% 36.3%
USC Aiken 587 587 134 87 28 0.0% 22.8% 37.6% 42.4% 42.4%
USC Beaufort 394 394 0 42 39 12 0.0% 10.7% 20.6% 23.6% 23.6%
USC Upstate 838 838 0 200 121 30 0.0% 23.9% 38.3% 41.9% 41.9%
Winthrop Univ. 959 959 0 387 146 25 0.0% 40.4% 55.6% 58.2% 58.2%
Subtotal & Average 9,650 9,650 20 3,291 1,184 305 0.0% 34.2% 46.5% 49.6% 49.6%Total & Average 17,053 17,053 22 7,424 2,450 460 0.0% 43.6% 58.0% 60.7% 60.7%
1Six Year Graduation Rate may differ from the 150% Rate because includes only initial Bachelor's degree students.2150% graduation rate includes students who received Bachelor's (Six years through August 2016)
COMPREHENSIVE TEACHING INSTITUTIONS
150%2 Grad. Rate
RESEARCH INSTITUTIONS
7,403 7,403 2 4,133 1,266 155
Bachelor's Cohort Received Bachelor's Degree
Bachelor's Cohort OnlyBachelor's Graduation RateAssociate's Cohort
Received Bachelor'sWithin 150%2
TotalCohort
75.0%
Bachelor'sCohort
0.0% 55.8% 72.9% 75.0%
TotalExclusions
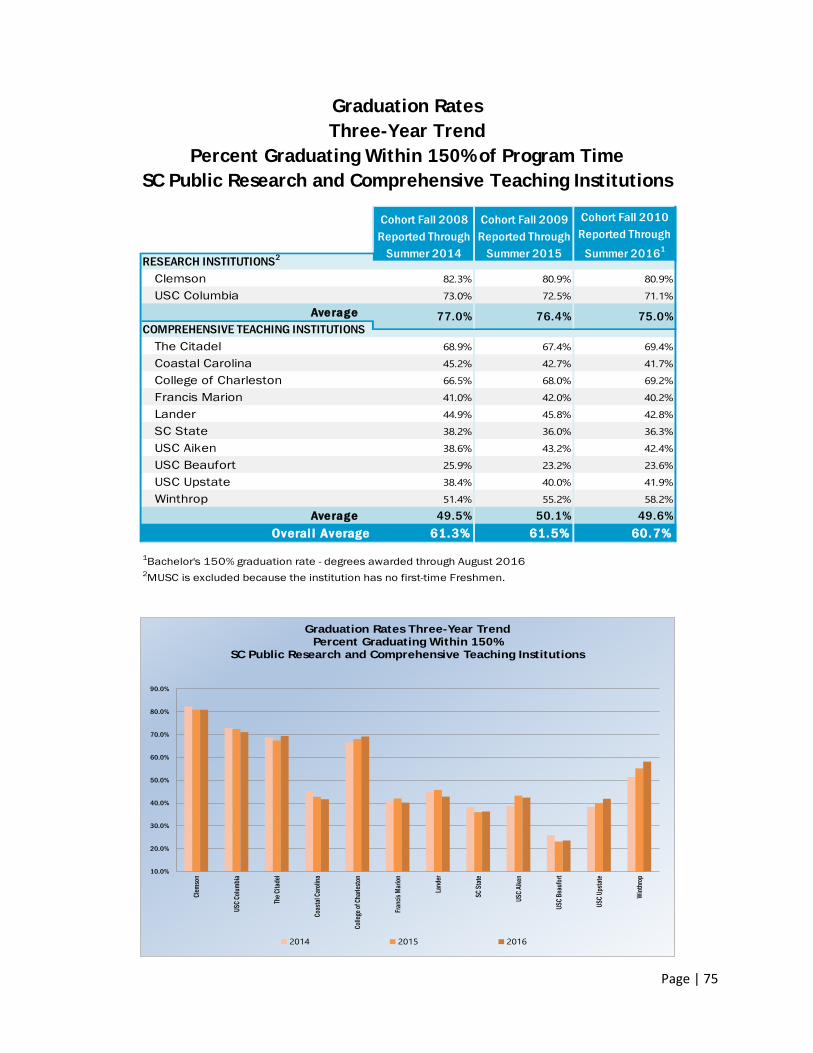
Page | 75
Graduation Rates Three-Year Trend
Percent Graduating Within 150% of Program Time SC Public Research and Comprehensive Teaching Institutions
10.0%
20.0%
30.0%
40.0%
50.0%
60.0%
70.0%
80.0%
90.0%
Clem
son
USC C
olumb
ia
The C
itade
l
Coas
tal Ca
rolina
Colle
ge of
Charl
eston
Franc
is Ma
rion
Land
er
SC St
ate
USC A
iken
USC B
eaufo
rt
USC U
pstat
e
Winth
ropGraduation Rates Three-Year Trend
Percent Graduating Within 150%SC Public Research and Comprehensive Teaching Institutions
2014 2015 2016
Clemson 82.3% 80.9% 80.9%
USC Columbia 73.0% 72.5% 71.1%
Average
The Citadel 68.9% 67.4% 69.4%
Coastal Carolina 45.2% 42.7% 41.7%
College of Charleston 66.5% 68.0% 69.2%Francis Marion 41.0% 42.0% 40.2%
Lander 44.9% 45.8% 42.8%
SC State 38.2% 36.0% 36.3%
USC Aiken 38.6% 43.2% 42.4%
USC Beaufort 25.9% 23.2% 23.6%
USC Upstate 38.4% 40.0% 41.9%
Winthrop 51.4% 55.2% 58.2%
Average 49.5% 50.1% 49.6%Overal l Average 61.3% 61.5% 60.7%
1Bachelor's 150% graduation rate - degrees awarded through August 20162MUSC is excluded because the institution has no first-time Freshmen.
Cohort Fall 2008Reported Through
Summer 2014
Cohort Fall 2009Reported Through
Summer 2015
Cohort Fall 2010Reported Through
Summer 20161
COMPREHENSIVE TEACHING INSTITUTIONS
RESEARCH INSTITUTIONS2
77.0% 76.4% 75.0%
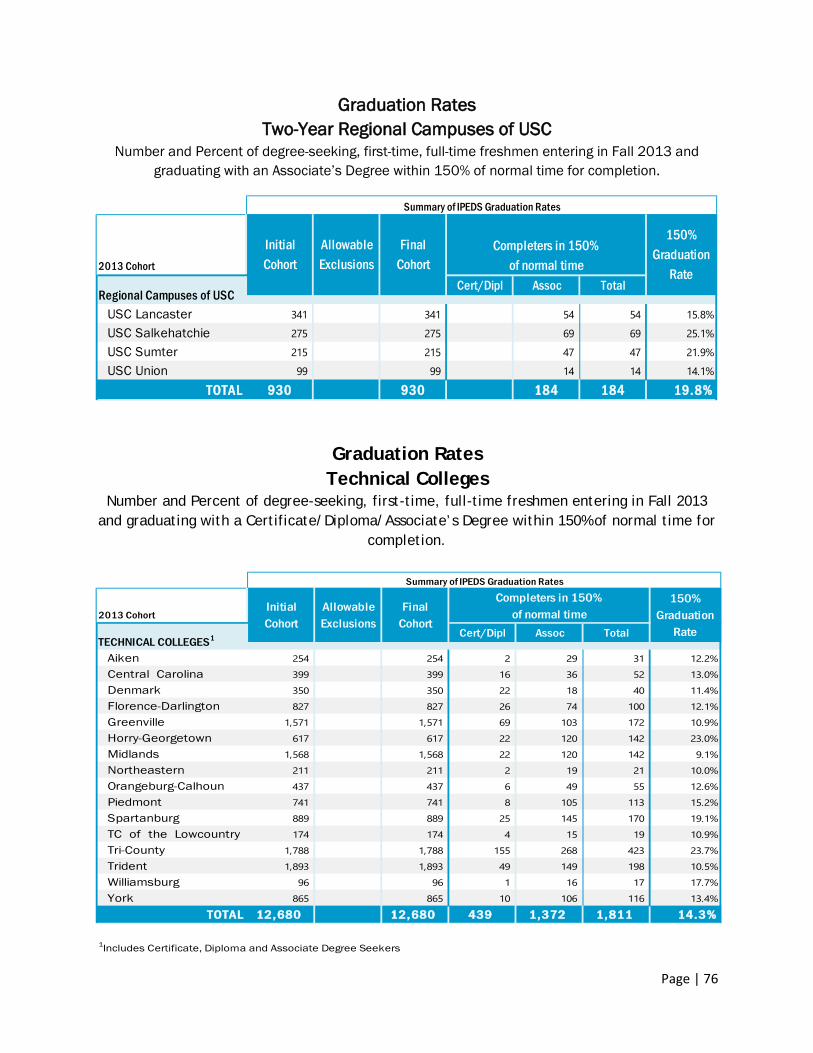
Page | 76
Graduation Rates Two-Year Regional Campuses of USC
Number and Percent of degree-seeking, first-time, full-time freshmen entering in Fall 2013 and graduating with an Associate’s Degree within 150% of normal time for completion.
Graduation Rates
Technical Colleges Number and Percent of degree-seeking, first-time, full-time freshmen entering in Fall 2013
and graduating with a Certificate/Diploma/Associate’s Degree within 150% of normal time for completion.
2013 Cohort
Cert/Dipl Assoc Total
USC Lancaster 341 341 54 54 15.8%
USC Salkehatchie 275 275 69 69 25.1%
USC Sumter 215 215 47 47 21.9%
USC Union 99 99 14 14 14.1%
TOTAL 930 930 184 184 19.8%
Summary of IPEDS Graduation Rates
Regional Campuses of USC
InitialCohort
Allowable Exclusions
FinalCohort
Completers in 150%of normal time
150%Graduation
Rate
2013 Cohort
Cert/Dipl Assoc Total
Aiken 254 254 2 29 31 12.2%
Central Carolina 399 399 16 36 52 13.0%
Denmark 350 350 22 18 40 11.4%Florence-Darlington 827 827 26 74 100 12.1%Greenville 1,571 1,571 69 103 172 10.9%Horry-Georgetown 617 617 22 120 142 23.0%Midlands 1,568 1,568 22 120 142 9.1%
Northeastern 211 211 2 19 21 10.0%
Orangeburg-Calhoun 437 437 6 49 55 12.6%Piedmont 741 741 8 105 113 15.2%
Spartanburg 889 889 25 145 170 19.1%
TC of the Lowcountry 174 174 4 15 19 10.9%
Tri-County 1,788 1,788 155 268 423 23.7%Trident 1,893 1,893 49 149 198 10.5%Williamsburg 96 96 1 16 17 17.7%
York 865 865 10 106 116 13.4%
TOTAL 12,680 12,680 439 1,372 1,811 14.3%
1Includes Certificate, Diploma and Associate Degree Seekers
Summary of IPEDS Graduation Rates
InitialCohort
Allowable Exclusions
FinalCohort
Completers in 150%of normal time
150%Graduation
RateTECHNICAL COLLEGES1
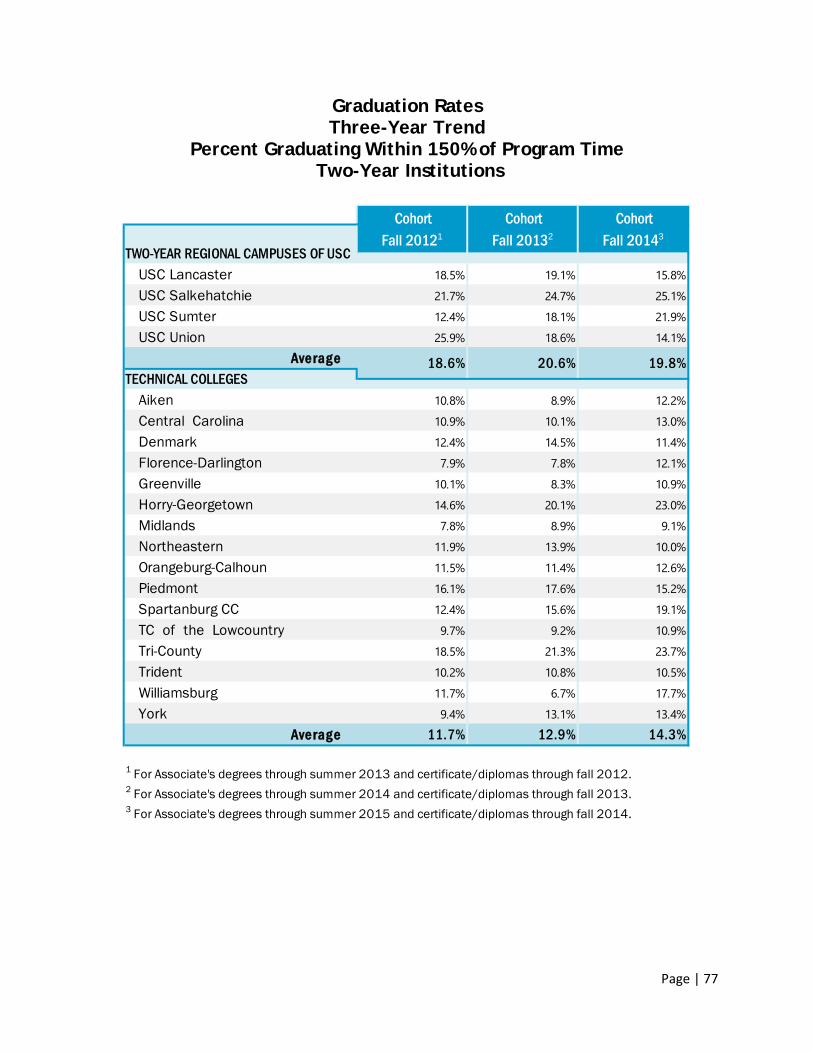
Page | 77
Graduation Rates Three-Year Trend
Percent Graduating Within 150% of Program Time Two-Year Institutions
USC Lancaster 18.5% 19.1% 15.8%
USC Salkehatchie 21.7% 24.7% 25.1%
USC Sumter 12.4% 18.1% 21.9%
USC Union 25.9% 18.6% 14.1%
Average
Aiken 10.8% 8.9% 12.2%
Central Carolina 10.9% 10.1% 13.0%
Denmark 12.4% 14.5% 11.4%
Florence-Darlington 7.9% 7.8% 12.1%
Greenville 10.1% 8.3% 10.9%
Horry-Georgetown 14.6% 20.1% 23.0%
Midlands 7.8% 8.9% 9.1%
Northeastern 11.9% 13.9% 10.0%
Orangeburg-Calhoun 11.5% 11.4% 12.6%
Piedmont 16.1% 17.6% 15.2%
Spartanburg CC 12.4% 15.6% 19.1%
TC of the Lowcountry 9.7% 9.2% 10.9%
Tri-County 18.5% 21.3% 23.7%
Trident 10.2% 10.8% 10.5%
Williamsburg 11.7% 6.7% 17.7%
York 9.4% 13.1% 13.4%
Average 11.7% 12.9% 14.3%
1 For Associate's degrees through summer 2013 and certificate/diplomas through fall 2012.2 For Associate's degrees through summer 2014 and certificate/diplomas through fall 2013.3 For Associate's degrees through summer 2015 and certificate/diplomas through fall 2014.
TWO-YEAR REGIONAL CAMPUSES OF USC
CohortFall 20121
CohortFall 20132
CohortFall 20143
18.6% 20.6% 19.8%TECHNICAL COLLEGES
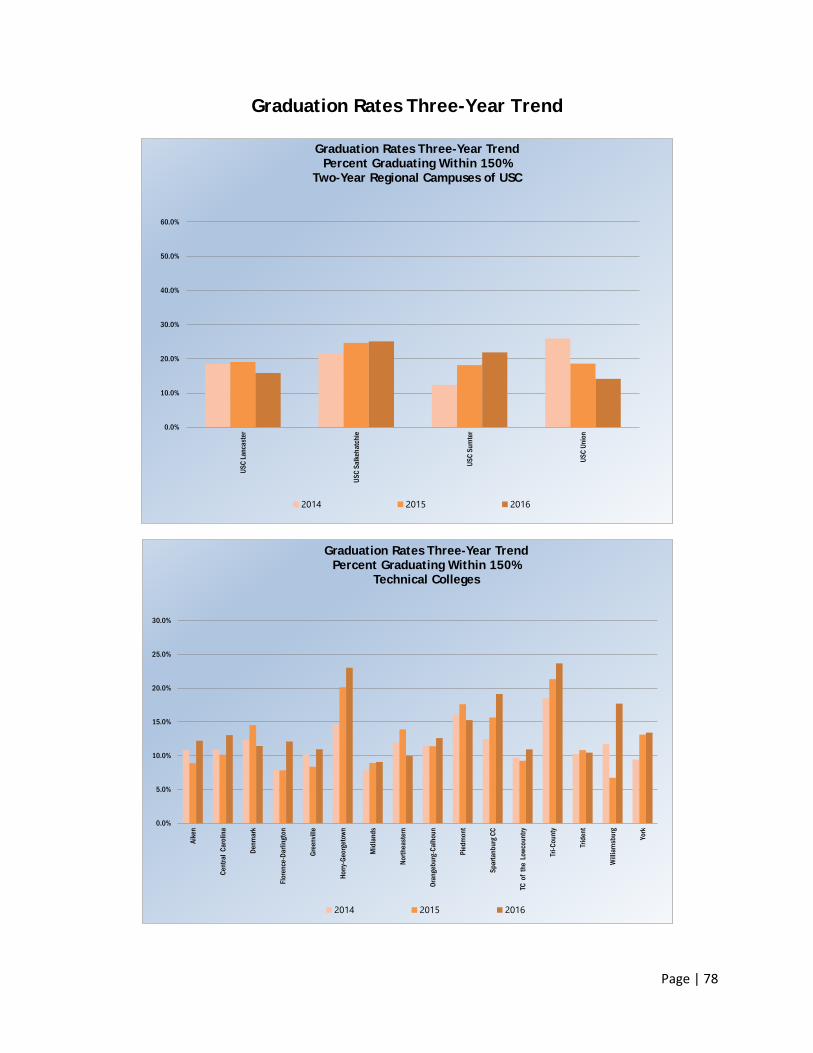
Page | 78
Graduation Rates Three-Year Trend
0.0%
10.0%
20.0%
30.0%
40.0%
50.0%
60.0%
USC
Lanc
aste
r
USC
Salk
ehat
chie
USC
Sum
ter
USC
Unio
n
Graduation Rates Three-Year TrendPercent Graduating Within 150%
Two-Year Regional Campuses of USC
2014 2015 2016
0.0%
5.0%
10.0%
15.0%
20.0%
25.0%
30.0%
Aike
n
Cent
ral C
arol
ina
Denm
ark
Flor
ence
-Dar
lingt
on
Gree
nvill
e
Horry
-Geo
rget
own
Mid
land
s
North
east
ern
Oran
gebu
rg-C
alho
un
Pied
mon
t
Spar
tanb
urg C
C
TC o
f the
Low
coun
try
Tri-C
ount
y
Trid
ent
Will
iam
sbur
g
York
Graduation Rates Three-Year TrendPercent Graduating Within 150%
Technical Colleges
2014 2015 2016
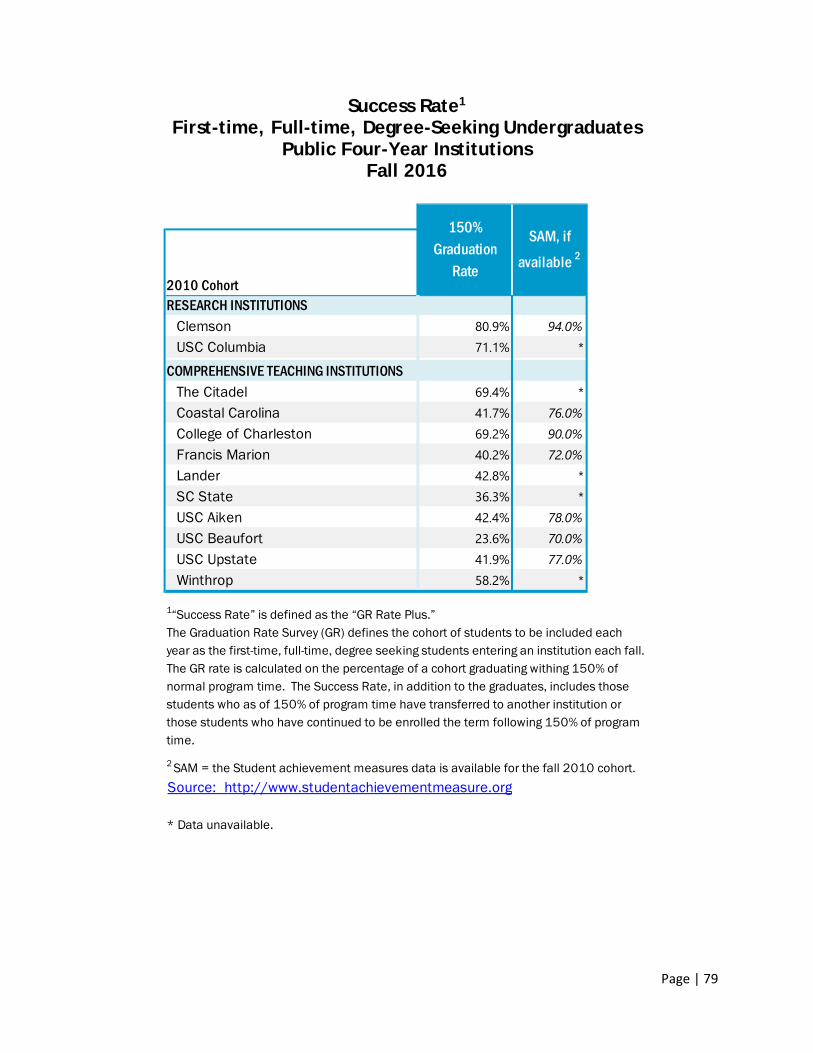
Page | 79
Success Rate1 First-time, Full-time, Degree-Seeking Undergraduates
Public Four-Year Institutions Fall 2016
2010 CohortRESEARCH INSTITUTIONS
Clemson 80.9% 94.0%USC Columbia 71.1% *
COMPREHENSIVE TEACHING INSTITUTIONSThe Citadel 69.4% *Coastal Carolina 41.7% 76.0%College of Charleston 69.2% 90.0%Francis Marion 40.2% 72.0%Lander 42.8% *SC State 36.3% *USC Aiken 42.4% 78.0%USC Beaufort 23.6% 70.0%USC Upstate 41.9% 77.0%Winthrop 58.2% *
1“Success Rate” is defined as the “GR Rate Plus.”
2 SAM = the Student achievement measures data is available for the fall 2010 cohort.Source: http://www.studentachievementmeasure.org
* Data unavailable.
SAM, if
available 2
The Graduation Rate Survey (GR) defines the cohort of students to be included each year as the first-time, full-time, degree seeking students entering an institution each fall. The GR rate is calculated on the percentage of a cohort graduating withing 150% of normal program time. The Success Rate, in addition to the graduates, includes those students who as of 150% of program time have transferred to another institution or those students who have continued to be enrolled the term following 150% of program time.
150%Graduation
Rate
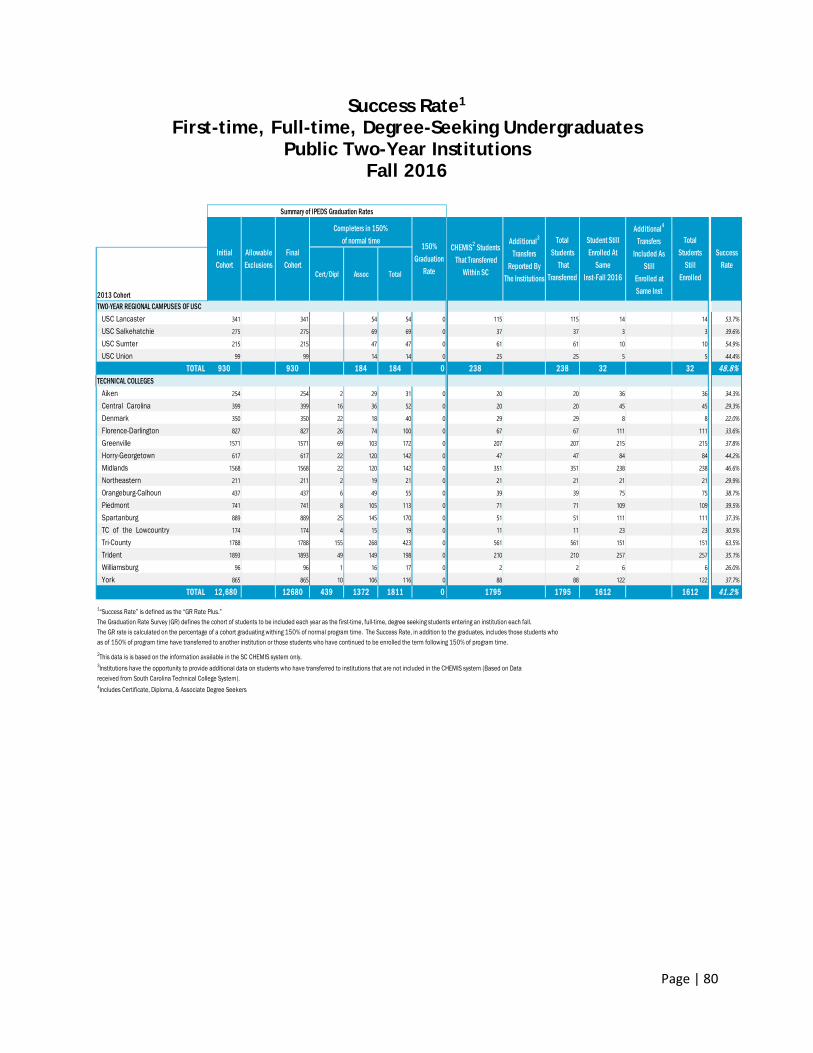
Page | 80
Success Rate1 First-time, Full-time, Degree-Seeking Undergraduates
Public Two-Year Institutions Fall 2016
2013 Cohort
Cert/Dipl Assoc Total
TWO-YEAR REGIONAL CAMPUSES OF USCUSC Lancaster 341 341 54 54 0 115 115 14 14 53.7%
USC Salkehatchie 275 275 69 69 0 37 37 3 3 39.6%
USC Sumter 215 215 47 47 0 61 61 10 10 54.9%
USC Union 99 99 14 14 0 25 25 5 5 44.4%
TOTAL 930 930 184 184 0 238 238 32 32 48.8%TECHNICAL COLLEGES
Aiken 254 254 2 29 31 0 20 20 36 36 34.3%
Central Carolina 399 399 16 36 52 0 20 20 45 45 29.3%
Denmark 350 350 22 18 40 0 29 29 8 8 22.0%
Florence-Darlington 827 827 26 74 100 0 67 67 111 111 33.6%
Greenville 1571 1571 69 103 172 0 207 207 215 215 37.8%
Horry-Georgetown 617 617 22 120 142 0 47 47 84 84 44.2%
Midlands 1568 1568 22 120 142 0 351 351 238 238 46.6%
Northeastern 211 211 2 19 21 0 21 21 21 21 29.9%
Orangeburg-Calhoun 437 437 6 49 55 0 39 39 75 75 38.7%
Piedmont 741 741 8 105 113 0 71 71 109 109 39.5%
Spartanburg 889 889 25 145 170 0 51 51 111 111 37.3%
TC of the Lowcountry 174 174 4 15 19 0 11 11 23 23 30.5%
Tri-County 1788 1788 155 268 423 0 561 561 151 151 63.5%
Trident 1893 1893 49 149 198 0 210 210 257 257 35.1%
Williamsburg 96 96 1 16 17 0 2 2 6 6 26.0%
York 865 865 10 106 116 0 88 88 122 122 37.7%
TOTAL 12,680 12680 439 1372 1811 0 1795 1795 1612 1612 41.2%
1“Success Rate” is defined as the “GR Rate Plus.” The Graduation Rate Survey (GR) defines the cohort of students to be included each year as the first-time, full-time, degree seeking students entering an institution each fall.The GR rate is calculated on the percentage of a cohort graduating withing 150% of normal program time. The Success Rate, in addition to the graduates, includes those students whoas of 150% of program time have transferred to another institution or those students who have continued to be enrolled the term following 150% of program time.2This data is is based on the information available in the SC CHEMIS system only.3Institutions have the opportunity to provide additional data on students who have transferred to institutions that are not included in the CHEMIS system (Based on Data received from South Carolina Technical College System).4Includes Certificate, Diploma, & Associate Degree Seekers
Total Students
That Transferred
Student Still Enrolled At
Same Inst-Fall 2016
Success Rate
Additional4
TransfersIncluded As
StillEnrolled at Same Inst
Summary of IPEDS Graduation Rates
Total Students
Still Enrolled
Completers in 150%of normal time
InitialCohort
Allowable Exclusions
FinalCohort
150%Graduation
Rate
CHEMIS2 Students That Transferred
Within SC
Additional3
Transfers Reported By
The Institutions
Page | 81
The SAT/ACT Programs
In March 2014, the College Board announced they would redesign the SAT to make it more focused, useful, and clear. Based on the most current research and evidence regarding what students need to be ready for college and careers, key changes to the SAT include:
• Emphasizing the meaning of words in context, instead of obscure vocabulary that students won’t use frequently in college or careers
• Focusing on the areas of math that matter most for college and career readiness • Making the essay optional • Eliminating the penalty for guessing
The new SAT was first administered in March 2016.
Most data points in this year’s report cannot be compared to those in previous years. Here’s why:
• The redesigned tests are new tests based on different specifications than the old tests. • While the majority of students in the class of 2016 took the old SAT, some took the new SAT. • The way the College Board collects and reports race and ethnicity data has changed. • The College Board changed their data systems to support their new score-reporting portal and to
better align to school, district, and state data systems.
The majority of SAT takers in the class of 2016 took the old SAT, which was last administered in January 2016. However, some may have taken the new SAT, first administered in March 2016, before graduating.
See Page 82 for a comparison of South Carolina’s SAT data to National data.
Sources: https://reports.collegeboard.org/archive/sat-suite-program-results/2016/new-sat-participation
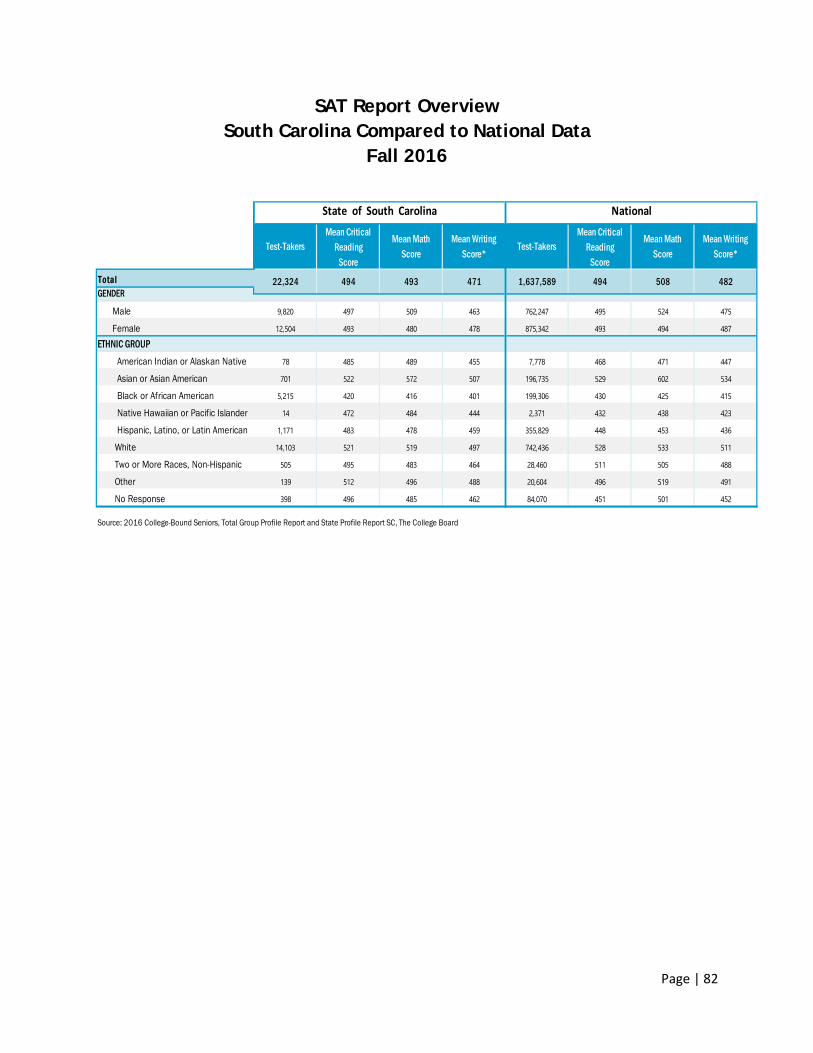
Page | 82
SAT Report Overview South Carolina Compared to National Data
Fall 2016
State of South Carolina National
Total
Male 9,820 497 509 463 762,247 495 524 475
Female 12,504 493 480 478 875,342 493 494 487
ETHNIC GROUP American Indian or Alaskan Native 78 485 489 455 7,778 468 471 447
Asian or Asian American 701 522 572 507 196,735 529 602 534
Black or African American 5,215 420 416 401 199,306 430 425 415
Native Hawaiian or Pacific Islander 14 472 484 444 2,371 432 438 423
Hispanic, Latino, or Latin American 1,171 483 478 459 355,829 448 453 436
White 14,103 521 519 497 742,436 528 533 511
Two or More Races, Non-Hispanic 505 495 483 464 28,460 511 505 488
Other 139 512 496 488 20,604 496 519 491
No Response 398 496 485 462 84,070 451 501 452
Source: 2016 College-Bound Seniors, Total Group Profile Report and State Profile Report SC, The College Board
Mean Critical Reading
Score
Mean MathScore
Mean Writing Score*
22,324 494 493 471
Test-TakersMean Critical
Reading Score
Mean Math Score
Mean Writing Score*
Test-Takers
GENDER1,637,589 494 508 482
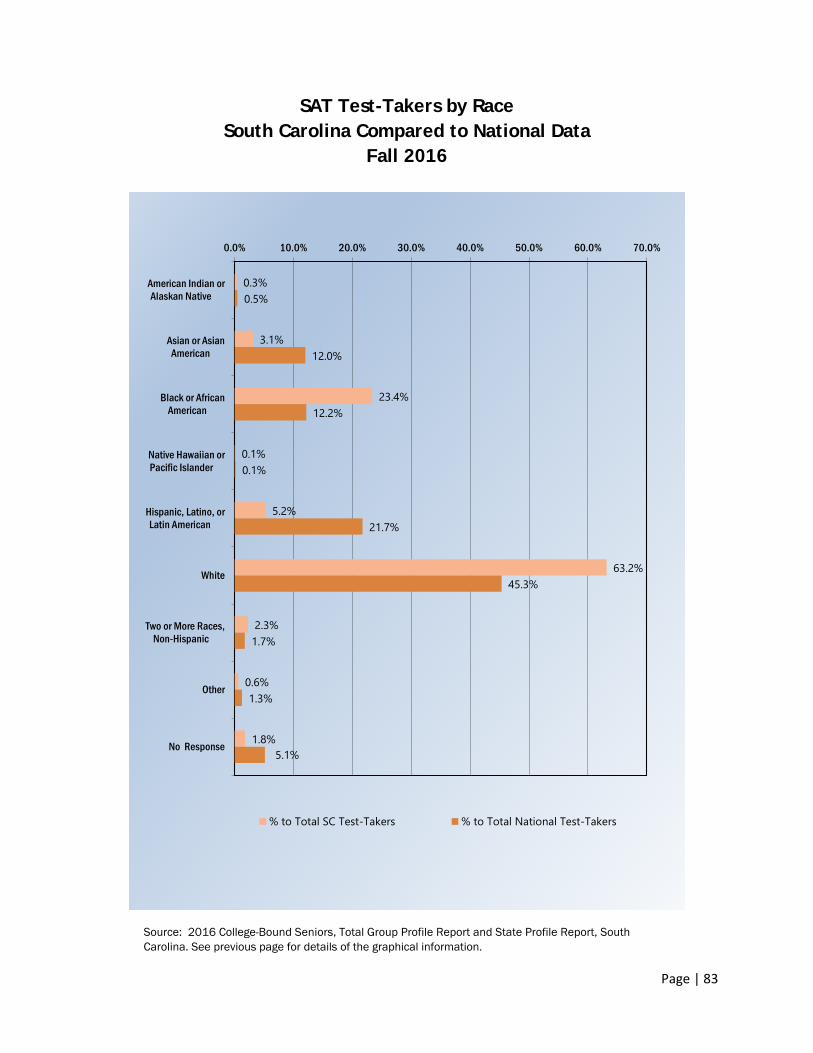
Page | 83
SAT Test-Takers by Race South Carolina Compared to National Data
Fall 2016
Source: 2016 College-Bound Seniors, Total Group Profile Report and State Profile Report, South Carolina. See previous page for details of the graphical information.
0.3%
3.1%
23.4%
0.1%
5.2%
63.2%
2.3%
0.6%
1.8%
0.5%
12.0%
12.2%
0.1%
21.7%
45.3%
1.7%
1.3%
5.1%
0.0% 10.0% 20.0% 30.0% 40.0% 50.0% 60.0% 70.0%
American Indian orAlaskan Native
Asian or AsianAmerican
Black or AfricanAmerican
Native Hawaiian orPacific Islander
Hispanic, Latino, orLatin American
White
Two or More Races,Non-Hispanic
Other
No Response
% to Total SC Test-Takers % to Total National Test-Takers
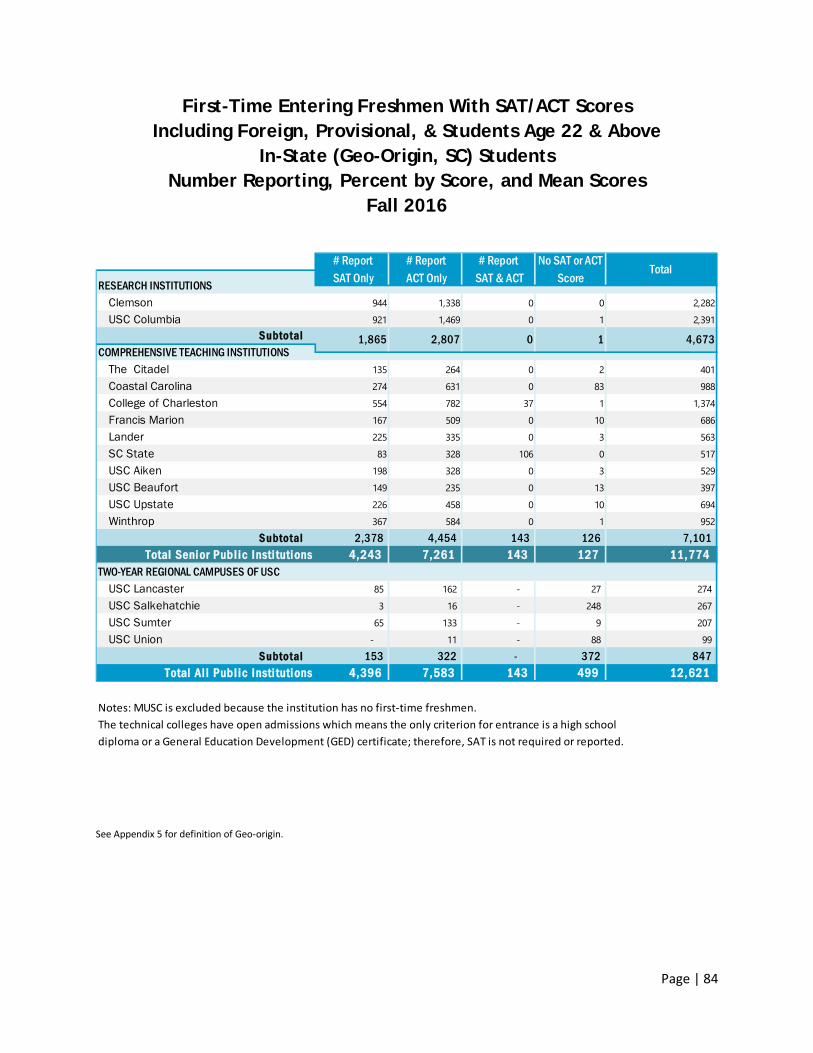
Page | 84
First-Time Entering Freshmen With SAT/ACT Scores
Including Foreign, Provisional, & Students Age 22 & Above In-State (Geo-Origin, SC) Students
Number Reporting, Percent by Score, and Mean Scores Fall 2016
See Appendix 5 for definition of Geo-origin.
Clemson 944 1,338 0 0 2,282
USC Columbia 921 1,469 0 1 2,391 Subtotal
The Citadel 135 264 0 2 401
Coastal Carolina 274 631 0 83 988
College of Charleston 554 782 37 1 1,374
Francis Marion 167 509 0 10 686
Lander 225 335 0 3 563
SC State 83 328 106 0 517
USC Aiken 198 328 0 3 529
USC Beaufort 149 235 0 13 397
USC Upstate 226 458 0 10 694
Winthrop 367 584 0 1 952
Subtotal 2,378 4,454 143 126 7,101 Total Senior Publ ic Insti tutions 4,243 7,261 143 127 11,774
TWO-YEAR REGIONAL CAMPUSES OF USCUSC Lancaster 85 162 - 27 274
USC Salkehatchie 3 16 - 248 267
USC Sumter 65 133 - 9 207
USC Union - 11 - 88 99
Subtotal 153 322 - 372 847 Total Al l Publ ic Insti tutions 4,396 7,583 143 499 12,621
Notes: MUSC is excluded because the institution has no first-time freshmen.The technical colleges have open admissions which means the only criterion for entrance is a high schooldiploma or a General Education Development (GED) certificate; therefore, SAT is not required or reported.
RESEARCH INSTITUTIONS
# Report SAT Only
# Report ACT Only
# Report SAT & ACT
No SAT or ACT Score
Total
1,865 2,807 0 1 4,673COMPREHENSIVE TEACHING INSTITUTIONS
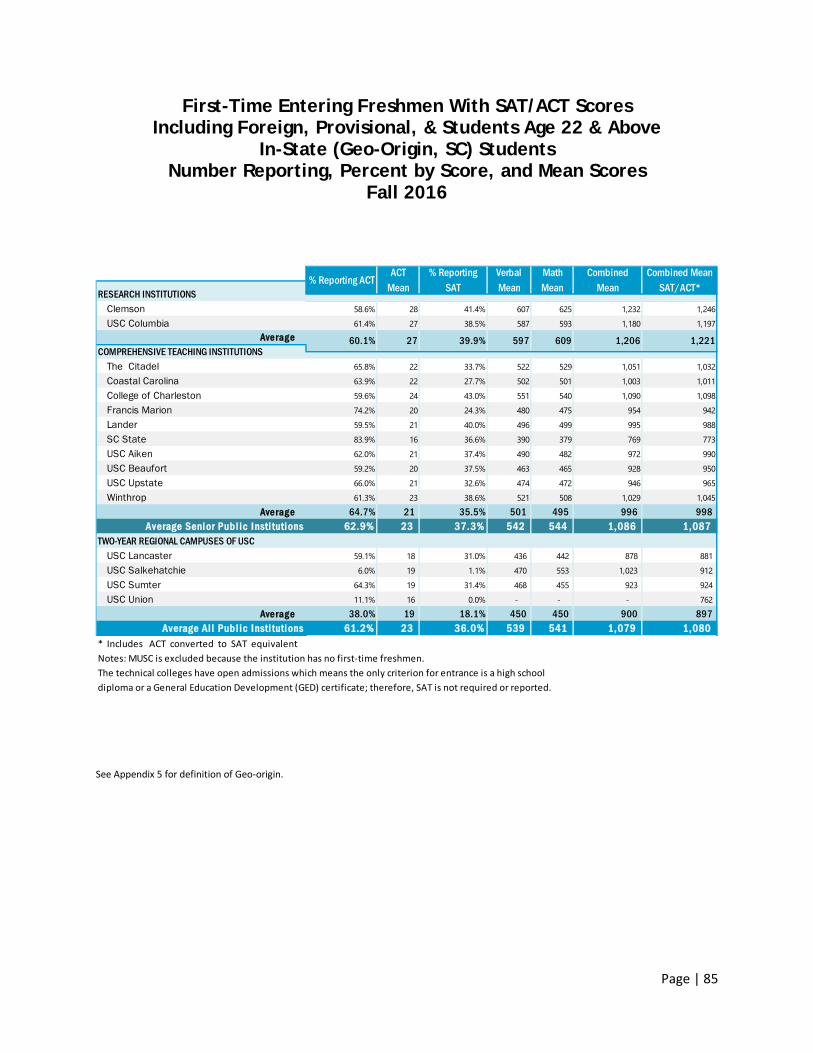
Page | 85
First-Time Entering Freshmen With SAT/ACT Scores Including Foreign, Provisional, & Students Age 22 & Above
In-State (Geo-Origin, SC) Students Number Reporting, Percent by Score, and Mean Scores
Fall 2016
See Appendix 5 for definition of Geo-origin.
Clemson 58.6% 28 41.4% 607 625 1,232 1,246
USC Columbia 61.4% 27 38.5% 587 593 1,180 1,197 Average
The Citadel 65.8% 22 33.7% 522 529 1,051 1,032
Coastal Carolina 63.9% 22 27.7% 502 501 1,003 1,011
College of Charleston 59.6% 24 43.0% 551 540 1,090 1,098
Francis Marion 74.2% 20 24.3% 480 475 954 942
Lander 59.5% 21 40.0% 496 499 995 988
SC State 83.9% 16 36.6% 390 379 769 773
USC Aiken 62.0% 21 37.4% 490 482 972 990
USC Beaufort 59.2% 20 37.5% 463 465 928 950
USC Upstate 66.0% 21 32.6% 474 472 946 965
Winthrop 61.3% 23 38.6% 521 508 1,029 1,045
Average 64.7% 21 35.5% 501 495 996 998 Average Senior Publ ic Insti tutions 62.9% 23 37.3% 542 544 1,086 1,087
TWO-YEAR REGIONAL CAMPUSES OF USCUSC Lancaster 59.1% 18 31.0% 436 442 878 881
USC Salkehatchie 6.0% 19 1.1% 470 553 1,023 912
USC Sumter 64.3% 19 31.4% 468 455 923 924
USC Union 11.1% 16 0.0% - - - 762
Average 38.0% 19 18.1% 450 450 900 897 Average Al l Publ ic Insti tutions 61.2% 23 36.0% 539 541 1,079 1,080
* Includes ACT converted to SAT equivalentNotes: MUSC is excluded because the institution has no first-time freshmen.The technical colleges have open admissions which means the only criterion for entrance is a high schooldiploma or a General Education Development (GED) certificate; therefore, SAT is not required or reported.
Combined Mean SAT/ACT*
COMPREHENSIVE TEACHING INSTITUTIONS1,221
% Reporting ACTACT
Mean% Reporting
SATVerbal Mean
Math Mean
Combined MeanRESEARCH INSTITUTIONS
60.1% 27 39.9% 597 609 1,206
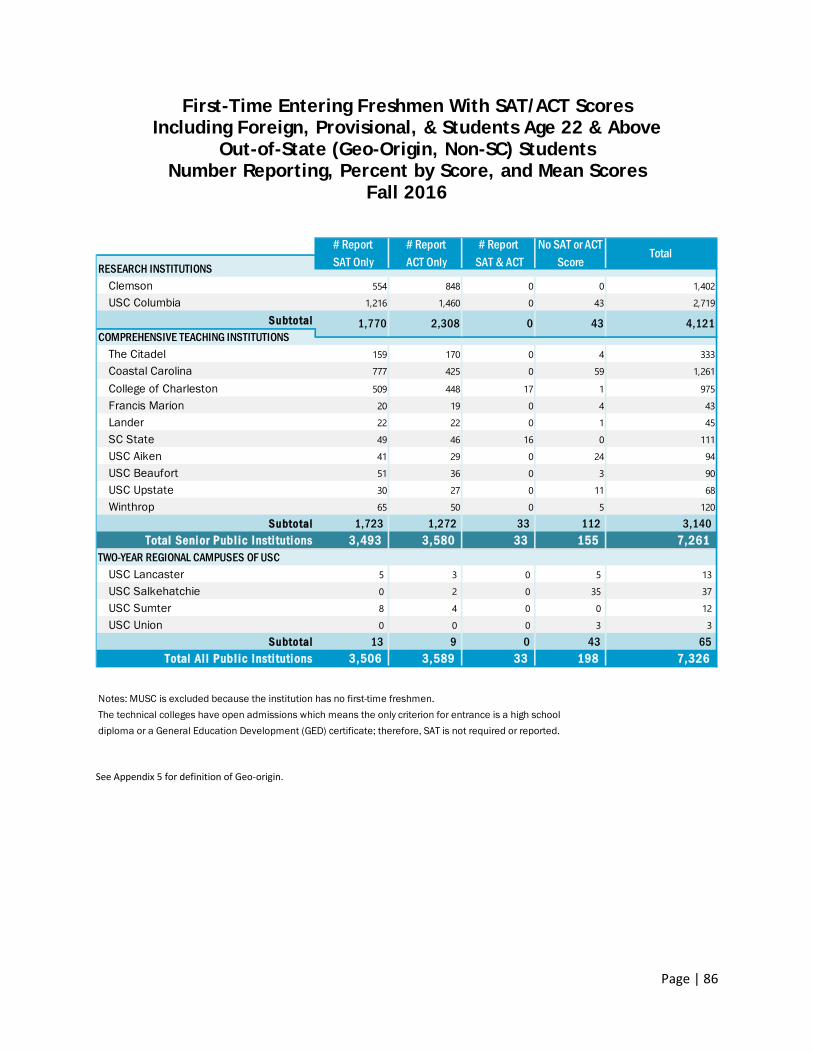
Page | 86
First-Time Entering Freshmen With SAT/ACT Scores Including Foreign, Provisional, & Students Age 22 & Above
Out-of-State (Geo-Origin, Non-SC) Students Number Reporting, Percent by Score, and Mean Scores
Fall 2016
See Appendix 5 for definition of Geo-origin.
Clemson 554 848 0 0 1,402USC Columbia 1,216 1,460 0 43 2,719
Subtotal
The Citadel 159 170 0 4 333Coastal Carolina 777 425 0 59 1,261
College of Charleston 509 448 17 1 975Francis Marion 20 19 0 4 43Lander 22 22 0 1 45SC State 49 46 16 0 111USC Aiken 41 29 0 24 94USC Beaufort 51 36 0 3 90USC Upstate 30 27 0 11 68Winthrop 65 50 0 5 120
Subtotal 1,723 1,272 33 112 3,140 Total Senior Publ ic Insti tutions 3,493 3,580 33 155 7,261
TWO-YEAR REGIONAL CAMPUSES OF USCUSC Lancaster 5 3 0 5 13USC Salkehatchie 0 2 0 35 37USC Sumter 8 4 0 0 12USC Union 0 0 0 3 3
Subtotal 13 9 0 43 65Total Al l Publ ic Insti tutions 3,506 3,589 33 198 7,326
Notes: MUSC is excluded because the institution has no first-time freshmen.The technical colleges have open admissions which means the only criterion for entrance is a high schooldiploma or a General Education Development (GED) certificate; therefore, SAT is not required or reported.
COMPREHENSIVE TEACHING INSTITUTIONS1,770 2,308 0 43 4,121
RESEARCH INSTITUTIONS
# Report SAT Only
# Report ACT Only
# Report SAT & ACT
No SAT or ACT Score
Total
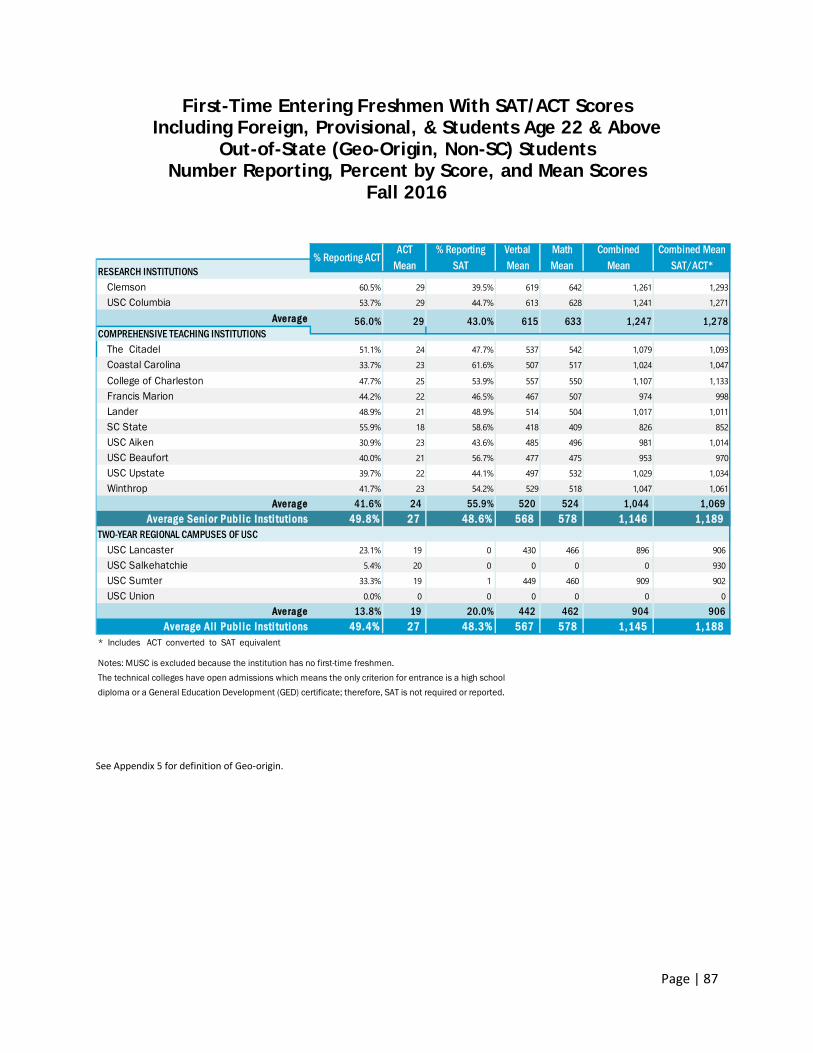
Page | 87
First-Time Entering Freshmen With SAT/ACT Scores Including Foreign, Provisional, & Students Age 22 & Above
Out-of-State (Geo-Origin, Non-SC) Students Number Reporting, Percent by Score, and Mean Scores
Fall 2016
See Appendix 5 for definition of Geo-origin.
Clemson 60.5% 29 39.5% 619 642 1,261 1,293
USC Columbia 53.7% 29 44.7% 613 628 1,241 1,271
Average
The Citadel 51.1% 24 47.7% 537 542 1,079 1,093
Coastal Carolina 33.7% 23 61.6% 507 517 1,024 1,047
College of Charleston 47.7% 25 53.9% 557 550 1,107 1,133
Francis Marion 44.2% 22 46.5% 467 507 974 998
Lander 48.9% 21 48.9% 514 504 1,017 1,011
SC State 55.9% 18 58.6% 418 409 826 852
USC Aiken 30.9% 23 43.6% 485 496 981 1,014
USC Beaufort 40.0% 21 56.7% 477 475 953 970
USC Upstate 39.7% 22 44.1% 497 532 1,029 1,034
Winthrop 41.7% 23 54.2% 529 518 1,047 1,061
Average 41.6% 24 55.9% 520 524 1,044 1,069 Average Senior Publ ic Insti tutions 49.8% 27 48.6% 568 578 1,146 1,189
TWO-YEAR REGIONAL CAMPUSES OF USCUSC Lancaster 23.1% 19 0 430 466 896 906
USC Salkehatchie 5.4% 20 0 0 0 0 930
USC Sumter 33.3% 19 1 449 460 909 902
USC Union 0.0% 0 0 0 0 0 0
Average 13.8% 19 20.0% 442 462 904 906 Average Al l Publ ic Insti tutions 49.4% 27 48.3% 567 578 1,145 1,188
* Includes ACT converted to SAT equivalent
Notes: MUSC is excluded because the institution has no first-time freshmen.The technical colleges have open admissions which means the only criterion for entrance is a high schooldiploma or a General Education Development (GED) certificate; therefore, SAT is not required or reported.
1,278COMPREHENSIVE TEACHING INSTITUTIONS
RESEARCH INSTITUTIONS% Reporting ACT
ACT Mean
% Reporting SAT
Verbal Mean
Math Mean
Combined Mean
Combined Mean SAT/ACT*
56.0% 29 43.0% 615 633 1,247
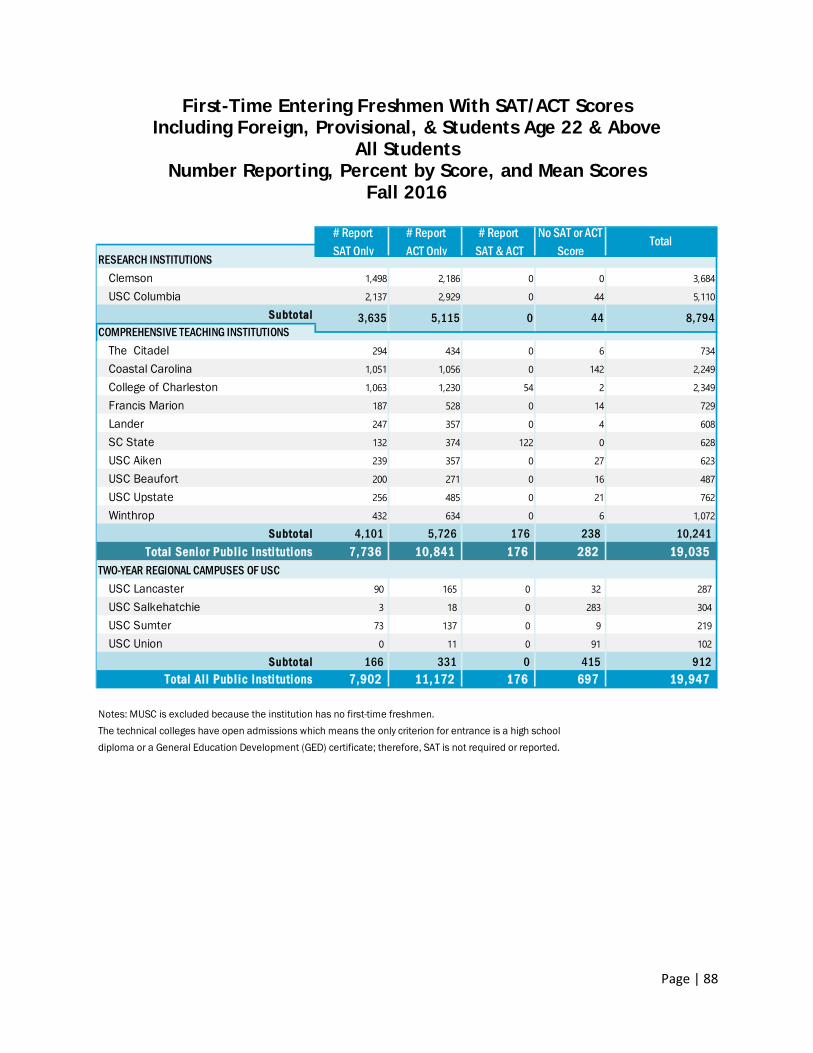
Page | 88
First-Time Entering Freshmen With SAT/ACT Scores Including Foreign, Provisional, & Students Age 22 & Above
All Students Number Reporting, Percent by Score, and Mean Scores
Fall 2016
Clemson 1,498 2,186 0 0 3,684
USC Columbia 2,137 2,929 0 44 5,110
Subtotal
The Citadel 294 434 0 6 734
Coastal Carolina 1,051 1,056 0 142 2,249
College of Charleston 1,063 1,230 54 2 2,349
Francis Marion 187 528 0 14 729
Lander 247 357 0 4 608
SC State 132 374 122 0 628
USC Aiken 239 357 0 27 623
USC Beaufort 200 271 0 16 487
USC Upstate 256 485 0 21 762
Winthrop 432 634 0 6 1,072
Subtotal 4,101 5,726 176 238 10,241 Total Senior Publ ic Insti tutions 7,736 10,841 176 282 19,035
TWO-YEAR REGIONAL CAMPUSES OF USCUSC Lancaster 90 165 0 32 287
USC Salkehatchie 3 18 0 283 304
USC Sumter 73 137 0 9 219
USC Union 0 11 0 91 102
Subtotal 166 331 0 415 912 Total Al l Publ ic Insti tutions 7,902 11,172 176 697 19,947
Notes: MUSC is excluded because the institution has no first-time freshmen.The technical colleges have open admissions which means the only criterion for entrance is a high schooldiploma or a General Education Development (GED) certificate; therefore, SAT is not required or reported.
No SAT or ACT Score
Total
3,635 5,115 0 44 8,794
RESEARCH INSTITUTIONS
# Report SAT Only
# Report ACT Only
# Report SAT & ACT
COMPREHENSIVE TEACHING INSTITUTIONS
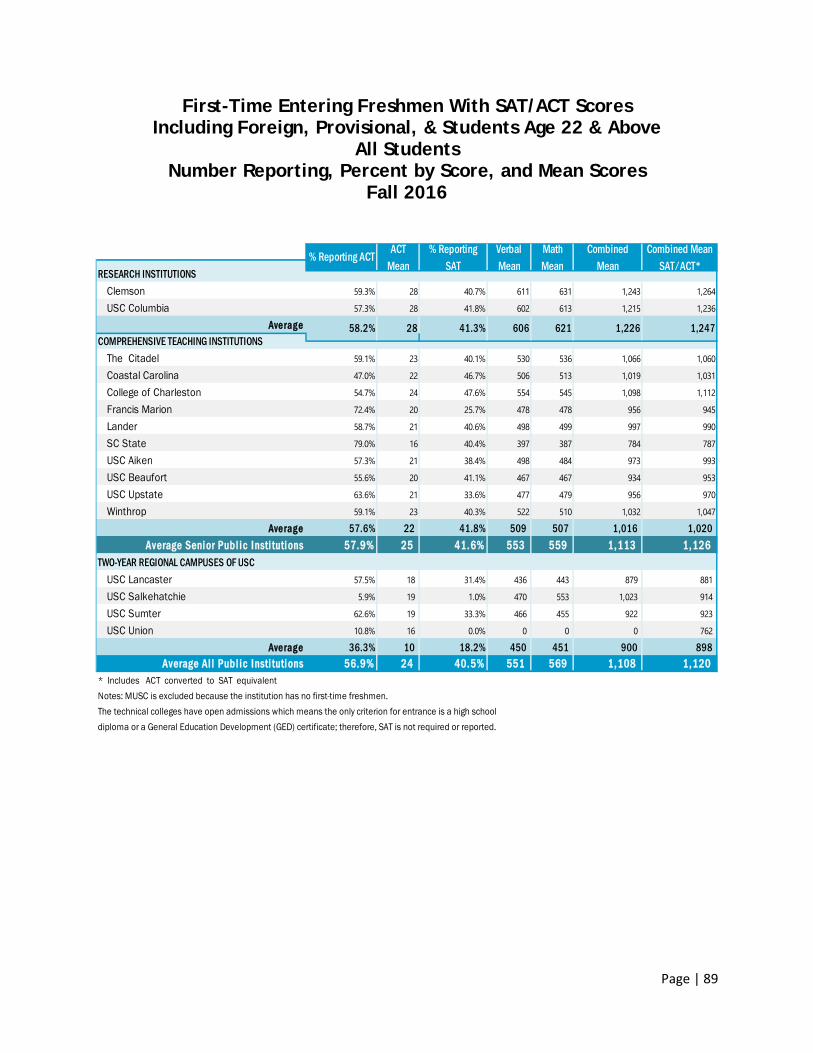
Page | 89
First-Time Entering Freshmen With SAT/ACT ScoresIncluding Foreign, Provisional, & Students Age 22 & Above
All Students Number Reporting, Percent by Score, and Mean Scores
Fall 2016
Clemson 59.3% 28 40.7% 611 631 1,243 1,264
USC Columbia 57.3% 28 41.8% 602 613 1,215 1,236
Average
The Citadel 59.1% 23 40.1% 530 536 1,066 1,060
Coastal Carolina 47.0% 22 46.7% 506 513 1,019 1,031
College of Charleston 54.7% 24 47.6% 554 545 1,098 1,112
Francis Marion 72.4% 20 25.7% 478 478 956 945
Lander 58.7% 21 40.6% 498 499 997 990
SC State 79.0% 16 40.4% 397 387 784 787
USC Aiken 57.3% 21 38.4% 498 484 973 993
USC Beaufort 55.6% 20 41.1% 467 467 934 953
USC Upstate 63.6% 21 33.6% 477 479 956 970
Winthrop 59.1% 23 40.3% 522 510 1,032 1,047
Average 57.6% 22 41.8% 509 507 1,016 1,020 Average Senior Publ ic Insti tutions 57.9% 25 41.6% 553 559 1,113 1,126
TWO-YEAR REGIONAL CAMPUSES OF USCUSC Lancaster 57.5% 18 31.4% 436 443 879 881
USC Salkehatchie 5.9% 19 1.0% 470 553 1,023 914
USC Sumter 62.6% 19 33.3% 466 455 922 923
USC Union 10.8% 16 0.0% 0 0 0 762
Average 36.3% 10 18.2% 450 451 900 898 Average Al l Publ ic Insti tutions 56.9% 24 40.5% 551 569 1,108 1,120
* Includes ACT converted to SAT equivalentNotes: MUSC is excluded because the institution has no first-time freshmen.The technical colleges have open admissions which means the only criterion for entrance is a high schooldiploma or a General Education Development (GED) certificate; therefore, SAT is not required or reported.
RESEARCH INSTITUTIONS% Reporting ACT ACT
Mean% Reporting
SATVerbal Mean
Math Mean
Combined Mean
Combined Mean SAT/ACT*
COMPREHENSIVE TEACHING INSTITUTIONS58.2% 28 41.3% 606 621 1,226 1,247
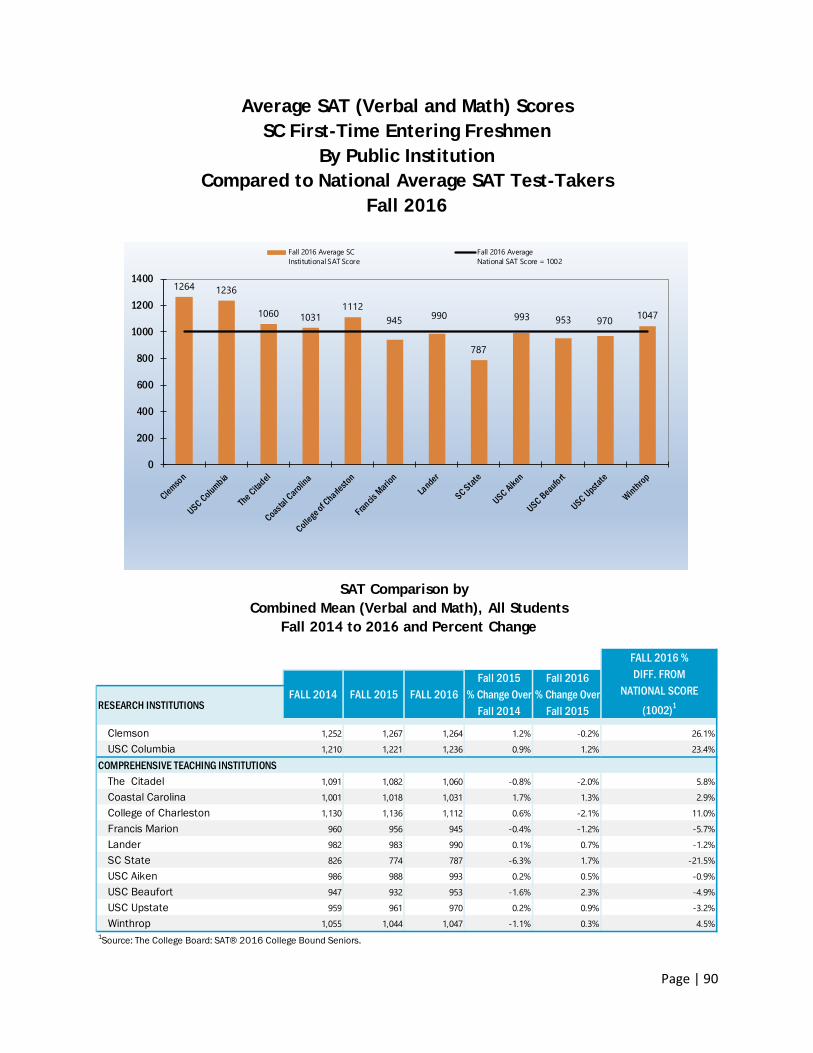
Page | 90
Average SAT (Verbal and Math) Scores SC First-Time Entering Freshmen
By Public Institution Compared to National Average SAT Test-Takers
Fall 2016
Clemson 1,252 1,267 1,264 1.2% -0.2% 26.1%
USC Columbia 1,210 1,221 1,236 0.9% 1.2% 23.4%
COMPREHENSIVE TEACHING INSTITUTIONSThe Citadel 1,091 1,082 1,060 -0.8% -2.0% 5.8%
Coastal Carolina 1,001 1,018 1,031 1.7% 1.3% 2.9%College of Charleston 1,130 1,136 1,112 0.6% -2.1% 11.0%
Francis Marion 960 956 945 -0.4% -1.2% -5.7%
Lander 982 983 990 0.1% 0.7% -1.2%SC State 826 774 787 -6.3% 1.7% -21.5%
USC Aiken 986 988 993 0.2% 0.5% -0.9%
USC Beaufort 947 932 953 -1.6% 2.3% -4.9%
USC Upstate 959 961 970 0.2% 0.9% -3.2%Winthrop 1,055 1,044 1,047 -1.1% 0.3% 4.5%
1Source: The College Board: SAT® 2016 College Bound Seniors.
SAT Comparison by Combined Mean (Verbal and Math), All Students
Fall 2014 to 2016 and Percent Change
FALL 2016 %DIFF. FROM
NATIONAL SCORE
(1002)1FALL 2014 FALL 2015 FALL 2016
RESEARCH INSTITUTIONS
Fall 2015% Change Over
Fall 2014
Fall 2016% Change Over
Fall 2015
1264 1236
1060 10311112
945 990
787
993 953 970 1047
0
200
400
600
800
1000
1200
1400
Fall 2016 Average SCInstitutional SAT Score
Fall 2016 AverageNational SAT Score = 1002
Page | 91
Scholarships and Grants
Scholarships and grants are forms of financial aid that help students pay for postsecondary education. Unlike student loans, scholarships and grants do not have to be repaid. Over the years, millions of dollars in scholarships and grants have been awarded to eligible students attending South Carolina public and independent colleges. The state provides financial assistance to eligible students in the
form of need-based, merit-based, and other financial aid. In South Carolina, students may be eligible to receive one of the three statewide, merit-based scholarships: Palmetto Fellows Scholarship, Legislative Incentives for Future Excellence (LIFE) Scholarship, or SC HOPE Scholarship. Additional funding is available for enhancements to the LIFE Scholarship and Palmetto Fellows Scholarship based on declared majors in approved mathematics and science programs. Please be aware that the information provided is subject to change and updates are made as necessary. For the most up-to-date information, visit the Commission’s web site at www.che.sc.gov.
Page | 92
South Carolina Scholarships and Grants Administered by the S.C. Commission on Higher Education
General Eligibility Requirements for all State Scholarships and Grants The Student must: 1. Be a US citizen/legal permanent resident*; 2. Be a South Carolina resident*; 3. Be enrolled as a degree-seeking student at an eligible South Carolina public or independent institution; 4. Not owe a refund or repayment on any State or Federal financial aid and not be in default on a Federal student loan; and 5. Certify that he/she has never been convicted of any felonies (except Lottery Tuition Assistance) and has not been convicted of any second or subsequent alcohol and/or drug-related misdemeanors within the past academic year. *This must be determined at the time of high school graduation. Palmetto Fellows Scholarship The Palmetto Fellows Scholarship is a merit-based scholarship established in 1988 to recognize the most academically-talented high school seniors and encourage them to attend college in the state. The annual award amount for the freshman year is up to $6,700. The award amounts for the sophomore, junior, and senior years are up to $7,500 per year. Half of the scholarship is awarded in the fall term and half in the spring. The scholarship is applied toward the cost of attendance, less any other gift aid, at an eligible four-year institution in South Carolina. Assuming continued eligibility, Palmetto Fellows may receive scholarship funding for up to eight consecutive terms of full-time study toward the first bachelor’s degree. Palmetto Fellows may receive up to 10 consecutive terms of full-time study toward the first CHE-approved five-year undergraduate program. In addition, Palmetto Fellows cannot be recipients of the LIFE Scholarship, S.C. HOPE Scholarship, or Lottery Tuition Assistance in the same academic year. There are two opportunities to apply for the scholarship during the student’s graduating year, which is during the early (December 15th) or final (June 15th) deadline of the graduating year. Students must process the application through their high school guidance counselor. Application for the Palmetto Fellows Scholarship must be completed during the student’s graduating year of high school. To be eligible for the scholarship, students must meet each criterion in one of the following sets of academic requirements:
1. Score at least 1200 on the SAT (27 on the ACT), earn a minimum 3.50 cumulative GPA on the S.C. Uniform Grading Policy (SC UGP), and rank in the top six percent at the end of either the sophomore, junior, or senior class; OR
2. Score at least 1400 on the SAT (32 on the ACT) and earn a minimum 4.00 cumulative GPA on the SC UGP (class rank requirement waived).
To renew the Palmetto Fellows Scholarship each academic year, students must earn at least 30 credit hours for graduation purposes and earn a minimum 3.0 cumulative institutional GPA for graduation purposes at the current institution at which the student is seeking a degree.
Page | 93
Legislative Incentives for Future Excellence (LIFE) Scholarship The LIFE Scholarship Program is a merit-based scholarship established in 1998. The scholarship is awarded annually to eligible students attending two- and four-year institutions in the state. Scholarship funds are awarded half in the fall term and half in the spring and must be applied toward the cost of attendance. Students attending an eligible two-year or technical college may receive up to the cost of tuition and fees, to include a $300 book allowance (total award not to exceed $5,000), for a maximum of two consecutive terms toward a one- year program and up to four consecutive terms toward a two-year program (based on the date of initial college enrollment). Students attending an eligible four-year public or independent institution may receive up to $4,700, plus a $300 book allowance (total award not to exceed $5,000), for a maximum of eight consecutive terms toward the first bachelor’s degree or the first CHE-approved 3 + 2 program. For the first CHE-approved five-year undergraduate program, students may receive up to 10 consecutive terms of scholarship funding (maximum terms of funding based on the date of initial college enrollment). To be eligible, students must be legal residents of South Carolina at the time of their high school graduation and college enrollment. In addition, LIFE Scholarship recipients cannot be recipients of the Palmetto Fellows Scholarship, S.C. HOPE Scholarship, or Lottery Tuition Assistance in the same academic year. In order to qualify at a two-year or technical college, first-time entering freshman must earn a minimum 3.0 cumulative GPA based on the SC Uniform Grading Policy (UGP) upon high school graduation (test score and class rank requirements are waived). In order to qualify at a four-year institution, first-time entering freshman must meet two of the following three criteria:
(1) Earn a minimum 3.0 cumulative GPA on the S.C. UGP upon high school graduation (2) Score at least 1100 on the SAT (equivalent 24 on ACT) by the June test administration of high
school graduation year (3) Rank in the top 30% of the high school graduating class based on the SC UGP
To renew (or earn) the LIFE Scholarship, students must earn an average of 30 credit hours by the end of the first year, 60 credit hours by the end of the second year, and 90 credit hours by the end of the third year for graduation purposes (based on the date of initial college enrollment) and earn a cumulative 3.0 “LIFE GPA” each academic year. Enhancements for the LIFE Scholarship and Palmetto Fellows Scholarship Scholarship recipients may be eligible to receive enhancement funds as early as the sophomore year for a maximum of six consecutive terms toward the first bachelor’s degree or first CHE-approved 3 + 2 program. Scholarship enhancements are not available the first year of college enrollment. To qualify for the LIFE Scholarship or Palmetto Fellows Scholarship Enhancement, a student must meet ALL eligibility requirements and be a recipient of the underlying scholarship. In addition, students must declare a major in an approved mathematics or science program at an eligible four-year institution in S.C. Students must successfully complete at least 14 credit hours of instruction in mathematics or life and physical science or a combination of both by the end of the first academic year of college enrollment. Palmetto Fellows may receive up to $10,000 per year (combined funds from $7,500 Palmetto Fellows Scholarship and $2,500 enhancement). LIFE Scholarship recipients may receive up to $7,500 per year (combined funds from $5,000 LIFE Scholarship and $2,500 enhancement). Scholarship and enhancement funds must be applied toward the cost of attendance.
Page | 94
S.C. HOPE Scholarship The S.C. HOPE Scholarship is a merit-based scholarship established under the 2001 S.C. Education Lottery Act and implemented in fall 2002. The scholarship was created to provide funding for students attending an eligible four-year institution in S.C. who did not qualify for the LIFE or Palmetto Fellows Scholarship. Students may receive up to $2,500 plus a $300 book allowance (total award not to exceed $2,800) for the first two consecutive terms of college enrollment. Scholarship funds are applied toward the cost of attendance. In order to qualify, first-time entering freshman must earn a minimum 3.0 cumulative GPA on the S.C. Uniform Grading Policy (UGP) upon high school graduation. Funding for this program is dependent upon lottery proceeds. S.C. HOPE Scholarship recipients cannot be recipients of the LIFE Scholarship, Palmetto Fellows Scholarship, or Lottery Tuition Assistance in the same academic year. Since the S.C. HOPE Scholarship is for the freshman year only, students may qualify for the LIFE scholarship beginning with their sophomore year. They must meet the eligibility requirements for earning the LIFE Scholarship. S.C. Need-based Grant At S.C. public institutions, eligible degree-seeking students may receive up to $2,500 annually if enrolled full-time and up to $1,250 annually if enrolled part-time. Students may receive Need-based Grant funding for up to two academic terms each academic year which may be awarded in any combination of fall, spring, or summer terms. The Need-based Grant is an annual award that must be applied toward the cost of attendance and disbursed half in the first semester and half in the second semester. To be eligible for grant funds, students must submit the Free Application for Federal Student Aid (FASFSA) to the US Department of Education, be enrolled in at least six credit hours for the term and enrolled in their first one-year program, first associate’s degree, first two-year program leading to a baccalaureate degree, first baccalaureate degree, or first professional degree. Assuming continued eligibility, students may receive up to eight full-time equivalent terms. Based on the institution’s level of Need-based Grant funding, the student’s financial aid office determines the exact award amount, after considering any other scholarship or federal aid received. To renew the Need-based Grant, students must complete and submit a FAFSA each year, earn the requisite number of credit hours based upon their enrollment status during the term(s) grant funds were awarded and earn at least a cumulative 2.0 GPA for graduation purposes by the end of the academic year. Lottery Tuition Assistance The Lottery Tuition Assistance Program was established in 2001 under the S.C. Education Lottery Act and implemented fall 2002. Lottery Tuition Assistance is available at eligible two-year institutions in the state. Exact award amounts are contingent upon the number of eligible students and funding available from lottery proceeds. Before calculating the award amount, all federal grants and the S.C. Need-based Grant must be applied. Lottery Tuition Assistance funds can only be used for payment of the cost of tuition and mandatory fees. Each academic year, S.C. residents must submit the Free Application for Federal Student Aid (FAFSA) or the FAFSA Waiver form. In addition, students must be enrolled as degree-seeking in at least six credit hours for the term. Recipients of Lottery Tuition Assistance cannot receive nor be eligible to receive the S.C. HOPE, LIFE, or Palmetto Fellows Scholarship in the same academic year. To renew Lottery Tuition Assistance, students must meet satisfactory academic progress established by the institution for the purposes of complying with Title IV regulations.
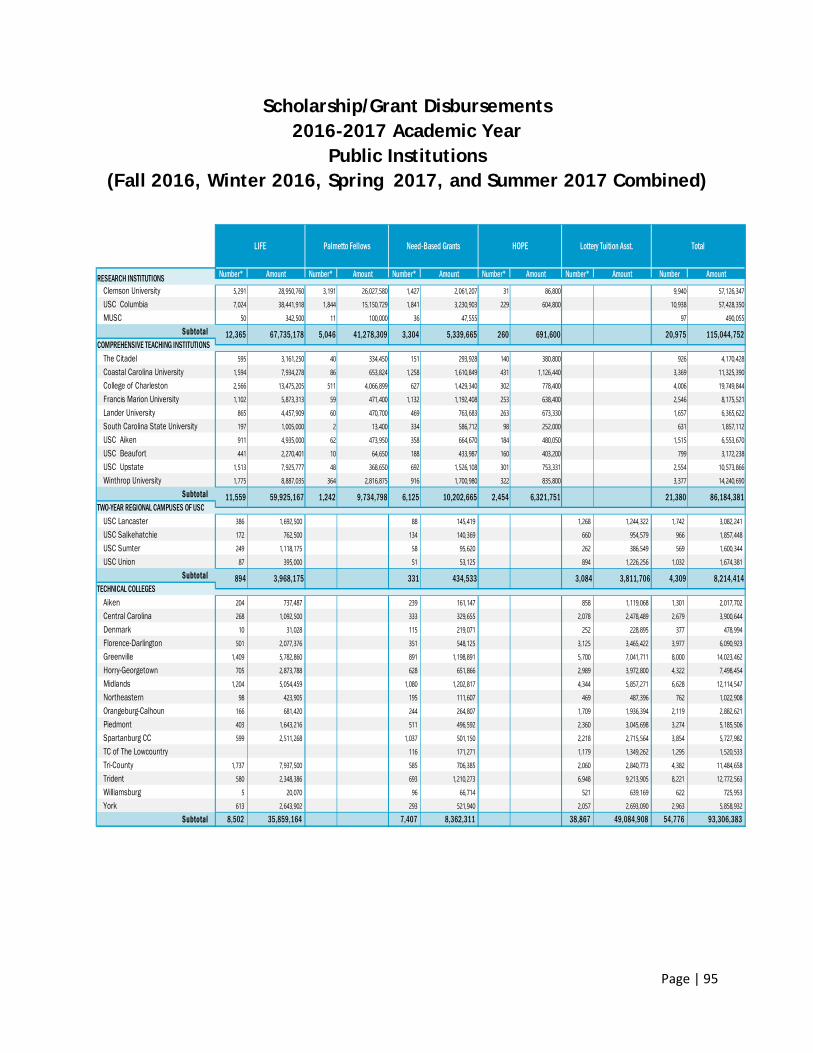
Page | 95
Scholarship/Grant Disbursements 2016-2017 Academic Year
Public Institutions (Fall 2016, Winter 2016, Spring 2017, and Summer 2017 Combined)
Number* Amount Number* Amount Number* Amount Number* Amount Number* Amount Number Amount
Clemson University 5,291 28,950,760 3,191 26,027,580 1,427 2,061,207 31 86,800 9,940 57,126,347
USC Columbia 7,024 38,441,918 1,844 15,150,729 1,841 3,230,903 229 604,800 10,938 57,428,350
MUSC 50 342,500 11 100,000 36 47,555 97 490,055
Subtotal
The Citadel 595 3,161,250 40 334,450 151 293,928 140 380,800 926 4,170,428Coastal Carolina University 1,594 7,934,278 86 653,824 1,258 1,610,849 431 1,126,440 3,369 11,325,390
College of Charleston 2,566 13,475,205 511 4,066,899 627 1,429,340 302 778,400 4,006 19,749,844
Francis Marion University 1,102 5,873,313 59 471,400 1,132 1,192,408 253 638,400 2,546 8,175,521
Lander University 865 4,457,909 60 470,700 469 763,683 263 673,330 1,657 6,365,622
South Carolina State University 197 1,005,000 2 13,400 334 586,712 98 252,000 631 1,857,112USC Aiken 911 4,935,000 62 473,950 358 664,670 184 480,050 1,515 6,553,670USC Beaufort 441 2,270,401 10 64,650 188 433,987 160 403,200 799 3,172,238USC Upstate 1,513 7,925,777 48 368,650 692 1,526,108 301 753,331 2,554 10,573,866Winthrop University 1,775 8,887,035 364 2,816,875 916 1,700,980 322 835,800 3,377 14,240,690
Subtotal
USC Lancaster 386 1,692,500 88 145,419 1,268 1,244,322 1,742 3,082,241
USC Salkehatchie 172 762,500 134 140,369 660 954,579 966 1,857,448
USC Sumter 249 1,118,175 58 95,620 262 386,549 569 1,600,344 USC Union 87 395,000 51 53,125 894 1,226,256 1,032 1,674,381
Subtotal
Aiken 204 737,487 239 161,147 858 1,119,068 1,301 2,017,702 Central Carolina 268 1,092,500 333 329,655 2,078 2,478,489 2,679 3,900,644 Denmark 10 31,028 115 219,071 252 228,895 377 478,994
Florence-Darlington 501 2,077,376 351 548,125 3,125 3,465,422 3,977 6,090,923 Greenville 1,409 5,782,860 891 1,198,891 5,700 7,041,711 8,000 14,023,462 Horry-Georgetown 705 2,873,788 628 651,866 2,989 3,972,800 4,322 7,498,454
Midlands 1,204 5,054,459 1,080 1,202,817 4,344 5,857,271 6,628 12,114,547
Northeastern 98 423,905 195 111,607 469 487,396 762 1,022,908 Orangeburg-Calhoun 166 681,420 244 264,807 1,709 1,936,394 2,119 2,882,621 Piedmont 403 1,643,216 511 496,592 2,360 3,045,698 3,274 5,185,506
Spartanburg CC 599 2,511,268 1,037 501,150 2,218 2,715,564 3,854 5,727,982 TC of The Lowcountry 116 171,271 1,179 1,349,262 1,295 1,520,533
Tri-County 1,737 7,937,500 585 706,385 2,060 2,840,773 4,382 11,484,658
Trident 580 2,348,386 693 1,210,273 6,948 9,213,905 8,221 12,772,563 Williamsburg 5 20,070 96 66,714 521 639,169 622 725,953 York 613 2,643,902 293 521,940 2,057 2,693,090 2,963 5,858,932
Subtotal 8,502 35,859,164 7,407 8,362,311 38,867 49,084,908 54,776 93,306,383
8,214,414TECHNICAL COLLEGES
434,533 3,084 3,811,706 4,309
21,380
894 3,968,175 331
20,975 115,044,752COMPREHENSIVE TEACHING INSTITUTIONS
11,559 59,925,167 1,242 9,734,798 6,125 10,202,665 2,454 6,321,751 86,184,381TWO-YEAR REGIONAL CAMPUSES OF USC
3,304 5,339,665 260 691,600
RESEARCH INSTITUTIONS
12,365 67,735,178 5,046 41,278,309
LIFE Palmetto Fellows Need-Based Grants HOPE Lottery Tuition Asst. Total
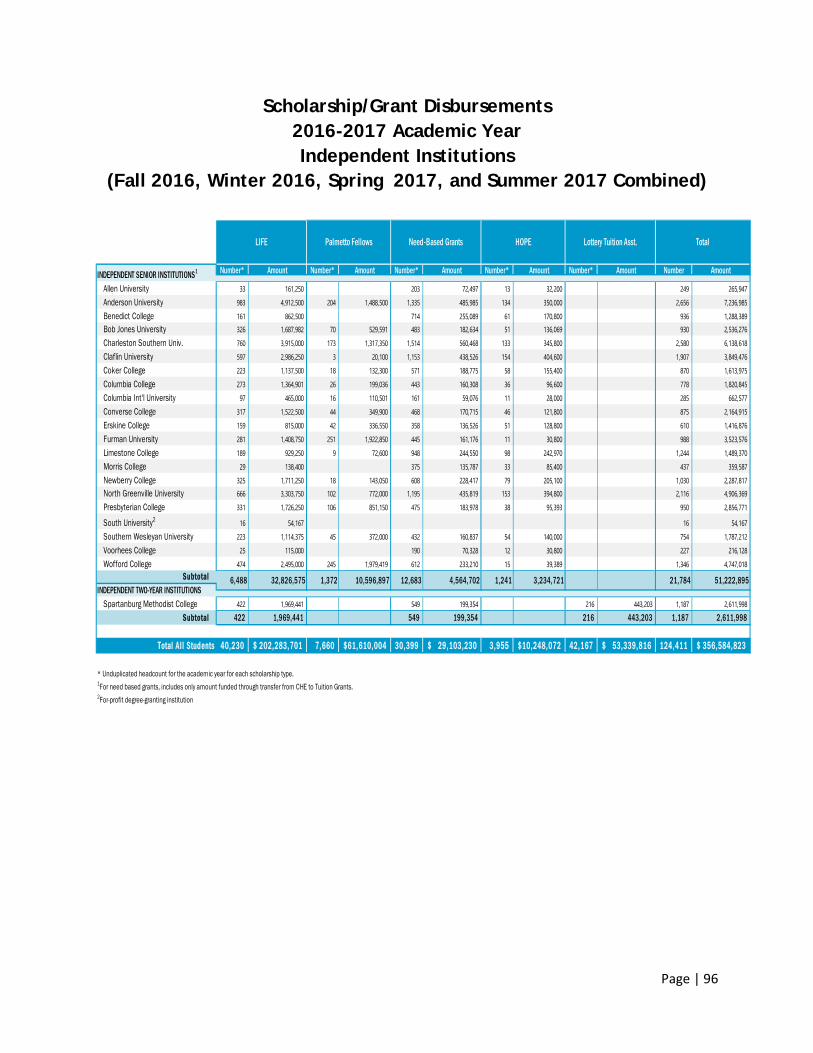
Page | 96
Scholarship/Grant Disbursements 2016-2017 Academic Year Independent Institutions
(Fall 2016, Winter 2016, Spring 2017, and Summer 2017 Combined)
Number* Amount Number* Amount Number* Amount Number* Amount Number* Amount Number Amount
Allen University 33 161,250 203 72,497 13 32,200 249 265,947 Anderson University 983 4,912,500 204 1,488,500 1,335 485,985 134 350,000 2,656 7,236,985 Benedict College 161 862,500 714 255,089 61 170,800 936 1,288,389 Bob Jones University 326 1,687,982 70 529,591 483 182,634 51 136,069 930 2,536,276 Charleston Southern Univ. 760 3,915,000 173 1,317,350 1,514 560,468 133 345,800 2,580 6,138,618 Claflin University 597 2,986,250 3 20,100 1,153 438,526 154 404,600 1,907 3,849,476 Coker College 223 1,137,500 18 132,300 571 188,775 58 155,400 870 1,613,975 Columbia College 273 1,364,901 26 199,036 443 160,308 36 96,600 778 1,820,845 Columbia Int'l University 97 465,000 16 110,501 161 59,076 11 28,000 285 662,577 Converse College 317 1,522,500 44 349,900 468 170,715 46 121,800 875 2,164,915 Erskine College 159 815,000 42 336,550 358 136,526 51 128,800 610 1,416,876 Furman University 281 1,408,750 251 1,922,850 445 161,176 11 30,800 988 3,523,576 Limestone College 189 929,250 9 72,600 948 244,550 98 242,970 1,244 1,489,370 Morris College 29 138,400 375 135,787 33 85,400 437 359,587 Newberry College 325 1,711,250 18 143,050 608 228,417 79 205,100 1,030 2,287,817 North Greenville University 666 3,303,750 102 772,000 1,195 435,819 153 394,800 2,116 4,906,369 Presbyterian College 331 1,726,250 106 851,150 475 183,978 38 95,393 950 2,856,771
South University2 16 54,167 16 54,167
Southern Wesleyan University 223 1,114,375 45 372,000 432 160,837 54 140,000 754 1,787,212 Voorhees College 25 115,000 190 70,328 12 30,800 227 216,128 Wofford College 474 2,495,000 245 1,979,419 612 233,210 15 39,389 1,346 4,747,018
Subtotal
Spartanburg Methodist College 422 1,969,441 549 199,354 216 443,203 1,187 2,611,998 Subtotal 422 1,969,441 549 199,354 216 443,203 1,187 2,611,998
Total Al l Students 40,230 202,283,701$ 7,660 61,610,004$ 30,399 29,103,230$ 3,955 10,248,072$ 42,167 53,339,816$ 124,411 356,584,823$
* Unduplicated headcount for the academic year for each scholarship type.1For need based grants, includes only amount funded through transfer from CHE to Tuition Grants.2For-profit degree-granting institution
21,784 51,222,895INDEPENDENT TWO-YEAR INSTITUTIONS
INDEPENDENT SENIOR INSTITUTIONS1
6,488 32,826,575 1,372 10,596,897 12,683 4,564,702 1,241 3,234,721
LIFE Palmetto Fellows Need-Based Grants HOPE Lottery Tuition Asst. Total
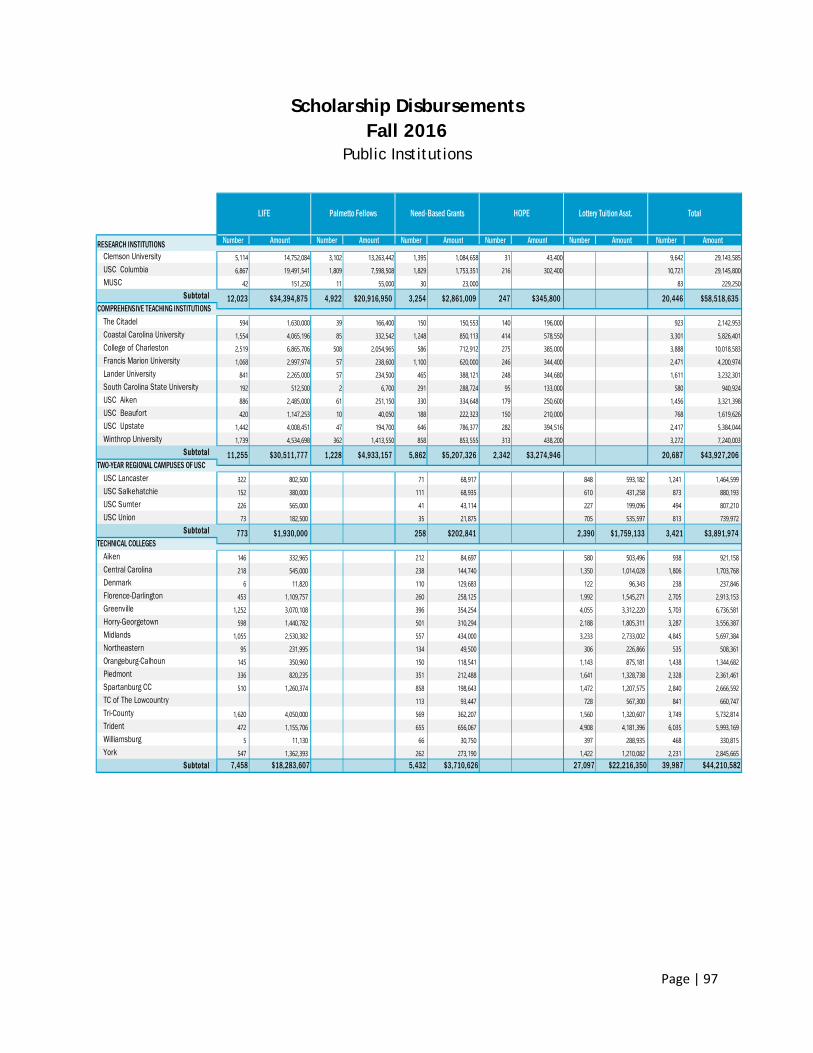
Page | 97
Scholarship Disbursements Fall 2016
Public Institutions
Number Amount Number Amount Number Amount Number Amount Number Amount Number Amount
Clemson University 5,114 14,752,084 3,102 13,263,442 1,395 1,084,658 31 43,400 9,642 29,143,585USC Columbia 6,867 19,491,541 1,809 7,598,508 1,829 1,753,351 216 302,400 10,721 29,145,800MUSC 42 151,250 11 55,000 30 23,000 83 229,250
Subtotal
The Citadel 594 1,630,000 39 166,400 150 150,553 140 196,000 923 2,142,953Coastal Carolina University 1,554 4,065,196 85 332,542 1,248 850,113 414 578,550 3,301 5,826,401College of Charleston 2,519 6,865,706 508 2,054,965 586 712,912 275 385,000 3,888 10,018,583Francis Marion University 1,068 2,997,974 57 238,600 1,100 620,000 246 344,400 2,471 4,200,974Lander University 841 2,265,000 57 234,500 465 388,121 248 344,680 1,611 3,232,301South Carolina State University 192 512,500 2 6,700 291 288,724 95 133,000 580 940,924USC Aiken 886 2,485,000 61 251,150 330 334,648 179 250,600 1,456 3,321,398USC Beaufort 420 1,147,253 10 40,050 188 222,323 150 210,000 768 1,619,626USC Upstate 1,442 4,008,451 47 194,700 646 786,377 282 394,516 2,417 5,384,044Winthrop University 1,739 4,534,698 362 1,413,550 858 853,555 313 438,200 3,272 7,240,003
Subtotal
USC Lancaster 322 802,500 71 68,917 848 593,182 1,241 1,464,599 USC Salkehatchie 152 380,000 111 68,935 610 431,258 873 880,193 USC Sumter 226 565,000 41 43,114 227 199,096 494 807,210 USC Union 73 182,500 35 21,875 705 535,597 813 739,972
Subtotal
Aiken 146 332,965 212 84,697 580 503,496 938 921,158 Central Carolina 218 545,000 238 144,740 1,350 1,014,028 1,806 1,703,768 Denmark 6 11,820 110 129,683 122 96,343 238 237,846 Florence-Darlington 453 1,109,757 260 258,125 1,992 1,545,271 2,705 2,913,153 Greenville 1,252 3,070,108 396 354,254 4,055 3,312,220 5,703 6,736,581 Horry-Georgetown 598 1,440,782 501 310,294 2,188 1,805,311 3,287 3,556,387 Midlands 1,055 2,530,382 557 434,000 3,233 2,733,002 4,845 5,697,384 Northeastern 95 231,995 134 49,500 306 226,866 535 508,361 Orangeburg-Calhoun 145 350,960 150 118,541 1,143 875,181 1,438 1,344,682 Piedmont 336 820,235 351 212,488 1,641 1,328,738 2,328 2,361,461 Spartanburg CC 510 1,260,374 858 198,643 1,472 1,207,575 2,840 2,666,592 TC of The Lowcountry 113 93,447 728 567,300 841 660,747 Tri-County 1,620 4,050,000 569 362,207 1,560 1,320,607 3,749 5,732,814 Trident 472 1,155,706 655 656,067 4,908 4,181,396 6,035 5,993,169 Williamsburg 5 11,130 66 30,750 397 288,935 468 330,815 York 547 1,362,393 262 273,190 1,422 1,210,082 2,231 2,845,665
Subtotal 7,458 $18,283,607 5,432 $3,710,626 27,097 $22,216,350 39,987 $44,210,582
LIFE Palmetto Fellows Need-Based Grants HOPE Lottery Tuition Asst. Total
247 $345,800
RESEARCH INSTITUTIONS
12,023 $34,394,875 4,922 $20,916,950 20,446 $58,518,635COMPREHENSIVE TEACHING INSTITUTIONS
11,255 $30,511,777 1,228 $4,933,157 5,862 $5,207,326 2,342 $3,274,946 $43,927,206TWO-YEAR REGIONAL CAMPUSES OF USC
3,254 $2,861,009
20,687
773 $1,930,000 258 $3,891,974TECHNICAL COLLEGES
$202,841 2,390 $1,759,133 3,421
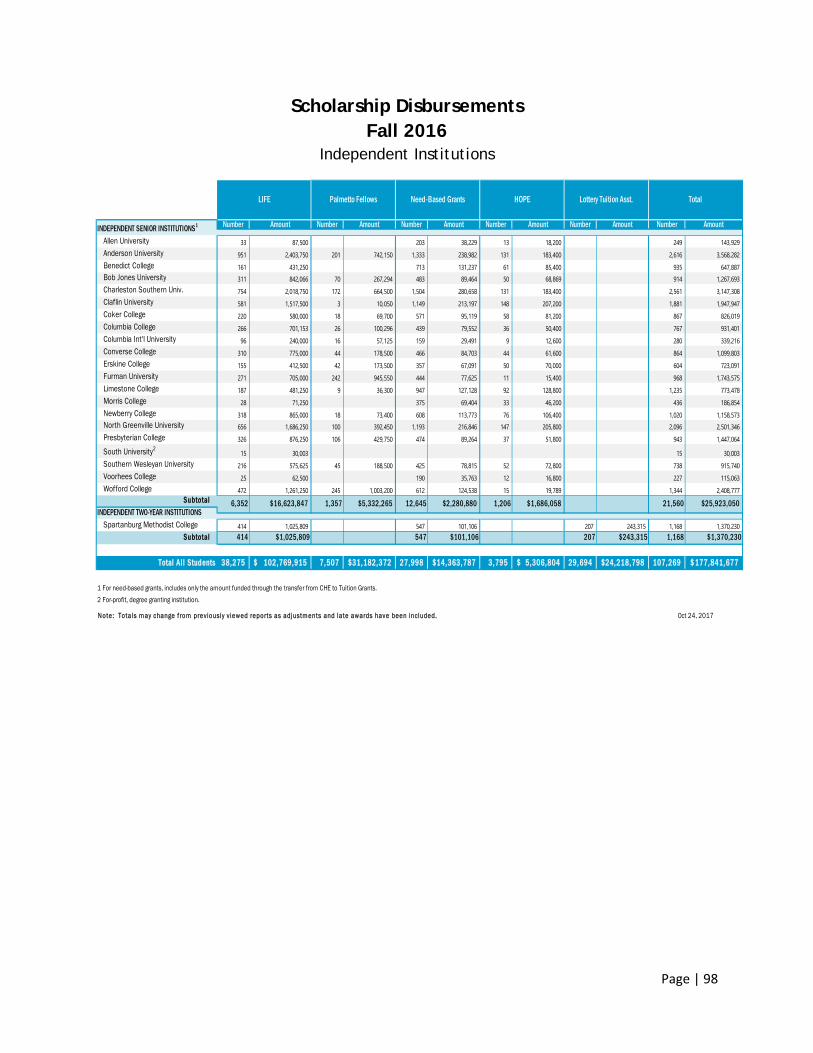
Page | 98
Scholarship Disbursements Fall 2016
Independent Institutions
Number Amount Number Amount Number Amount Number Amount Number Amount Number Amount
Allen University 33 87,500 203 38,229 13 18,200 249 143,929 Anderson University 951 2,403,750 201 742,150 1,333 238,982 131 183,400 2,616 3,568,282 Benedict College 161 431,250 713 131,237 61 85,400 935 647,887 Bob Jones University 311 842,066 70 267,294 483 89,464 50 68,869 914 1,267,693 Charleston Southern Univ. 754 2,018,750 172 664,500 1,504 280,658 131 183,400 2,561 3,147,308 Claflin University 581 1,517,500 3 10,050 1,149 213,197 148 207,200 1,881 1,947,947 Coker College 220 580,000 18 69,700 571 95,119 58 81,200 867 826,019 Columbia College 266 701,153 26 100,296 439 79,552 36 50,400 767 931,401 Columbia Int'l University 96 240,000 16 57,125 159 29,491 9 12,600 280 339,216 Converse College 310 775,000 44 178,500 466 84,703 44 61,600 864 1,099,803 Erskine College 155 412,500 42 173,500 357 67,091 50 70,000 604 723,091 Furman University 271 705,000 242 945,550 444 77,625 11 15,400 968 1,743,575 Limestone College 187 481,250 9 36,300 947 127,128 92 128,800 1,235 773,478 Morris College 28 71,250 375 69,404 33 46,200 436 186,854 Newberry College 318 865,000 18 73,400 608 113,773 76 106,400 1,020 1,158,573 North Greenville University 656 1,686,250 100 392,450 1,193 216,846 147 205,800 2,096 2,501,346 Presbyterian College 326 876,250 106 429,750 474 89,264 37 51,800 943 1,447,064 South University2
15 30,003 15 30,003 Southern Wesleyan University 216 575,625 45 188,500 425 78,815 52 72,800 738 915,740 Voorhees College 25 62,500 190 35,763 12 16,800 227 115,063 Wofford College 472 1,261,250 245 1,003,200 612 124,538 15 19,789 1,344 2,408,777
Subtotal
Spartanburg Methodist College 414 1,025,809 547 101,106 207 243,315 1,168 1,370,230 Subtotal 414 $1,025,809 547 $101,106 207 $243,315 1,168 $1,370,230
Total Al l Students 38,275 102,769,915$ 7,507 31,182,372$ 27,998 14,363,787$ 3,795 5,306,804$ 29,694 24,218,798$ 107,269 177,841,677$
1 For need-based grants, includes only the amount funded through the transfer from CHE to Tuition Grants.
2 For-profit, degree granting institution.
Note: Totals may change from previously viewed reports as adjustments and late awards have been included. Oct 24, 2017
21,560 $25,923,050INDEPENDENT TWO-YEAR INSTITUTIONS
INDEPENDENT SENIOR INSTITUTIONS1
6,352 $16,623,847 1,357 $5,332,265 12,645 $2,280,880 1,206 $1,686,058
LIFE Palmetto Fellows Need-Based Grants HOPE Lottery Tuition Asst. Total
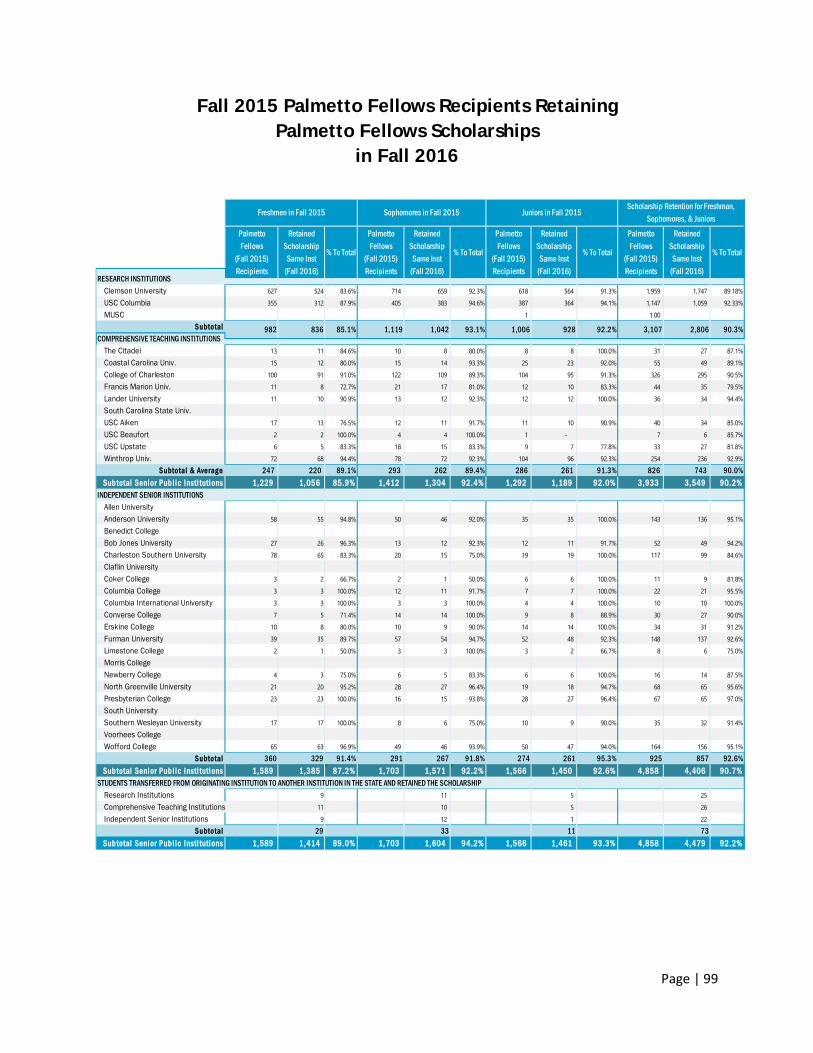
Page | 99
Fall 2015 Palmetto Fellows Recipients Retaining Palmetto Fellows Scholarships
in Fall 2016
Clemson University 627 524 83.6% 714 659 92.3% 618 564 91.3% 1,959 1,747 89.18%USC Columbia 355 312 87.9% 405 383 94.6% 387 364 94.1% 1,147 1,059 92.33%
MUSC 1 1.00 Subtotal
The Citadel 13 11 84.6% 10 8 80.0% 8 8 100.0% 31 27 87.1%
Coastal Carolina Univ. 15 12 80.0% 15 14 93.3% 25 23 92.0% 55 49 89.1%
College of Charleston 100 91 91.0% 122 109 89.3% 104 95 91.3% 326 295 90.5%Francis Marion Univ. 11 8 72.7% 21 17 81.0% 12 10 83.3% 44 35 79.5%Lander University 11 10 90.9% 13 12 92.3% 12 12 100.0% 36 34 94.4%South Carolina State Univ. USC Aiken 17 13 76.5% 12 11 91.7% 11 10 90.9% 40 34 85.0%USC Beaufort 2 2 100.0% 4 4 100.0% 1 - 7 6 85.7%USC Upstate 6 5 83.3% 18 15 83.3% 9 7 77.8% 33 27 81.8%Winthrop Univ. 72 68 94.4% 78 72 92.3% 104 96 92.3% 254 236 92.9%
Subtotal & Average 247 220 89.1% 293 262 89.4% 286 261 91.3% 826 743 90.0%Subtotal Senior Publ ic Insti tutions 1,229 1,056 85.9% 1,412 1,304 92.4% 1,292 1,189 92.0% 3,933 3,549 90.2%
INDEPENDENT SENIOR INSTITUTIONSAllen UniversityAnderson University 58 55 94.8% 50 46 92.0% 35 35 100.0% 143 136 95.1%Benedict CollegeBob Jones University 27 26 96.3% 13 12 92.3% 12 11 91.7% 52 49 94.2%Charleston Southern University 78 65 83.3% 20 15 75.0% 19 19 100.0% 117 99 84.6%Claflin UniversityCoker College 3 2 66.7% 2 1 50.0% 6 6 100.0% 11 9 81.8%
Columbia College 3 3 100.0% 12 11 91.7% 7 7 100.0% 22 21 95.5%Columbia International University 3 3 100.0% 3 3 100.0% 4 4 100.0% 10 10 100.0%Converse College 7 5 71.4% 14 14 100.0% 9 8 88.9% 30 27 90.0%Erskine College 10 8 80.0% 10 9 90.0% 14 14 100.0% 34 31 91.2%
Furman University 39 35 89.7% 57 54 94.7% 52 48 92.3% 148 137 92.6%
Limestone College 2 1 50.0% 3 3 100.0% 3 2 66.7% 8 6 75.0%
Morris CollegeNewberry College 4 3 75.0% 6 5 83.3% 6 6 100.0% 16 14 87.5%North Greenville University 21 20 95.2% 28 27 96.4% 19 18 94.7% 68 65 95.6%
Presbyterian College 23 23 100.0% 16 15 93.8% 28 27 96.4% 67 65 97.0%
South UniversitySouthern Wesleyan University 17 17 100.0% 8 6 75.0% 10 9 90.0% 35 32 91.4%
Voorhees CollegeWofford College 65 63 96.9% 49 46 93.9% 50 47 94.0% 164 156 95.1%
Subtotal 360 329 91.4% 291 267 91.8% 274 261 95.3% 925 857 92.6%Subtotal Senior Publ ic Insti tutions 1,589 1,385 87.2% 1,703 1,571 92.2% 1,566 1,450 92.6% 4,858 4,406 90.7%
STUDENTS TRANSFERRED FROM ORIGINATING INSTITUTION TO ANOTHER INSTITUTION IN THE STATE AND RETAINED THE SCHOLARSHIPResearch Institutions 9 11 5 25
Comprehensive Teaching Institutions 11 10 5 26 Independent Senior Institutions 9 12 1 22
Subtotal 29 33 11 73Subtotal Senior Publ ic Insti tutions 1,589 1,414 89.0% 1,703 1,604 94.2% 1,566 1,461 93.3% 4,858 4,479 92.2%
90.3%
Palmetto Fellows
(Fall 2015)Recipients
Retained Scholarship
Same Inst(Fall 2016)
COMPREHENSIVE TEACHING INSTITUTIONS
Freshmen in Fall 2015 Sophomores in Fall 2015
982 836 85.1% 1,119 1,042 93.1%
Retained Scholarship
Same Inst(Fall 2016)
% To Total
1,006 928 92.2% 3,107 2,806
% To Total
Palmetto Fellows
(Fall 2015)Recipients
Retained Scholarship
Same Inst(Fall 2016)
% To Total
RESEARCH INSTITUTIONS
Palmetto Fellows
(Fall 2015)Recipients
Retained Scholarship
Same Inst(Fall 2016)
% To Total
Palmetto Fellows
(Fall 2015)Recipients
Juniors in Fall 2015Scholarship Retention for Freshman,
Sophomores, & Juniors
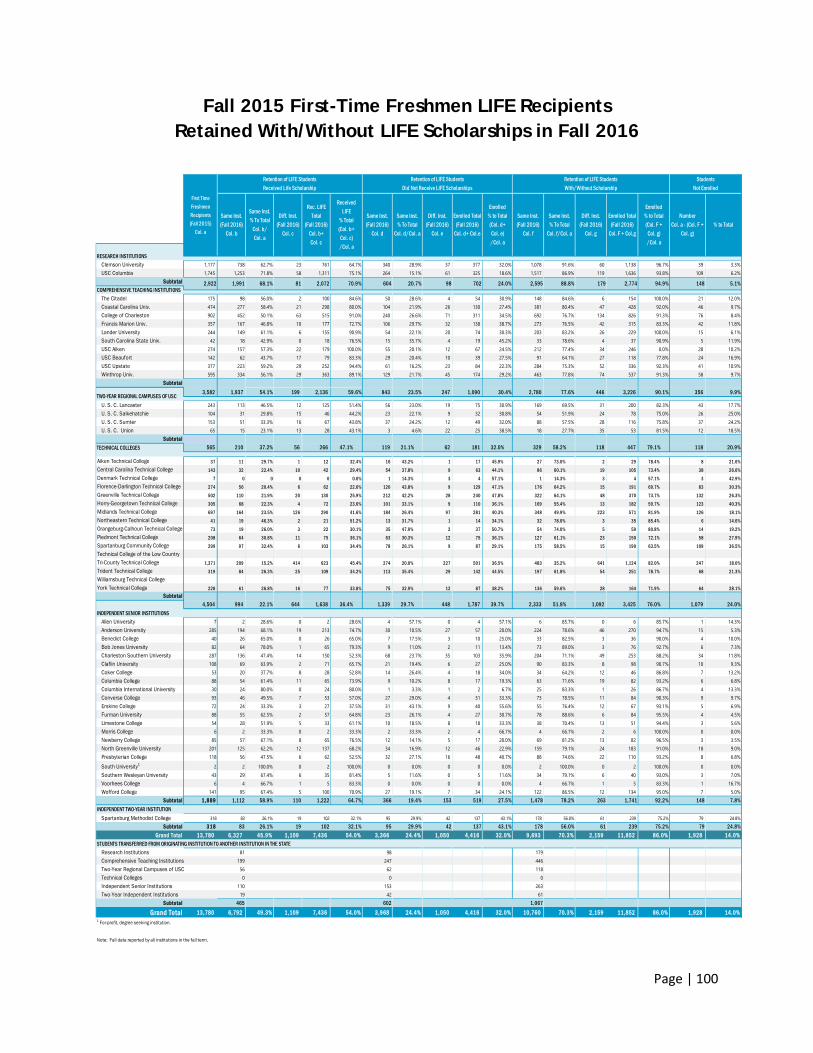
Page | 100
Fall 2015 First-Time Freshmen LIFE Recipients Retained With/Without LIFE Scholarships in Fall 2016
Clemson University 1,177 738 62.7% 23 761 64.7% 340 28.9% 37 377 32.0% 1,078 91.6% 60 1,138 96.7% 39 3.3%USC Columbia 1,745 1,253 71.8% 58 1,311 75.1% 264 15.1% 61 325 18.6% 1,517 86.9% 119 1,636 93.8% 109 6.2%
Subtotal
The Citadel 175 98 56.0% 2 100 84.6% 50 28.6% 4 54 30.9% 148 84.6% 6 154 100.0% 21 12.0%Coastal Carolina Univ. 474 277 58.4% 21 298 80.0% 104 21.9% 26 130 27.4% 381 80.4% 47 428 92.0% 46 9.7%College of Charleston 902 452 50.1% 63 515 91.0% 240 26.6% 71 311 34.5% 692 76.7% 134 826 91.3% 76 8.4%Francis Marion Univ. 357 167 46.8% 10 177 72.7% 106 29.7% 32 138 38.7% 273 76.5% 42 315 83.3% 42 11.8%Lander University 244 149 61.1% 6 155 90.9% 54 22.1% 20 74 30.3% 203 83.2% 26 229 100.0% 15 6.1%South Carolina State Univ. 42 18 42.9% 0 18 76.5% 15 35.7% 4 19 45.2% 33 78.6% 4 37 90.9% 5 11.9%USC Aiken 274 157 57.3% 22 179 100.0% 55 20.1% 12 67 24.5% 212 77.4% 34 246 0.0% 28 10.2%USC Beaufort 142 62 43.7% 17 79 83.3% 29 20.4% 10 39 27.5% 91 64.1% 27 118 77.8% 24 16.9%USC Upstate 377 223 59.2% 29 252 94.4% 61 16.2% 23 84 22.3% 284 75.3% 52 336 92.3% 41 10.9%Winthrop Univ. 595 334 56.1% 29 363 89.1% 129 21.7% 45 174 29.2% 463 77.8% 74 537 91.3% 58 9.7%
Subtotal1,937 54.1% 199 2,136 59.6%
U. S. C. Lancaster 243 113 46.5% 12 125 51.4% 56 23.0% 19 75 30.9% 169 69.5% 31 200 82.3% 43 17.7%U. S. C. Salkehatchie 104 31 29.8% 15 46 44.2% 23 22.1% 9 32 30.8% 54 51.9% 24 78 75.0% 26 25.0%U. S. C. Sumter 153 51 33.3% 16 67 43.8% 37 24.2% 12 49 32.0% 88 57.5% 28 116 75.8% 37 24.2%U. S. C. Union 65 15 23.1% 13 28 43.1% 3 4.6% 22 25 38.5% 18 27.7% 35 53 81.5% 12 18.5%
Subtotal565 210 56 266 119 62 181 329 118 447 118
Aiken Technical College 37 11 29.7% 1 12 32.4% 16 43.2% 1 17 45.9% 27 73.0% 2 29 78.4% 8 21.6%Central Carolina Technical College 143 32 22.4% 10 42 29.4% 54 37.8% 9 63 44.1% 86 60.1% 19 105 73.4% 38 26.6%Denmark Technical College 7 0 0 0 0 0.0% 1 14.3% 3 4 57.1% 1 14.3% 3 4 57.1% 3 42.9%Florence-Darlington Technical College 274 56 20.4% 6 62 22.6% 120 43.8% 9 129 47.1% 176 64.2% 15 191 69.7% 83 30.3%Greenville Technical College 502 110 21.9% 20 130 25.9% 212 42.2% 28 240 47.8% 322 64.1% 48 370 73.7% 132 26.3%Horry-Georgetown Technical College 305 68 22.3% 4 72 23.6% 101 33.1% 9 110 36.1% 169 55.4% 13 182 59.7% 123 40.3%Midlands Technical College 697 164 23.5% 126 290 41.6% 184 26.4% 97 281 40.3% 348 49.9% 223 571 81.9% 126 18.1%Northeastern Technical College 41 19 46.3% 2 21 51.2% 13 31.7% 1 14 34.1% 32 78.0% 3 35 85.4% 6 14.6%Orangeburg-Calhoun Technical College 73 19 26.0% 3 22 30.1% 35 47.9% 2 37 50.7% 54 74.0% 5 59 80.8% 14 19.2%Piedmont Technical College 208 64 30.8% 11 75 36.1% 63 30.3% 12 75 36.1% 127 61.1% 23 150 72.1% 58 27.9%Spartanburg Community College 299 97 32.4% 6 103 34.4% 78 26.1% 9 87 29.1% 175 58.5% 15 190 63.5% 109 36.5%Technical College of the Low CountryTri-County Technical College 1,371 209 15.2% 414 623 45.4% 274 20.0% 227 501 36.5% 483 35.2% 641 1,124 82.0% 247 18.0%Trident Technical College 319 84 26.3% 25 109 34.2% 113 35.4% 29 142 44.5% 197 61.8% 54 251 78.7% 68 21.3%Williamsburg Technical CollegeYork Technical College 228 61 26.8% 16 77 33.8% 75 32.9% 12 87 38.2% 136 59.6% 28 164 71.9% 64 28.1%
Subtotal994 644
INDEPENDENT SENIOR INSTITUTIONSAllen University 7 2 28.6% 0 2 28.6% 4 57.1% 0 4 57.1% 6 85.7% 0 6 85.7% 1 14.3%Anderson University 285 194 68.1% 19 213 74.7% 30 10.5% 27 57 20.0% 224 78.6% 46 270 94.7% 15 5.3%Benedict College 40 26 65.0% 0 26 65.0% 7 17.5% 3 10 25.0% 33 82.5% 3 36 90.0% 4 10.0%Bob Jones University 82 64 78.0% 1 65 79.3% 9 11.0% 2 11 13.4% 73 89.0% 3 76 92.7% 6 7.3%Charleston Southern University 287 136 47.4% 14 150 52.3% 68 23.7% 35 103 35.9% 204 71.1% 49 253 88.2% 34 11.8%Claflin University 108 69 63.9% 2 71 65.7% 21 19.4% 6 27 25.0% 90 83.3% 8 98 90.7% 10 9.3%Coker College 53 20 37.7% 8 28 52.8% 14 26.4% 4 18 34.0% 34 64.2% 12 46 86.8% 7 13.2%Columbia College 88 54 61.4% 11 65 73.9% 9 10.2% 8 17 19.3% 63 71.6% 19 82 93.2% 6 6.8%Columbia International University 30 24 80.0% 0 24 80.0% 1 3.3% 1 2 6.7% 25 83.3% 1 26 86.7% 4 13.3%Converse College 93 46 49.5% 7 53 57.0% 27 29.0% 4 31 33.3% 73 78.5% 11 84 90.3% 9 9.7%Erskine College 72 24 33.3% 3 27 37.5% 31 43.1% 9 40 55.6% 55 76.4% 12 67 93.1% 5 6.9%Furman University 88 55 62.5% 2 57 64.8% 23 26.1% 4 27 30.7% 78 88.6% 6 84 95.5% 4 4.5%Limestone College 54 28 51.9% 5 33 61.1% 10 18.5% 8 18 33.3% 38 70.4% 13 51 94.4% 3 5.6%Morris College 6 2 33.3% 0 2 33.3% 2 33.3% 2 4 66.7% 4 66.7% 2 6 100.0% 0 0.0%Newberry College 85 57 67.1% 8 65 76.5% 12 14.1% 5 17 20.0% 69 81.2% 13 82 96.5% 3 3.5%North Greenville University 201 125 62.2% 12 137 68.2% 34 16.9% 12 46 22.9% 159 79.1% 24 183 91.0% 18 9.0%Presbyterian College 118 56 47.5% 6 62 52.5% 32 27.1% 16 48 40.7% 88 74.6% 22 110 93.2% 8 6.8%
South University1 2 2 100.0% 0 2 100.0% 0 0.0% 0 0 0.0% 2 100.0% 0 2 100.0% 0 0.0%Southern Wesleyan University 43 29 67.4% 6 35 81.4% 5 11.6% 0 5 11.6% 34 79.1% 6 40 93.0% 3 7.0%Voorhees College 6 4 66.7% 1 5 83.3% 0 0.0% 0 0 0.0% 4 66.7% 1 5 83.3% 1 16.7%Wofford College 141 95 67.4% 5 100 70.9% 27 19.1% 7 34 24.1% 122 86.5% 12 134 95.0% 7 5.0%
Subtotal 1, 889 1,112 58.9% 110 1,222 64.7% 366 19.4% 153 519 27.5% 1,478 78.2% 263 1,741 92.2% 148 7.8%INDEPENDENT TWO-YEAR INSTITUTION
Spartanburg Methodist College 318 83 26.1% 19 102 32.1% 95 29.9% 42 137 43.1% 178 56.0% 61 239 75.2% 79 24.8%Subtotal 318 83 26.1% 19 102 32.1% 95 29.9% 42 137 43.1% 178 56.0% 61 239 75.2% 79 24.8%
Grand Total 13,780 6,327 45.9% 1,109 7,436 54.0% 3,366 24.4% 1,050 4,416 32.0% 9,693 70.3% 2,159 11,852 86.0% 1,928 14.0%
Research Institutions 81 98 179Comprehensive Teaching Institutions 199 247 446Two-Year Regional Campuses of USC 56 62 118Technical Colleges 0 0 0Independent Senior Institutions 110 153 263Two-Year Independent Institutions 19 42 61
Subtotal 465 602 1,067
Grand Total 13,780 6,792 49.3% 1,109 7,436 54.0% 3,968 24.4% 1,050 4,416 32.0% 10,760 70.3% 2,159 11,852 86.0% 1,928 14.0%1 For-profit, degree seeking institution.
Note: Fall data reported by all institutions in the fall term.
4,504 2,333 51.8% 1,092 3,425 76.0%1,339 29.7% 448 1,787 39.7%22.1% 1,638
STUDENTS TRANSFERRED FROM ORIGINATING INSTITUTION TO ANOTHER INSTITUTION IN THE STATE
Enrolled % to Total(Col. F +
Col. g)/Col. a
NumberCol. a - (Col. F +
Col. g)% to Total
RESEARCH INSTITUTIONS
Retention of LIFE Students With/Without Scholarship
StudentsNot Enrolled
2,595 88.8% 94.9%
1,079 24.0%
Retention of LIFE StudentsDid Not Receive LIFE Scholarships
24.0%
Same Inst.% To Total
Col. d/Col. a
Enrolled % to Total(Col. d+Col. e)/Col. a
36.4%
446
COMPREHENSIVE TEACHING INSTITUTIONS
First Time FreshmenRecipients (Fall 2015)
Col. a
2,922
3,582
Retention of LIFE StudentsReceived Life Scholarship
Same Inst.% To Total
Col. b/Col. a
ReceivedLIFE
% Total(Col. b+Col. c)/Col. a
Same Inst. (Fall 2016)
Col. b
Diff. Inst.(Fall 2016)
Col. g
179
30.4%1,090 843 23.5% 247
702
Diff. Inst.(Fall 2016)
Col. e
Enrolled Total(Fall 2016)
Col. d+ Col.e
Same Inst. (Fall 2016)
Col. d
Enrolled Total(Fall 2016)
Col. F + Col.g
2,7741,991 68.1% 70.9% 604 20.7% 148 5.1%
Same Inst. (Fall 2016)
Col. f
Same Inst.% To Total
Col. f/Col. a
Diff. Inst.(Fall 2016)
Col. c
Rec. LIFE Total
(Fall 2016)Col. b+Col. c
81 2,072 98
TECHNICAL COLLEGES
3,226
37.2% 58.2%
TWO-YEAR REGIONAL CAMPUSES OF USC
47.1% 21.1% 79.1%
9.9%
32.0% 20.9%
90.1% 356 2,780 77.6%
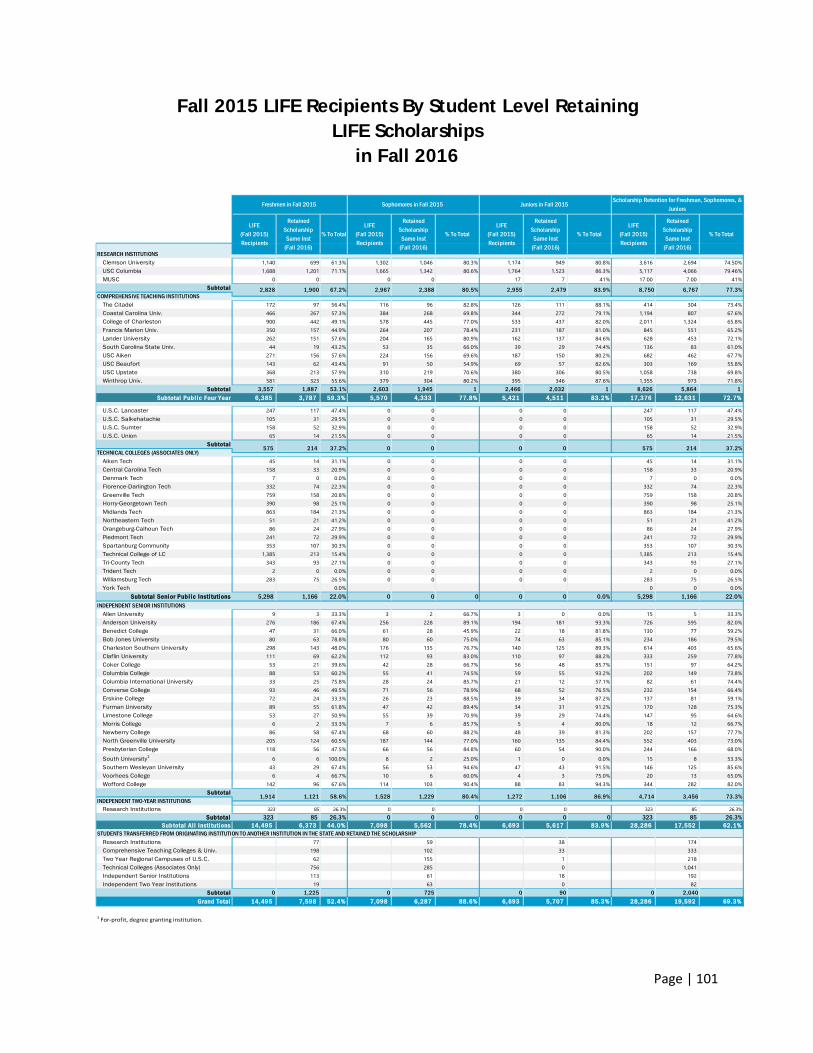
Page | 101
Fall 2015 LIFE Recipients By Student Level Retaining LIFE Scholarships
in Fall 2016
Clemson University 1,140 699 61.3% 1,302 1,046 80.3% 1,174 949 80.8% 3,616 2,694 74.50%USC Columbia 1,688 1,201 71.1% 1,665 1,342 80.6% 1,764 1,523 86.3% 5,117 4,066 79.46%MUSC 0 0 0 0 17 7 41% 17.00 7.00 41%
Subtotal
The Citadel 172 97 56.4% 116 96 82.8% 126 111 88.1% 414 304 73.4%Coastal Carolina Univ. 466 267 57.3% 384 268 69.8% 344 272 79.1% 1,194 807 67.6%College of Charleston 900 442 49.1% 578 445 77.0% 533 437 82.0% 2,011 1,324 65.8%Francis Marion Univ. 350 157 44.9% 264 207 78.4% 231 187 81.0% 845 551 65.2%Lander University 262 151 57.6% 204 165 80.9% 162 137 84.6% 628 453 72.1%South Carolina State Univ. 44 19 43.2% 53 35 66.0% 39 29 74.4% 136 83 61.0%USC Aiken 271 156 57.6% 224 156 69.6% 187 150 80.2% 682 462 67.7%USC Beaufort 143 62 43.4% 91 50 54.9% 69 57 82.6% 303 169 55.8%USC Upstate 368 213 57.9% 310 219 70.6% 380 306 80.5% 1,058 738 69.8%Winthrop Univ. 581 323 55.6% 379 304 80.2% 395 346 87.6% 1,355 973 71.8%
Subtotal 3,557 1,887 53.1% 2,603 1,945 1 2,466 2,032 1 8,626 5,864 1 Subtotal Publ ic Four Year 6,385 3,787 59.3% 5,570 4,333 77.8% 5,421 4,511 83.2% 17,376 12,631 72.7%
U.S.C. Lancaster 247 117 47.4% 0 0 0 0 247 117 47.4%U.S.C. Salkehatachie 105 31 29.5% 0 0 0 0 105 31 29.5%U.S.C. Sumter 158 52 32.9% 0 0 0 0 158 52 32.9%U.S.C. Union 65 14 21.5% 0 0 0 0 65 14 21.5%
Subtotal
Aiken Tech 45 14 31.1% 0 0 0 0 45 14 31.1%Central Carolina Tech 158 33 20.9% 0 0 0 0 158 33 20.9%Denmark Tech 7 0 0.0% 0 0 0 0 7 0 0.0%Florence-Darlington Tech 332 74 22.3% 0 0 0 0 332 74 22.3%Greenville Tech 759 158 20.8% 0 0 0 0 759 158 20.8%Horry-Georgetown Tech 390 98 25.1% 0 0 0 0 390 98 25.1%Midlands Tech 863 184 21.3% 0 0 0 0 863 184 21.3%Northeastern Tech 51 21 41.2% 0 0 0 0 51 21 41.2%Orangeburg-Calhoun Tech 86 24 27.9% 0 0 0 0 86 24 27.9%Piedmont Tech 241 72 29.9% 0 0 0 0 241 72 29.9%Spartanburg Community 353 107 30.3% 0 0 0 0 353 107 30.3%Technical College of LC 1,385 213 15.4% 0 0 0 0 1,385 213 15.4%Tri-County Tech 343 93 27.1% 0 0 0 0 343 93 27.1%Trident Tech 2 0 0.0% 0 0 0 0 2 0 0.0%Williamsburg Tech 283 75 26.5% 0 0 0 0 283 75 26.5%York Tech 0.0% 0 0 0.0%
Subtotal Senior Publ ic Insti tutions 5,298 1,166 22.0% 0 0 0 0 0 0.0% 5,298 1,166 22.0%INDEPENDENT SENIOR INSTITUTIONS
Allen University 9 3 33.3% 3 2 66.7% 3 0 0.0% 15 5 33.3%Anderson University 276 186 67.4% 256 228 89.1% 194 181 93.3% 726 595 82.0%Benedict College 47 31 66.0% 61 28 45.9% 22 18 81.8% 130 77 59.2%Bob Jones University 80 63 78.8% 80 60 75.0% 74 63 85.1% 234 186 79.5%Charleston Southern University 298 143 48.0% 176 135 76.7% 140 125 89.3% 614 403 65.6%Claflin University 111 69 62.2% 112 93 83.0% 110 97 88.2% 333 259 77.8%Coker College 53 21 39.6% 42 28 66.7% 56 48 85.7% 151 97 64.2%Columbia College 88 53 60.2% 55 41 74.5% 59 55 93.2% 202 149 73.8%Columbia International University 33 25 75.8% 28 24 85.7% 21 12 57.1% 82 61 74.4%Converse College 93 46 49.5% 71 56 78.9% 68 52 76.5% 232 154 66.4%Erskine College 72 24 33.3% 26 23 88.5% 39 34 87.2% 137 81 59.1%Furman University 89 55 61.8% 47 42 89.4% 34 31 91.2% 170 128 75.3%Limestone College 53 27 50.9% 55 39 70.9% 39 29 74.4% 147 95 64.6%Morris College 6 2 33.3% 7 6 85.7% 5 4 80.0% 18 12 66.7%Newberry College 86 58 67.4% 68 60 88.2% 48 39 81.3% 202 157 77.7%North Greenville University 205 124 60.5% 187 144 77.0% 160 135 84.4% 552 403 73.0%Presbyterian College 118 56 47.5% 66 56 84.8% 60 54 90.0% 244 166 68.0%
South University1 6 6 100.0% 8 2 25.0% 1 0 0.0% 15 8 53.3%Southern Wesleyan University 43 29 67.4% 56 53 94.6% 47 43 91.5% 146 125 85.6%Voorhees College 6 4 66.7% 10 6 60.0% 4 3 75.0% 20 13 65.0%Wofford College 142 96 67.6% 114 103 90.4% 88 83 94.3% 344 282 82.0%
Subtotal
Research Institutions 323 85 26.3% 0 0 0 0 323 85 26.3%
Subtotal 323 85 26.3% 0 0 0 0 0 0 323 85 26.3%Subtotal Al l Insti tutions 14,495 6,373 44.0% 7,098 5,562 78.4% 6,693 5,617 83.9% 28,286 17,552 62.1%
STUDENTS TRANSFERRED FROM ORIGINATING INSTITUTION TO ANOTHER INSTITUTION IN THE STATE AND RETAINED THE SCHOLARSHIPResearch Institutions 77 59 38 174 Comprehensive Teaching Colleges & Univ. 198 102 33 333 Two Year Regional Campuses of U.S.C. 62 155 1 218 Technical Colleges (Associates Only) 756 285 0 1,041 Independent Senior Institutions 113 61 18 192 Independent Two Year Institutions 19 63 0 82
Subtotal 0 1,225 0 725 0 90 0 2,040Grand Total 14,495 7,598 52.4% 7,098 6,287 88.6% 6,693 5,707 85.3% 28,286 19,592 69.3%
1 For-profit, degree granting institution.
Freshmen in Fall 2015 Sophomores in Fall 2015 Juniors in Fall 2015Scholarship Retention for Freshman, Sophomores, &
Juniors
LIFE(Fall 2015)Recipients
Retained Scholarship
Same Inst(Fall 2016)
% To TotalLIFE
(Fall 2015)Recipients
Retained Scholarship
Same Inst(Fall 2016)
% To TotalLIFE
(Fall 2015)Recipients
Retained Scholarship
Same Inst(Fall 2016)
% To TotalLIFE
(Fall 2015)Recipients
Retained Scholarship
Same Inst(Fall 2016)
% To Total
RESEARCH INSTITUTIONS
2,828 1,900 67.2% 2,967 2,388 80.5% 2,955 2,479 83.9% 8,750 6,767 77.3%COMPREHENSIVE TEACHING INSTITUTIONS
575 214 37.2% 0 0 0 0 575 214 37.2%TECHNICAL COLLEGES (ASSOCIATES ONLY)
1,914 1,121 58.6% 1,528 1,229 80.4%INDEPENDENT TWO-YEAR INSTITUTIONS
1,272 1,106 86.9% 4,714 3,456 73.3%
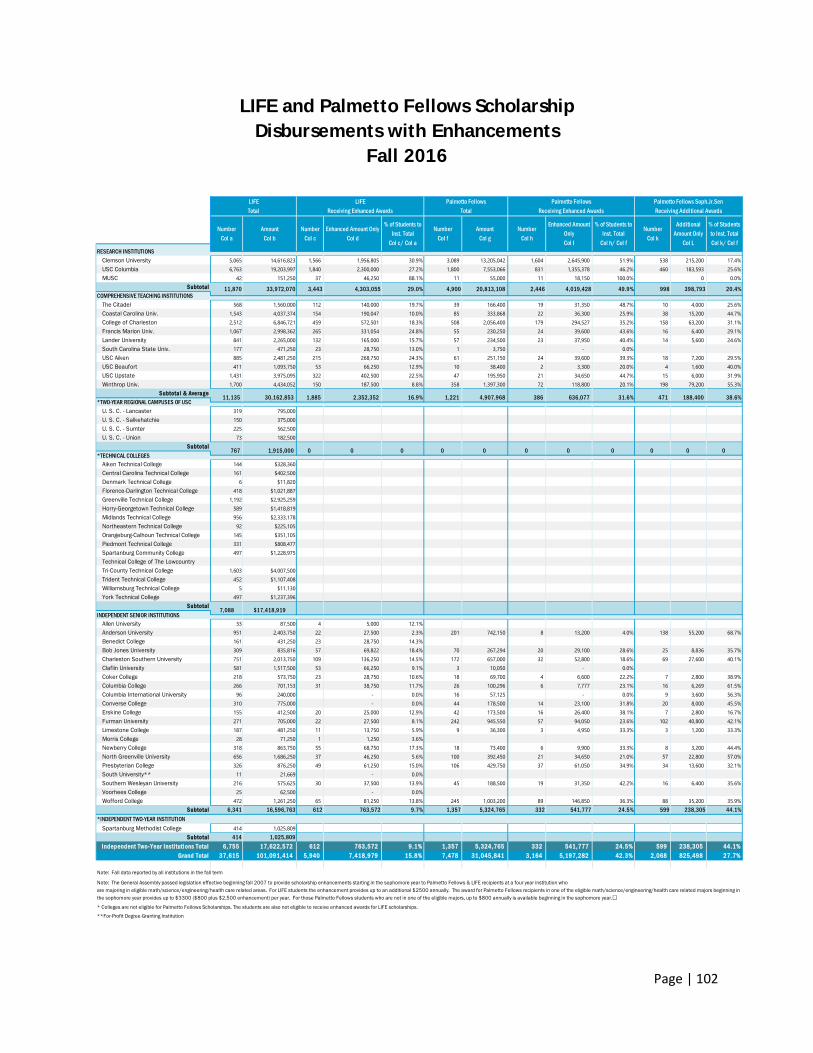
Page | 102
LIFE and Palmetto Fellows Scholarship Disbursements with Enhancements
Fall 2016
Clemson University 5,065 14,616,823 1,566 1,956,805 30.9% 3,089 13,205,042 1,604 2,645,900 51.9% 538 215,200 17.4%USC Columbia 6,763 19,203,997 1,840 2,300,000 27.2% 1,800 7,553,066 831 1,355,378 46.2% 460 183,593 25.6%MUSC 42 151,250 37 46,250 88.1% 11 55,000 11 18,150 100.0% 0 0.0%
Subtotal
The Citadel 568 1,560,000 112 140,000 19.7% 39 166,400 19 31,350 48.7% 10 4,000 25.6%Coastal Carolina Univ. 1,543 4,037,374 154 190,047 10.0% 85 333,868 22 36,300 25.9% 38 15,200 44.7%College of Charleston 2,512 6,846,721 459 572,501 18.3% 508 2,056,400 179 294,527 35.2% 158 63,200 31.1%Francis Marion Univ. 1,067 2,998,362 265 331,054 24.8% 55 230,250 24 39,600 43.6% 16 6,400 29.1%Lander University 841 2,265,000 132 165,000 15.7% 57 234,500 23 37,950 40.4% 14 5,600 24.6%South Carolina State Univ. 177 471,250 23 28,750 13.0% 1 3,750 - 0.0% USC Aiken 885 2,481,250 215 268,750 24.3% 61 251,150 24 39,600 39.3% 18 7,200 29.5%USC Beaufort 411 1,093,750 53 66,250 12.9% 10 38,400 2 3,300 20.0% 4 1,600 40.0%USC Upstate 1,431 3,975,095 322 402,500 22.5% 47 195,950 21 34,650 44.7% 15 6,000 31.9%Winthrop Univ. 1,700 4,434,052 150 187,500 8.8% 358 1,397,300 72 118,800 20.1% 198 79,200 55.3%
Subtotal & Average
U. S. C. - Lancaster 319 795,000U. S. C. - Salkehatchie 150 375,000U. S. C. - Sumter 225 562,500U. S. C. - Union 73 182,500
Subtotal
Aiken Technical College 144 $328,360Central Carolina Technical College 161 $402,500Denmark Technical College 6 $11,820Florence-Darlington Technical College 418 $1,021,887Greenville Technical College 1,192 $2,925,259Horry-Georgetown Technical College 589 $1,418,819Midlands Technical College 956 $2,333,178Northeastern Technical College 92 $225,105Orangeburg-Calhoun Technical College 145 $351,105Piedmont Technical College 331 $808,477Spartanburg Community College 497 $1,228,975Technical College of The LowcountryTri-County Technical College 1,603 $4,007,500Trident Technical College 452 $1,107,408Williamsburg Technical College 5 $11,130York Technical College 497 $1,237,396
Subtotal
Allen University 33 87,500 4 5,000 12.1% Anderson University 951 2,403,750 22 27,500 2.3% 201 742,150 8 13,200 4.0% 138 55,200 68.7%Benedict College 161 431,250 23 28,750 14.3% Bob Jones University 309 835,816 57 69,822 18.4% 70 267,294 20 29,100 28.6% 25 8,836 35.7%Charleston Southern University 751 2,013,750 109 136,250 14.5% 172 657,000 32 52,800 18.6% 69 27,600 40.1%Claflin University 581 1,517,500 53 66,250 9.1% 3 10,050 - 0.0% Coker College 218 573,750 23 28,750 10.6% 18 69,700 4 6,600 22.2% 7 2,800 38.9%Columbia College 266 701,153 31 38,750 11.7% 26 100,296 6 7,777 23.1% 16 6,269 61.5%Columbia International University 96 240,000 - 0.0% 16 57,125 - 0.0% 9 3,600 56.3%Converse College 310 775,000 - 0.0% 44 178,500 14 23,100 31.8% 20 8,000 45.5%Erskine College 155 412,500 20 25,000 12.9% 42 173,500 16 26,400 38.1% 7 2,800 16.7%Furman University 271 705,000 22 27,500 8.1% 242 945,550 57 94,050 23.6% 102 40,800 42.1%Limestone College 187 481,250 11 13,750 5.9% 9 36,300 3 4,950 33.3% 3 1,200 33.3%Morris College 28 71,250 1 1,250 3.6% Newberry College 318 863,750 55 68,750 17.3% 18 73,400 6 9,900 33.3% 8 3,200 44.4%North Greenville University 656 1,686,250 37 46,250 5.6% 100 392,450 21 34,650 21.0% 57 22,800 57.0%Presbyterian College 326 876,250 49 61,250 15.0% 106 429,750 37 61,050 34.9% 34 13,600 32.1%South University** 11 21,669 - 0.0% Southern Wesleyan University 216 575,625 30 37,500 13.9% 45 188,500 19 31,350 42.2% 16 6,400 35.6%Voorhees College 25 62,500 - 0.0% Wofford College 472 1,261,250 65 81,250 13.8% 245 1,003,200 89 146,850 36.3% 88 35,200 35.9%
Subtotal 6,341 16,596,763 612 763,572 9.7% 1,357 5,324,765 332 541,777 24.5% 599 238,305 44.1%*INDEPENDENT TWO-YEAR INSTITUTION
Spartanburg Methodist College 414 1,025,809Subtotal 414 1,025,809
Independent Two-Year Insti tutions Total 6,755 17,622,572 612 763,572 9.1% 1,357 5,324,765 332 541,777 24.5% 599 238,305 44.1%Grand Total 37,615 101,091,414 5,940 7,418,979 15.8% 7,478 31,045,841 3,164 5,197,282 42.3% 2,068 825,498 27.7%
Note: Fall data reported by all institutions in the fall term
* Colleges are not eligible for Palmetto Fellows Scholarships. The students are also not eligible to receive enhanced awards for LIFE scholarships.
**For-Profit Degree-Granting Institution
0 0
INDEPENDENT SENIOR INSTITUTIONS7,088 $17,418,919
Note: The General Assembly passed legislation effective beginning fall 2007 to provide scholarship enhancements starting in the sophomore year to Palmetto Fellows & LIFE recipients at a four year institution whoare majoring in eligible math/science/engineering/health care related areas. For LIFE students the enhancement provides up to an additional $2500 annually. The award for Palmetto Fellows recipients in one of the eligible math/science/engineering/health care related majors beginning in the sophomore year provides up to $3300 ($800 plus $2,500 enhancement) per year. For those Palmetto Fellows students who are not in one of the eligible majors, up to $800 annually is available beginning in the sophomore year.
0
998
38.6%
0 00
188,400 471 31.6%
0 0
*TWO-YEAR REGIONAL CAMPUSES OF USC
0 0 0
30,162,853 1,885 2,352,352 1,221
*TECHNICAL COLLEGES767 1,915,000
COMPREHENSIVE TEACHING INSTITUTIONS
11,135
LIFETotal
398,793
Number Col h
AmountCol g
LIFE Receiving Enhanced Awards
11,870 3,443
AmountCol b
Number Col c
33,972,070 4,303,055 29.0%
Enhanced Amount OnlyCol d
386 4,907,968 636,077 16.9%
RESEARCH INSTITUTIONS
Palmetto FellowsReceiving Enhanced Awards
2,44620,813,108 49.9%
NumberCol f
Number Col a
Enhanced Amount OnlyCol I
4,900
% of Students to Inst. Total
Col c/ Col a
% of Students to Inst. Total
Col h/ Col f
4,019,428
Palmetto FellowsTotal
Palmetto Fellows Soph.Jr.SenReceiving Additional Awards
Number Col k
Additional Amount Only
Col L
20.4%
% of Students to Inst. TotalCol k/ Col f
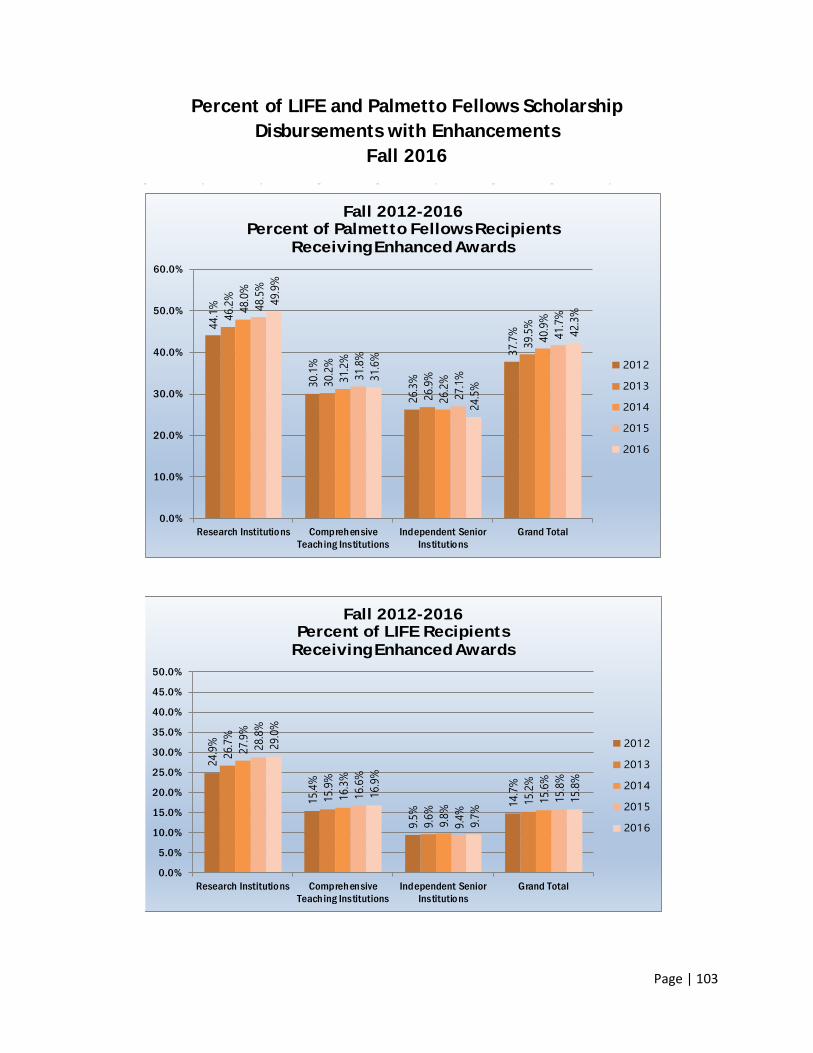
Page | 103
Percent of LIFE and Palmetto Fellows Scholarship Disbursements with Enhancements
Fall 2016
24.9%
15.4%
9.5% 14
.7%
26.7%
15.9%
9.6%
15.2%
27.9%
16.3%
9.8%
15.6%
28.8%
16.6%
9.4%
15.8%
29.0%
16.9%
9.7%
15.8%
0.0%
5.0%
10.0%
15.0%
20.0%
25.0%
30.0%
35.0%
40.0%
45.0%
50.0%
Research Institutions ComprehensiveTeaching Institutions
Independent SeniorInstitutions
Grand Total
Fall 2012-2016Percent of LIFE Recipients
Receiving Enhanced Awards
2012
2013
2014
2015
2016
44.1%
30.1%
26.3%
37.7%
46.2%
30.2%
26.9%
39.5%
48.0%
31.2%
26.2%
40.9%
48.5%
31.8%
27.1%
41.7%
49.9%
31.6%
24.5%
42.3%
0.0%
10.0%
20.0%
30.0%
40.0%
50.0%
60.0%
Research Institutions ComprehensiveTeaching Institutions
Independent SeniorInstitutions
Grand Total
Fall 2012-2016Percent of Palmetto Fellows Recipients
Receiving Enhanced Awards
2012
2013
2014
2015
2016
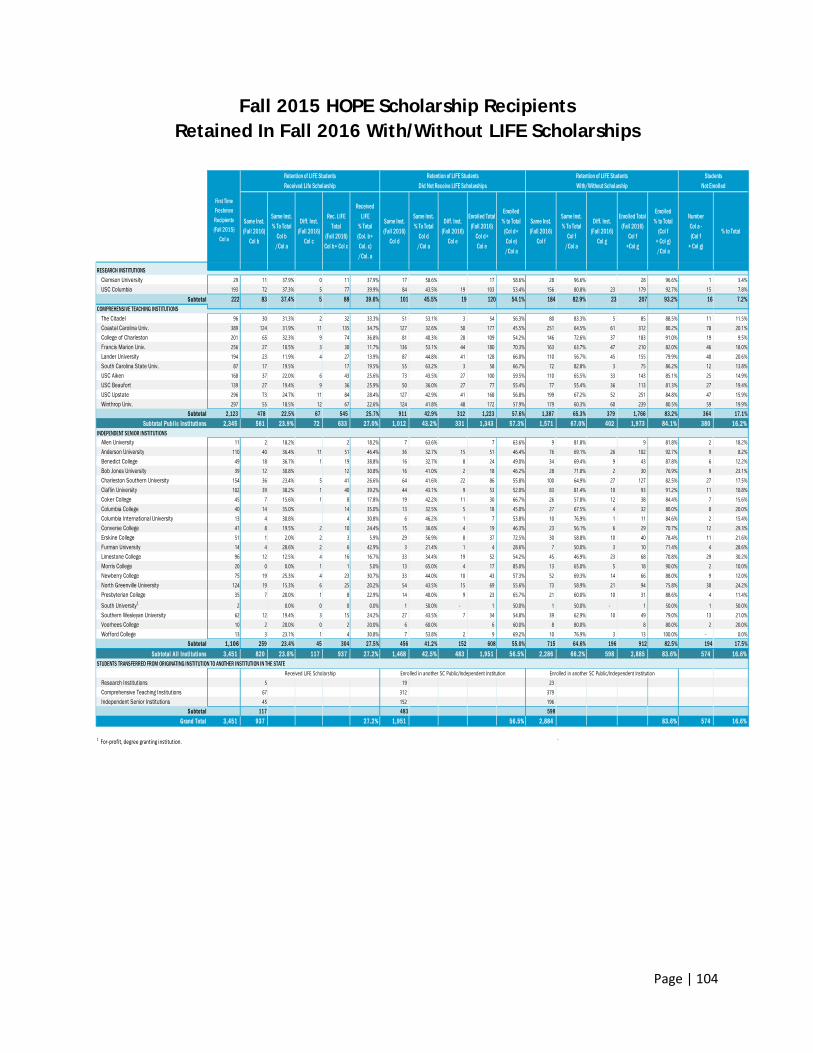
Page | 104
Fall 2015 HOPE Scholarship Recipients Retained In Fall 2016 With/Without LIFE Scholarships
Clemson University 29 11 37.9% 0 11 37.9% 17 58.6% 17 58.6% 28 96.6% 28 96.6% 1 3.4%USC Columbia 193 72 37.3% 5 77 39.9% 84 43.5% 19 103 53.4% 156 80.8% 23 179 92.7% 15 7.8%
Subtotal 222 83 37.4% 5 88 39.6% 101 45.5% 19 120 54.1% 184 82.9% 23 207 93.2% 16 7.2%
The Citadel 96 30 31.3% 2 32 33.3% 51 53.1% 3 54 56.3% 80 83.3% 5 85 88.5% 11 11.5%Coastal Carolina Univ. 389 124 31.9% 11 135 34.7% 127 32.6% 50 177 45.5% 251 64.5% 61 312 80.2% 78 20.1%College of Charleston 201 65 32.3% 9 74 36.8% 81 40.3% 28 109 54.2% 146 72.6% 37 183 91.0% 19 9.5%Francis Marion Univ. 256 27 10.5% 3 30 11.7% 136 53.1% 44 180 70.3% 163 63.7% 47 210 82.0% 46 18.0%Lander University 194 23 11.9% 4 27 13.9% 87 44.8% 41 128 66.0% 110 56.7% 45 155 79.9% 40 20.6%South Carolina State Univ. 87 17 19.5% 17 19.5% 55 63.2% 3 58 66.7% 72 82.8% 3 75 86.2% 12 13.8%USC Aiken 168 37 22.0% 6 43 25.6% 73 43.5% 27 100 59.5% 110 65.5% 33 143 85.1% 25 14.9%USC Beaufort 139 27 19.4% 9 36 25.9% 50 36.0% 27 77 55.4% 77 55.4% 36 113 81.3% 27 19.4%USC Upstate 296 73 24.7% 11 84 28.4% 127 42.9% 41 168 56.8% 199 67.2% 52 251 84.8% 47 15.9%Winthrop Univ. 297 55 18.5% 12 67 22.6% 124 41.8% 48 172 57.9% 179 60.3% 60 239 80.5% 59 19.9%
Subtotal 2,123 478 22.5% 67 545 25.7% 911 42.9% 312 1,223 57.6% 1,387 65.3% 379 1,766 83.2% 364 17.1%Subtotal Publ ic Insti tutions 2,345 561 23.9% 72 633 27.0% 1,012 43.2% 331 1,343 57.3% 1,571 67.0% 402 1,973 84.1% 380 16.2%
INDEPENDENT SENIOR INSTITUTIONSAllen University 11 2 18.2% 2 18.2% 7 63.6% 7 63.6% 9 81.8% 9 81.8% 2 18.2%Anderson University 110 40 36.4% 11 51 46.4% 36 32.7% 15 51 46.4% 76 69.1% 26 102 92.7% 9 8.2%Benedict College 49 18 36.7% 1 19 38.8% 16 32.7% 8 24 49.0% 34 69.4% 9 43 87.8% 6 12.2%Bob Jones University 39 12 30.8% 12 30.8% 16 41.0% 2 18 46.2% 28 71.8% 2 30 76.9% 9 23.1%Charleston Southern University 154 36 23.4% 5 41 26.6% 64 41.6% 22 86 55.8% 100 64.9% 27 127 82.5% 27 17.5%Claflin University 102 39 38.2% 1 40 39.2% 44 43.1% 9 53 52.0% 83 81.4% 10 93 91.2% 11 10.8%Coker College 45 7 15.6% 1 8 17.8% 19 42.2% 11 30 66.7% 26 57.8% 12 38 84.4% 7 15.6%Columbia College 40 14 35.0% 14 35.0% 13 32.5% 5 18 45.0% 27 67.5% 4 32 80.0% 8 20.0%Columbia International University 13 4 30.8% 4 30.8% 6 46.2% 1 7 53.8% 10 76.9% 1 11 84.6% 2 15.4%Converse College 41 8 19.5% 2 10 24.4% 15 36.6% 4 19 46.3% 23 56.1% 6 29 70.7% 12 29.3%Erskine College 51 1 2.0% 2 3 5.9% 29 56.9% 8 37 72.5% 30 58.8% 10 40 78.4% 11 21.6%Furman University 14 4 28.6% 2 6 42.9% 3 21.4% 1 4 28.6% 7 50.0% 3 10 71.4% 4 28.6%Limestone College 96 12 12.5% 4 16 16.7% 33 34.4% 19 52 54.2% 45 46.9% 23 68 70.8% 29 30.2%Morris College 20 0 0.0% 1 1 5.0% 13 65.0% 4 17 85.0% 13 65.0% 5 18 90.0% 2 10.0%Newberry College 75 19 25.3% 4 23 30.7% 33 44.0% 10 43 57.3% 52 69.3% 14 66 88.0% 9 12.0%North Greenville University 124 19 15.3% 6 25 20.2% 54 43.5% 15 69 55.6% 73 58.9% 21 94 75.8% 30 24.2%Presbyterian College 35 7 20.0% 1 8 22.9% 14 40.0% 9 23 65.7% 21 60.0% 10 31 88.6% 4 11.4%
South University1 2 0.0% 0 0 0.0% 1 50.0% - 1 50.0% 1 50.0% - 1 50.0% 1 50.0%Southern Wesleyan University 62 12 19.4% 3 15 24.2% 27 43.5% 7 34 54.8% 39 62.9% 10 49 79.0% 13 21.0%Voorhees College 10 2 20.0% 0 2 20.0% 6 60.0% 6 60.0% 8 80.0% 8 80.0% 2 20.0%Wofford College 13 3 23.1% 1 4 30.8% 7 53.8% 2 9 69.2% 10 76.9% 3 13 100.0% - 0.0%
Subtotal 1, 106 259 23.4% 45 304 27.5% 456 41.2% 152 608 55.0% 715 64.6% 196 912 82.5% 194 17.5%Subtotal Al l Insti tutions 3,451 820 23.8% 117 937 27.2% 1,468 42.5% 483 1,951 56.5% 2,286 66.2% 598 2,885 83.6% 574 16.6%
Research Institutions 5 19 23 Comprehensive Teaching Institutions 67 312 379 Independent Senior Institutions 45 152 196
Subtotal 117 483 598Grand Total 3,451 937 27.2% 1,951 56.5% 2,884 83.6% 574 16.6%
1 For-profit, degree granting institution. `
Received LIFE Scholarship Enrolled in another SC Public/Independent Institution Enrolled in another SC Public/Independent Institution
Same Inst. (Fall 2016)
Col d
Same Inst. (Fall 2016)
Col f
STUDENTS TRANSFERRED FROM ORIGINATING INSTITUTION TO ANOTHER INSTITUTION IN THE STATE
Retention of LIFE StudentsDid Not Receive LIFE Scholarships
COMPREHENSIVE TEACHING INSTITUTIONS
First Time FreshmenRecipients (Fall 2015)
Col a
Retention of LIFE StudentsReceived Life Scholarship
Same Inst.% To Total
Col b/Col a
ReceivedLIFE
% Total(Col. b+Col. c)/Col. a
Diff. Inst.(Fall 2016)
Col c
Rec. LIFE Total
(Fall 2016)Col b+ Col c
Diff. Inst.(Fall 2016)
Col e
Enrolled Total(Fall 2016)
Col d+ Col e
Same Inst.% To Total
Col d/Col a
Enrolled % to Total
(Col d+Col e)/Col a
Enrolled % to Total
(Col f+ Col g)/Col a
NumberCol a - (Col f
+ Col g)
% to Total
RESEARCH INSTITUTIONS
Retention of LIFE Students With/Without Scholarship
StudentsNot Enrolled
Same Inst. (Fall 2016)
Col b
Diff. Inst.(Fall 2016)
Col g
Enrolled Total(Fall 2016)
Col f+Col g
Same Inst.% To Total
Col f/Col a
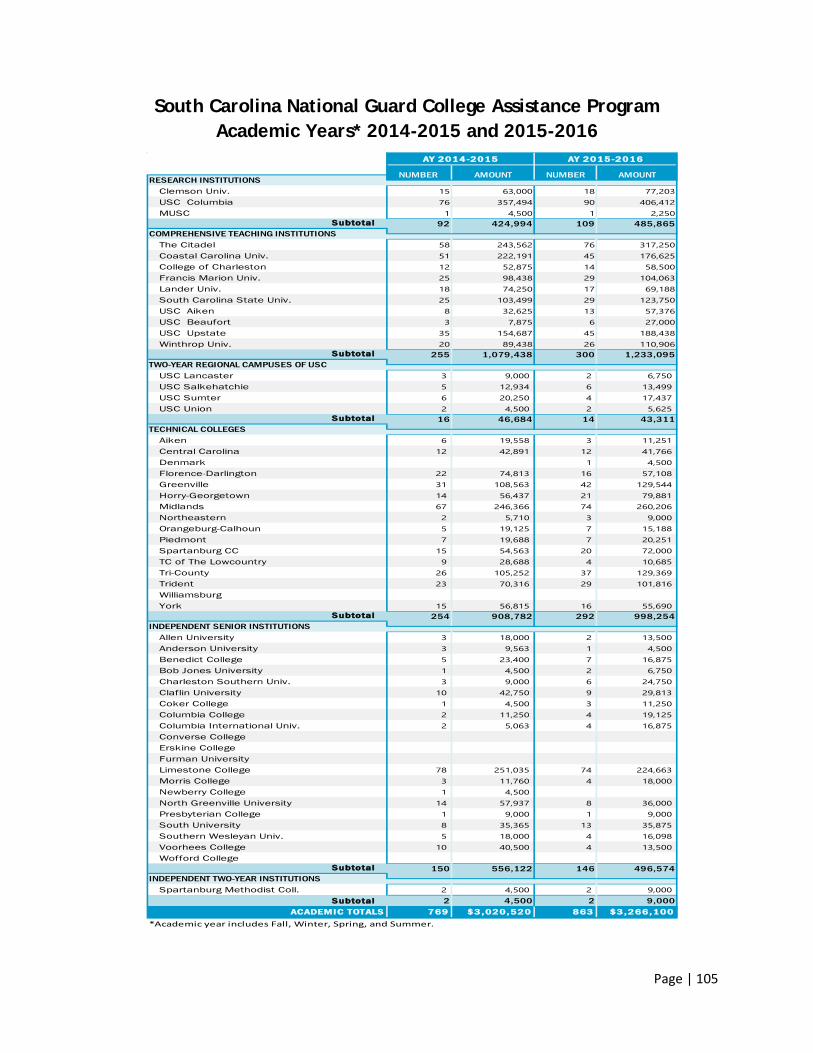
Page | 105
South Carolina National Guard College Assistance Program Academic Years* 2014-2015 and 2015-2016
Clemson Univ. 15 63,000 18 77,203USC Columbia 76 357,494 90 406,412MUSC 1 4,500 1 2,250
Subtotal 92 424,994 109 485,865
The Citadel 58 243,562 76 317,250Coastal Carolina Univ. 51 222,191 45 176,625College of Charleston 12 52,875 14 58,500Francis Marion Univ. 25 98,438 29 104,063Lander Univ. 18 74,250 17 69,188South Carolina State Univ. 25 103,499 29 123,750USC Aiken 8 32,625 13 57,376USC Beaufort 3 7,875 6 27,000USC Upstate 35 154,687 45 188,438Winthrop Univ. 20 89,438 26 110,906
Subtotal 255 1,079,438 300 1,233,095
USC Lancaster 3 9,000 2 6,750 USC Salkehatchie 5 12,934 6 13,499 USC Sumter 6 20,250 4 17,437 USC Union 2 4,500 2 5,625
Subtotal 16 46,684 14 43,311
Aiken 6 19,558 3 11,251 Central Carolina 12 42,891 12 41,766 Denmark 1 4,500 Florence-Darlington 22 74,813 16 57,108 Greenville 31 108,563 42 129,544 Horry-Georgetown 14 56,437 21 79,881 Midlands 67 246,366 74 260,206 Northeastern 2 5,710 3 9,000 Orangeburg-Calhoun 5 19,125 7 15,188 Piedmont 7 19,688 7 20,251 Spartanburg CC 15 54,563 20 72,000 TC of The Lowcountry 9 28,688 4 10,685 Tri-County 26 105,252 37 129,369 Trident 23 70,316 29 101,816 Williamsburg York 15 56,815 16 55,690
Subtotal 254 908,782 292 998,254
Allen University 3 18,000 2 13,500 Anderson University 3 9,563 1 4,500 Benedict College 5 23,400 7 16,875 Bob Jones University 1 4,500 2 6,750 Charleston Southern Univ. 3 9,000 6 24,750 Claflin University 10 42,750 9 29,813 Coker College 1 4,500 3 11,250 Columbia College 2 11,250 4 19,125 Columbia International Univ. 2 5,063 4 16,875 Converse CollegeErskine CollegeFurman UniversityLimestone College 78 251,035 74 224,663 Morris College 3 11,760 4 18,000 Newberry College 1 4,500 North Greenville University 14 57,937 8 36,000 Presbyterian College 1 9,000 1 9,000 South University 8 35,365 13 35,875 Southern Wesleyan Univ. 5 18,000 4 16,098 Voorhees College 10 40,500 4 13,500 Wofford College
Subtotal 150 556,122 146 496,574
Spartanburg Methodist Coll. 2 4,500 2 9,000 Subtotal 2 4,500 2 9,000
ACADEMI C TOTALS 769 $3, 020, 520 863 $3, 266, 100*Academic year includes Fall, Winter, Spring, and Summer.
AY 2015-2016AY 2014-2015
RESEARCH INSTITUTIONSNUMBER AMOUNT NUMBER AMOUNT
COMPREHENSIVE TEACHING INSTITUTIONS
TWO-YEAR REGIONAL CAMPUSES OF USC
TECHNICAL COLLEGES
INDEPENDENT SENIOR INSTITUTIONS
INDEPENDENT TWO-YEAR INSTITUTIONS
Page | 106
Intentionally Blank
Page | 107
Tuition and Required Fees
For the purposes of the data in this section, the Integrated Postsecondary Education Data System (IPEDS) definition of “tuition and required fees” is used. IPEDS defines the term as: “Tuition is an amount of money charged to students for instructional services. Required fees are fixed sums charged to students for items not covered by tuition and required of such a large percentage of students that the student who does not pay the charge is an exception.” It is important to note that institutions may assess special user fees. For example, students may be assessed a fee for enrolling in a particular course or academic program.
Institutions use these revenues to support their missions in the areas of: instruction, research, public service, libraries, student services, physical plant (facilities) operation and maintenance, and administration. State funds are also provided to support the portion of these costs associated with the education of in-state students.
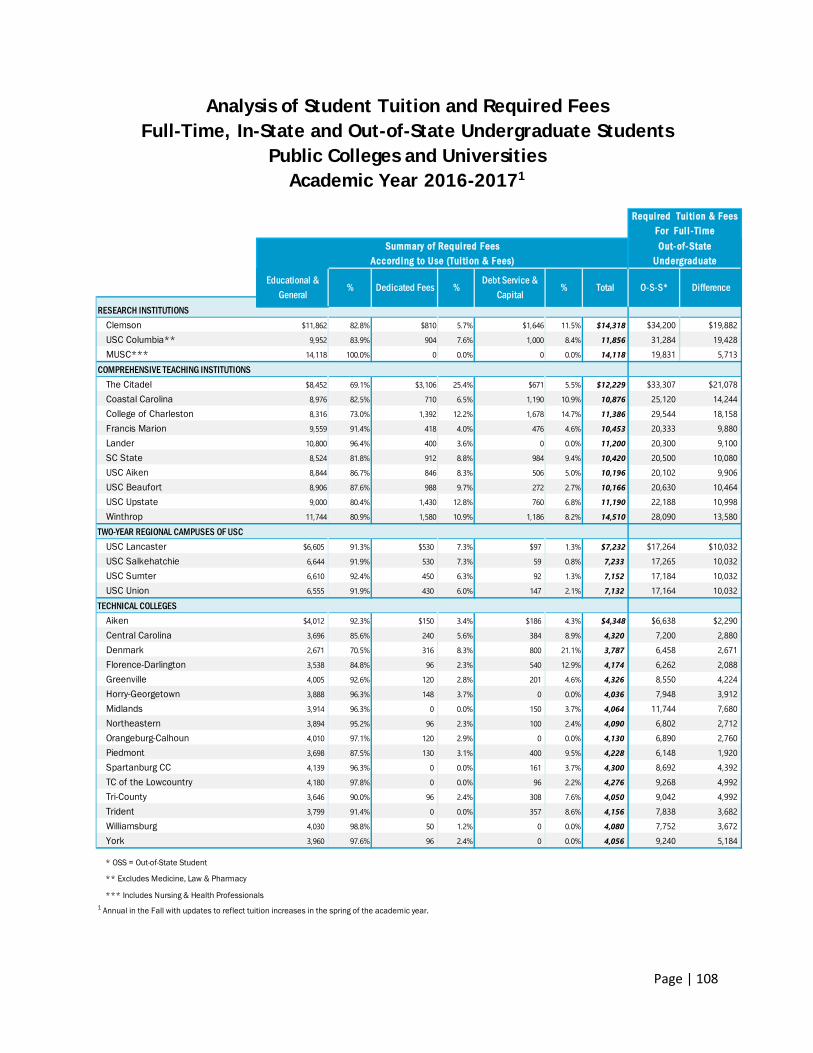
Page | 108
Analysis of Student Tuition and Required Fees Full-Time, In-State and Out-of-State Undergraduate Students
Public Colleges and Universities Academic Year 2016-20171
Required Tui tion & FeesFor Ful l -TimeOut-of-State
Undergraduate
Clemson $11,862 82.8% $810 5.7% $1,646 11.5% $14,318 $34,200 $19,882USC Columbia** 9,952 83.9% 904 7.6% 1,000 8.4% 11,856 31,284 19,428MUSC*** 14,118 100.0% 0 0.0% 0 0.0% 14,118 19,831 5,713
COMPREHENSIVE TEACHING INSTITUTIONSThe Citadel $8,452 69.1% $3,106 25.4% $671 5.5% $12,229 $33,307 $21,078Coastal Carolina 8,976 82.5% 710 6.5% 1,190 10.9% 10,876 25,120 14,244College of Charleston 8,316 73.0% 1,392 12.2% 1,678 14.7% 11,386 29,544 18,158Francis Marion 9,559 91.4% 418 4.0% 476 4.6% 10,453 20,333 9,880Lander 10,800 96.4% 400 3.6% 0 0.0% 11,200 20,300 9,100SC State 8,524 81.8% 912 8.8% 984 9.4% 10,420 20,500 10,080USC Aiken 8,844 86.7% 846 8.3% 506 5.0% 10,196 20,102 9,906USC Beaufort 8,906 87.6% 988 9.7% 272 2.7% 10,166 20,630 10,464 USC Upstate 9,000 80.4% 1,430 12.8% 760 6.8% 11,190 22,188 10,998Winthrop 11,744 80.9% 1,580 10.9% 1,186 8.2% 14,510 28,090 13,580
TWO-YEAR REGIONAL CAMPUSES OF USCUSC Lancaster $6,605 91.3% $530 7.3% $97 1.3% $7,232 $17,264 $10,032USC Salkehatchie 6,644 91.9% 530 7.3% 59 0.8% 7,233 17,265 10,032USC Sumter 6,610 92.4% 450 6.3% 92 1.3% 7,152 17,184 10,032USC Union 6,555 91.9% 430 6.0% 147 2.1% 7,132 17,164 10,032
TECHNICAL COLLEGESAiken $4,012 92.3% $150 3.4% $186 4.3% $4,348 $6,638 $2,290Central Carolina 3,696 85.6% 240 5.6% 384 8.9% 4,320 7,200 2,880Denmark 2,671 70.5% 316 8.3% 800 21.1% 3,787 6,458 2,671Florence-Darlington 3,538 84.8% 96 2.3% 540 12.9% 4,174 6,262 2,088Greenville 4,005 92.6% 120 2.8% 201 4.6% 4,326 8,550 4,224Horry-Georgetown 3,888 96.3% 148 3.7% 0 0.0% 4,036 7,948 3,912Midlands 3,914 96.3% 0 0.0% 150 3.7% 4,064 11,744 7,680Northeastern 3,894 95.2% 96 2.3% 100 2.4% 4,090 6,802 2,712Orangeburg-Calhoun 4,010 97.1% 120 2.9% 0 0.0% 4,130 6,890 2,760Piedmont 3,698 87.5% 130 3.1% 400 9.5% 4,228 6,148 1,920Spartanburg CC 4,139 96.3% 0 0.0% 161 3.7% 4,300 8,692 4,392TC of the Lowcountry 4,180 97.8% 0 0.0% 96 2.2% 4,276 9,268 4,992Tri-County 3,646 90.0% 96 2.4% 308 7.6% 4,050 9,042 4,992Trident 3,799 91.4% 0 0.0% 357 8.6% 4,156 7,838 3,682Williamsburg 4,030 98.8% 50 1.2% 0 0.0% 4,080 7,752 3,672York 3,960 97.6% 96 2.4% 0 0.0% 4,056 9,240 5,184
* OSS = Out-of-State Student
** Excludes Medicine, Law & Pharmacy
*** Includes Nursing & Health Professionals1 Annual in the Fall with updates to reflect tuition increases in the spring of the academic year.
Educational &General
% Dedicated Fees %Debt Service &
Capital% Total
Summary of Required FeesAccording to Use (Tui tion & Fees)
RESEARCH INSTITUTIONS
O-S-S* Difference
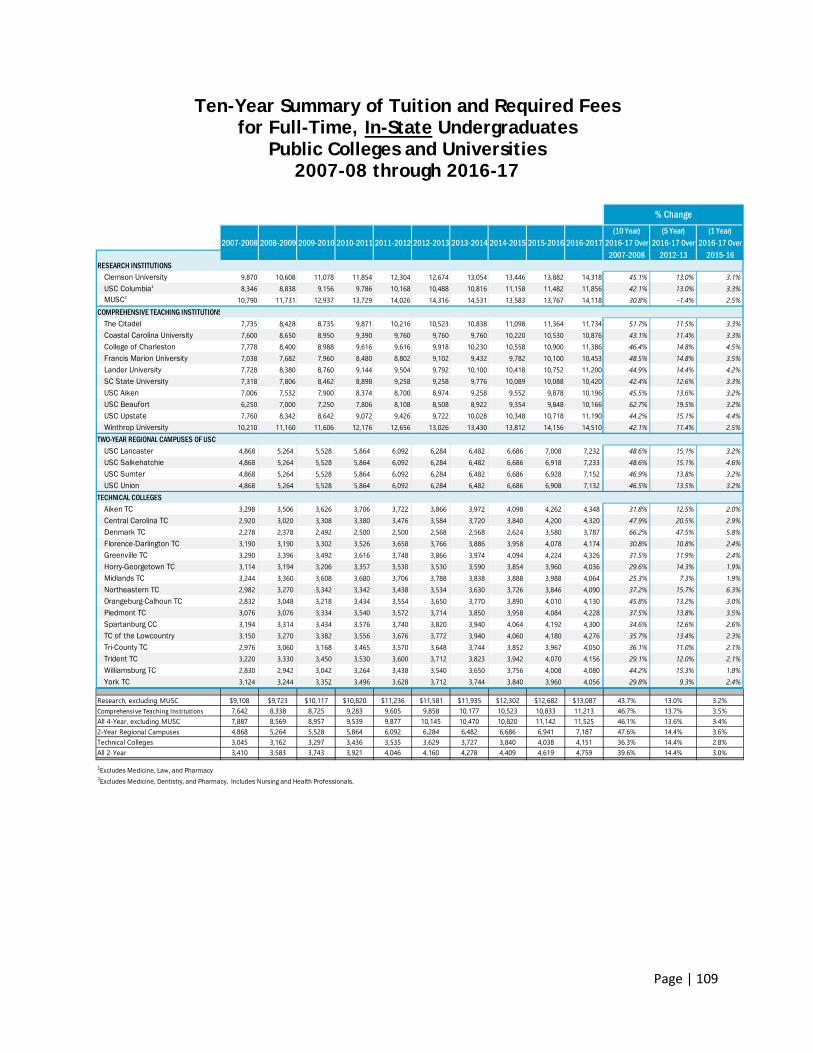
Page | 109
Ten-Year Summary of Tuition and Required Fees for Full-Time, In-State Undergraduates
Public Colleges and Universities 2007-08 through 2016-17
Clemson University 9,870 10,608 11,078 11,854 12,304 12,674 13,054 13,446 13,882 14,318 45.1% 13.0% 3.1%USC Columbia1 8,346 8,838 9,156 9,786 10,168 10,488 10,816 11,158 11,482 11,856 42.1% 13.0% 3.3%MUSC2 10,790 11,731 12,937 13,729 14,026 14,316 14,531 13,583 13,767 14,118 30.8% -1.4% 2.5%
COMPREHENSIVE TEACHING INSTITUTIONSThe Citadel 7,735 8,428 8,735 9,871 10,216 10,523 10,838 11,098 11,364 11,734 51.7% 11.5% 3.3%Coastal Carolina University 7,600 8,650 8,950 9,390 9,760 9,760 9,760 10,220 10,530 10,876 43.1% 11.4% 3.3%College of Charleston 7,778 8,400 8,988 9,616 9,616 9,918 10,230 10,558 10,900 11,386 46.4% 14.8% 4.5%Francis Marion University 7,038 7,682 7,960 8,480 8,802 9,102 9,432 9,782 10,100 10,453 48.5% 14.8% 3.5%Lander University 7,728 8,380 8,760 9,144 9,504 9,792 10,100 10,418 10,752 11,200 44.9% 14.4% 4.2%SC State University 7,318 7,806 8,462 8,898 9,258 9,258 9,776 10,089 10,088 10,420 42.4% 12.6% 3.3%USC Aiken 7,006 7,532 7,900 8,374 8,700 8,974 9,258 9,552 9,878 10,196 45.5% 13.6% 3.2%USC Beaufort 6,250 7,000 7,250 7,806 8,108 8,508 8,922 9,354 9,848 10,166 62.7% 19.5% 3.2%USC Upstate 7,760 8,342 8,642 9,072 9,426 9,722 10,028 10,348 10,718 11,190 44.2% 15.1% 4.4%Winthrop University 10,210 11,160 11,606 12,176 12,656 13,026 13,430 13,812 14,156 14,510 42.1% 11.4% 2.5%
TWO-YEAR REGIONAL CAMPUSES OF USCUSC Lancaster 4,868 5,264 5,528 5,864 6,092 6,284 6,482 6,686 7,008 7,232 48.6% 15.1% 3.2%USC Salkehatchie 4,868 5,264 5,528 5,864 6,092 6,284 6,482 6,686 6,918 7,233 48.6% 15.1% 4.6%USC Sumter 4,868 5,264 5,528 5,864 6,092 6,284 6,482 6,686 6,928 7,152 46.9% 13.8% 3.2%USC Union 4,868 5,264 5,528 5,864 6,092 6,284 6,482 6,686 6,908 7,132 46.5% 13.5% 3.2%
TECHNICAL COLLEGESAiken TC 3,298 3,506 3,626 3,706 3,722 3,866 3,972 4,098 4,262 4,348 31.8% 12.5% 2.0%Central Carolina TC 2,920 3,020 3,308 3,380 3,476 3,584 3,720 3,840 4,200 4,320 47.9% 20.5% 2.9%Denmark TC 2,278 2,378 2,492 2,500 2,500 2,568 2,568 2,624 3,580 3,787 66.2% 47.5% 5.8%Florence-Darlington TC 3,190 3,190 3,302 3,526 3,658 3,766 3,886 3,958 4,078 4,174 30.8% 10.8% 2.4%Greenville TC 3,290 3,396 3,492 3,616 3,748 3,866 3,974 4,094 4,224 4,326 31.5% 11.9% 2.4%Horry-Georgetown TC 3,114 3,194 3,206 3,357 3,530 3,530 3,590 3,854 3,960 4,036 29.6% 14.3% 1.9%Midlands TC 3,244 3,360 3,608 3,680 3,706 3,788 3,838 3,888 3,988 4,064 25.3% 7.3% 1.9%Northeastern TC 2,982 3,270 3,342 3,342 3,438 3,534 3,630 3,726 3,846 4,090 37.2% 15.7% 6.3%Orangeburg-Calhoun TC 2,832 3,048 3,218 3,434 3,554 3,650 3,770 3,890 4,010 4,130 45.8% 13.2% 3.0%Piedmont TC 3,076 3,076 3,334 3,540 3,572 3,714 3,850 3,958 4,084 4,228 37.5% 13.8% 3.5%Spartanburg CC 3,194 3,314 3,434 3,576 3,740 3,820 3,940 4,064 4,192 4,300 34.6% 12.6% 2.6%TC of the Lowcountry 3,150 3,270 3,382 3,556 3,676 3,772 3,940 4,060 4,180 4,276 35.7% 13.4% 2.3%Tri-County TC 2,976 3,060 3,168 3,465 3,570 3,648 3,744 3,852 3,967 4,050 36.1% 11.0% 2.1%Trident TC 3,220 3,330 3,450 3,530 3,600 3,712 3,823 3,942 4,070 4,156 29.1% 12.0% 2.1%Williamsburg TC 2,830 2,942 3,042 3,264 3,438 3,540 3,650 3,756 4,008 4,080 44.2% 15.3% 1.8%York TC 3,124 3,244 3,352 3,496 3,628 3,712 3,744 3,840 3,960 4,056 29.8% 9.3% 2.4%
Research, excluding MUSC $9,108 $9,723 $10,117 $10,820 $11,236 $11,581 $11,935 $12,302 $12,682 $13,087 43.7% 13.0% 3.2%Comprehensive Teaching Institutions 7,642 8,338 8,725 9,283 9,605 9,858 10,177 10,523 10,833 11,213 46.7% 13.7% 3.5%All 4-Year, excluding MUSC 7,887 8,569 8,957 9,539 9,877 10,145 10,470 10,820 11,142 11,525 46.1% 13.6% 3.4%2-Year Regional Campuses 4,868 5,264 5,528 5,864 6,092 6,284 6,482 6,686 6,941 7,187 47.6% 14.4% 3.6%Technical Colleges 3,045 3,162 3,297 3,436 3,535 3,629 3,727 3,840 4,038 4,151 36.3% 14.4% 2.8%All 2-Year 3,410 3,583 3,743 3,921 4,046 4,160 4,278 4,409 4,619 4,759 39.6% 14.4% 3.0%
1Excludes Medicine, Law, and Pharmacy2Excludes Medicine, Dentistry, and Pharmacy. Includes Nursing and Health Professionals.
% Change
RESEARCH INSTITUTIONS
2007-2008 2008-2009 2009-2010 2010-2011(5 Year)
2016-17 Over2012-13
(1 Year)2016-17 Over
2015-162012-2013 2013-2014 2014-2015 2015-2016 2016-20172011-2012
(10 Year)2016-17 Over
2007-2008
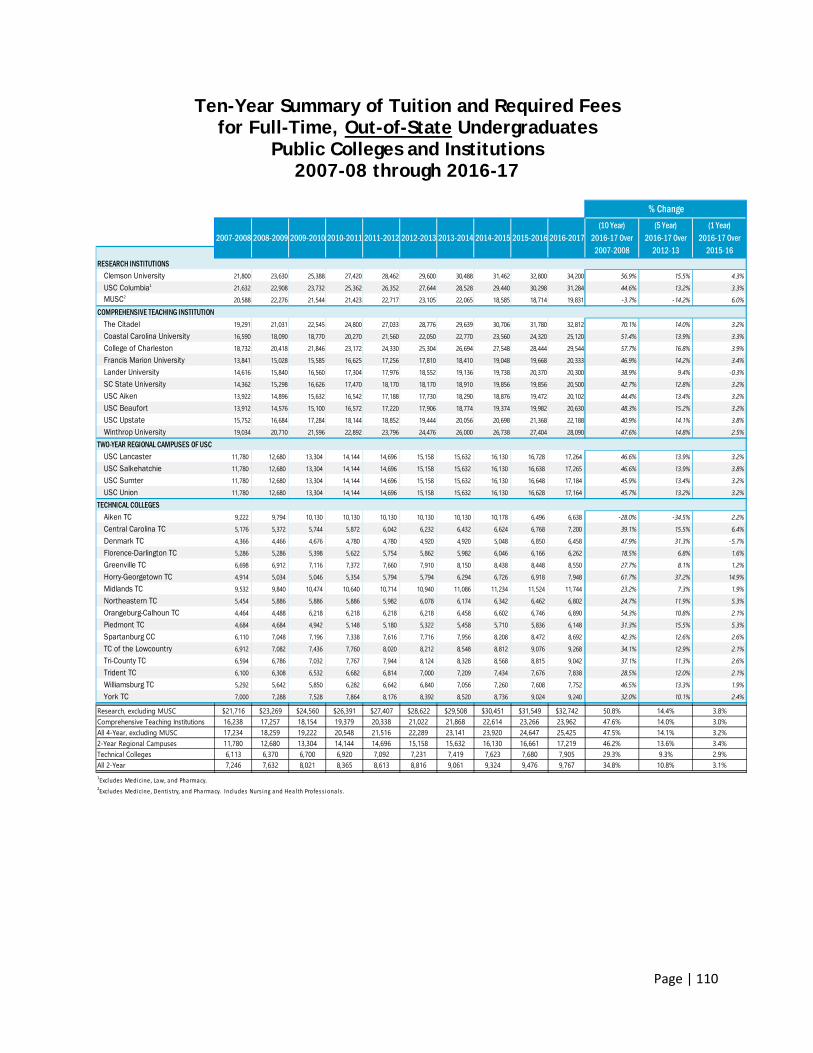
Page | 110
Ten-Year Summary of Tuition and Required Fees for Full-Time, Out-of-State Undergraduates
Public Colleges and Institutions 2007-08 through 2016-17
Clemson University 21,800 23,630 25,388 27,420 28,462 29,600 30,488 31,462 32,800 34,200 56.9% 15.5% 4.3%
USC Columbia1 21,632 22,908 23,732 25,362 26,352 27,644 28,528 29,440 30,298 31,284 44.6% 13.2% 3.3%MUSC2 20,588 22,276 21,544 21,423 22,717 23,105 22,065 18,585 18,714 19,831 -3.7% -14.2% 6.0%
COMPREHENSIVE TEACHING INSTITUTIONSThe Citadel 19,291 21,031 22,545 24,800 27,033 28,776 29,639 30,706 31,780 32,812 70.1% 14.0% 3.2%
Coastal Carolina University 16,590 18,090 18,770 20,270 21,560 22,050 22,770 23,560 24,320 25,120 51.4% 13.9% 3.3%
College of Charleston 18,732 20,418 21,846 23,172 24,330 25,304 26,694 27,548 28,444 29,544 57.7% 16.8% 3.9%Francis Marion University 13,841 15,028 15,585 16,625 17,256 17,810 18,410 19,048 19,668 20,333 46.9% 14.2% 3.4%
Lander University 14,616 15,840 16,560 17,304 17,976 18,552 19,136 19,738 20,370 20,300 38.9% 9.4% -0.3%
SC State University 14,362 15,298 16,626 17,470 18,170 18,170 18,910 19,856 19,856 20,500 42.7% 12.8% 3.2%
USC Aiken 13,922 14,896 15,632 16,542 17,188 17,730 18,290 18,876 19,472 20,102 44.4% 13.4% 3.2%USC Beaufort 13,912 14,576 15,100 16,572 17,220 17,906 18,774 19,374 19,982 20,630 48.3% 15.2% 3.2%
USC Upstate 15,752 16,684 17,284 18,144 18,852 19,444 20,056 20,698 21,368 22,188 40.9% 14.1% 3.8%
Winthrop University 19,034 20,710 21,596 22,892 23,796 24,476 26,000 26,738 27,404 28,090 47.6% 14.8% 2.5%
TWO-YEAR REGIONAL CAMPUSES OF USCUSC Lancaster 11,780 12,680 13,304 14,144 14,696 15,158 15,632 16,130 16,728 17,264 46.6% 13.9% 3.2%USC Salkehatchie 11,780 12,680 13,304 14,144 14,696 15,158 15,632 16,130 16,638 17,265 46.6% 13.9% 3.8%USC Sumter 11,780 12,680 13,304 14,144 14,696 15,158 15,632 16,130 16,648 17,184 45.9% 13.4% 3.2%
USC Union 11,780 12,680 13,304 14,144 14,696 15,158 15,632 16,130 16,628 17,164 45.7% 13.2% 3.2%
TECHNICAL COLLEGESAiken TC 9,222 9,794 10,130 10,130 10,130 10,130 10,130 10,178 6,496 6,638 -28.0% -34.5% 2.2%
Central Carolina TC 5,176 5,372 5,744 5,872 6,042 6,232 6,432 6,624 6,768 7,200 39.1% 15.5% 6.4%Denmark TC 4,366 4,466 4,676 4,780 4,780 4,920 4,920 5,048 6,850 6,458 47.9% 31.3% -5.7%
Florence-Darlington TC 5,286 5,286 5,398 5,622 5,754 5,862 5,982 6,046 6,166 6,262 18.5% 6.8% 1.6%
Greenville TC 6,698 6,912 7,116 7,372 7,660 7,910 8,150 8,438 8,448 8,550 27.7% 8.1% 1.2%
Horry-Georgetown TC 4,914 5,034 5,046 5,354 5,794 5,794 6,294 6,726 6,918 7,948 61.7% 37.2% 14.9%
Midlands TC 9,532 9,840 10,474 10,640 10,714 10,940 11,086 11,234 11,524 11,744 23.2% 7.3% 1.9%Northeastern TC 5,454 5,886 5,886 5,886 5,982 6,078 6,174 6,342 6,462 6,802 24.7% 11.9% 5.3%
Orangeburg-Calhoun TC 4,464 4,488 6,218 6,218 6,218 6,218 6,458 6,602 6,746 6,890 54.3% 10.8% 2.1%Piedmont TC 4,684 4,684 4,942 5,148 5,180 5,322 5,458 5,710 5,836 6,148 31.3% 15.5% 5.3%
Spartanburg CC 6,110 7,048 7,196 7,338 7,616 7,716 7,956 8,208 8,472 8,692 42.3% 12.6% 2.6%
TC of the Lowcountry 6,912 7,082 7,436 7,760 8,020 8,212 8,548 8,812 9,076 9,268 34.1% 12.9% 2.1%Tri-County TC 6,594 6,786 7,032 7,767 7,944 8,124 8,328 8,568 8,815 9,042 37.1% 11.3% 2.6%
Trident TC 6,100 6,308 6,532 6,682 6,814 7,000 7,209 7,434 7,676 7,838 28.5% 12.0% 2.1%
Williamsburg TC 5,292 5,642 5,850 6,282 6,642 6,840 7,056 7,260 7,608 7,752 46.5% 13.3% 1.9%
York TC 7,000 7,288 7,528 7,864 8,176 8,392 8,520 8,736 9,024 9,240 32.0% 10.1% 2.4%
Research, excluding MUSC $21,716 $23,269 $24,560 $26,391 $27,407 $28,622 $29,508 $30,451 $31,549 $32,742 50.8% 14.4% 3.8%Comprehensive Teaching Institutions 16,238 17,257 18,154 19,379 20,338 21,022 21,868 22,614 23,266 23,962 47.6% 14.0% 3.0%All 4-Year, excluding MUSC 17,234 18,259 19,222 20,548 21,516 22,289 23,141 23,920 24,647 25,425 47.5% 14.1% 3.2%2-Year Regional Campuses 11,780 12,680 13,304 14,144 14,696 15,158 15,632 16,130 16,661 17,219 46.2% 13.6% 3.4%Technical Colleges 6,113 6,370 6,700 6,920 7,092 7,231 7,419 7,623 7,680 7,905 29.3% 9.3% 2.9%All 2-Year 7,246 7,632 8,021 8,365 8,613 8,816 9,061 9,324 9,476 9,767 34.8% 10.8% 3.1%1Excludes Medicine, Law, and Pharmacy.2Excludes Medicine, Dentis try, and Pharmacy. Includes Nurs ing and Heal th Profess ionals .
(10 Year)2016-17 Over
2007-2008
(5 Year) 2016-17 Over
2012-13
(1 Year)2016-17 Over
2015-162014-2015 2015-2016 2016-2017
% Change
RESEARCH INSTITUTIONS
2007-2008 2008-2009 2009-2010 2010-2011 2011-2012 2012-2013 2013-2014
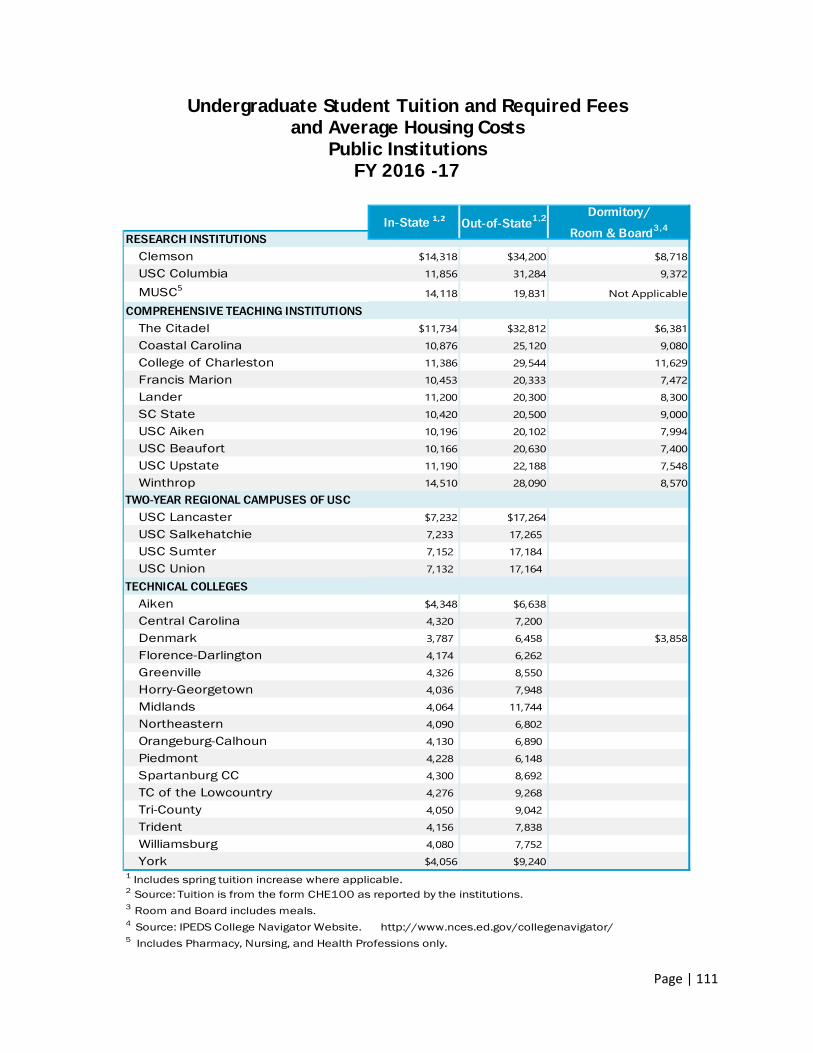
Page | 111
Undergraduate Student Tuition and Required Fees and Average Housing Costs
Public Institutions FY 2016 -17
Clemson $14,318 $34,200 $8,718
USC Columbia 11,856 31,284 9,372
MUSC5 14,118 19,831 Not Applicable
COMPREHENSIVE TEACHING INSTITUTIONSThe Citadel $11,734 $32,812 $6,381Coastal Carolina 10,876 25,120 9,080
College of Charleston 11,386 29,544 11,629Francis Marion 10,453 20,333 7,472Lander 11,200 20,300 8,300
SC State 10,420 20,500 9,000USC Aiken 10,196 20,102 7,994USC Beaufort 10,166 20,630 7,400
USC Upstate 11,190 22,188 7,548Winthrop 14,510 28,090 8,570
TWO-YEAR REGIONAL CAMPUSES OF USCUSC Lancaster $7,232 $17,264USC Salkehatchie 7,233 17,265
USC Sumter 7,152 17,184 USC Union 7,132 17,164
TECHNICAL COLLEGESAiken $4,348 $6,638Central Carolina 4,320 7,200 Denmark 3,787 6,458 $3,858Florence-Darlington 4,174 6,262 Greenville 4,326 8,550 Horry-Georgetown 4,036 7,948 Midlands 4,064 11,744 Northeastern 4,090 6,802 Orangeburg-Calhoun 4,130 6,890 Piedmont 4,228 6,148 Spartanburg CC 4,300 8,692 TC of the Lowcountry 4,276 9,268 Tri-County 4,050 9,042
Trident 4,156 7,838 Williamsburg 4,080 7,752 York $4,056 $9,240
1 Includes spring tuition increase where applicable.
3 Room and Board includes meals.4 Source: IPEDS College Navigator Website. http://www.nces.ed.gov/collegenavigator/5 Includes Pharmacy, Nursing, and Health Professions only.
2 Source: Tuition is from the form CHE100 as reported by the institutions.
RESEARCH INSTITUTIONSIn-State 1,2 Out-of-State1,2 Dormitory/
Room & Board3,4
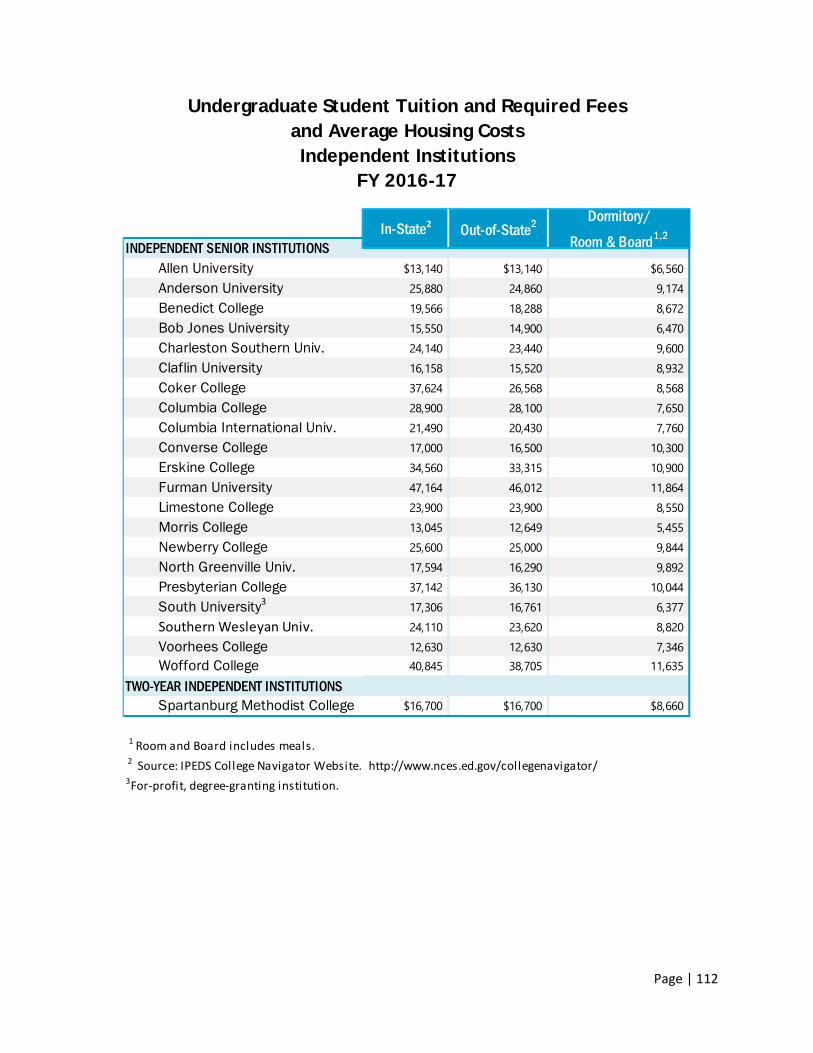
Page | 112
Undergraduate Student Tuition and Required Fees and Average Housing Costs Independent Institutions
FY 2016-17
Allen University $13,140 $13,140 $6,560 Anderson University 25,880 24,860 9,174 Benedict College 19,566 18,288 8,672 Bob Jones University 15,550 14,900 6,470 Charleston Southern Univ. 24,140 23,440 9,600 Claflin University 16,158 15,520 8,932 Coker College 37,624 26,568 8,568 Columbia College 28,900 28,100 7,650 Columbia International Univ. 21,490 20,430 7,760 Converse College 17,000 16,500 10,300 Erskine College 34,560 33,315 10,900 Furman University 47,164 46,012 11,864 Limestone College 23,900 23,900 8,550 Morris College 13,045 12,649 5,455 Newberry College 25,600 25,000 9,844 North Greenville Univ. 17,594 16,290 9,892 Presbyterian College 37,142 36,130 10,044 South University3 17,306 16,761 6,377 Southern Wesleyan Univ. 24,110 23,620 8,820 Voorhees College 12,630 12,630 7,346 Wofford College 40,845 38,705 11,635
TWO-YEAR INDEPENDENT INSTITUTIONS Spartanburg Methodist College $16,700 $16,700 $8,660
1 Room and Board includes meals. 2 Source: IPEDS College Navigator Website. http://www.nces.ed.gov/collegenavigator/3For-profit, degree-granting institution.
INDEPENDENT SENIOR INSTITUTIONSIn-State2 Out-of-State2 Dormitory/
Room & Board1,2
Page | 113
Financial Appropriations
Revenue derived from state appropriations is combined with tuition & fees; grants, contracts, and gifts; and in part by sales and service to fund the Educational and General (E&G) activities of our public colleges and universities. The tables on the following pages reflect a consistent pattern of decreasing state support for higher education and a shift to more reliance on tuition & fees and other non-state revenue. The following pages give a brief overview of the appropriations provided in support of E&G costs at our public colleges and universities as well as funding provided through the South Carolina Education Lottery for operations and funding provided through a combination of appropriated, lottery, and other funding in support of merit-based scholarships (Palmetto Fellows, LIFE, and HOPE), Lottery Tuition Assistance (LTA) to two-year institutions, and need-based aid.
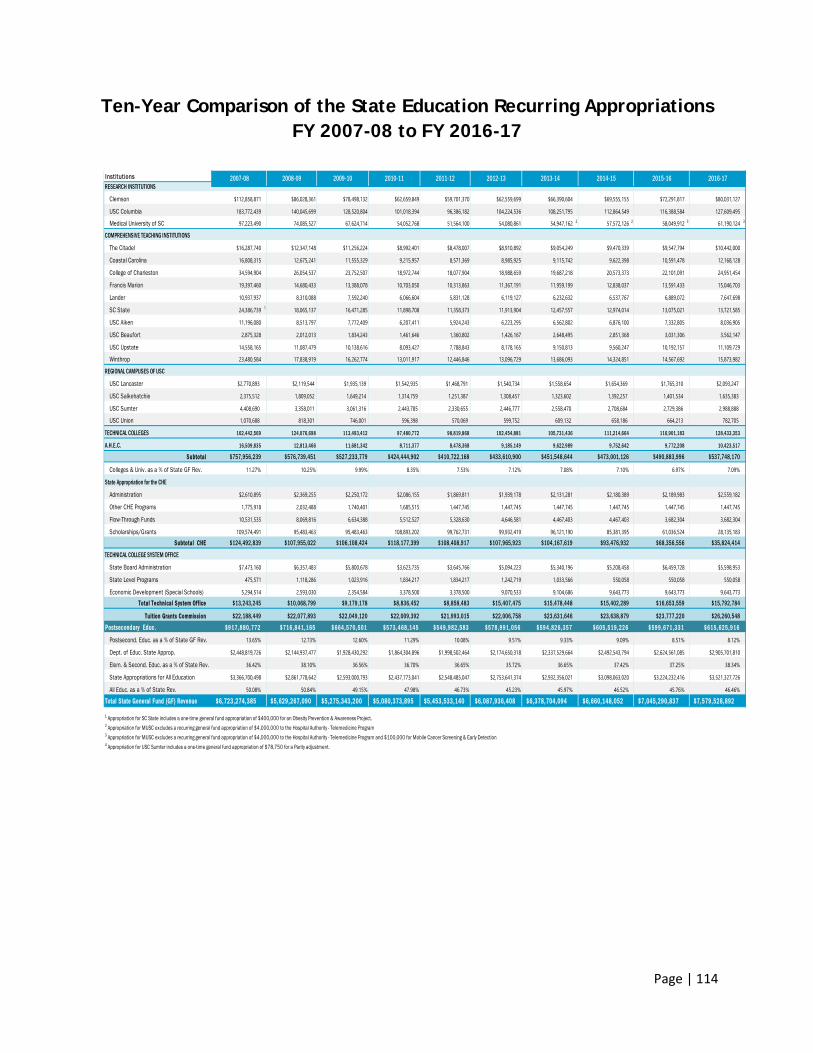
Page | 114
Ten-Year Comparison of the State Education Recurring Appropriations FY 2007-08 to FY 2016-17
Inst itut ions
Clemson $112,858,871 $86,028,361 $78,498,132 $62,659,849 $59,701,370 $62,559,699 $66,390,604 $69,555,155 $72,291,817 $80,031,127
USC Columbia 183,772,439 140,045,699 128,520,804 101,018,394 96,386,182 104,224,536 108,251,795 112,864,549 116,388,584 127,609,495
Medical University of SC 97,223,490 74,085,527 67,624,714 54,052,768 51,564,100 54,080,861 54,947,162 2 57,572,126 2 58,049,912 3 61,190,124 3
COMPREHENSIVE TEACHING INSTITUTIONS
The Citadel $16,287,740 $12,347,148 $11,256,224 $8,992,401 $8,478,007 $8,910,892 $9,054,249 $9,470,339 $9,547,794 $10,442,000
Coastal Carolina 16,808,315 12,675,241 11,555,329 9,215,957 8,571,369 8,985,925 9,115,742 9,622,398 10,591,478 12,168,128
College of Charleston 34,594,904 26,054,537 23,752,507 18,972,744 18,077,904 18,988,659 19,687,218 20,573,373 22,101,091 24,951,454
Francis Marion 19,397,460 14,680,433 13,388,078 10,703,050 10,313,863 11,367,191 11,959,199 12,838,037 13,591,433 15,046,703
Lander 10,937,937 8,310,088 7,592,240 6,066,604 5,831,128 6,119,127 6,232,632 6,537,767 6,889,072 7,647,698
SC State 24,386,739 1 18,065,137 16,471,285 11,898,708 11,358,373 11,913,904 12,457,557 12,974,014 13,075,021 13,721,585
USC Aiken 11,196,080 8,513,797 7,772,409 6,207,411 5,924,243 6,223,295 6,562,802 6,876,100 7,332,805 8,036,905
USC Beaufort 2,875,328 2,012,013 1,834,243 1,461,646 1,360,802 1,426,167 2,648,495 2,851,368 3,031,306 3,562,147
USC Upstate 14,558,165 11,087,479 10,138,616 8,093,427 7,788,843 8,178,165 9,150,813 9,560,247 10,192,157 11,109,729
Winthrop 23,480,584 17,838,919 16,262,774 13,011,917 12,446,846 13,096,729 13,686,093 14,324,851 14,567,692 15,873,982
REGIONAL CAMPUSES OF USC
USC Lancaster $2,770,893 $2,119,544 $1,935,139 $1,542,935 $1,468,791 $1,540,734 $1,558,654 $1,654,369 $1,765,310 $2,093,247
USC Salkehatchie 2,375,512 1,809,052 1,649,214 1,314,759 1,251,387 1,308,457 1,323,602 1,392,257 1,401,534 1,635,383
USC Sumter 4,408,690 3,358,011 3,061,316 2,443,785 2,330,655 2,446,777 2,558,470 2,708,684 2,729,386 2,988,888
USC Union 1,070,688 818,301 746,001 596,398 570,069 599,752 609,132 658,186 664,213 782,705
TECHNICAL COLLEGES 162,442,569 124,076,698 113,493,412 97,480,772 98,819,868 102,454,881 105,731,436 111,214,664 116,901,183 128,433,353
A.H.E.C. 16,509,835 12,813,466 11,681,342 8,711,377 8,478,368 9,185,149 9,622,989 9,752,642 9,772,208 10,423,517
Subtotal $757,956,239 $576,739,451 $527,233,779 $424,444,902 $410,722,168 $433,610,900 $451,548,644 $473,001,126 $490,883,996 $537,748,170
Colleges & Univ. as a % of State GF Rev. 11.27% 10.25% 9.99% 8.35% 7.53% 7.12% 7.08% 7.10% 6.97% 7.09%
State Appropriation for the CHE
Administration $2,610,895 $2,369,255 $2,250,172 $2,086,155 $1,869,811 $1,939,178 $2,131,281 $2,180,389 $2,189,983 $2,559,182
Other CHE Programs 1,775,918 2,032,488 1,740,401 1,685,515 1,447,745 1,447,745 1,447,745 1,447,745 1,447,745 1,447,745
Flow-Through Funds 10,531,535 8,069,816 6,634,388 5,512,527 5,328,630 4,646,581 4,467,403 4,467,403 3,682,304 3,682,304
Scholarships/Grants 109,574,491 95,483,463 95,483,463 108,893,202 99,762,731 99,932,419 96,121,190 85,381,395 61,036,524 28,135,183
Subtotal CHE $124,492,839 $107,955,022 $106,108,424 $118,177,399 $108,408,917 $107,965,923 $104,167,619 $93,476,932 $68,356,556 $35,824,414
TECHNICAL COLLEGE SYSTEM OFFICE
State Board Administration $7,473,160 $6,357,483 $5,800,678 $3,623,735 $3,645,766 $5,094,223 $5,340,196 $5,208,458 $6,459,728 $5,598,953
State Level Programs 475,571 1,118,286 1,023,916 1,834,217 1,834,217 1,242,719 1,033,566 550,058 550,058 550,058
Economic Development (Special Schools) 5,294,514 2,593,030 2,354,584 3,378,500 3,378,500 9,070,533 9,104,686 9,643,773 9,643,773 9,643,773
Total Technical System Office $13,243,245 $10,068,799 $9,179,178 $8,836,452 $8,858,483 $15,407,475 $15,478,448 $15,402,289 $16,653,559 $15,792,784
Tuition Grants Commission $22,188,449 $22,077,893 $22,049,120 $22,009,392 $21,993,015 $22,006,758 $23,631,646 $23,638,879 $23,777,220 $26,260,548Postsecondary Educ. $917, 880, 772 $716, 841, 165 $664, 570, 501 $573, 468, 145 $549, 982, 583 $578, 991, 056 $594, 826, 357 $605, 519, 226 $599, 671, 331 $615, 625, 916
Postsecond. Educ. as a % of State GF Rev. 13.65% 12.73% 12.60% 11.29% 10.08% 9.51% 9.33% 9.09% 8.51% 8.12%
Dept. of Educ. State Approp. $2,448,819,726 $2,144,937,477 $1,928,430,292 $1,864,304,896 $1,998,502,464 $2,174,650,318 $2,337,529,664 $2,492,543,794 $2,624,561,085 $2,905,701,810
Elem. & Second. Educ. as a % of State Rev. 36.42% 38.10% 36.56% 36.70% 36.65% 35.72% 36.65% 37.42% 37.25% 38.34%
State Appropriations for All Education $3,366,700,498 $2,861,778,642 $2,593,000,793 $2,437,773,041 $2,548,485,047 $2,753,641,374 $2,932,356,021 $3,098,063,020 $3,224,232,416 $3,521,327,726
All Educ. as a % of State Rev. 50.08% 50.84% 49.15% 47.98% 46.73% 45.23% 45.97% 46.52% 45.76% 46.46%
Total State General Fund (GF) Revenue $6,723,274,385 $5,629,267,090 $5,275,343,200 $5,080,373,895 $5,453,533,140 $6,087,936,408 $6,378,704,094 $6,660,148,052 $7,045,290,837 $7,579,528,892
1 Appropriation for SC State includes a one-time general fund appropriation of $400,000 for an Obesity Prevention & Awareness Project.2 Appropriation for MUSC excludes a recurring general fund appropriation of $4,000,000 to the Hospital Authority - Telemedicine Program3 Appropriation for MUSC excludes a recurring general fund appropriation of $4,000,000 to the Hospital Authority - Telemedicine Program and $100,000 for Mobile Cancer Screening & Early Detection4 Appropriation for USC Sumter includes a one-time general fund appropriation of $78,750 for a Parity adjustment.
RESEARCH INSTITUTIONS2007-08 2008-09 2009-10 2010-11 2011-12 2012-13 2013-14 2014-15 2015-16 2016-17
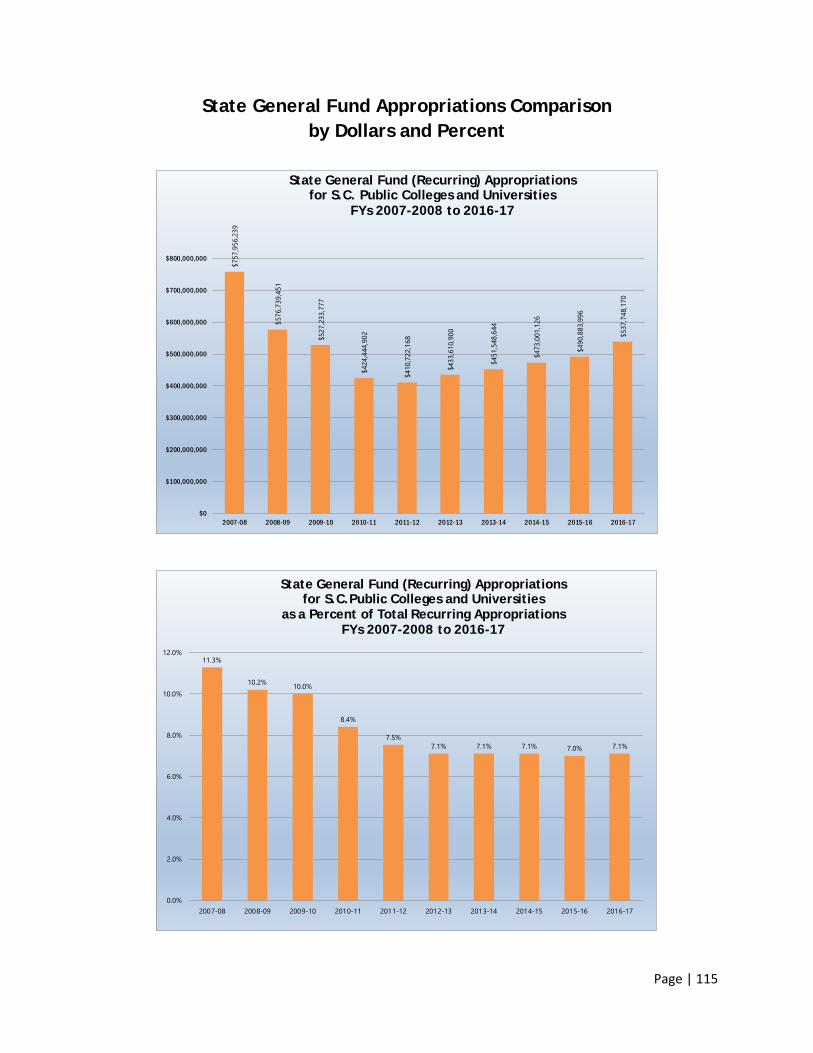
Page | 115
State General Fund Appropriations Comparison by Dollars and Percent
$757,956,239
$576,739,451
$527,233,777
$424,444,902
$410,722,168
$433,610,900
$451,548,644
$473,001,126
$490,883,996
$537,748,170
$0
$100,000,000
$200,000,000
$300,000,000
$400,000,000
$500,000,000
$600,000,000
$700,000,000
$800,000,000
2007-08 2008-09 2009-10 2010-11 2011-12 2012-13 2013-14 2014-15 2015-16 2016-17
State General Fund (Recurring) Appropriationsfor S.C. Public Colleges and Universities
FYs 2007-2008 to 2016-17
11.3%
10.2% 10.0%
8.4%
7.5%7.1% 7.1% 7.1% 7.0% 7.1%
0.0%
2.0%
4.0%
6.0%
8.0%
10.0%
12.0%
2007-08 2008-09 2009-10 2010-11 2011-12 2012-13 2013-14 2014-15 2015-16 2016-17
State General Fund (Recurring) Appropriations for S.C.Public Colleges and Universities
as a Percent of Total Recurring AppropriationsFYs 2007-2008 to 2016-17
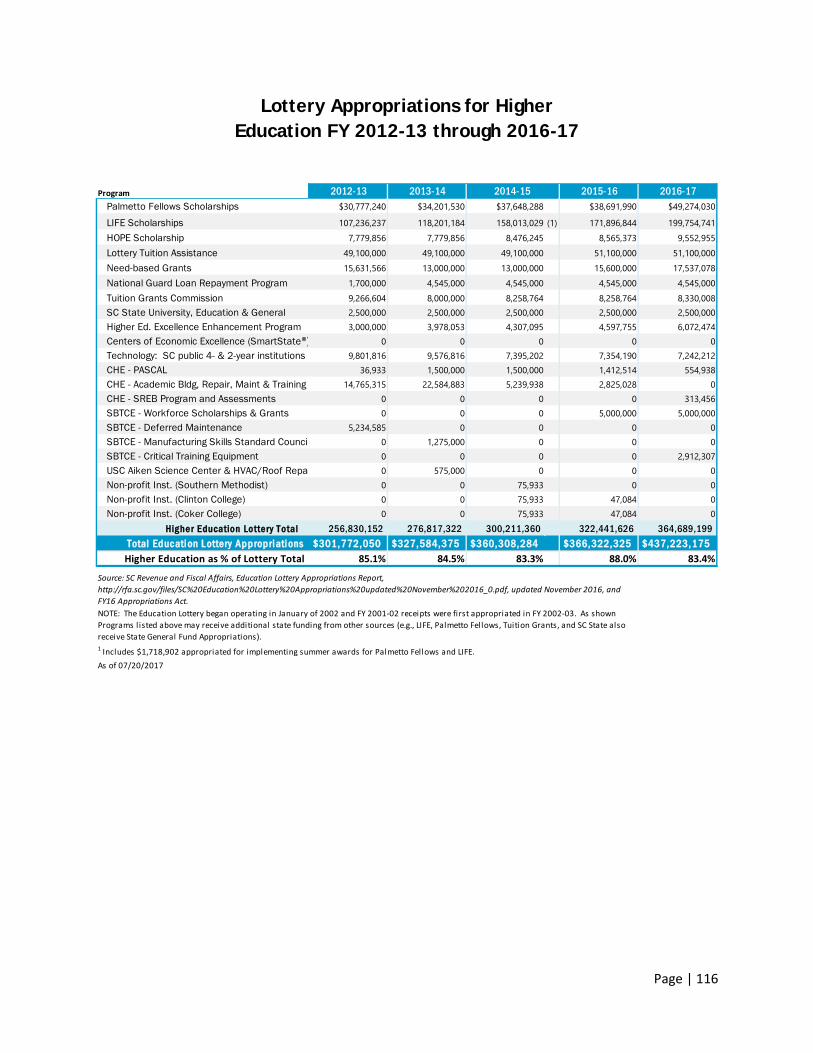
Page | 116
Lottery Appropriations for Higher Education FY 2012-13 through 2016-17
Program 2012-13 2013-14 2014-15 2015-16 2016-17Palmetto Fellows Scholarships $30,777,240 $34,201,530 $37,648,288 $38,691,990 $49,274,030
LIFE Scholarships 107,236,237 118,201,184 158,013,029 (1) 171,896,844 199,754,741HOPE Scholarship 7,779,856 7,779,856 8,476,245 8,565,373 9,552,955Lottery Tuition Assistance 49,100,000 49,100,000 49,100,000 51,100,000 51,100,000Need-based Grants 15,631,566 13,000,000 13,000,000 15,600,000 17,537,078National Guard Loan Repayment Program 1,700,000 4,545,000 4,545,000 4,545,000 4,545,000Tuition Grants Commission 9,266,604 8,000,000 8,258,764 8,258,764 8,330,008SC State University, Education & General 2,500,000 2,500,000 2,500,000 2,500,000 2,500,000Higher Ed. Excellence Enhancement Program 3,000,000 3,978,053 4,307,095 4,597,755 6,072,474Centers of Economic Excellence (SmartState®) 0 0 0 0 0Technology: SC public 4- & 2-year institutions 9,801,816 9,576,816 7,395,202 7,354,190 7,242,212CHE - PASCAL 36,933 1,500,000 1,500,000 1,412,514 554,938CHE - Academic Bldg, Repair, Maint & Training 14,765,315 22,584,883 5,239,938 2,825,028 0CHE - SREB Program and Assessments 0 0 0 0 313,456SBTCE - Workforce Scholarships & Grants 0 0 0 5,000,000 5,000,000SBTCE - Deferred Maintenance 5,234,585 0 0 0 0SBTCE - Manufacturing Skills Standard Council 0 1,275,000 0 0 0SBTCE - Critical Training Equipment 0 0 0 0 2,912,307USC Aiken Science Center & HVAC/Roof Repai 0 575,000 0 0 0Non-profit Inst. (Southern Methodist) 0 0 75,933 0 0Non-profit Inst. (Clinton College) 0 0 75,933 47,084 0Non-profit Inst. (Coker College) 0 0 75,933 47,084 0
Higher Education Lottery Total 256,830,152 276,817,322 300,211,360 322,441,626 364,689,199 Total Education Lottery Appropriations $301,772,050 $327,584,375 $360,308,284 $366,322,325 $437,223,175
Higher Education as % of Lottery Total 85.1% 84.5% 83.3% 88.0% 83.4%
As of 07/20/2017
Source: SC Revenue and Fiscal Affairs, Education Lottery Appropriations Report, http://rfa.sc.gov/files/SC%20Education%20Lottery%20Appropriations%20updated%20November%202016_0.pdf, updated November 2016, and FY16 Appropriations Act.NOTE: The Education Lottery began operating in January of 2002 and FY 2001-02 receipts were first appropriated in FY 2002-03. As shown Programs l isted above may receive additional state funding from other sources (e.g., LIFE, Palmetto Fellows, Tuition Grants, and SC State also receive State General Fund Appropriations).1 Includes $1,718,902 appropriated for implementing summer awards for Palmetto Fellows and LIFE.
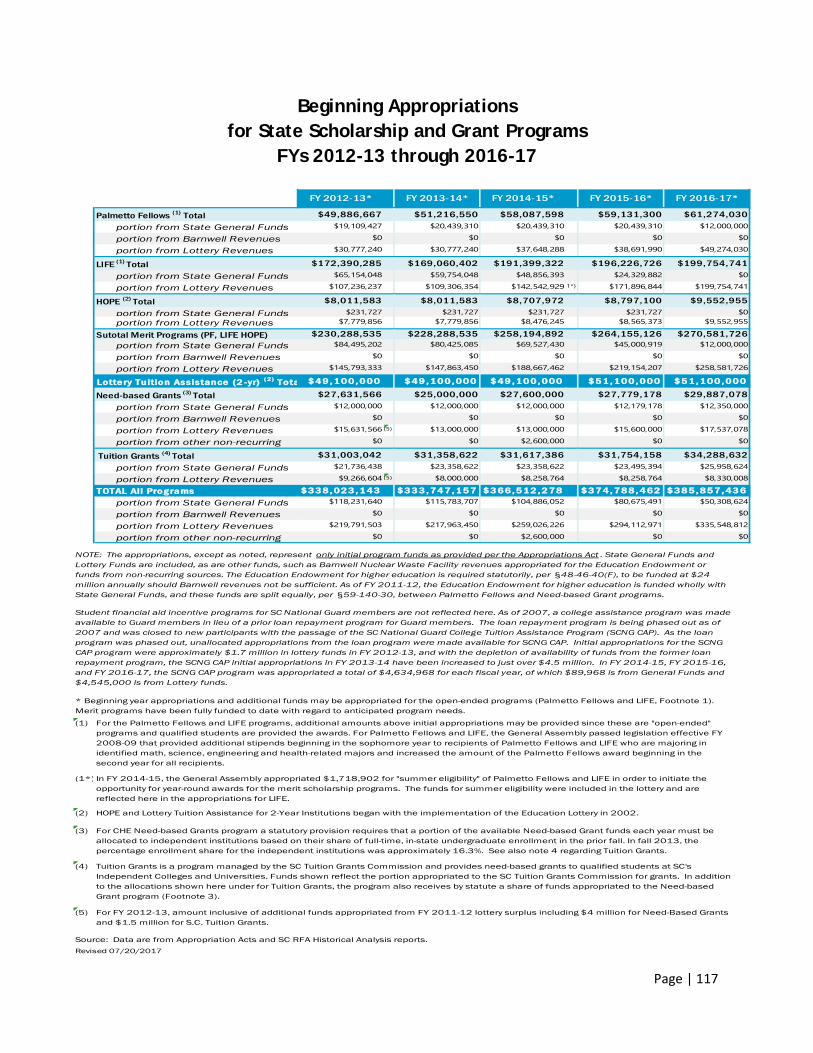
Page | 117
Beginning Appropriations for State Scholarship and Grant Programs
FYs 2012-13 through 2016-17
Palmetto Fellows (1) Totalportion from State General Fundsportion from Barnwell Revenuesportion from Lottery Revenues
LIFE (1) Totalportion from State General Fundsportion from Lottery Revenues (1*)
HOPE (2) Totalportion from State General Fundsportion from Lottery Revenues
Sutotal Merit Programs (PF, LIFE HOPE)portion from State General Fundsportion from Barnwell Revenuesportion from Lottery Revenues
Lottery Tuition Assistance (2-yr) ( 2) TotaNeed-based Grants (3) Total
portion from State General Fundsportion from Barnwell Revenuesportion from Lottery Revenues (5)
portion from other non-recurring
Tuition Grants (4) Totalportion from State General Fundsportion from Lottery Revenues (5)
TOTAL All Programsportion from State General Fundsportion from Barnwell Revenuesportion from Lottery Revenuesportion from other non-recurring
(1)
(1*)
(2)
(3)
(4)
(5)
Revised 07/20/2017
Source: Data are from Appropriation Acts and SC RFA Historical Analysis reports.
In FY 2014-15, the General Assembly appropriated $1,718,902 for "summer eligibility" of Palmetto Fellows and LIFE in order to initiate the opportunity for year-round awards for the merit scholarship programs. The funds for summer eligibility were included in the lottery and are reflected here in the appropriations for LIFE.
HOPE and Lottery Tuition Assistance for 2-Year Institutions began with the implementation of the Education Lottery in 2002.
For CHE Need-based Grants program a statutory provision requires that a portion of the available Need-based Grant funds each year must be allocated to independent institutions based on their share of full-time, in-state undergraduate enrollment in the prior fall. In fall 2013, the percentage enrollment share for the independent institutions was approximately 16.3%. See also note 4 regarding Tuition Grants.
Tuition Grants is a program managed by the SC Tuition Grants Commission and provides need-based grants to qualified students at SC's Independent Colleges and Universities. Funds shown reflect the portion appropriated to the SC Tuition Grants Commission for grants. In addition to the allocations shown here under for Tuition Grants, the program also receives by statute a share of funds appropriated to the Need-based Grant program (Footnote 3).
For FY 2012-13, amount inclusive of additional funds appropriated from FY 2011-12 lottery surplus including $4 million for Need-Based Grants and $1.5 million for S.C. Tuition Grants.
For the Palmetto Fellows and LIFE programs, additional amounts above initial appropriations may be provided since these are "open-ended" programs and qualified students are provided the awards. For Palmetto Fellows and LIFE, the General Assembly passed legislation effective FY 2008-09 that provided additional stipends beginning in the sophomore year to recipients of Palmetto Fellows and LIFE who are majoring in identified math, science, engineering and health-related majors and increased the amount of the Palmetto Fellows award beginning in the second year for all recipients.
NOTE: The appropriations, except as noted, represent only initial program funds as provided per the Appropriations Act . State General Funds and Lottery Funds are included, as are other funds, such as Barnwell Nuclear Waste Facility revenues appropriated for the Education Endowment or funds from non-recurring sources. The Education Endowment for higher education is required statutorily, per §48-46-40(F), to be funded at $24 million annually should Barnwell revenues not be sufficient. As of FY 2011-12, the Education Endowment for higher education is funded wholly with State General Funds, and these funds are split equally, per §59-140-30, between Palmetto Fellows and Need-based Grant programs.
Student financial aid incentive programs for SC National Guard members are not reflected here. As of 2007, a college assistance program was made available to Guard members in lieu of a prior loan repayment program for Guard members. The loan repayment program is being phased out as of 2007 and was closed to new participants with the passage of the SC National Guard College Tuition Assistance Program (SCNG CAP). As the loan program was phased out, unallocated appropriations from the loan program were made available for SCNG CAP. Initial appropriations for the SCNG CAP program were approximately $1.7 million in lottery funds in FY 2012-13, and with the depletion of availability of funds from the former loan repayment program, the SCNG CAP initial appropriations in FY 2013-14 have been increased to just over $4.5 million. In FY 2014-15, FY 2015-16, and FY 2016-17, the SCNG CAP program was appropriated a total of $4,634,968 for each fiscal year, of which $89,968 is from General Funds and $4,545,000 is from Lottery funds.
* Beginning year appropriations and additional funds may be appropriated for the open-ended programs (Palmetto Fellows and LIFE, Footnote 1). Merit programs have been fully funded to date with regard to anticipated program needs.
FY 2012-13* FY 2013-14* FY 2014-15* FY 2015-16* FY 2016-17*
$19,109,427
$0
$30,777,240
$49,886,667 $51,216,550 $58,087,598 $59,131,300 $61,274,030$20,439,310
$0
$38,691,990
$12,000,000
$0
$49,274,030
$20,439,310
$0
$30,777,240
$20,439,310
$0
$37,648,288
$65,154,048 $59,754,048 $48,856,393 $24,329,882 $0$172,390,285 $169,060,402 $191,399,322 $196,226,726 $199,754,741
$8,011,583 $8,011,583 $8,707,972 $8,797,100 $9,552,955
$107,236,237 $109,306,354 $142,542,929 $171,896,844 $199,754,741
$7,779,856 $7,779,856 $8,476,245 $8,565,373 $9,552,955$231,727 $231,727 $231,727 $231,727 $0
$84,495,202 $80,425,085 $69,527,430 $45,000,919 $12,000,000$230,288,535 $228,288,535 $258,194,892 $264,155,126 $270,581,726
$145,793,333 $147,863,450 $188,667,462 $219,154,207 $258,581,726
$0 $0 $0 $0 $0
$27,631,566 $25,000,000 $27,600,000 $27,779,178 $29,887,078$49, 100, 000 $49, 100, 000 $49, 100, 000 $51, 100, 000 $51, 100, 000
$0 $0 $0 $0 $0
$12,000,000 $12,000,000 $12,000,000 $12,179,178 $12,350,000
$0 $0 $2,600,000 $0 $0
$15,631,566 $13,000,000 $13,000,000 $15,600,000 $17,537,078
$21,736,438 $23,358,622 $23,358,622 $23,495,394 $25,958,624$31,003,042 $31,358,622 $31,617,386 $31,754,158 $34,288,632
$338, 023, 143 $333, 747, 157 $366, 512, 278 $374, 788, 462 $385, 857, 436$9,266,604 $8,000,000 $8,258,764 $8,258,764 $8,330,008
$0 $0 $0 $0 $0
$118,231,640 $115,783,707 $104,886,052 $80,675,491 $50,308,624
$0 $0 $2,600,000 $0 $0
$219,791,503 $217,963,450 $259,026,226 $294,112,971 $335,548,812
Page | 118
Intentionally Blank
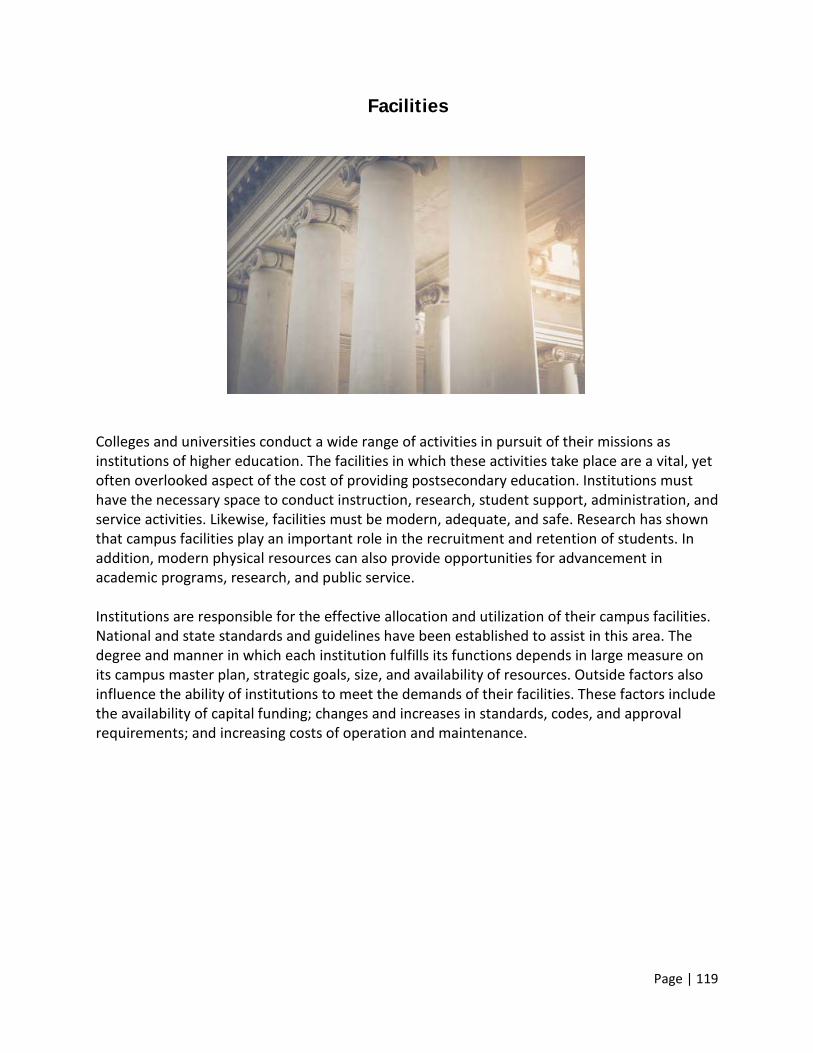
Page | 119
Facilities
Colleges and universities conduct a wide range of activities in pursuit of their missions as institutions of higher education. The facilities in which these activities take place are a vital, yet often overlooked aspect of the cost of providing postsecondary education. Institutions must have the necessary space to conduct instruction, research, student support, administration, and service activities. Likewise, facilities must be modern, adequate, and safe. Research has shown that campus facilities play an important role in the recruitment and retention of students. In addition, modern physical resources can also provide opportunities for advancement in academic programs, research, and public service. Institutions are responsible for the effective allocation and utilization of their campus facilities. National and state standards and guidelines have been established to assist in this area. The degree and manner in which each institution fulfills its functions depends in large measure on its campus master plan, strategic goals, size, and availability of resources. Outside factors also influence the ability of institutions to meet the demands of their facilities. These factors include the availability of capital funding; changes and increases in standards, codes, and approval requirements; and increasing costs of operation and maintenance.
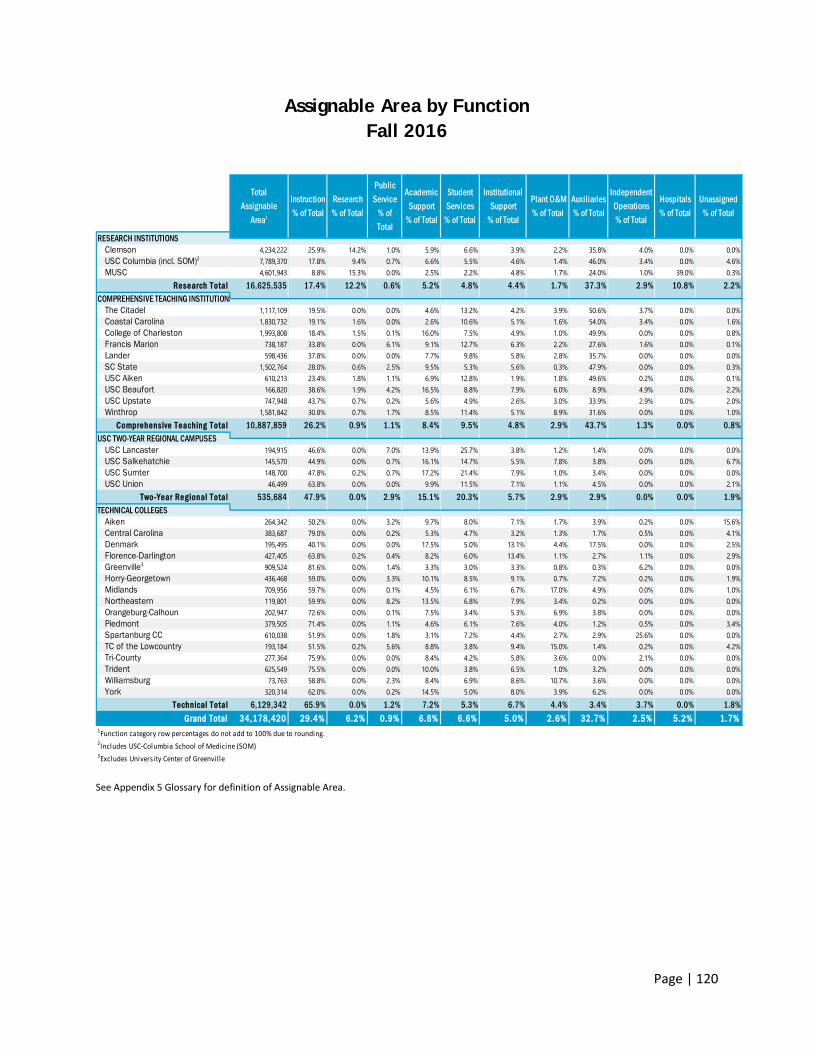
Page | 120
Assignable Area by Function Fall 2016
See Appendix 5 Glossary for definition of Assignable Area.
Clemson 4,234,222 25.9% 14.2% 1.0% 5.9% 6.6% 3.9% 2.2% 35.8% 4.0% 0.0% 0.0%USC Columbia (incl. SOM)2 7,789,370 17.8% 9.4% 0.7% 6.6% 5.5% 4.6% 1.4% 46.0% 3.4% 0.0% 4.6%MUSC 4,601,943 8.8% 15.3% 0.0% 2.5% 2.2% 4.8% 1.7% 24.0% 1.0% 39.0% 0.3%
Research Total 16,625,535 17.4% 12.2% 0.6% 5.2% 4.8% 4.4% 1.7% 37.3% 2.9% 10.8% 2.2%
The Citadel 1,117,109 19.5% 0.0% 0.0% 4.6% 13.2% 4.2% 3.9% 50.6% 3.7% 0.0% 0.0%Coastal Carolina 1,830,732 19.1% 1.6% 0.0% 2.6% 10.6% 5.1% 1.6% 54.0% 3.4% 0.0% 1.6%College of Charleston 1,993,808 18.4% 1.5% 0.1% 16.0% 7.5% 4.9% 1.0% 49.9% 0.0% 0.0% 0.8%Francis Marion 738,187 33.8% 0.0% 6.1% 9.1% 12.7% 6.3% 2.2% 27.6% 1.6% 0.0% 0.1%Lander 598,436 37.8% 0.0% 0.0% 7.7% 9.8% 5.8% 2.8% 35.7% 0.0% 0.0% 0.0%SC State 1,502,764 28.0% 0.6% 2.5% 9.5% 5.3% 5.6% 0.3% 47.9% 0.0% 0.0% 0.3%USC Aiken 610,213 23.4% 1.8% 1.1% 6.9% 12.8% 1.9% 1.8% 49.6% 0.2% 0.0% 0.1%USC Beaufort 166,820 38.6% 1.9% 4.2% 16.5% 8.8% 7.9% 6.0% 8.9% 4.9% 0.0% 2.2%USC Upstate 747,948 43.7% 0.7% 0.2% 5.6% 4.9% 2.6% 3.0% 33.9% 2.9% 0.0% 2.0%Winthrop 1,581,842 30.8% 0.7% 1.7% 8.5% 11.4% 5.1% 8.9% 31.6% 0.0% 0.0% 1.0%
Comprehensive Teaching Total 10,887,859 26.2% 0.9% 1.1% 8.4% 9.5% 4.8% 2.9% 43.7% 1.3% 0.0% 0.8%
USC Lancaster 194,915 46.6% 0.0% 7.0% 13.9% 25.7% 3.8% 1.2% 1.4% 0.0% 0.0% 0.0%USC Salkehatchie 145,570 44.9% 0.0% 0.7% 16.1% 14.7% 5.5% 7.8% 3.8% 0.0% 0.0% 6.7%USC Sumter 148,700 47.8% 0.2% 0.7% 17.2% 21.4% 7.9% 1.0% 3.4% 0.0% 0.0% 0.0%USC Union 46,499 63.8% 0.0% 0.0% 9.9% 11.5% 7.1% 1.1% 4.5% 0.0% 0.0% 2.1%
Two-Year Regional Total 535,684 47.9% 0.0% 2.9% 15.1% 20.3% 5.7% 2.9% 2.9% 0.0% 0.0% 1.9%
Aiken 264,342 50.2% 0.0% 3.2% 9.7% 8.0% 7.1% 1.7% 3.9% 0.2% 0.0% 15.6%Central Carolina 383,687 79.0% 0.0% 0.2% 5.3% 4.7% 3.2% 1.3% 1.7% 0.5% 0.0% 4.1%Denmark 195,495 40.1% 0.0% 0.0% 17.5% 5.0% 13.1% 4.4% 17.5% 0.0% 0.0% 2.5%Florence-Darlington 427,405 63.8% 0.2% 0.4% 8.2% 6.0% 13.4% 1.1% 2.7% 1.1% 0.0% 2.9%Greenville3 909,524 81.6% 0.0% 1.4% 3.3% 3.0% 3.3% 0.8% 0.3% 6.2% 0.0% 0.0%Horry-Georgetown 436,468 59.0% 0.0% 3.3% 10.1% 8.5% 9.1% 0.7% 7.2% 0.2% 0.0% 1.9%Midlands 709,956 59.7% 0.0% 0.1% 4.5% 6.1% 6.7% 17.0% 4.9% 0.0% 0.0% 1.0%Northeastern 119,801 59.9% 0.0% 8.2% 13.5% 6.8% 7.9% 3.4% 0.2% 0.0% 0.0% 0.0%Orangeburg-Calhoun 202,947 72.6% 0.0% 0.1% 7.5% 3.4% 5.3% 6.9% 3.8% 0.0% 0.0% 0.0%Piedmont 379,505 71.4% 0.0% 1.1% 4.6% 6.1% 7.6% 4.0% 1.2% 0.5% 0.0% 3.4%Spartanburg CC 610,038 51.9% 0.0% 1.8% 3.1% 7.2% 4.4% 2.7% 2.9% 25.6% 0.0% 0.0%TC of the Lowcountry 193,184 51.5% 0.2% 5.6% 8.8% 3.8% 9.4% 15.0% 1.4% 0.2% 0.0% 4.2%Tri-County 277,364 75.9% 0.0% 0.0% 8.4% 4.2% 5.8% 3.6% 0.0% 2.1% 0.0% 0.0%Trident 625,549 75.5% 0.0% 0.0% 10.0% 3.8% 6.5% 1.0% 3.2% 0.0% 0.0% 0.0%Williamsburg 73,763 58.8% 0.0% 2.3% 8.4% 6.9% 8.6% 10.7% 3.6% 0.0% 0.0% 0.0%York 320,314 62.0% 0.0% 0.2% 14.5% 5.0% 8.0% 3.9% 6.2% 0.0% 0.0% 0.0%
Technical Total 6,129,342 65.9% 0.0% 1.2% 7.2% 5.3% 6.7% 4.4% 3.4% 3.7% 0.0% 1.8%Grand Total 34,178,420 29.4% 6.2% 0.9% 6.8% 6.6% 5.0% 2.6% 32.7% 2.5% 5.2% 1.7%
1Function category row percentages do not add to 100% due to rounding.2Includes USC-Columbia School of Medicine (SOM)3Excludes University Center of Greenvil le
Unassigned % of Total
USC TWO-YEAR REGIONAL CAMPUSES
TECHNICAL COLLEGES
RESEARCH INSTITUTIONS
Total Assignable
Area1
Instruction % of Total
Research % of Total
Public Service
% of Total
Academic Support
% of Total
Student Services
% of Total
Institutional Support
% of Total
Plant O&M % of Total
Auxiliaries % of Total
Independent Operations% of Total
COMPREHENSIVE TEACHING INSTITUTIONS
Hospitals % of Total
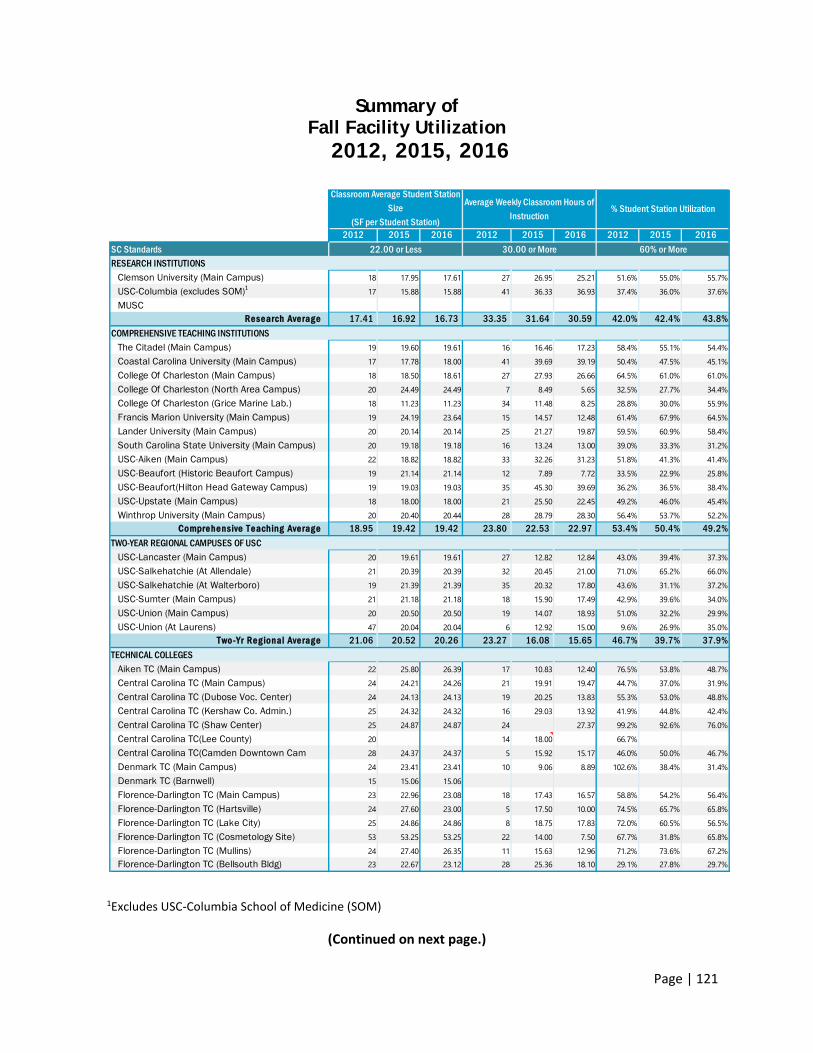
Page | 121
Summary of Fall Facility Utilization
2012, 2015, 2016
1Excludes USC-Columbia School of Medicine (SOM)
(Continued on next page.)
2012 2015 2016 2012 2015 2016 2012 2015 2016SC StandardsRESEARCH INSTITUTIONS
Clemson University (Main Campus) 18 17.95 17.61 27 26.95 25.21 51.6% 55.0% 55.7%
USC-Columbia (excludes SOM)1 17 15.88 15.88 41 36.33 36.93 37.4% 36.0% 37.6%
MUSCResearch Average 17.41 16.92 16.73 33.35 31.64 30.59 42.0% 42.4% 43.8%
COMPREHENSIVE TEACHING INSTITUTIONSThe Citadel (Main Campus) 19 19.60 19.61 16 16.46 17.23 58.4% 55.1% 54.4%
Coastal Carolina University (Main Campus) 17 17.78 18.00 41 39.69 39.19 50.4% 47.5% 45.1%
College Of Charleston (Main Campus) 18 18.50 18.61 27 27.93 26.66 64.5% 61.0% 61.0%
College Of Charleston (North Area Campus) 20 24.49 24.49 7 8.49 5.65 32.5% 27.7% 34.4%
College Of Charleston (Grice Marine Lab.) 18 11.23 11.23 34 11.48 8.25 28.8% 30.0% 55.9%
Francis Marion University (Main Campus) 19 24.19 23.64 15 14.57 12.48 61.4% 67.9% 64.5%
Lander University (Main Campus) 20 20.14 20.14 25 21.27 19.87 59.5% 60.9% 58.4%
South Carolina State University (Main Campus) 20 19.18 19.18 16 13.24 13.00 39.0% 33.3% 31.2%
USC-Aiken (Main Campus) 22 18.82 18.82 33 32.26 31.23 51.8% 41.3% 41.4%
USC-Beaufort (Historic Beaufort Campus) 19 21.14 21.14 12 7.89 7.72 33.5% 22.9% 25.8%
USC-Beaufort(Hilton Head Gateway Campus) 19 19.03 19.03 35 45.30 39.69 36.2% 36.5% 38.4%
USC-Upstate (Main Campus) 18 18.00 18.00 21 25.50 22.45 49.2% 46.0% 45.4%
Winthrop University (Main Campus) 20 20.40 20.44 28 28.79 28.30 56.4% 53.7% 52.2%Comprehensive Teaching Average 18.95 19.42 19.42 23.80 22.53 22.97 53.4% 50.4% 49.2%
TWO-YEAR REGIONAL CAMPUSES OF USCUSC-Lancaster (Main Campus) 20 19.61 19.61 27 12.82 12.84 43.0% 39.4% 37.3%
USC-Salkehatchie (At Allendale) 21 20.39 20.39 32 20.45 21.00 71.0% 65.2% 66.0%
USC-Salkehatchie (At Walterboro) 19 21.39 21.39 35 20.32 17.80 43.6% 31.1% 37.2%
USC-Sumter (Main Campus) 21 21.18 21.18 18 15.90 17.49 42.9% 39.6% 34.0%
USC-Union (Main Campus) 20 20.50 20.50 19 14.07 18.93 51.0% 32.2% 29.9%
USC-Union (At Laurens) 47 20.04 20.04 6 12.92 15.00 9.6% 26.9% 35.0%Two-Yr Regional Average 21.06 20.52 20.26 23.27 16.08 15.65 46.7% 39.7% 37.9%
TECHNICAL COLLEGESAiken TC (Main Campus) 22 25.80 26.39 17 10.83 12.40 76.5% 53.8% 48.7%
Central Carolina TC (Main Campus) 24 24.21 24.26 21 19.91 19.47 44.7% 37.0% 31.9%
Central Carolina TC (Dubose Voc. Center) 24 24.13 24.13 19 20.25 13.83 55.3% 53.0% 48.8%
Central Carolina TC (Kershaw Co. Admin.) 25 24.32 24.32 16 29.03 13.92 41.9% 44.8% 42.4%
Central Carolina TC (Shaw Center) 25 24.87 24.87 24 27.37 99.2% 92.6% 76.0%
Central Carolina TC(Lee County) 20 14 18.00 66.7%
Central Carolina TC(Camden Downtown Cam 28 24.37 24.37 5 15.92 15.17 46.0% 50.0% 46.7%
Denmark TC (Main Campus) 24 23.41 23.41 10 9.06 8.89 102.6% 38.4% 31.4%
Denmark TC (Barnwell) 15 15.06 15.06
Florence-Darlington TC (Main Campus) 23 22.96 23.08 18 17.43 16.57 58.8% 54.2% 56.4%
Florence-Darlington TC (Hartsville) 24 27.60 23.00 5 17.50 10.00 74.5% 65.7% 65.8%
Florence-Darlington TC (Lake City) 25 24.86 24.86 8 18.75 17.83 72.0% 60.5% 56.5%
Florence-Darlington TC (Cosmetology Site) 53 53.25 53.25 22 14.00 7.50 67.7% 31.8% 65.8%
Florence-Darlington TC (Mullins) 24 27.40 26.35 11 15.63 12.96 71.2% 73.6% 67.2%Florence-Darlington TC (Bellsouth Bldg) 23 22.67 23.12 28 25.36 18.10 29.1% 27.8% 29.7%
22.00 or Less 30.00 or More 60% or More
Classroom Average Student Station Size
(SF per Student Station)
Average Weekly Classroom Hours of Instruction
% Student Station Utilization
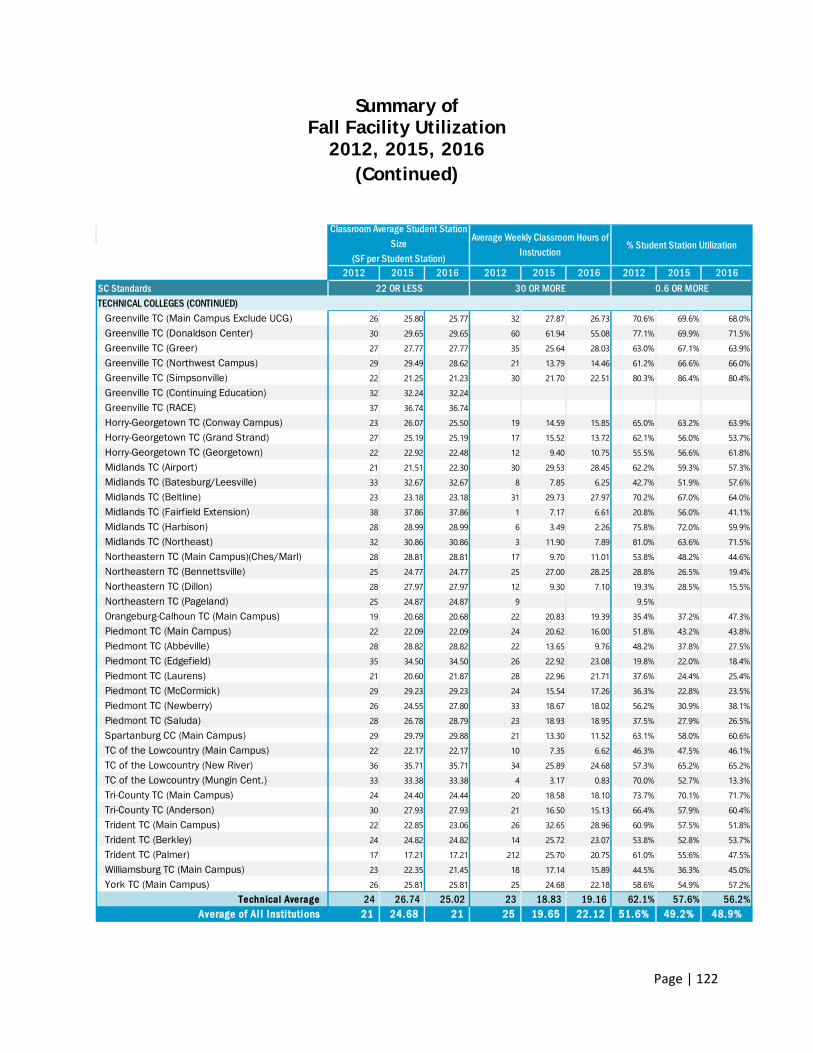
Page | 122
Summary of Fall Facility Utilization
2012, 2015, 2016 (Continued)
2012 2015 2016 2012 2015 2016 2012 2015 2016SC StandardsTECHNICAL COLLEGES (CONTINUED)
Greenville TC (Main Campus Exclude UCG) 26 25.80 25.77 32 27.87 26.73 70.6% 69.6% 68.0%
Greenville TC (Donaldson Center) 30 29.65 29.65 60 61.94 55.08 77.1% 69.9% 71.5%
Greenville TC (Greer) 27 27.77 27.77 35 25.64 28.03 63.0% 67.1% 63.9%
Greenville TC (Northwest Campus) 29 29.49 28.62 21 13.79 14.46 61.2% 66.6% 66.0%
Greenville TC (Simpsonville) 22 21.25 21.23 30 21.70 22.51 80.3% 86.4% 80.4%
Greenville TC (Continuing Education) 32 32.24 32.24
Greenville TC (RACE) 37 36.74 36.74
Horry-Georgetown TC (Conway Campus) 23 26.07 25.50 19 14.59 15.85 65.0% 63.2% 63.9%
Horry-Georgetown TC (Grand Strand) 27 25.19 25.19 17 15.52 13.72 62.1% 56.0% 53.7%
Horry-Georgetown TC (Georgetown) 22 22.92 22.48 12 9.40 10.75 55.5% 56.6% 61.8%
Midlands TC (Airport) 21 21.51 22.30 30 29.53 28.45 62.2% 59.3% 57.3%
Midlands TC (Batesburg/Leesville) 33 32.67 32.67 8 7.85 6.25 42.7% 51.9% 57.6%
Midlands TC (Beltline) 23 23.18 23.18 31 29.73 27.97 70.2% 67.0% 64.0%
Midlands TC (Fairfield Extension) 38 37.86 37.86 1 7.17 6.61 20.8% 56.0% 41.1%
Midlands TC (Harbison) 28 28.99 28.99 6 3.49 2.26 75.8% 72.0% 59.9%
Midlands TC (Northeast) 32 30.86 30.86 3 11.90 7.89 81.0% 63.6% 71.5%
Northeastern TC (Main Campus)(Ches/Marl) 28 28.81 28.81 17 9.70 11.01 53.8% 48.2% 44.6%
Northeastern TC (Bennettsville) 25 24.77 24.77 25 27.00 28.25 28.8% 26.5% 19.4%
Northeastern TC (Dillon) 28 27.97 27.97 12 9.30 7.10 19.3% 28.5% 15.5%
Northeastern TC (Pageland) 25 24.87 24.87 9 9.5%
Orangeburg-Calhoun TC (Main Campus) 19 20.68 20.68 22 20.83 19.39 35.4% 37.2% 47.3%
Piedmont TC (Main Campus) 22 22.09 22.09 24 20.62 16.00 51.8% 43.2% 43.8%
Piedmont TC (Abbeville) 28 28.82 28.82 22 13.65 9.76 48.2% 37.8% 27.5%
Piedmont TC (Edgefield) 35 34.50 34.50 26 22.92 23.08 19.8% 22.0% 18.4%
Piedmont TC (Laurens) 21 20.60 21.87 28 22.96 21.71 37.6% 24.4% 25.4%
Piedmont TC (McCormick) 29 29.23 29.23 24 15.54 17.26 36.3% 22.8% 23.5%
Piedmont TC (Newberry) 26 24.55 27.80 33 18.67 18.02 56.2% 30.9% 38.1%
Piedmont TC (Saluda) 28 26.78 28.79 23 18.93 18.95 37.5% 27.9% 26.5%
Spartanburg CC (Main Campus) 29 29.79 29.88 21 13.30 11.52 63.1% 58.0% 60.6%
TC of the Lowcountry (Main Campus) 22 22.17 22.17 10 7.35 6.62 46.3% 47.5% 46.1%
TC of the Lowcountry (New River) 36 35.71 35.71 34 25.89 24.68 57.3% 65.2% 65.2%
TC of the Lowcountry (Mungin Cent.) 33 33.38 33.38 4 3.17 0.83 70.0% 52.7% 13.3%
Tri-County TC (Main Campus) 24 24.40 24.44 20 18.58 18.10 73.7% 70.1% 71.7%
Tri-County TC (Anderson) 30 27.93 27.93 21 16.50 15.13 66.4% 57.9% 60.4%
Trident TC (Main Campus) 22 22.85 23.06 26 32.65 28.96 60.9% 57.5% 51.8%
Trident TC (Berkley) 24 24.82 24.82 14 25.72 23.07 53.8% 52.8% 53.7%
Trident TC (Palmer) 17 17.21 17.21 212 25.70 20.75 61.0% 55.6% 47.5%
Williamsburg TC (Main Campus) 23 22.35 21.45 18 17.14 15.89 44.5% 36.3% 45.0%
York TC (Main Campus) 26 25.81 25.81 25 24.68 22.18 58.6% 54.9% 57.2%
Technical Average 24 26.74 25.02 23 18.83 19.16 62.1% 57.6% 56.2%Average of Al l Insti tutions 21 24.68 21 25 19.65 22.12 51.6% 49.2% 48.9%
% Student Station Utilization
22 OR LESS 30 OR MORE 0.6 OR MORE
Classroom Average Student Station Size
(SF per Student Station)
Average Weekly Classroom Hours of Instruction
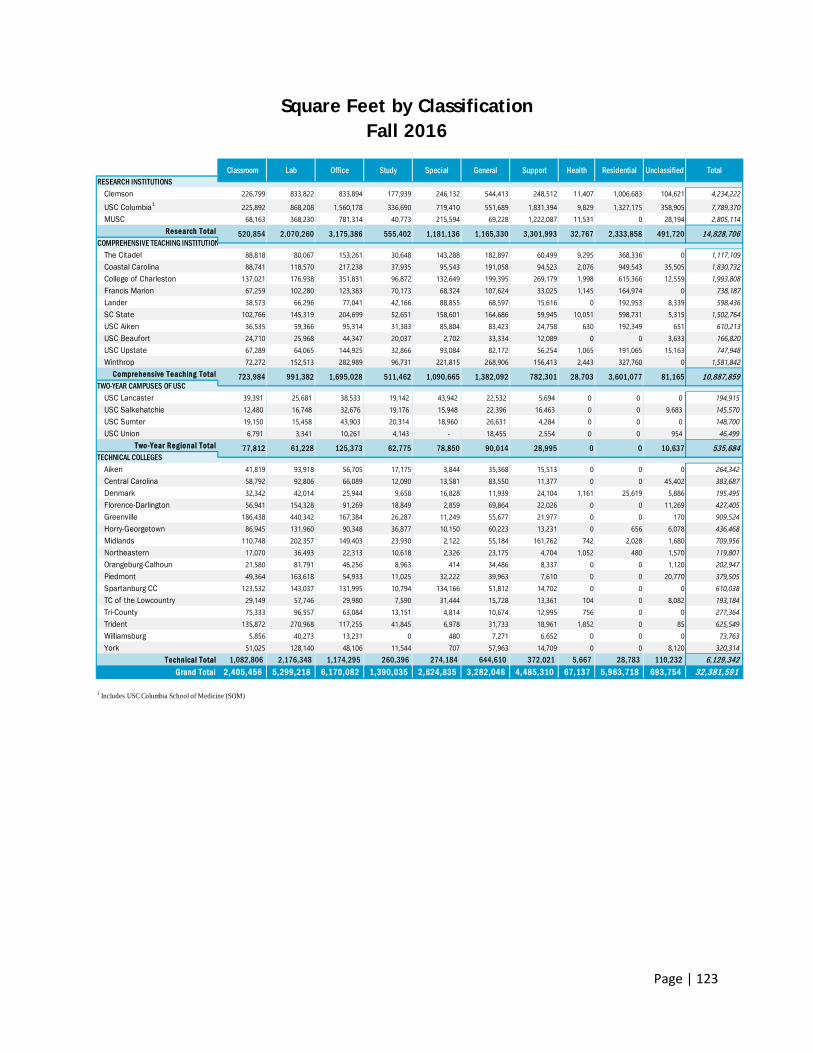
Page | 123
Square Feet by Classification Fall 2016
Clemson 226,799 833,822 833,894 177,939 246,132 544,413 248,512 11,407 1,006,683 104,621 4,234,222
USC Columbia1 225,892 868,208 1,560,178 336,690 719,410 551,689 1,831,394 9,829 1,327,175 358,905 7,789,370MUSC 68,163 368,230 781,314 40,773 215,594 69,228 1,222,087 11,531 0 28,194 2,805,114
Research Total
The Citadel 88,818 80,067 153,261 30,648 143,288 182,897 60,499 9,295 368,336 0 1,117,109Coastal Carolina 88,741 118,570 217,238 37,935 95,543 191,058 94,523 2,076 949,543 35,505 1,830,732College of Charleston 137,021 176,938 351,831 96,872 132,649 199,395 269,179 1,998 615,366 12,559 1,993,808Francis Marion 67,259 102,280 123,383 70,173 68,324 107,624 33,025 1,145 164,974 0 738,187Lander 38,573 66,296 77,041 42,166 88,855 68,597 15,616 0 192,953 8,339 598,436SC State 102,766 145,319 204,699 52,651 158,601 164,686 59,945 10,051 598,731 5,315 1,502,764USC Aiken 36,535 59,366 95,314 31,383 85,804 83,423 24,758 630 192,349 651 610,213USC Beaufort 24,710 25,968 44,347 20,037 2,702 33,334 12,089 0 0 3,633 166,820USC Upstate 67,289 64,065 144,925 32,866 93,084 82,172 56,254 1,065 191,065 15,163 747,948Winthrop 72,272 152,513 282,989 96,731 221,815 268,906 156,413 2,443 327,760 0 1,581,842
Comprehensive Teaching Total
USC Lancaster 39,391 25,681 38,533 19,142 43,942 22,532 5,694 0 0 0 194,915 USC Salkehatchie 12,480 16,748 32,676 19,176 15,948 22,396 16,463 0 0 9,683 145,570 USC Sumter 19,150 15,458 43,903 20,314 18,960 26,631 4,284 0 0 0 148,700 USC Union 6,791 3,341 10,261 4,143 - 18,455 2,554 0 0 954 46,499
Two-Year Regional Total
Aiken 41,819 93,918 56,705 17,175 3,844 35,368 15,513 0 0 0 264,342 Central Carolina 58,792 92,806 66,089 12,090 13,581 83,550 11,377 0 0 45,402 383,687 Denmark 32,342 42,014 25,944 9,658 16,828 11,939 24,104 1,161 25,619 5,886 195,495 Florence-Darlington 56,941 154,328 91,269 18,849 2,859 69,864 22,026 0 0 11,269 427,405 Greenville 186,438 440,342 167,384 26,287 11,249 55,677 21,977 0 0 170 909,524 Horry-Georgetown 86,945 131,960 90,348 36,877 10,150 60,223 13,231 0 656 6,078 436,468 Midlands 110,748 202,357 149,403 23,930 2,122 55,184 161,762 742 2,028 1,680 709,956 Northeastern 17,070 36,493 22,313 10,618 2,326 23,175 4,704 1,052 480 1,570 119,801 Orangeburg-Calhoun 21,580 81,791 46,256 8,963 414 34,486 8,337 0 0 1,120 202,947 Piedmont 49,364 163,618 54,933 11,025 32,222 39,963 7,610 0 0 20,770 379,505 Spartanburg CC 123,532 143,037 131,995 10,794 134,166 51,812 14,702 0 0 0 610,038 TC of the Lowcountry 29,149 57,746 29,980 7,590 31,444 15,728 13,361 104 0 8,082 193,184 Tri-County 75,333 96,557 63,084 13,151 4,814 10,674 12,995 756 0 0 277,364 Trident 135,872 270,968 117,255 41,845 6,978 31,733 18,961 1,852 0 85 625,549 Williamsburg 5,856 40,273 13,231 0 480 7,271 6,652 0 0 0 73,763 York 51,025 128,140 48,106 11,544 707 57,963 14,709 0 0 8,120 320,314
Technical Total 1,082,806 2,176,348 1,174,295 260,396 274,184 644,610 372,021 5,667 28,783 110,232 6,129,342 Grand Total 2,405,456 5,299,218 6,170,082 1,390,035 2,624,835 3,282,046 4,485,310 67,137 5,963,718 693,754 32,381,591
1 Includes USC Columbia School of Medicine (SOM)
COMPREHENSIVE TEACHING INSTITUTION14,828,706
90,014 28,995 0 0 10,637
3,601,077 81,165
TECHNICAL COLLEGES535,684
10,887,859
77,812 61,228 125,373 62,775 78,850
511,462 1,090,665 1,382,092 782,301 28,703TWO-YEAR CAMPUSES OF USC
1,165,330 3,301,993 32,767 2,333,858 491,720520,854 2,070,260 3,175,386 555,402 1,181,136
723,984 991,382 1,695,028
RESEARCH INSTITUTIONSClassroom Lab Office Study Special General Support Health Residential Unclassified Total
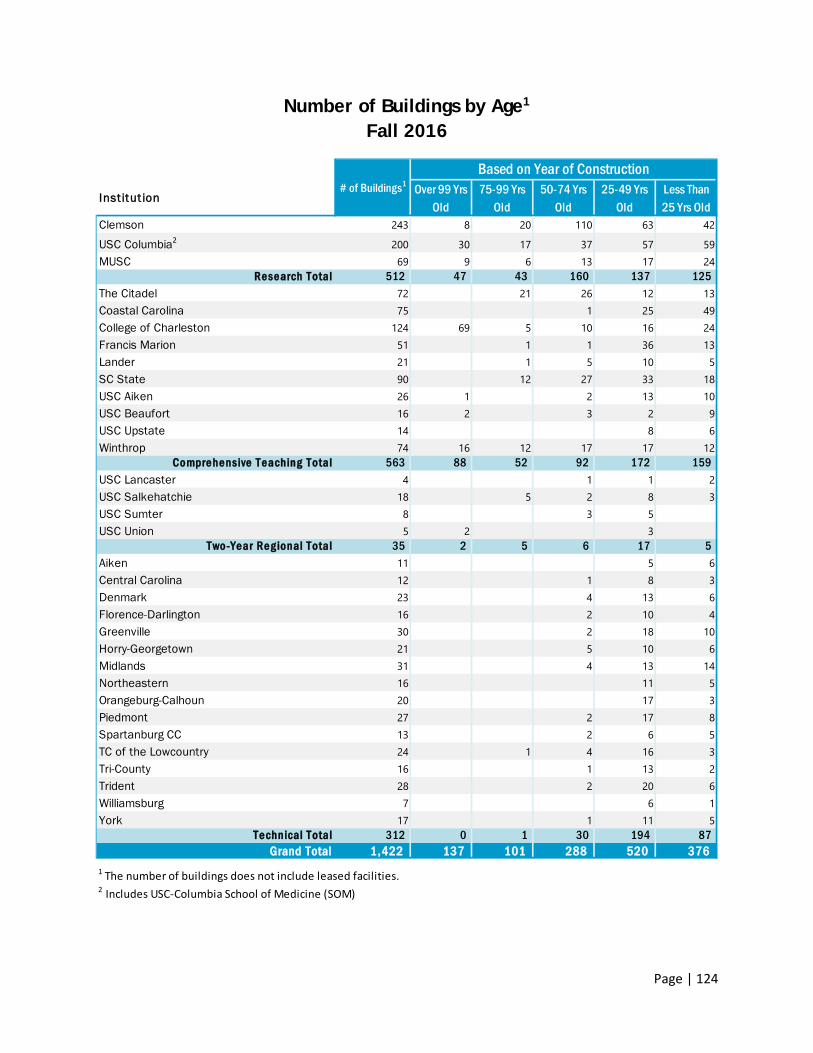
Page | 124
Number of Buildings by Age1 Fall 2016
Inst itut ionOver 99 Yrs
Old75-99 Yrs
Old50-74 Yrs
Old25-49 Yrs
OldLess Than 25 Yrs Old
Clemson 243 8 20 110 63 42
USC Columbia2 200 30 17 37 57 59MUSC 69 9 6 13 17 24
Research Total 512 47 43 160 137 125 The Citadel 72 21 26 12 13Coastal Carolina 75 1 25 49College of Charleston 124 69 5 10 16 24Francis Marion 51 1 1 36 13Lander 21 1 5 10 5SC State 90 12 27 33 18USC Aiken 26 1 2 13 10USC Beaufort 16 2 3 2 9USC Upstate 14 8 6Winthrop 74 16 12 17 17 12
Comprehensive Teaching Total 563 88 52 92 172 159 USC Lancaster 4 1 1 2USC Salkehatchie 18 5 2 8 3USC Sumter 8 3 5USC Union 5 2 3
Two-Year Regional Total 35 2 5 6 17 5 Aiken 11 5 6Central Carolina 12 1 8 3Denmark 23 4 13 6Florence-Darlington 16 2 10 4Greenville 30 2 18 10Horry-Georgetown 21 5 10 6Midlands 31 4 13 14Northeastern 16 11 5Orangeburg-Calhoun 20 17 3Piedmont 27 2 17 8Spartanburg CC 13 2 6 5TC of the Lowcountry 24 1 4 16 3Tri-County 16 1 13 2Trident 28 2 20 6Williamsburg 7 6 1York 17 1 11 5
Technical Total 312 0 1 30 194 87 Grand Total 1,422 137 101 288 520 376
1 The number of buildings does not include leased facilities.2 Includes USC-Columbia School of Medicine (SOM)
Based on Year of Construction# of Buildings1
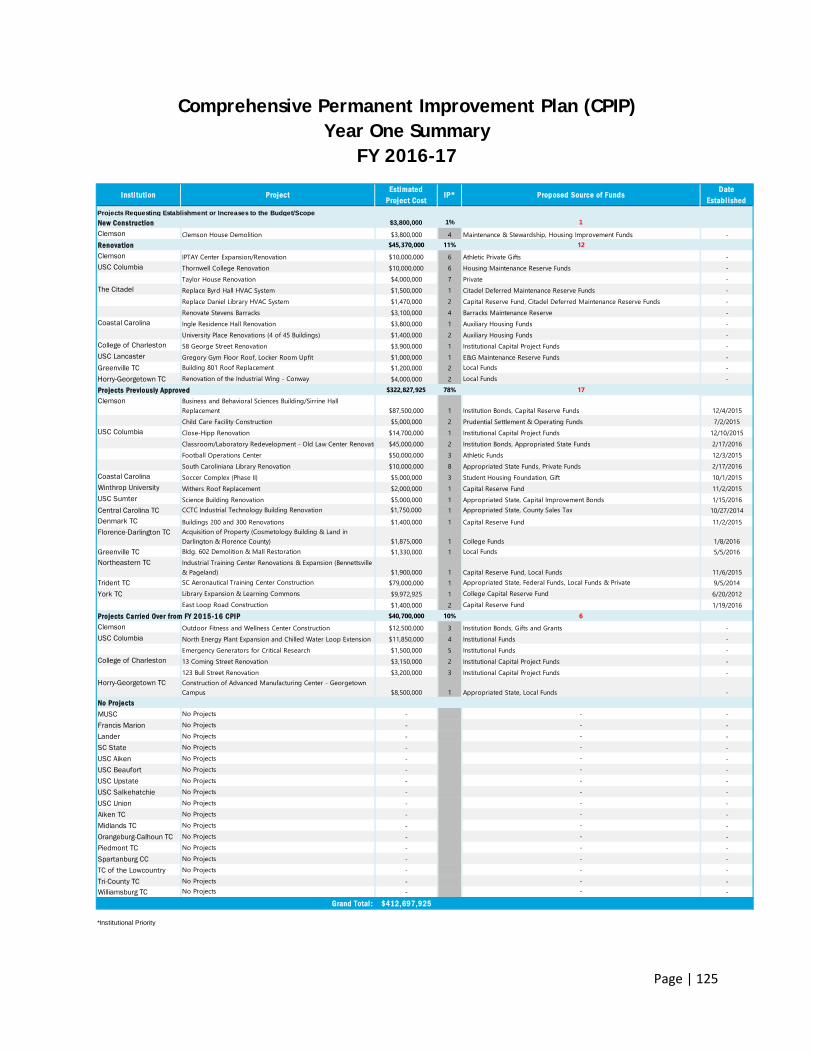
Page | 125
Comprehensive Permanent Improvement Plan (CPIP) Year One Summary
FY 2016-17
Insti tution ProjectEstimated
Project CostIP* Proposed Source of Funds
DateEstabl ished
New Construction $3,800,000 1% 1Clemson Clemson House Demolition $3,800,000 4 Maintenance & Stewardship, Housing Improvement Funds -Renovation $45,370,000 11% 12Clemson IPTAY Center Expansion/Renovation $10,000,000 6 Athletic Private Gifts -USC Columbia Thornwell College Renovation $10,000,000 6 Housing Maintenance Reserve Funds -
Taylor House Renovation $4,000,000 7 Private -The Citadel Replace Byrd Hall HVAC System $1,500,000 1 Citadel Deferred Maintenance Reserve Funds -
Replace Daniel Library HVAC System $1,470,000 2 Capital Reserve Fund, Citadel Deferred Maintenance Reserve Funds -Renovate Stevens Barracks $3,100,000 4 Barracks Maintenance Reserve -
Coastal Carolina Ingle Residence Hall Renovation $3,800,000 1 Auxiliary Housing Funds -University Place Renovations (4 of 45 Buildings) $1,400,000 2 Auxiliary Housing Funds -
College of Charleston 58 George Street Renovation $3,900,000 1 Institutional Capital Project Funds -USC Lancaster Gregory Gym Floor Roof, Locker Room Upfit $1,000,000 1 E&G Maintenance Reserve Funds -Greenville TC Building 801 Roof Replacement $1,200,000 2 Local Funds -Horry-Georgetown TC Renovation of the Industrial Wing - Conway $4,000,000 2 Local Funds -Projects Previously Approved $322,827,925 78% 17Clemson Business and Behavioral Sciences Building/Sirrine Hall
Replacement $87,500,000 1 Institution Bonds, Capital Reserve Funds 12/4/2015Child Care Facility Construction $5,000,000 2 Prudential Settlement & Operating Funds 7/2/2015
USC Columbia Close-Hipp Renovation $14,700,000 1 Institutional Capital Project Funds 12/10/2015Classroom/Laboratory Redevelopment - Old Law Center Renovati $45,000,000 2 Institution Bonds, Appropriated State Funds 2/17/2016Football Operations Center $50,000,000 3 Athletic Funds 12/3/2015South Caroliniana Library Renovation $10,000,000 8 Appropriated State Funds, Private Funds 2/17/2016
Coastal Carolina Soccer Complex (Phase II) $5,000,000 3 Student Housing Foundation, Gift 10/1/2015Winthrop University Withers Roof Replacement $2,000,000 1 Capital Reserve Fund 11/2/2015USC Sumter Science Building Renovation $5,000,000 1 Appropriated State, Capital Improvement Bonds 1/15/2016Central Carolina TC CCTC Industrial Technology Building Renovation $1,750,000 1 Appropriated State, County Sales Tax 10/27/2014Denmark TC Buildings 200 and 300 Renovations $1,400,000 1 Capital Reserve Fund 11/2/2015Florence-Darlington TC Acquisition of Property (Cosmetology Building & Land in
Darlington & Florence County) $1,875,000 1 College Funds 1/8/2016Greenville TC Bldg. 602 Demolition & Mall Restoration $1,330,000 1 Local Funds 5/5/2016Northeastern TC Industrial Training Center Renovations & Expansion (Bennettsville
& Pageland) $1,900,000 1 Capital Reserve Fund, Local Funds 11/6/2015Trident TC SC Aeronautical Training Center Construction $79,000,000 1 Appropriated State, Federal Funds, Local Funds & Private 9/5/2014York TC Library Expansion & Learning Commons $9,972,925 1 College Capital Reserve Fund 6/20/2012
East Loop Road Construction $1,400,000 2 Capital Reserve Fund 1/19/2016Projects Carried Over from FY 2015-16 CPI P $40,700,000 10% 6Clemson Outdoor Fitness and Wellness Center Construction $12,500,000 3 Institution Bonds, Gifts and Grants -USC Columbia North Energy Plant Expansion and Chilled Water Loop Extension $11,850,000 4 Institutional Funds -
Emergency Generators for Critical Research $1,500,000 5 Institutional Funds -College of Charleston 13 Coming Street Renovation $3,150,000 2 Institutional Capital Project Funds -
123 Bull Street Renovation $3,200,000 3 Institutional Capital Project Funds -Horry-Georgetown TC Construction of Advanced Manufacturing Center - Georgetown
Campus $8,500,000 1 Appropriated State, Local Funds -No ProjectsMUSC No Projects - - -Francis Marion No Projects - - -Lander No Projects - - -SC State No Projects - - -USC Aiken No Projects - - -USC Beaufort No Projects - - -USC Upstate No Projects - - -USC Salkehatchie No Projects - - -USC Union No Projects - - -Aiken TC No Projects - - -Midlands TC No Projects - - -Orangeburg-Calhoun TC No Projects - - -Piedmont TC No Projects - - -Spartanburg CC No Projects - - -TC of the Lowcountry No Projects - - -Tri-County TC No Projects - - -Williamsburg TC No Projects - - -
Grand Total : $412,697,925
*Institutional Priority
Projects Requesting Establishment or Increases to the Budget/Scope
Page | 126
Intentionally Blank

Page | 127
Faculty in Higher Education
Faculty are pivotal resources around which postsecondary education revolves. They determine curriculum content, student performance standards, and quality of students’ preparation for careers. Faculty members perform research and development work which can advance this nation’s technological and economic well-being. Through their public service activities, they also contribute to the public good.
Faculty may hold academic rank of professor, associate professor, assistant professor, instructor, or lecturer. Faculty may also include the chancellor/president, provost, vice provosts, deans, directors or the equivalent, as well as associate deans, assistant deans, and executive officers of academic departments if their principal activity is instruction combined with research and/or public service. The designation as "faculty" is separate from the activities to which they may be currently assigned. For example, a newly appointed president of an institution may also be appointed as a faculty member. Graduate and research assistants are not included as faculty.
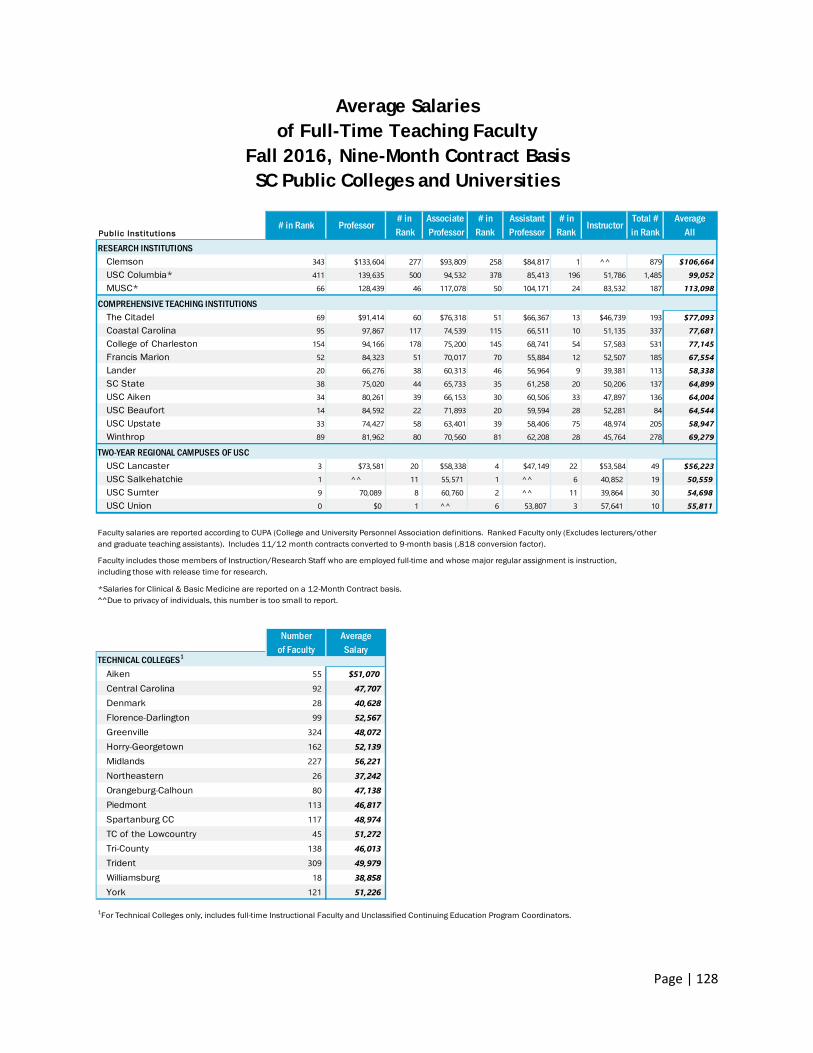
Page | 128
Average Salaries of Full-Time Teaching Faculty
Fall 2016, Nine-Month Contract Basis SC Public Colleges and Universities
Public Institutions
RESEARCH INSTITUTIONSClemson 343 $133,604 277 $93,809 258 $84,817 1 ^^ 879 $106,664
USC Columbia* 411 139,635 500 94,532 378 85,413 196 51,786 1,485 99,052
MUSC* 66 128,439 46 117,078 50 104,171 24 83,532 187 113,098
COMPREHENSIVE TEACHING INSTITUTIONSThe Citadel 69 $91,414 60 $76,318 51 $66,367 13 $46,739 193 $77,093
Coastal Carolina 95 97,867 117 74,539 115 66,511 10 51,135 337 77,681
College of Charleston 154 94,166 178 75,200 145 68,741 54 57,583 531 77,145
Francis Marion 52 84,323 51 70,017 70 55,884 12 52,507 185 67,554
Lander 20 66,276 38 60,313 46 56,964 9 39,381 113 58,338
SC State 38 75,020 44 65,733 35 61,258 20 50,206 137 64,899
USC Aiken 34 80,261 39 66,153 30 60,506 33 47,897 136 64,004
USC Beaufort 14 84,592 22 71,893 20 59,594 28 52,281 84 64,544
USC Upstate 33 74,427 58 63,401 39 58,406 75 48,974 205 58,947
Winthrop 89 81,962 80 70,560 81 62,208 28 45,764 278 69,279
TWO-YEAR REGIONAL CAMPUSES OF USCUSC Lancaster 3 $73,581 20 $58,338 4 $47,149 22 $53,584 49 $56,223
USC Salkehatchie 1 ^^ 11 55,571 1 ^^ 6 40,852 19 50,559
USC Sumter 9 70,089 8 60,760 2 ^^ 11 39,864 30 54,698
USC Union 0 $0 1 ^^ 6 53,807 3 57,641 10 55,811
Faculty salaries are reported according to CUPA (College and University Personnel Association definitions. Ranked Faculty only (Excludes lecturers/other and graduate teaching assistants). Includes 11/12 month contracts converted to 9-month basis (.818 conversion factor).
Faculty includes those members of Instruction/Research Staff who are employed full-time and whose major regular assignment is instruction, including those with release time for research.
*Salaries for Clinical & Basic Medicine are reported on a 12-Month Contract basis.^^Due to privacy of individuals, this number is too small to report.
Aiken 55 $51,070
Central Carolina 92 47,707
Denmark 28 40,628
Florence-Darlington 99 52,567
Greenville 324 48,072
Horry-Georgetown 162 52,139
Midlands 227 56,221
Northeastern 26 37,242
Orangeburg-Calhoun 80 47,138
Piedmont 113 46,817
Spartanburg CC 117 48,974
TC of the Lowcountry 45 51,272
Tri-County 138 46,013
Trident 309 49,979
Williamsburg 18 38,858
York 121 51,226
1For Technical Colleges only, includes full-time Instructional Faculty and Unclassified Continuing Education Program Coordinators.
# in Rank Professor# in
RankAssociate Professor
# in Rank
AssistantProfessor
# inRank
TECHNICAL COLLEGES1
Numberof Faculty
Average Salary
InstructorTotal #in Rank
AverageAll
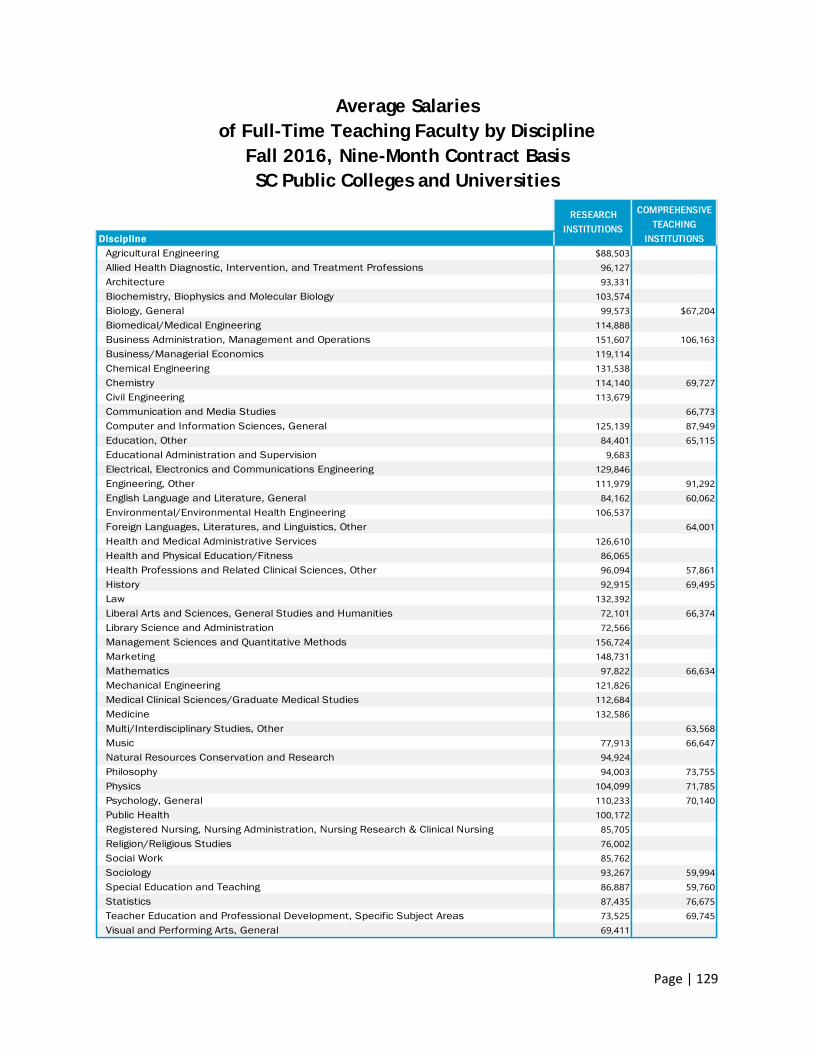
Page | 129
Average Salaries of Full-Time Teaching Faculty by Discipline
Fall 2016, Nine-Month Contract Basis SC Public Colleges and Universities
DisciplineAgricultural Engineering $88,503Allied Health Diagnostic, Intervention, and Treatment Professions 96,127Architecture 93,331Biochemistry, Biophysics and Molecular Biology 103,574Biology, General 99,573 $67,204Biomedical/Medical Engineering 114,888Business Administration, Management and Operations 151,607 106,163Business/Managerial Economics 119,114Chemical Engineering 131,538Chemistry 114,140 69,727Civil Engineering 113,679Communication and Media Studies 66,773Computer and Information Sciences, General 125,139 87,949Education, Other 84,401 65,115Educational Administration and Supervision 9,683Electrical, Electronics and Communications Engineering 129,846Engineering, Other 111,979 91,292English Language and Literature, General 84,162 60,062Environmental/Environmental Health Engineering 106,537Foreign Languages, Literatures, and Linguistics, Other 64,001Health and Medical Administrative Services 126,610Health and Physical Education/Fitness 86,065Health Professions and Related Clinical Sciences, Other 96,094 57,861History 92,915 69,495Law 132,392Liberal Arts and Sciences, General Studies and Humanities 72,101 66,374Library Science and Administration 72,566Management Sciences and Quantitative Methods 156,724Marketing 148,731Mathematics 97,822 66,634Mechanical Engineering 121,826Medical Clinical Sciences/Graduate Medical Studies 112,684Medicine 132,586Multi/Interdisciplinary Studies, Other 63,568Music 77,913 66,647Natural Resources Conservation and Research 94,924Philosophy 94,003 73,755Physics 104,099 71,785Psychology, General 110,233 70,140Public Health 100,172Registered Nursing, Nursing Administration, Nursing Research & Clinical Nursing 85,705Religion/Religious Studies 76,002Social Work 85,762Sociology 93,267 59,994Special Education and Teaching 86,887 59,760Statistics 87,435 76,675Teacher Education and Professional Development, Specific Subject Areas 73,525 69,745Visual and Performing Arts, General 69,411
RESEARCHINSTITUTIONS
COMPREHENSIVETEACHING
INSTITUTIONS
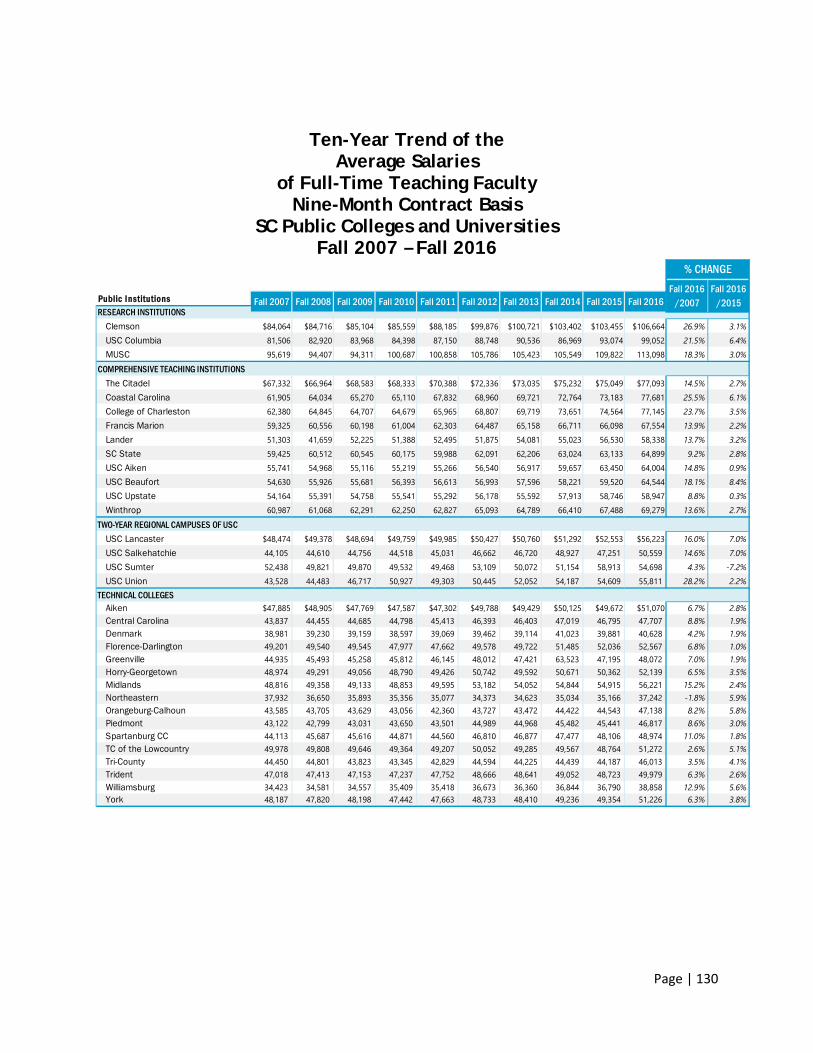
Page | 130
Ten-Year Trend of the Average Salaries
of Full-Time Teaching Faculty Nine-Month Contract Basis
SC Public Colleges and Universities Fall 2007 – Fall 2016
Public I nstitutions
Clemson $84,064 $84,716 $85,104 $85,559 $88,185 $99,876 $100,721 $103,402 $103,455 $106,664 26.9% 3.1%USC Columbia 81,506 82,920 83,968 84,398 87,150 88,748 90,536 86,969 93,074 99,052 21.5% 6.4%MUSC 95,619 94,407 94,311 100,687 100,858 105,786 105,423 105,549 109,822 113,098 18.3% 3.0%
COMPREHENSIVE TEACHING INSTITUTIONSThe Citadel $67,332 $66,964 $68,583 $68,333 $70,388 $72,336 $73,035 $75,232 $75,049 $77,093 14.5% 2.7%Coastal Carolina 61,905 64,034 65,270 65,110 67,832 68,960 69,721 72,764 73,183 77,681 25.5% 6.1%College of Charleston 62,380 64,845 64,707 64,679 65,965 68,807 69,719 73,651 74,564 77,145 23.7% 3.5%Francis Marion 59,325 60,556 60,198 61,004 62,303 64,487 65,158 66,711 66,098 67,554 13.9% 2.2%Lander 51,303 41,659 52,225 51,388 52,495 51,875 54,081 55,023 56,530 58,338 13.7% 3.2%SC State 59,425 60,512 60,545 60,175 59,988 62,091 62,206 63,024 63,133 64,899 9.2% 2.8%USC Aiken 55,741 54,968 55,116 55,219 55,266 56,540 56,917 59,657 63,450 64,004 14.8% 0.9%USC Beaufort 54,630 55,926 55,681 56,393 56,613 56,993 57,596 58,221 59,520 64,544 18.1% 8.4%USC Upstate 54,164 55,391 54,758 55,541 55,292 56,178 55,592 57,913 58,746 58,947 8.8% 0.3%Winthrop 60,987 61,068 62,291 62,250 62,827 65,093 64,789 66,410 67,488 69,279 13.6% 2.7%
TWO-YEAR REGIONAL CAMPUSES OF USCUSC Lancaster $48,474 $49,378 $48,694 $49,759 $49,985 $50,427 $50,760 $51,292 $52,553 $56,223 16.0% 7.0%USC Salkehatchie 44,105 44,610 44,756 44,518 45,031 46,662 46,720 48,927 47,251 50,559 14.6% 7.0%USC Sumter 52,438 49,821 49,870 49,532 49,468 53,109 50,072 51,154 58,913 54,698 4.3% -7.2%USC Union 43,528 44,483 46,717 50,927 49,303 50,445 52,052 54,187 54,609 55,811 28.2% 2.2%
TECHNICAL COLLEGESAiken $47,885 $48,905 $47,769 $47,587 $47,302 $49,788 $49,429 $50,125 $49,672 $51,070 6.7% 2.8%Central Carolina 43,837 44,455 44,685 44,798 45,413 46,393 46,403 47,019 46,795 47,707 8.8% 1.9%Denmark 38,981 39,230 39,159 38,597 39,069 39,462 39,114 41,023 39,881 40,628 4.2% 1.9%Florence-Darlington 49,201 49,540 49,545 47,977 47,662 49,578 49,722 51,485 52,036 52,567 6.8% 1.0%Greenville 44,935 45,493 45,258 45,812 46,145 48,012 47,421 63,523 47,195 48,072 7.0% 1.9%Horry-Georgetown 48,974 49,291 49,056 48,790 49,426 50,742 49,592 50,671 50,362 52,139 6.5% 3.5%Midlands 48,816 49,358 49,133 48,853 49,595 53,182 54,052 54,844 54,915 56,221 15.2% 2.4%Northeastern 37,932 36,650 35,893 35,356 35,077 34,373 34,623 35,034 35,166 37,242 -1.8% 5.9%Orangeburg-Calhoun 43,585 43,705 43,629 43,056 42,360 43,727 43,472 44,422 44,543 47,138 8.2% 5.8%Piedmont 43,122 42,799 43,031 43,650 43,501 44,989 44,968 45,482 45,441 46,817 8.6% 3.0%Spartanburg CC 44,113 45,687 45,616 44,871 44,560 46,810 46,877 47,477 48,106 48,974 11.0% 1.8%TC of the Lowcountry 49,978 49,808 49,646 49,364 49,207 50,052 49,285 49,567 48,764 51,272 2.6% 5.1%Tri-County 44,450 44,801 43,823 43,345 42,829 44,594 44,225 44,439 44,187 46,013 3.5% 4.1%Trident 47,018 47,413 47,153 47,237 47,752 48,666 48,641 49,052 48,723 49,979 6.3% 2.6%Williamsburg 34,423 34,581 34,557 35,409 35,418 36,673 36,360 36,844 36,790 38,858 12.9% 5.6%York 48,187 47,820 48,198 47,442 47,663 48,733 48,410 49,236 49,354 51,226 6.3% 3.8%
RESEARCH INSTITUTIONSFall 2007 Fall 2008 Fall 2009 Fall 2010 Fall 2011 Fall 2012 Fall 2013 Fall 2014 Fall 2015 Fall 2016
% CHANGEFall 2016
/2007Fall 2016
/2015
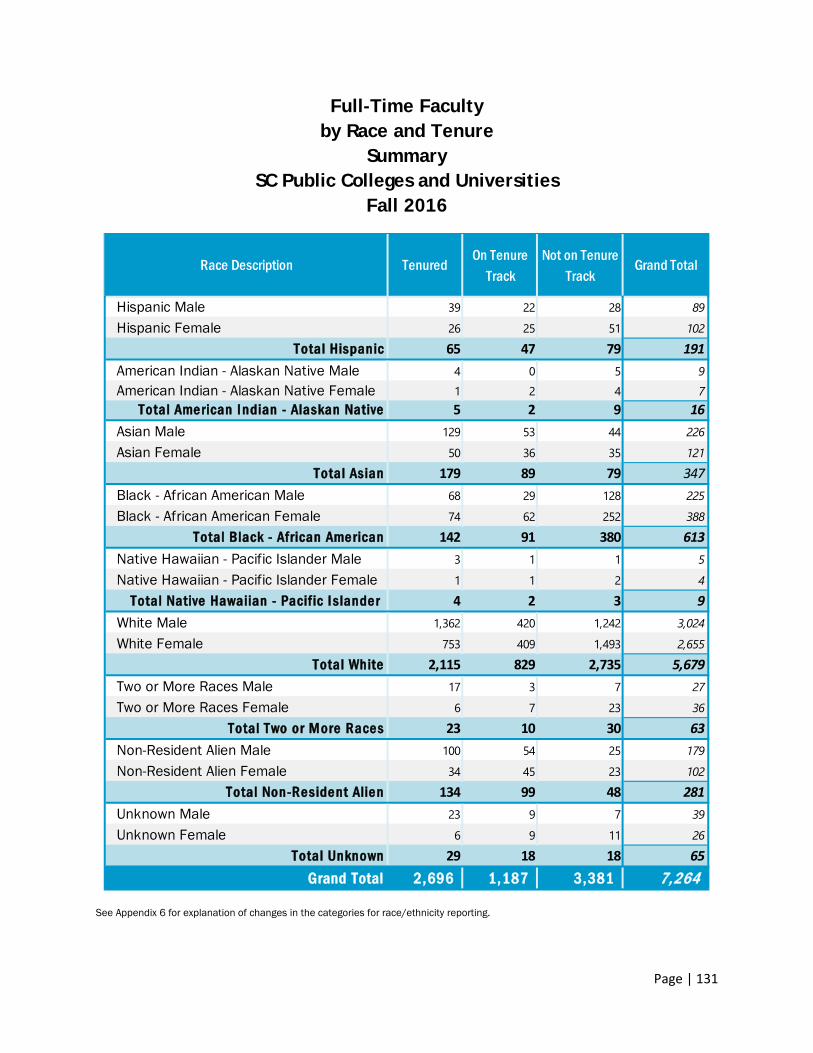
Page | 131
Full-Time Faculty by Race and Tenure
Summary SC Public Colleges and Universities
Fall 2016
See Appendix 6 for explanation of changes in the categories for race/ethnicity reporting.
Race Description Tenured On Tenure
Track Not on Tenure
Track Grand Total
Hispanic Male 39 22 28 89
Hispanic Female 26 25 51 102
Total Hispanic 65 47 79 191American Indian - Alaskan Native Male 4 0 5 9American Indian - Alaskan Native Female 1 2 4 7
Total American I ndian - Alaskan Native 5 2 9 16Asian Male 129 53 44 226
Asian Female 50 36 35 121
Total Asian 179 89 79 347Black - African American Male 68 29 128 225
Black - African American Female 74 62 252 388
Total Black - African American 142 91 380 613Native Hawaiian - Pacific Islander Male 3 1 1 5
Native Hawaiian - Pacific Islander Female 1 1 2 4
Total Native Hawaiian - Pacif ic I slander 4 2 3 9White Male 1,362 420 1,242 3,024
White Female 753 409 1,493 2,655
Total White 2,115 829 2,735 5,679Two or More Races Male 17 3 7 27
Two or More Races Female 6 7 23 36
Total Two or More Races 23 10 30 63Non-Resident Alien Male 100 54 25 179
Non-Resident Alien Female 34 45 23 102
Total Non-Resident Alien 134 99 48 281Unknown Male 23 9 7 39
Unknown Female 6 9 11 26
Total Unknown 29 18 18 65Grand Total 2,696 1,187 3,381 7,264
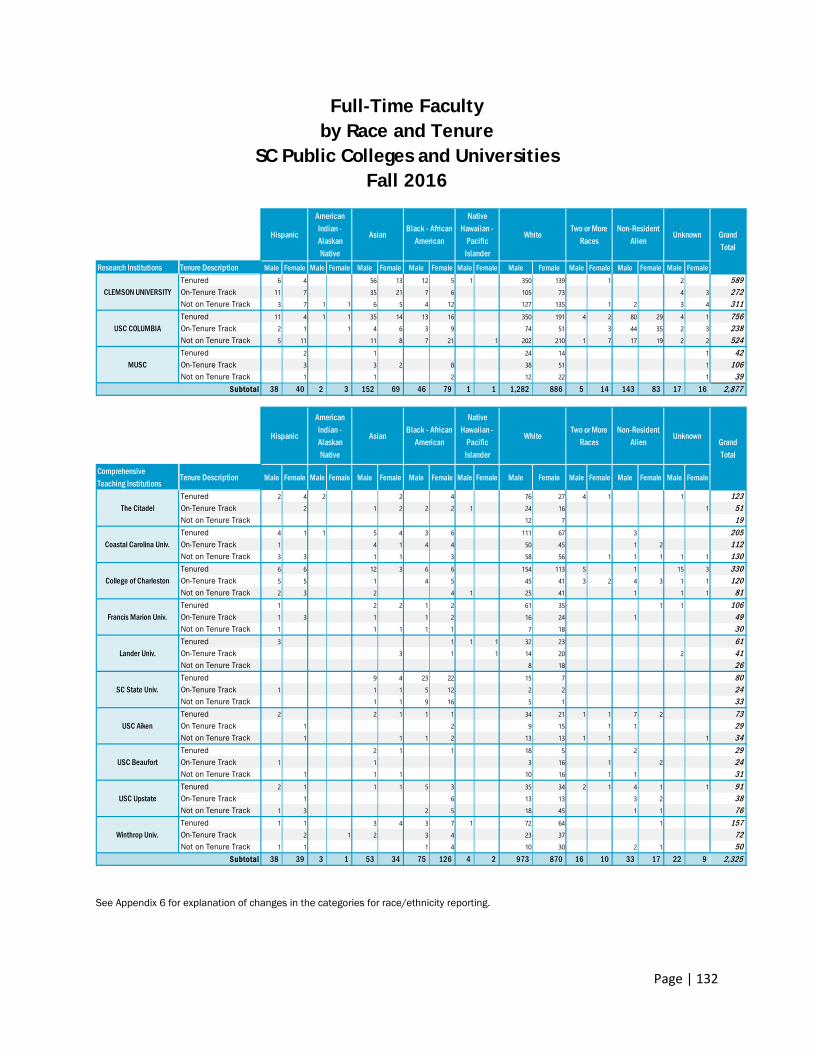
Page | 132
Full-Time Faculty by Race and Tenure
SC Public Colleges and Universities Fall 2016
See Appendix 6 for explanation of changes in the categories for race/ethnicity reporting.
Research Institutions Tenure Description Male Female Male Female Male Female Male Female Male Female Male Female Male Female Male Female Male FemaleTenured 6 4 56 13 12 5 1 350 139 1 2 589On-Tenure Track 11 7 35 21 7 6 105 73 4 3 272Not on Tenure Track 3 7 1 1 6 5 4 12 127 135 1 2 3 4 311Tenured 11 4 1 1 35 14 13 16 350 191 4 2 80 29 4 1 756On-Tenure Track 2 1 1 4 6 3 9 74 51 3 44 35 2 3 238Not on Tenure Track 5 11 11 8 7 21 1 202 210 1 7 17 19 2 2 524Tenured 2 1 24 14 1 42On-Tenure Track 3 3 2 8 38 51 1 106Not on Tenure Track 1 1 2 12 22 1 39
38 40 2 3 152 69 46 79 1 1 1,282 886 5 14 143 83 17 16 2,877
Comprehensive Teaching Institutions
Tenure Description Male Female Male Female Male Female Male Female Male Female Male Female Male Female Male Female Male Female
Tenured 2 4 2 2 4 76 27 4 1 1 123On-Tenure Track 2 1 2 2 2 1 24 16 1 51Not on Tenure Track 12 7 19Tenured 4 1 1 5 4 3 6 111 67 3 205On-Tenure Track 1 4 1 4 4 50 45 1 2 112Not on Tenure Track 3 3 1 1 3 58 56 1 1 1 1 1 130Tenured 6 6 12 3 6 6 154 113 5 1 15 3 330On-Tenure Track 5 5 1 4 5 45 41 3 2 4 3 1 1 120Not on Tenure Track 2 3 2 4 1 25 41 1 1 1 81Tenured 1 2 2 1 2 61 35 1 1 106On-Tenure Track 1 3 1 1 2 16 24 1 49Not on Tenure Track 1 1 1 1 1 7 18 30Tenured 3 1 1 1 32 23 61On-Tenure Track 3 1 1 14 20 2 41Not on Tenure Track 8 18 26Tenured 9 4 23 22 15 7 80On-Tenure Track 1 1 1 5 12 2 2 24Not on Tenure Track 1 1 9 16 5 1 33Tenured 2 2 1 1 1 34 21 1 1 7 2 73On Tenure Track 1 2 9 15 1 1 29Not on Tenure Track 1 1 1 2 13 13 1 1 1 34Tenured 2 1 1 18 5 2 29On-Tenure Track 1 1 3 16 1 2 24Not on Tenure Track 1 1 1 10 16 1 1 31Tenured 2 1 1 1 5 3 35 34 2 1 4 1 1 91On-Tenure Track 1 6 13 13 3 2 38Not on Tenure Track 1 3 2 5 18 45 1 1 76Tenured 1 1 3 4 3 7 1 72 64 1 157On-Tenure Track 2 1 2 3 4 23 37 72Not on Tenure Track 1 1 1 4 10 30 2 1 50
38 39 3 1 53 34 75 126 4 2 973 870 16 10 33 17 22 9 2,325
Hispanic
Native Hawaiian -
Pacific Islander
Unknown White
American Indian - Alaskan Native
Asian Black - African
American
Unknown
Two or More Races
Non-Resident Alien
Grand Total
Grand Total
The Citadel
Coastal Carolina Univ.
Subtotal
CLEMSON UNIVERSITY
USC COLUMBIA
MUSC
American Indian - Alaskan Native
Asian Black - African
American Hispanic
Native Hawaiian -
Pacific Islander
Two or More Races
White Non-Resident
Alien
USC Beaufort
USC Upstate
Winthrop Univ.
Subtotal
College of Charleston
Francis Marion Univ.
Lander Univ.
SC State Univ.
USC Aiken
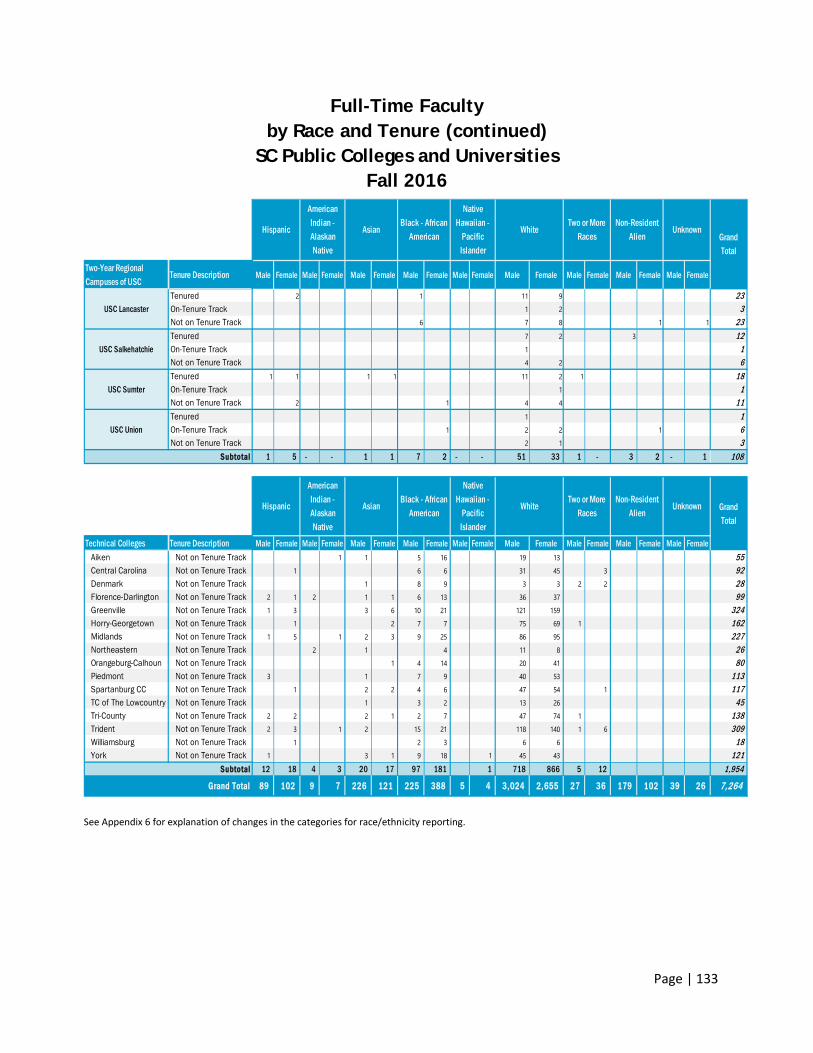
Page | 133
Full-Time Faculty by Race and Tenure (continued)
SC Public Colleges and Universities Fall 2016
See Appendix 6 for explanation of changes in the categories for race/ethnicity reporting.
Two-Year Regional Campuses of USC
Tenure Description Male Female Male Female Male Female Male Female Male Female Male Female Male Female Male Female Male Female
Tenured 2 1 11 9 23On-Tenure Track 1 2 3Not on Tenure Track 6 7 8 1 1 23Tenured 7 2 3 12On-Tenure Track 1 1Not on Tenure Track 4 2 6Tenured 1 1 1 1 11 2 1 18On-Tenure Track 1 1Not on Tenure Track 2 1 4 4 11Tenured 1 1On-Tenure Track 1 2 2 1 6Not on Tenure Track 2 1 3
1 5 - - 1 1 7 2 - - 51 33 1 - 3 2 - 1 108
Technical Colleges Tenure Description Male Female Male Female Male Female Male Female Male Female Male Female Male Female Male Female Male FemaleAiken Not on Tenure Track 1 1 5 16 19 13 55Central Carolina Not on Tenure Track 1 6 6 31 45 3 92Denmark Not on Tenure Track 1 8 9 3 3 2 2 28Florence-Darlington Not on Tenure Track 2 1 2 1 1 6 13 36 37 99Greenville Not on Tenure Track 1 3 3 6 10 21 121 159 324Horry-Georgetown Not on Tenure Track 1 2 7 7 75 69 1 162Midlands Not on Tenure Track 1 5 1 2 3 9 25 86 95 227Northeastern Not on Tenure Track 2 1 4 11 8 26Orangeburg-Calhoun Not on Tenure Track 1 4 14 20 41 80Piedmont Not on Tenure Track 3 1 7 9 40 53 113Spartanburg CC Not on Tenure Track 1 2 2 4 6 47 54 1 117TC of The Lowcountry Not on Tenure Track 1 3 2 13 26 45Tri-County Not on Tenure Track 2 2 2 1 2 7 47 74 1 138Trident Not on Tenure Track 2 3 1 2 15 21 118 140 1 6 309Williamsburg Not on Tenure Track 1 2 3 6 6 18York Not on Tenure Track 1 3 1 9 18 1 45 43 121
12 18 4 3 20 17 97 181 1 718 866 5 12 1,954
89 102 9 7 226 121 225 388 5 4 3,024 2,655 27 36 179 102 39 26 7,264
American Indian - Alaskan Native
Asian Black - African
American Hispanic
Native Hawaiian -
Pacific Islander
Unknown White
Unknown White Two or More
Races Non-Resident
Alien
Subtotal
Grand Total
Subtotal
Grand Total
Grand Total
USC Lancaster
USC Salkehatchie
USC Sumter
USC Union
American Indian - Alaskan Native
Asian Black - African
American Hispanic
Native Hawaiian -
Pacific Islander
Two or More Races
Non-Resident Alien
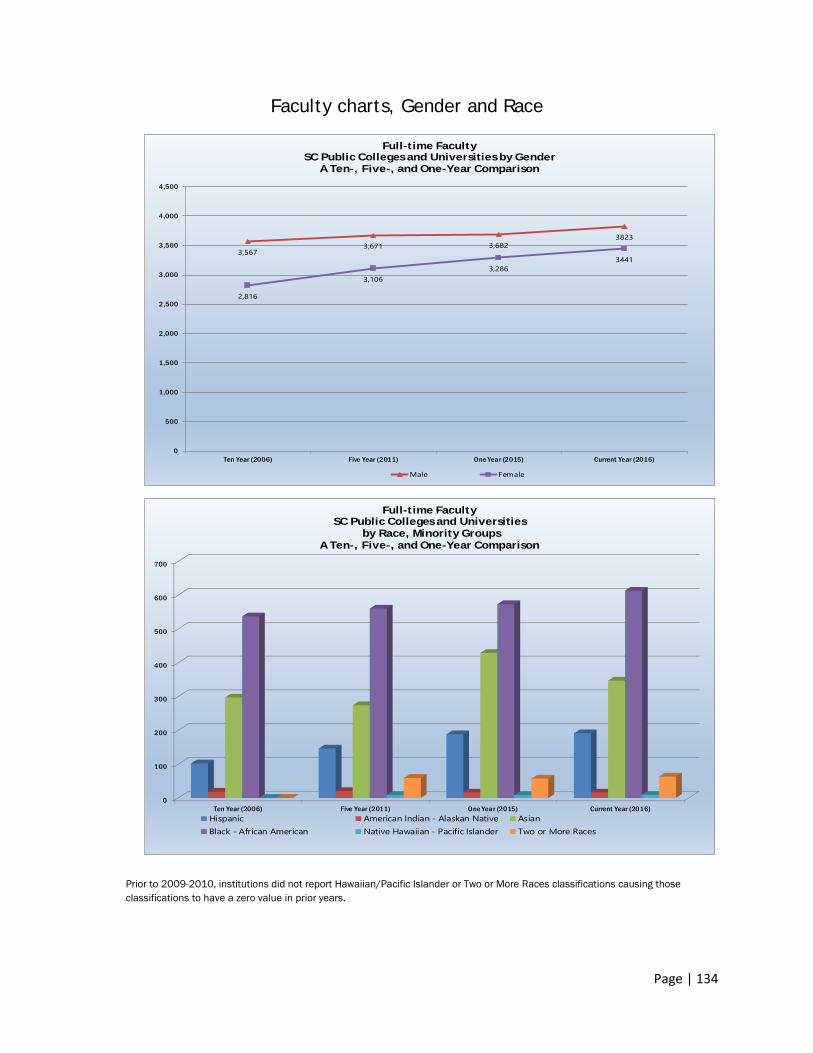
Page | 134
Faculty charts, Gender and Race
Prior to 2009-2010, institutions did not report Hawaiian/Pacific Islander or Two or More Races classifications causing those classifications to have a zero value in prior years.
0
100
200
300
400
500
600
700
Ten Year (2006) Five Year (2011) One Year (2015) Current Year (2016)
Full-time FacultySC Public Colleges and Universities
by Race, Minority GroupsA Ten-, Five-, and One-Year Comparison
Hispanic American Indian - Alaskan Native AsianBlack - African American Native Hawaiian - Pacific Islander Two or More Races
3,5673,671 3,682
3823
2,816
3,1063,286
3441
0
500
1,000
1,500
2,000
2,500
3,000
3,500
4,000
4,500
Ten Year (2006) Five Year (2011) One Year (2015) Current Year (2016)
Full-time FacultySC Public Colleges and Universities by Gender
A Ten-, Five-, and One-Year Comparison
Male Female
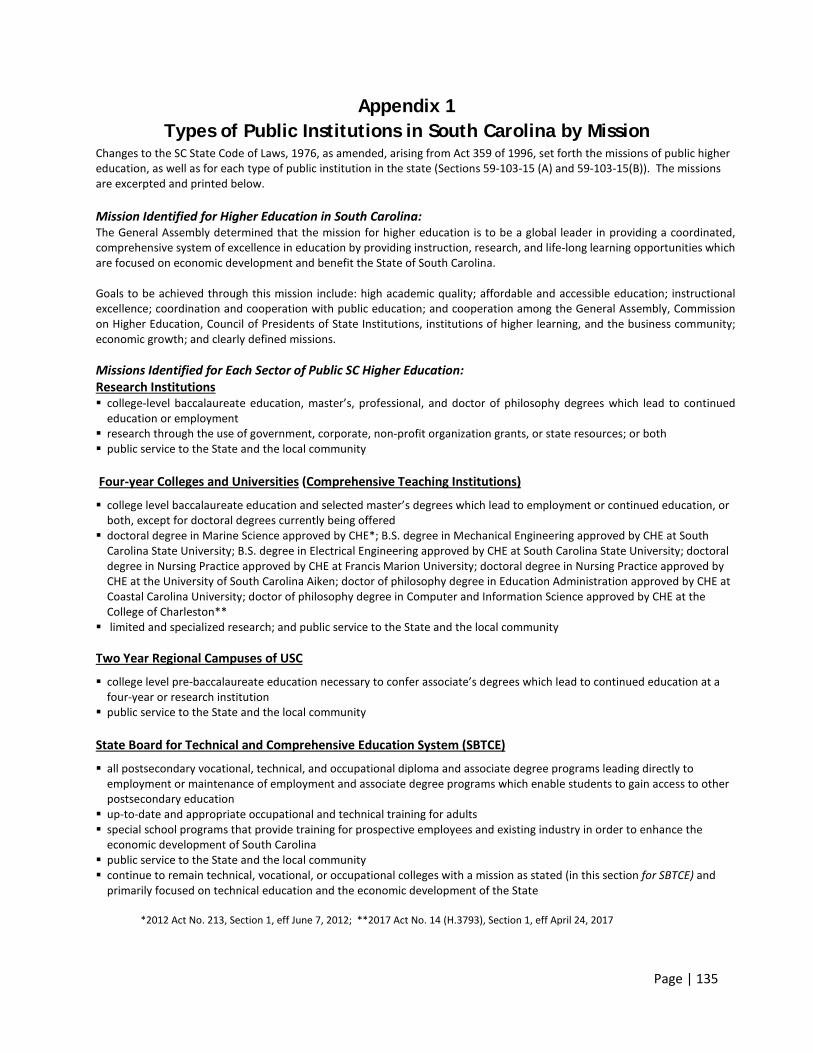
Page | 135
Appendix 1 Types of Public Institutions in South Carolina by Mission
Changes to the SC State Code of Laws, 1976, as amended, arising from Act 359 of 1996, set forth the missions of public higher education, as well as for each type of public institution in the state (Sections 59-103-15 (A) and 59-103-15(B)). The missions are excerpted and printed below.
Mission Identified for Higher Education in South Carolina: The General Assembly determined that the mission for higher education is to be a global leader in providing a coordinated, comprehensive system of excellence in education by providing instruction, research, and life-long learning opportunities which are focused on economic development and benefit the State of South Carolina.
Goals to be achieved through this mission include: high academic quality; affordable and accessible education; instructional excellence; coordination and cooperation with public education; and cooperation among the General Assembly, Commission on Higher Education, Council of Presidents of State Institutions, institutions of higher learning, and the business community; economic growth; and clearly defined missions.
Missions Identified for Each Sector of Public SC Higher Education: Research Institutions college-level baccalaureate education, master’s, professional, and doctor of philosophy degrees which lead to continued
education or employment research through the use of government, corporate, non-profit organization grants, or state resources; or both public service to the State and the local community
Four-year Colleges and Universities (Comprehensive Teaching Institutions)
college level baccalaureate education and selected master’s degrees which lead to employment or continued education, orboth, except for doctoral degrees currently being offered
doctoral degree in Marine Science approved by CHE*; B.S. degree in Mechanical Engineering approved by CHE at SouthCarolina State University; B.S. degree in Electrical Engineering approved by CHE at South Carolina State University; doctoraldegree in Nursing Practice approved by CHE at Francis Marion University; doctoral degree in Nursing Practice approved byCHE at the University of South Carolina Aiken; doctor of philosophy degree in Education Administration approved by CHE atCoastal Carolina University; doctor of philosophy degree in Computer and Information Science approved by CHE at theCollege of Charleston**
limited and specialized research; and public service to the State and the local community
Two Year Regional Campuses of USC
college level pre-baccalaureate education necessary to confer associate’s degrees which lead to continued education at afour-year or research institution
public service to the State and the local community
State Board for Technical and Comprehensive Education System (SBTCE)
all postsecondary vocational, technical, and occupational diploma and associate degree programs leading directly toemployment or maintenance of employment and associate degree programs which enable students to gain access to otherpostsecondary education
up-to-date and appropriate occupational and technical training for adults special school programs that provide training for prospective employees and existing industry in order to enhance the
economic development of South Carolina public service to the State and the local community continue to remain technical, vocational, or occupational colleges with a mission as stated (in this section for SBTCE) and
primarily focused on technical education and the economic development of the State
*2012 Act No. 213, Section 1, eff June 7, 2012; **2017 Act No. 14 (H.3793), Section 1, eff April 24, 2017
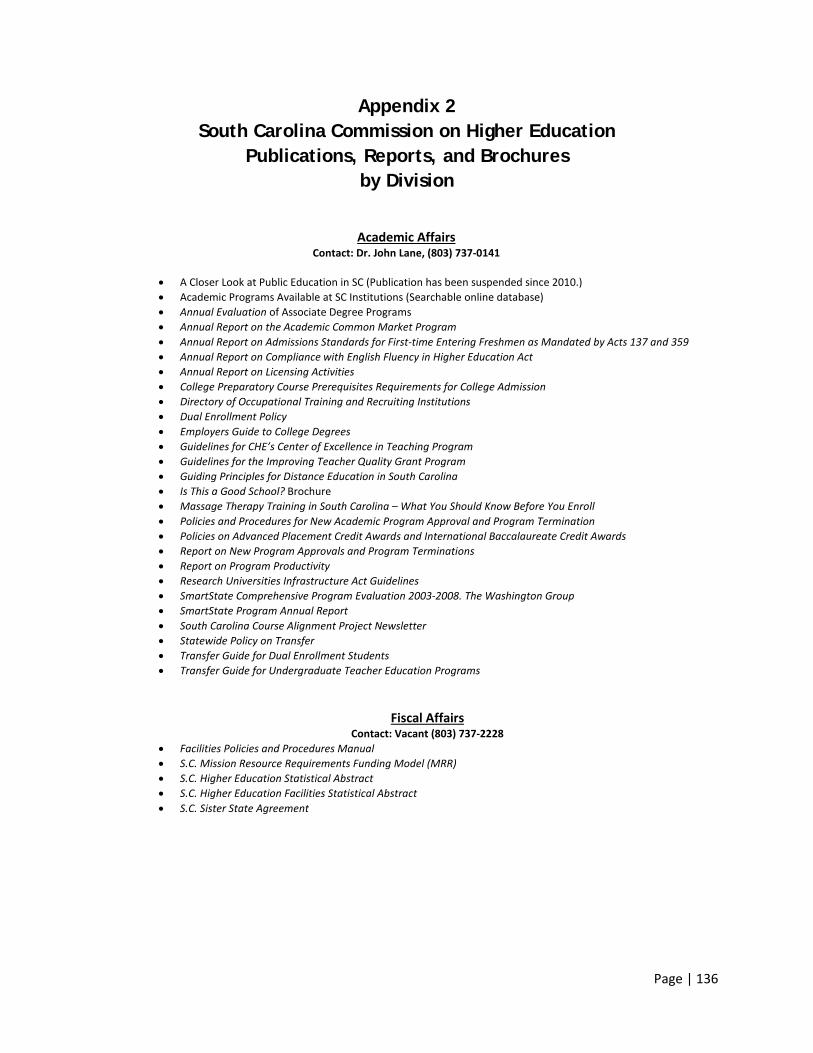
Page | 136
Appendix 2 South Carolina Commission on Higher Education
Publications, Reports, and Brochures by Division
Academic Affairs
Contact: Dr. John Lane, (803) 737-0141
• A Closer Look at Public Education in SC (Publication has been suspended since 2010.) • Academic Programs Available at SC Institutions (Searchable online database) • Annual Evaluation of Associate Degree Programs • Annual Report on the Academic Common Market Program • Annual Report on Admissions Standards for First-time Entering Freshmen as Mandated by Acts 137 and 359 • Annual Report on Compliance with English Fluency in Higher Education Act • Annual Report on Licensing Activities • College Preparatory Course Prerequisites Requirements for College Admission • Directory of Occupational Training and Recruiting Institutions • Dual Enrollment Policy • Employers Guide to College Degrees • Guidelines for CHE’s Center of Excellence in Teaching Program • Guidelines for the Improving Teacher Quality Grant Program • Guiding Principles for Distance Education in South Carolina • Is This a Good School? Brochure • Massage Therapy Training in South Carolina – What You Should Know Before You Enroll • Policies and Procedures for New Academic Program Approval and Program Termination • Policies on Advanced Placement Credit Awards and International Baccalaureate Credit Awards • Report on New Program Approvals and Program Terminations • Report on Program Productivity • Research Universities Infrastructure Act Guidelines • SmartState Comprehensive Program Evaluation 2003-2008. The Washington Group • SmartState Program Annual Report • South Carolina Course Alignment Project Newsletter • Statewide Policy on Transfer • Transfer Guide for Dual Enrollment Students • Transfer Guide for Undergraduate Teacher Education Programs
Fiscal Affairs Contact: Vacant (803) 737-2228
• Facilities Policies and Procedures Manual • S.C. Mission Resource Requirements Funding Model (MRR) • S.C. Higher Education Statistical Abstract • S.C. Higher Education Facilities Statistical Abstract • S.C. Sister State Agreement
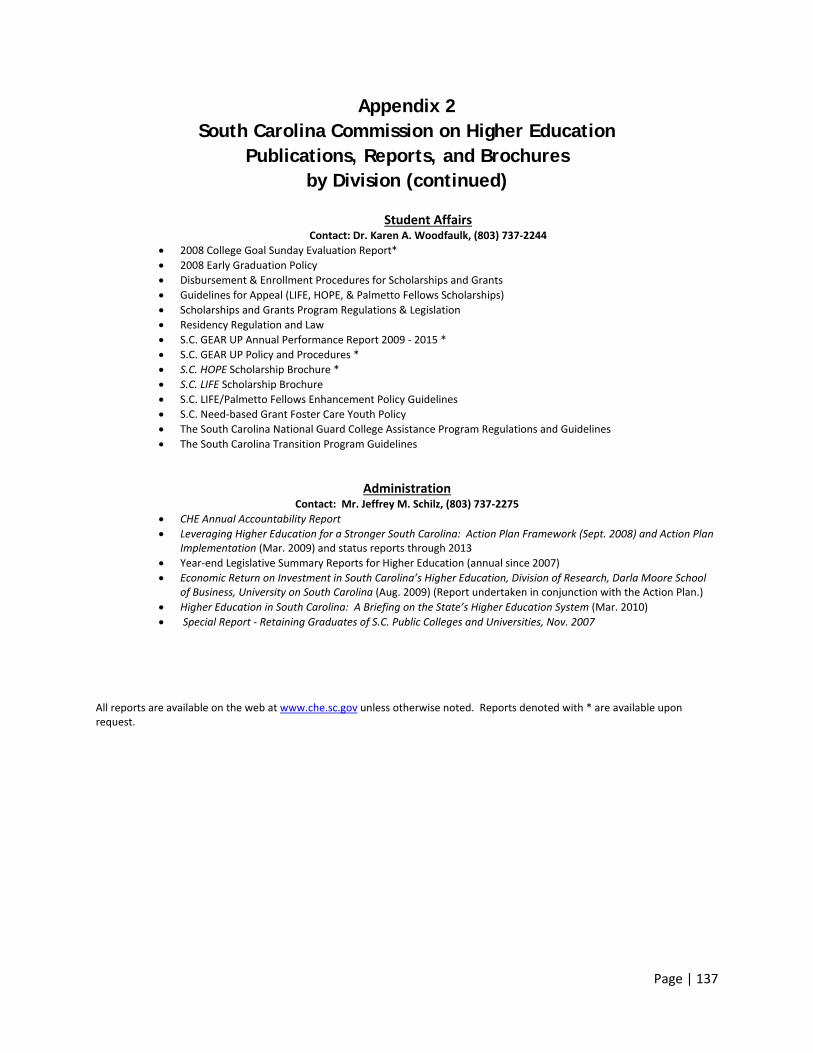
Page | 137
Appendix 2 South Carolina Commission on Higher Education
Publications, Reports, and Brochures by Division (continued)
Student Affairs Contact: Dr. Karen A. Woodfaulk, (803) 737-2244
• 2008 College Goal Sunday Evaluation Report* • 2008 Early Graduation Policy • Disbursement & Enrollment Procedures for Scholarships and Grants • Guidelines for Appeal (LIFE, HOPE, & Palmetto Fellows Scholarships) • Scholarships and Grants Program Regulations & Legislation • Residency Regulation and Law • S.C. GEAR UP Annual Performance Report 2009 - 2015 * • S.C. GEAR UP Policy and Procedures * • S.C. HOPE Scholarship Brochure * • S.C. LIFE Scholarship Brochure • S.C. LIFE/Palmetto Fellows Enhancement Policy Guidelines • S.C. Need-based Grant Foster Care Youth Policy • The South Carolina National Guard College Assistance Program Regulations and Guidelines • The South Carolina Transition Program Guidelines
Administration Contact: Mr. Jeffrey M. Schilz, (803) 737-2275
• CHE Annual Accountability Report • Leveraging Higher Education for a Stronger South Carolina: Action Plan Framework (Sept. 2008) and Action Plan
Implementation (Mar. 2009) and status reports through 2013 • Year-end Legislative Summary Reports for Higher Education (annual since 2007) • Economic Return on Investment in South Carolina’s Higher Education, Division of Research, Darla Moore School
of Business, University on South Carolina (Aug. 2009) (Report undertaken in conjunction with the Action Plan.) • Higher Education in South Carolina: A Briefing on the State’s Higher Education System (Mar. 2010) • Special Report - Retaining Graduates of S.C. Public Colleges and Universities, Nov. 2007
All reports are available on the web at www.che.sc.gov unless otherwise noted. Reports denoted with * are available upon request.
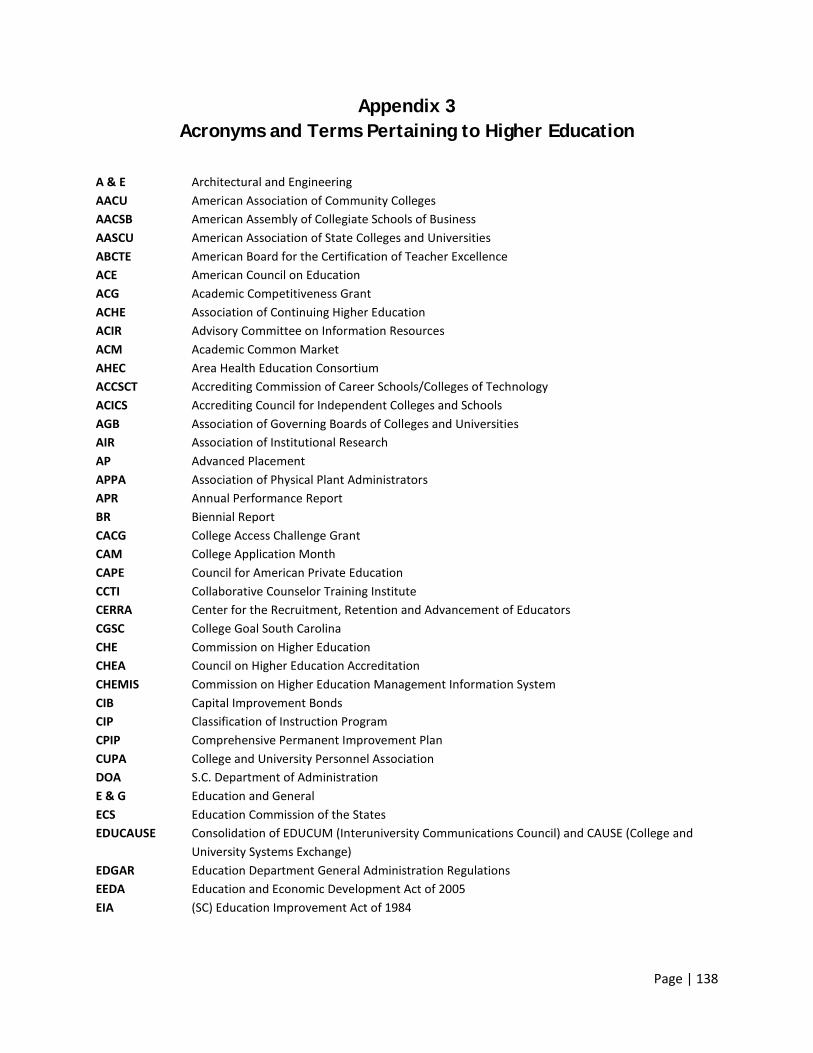
Page | 138
Appendix 3 Acronyms and Terms Pertaining to Higher Education
A & E Architectural and Engineering AACU American Association of Community Colleges AACSB American Assembly of Collegiate Schools of Business AASCU American Association of State Colleges and Universities ABCTE American Board for the Certification of Teacher Excellence ACE American Council on Education ACG Academic Competitiveness Grant ACHE Association of Continuing Higher Education ACIR Advisory Committee on Information Resources ACM Academic Common Market AHEC Area Health Education Consortium ACCSCT Accrediting Commission of Career Schools/Colleges of Technology ACICS Accrediting Council for Independent Colleges and Schools AGB Association of Governing Boards of Colleges and Universities AIR Association of Institutional Research AP Advanced Placement APPA Association of Physical Plant Administrators APR Annual Performance Report BR Biennial Report CACG College Access Challenge Grant CAM College Application Month CAPE Council for American Private Education CCTI Collaborative Counselor Training Institute CERRA Center for the Recruitment, Retention and Advancement of Educators CGSC College Goal South Carolina CHE Commission on Higher Education CHEA Council on Higher Education Accreditation CHEMIS Commission on Higher Education Management Information System CIB Capital Improvement Bonds CIP Classification of Instruction Program CPIP Comprehensive Permanent Improvement Plan CUPA College and University Personnel Association DOA S.C. Department of AdministrationE & G Education and GeneralECS Education Commission of the StatesEDUCAUSE Consolidation of EDUCUM (Interuniversity Communications Council) and CAUSE (College and
University Systems Exchange)EDGAR Education Department General Administration RegulationsEEDA Education and Economic Development Act of 2005EIA (SC) Education Improvement Act of 1984
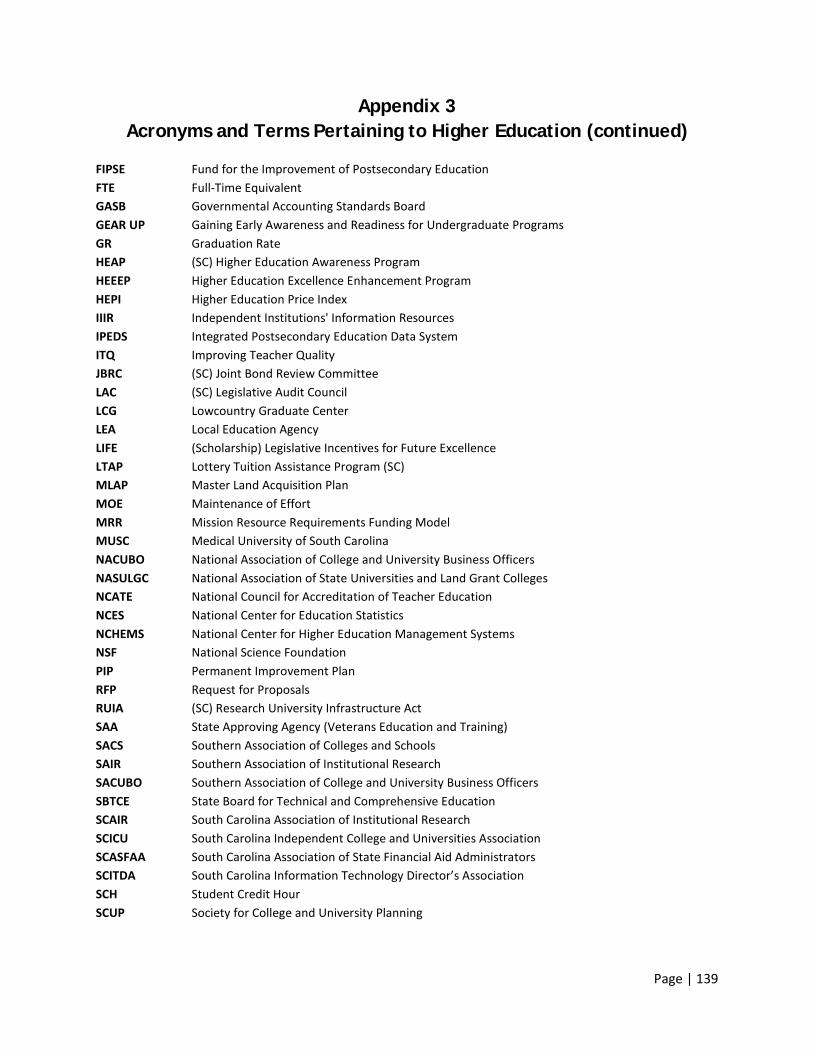
Page | 139
Appendix 3 Acronyms and Terms Pertaining to Higher Education (continued)
FIPSE Fund for the Improvement of Postsecondary Education FTE Full-Time Equivalent GASB Governmental Accounting Standards Board GEAR UP Gaining Early Awareness and Readiness for Undergraduate Programs GR Graduation Rate HEAP (SC) Higher Education Awareness Program HEEEP Higher Education Excellence Enhancement Program HEPI Higher Education Price Index IIIR Independent Institutions' Information Resources IPEDS Integrated Postsecondary Education Data System ITQ Improving Teacher Quality JBRC (SC) Joint Bond Review Committee LAC (SC) Legislative Audit Council LCG Lowcountry Graduate Center LEA Local Education Agency LIFE (Scholarship) Legislative Incentives for Future Excellence LTAP Lottery Tuition Assistance Program (SC) MLAP Master Land Acquisition Plan MOE Maintenance of Effort MRR Mission Resource Requirements Funding Model MUSC Medical University of South Carolina NACUBO National Association of College and University Business Officers NASULGC National Association of State Universities and Land Grant Colleges NCATE National Council for Accreditation of Teacher Education NCES National Center for Education Statistics NCHEMS National Center for Higher Education Management Systems NSF National Science Foundation PIP Permanent Improvement Plan RFP Request for Proposals RUIA (SC) Research University Infrastructure Act SAA State Approving Agency (Veterans Education and Training) SACS Southern Association of Colleges and Schools SAIR Southern Association of Institutional Research SACUBO Southern Association of College and University Business Officers SBTCE State Board for Technical and Comprehensive Education SCAIR South Carolina Association of Institutional Research SCICU South Carolina Independent College and Universities Association SCASFAA South Carolina Association of State Financial Aid Administrators SCITDA South Carolina Information Technology Director’s Association SCH Student Credit Hour SCUP Society for College and University Planning
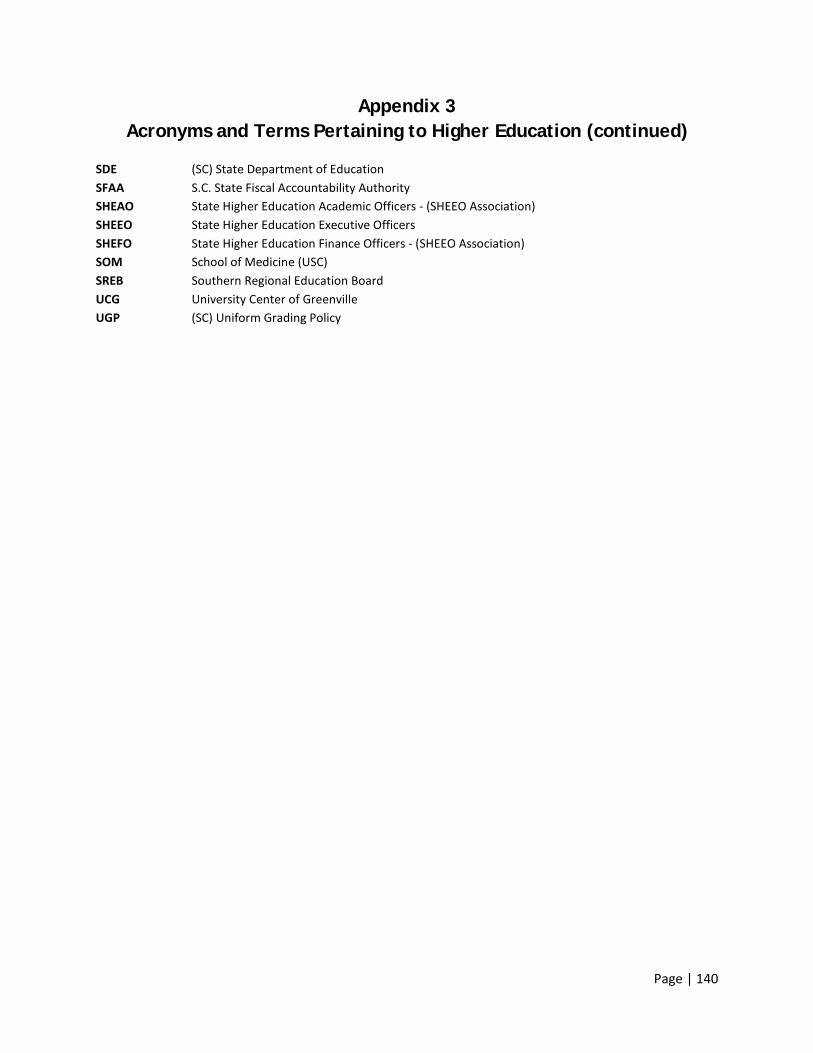
Page | 140
Appendix 3 Acronyms and Terms Pertaining to Higher Education (continued)
SDE (SC) State Department of Education SFAA S.C. State Fiscal Accountability Authority SHEAO State Higher Education Academic Officers - (SHEEO Association) SHEEO State Higher Education Executive Officers SHEFO State Higher Education Finance Officers - (SHEEO Association) SOM School of Medicine (USC) SREB Southern Regional Education Board UCG University Center of Greenville UGP (SC) Uniform Grading Policy
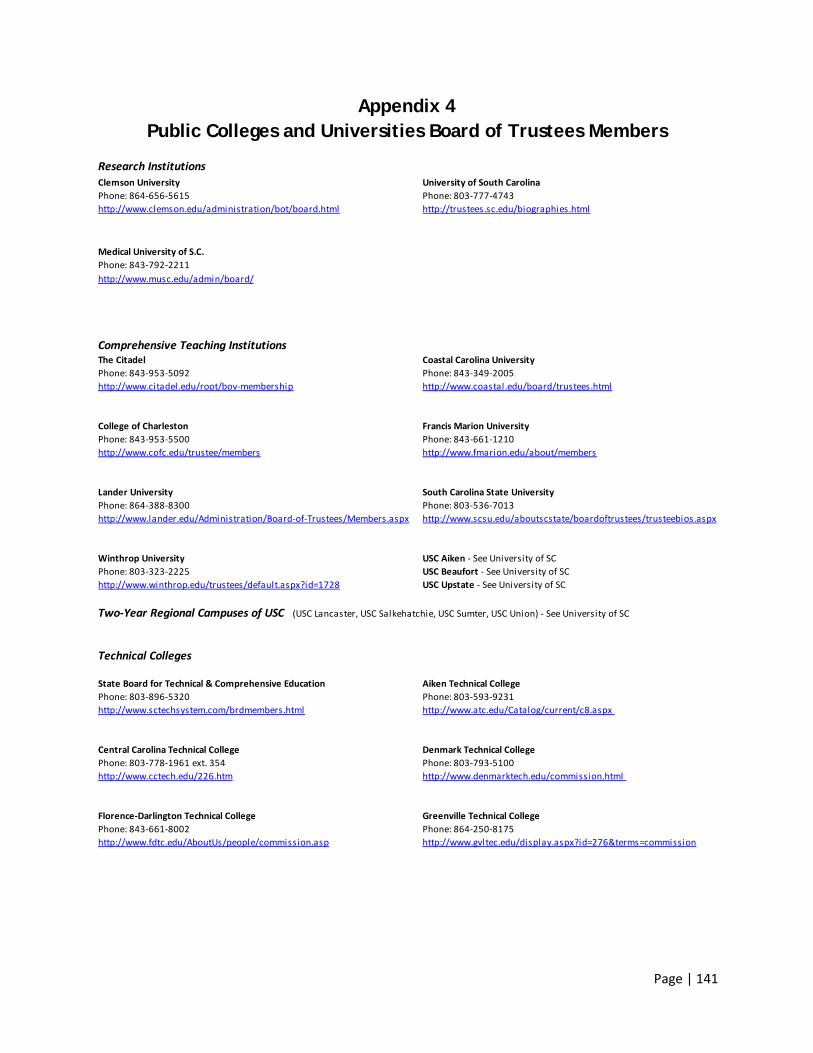
Page | 141
Appendix 4 Public Colleges and Universities Board of Trustees Members
Research InstitutionsClemson University University of South CarolinaPhone: 864-656-5615 Phone: 803-777-4743http://www.clemson.edu/administration/bot/board.html http://trustees.sc.edu/biographies.html
Medical University of S.C.Phone: 843-792-2211http://www.musc.edu/admin/board/
Comprehensive Teaching InstitutionsThe Citadel Coastal Carolina UniversityPhone: 843-953-5092 Phone: 843-349-2005http://www.citadel.edu/root/bov-membership http://www.coastal.edu/board/trustees.html
College of Charleston Francis Marion UniversityPhone: 843-953-5500 Phone: 843-661-1210http://www.cofc.edu/trustee/members http://www.fmarion.edu/about/members
Lander University South Carolina State UniversityPhone: 864-388-8300 Phone: 803-536-7013http://www.lander.edu/Administration/Board-of-Trustees/Members.aspx http://www.scsu.edu/aboutscstate/boardoftrustees/trusteebios.aspx
Winthrop University USC Aiken - See University of SCPhone: 803-323-2225 USC Beaufort - See University of SChttp://www.winthrop.edu/trustees/default.aspx?id=1728 USC Upstate - See University of SC
Two-Year Regional Campuses of USC (USC Lancaster, USC Salkehatchie, USC Sumter, USC Union) - See University of SC
Technical Colleges
State Board for Technical & Comprehensive Education Aiken Technical CollegePhone: 803-896-5320 Phone: 803-593-9231http://www.sctechsystem.com/brdmembers.html http://www.atc.edu/Catalog/current/c8.aspx
Central Carolina Technical College Denmark Technical CollegePhone: 803-778-1961 ext. 354 Phone: 803-793-5100http://www.cctech.edu/226.htm http://www.denmarktech.edu/commission.html
Florence-Darlington Technical College Greenville Technical CollegePhone: 843-661-8002 Phone: 864-250-8175http://www.fdtc.edu/AboutUs/people/commission.asp http://www.gvltec.edu/display.aspx?id=276&terms=commission
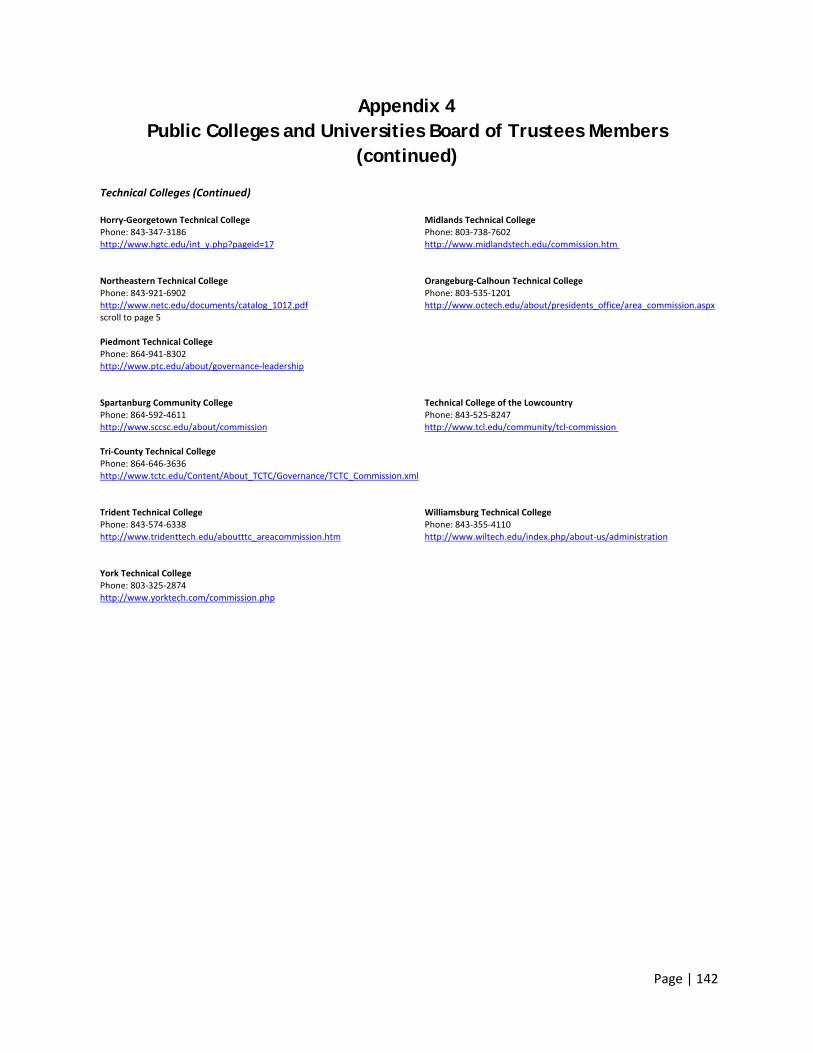
Page | 142
Appendix 4 Public Colleges and Universities Board of Trustees Members
(continued)
Technical Colleges (Continued)
Horry-Georgetown Technical College Midlands Technical CollegePhone: 843-347-3186 Phone: 803-738-7602http://www.hgtc.edu/int_y.php?pageid=17 http://www.midlandstech.edu/commission.htm
Northeastern Technical College Orangeburg-Calhoun Technical CollegePhone: 843-921-6902 Phone: 803-535-1201http://www.netc.edu/documents/catalog_1012.pdf http://www.octech.edu/about/presidents_office/area_commission.aspxscroll to page 5
Piedmont Technical CollegePhone: 864-941-8302http://www.ptc.edu/about/governance-leadership
Spartanburg Community College Technical College of the LowcountryPhone: 864-592-4611 Phone: 843-525-8247http://www.sccsc.edu/about/commission http://www.tcl.edu/community/tcl-commission
Tri-County Technical CollegePhone: 864-646-3636http://www.tctc.edu/Content/About_TCTC/Governance/TCTC_Commission.xml
Trident Technical College Williamsburg Technical CollegePhone: 843-574-6338 Phone: 843-355-4110http://www.tridenttech.edu/aboutttc_areacommission.htm http://www.wiltech.edu/index.php/about-us/administration
York Technical CollegePhone: 803-325-2874http://www.yorktech.com/commission.php
Page | 143
Appendix 5 Glossary
Academic Support – Funds to provide support services for an institution's primary missions – instruction, research, and public service.
Accessible Area – An indication that a room can be approached, entered, and used without assistance by a mobility-impaired person. The United States Department of Education Section 504 Subpart C regulation states “no qualified individual with a disability shall be excluded from participation in, be denied the benefits of, or otherwise be subjected to discrimination under any program or activity because a recipient’s facilities are inaccessible to, or unusable by, persons with disabilities.”
American Indian or Alaskan Native - A person having origins in any of the original peoples of North and South America (including Central America) who maintains cultural identification through tribal affiliation or community attachment.
Application Fee – The amount of money that an institution charges for processing a student’s application for admittance to the institution. This amount is not creditable toward tuition or required fees, nor is it refundable if the student is not admitted to the institution.
Asian or Pacific Islander – A person having origins in any of the original peoples of the Far East, Southeast Asia, the Indian Subcontinent, or Pacific Islands. This definition includes people from China, Japan, Korea, the Philippine Islands, American Samoa, India, and Vietnam.
Asian - A person having origins in any of the original peoples of the Far East, Southeast Asia, or the Indian Subcontinent, including, for example, Cambodia, China, India, Japan, Korea, Malaysia, Pakistan, the Philippine Islands, Thailand, and Vietnam.
Assignable Area – The sum of all areas on all floors of a building assigned to, or available for assignment to, an occupant or use, excluding spaces defined as building service, circulation, mechanical, and structural areas.
Associate’s Degree – An award that normally requires at least two, but less than four, years of full-time equivalent college work.
Auxiliary Enterprises – Activities that exist to furnish goods or services to students, faculty, or staff, and that charge a fee directly related to, although not necessarily equal to, the cost of the goods or services are included in auxiliary enterprises. These entities are classified as self-supporting.
Bachelor’s Degree – An award (baccalaureate or equivalent degree, as determined by the Secretary, U.S. Department of Education) that normally requires at least four, but NOT more than five, years of full-time equivalent college-level work. This definition includes bachelor’s degrees conferred in a five-year cooperative (work-study plan) program.
Black/African American - A person having origins in any of the black racial groups of Africa.
Board Charges – Charges assessed students for an academic year for meals.
Books and Supplies – The average cost of books and supplies for a typical student for an entire academic year (or program). Does not include unusual costs for special groups of students (e.g., engineering or art majors), unless they constitute the majority of students at an institution.
Certificate – A formal award certifying the satisfactory completion of a postsecondary education program.
Page | 144
Appendix 5 Glossary (continued)
Classification of Instructional Programs (CIP) – A numerical classification and standard terminology for secondary and postsecondary instructional programs provided by National Center of Education Statistics (NCES).
Cohort – A specific group of students established for tracking purposes.
Credit Course – A course that, if successfully completed, can be applied toward the number of courses required for achieving a degree, diploma, certificate, or other formal award.
Credit Hour – A unit of measure that represents the equivalent of an hour (50 minutes) of instruction that can be applied to the total number of hours needed for completing the requirements of a degree, diploma, certificate or other formal award.
Debt Service – The amount set aside annually in a fund to pay the interest and the part of the principal due on the Institution’s bond and note debt.
Dedicated Fees – Fees committed for a specific use of the funds collected. These funds may be carried forward year to year.
Degree – An award conferred by a college, university, or other postsecondary education institution as official recognition for the successful completion of a program of study.
Degree/Certificate-Seeking Students – Students enrolled in courses for credit who are recognized by the institution as seeking a degree or other formal award. At the undergraduate level, this classification is intended to include students enrolled in vocational or occupational programs.
Diploma – A formal document certifying the successful completion of a prescribed program of study.
Doctor’s Degree – The highest award a student can earn for graduate study. The doctor’s degree classification includes such degrees as Doctor of Education, Doctor of Juridical Science, Doctor of Public Health, and the Doctor of Philosophy degree in any field such as agronomy, food technology, education, engineering, public administration, ophthalmology, or radiology.
Doctor's degree - other – A doctor's degree that does not meet the definition of a doctor’s degree - research/scholarship or a doctor’s degree - professional practice.
Doctor's degree - professional practice – A doctor's degree that is conferred upon completion of a program providing the knowledge and skills for the recognition, credential, or license required for professional practice. The degree is awarded after a period of study such that the total time to the degree, including both pre-professional and professional preparation, equals at least six full-time equivalent academic years. Some of these degrees were formerly classified as “first-professional” and may include: Chiropractic (D.C. or D.C.M.); Dentistry (D.D.S. or D.M.D.); Law (L.L.B. or J.D.); Medicine (M.D.); Optometry (O.D.); Osteopathic Medicine (D.O); Pharmacy (Pharm.D.); Podiatry (D.P.M., Pod.D., D.P.); or, Veterinary Medicine (D.V.M.), and others, as designated by the awarding institution.
Doctor's degree - research/scholarship – A Ph.D. or other doctor's degree that requires advanced work beyond the master’s level, including the preparation and defense of a dissertation based on original research, or the planning and execution of an original project demonstrating substantial artistic or scholarly achievement. Some examples of this type of degree may include Ed.D., D.M.A., D.B.A., D.Sc., D.A., or D.M, and others, as designated by the awarding institution.
Page | 145
Appendix 5 Glossary (continued)
Dormitory Capacity – The maximum number of students for which the institution can provide dormitory housing facilities, whether on or off campus.
Educational and General (E&G) – The educational and general operations of an institution, including instruction, research, public service, academic support, student services, institutional support, operation and maintenance of physical plant, etc.
First-Professional Degree – An award that requires completion of a program that meets all of the following criteria: (1) completion of the academic requirements to begin practice in the profession; (2) at least two years of college work prior to entering the program; and (3) a total of a least six academic years of college work to complete the degree program, including prior required college work plus the length of the professional program itself. First-professional degrees may be awarded in the following ten fields: Chiropractic, Dentistry, Law, Medicine, Optometry, Osteopathic Medicine, Pharmacy, Podiatry, Theology, and Veterinary Medicine. NOTE: The National Center for Education Statistics (NCES) has eliminated this degree category and required all institutions to reclassify the above first-professional degrees into the Doctor’s degree classification. See Doctor’s-Professional Practice degree for additional information.
First-Time Freshman – An entering freshman who has never attended a college (or other postsecondary institution). Includes students enrolled in the fall term who attended college for the first time in the prior summer term. Also includes students who entered with advanced standing (college credits earned before graduation from high school.
Full-Time Equivalent (FTE) Student Enrollment – Calculated as fifteen (15) credit hours per semester for an undergraduate student, twelve (12) credit hours per semester for a graduate level 1 (master’s) student, and nine (9) credit hours per semester for graduate level 2 (doctoral) students. First professional pharmacy hours are fifteen (15) credit hours per semester and first professional law are fourteen (14) credit hours per semester. Medicine and Dentistry use the headcount rather than credit hours.
Full-time student - Undergraduate: A student enrolled for 12 or more semester credits , or 12 or more quarter credits, or 24 or more contact hours a week each term. Graduate: A student enrolled for 9 or more semester credits, or 9 or more quarter credits, or a student involved in thesis or dissertation preparation that is considered full time by the institution. Doctor's degree - Professional practice as defined by the institution.
Geo-Origin – The first reported Geographic origin of the student enrolling in a South Carolina institution. If unknown is reported, totals are included in Geo-Origin Non-S.C.
Graduate Student – A student taking courses offered for credit toward a master’s or doctoral degree.
Graduation Rate – The rate required for disclosure and/or reporting purposes under Student Right-to-Know. This rate is calculated as the total number of completers within 150% of normal time divided by the revised cohort minus any allowable exclusions.
Hispanic – A person of Mexican, Puerto Rican, Cuban, Central or South American, or other Spanish culture or origin, regardless of race.
Hospitals – Activities associated with the patient care operations of a hospital. This category does not include instructional activities which may take place in the hospital but which are more appropriately categorized in the instruction program.
In-District Student – A student who is a legal resident of the locality in which he/she attends school and thus is entitled to reduced tuition charges if offered by the institution.
Page | 146
Appendix 5 Glossary (continued)
In-State Student – A student who is a legal resident of the state in which he/she attends school. (S.C. uses geo-origin. See definition for geo-origin.)
Independent Operations – Institutional activities that are owned by or controlled by the institution but that are independent of or unrelated to the institution's mission.
Institutional Support – Activities carried out to provide for both the day-to-day functioning and the long-range viability of the institution as an operating organization. The ultimate goal of the institutional support program is to provide for the institution's organizational effectiveness and continuity.
Instruction – Activities carried out for the express purpose of eliciting a measure of educational change in a learner or group of learners.
Lower Division – Courses at the freshman and sophomore levels of college work, available at the two-year institutions as well as the four-year institutions.
Master’s Degree – An award that requires the successful completion of a program of study of at least the full-time equivalent of one, but not more than two, academic years of work beyond the bachelor’s degree.
Native Hawaiian or Pacific Islander - A person having origins in any of the original peoples of Hawaii, Guam, Samoa, or other Pacific Islands.
Nonresident Alien – A person who is not a citizen or national of the United States and who is in this country on a visa or temporary basis and does not have the right to remain indefinitely.
Out-of-State Student – A student who is not a legal resident of the state in which he/she attends school. (S.C. uses geo-origin. See definition for geo-origin.)
Physical Plant Operations – Activities related to maintaining existing facilities and grounds, providing utility services, and planning and designing future plant expansions and modifications.
Public Service – Activities established to make available to the public the various resources and capabilities of the institution for the specific purpose of responding to a community need or solving a community problem.
Race/ethnicity Unknown – This category is used ONLY if the student did not select a racial/ethnic designation, and the postsecondary institution finds it impossible to place the student in one of the aforementioned racial/ethnic categories during established enrollment procedures or in any post-enrollment identification or verification process.
Required Fees – Fixed sum charged to students for items not covered by tuition and required of such a large proportion of all students that the student who does NOT pay is an exception.
Research – Any activity intended to produce one or more research outcomes – including the creation of knowledge, the organization of knowledge, and the application of knowledge. A research activity may be conducted with institutional funds or under the terms of an agreement with an agency external to the institution.
Room Charges – The charges for an academic year for rooming accommodations for a typical student sharing a room with one other student.
Page | 147
Appendix 5 Glossary (continued)
Room Hours of Instruction – The number of hours each week that a classroom is used for regularly scheduled classes.
Space Factor Calculation – A very useful calculation for facilities planners, in that it combines into a single factor the concepts of weekly room hours, percent student station utilization, and assignable square feet per student station. The lower the space factor, the more effectively the space is being utilized for instructional purposes. The calculation is: average student station size (SF per student station) divided by average week room hours of instruction multiplied by station utilization percentage.
Specialist Degree – An award that requires the completion of an organized program of study that awards the specialist degree (beyond Master’s), but does not meet the requirements of academic degree at the doctor’s level.
Student Services – Activities that contribute to the emotional and physical well-being of the students, as well as to their intellectual, cultural, and social development outside of the context of the institution's formal instruction program.
Student Station – A desk, table/chair, theatre seating, etc., used by a student in a classroom or class laboratory.
Success Rate - The Graduation Rate Survey (GRS) defines the cohort of students to be included each year as the first-time, full-time, degree-seeking students entering an institution each fall. The GRS rate is calculated on the percentage of a cohort graduating within 150% of normal program time. The Success Rate, in addition to the graduates, includes those students who as of 150% of program time have transferred to another institution or those students who have continued to be enrolled the term following 150% of program time. This is often referred to as the “GRS Rate Plus.”
Transfer Student – A student entering the reporting institution for the first time but known to have previously attended a postsecondary institution at the same level (e.g., undergraduate, graduate). The student may transfer with or without credit.
Tuition – The amount of money charged to students for instructional services. Tuition may be charged per term, per course, or per credit.
Two or More Races – A student selects more than one race category.
Undergraduate Student – A student enrolled in a four- or five-year bachelor’s degree program, an associate’s degree program, or a vocational or technical program below the baccalaureate.
Upper Division – The courses students are generally expected to complete during the junior and senior years of a typical baccalaureate degree program and often require completion of prerequisite courses.
White - A person having origins in any of the original peoples of Europe, North Africa, or the Middle East.
Page | 148
Appendix 6 Explanations and Changes in the Categories for Race/Ethnicity
Reporting
Note: New Definitions and reporting requirements to the federal government for race and ethnicity have been adopted in accordance with the final guidance issued by the U.S. Department of Education on October 19, 2007. These changes are necessary to implement the US Office of Management and Budget's (OMB) 1997 Standards for Maintaining, Collecting, and Presenting Federal Data on Race and Ethnicity. For more details on the changes, please see the following web site: http://nces.ed.gov/ipeds/reic/resource.asp.
Under the new guidelines, individuals may select an ethnicity and one or more races. The ethnicity choice is between Hispanic and not Hispanic. Hispanic is defined as a person of Cuban, Mexican, Puerto Rican, South or Central American, or Spanish culture or origin, regardless of race. To match Federal reporting guidelines, all who select Hispanic will be reported under this category and non-Hispanic individuals who select more than one race will be reported in the category titled Two or More Races. Those individuals who select non-Hispanic and a single race will be reported under the single race.
• Under the new guidelines, all individuals who select Hispanic as their ethnicity will be reportedhere regardless of the race or races selected.
• The new definition separates Asian, Native Hawaiian, and Other Pacific Islander. During the next few years as we transition between the old and new definitions, the data reported under the old definition of Asian or Pacific Islander will be included under Asian so that a mapping of the datafrom old definitions to new definitions can occur.
• Non-Hispanics who select more than one race will be reported under the label Two or MoreRaces.
Since 2009-10, reporting of data to the Commission on Higher Education using the new guidelines was optional. From 2010-11, all data was reported using the new definitions.
Page | 149
For Additional Information/Data:
Contact:
S.C. Commission on Higher Education1122 Lady Street, Suite 300
Columbia, SC 29201 Phone: (803)737-2260
Fax: (803)737-5091 Email: [email protected]
or
Visit our home page at
http://www.che.sc.gov
The South Carolina Higher Education Abstract is published annually by the South Carolina Commission on Higher Education, Division of Fiscal Affairs. In accordance with South Carolina Section 1-11-425, the following information is provided:
Number of Abstracts Printed 100
Cost Per Abstract $ 28.67Total Printing Cost $ 2,866.51