Embed Size (px)
Citation preview
South Cambridgeshire Crime & Disorder Reduction Partnership
Strategic Assessment 2008
Produced by: Cambridgeshire County Council, Research Group Michael Soper / Siobhan Dennehy / Kamila Gielnik Contact: 01223 715312 / [email protected]

South Cambridgeshire Community Safety Partnership – Strategic Assessment 2008 2
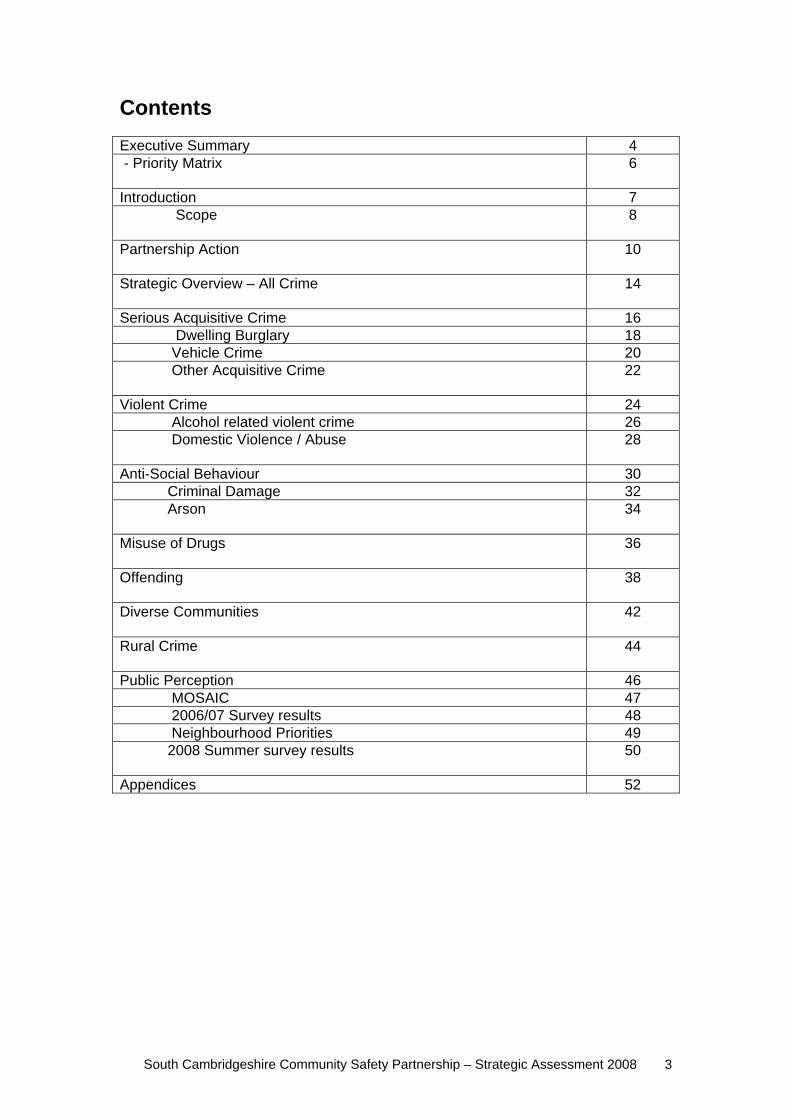
Contents Executive Summary 4 - Priority Matrix
6
Introduction 7 Scope
8
Partnership Action
10
Strategic Overview – All Crime
14
Serious Acquisitive Crime 16 Dwelling Burglary 18 Vehicle Crime 20 Other Acquisitive Crime
22
Violent Crime 24 Alcohol related violent crime 26 Domestic Violence / Abuse
28
Anti-Social Behaviour 30 Criminal Damage 32 Arson
34
Misuse of Drugs
36
Offending
38
Diverse Communities
42
Rural Crime
44
Public Perception 46 MOSAIC 47 2006/07 Survey results 48 Neighbourhood Priorities 49 2008 Summer survey results
50
Appendices 52
South Cambridgeshire Community Safety Partnership – Strategic Assessment 2008 3
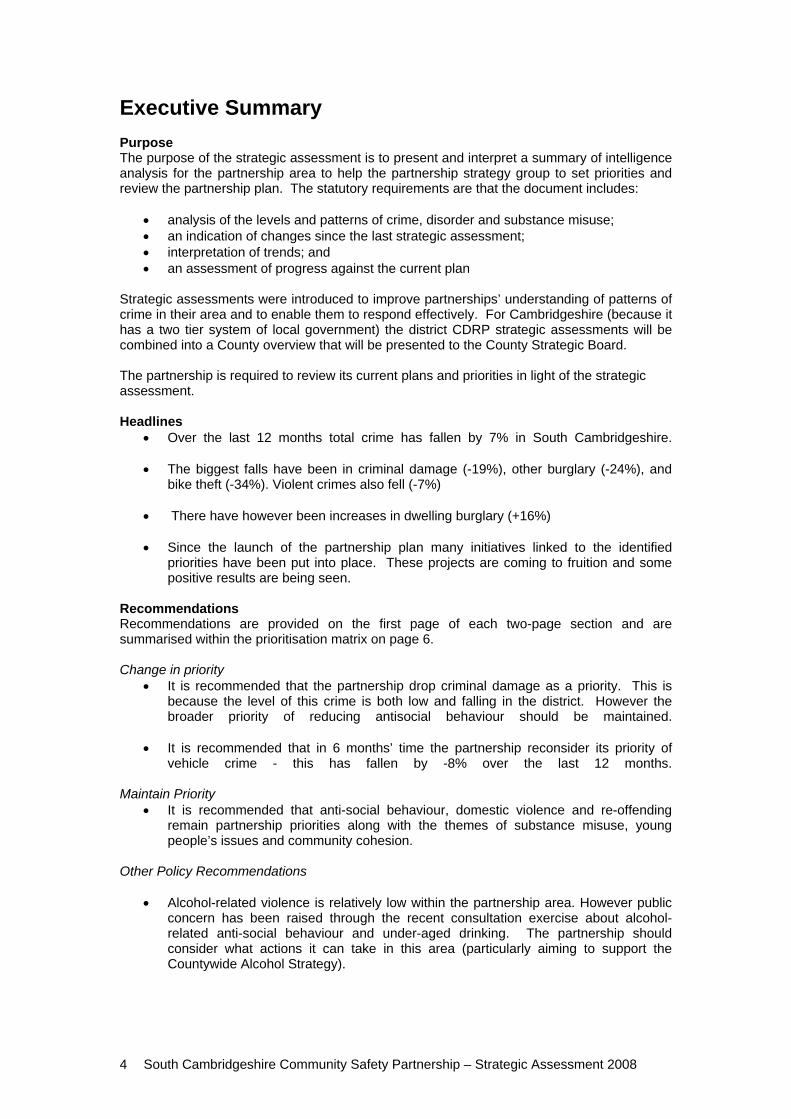
Executive Summary Purpose The purpose of the strategic assessment is to present and interpret a summary of intelligence analysis for the partnership area to help the partnership strategy group to set priorities and review the partnership plan. The statutory requirements are that the document includes:
• analysis of the levels and patterns of crime, disorder and substance misuse; • an indication of changes since the last strategic assessment; • interpretation of trends; and • an assessment of progress against the current plan
Strategic assessments were introduced to improve partnerships’ understanding of patterns of crime in their area and to enable them to respond effectively. For Cambridgeshire (because it has a two tier system of local government) the district CDRP strategic assessments will be combined into a County overview that will be presented to the County Strategic Board. The partnership is required to review its current plans and priorities in light of the strategic assessment. Headlines
• Over the last 12 months total crime has fallen by 7% in South Cambridgeshire.
• The biggest falls have been in criminal damage (-19%), other burglary (-24%), and bike theft (-34%). Violent crimes also fell (-7%)
• There have however been increases in dwelling burglary (+16%)
• Since the launch of the partnership plan many initiatives linked to the identified
priorities have been put into place. These projects are coming to fruition and some positive results are being seen.
Recommendations Recommendations are provided on the first page of each two-page section and are summarised within the prioritisation matrix on page 6. Change in priority
• It is recommended that the partnership drop criminal damage as a priority. This is because the level of this crime is both low and falling in the district. However the broader priority of reducing antisocial behaviour should be maintained.
• It is recommended that in 6 months’ time the partnership reconsider its priority of vehicle crime - this has fallen by -8% over the last 12 months.
Maintain Priority • It is recommended that anti-social behaviour, domestic violence and re-offending
remain partnership priorities along with the themes of substance misuse, young people’s issues and community cohesion.
Other Policy Recommendations
• Alcohol-related violence is relatively low within the partnership area. However public
concern has been raised through the recent consultation exercise about alcohol-related anti-social behaviour and under-aged drinking. The partnership should consider what actions it can take in this area (particularly aiming to support the Countywide Alcohol Strategy).
South Cambridgeshire Community Safety Partnership – Strategic Assessment 2008 4
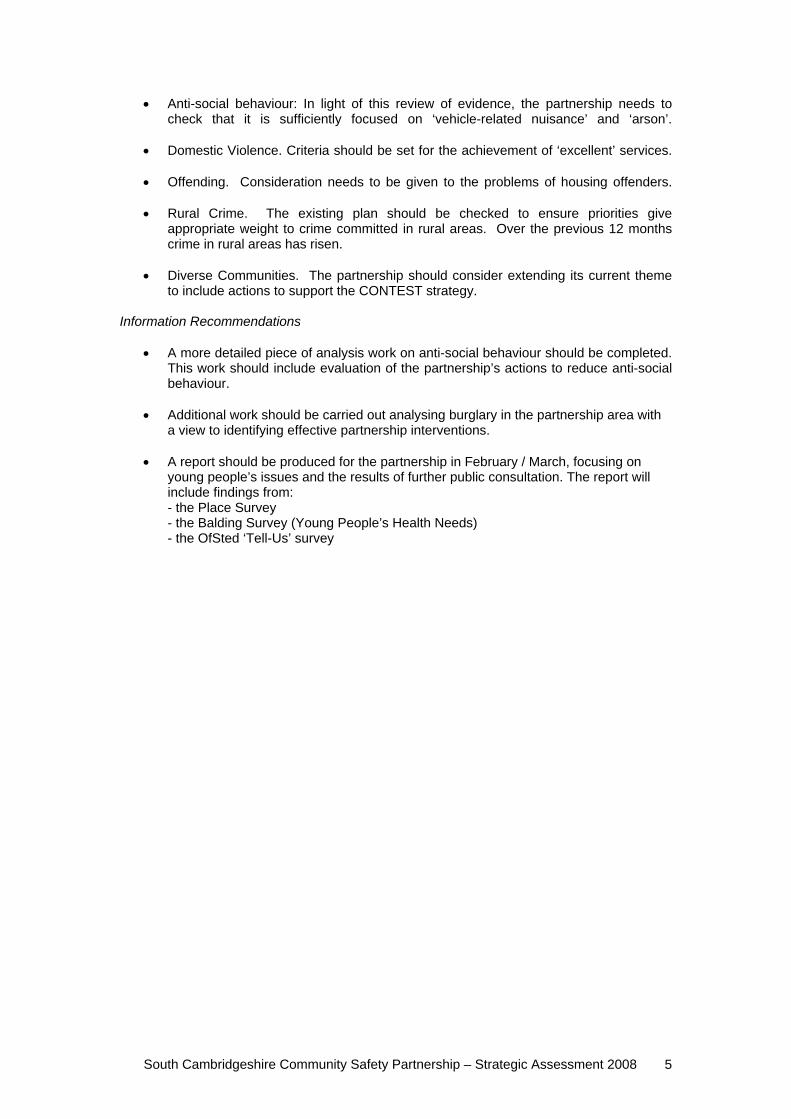
• Anti-social behaviour: In light of this review of evidence, the partnership needs to check that it is sufficiently focused on ‘vehicle-related nuisance’ and ‘arson’.
• Domestic Violence. Criteria should be set for the achievement of ‘excellent’ services.
• Offending. Consideration needs to be given to the problems of housing offenders.
• Rural Crime. The existing plan should be checked to ensure priorities give appropriate weight to crime committed in rural areas. Over the previous 12 months crime in rural areas has risen.
• Diverse Communities. The partnership should consider extending its current theme
to include actions to support the CONTEST strategy. Information Recommendations
• A more detailed piece of analysis work on anti-social behaviour should be completed.
This work should include evaluation of the partnership’s actions to reduce anti-social behaviour.
• Additional work should be carried out analysing burglary in the partnership area with a view to identifying effective partnership interventions.
• A report should be produced for the partnership in February / March, focusing on young people’s issues and the results of further public consultation. The report will include findings from: - the Place Survey - the Balding Survey (Young People’s Health Needs) - the OfSted ‘Tell-Us’ survey
South Cambridgeshire Community Safety Partnership – Strategic Assessment 2008 5
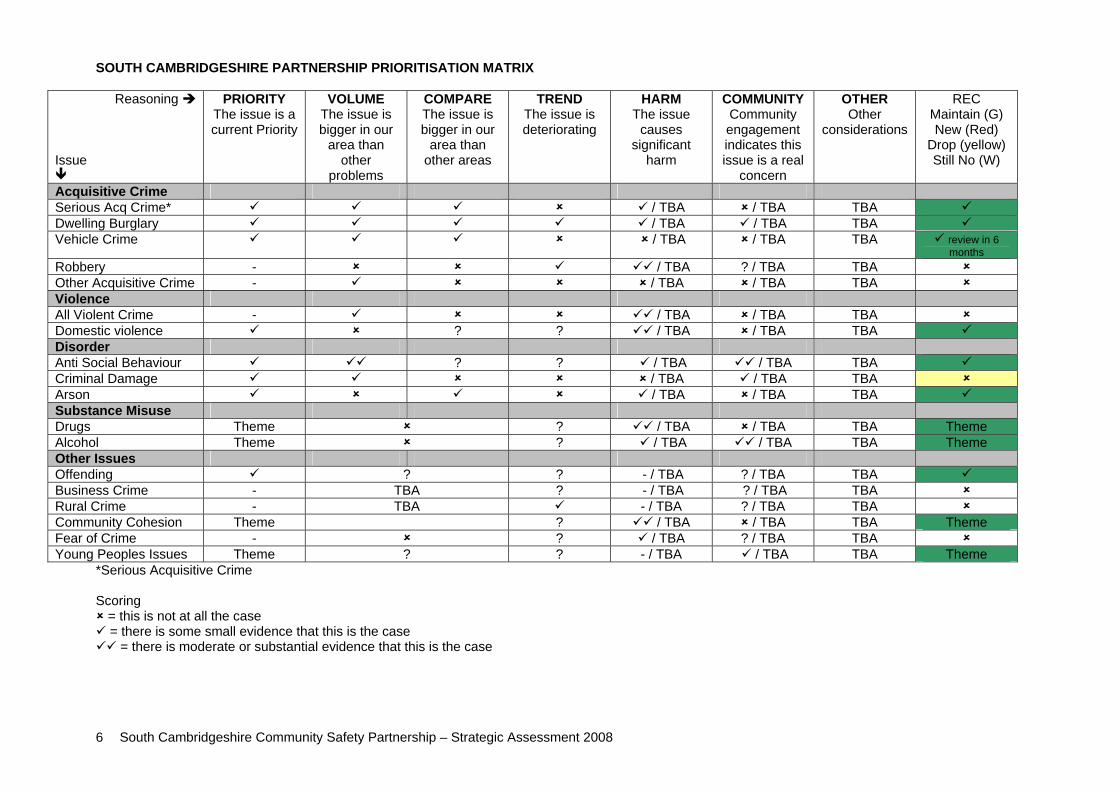
SOUTH CAMBRIDGESHIRE PARTNERSHIP PRIORITISATION MATRIX
Reasoning Issue
PRIORITY The issue is a current Priority
VOLUME The issue is bigger in our
area than other
problems
COMPARE The issue is bigger in our
area than other areas
TREND The issue is deteriorating
HARM The issue
causes significant
harm
COMMUNITY Community engagement indicates this issue is a real
concern
OTHER Other
considerations
REC Maintain (G) New (Red)
Drop (yellow) Still No (W)
Acquisitive Crime Serious Acq Crime* / TBA / TBA TBA Dwelling Burglary / TBA / TBA TBA Vehicle Crime / TBA / TBA TBA review in 6
months Robbery - / TBA ? / TBA TBA Other Acquisitive Crime - / TBA / TBA TBA Violence All Violent Crime - / TBA / TBA TBA Domestic violence ? ? / TBA / TBA TBA Disorder Anti Social Behaviour ? ? / TBA / TBA TBA Criminal Damage / TBA / TBA TBA Arson / TBA / TBA TBA Substance Misuse Drugs Theme ? / TBA / TBA TBA Theme Alcohol Theme ? / TBA / TBA TBA Theme Other Issues Offending ? ? - / TBA ? / TBA TBA Business Crime - TBA ? - / TBA ? / TBA TBA Rural Crime - TBA - / TBA ? / TBA TBA Community Cohesion Theme ? / TBA / TBA TBA Theme Fear of Crime - ? / TBA ? / TBA TBA Young Peoples Issues Theme ? ? - / TBA / TBA TBA Theme
*Serious Acquisitive Crime Scoring
= this is not at all the case = there is some small evidence that this is the case
= there is moderate or substantial evidence that this is the case
South Cambridgeshire Community Safety Partnership – Strategic Assessment 2008 6
Introduction Background In 2006 a review was held of the partnership provisions within the Crime & Disorder Act 1998 and the Police Reform Act 2002. As a result, a new set of national minimum standards for partnership working aimed at tackling crime and disorder were introduced within the Police and Justice Act 2006. These minimum standards came into force in August 2007. The new statutory responsibilities related to the composition and duties of Crime and Disorder Reduction Partnerships (CDRPs) and relevant county level group in two tier areas. These included a duty for partnerships to prepare an annual strategic assessment. In addition, the statutory responsibilities were supported by the advisory ‘six hallmarks’ of effective partnerships. These are:
• Empowered and effective leadership • Visible and constructive accountability • Intelligence led business processes • Effective and responsive delivery structures • Engaged communities • Appropriate knowledge and skills
The guidance around the area of intelligence-led business processes for partnerships includes detail around the format, content and use of the strategic assessment. Purpose The purpose of the strategic assessment is to present and interpret a summary of intelligence analysis for the partnership area to help the partnership strategy group to set priorities and review the partnership plan. The statutory requirements are that the document includes:
• Analysis of the levels and patterns of crime, disorder and substance misuse; • An indication of changes since the last strategic assessment; • Interpretation of trends; • An assessment of progress against the current plan
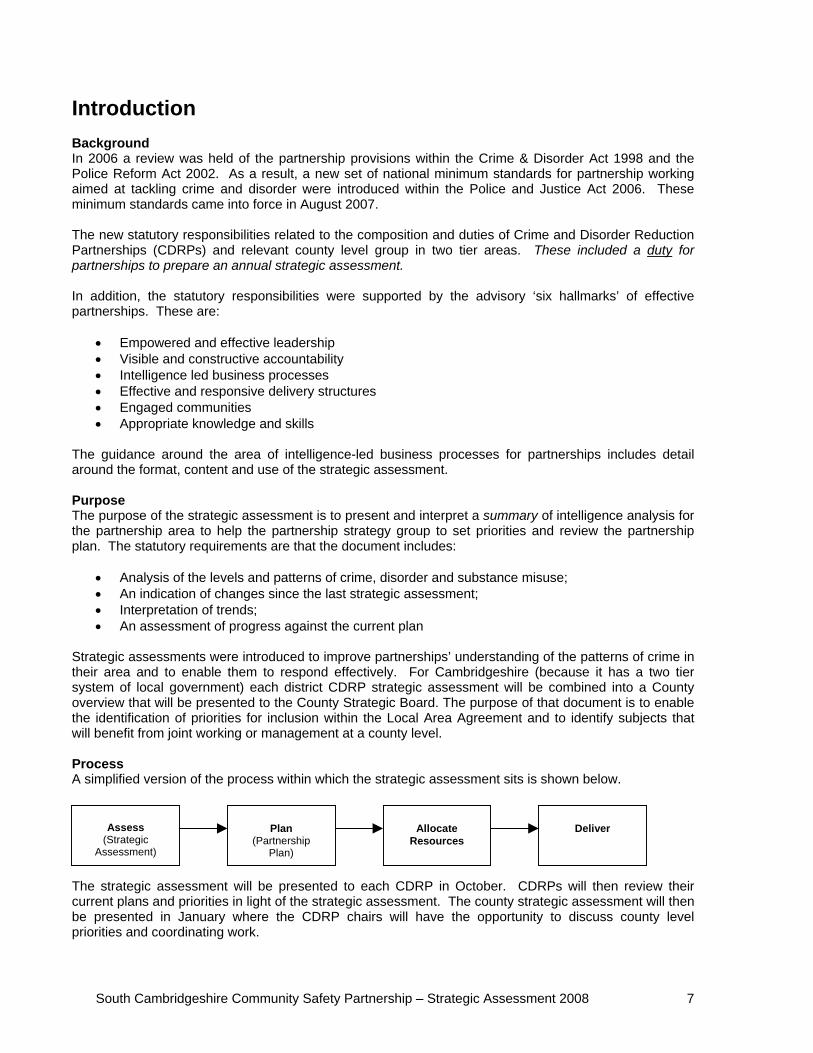
Strategic assessments were introduced to improve partnerships’ understanding of the patterns of crime in their area and to enable them to respond effectively. For Cambridgeshire (because it has a two tier system of local government) each district CDRP strategic assessment will be combined into a County overview that will be presented to the County Strategic Board. The purpose of that document is to enable the identification of priorities for inclusion within the Local Area Agreement and to identify subjects that will benefit from joint working or management at a county level. Process A simplified version of the process within which the strategic assessment sits is shown below.
Plan (Partnership
Plan)
Allocate Resources
Deliver
Assess (Strategic
Assessment)
The strategic assessment will be presented to each CDRP in October. CDRPs will then review their current plans and priorities in light of the strategic assessment. The county strategic assessment will then be presented in January where the CDRP chairs will have the opportunity to discuss county level priorities and coordinating work.
South Cambridgeshire Community Safety Partnership – Strategic Assessment 2008 7
South Cambridgeshire Community Safety Partnership – Strategic Assessment 2008 8
Scope Authors Within Cambridgeshire we have a long-standing arrangement funded by both the County and District Councils that the County Council’s Research Group supports each of the County’s CDRPs with their research and information needs. This remit includes the production of the partnership strategic assessments and is also supported by Cambridgeshire Constabulary. For 2008/09 the County Council’s Research Group has led on the production of the Partnership Strategic Assessments (at both CDRP and County level). However this work has been coordinated with Cambridgeshire Constabulary’s own strategic assessment process and information and analysis has been shared between the two. In addition each of the Community Safety Officers for the district councils have been involved in the planning process. Contributors It is the role of the strategic assessment to bring together both information and analysis from a range of partner organisations. In order for strategic assessments to be successful they need to be built on strong information-sharing arrangements. The following agencies have contributed information for the 2008/09 strategic assessments:
• Cambridgeshire County Council • Cambridge City Council • East Cambridgeshire District Council • Huntingdonshire District Council • Fenland District Council • South Cambridgeshire District Council • Cambridgeshire Constabulary • Cambridgeshire Fire & Rescue Service • East of England Ambulance Service NHS Trust • Addenbrookes Hospital (Cambridge University Hospitals NHS Foundation Trust • NHS Cambridgeshire • Cambridgeshire Probation Service • Criminal Justice Board
In addition the views of members of the public have been incorporated through a scan of previous public involvement exercises; collation of views expressed at neighbourhood panels and through an on-line survey. Various regional and national reports have also been used to provide contextual information. Methodology The process for producing the Cambridgeshire strategic assessments follows Home Office best practice guidelines. 1. Carry out initial scanning The purpose of the scanning exercise is to identify ‘emerging issues’ (problems that partnerships have not previously had to face) and to consider external factors such as political or economic changes that may affect future crime trends. 2. ‘Top line Analysis’ An overview of each partnership’s position against current performance targets and trends in total crime. In addition we have added data from all three emergency services. 3. Detailed Analysis of topics The precise nature of each topic analysed and the structure of the analysis is guided by the initial scanning work. Topic Analysis is supported by an overview of performance in each area.
South Cambridgeshire Community Safety Partnership – Strategic Assessment 2008 9
4. Assessment of delivery. With the support of district community safety officers, an assessment has been made as to progress against current CDRP plans. 5. Public Priorities The views of members of the public have been incorporated through a scan of previous public involvement exercises; collation of views expressed at neighbourhood panels and through an on-line survey. Feedback As with last year, feedback is invited on both the strategic assessment document and on the process undertaken to consider it. Normally a review meeting is held in December following publication. To comment or ask any further questions about the strategic assessment then please contact [email protected]
South Cambridgeshire Community Safety Partnership – Strategic Assessment 2008 10
Performance Assessment – Partnership Action The CDRP has five priorities in its current Rolling Plan.
• Anti-Social Behaviour and Criminal Damage • Burglary of homes • Vehicle crime • Domestic Violence • Re-offending
Reducing Anti-Social Behaviour and Criminal Damage The Police lead on the Partnership’s work to address anti-social behaviour by responding to calls made by the public, with local Neighbourhood Policing teams playing an active role. Much of the work to address anti-social behaviour is prioritised through resident involvement at the Neighbourhood Panels. In the summer the police and District Council licensing team worked on joint operations together. In addition to the day-to-day front-line response, the multi-agency ASB task group continues to meet on a monthly basis, and has taken action on 15 cases since April. Through focussed casework, the Partnership has continued to work with individuals to improve their behaviour making wide use of Acceptable Behaviour Contracts. The District benefits from a wide range of positive youth activities, sporting and cultural and these provide positive diversionary activities for young people. The CDRP has also taken an active part in the ‘Streets Project’ promoting positive community safety messages in the local village colleges. The CDRP ASB Caseworker post has been vacant since June, and is scheduled to be filled by the end of October. This has had a negative impact on the number of cases that the CDRP has been able to take forward and work with on an individual basis over the summer months. Continuity of the ASB Task Group meeting has sometimes been difficult to manage, with attendance sometimes disappointing. There is great value in partners being encouraged to come along to the meeting, make referrals and most importantly share information about cases between each agency to ensure co-ordinated action. Neighbourhood Panels The CDRP works closely with the seven Neighbourhood Panels that meet regularly across the district. Since the system was set up, 48 panel meetings have been held Priorities set by the panels commonly require Police action; however a high number of the priorities require a multi-agency response from CDRP partners. The Partnership has now agreed that any priorities relating to anti-social behaviour will automatically be referred to the next scheduled monthly ASB Task Group to ensure the immediate involvement of local officers from CDRP agencies, who can make an impact on the issues, and work toward finding solutions. Any other priorities emerging (that do not relate to ASB) will be referred to lead CDRP officers who will progress in their own organisations and then feed back through the Neighbourhood Panel Profile document produced for the follow-up panel meeting.
Burglary of homes The Burglary Task group meets on a regular basis and has been focussing on establishing No Cold Calling Zones, hosting the ‘Trickster’ event to warn older residents about Distraction Burglary as well as giving advice. As part of ‘Operation Promenade’, the Police Crime Prevention Team carried out 14 security surveys as well as distributing free security devices to households. Advice and information has been distributed to many residents in the district through E-Cops, Immobilise, attendance at open days, road shows and neighbourhood panels, articles for use by parish councils in their newsletters as well as working directly with the Council’s Sheltered Housing schemes.
South Cambridgeshire Community Safety Partnership – Strategic Assessment 2008 11
Known prolific burglars have been targeted through the PPO scheme, with one offender charged in the summer. The Cambridgeshire Police Shrievalty Trust has continued to operate the Bobby scheme in the District, helping to make homes more resilient to burglary. Overall they have responded to 170 calls including supporting the victims of distraction burglary in the Linton/Balsham area. In addition, Trading Standards have now established 24 No Cold Calling Zones in the District.
Vehicle crime The Vehicle Crime Task Group has met on a regular basis and has seen progress in targeting beauty spots in the District, as well as addressing nuisance motorcycle use. Through the use of new motorcycle equipment, Police have seized a number of vehicles used for anti-social behaviour. Advice and information continues to be circulated to residents through E-cops and at Neighbourhood Panels. The District Council investigates reports of nuisance and abandoned vehicles and since April has removed 24 vehicles within 24 hours of reporting. Three PPOs suspected of being involved in vehicle crime are being closely monitored. Task Group members have queried whether the group needs to continue given the low crime rate and the limited opportunities for joint CDRP Vehicle Crime projects and initiatives. Vehicle crime remains low in the District and analysis of the data has proved that is difficult to identify hotspots or problems that require direct attention. The group is linked to the Countywide Vehicle Crime Reduction Group to ensure it benefits from countywide knowledge and initiatives. Domestic Violence The CDRP works closely with the City Council to reduce Domestic Violence, shares a joint domestic violence action group and has now agreed a joint action plan. Earlier in the year, the group elected a new chair. The task group has focussed on communicating messages about services available, and has established sub-groups focussing on children and also on the annual Training and Awareness Day held for professionals. A ‘Domestic Violence Directory of Services’ for South Cambridgeshire has been produced to direct victims to appropriate agencies that can help. There remains some concern regarding regular attendance from group members. In particular, appropriate representation from Mental Health services needs to be encouraged. The group is also reviewing how The Sanctuary Project can best be delivered across the District Reducing re-offending The Southern Division PPO scheme has led the contribution to this CDRP aim and has closely monitored 10 individuals since April 2008, with 9 live cases at the time of writing. It is estimated that the scheme has saved a total of 102 crimes since the start of the financial year. An important objective for the CDRP is effectively rehabilitating and resettling offenders, and this is achieved through direct engagement by the Support and Resettlement Officer with the individual, to formulate action plans for personal development. Recently the scheme has focussed on some suspected vehicle crime offenders, charging a PPO serving a prison sentence with further offences, as well as working closely with the Council housing team on the relocation of some PPOs. The Partnership has now agreed the Southern Division PPO Delivery Plan for 2008-9
South Cambridgeshire Community Safety Partnership – Strategic Assessment 2008 12
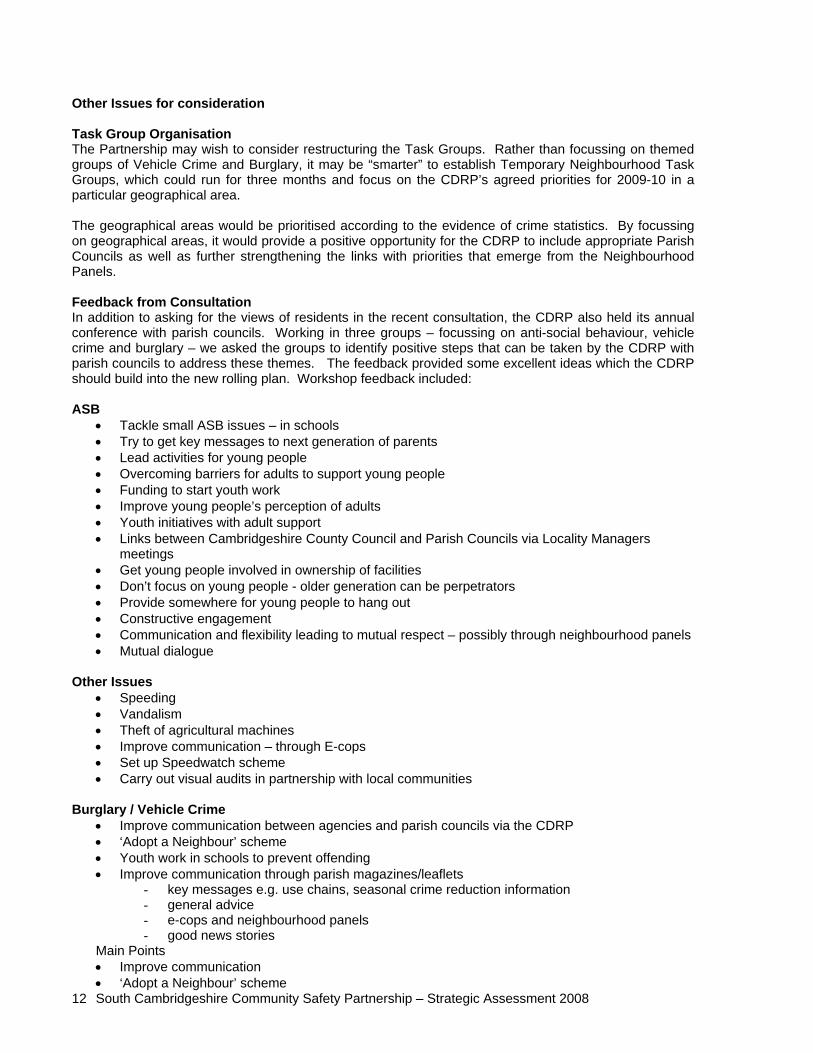
Other Issues for consideration Task Group Organisation The Partnership may wish to consider restructuring the Task Groups. Rather than focussing on themed groups of Vehicle Crime and Burglary, it may be “smarter” to establish Temporary Neighbourhood Task Groups, which could run for three months and focus on the CDRP’s agreed priorities for 2009-10 in a particular geographical area. The geographical areas would be prioritised according to the evidence of crime statistics. By focussing on geographical areas, it would provide a positive opportunity for the CDRP to include appropriate Parish Councils as well as further strengthening the links with priorities that emerge from the Neighbourhood Panels. Feedback from Consultation In addition to asking for the views of residents in the recent consultation, the CDRP also held its annual conference with parish councils. Working in three groups – focussing on anti-social behaviour, vehicle crime and burglary – we asked the groups to identify positive steps that can be taken by the CDRP with parish councils to address these themes. The feedback provided some excellent ideas which the CDRP should build into the new rolling plan. Workshop feedback included: ASB
• Tackle small ASB issues – in schools • Try to get key messages to next generation of parents • Lead activities for young people • Overcoming barriers for adults to support young people • Funding to start youth work • Improve young people’s perception of adults • Youth initiatives with adult support • Links between Cambridgeshire County Council and Parish Councils via Locality Managers
meetings • Get young people involved in ownership of facilities • Don’t focus on young people - older generation can be perpetrators • Provide somewhere for young people to hang out • Constructive engagement • Communication and flexibility leading to mutual respect – possibly through neighbourhood panels • Mutual dialogue
Other Issues
• Speeding • Vandalism • Theft of agricultural machines • Improve communication – through E-cops • Set up Speedwatch scheme • Carry out visual audits in partnership with local communities
Burglary / Vehicle Crime
• Improve communication between agencies and parish councils via the CDRP • ‘Adopt a Neighbour’ scheme • Youth work in schools to prevent offending • Improve communication through parish magazines/leaflets
- key messages e.g. use chains, seasonal crime reduction information - general advice - e-cops and neighbourhood panels - good news stories
Main Points • Improve communication • ‘Adopt a Neighbour’ scheme

South Cambridgeshire Community Safety Partnership – Strategic Assessment 2008 13
South Cambridgeshire Community Safety Partnership – Strategic Assessment 2008 14
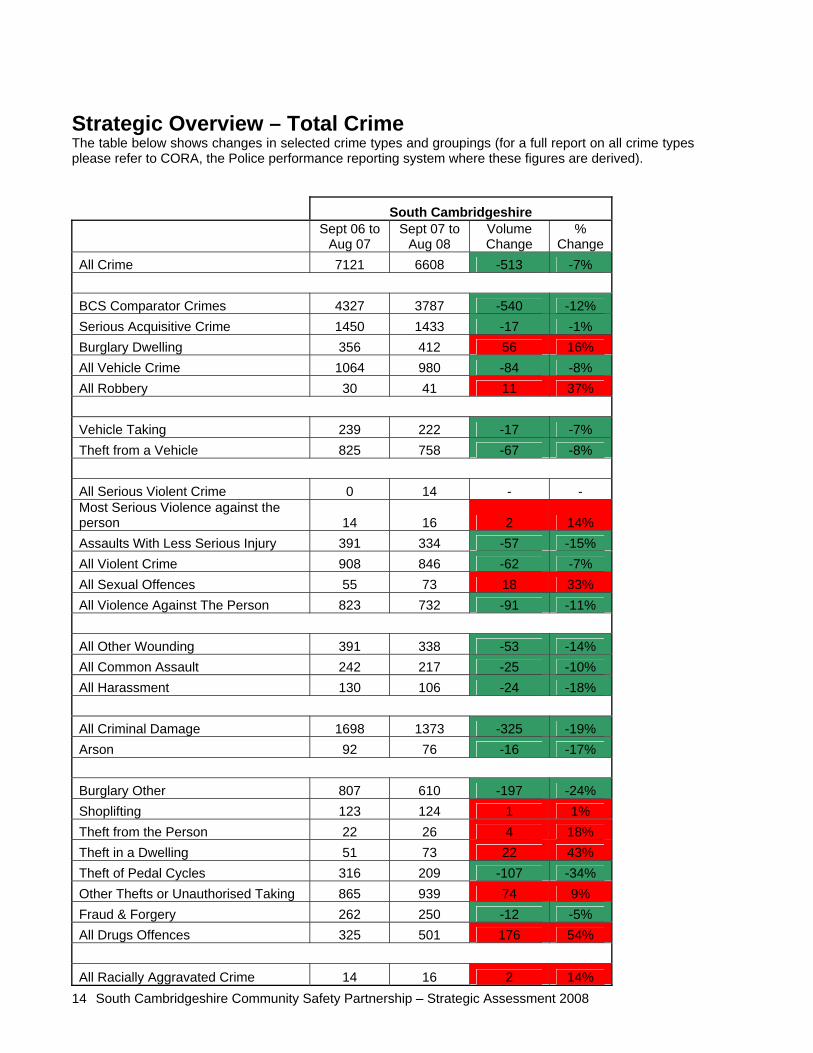
Strategic Overview – Total Crime The table below shows changes in selected crime types and groupings (for a full report on all crime types please refer to CORA, the Police performance reporting system where these figures are derived).
South Cambridgeshire
Sept 06 to
Aug 07 Sept 07 to
Aug 08 Volume Change
% Change
All Crime 7121 6608 -513 -7% BCS Comparator Crimes 4327 3787 -540 -12% Serious Acquisitive Crime 1450 1433 -17 -1% Burglary Dwelling 356 412 56 16% All Vehicle Crime 1064 980 -84 -8% All Robbery 30 41 11 37% Vehicle Taking 239 222 -17 -7% Theft from a Vehicle 825 758 -67 -8% All Serious Violent Crime 0 14 - - Most Serious Violence against the person 14 16 2 14% Assaults With Less Serious Injury 391 334 -57 -15% All Violent Crime 908 846 -62 -7% All Sexual Offences 55 73 18 33% All Violence Against The Person 823 732 -91 -11% All Other Wounding 391 338 -53 -14% All Common Assault 242 217 -25 -10% All Harassment 130 106 -24 -18% All Criminal Damage 1698 1373 -325 -19% Arson 92 76 -16 -17% Burglary Other 807 610 -197 -24% Shoplifting 123 124 1 1% Theft from the Person 22 26 4 18% Theft in a Dwelling 51 73 22 43% Theft of Pedal Cycles 316 209 -107 -34% Other Thefts or Unauthorised Taking 865 939 74 9% Fraud & Forgery 262 250 -12 -5% All Drugs Offences 325 501 176 54% All Racially Aggravated Crime 14 16 2 14%
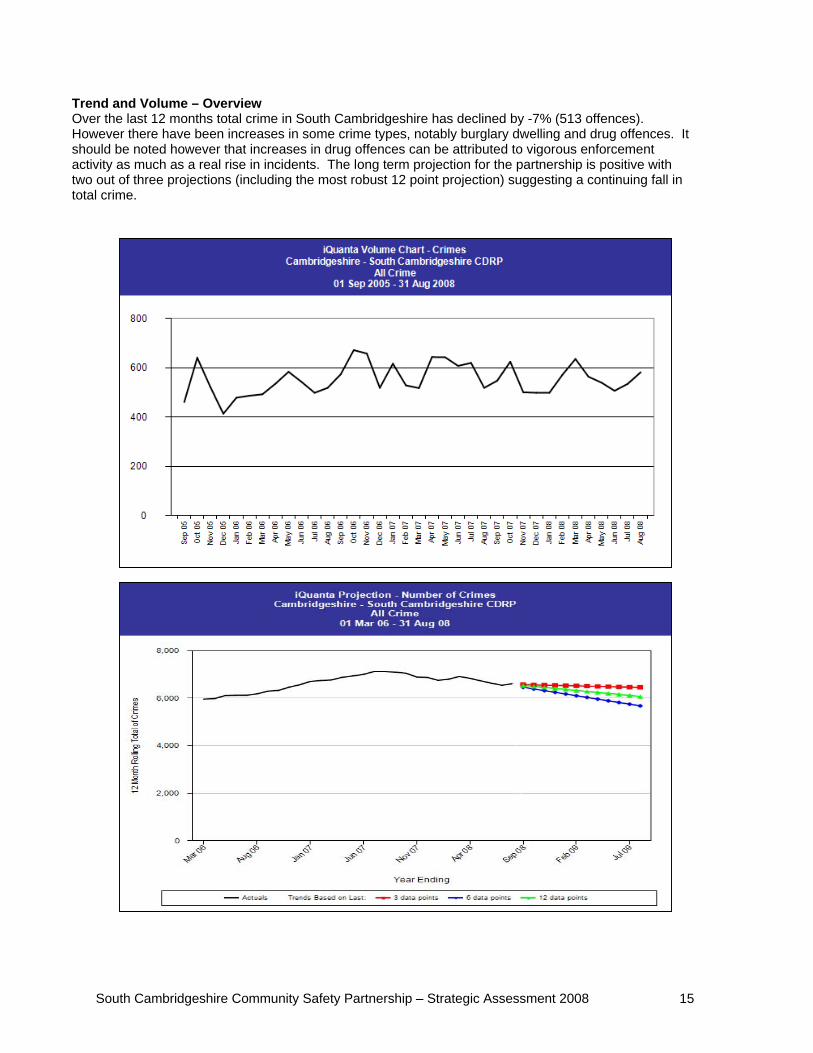
Trend and Volume – Overview Over the last 12 months total crime in South Cambridgeshire has declined by -7% (513 offences). However there have been increases in some crime types, notably burglary dwelling and drug offences. It should be noted however that increases in drug offences can be attributed to vigorous enforcement activity as much as a real rise in incidents. The long term projection for the partnership is positive with two out of three projections (including the most robust 12 point projection) suggesting a continuing fall in total crime.
South Cambridgeshire Community Safety Partnership – Strategic Assessment 2008 15
SERIOUS ACQUISITIVE CRIME
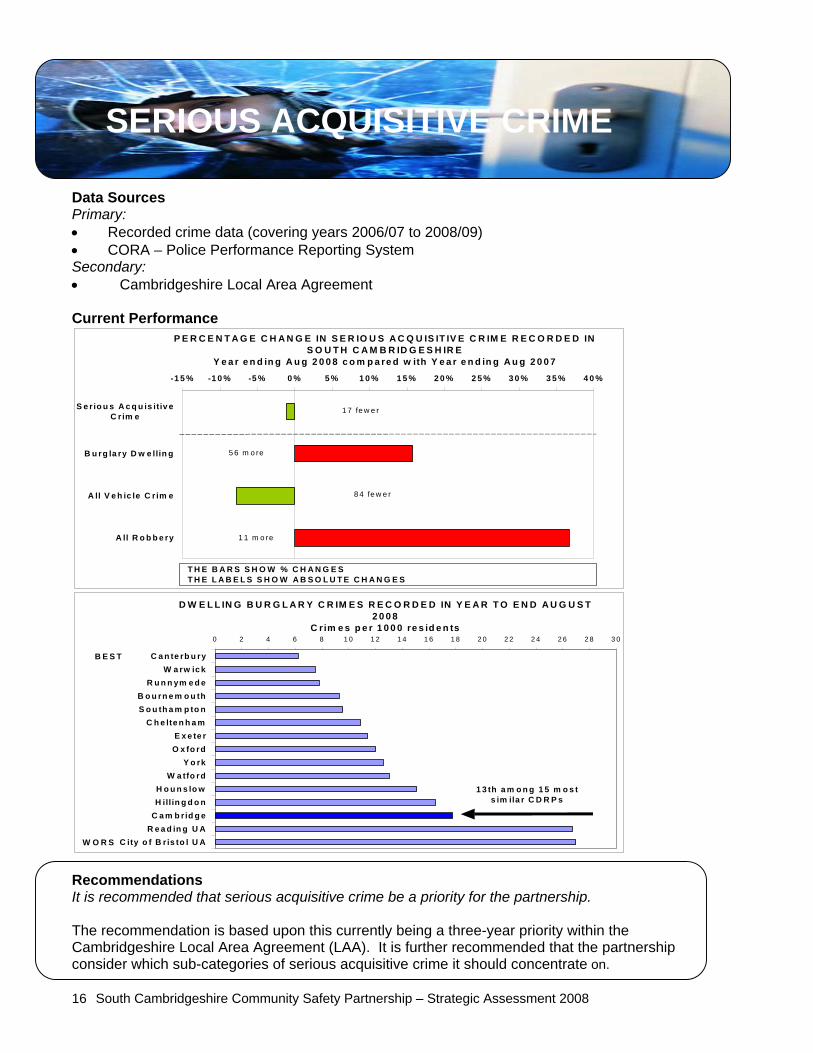
Data Sources Primary: • Recorded crime data (covering years 2006/07 to 2008/09) • CORA – Police Performance Reporting System Secondary: • Cambridgeshire Local Area Agreement
Current Performance
P E R C E N T A G E C H A N G E IN S E R IO U S A C Q U IS IT IV E C R IM E R E C O R D E D IN S O U T H C A M B R ID G E S H IR E
Y e a r e n d in g A u g 2 0 0 8 c o m p a re d w ith Y e a r e n d in g A u g 2 0 0 7
1 7 fe w e r
5 6 m o re
8 4 fe w e r
1 1 m o re
-1 5 % -1 0 % -5 % 0 % 5 % 1 0 % 1 5 % 2 0 % 2 5 % 3 0 % 3 5 % 4 0 %
S e rio u s A c q u is itiv eC r im e
B u rg la ry D w e llin g
A ll V e h ic le C r im e
A ll R o b b e ry
T H E B A R S S H O W % C H A N G E ST H E L A B E L S S H O W A B S O L U T E C H A N G E S
D W E L L IN G B U R G L A R Y C R IM E S R E C O R D E D IN Y E A R T O E N D A U G U S T 2 0 0 8
C r im e s p e r 1 0 0 0 re s id e n ts0 2 4 6 8 1 0 1 2 1 4 1 6 1 8 2 0 2 2 2 4 2 6 2 8 3 0
C a n te rb u ryW a rw ic k
R u n n ym e d eB o u rn e m o u thS o u th a m p to n
C h e lte n h a mE x e te rO x fo rd
Y o rkW a tfo rd
H o u n s lo wH illin g d o n
C a m b rid g eR e a d in g U A
C ity o f B r is to l U A
1 3 th a m o n g 1 5 m o s t s im ila r C D R P s
B E S T
W O R S Recommendations It is recommended that serious acquisitive crime be a priority for the partnership. The recommendation is based upon this currently being a three-year priority within the Cambridgeshire Local Area Agreement (LAA). It is further recommended that the partnership consider which sub-categories of serious acquisitive crime it should concentrate on.
South Cambridgeshire Community Safety Partnership – Strategic Assessment 2008 16
ANALYSIS – Serious Acquisitive Crime General Picture The Category of ‘Serious Acquisitive Crime’ is relatively new and refers to National Indicator 16, which has been adopted as a countywide priority within the Cambridgeshire Local Area Agreement. This category of crime includes all forms of dwelling burglary, vehicle crime and robbery. A summary of performance for each of these is as follows:
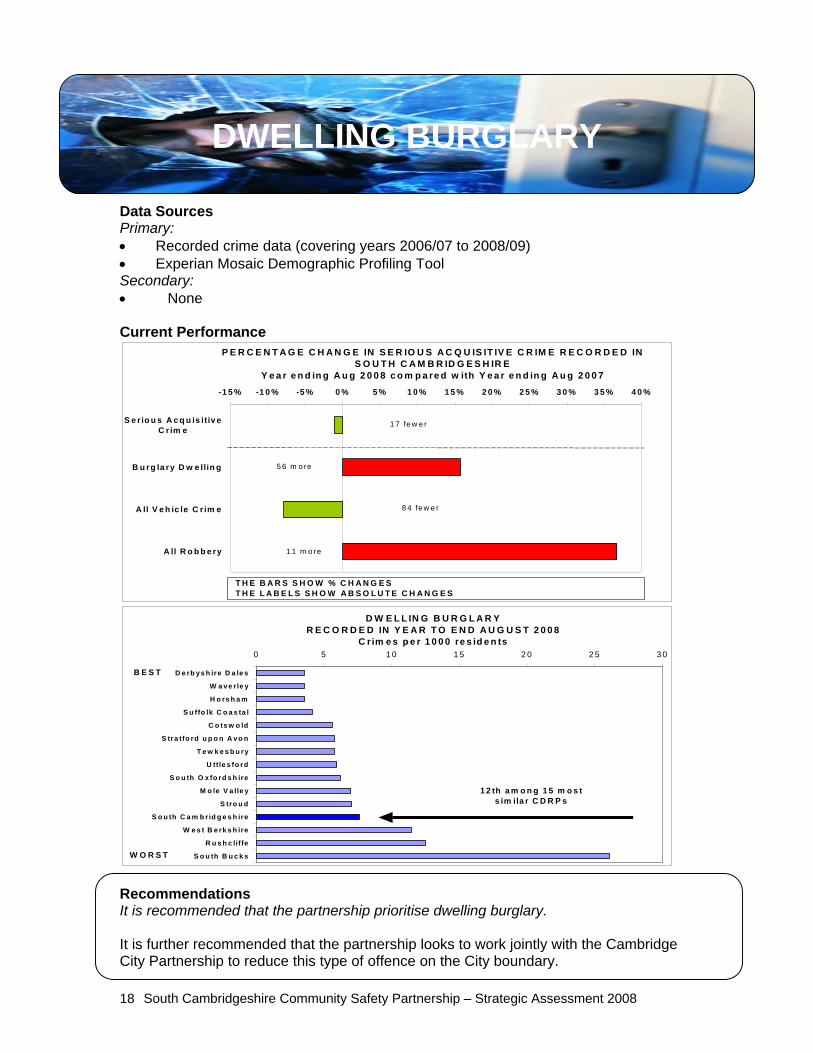
• Dwelling Burglary has increased by 16% over the previous twelve months. A more detailed analysis follows.
• Vehicle Crime has decreased by 8%. A more detailed analysis follows
• Robbery has increased but due to the relatively low level of incidents there is no further analysis of robbery within this strategic assessment document.
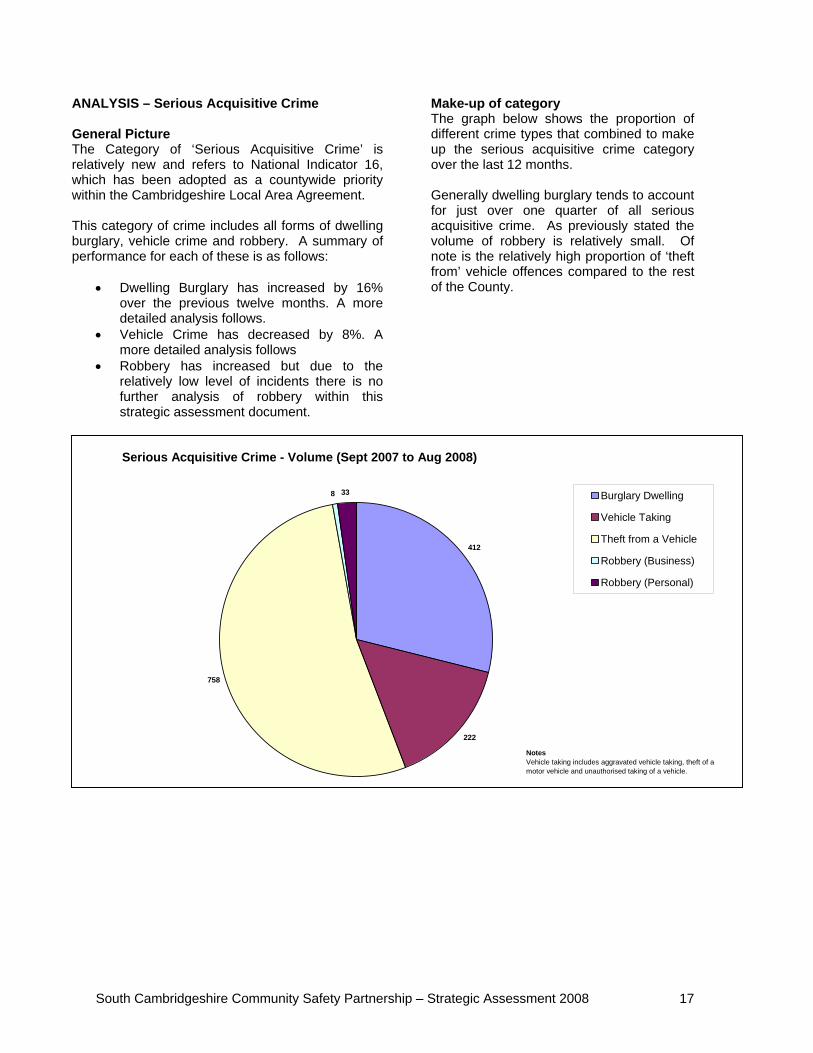
Make-up of category The graph below shows the proportion of different crime types that combined to make up the serious acquisitive crime category over the last 12 months. Generally dwelling burglary tends to account for just over one quarter of all serious acquisitive crime. As previously stated the volume of robbery is relatively small. Of note is the relatively high proportion of ‘theft from’ vehicle offences compared to the rest of the County.
Serious Acquisitive Crime - Volume (Sept 2007 to Aug 2008)
412
222
758
8 33 Burglary Dwelling
Vehicle Taking
Theft from a Vehicle
Robbery (Business)
Robbery (Personal)
NotesVehicle taking includes aggravated vehicle taking, theft of a motor vehicle and unauthorised taking of a vehicle.
South Cambridgeshire Community Safety Partnership – Strategic Assessment 2008 17
DWELLING BURGLARY
Data Sources Primary: • Recorded crime data (covering years 2006/07 to 2008/09) • Experian Mosaic Demographic Profiling Tool Secondary: • None
Current Performance
P E R C E N T A G E C H A N G E IN S E R IO U S A C Q U IS IT IV E C R IM E R E C O R D E D IN S O U T H C A M B R ID G E S H IR E
Y e a r e n d in g A u g 2 0 0 8 c o m p a re d w ith Y e a r e n d in g A u g 2 0 0 7
1 7 fe w e r
5 6 m o re
8 4 fe w e r
1 1 m o re
-1 5 % -1 0 % -5 % 0 % 5 % 1 0 % 1 5 % 2 0 % 2 5 % 3 0 % 3 5 % 4 0 %
S e rio u s A c q u is itiv eC r im e
B u rg la ry D w e llin g
A ll V e h ic le C r im e
A ll R o b b e ry
T H E B A R S S H O W % C H A N G E ST H E L A B E L S S H O W A B S O L U T E C H A N G E S
D W E L L IN G B U R G L A R YR E C O R D E D IN Y E A R T O E N D A U G U S T 2 0 0 8
C r im e s p e r 1 0 0 0 re s id e n ts0 5 1 0 1 5 2 0 2 5 3 0
D e rb ys h ire D a le s
W a ve rle y
H o rs h a m
S u ffo lk C o a s ta l
C o ts w o ld
S tra tfo rd u p o n A vo n
T e w k e s b u ry
U ttle s fo rd
S o u th O x fo rd s h ire
M o le V a lle y
S tro u d
S o u th C a m b r id g e s h ire
W e s t B e rk s h ire
R u s h c liffe
S o u th B u c k s
1 2 th a m o n g 1 5 m o s t s im ila r C D R P s
B E S T
W O R S T
Recommendations It is recommended that the partnership prioritise dwelling burglary. It is further recommended that the partnership looks to work jointly with the Cambridge City Partnership to reduce this type of offence on the City boundary.
South Cambridgeshire Community Safety Partnership – Strategic Assessment 2008 18
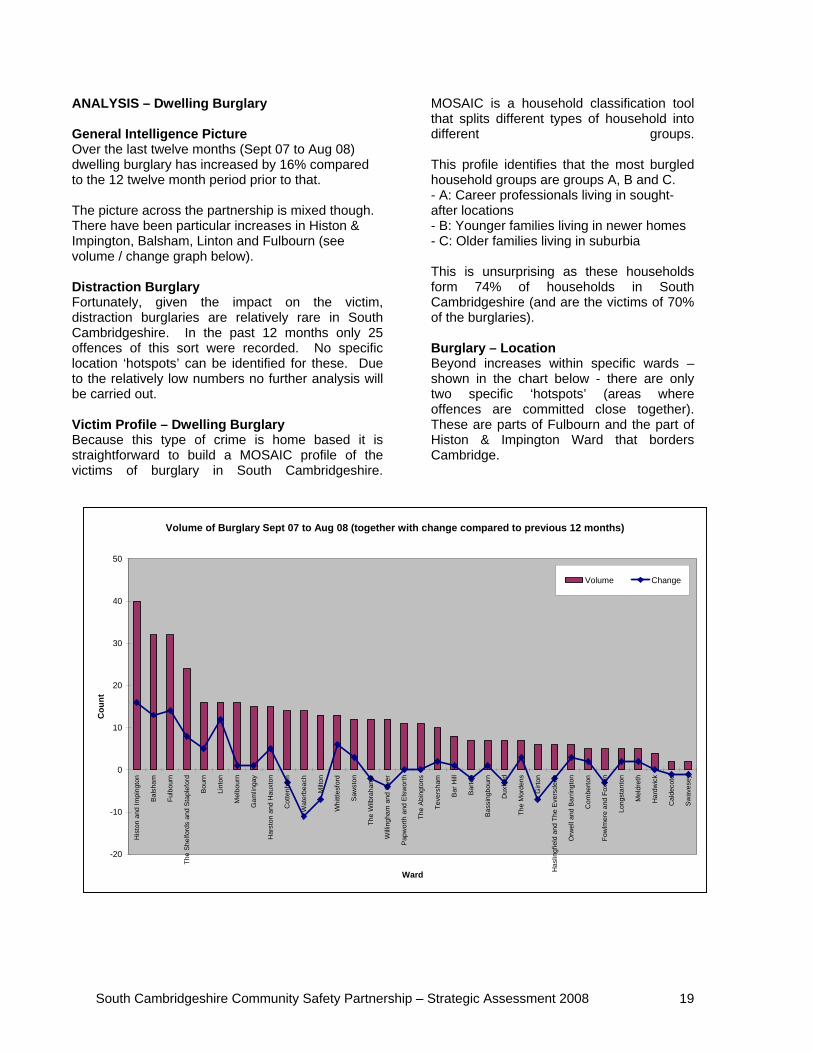
ANALYSIS – Dwelling Burglary General Intelligence Picture Over the last twelve months (Sept 07 to Aug 08) dwelling burglary has increased by 16% compared to the 12 twelve month period prior to that. The picture across the partnership is mixed though. There have been particular increases in Histon & Impington, Balsham, Linton and Fulbourn (see volume / change graph below). Distraction Burglary Fortunately, given the impact on the victim, distraction burglaries are relatively rare in South Cambridgeshire. In the past 12 months only 25 offences of this sort were recorded. No specific location ‘hotspots’ can be identified for these. Due to the relatively low numbers no further analysis will be carried out. Victim Profile – Dwelling Burglary Because this type of crime is home based it is straightforward to build a MOSAIC profile of the victims of burglary in South Cambridgeshire.
MOSAIC is a household classification tool that splits different types of household into different groups. This profile identifies that the most burgled household groups are groups A, B and C. - A: Career professionals living in sought-after locations - B: Younger families living in newer homes - C: Older families living in suburbia This is unsurprising as these households form 74% of households in South Cambridgeshire (and are the victims of 70% of the burglaries). Burglary – Location Beyond increases within specific wards – shown in the chart below - there are only two specific ‘hotspots’ (areas where offences are committed close together). These are parts of Fulbourn and the part of Histon & Impington Ward that borders Cambridge.
Volume of Burglary Sept 07 to Aug 08 (together with change compared to previous 12 months)
-20
-10
0
10
20
30
40
50
His
ton
and
Impi
ngto
n
Bal
sham
Fulb
ourn
The
She
lford
s an
d S
tapl
efor
d
Bou
rn
Lint
on
Mel
bour
n
Gam
linga
y
Har
ston
and
Hau
xton
Cot
tenh
am
Wat
erbe
ach
Milt
on
Whi
ttles
ford
Saw
ston
The
Wilb
raha
ms
Will
ingh
am a
nd O
ver
Pap
wor
th a
nd E
lsw
orth
The
Abi
ngto
ns
Teve
rsha
m
Bar
Hill
Bar
ton
Bas
sing
bour
n
Dux
ford
The
Mor
dens
Girt
on
Has
lingf
ield
and
The
Eve
rsde
ns
Orw
ell a
nd B
arrin
gton
Com
berto
n
Fow
lmer
e an
d Fo
xton
Long
stan
ton
Mel
dret
h
Har
dwic
k
Cal
deco
te
Sw
aves
ey
Ward
Cou
nt
Volume Change
South Cambridgeshire Community Safety Partnership – Strategic Assessment 2008 19
South Cambridgeshire Community Safety Partnership – Strategic Assessment 2008 20
VEHICLE CRIME
Data Sources Primary: • Recorded crime data (covering years 2006/07 to 2008/09) Secondary: • None
Current Performance
P E R C E N T A G E C H A N G E IN V E H IC L E C R IM E R E C O R D E D IN S O U T H C A M B R ID G E S H IR E
Y e a r e n d in g A u g 2 0 0 8 c o m p a re d w ith Y e a r e n d in g A u g 2 0 0 7
8 4 fe w e r
1 7 fe w e r
6 7 fe w e r
-8 % -8 % -8 % -8 % -7 % -7 % -7 % -7 % -7 %
A ll V e h ic le C r im e
V e h ic le T a k in g
T h e ft fro m a V e h ic le
T H E B A R S S H O W % C H A N G E ST H E L A B E L S S H O W A B S O L U T E C H A N G E S
V E H IC L E C R IM E IN Y E A R T O E N D A U G U S T 2 0 0 8
C r im e s p e r 1 0 0 0 re s id e n ts
0 2 4 6 8 1 0 1 2 1 4 1 6 1 8 2 0 2 2
S u ffo lk C o a s ta l
H o rs h a m
C o ts w o ld
U ttle s fo rd
D e rb ys h ire D a le s
W a ve rle y
M o le V a lle y
T e w k e s b u ry
S o u th O x fo rd s h ire
S tra tfo rd u p o n A v o n
S o u th C a m b r id g e s h ire
S tro u d
R u s h c liffe
W e s t B e rk s h ire
S o u th B u c k s
1 1 th a m o n g 1 5 m o s t s im ila r C D R P s
B E S T
W O R S T
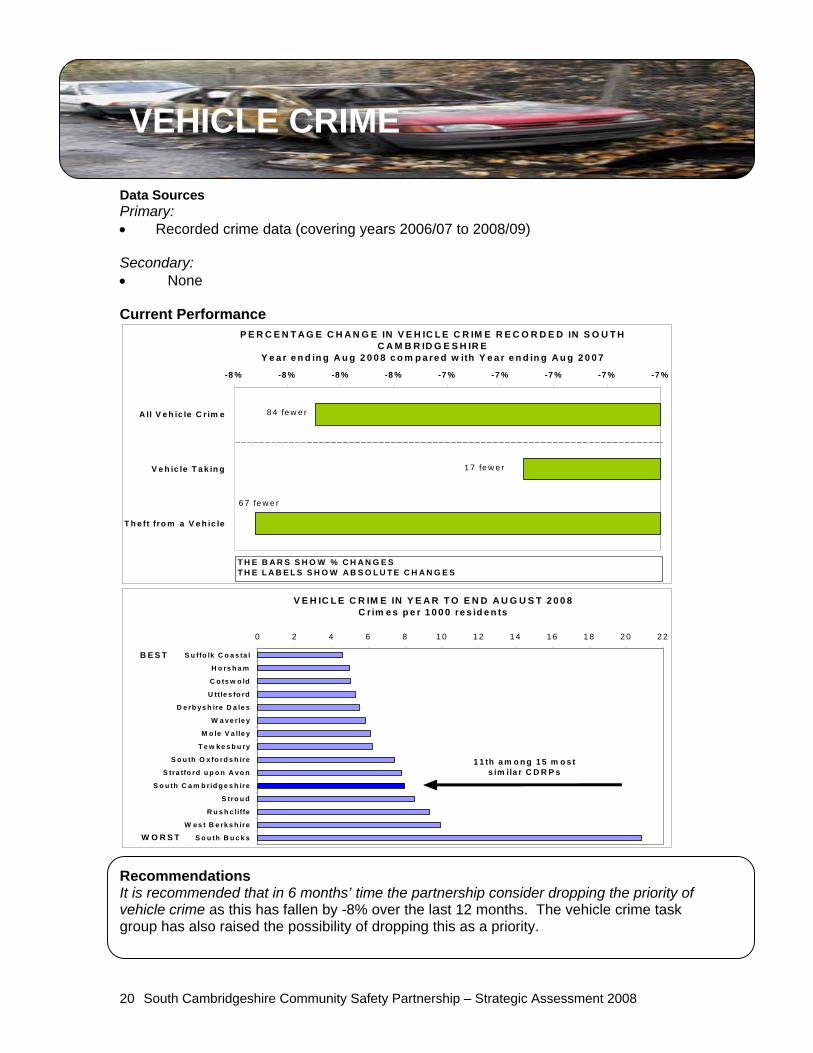
Recommendations It is recommended that in 6 months’ time the partnership consider dropping the priority of vehicle crime as this has fallen by -8% over the last 12 months. The vehicle crime task group has also raised the possibility of dropping this as a priority.
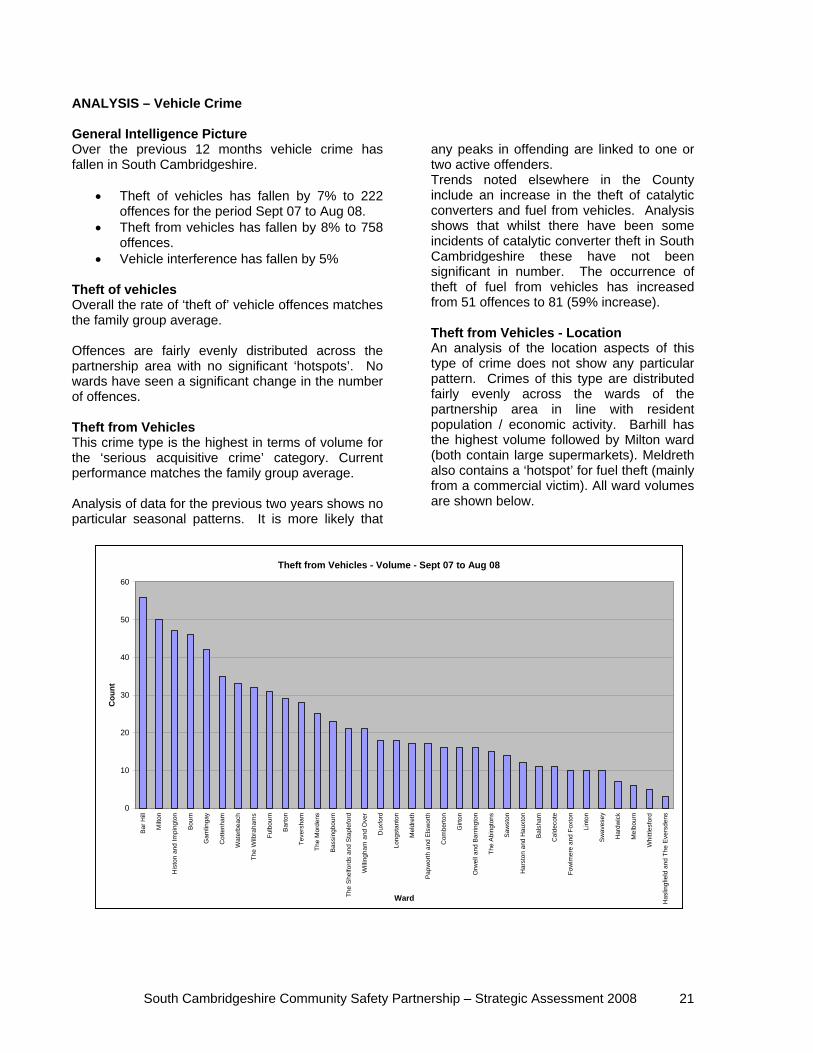
ANALYSIS – Vehicle Crime General Intelligence Picture Over the previous 12 months vehicle crime has fallen in South Cambridgeshire.
• Theft of vehicles has fallen by 7% to 222 offences for the period Sept 07 to Aug 08.
• Theft from vehicles has fallen by 8% to 758 offences.
• Vehicle interference has fallen by 5% Theft of vehicles Overall the rate of ‘theft of’ vehicle offences matches the family group average. Offences are fairly evenly distributed across the partnership area with no significant ‘hotspots’. No wards have seen a significant change in the number of offences. Theft from Vehicles This crime type is the highest in terms of volume for the ‘serious acquisitive crime’ category. Current performance matches the family group average. Analysis of data for the previous two years shows no particular seasonal patterns. It is more likely that
any peaks in offending are linked to one or two active offenders. Trends noted elsewhere in the County include an increase in the theft of catalytic converters and fuel from vehicles. Analysis shows that whilst there have been some incidents of catalytic converter theft in South Cambridgeshire these have not been significant in number. The occurrence of theft of fuel from vehicles has increased from 51 offences to 81 (59% increase). Theft from Vehicles - Location An analysis of the location aspects of this type of crime does not show any particular pattern. Crimes of this type are distributed fairly evenly across the wards of the partnership area in line with resident population / economic activity. Barhill has the highest volume followed by Milton ward (both contain large supermarkets). Meldreth also contains a ‘hotspot’ for fuel theft (mainly from a commercial victim). All ward volumes are shown below.
Theft from Vehicles - Volume - Sept 07 to Aug 08
0
10
20
30
40
50
60
Bar H
ill
Milt
on
His
ton
and
Impi
ngto
n
Bour
n
Gam
linga
y
Cot
tenh
am
Wat
erbe
ach
The
Wilb
raha
ms
Fulb
ourn
Barto
n
Teve
rsha
m
The
Mor
dens
Bas
sing
bour
n
The
Shel
ford
s an
d S
tapl
efor
d
Will
ingh
am a
nd O
ver
Dux
ford
Long
stan
ton
Mel
dret
h
Papw
orth
and
Els
wor
th
Com
berto
n
Girt
on
Orw
ell a
nd B
arrin
gton
The
Abi
ngto
ns
Saw
ston
Har
ston
and
Hau
xton
Bal
sham
Cal
deco
te
Fow
lmer
e an
d Fo
xton
Lint
on
Sw
aves
ey
Har
dwic
k
Mel
bour
n
Whi
ttles
ford
Has
lingf
ield
and
The
Eve
rsde
ns
Ward
Cou
nt
South Cambridgeshire Community Safety Partnership – Strategic Assessment 2008 21
South Cambridgeshire Community Safety Partnership – Strategic Assessment 2008 22
OTHER ACQUISITIVE CRIME Data Sources Primary: • Recorded crime data (covering years 2006/07 to 2008/09) Secondary: • None
Current Performance
PERCENTAGE CHANGE IN OTHER ACQUISITIVE CRIME RECORDED IN SOUTH CAMBRIDGESHIRE
Year ending Aug 2008 compared with Year ending Aug 2007
12 fewer
55 fewer
74 more
107 fewer
22 more
4 more
1 more
197 fewer
270 fewer
-80% -60% -40% -20% 0% 20% 40% 60%
Other acquisitive crime
Shoplifting
Theft in a Dwelling
Other Thefts orUnauthorised Taking
Fraud & Forgery
THE BARS SHOW % CHANGESTHE LABELS SHOW ABSOLUTE CHANGES
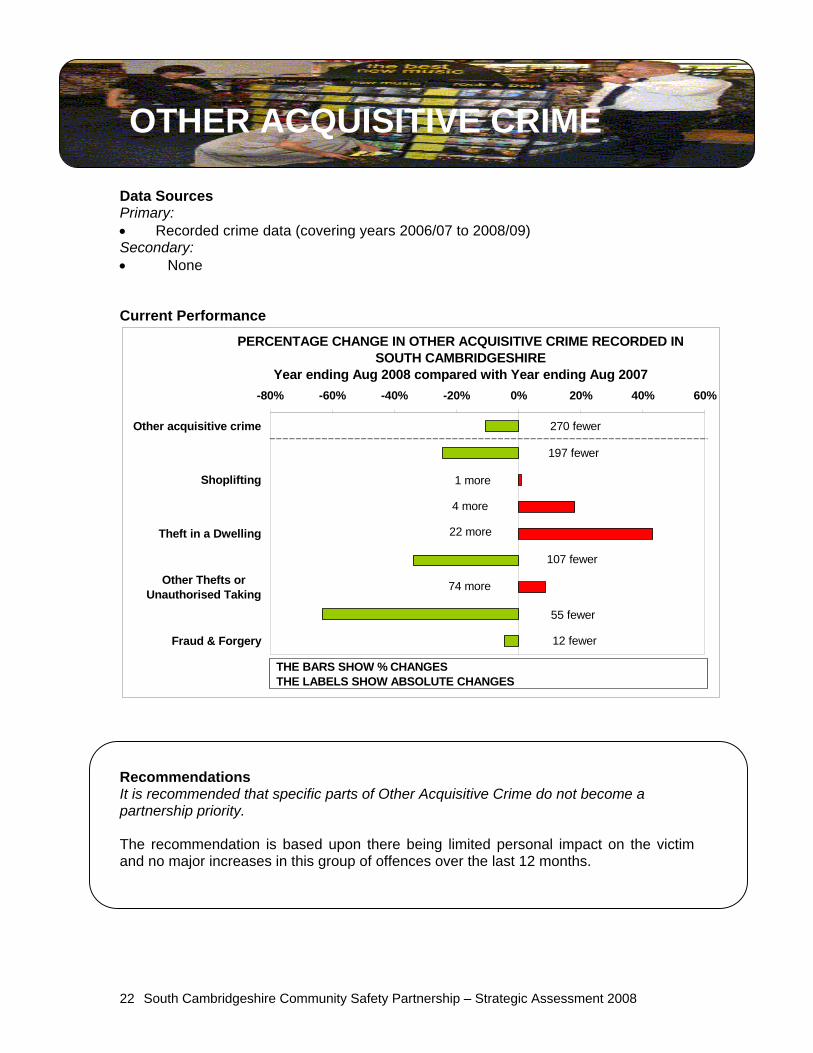
Recommendations It is recommended that specific parts of Other Acquisitive Crime do not become a partnership priority. The recommendation is based upon there being limited personal impact on the victim and no major increases in this group of offences over the last 12 months.
South Cambridgeshire Community Safety Partnership – Strategic Assessment 2008 23
ANALYSIS – Other Acquisitive Crime This section covers other acquisitive crime not included elsewhere in the strategic assessment.
• Other burglary • Theft from shops (shop lifting) • Theft from the person • Theft in a dwelling • Theft of pedal cycles • All other thefts
Other Burglary This includes burglaries of sheds and garages and burglaries of business premises or civic premises (e.g. schools). Overall this group of offences has decreased by 24% over the last twelve months to 610 offences. This type of offence has an impact on both business and rural communities. However, this is not currently a partnership priority and no further analysis will be carried out at this stage. Theft from shops (shop lifting) South Cambridgeshire does not have any significant retail centres. Consequently the volume of this type of offence is relatively low - 124 offences in the last 12 months - and the partnership is the best performer within the family group. An analysis of the geographic distribution of offences reflects where the main retail outlets are. Most offences are committed in the main supermarkets. Theft from the person This covers the theft of (generally small) personal items e.g. phones or wallets whilst in the possession of someone. Overall the number of this type of offence is small and there has been no significant change in volume so no further analysis will be carried out. Theft in a dwelling This covers the theft of items from inside a dwelling by someone other than a burglar. Overall the number of this type of offence is small and there has been no significant change in volume so no further analysis will be carried out. Theft of pedal cycles The volume of this type of offences committed in South Cambridgeshire is relatively low compared to other crime types. It has also decreased by 34% over the past 12 months to 209 offences and the position against the family group is good.
All other thefts This covers a range of thefts not covered by the above. Amongst the most common type of offence is the theft of unattended items such as bags but it also includes the theft of lead from roofs, theft of items from gardens or other open spaces. The volume of this type of offence is high, 939 over the last 12 months and it has increased by 9%. Identifying specific trends is difficult as this category covers such a wide range of different activity. However some concern has been raised regarding the increase in thefts of metal (e.g. lead from roofs). A more detailed analysis on this has been completed by the constabulary.
South Cambridgeshire Community Safety Partnership – Strategic Assessment 2008 24
VIOLENT CRIME
Data Sources Primary
• Recorded crime data • Ambulance Trust call-outs
Secondary • None
Current Performance
P E R C E N T A G E C H A N G E IN V IO L E N T C R IM E R E C O R D E D IN S O U T H C A M B R ID G E S H IR E
Y e a r e n d in g A u g 2 0 0 8 c o m p a re d w ith Y e a r e n d in g A u g 2 0 0 7
7 m o re
2 4 fe w e r
1 m o re
2 5 fe w e r
5 3 fe w e r
2 m o re1 m o re
1 5 fe w e r
1 m o re
1 1 m o re
6 2 fe w e r
-8 0 % -6 0 % -4 0 % -2 0 % 0 % 2 0 % 4 0 % 6 0 %
A ll V io le n t C r im e
A ll R o b b e ry
R a p eO th e r
S e x u a l O ffe n c e sH o m ic id e s
W o u n d in gE n d a n g e r in g L ife
A ll O th e r W o u n d in g
A ll C o m m o n A s s a u lt
A s s a u lt P o lic e
A ll H a ra s s m e n t
O th e r V io le n t C r im e
T H E B A R S S H O W % C H A N G E ST H E L A B E L S S H O W A B S O L U T E C H A N G E S
V IO L E N T C R IM E IN Y E A R E N D IN G A U G U S T 2 0 0 8 C r im e s p e r 1 0 0 0 re s id e n ts
0 2 4 6 8 1 0 1 2 1 4 1 6 1 8 2 0
S o u th C a m b r id g e s h ire
W a v e r le yS tra tfo rd u p o n A v o n
S u ffo lk C o a s ta lH o rs h a m
R u s h c liffeM o le V a lle y
C o ts w o ldU tt le s fo rd
D e rb ys h ire D a le s
T e w k e s b u ryS o u th O x fo rd s h ire
S tro u dW e s t B e rk s h ire
S o u th B u c k s
1 s t a m o n g 1 5 m o s t s im ila r C D R P s
B E S T
W O R S T
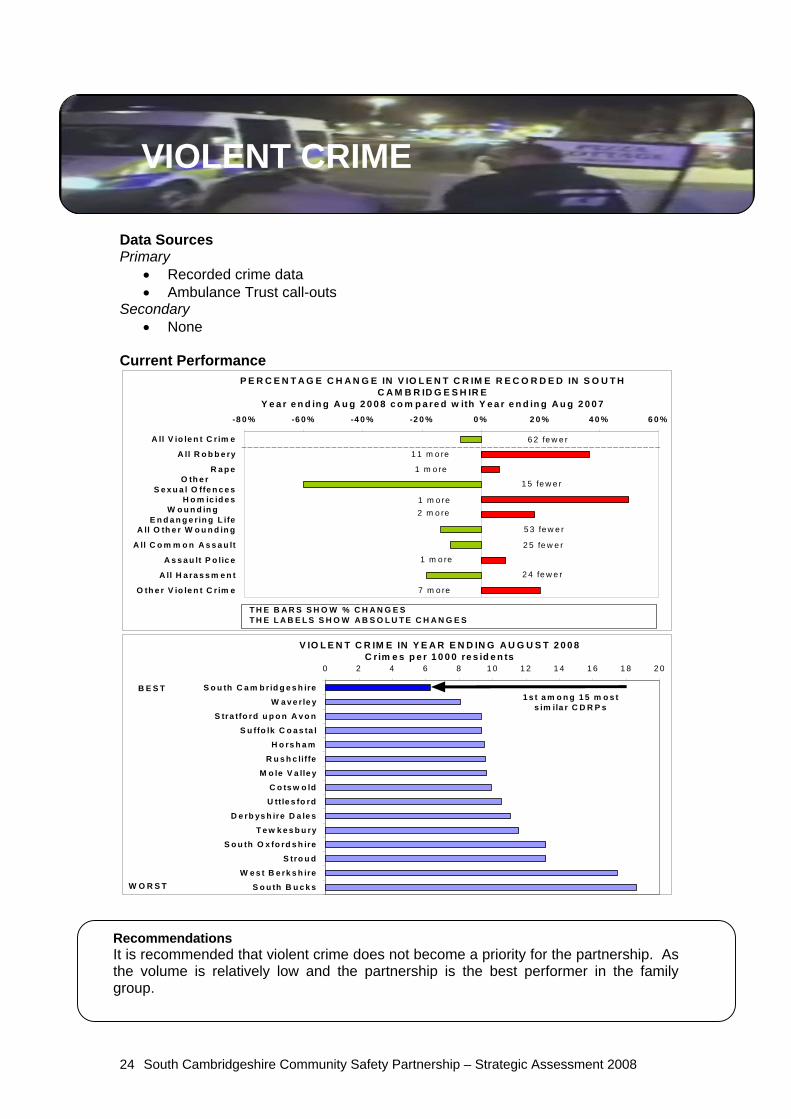
RecommendationsIt is recommended that violent crime does not become a priority for the partnership. As the volume is relatively low and the partnership is the best performer in the family group.
Analysis – violent crime Overview In South Cambridgeshire last year there were: • 846 violent crimes recorded
(September 2007 to August 2008); and • 170 Ambulance call-outs due to
assaults, shootings or stabbings (July 2007 to June 2008).
Of violent crimes, around 80% were common assault, other wounding or harassment. The most serious violence1 made up 2% of the total.
South Cambridgeshire Community Safety Partnership – Strategic Assessment 2008 25
Crimes Violent crime in the year ending August 2008 was 7% (62 cases) lower than last year though 4% higher (31 cases) than the year ending August 2006. Among violent offences, robbery is very low in South Cambridgeshire – it is the best performer of its most similar group and robbery makes up less than 1% of crimes. However, there has been an increase from 17 robberies in the year ending August 2006 and 30 last year to 41 in the year ending August 2008. Although from a low base, the recorded number of Most Serious Violent Crimes has also risen over the last three years2. The number of crimes in the categories of GBH/ABH and common assaults has fluctuated recently, but the level this year was similar to that three years ago. For these less serious violent crimes, there are two peaks in the day – one mid-morning and one 9 to 10pm on weekend evenings. The morning peak was mainly domestic incidents or at schools, hospitals or the police station. This is reflected in the map, which shows a hotspot at Kneesworth Hospital in Bassingbourn. Police analysis for Southern Division including South Cambridgeshire shows that knife crime is low: 0.8% of crime involved use, threat or presence of a knife and in less than 0.1% of crimes involving knives
1 Includes murder, attempted murder, manslaughter, child destruction, causing death by dangerous/careless driving, wounding endangering life, use of substance to endanger life, possession of items to endanger life, causing death by aggravated vehicle taking. 2 September 2005 to 2006 vs September 07 to 08
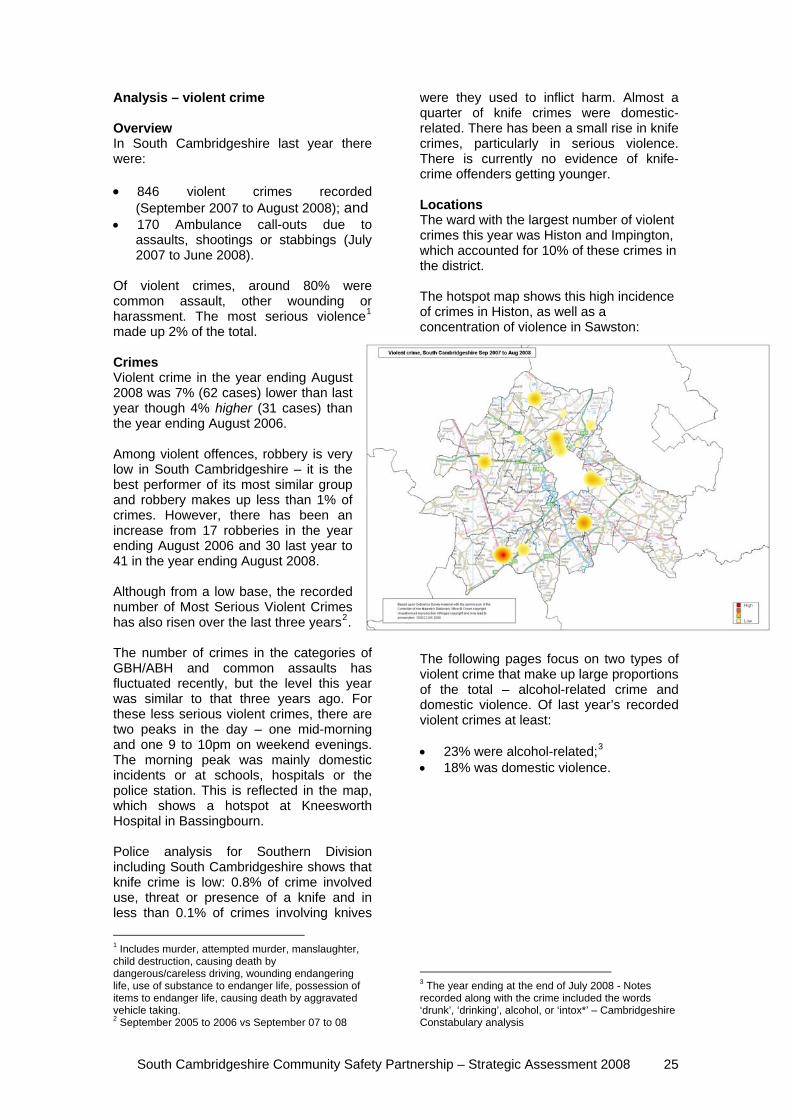
were they used to inflict harm. Almost a quarter of knife crimes were domestic-related. There has been a small rise in knife crimes, particularly in serious violence. There is currently no evidence of knife-crime offenders getting younger. Locations The ward with the largest number of violent crimes this year was Histon and Impington, which accounted for 10% of these crimes in the district. The hotspot map shows this high incidence of crimes in Histon, as well as a concentration of violence in Sawston:
The following pages focus on two types of violent crime that make up large proportions of the total – alcohol-related crime and domestic violence. Of last year’s recorded violent crimes at least: • 23% were alcohol-related;3 • 18% was domestic violence.
3 The year ending at the end of July 2008 - Notes recorded along with the crime included the words ‘drunk’, ‘drinking’, alcohol, or ‘intox*’ – Cambridgeshire Constabulary analysis
ALCOHOL-RELATED VIOLENCE
Data Sources Primary
• Recorded crime data • Ambulance Trust call-outs
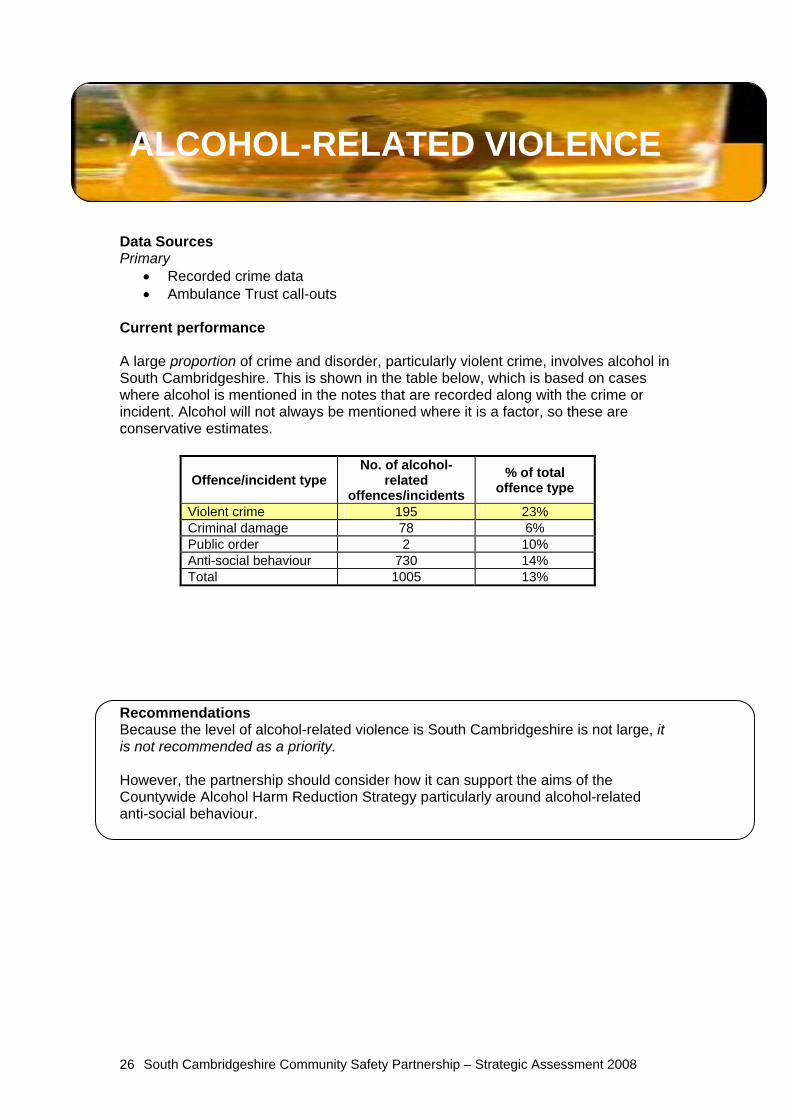
Current performance A large proportion of crime and disorder, particularly violent crime, involves alcohol in South Cambridgeshire. This is shown in the table below, which is based on cases where alcohol is mentioned in the notes that are recorded along with the crime or incident. Alcohol will not always be mentioned where it is a factor, so these are conservative estimates.
Offence/incident type No. of alcohol-
related offences/incidents
% of total offence type
Violent crime 195 23% Criminal damage 78 6% Public order 2 10% Anti-social behaviour 730 14% Total 1005 13%
Recommendations Because the level of alcohol-related violence is South Cambridgeshire is not large, it is not recommended as a priority. However, the partnership should consider how it can support the aims of the Countywide Alcohol Harm Reduction Strategy particularly around alcohol-related anti-social behaviour.
South Cambridgeshire Community Safety Partnership – Strategic Assessment 2008 26
Analysis – alcohol-related violence Extent of alcohol-related violence Alcohol and violence are associated. Using information from crime records suggests that at least 23% (195 cases) of violent crimes in South Cambridgeshire were alcohol-related last year; and this may be an underestimate. A national survey4 found that in 45% of all violent incidents, victims believed offenders to be under the influence of alcohol. This figure rose to 58% in cases of attacks by people they did not know. Many violent crimes happen at night, at weekends, in town centres. 74% of ambulance assault cases were at night5, peaking between 11pm and 2am. Most were at weekends - Saturday night accounts for 20%. Extent of drinking Although the problem is not worse than in other parts of the county, some very heavy drinking does take place in South Cambridgeshire: in the year to the end of June 2008 there were around 300 call-outs due to overdoses or poisonings – including at least 60 alcohol overdoses. Many were young people: 15% were aged 18 to 24.
Neighbourhood Panels show that the public are concerned about underage drinking – it is a current priority for Papworth, Bar Hill and Sawston.
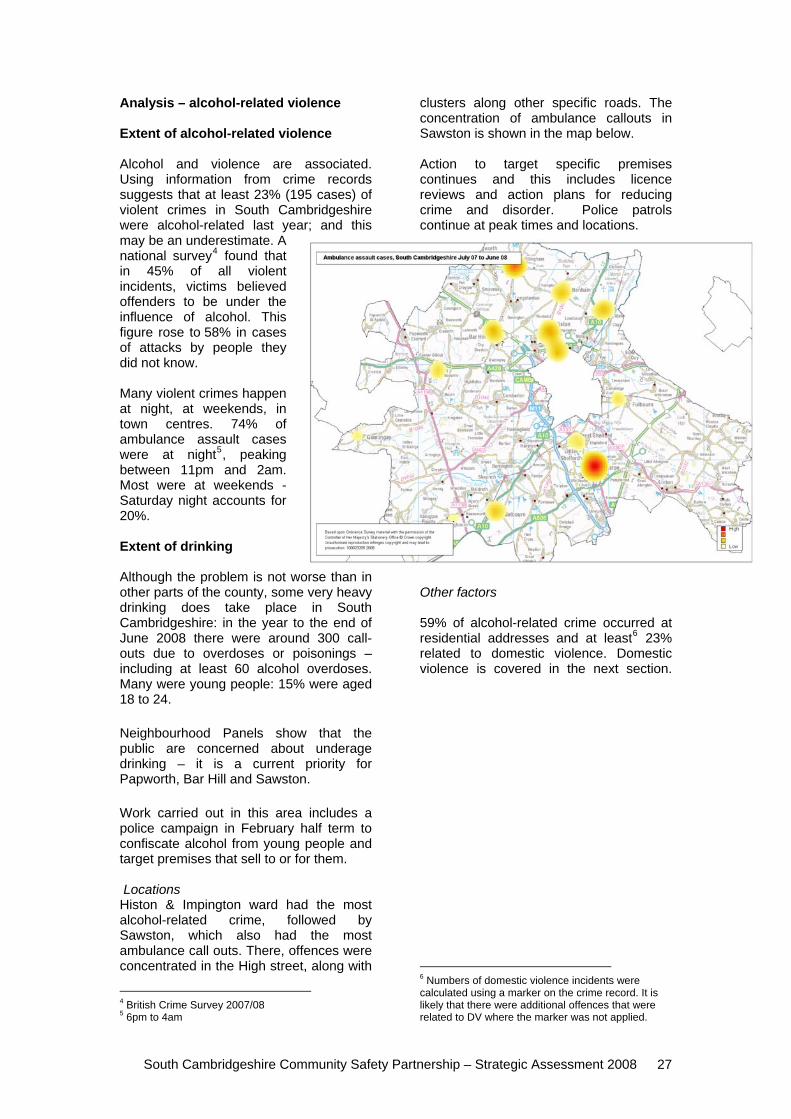
Work carried out in this area includes a police campaign in February half term to confiscate alcohol from young people and target premises that sell to or for them. Locations Histon & Impington ward had the most alcohol-related crime, followed by Sawston, which also had the most ambulance call outs. There, offences were concentrated in the High street, along with
4 British Crime Survey 2007/08 5 6pm to 4am
clusters along other specific roads. The concentration of ambulance callouts in Sawston is shown in the map below. Action to target specific premises continues and this includes licence reviews and action plans for reducing crime and disorder. Police patrols continue at peak times and locations.
Other factors 59% of alcohol-related crime occurred at residential addresses and at least6 23% related to domestic violence. Domestic violence is covered in the next section.
6 Numbers of domestic violence incidents were calculated using a marker on the crime record. It is likely that there were additional offences that were related to DV where the marker was not applied.
South Cambridgeshire Community Safety Partnership – Strategic Assessment 2008 27
R a te p e r 1 0 0 0 D o m e s tic e V io le n c e In c id e n ts - B y w a rd - 2 0 0 7
0
2
4
6
8
1 0
1 2
1 4
Balsha
m
Bar Hill
Barton
Bassin
gbou
rnBou
rn
Caldec
ote
Combe
rton
Cotten
ham
Duxfor
d
Fowlm
ere an
d Fox
ton
Fulbou
rn
Gamlin
gay
Girton
Hardwick
Harston
and H
auxto
n
Haslin
gfield
and T
he E
versd
ens
Histon
and I
mpingto
nLin
ton
Long
stanto
n
Melbou
rn
Meldret
hMilto
n
Orwell
and B
arring
ton
Papwort
h and
Elsw
orth
Sawsto
n
Swaves
ey
Tevers
ham
The A
bingto
ns
The M
orden
s
The S
helfo
rds an
d Stap
leford
The W
ilbrah
ams
Wate
rbeac
h
Whit
tlesfo
rd
Willin
gham
and O
ver
W a rd
Rat
e pe
r 100
0
DOMESTIC VIOLENCE & ABUSE
Data Sources Primary: • Recorded crime data (covering years 2006/07 to 2008/09) • Police Recorded Incidents (covering years 2006/07 to 2008/09) • Contacts and Referrals due to domestic violence to the County Council, Office
of Children & Young People • Referrals to the County Domestic Violence Advocacy Service Secondary: • “Child Referrals to Social Services in Cambridgeshire”, CCC Research
Group, 2007. • “An Analysis of Domestic Violence using a Range of Partnership Data to
Support the Establishment of a ‘Domestic Abuse Centre’ for Cambridgeshire”, CCC Research Group, 2007.
• Problem Profile – Domestic Abuse, Cambridgeshire Constabulary, 2007 • 1st Quarter report of the Independent Domestic Violence Advocacy Service
(2008/09) Current Performance
Recommendations It is recommended that domestic violence remain a priority. The recommendation is based upon there being identified gaps in the level of service provided to the victims of domestic abuse and due to an increase in the number of incidents being reported and of incidents being referred amongst partner agencies. This increase in reporting and referring is the achievement of our long-term aim, but it has created additional service pressures. However, it is further recommended that the level of desired service is agreed amongst partners. The aim would be to establish service goals which when met could lead to a judgment being taken that domestic violence services in the County are “excellent” and the topic of domestic abuse can change from being a priority area for improvement. It is suggested that the Countywide Domestic Abuse Forum take this second recommendation forward.
South Cambridgeshire Community Safety Partnership – Strategic Assessment 2008 28
ANALYSIS - Domestic Violence General Intelligence Picture In the build-up to the 2007/08 strategic assessment a comprehensive analysis of domestic abuse was completed that drew on a variety of partnership data sources and applied national rates to produce an estimate of the level of abuse with each of the partnership areas of Cambridgeshire. This analysis has not been repeated in full for this year’s assessment but some key datasets have been updated. The major conclusions from this previous work were. • The information picture regarding
domestic violence is good but it takes considerable effort to draw data together from different agencies.
• Based on national prevalence rates a possible 9,400 people experience partner ‘threat or force’ each year in the County. Given the expected level of repeat victimization it is likely that there are 29,200 incidents per year.
• Using a range of partnership data and taking into account some caveats it is possible to say that, at the very least, 500 victims per year in the County are requiring intensive service input from at least one agency.
• Based on a Cambridgeshire Constabulary ‘force problem profile’ on domestic violence 87% of victims are female and 13% male. The average age of victims (where recorded) was 34 years of age.
• For approximately 55% of incidents children were identified as being present.
• Measuring repeat victimization is difficult and there are complications around the identification and timescale. For a sample of incidents between April – September 2006 18.1% were defined as repeats.
• The majority of the perpetrators of domestic violence are males, with an average age of 35. From analysis of referral forms, alcohol would appear to be a factor in 8% - 10% of cases; drugs make up a much smaller proportion, between 1% and 2% of cases.
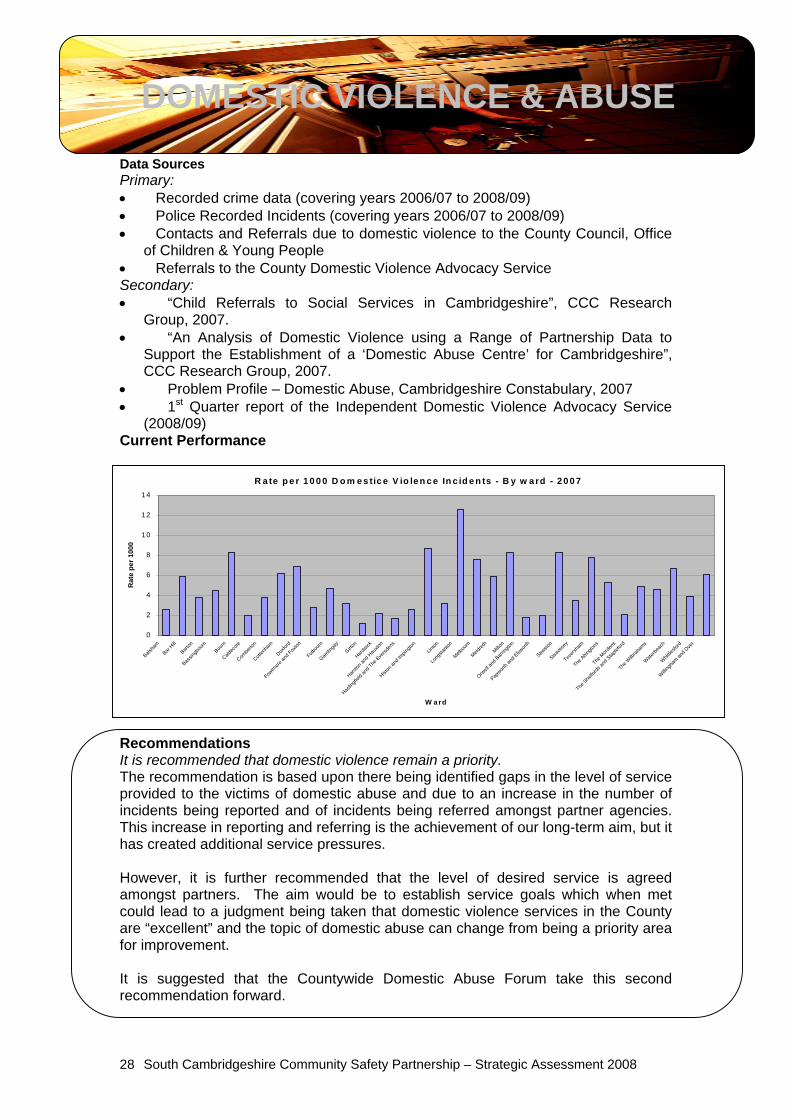
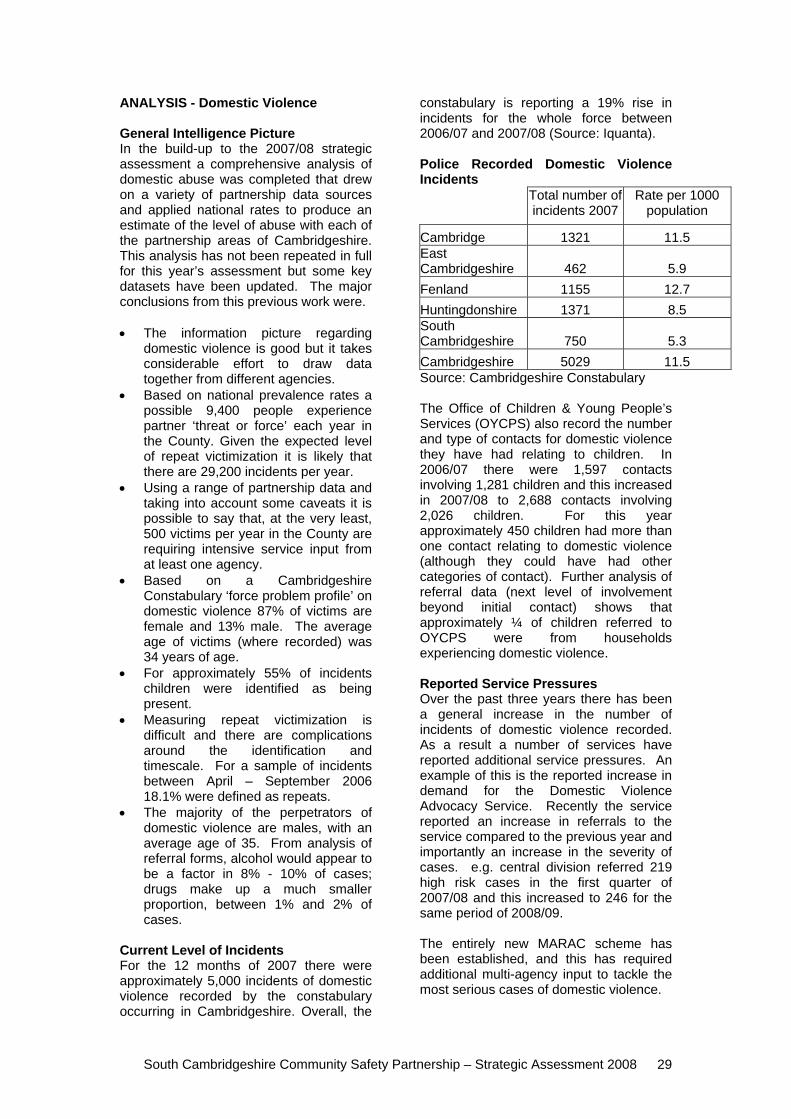
Current Level of Incidents For the 12 months of 2007 there were approximately 5,000 incidents of domestic violence recorded by the constabulary occurring in Cambridgeshire. Overall, the
constabulary is reporting a 19% rise in incidents for the whole force between 2006/07 and 2007/08 (Source: Iquanta). Police Recorded Domestic Violence Incidents Total number of
incidents 2007 Rate per 1000
population
Cambridge 1321 11.5 East Cambridgeshire 462 5.9 Fenland 1155 12.7 Huntingdonshire 1371 8.5 South Cambridgeshire 750 5.3 Cambridgeshire 5029 11.5 Source: Cambridgeshire Constabulary The Office of Children & Young People’s Services (OYCPS) also record the number and type of contacts for domestic violence they have had relating to children. In 2006/07 there were 1,597 contacts involving 1,281 children and this increased in 2007/08 to 2,688 contacts involving 2,026 children. For this year approximately 450 children had more than one contact relating to domestic violence (although they could have had other categories of contact). Further analysis of referral data (next level of involvement beyond initial contact) shows that approximately ¼ of children referred to OYCPS were from households experiencing domestic violence. Reported Service Pressures Over the past three years there has been a general increase in the number of incidents of domestic violence recorded. As a result a number of services have reported additional service pressures. An example of this is the reported increase in demand for the Domestic Violence Advocacy Service. Recently the service reported an increase in referrals to the service compared to the previous year and importantly an increase in the severity of cases. e.g. central division referred 219 high risk cases in the first quarter of 2007/08 and this increased to 246 for the same period of 2008/09. The entirely new MARAC scheme has been established, and this has required additional multi-agency input to tackle the most serious cases of domestic violence.
South Cambridgeshire Community Safety Partnership – Strategic Assessment 2008 29
ANTI-SOCIAL BEHAVIOUR
Data Sources Primary
• Police recorded incidents • District Council data • Neighbourhood Priorities • Best value survey results
Secondary • School attendance report
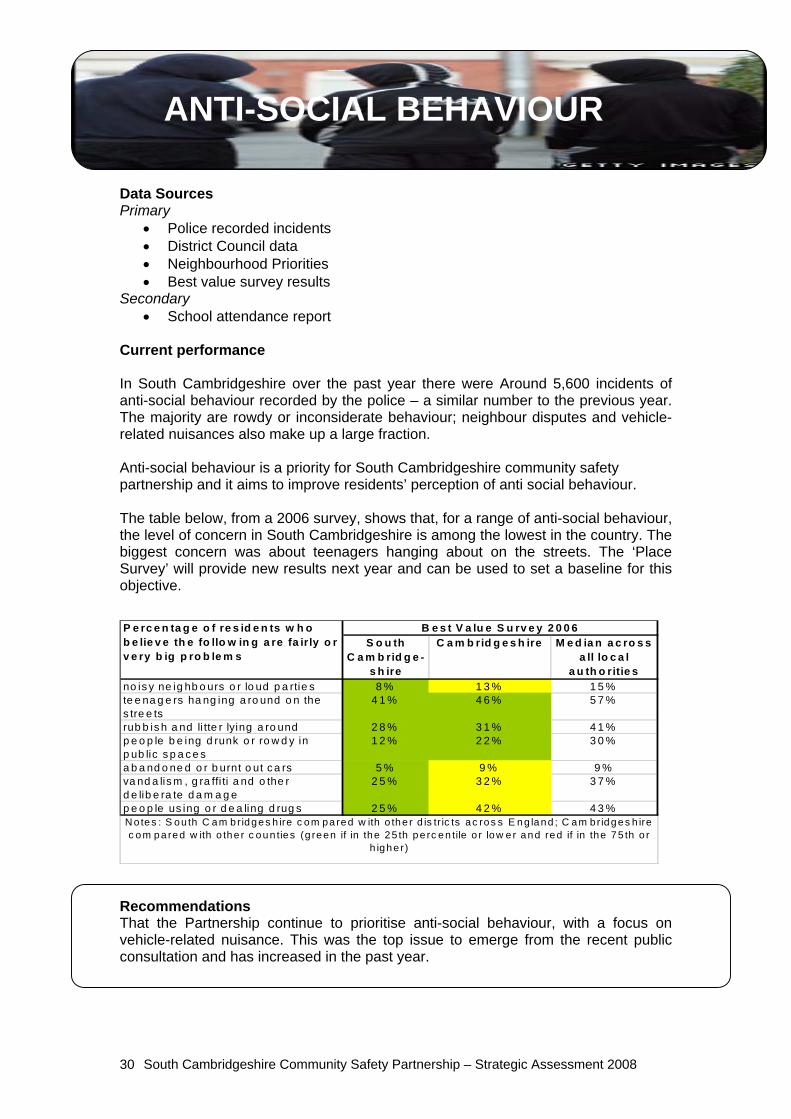
Current performance In South Cambridgeshire over the past year there were Around 5,600 incidents of anti-social behaviour recorded by the police – a similar number to the previous year. The majority are rowdy or inconsiderate behaviour; neighbour disputes and vehicle-related nuisances also make up a large fraction. Anti-social behaviour is a priority for South Cambridgeshire community safety partnership and it aims to improve residents’ perception of anti social behaviour. The table below, from a 2006 survey, shows that, for a range of anti-social behaviour, the level of concern in South Cambridgeshire is among the lowest in the country. The biggest concern was about teenagers hanging about on the streets. The ‘Place Survey’ will provide new results next year and can be used to set a baseline for this objective.
S o u th C a m b rid g e -
s h ire
C a m b rid g e s h ire M e d ia n a c ro s s a ll lo c a l
a u th o ritie sno is y ne ig hb o urs o r lo ud p a rtie s 8 % 1 3 % 1 5 %te e na g e rs ha ng ing a ro und o n the s tre e ts
4 1 % 4 6 % 5 7 %
rub b is h a nd li tte r lying a ro und 2 8 % 3 1 % 4 1 %p e o p le b e ing d runk o r ro w d y in p ub lic s p a c e s
1 2 % 2 2 % 3 0 %
a b a nd o ne d o r b urnt o ut c a rs 5 % 9 % 9 %va nd a lis m , g ra ffi ti a nd o the r d e lib e ra te d a m a g e
2 5 % 3 2 % 3 7 %
p e o p le us ing o r d e a ling d rug s 2 5 % 4 2 % 4 3 %N otes : S ou th C am bridges h ire c om pared w ith o the r d is tr ic ts ac ros s E ng land ; C am bridges h ire c om pared w ith o the r c oun ties (g reen if in the 25 th pe rc en tile o r low e r and red if in the 75 th o r
h ighe r)
P e rc e n ta g e o f re s id e n ts w h o b e lie v e th e fo llo w in g a re fa irly o r v e ry b ig p ro b le m s
B e s t V a lu e S u rv e y 2 0 0 6
Recommendations That the Partnership continue to prioritise anti-social behaviour, with a focus on vehicle-related nuisance. This was the top issue to emerge from the recent public consultation and has increased in the past year.
South Cambridgeshire Community Safety Partnership – Strategic Assessment 2008 30
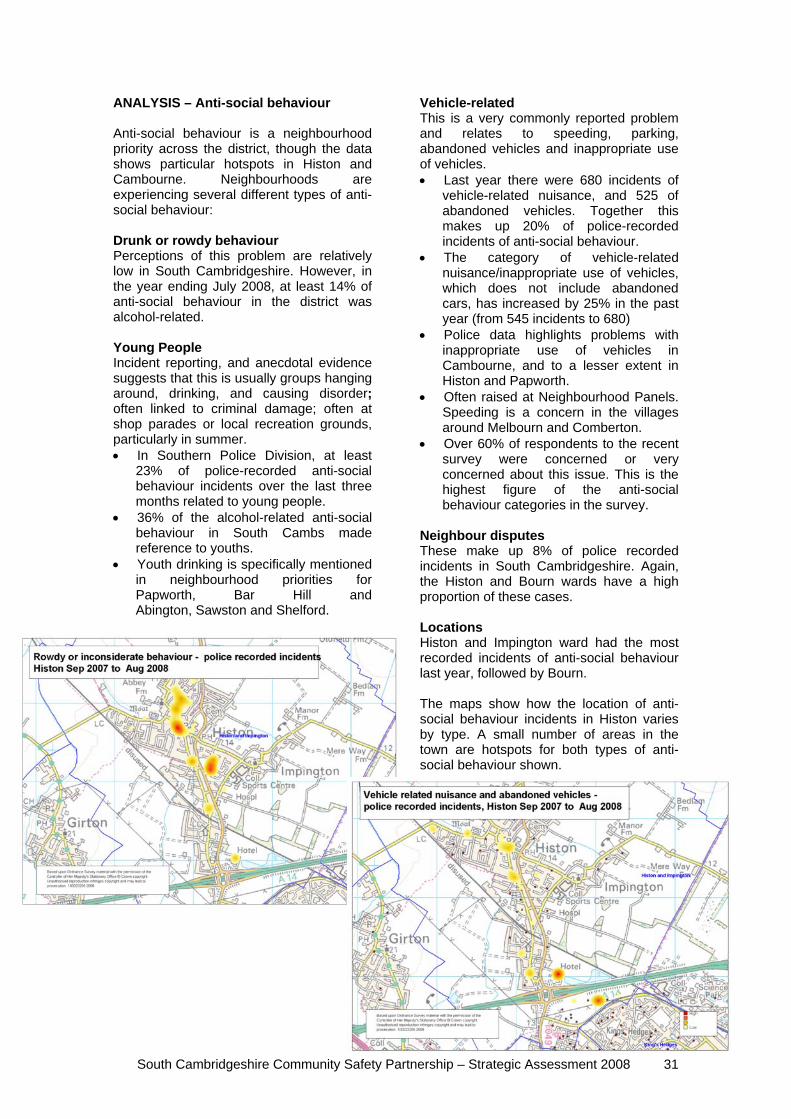
ANALYSIS – Anti-social behaviour Anti-social behaviour is a neighbourhood priority across the district, though the data shows particular hotspots in Histon and Cambourne. Neighbourhoods are experiencing several different types of anti-social behaviour: Drunk or rowdy behaviour Perceptions of this problem are relatively low in South Cambridgeshire. However, in the year ending July 2008, at least 14% of anti-social behaviour in the district was alcohol-related. Young People Incident reporting, and anecdotal evidence suggests that this is usually groups hanging around, drinking, and causing disorder; often linked to criminal damage; often at shop parades or local recreation grounds, particularly in summer. • In Southern Police Division, at least
23% of police-recorded anti-social behaviour incidents over the last three months related to young people.
• 36% of the alcohol-related anti-social behaviour in South Cambs made reference to youths.
• Youth drinking is specifically mentioned in neighbourhood priorities for Papworth, Bar Hill and Abington, Sawston and Shelford.
Vehicle-related This is a very commonly reported problem and relates to speeding, parking, abandoned vehicles and inappropriate use of vehicles. • Last year there were 680 incidents of
vehicle-related nuisance, and 525 of abandoned vehicles. Together this makes up 20% of police-recorded incidents of anti-social behaviour.
• The category of vehicle-related nuisance/inappropriate use of vehicles, which does not include abandoned cars, has increased by 25% in the past year (from 545 incidents to 680)
• Police data highlights problems with inappropriate use of vehicles in Cambourne, and to a lesser extent in Histon and Papworth.
• Often raised at Neighbourhood Panels. Speeding is a concern in the villages around Melbourn and Comberton.
• Over 60% of respondents to the recent survey were concerned or very concerned about this issue. This is the highest figure of the anti-social behaviour categories in the survey.
Neighbour disputes These make up 8% of police recorded incidents in South Cambridgeshire. Again, the Histon and Bourn wards have a high proportion of these cases. Locations Histon and Impington ward had the most recorded incidents of anti-social behaviour last year, followed by Bourn. The maps show how the location of anti-social behaviour incidents in Histon varies by type. A small number of areas in the town are hotspots for both types of anti-social behaviour shown.
South Cambridgeshire Community Safety Partnership – Strategic Assessment 2008 31
CRIMINAL DMAGE
CRIMINAL DAMAGE
Data Sources Primary
• Police recorded crimes • Best value survey results
Current PerformanceP E R C E N T A G E C H A N G E IN C R IM IN A L D A M A G E R E C O R D E D IN S O U T H
C A M B R ID G E S H IR E Y e a r e n d in g A u g 2 0 0 8 c o m p a re d w ith Y e a r e n d in g A u g 2 0 0 7
8 7 fe w e r
1 0 0 fe w e r
1 2 1 fe w e r
1 7 fe w e r
3 2 5 fe w e r
-5 0 % -4 5 % -4 0 % -3 5 % -3 0 % -2 5 % -2 0 % -1 5 % -1 0 % -5 % 0 %
A ll C r im in a l D a m a g e
A ll D a m a g eto D w e llin g s
A ll D a m a g eto O th e r B u ild in g s
A ll D a m a g eto V e h ic le s
A ll O th e r D a m a g e
T H E B A R S S H O W % C H A N G E ST H E L A B E L S S H O W A B S O L U T E C H A N G E S
C R IM IN A L D A M A G E IN Y E A R T O E N D A U G U S T 2 0 0 8 C r im e s p e r 1 0 0 0 re s id e n ts
0 2 4 6 8 1 0 1 2 1 4 1 6 1 8 2 0 2 2
U ttle s fo rdD e rb ys h ire D a le s
S o u th C a m b r id g e s h ireS tra tfo rd u p o n A v o n
M o le V a lle yW a v e r le yH o rs h a m
R u s h c liffeS u ffo lk C o a s ta l
S o u th O x fo rd s h ireC o ts w o ld
T e w k e s b u ryS tro u d
W e s t B e rk s h ireS o u th B u c k s
3 rd a m o n g 1 5 m o s t s im ila r C D R P s
B E S T
W O R S T
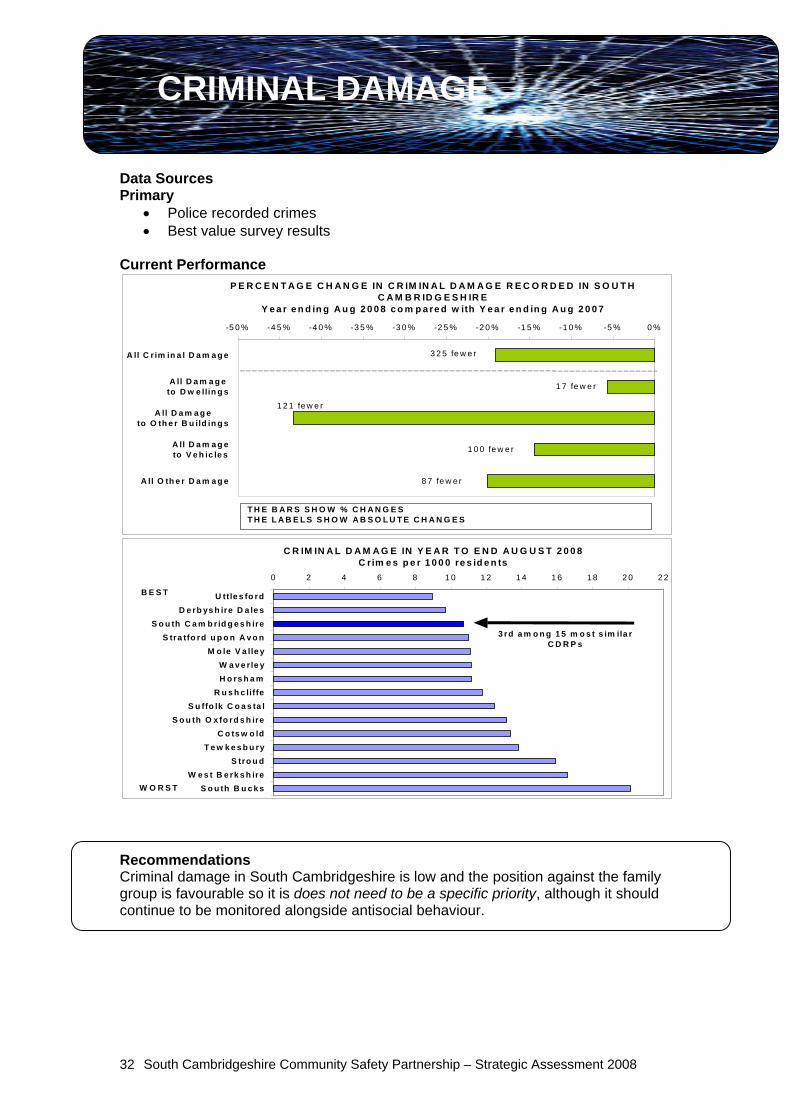
Recommendations Criminal damage in South Cambridgeshire is low and the position against the family group is favourable so it is does not need to be a specific priority, although it should continue to be monitored alongside antisocial behaviour.
South Cambridgeshire Community Safety Partnership – Strategic Assessment 2008 32
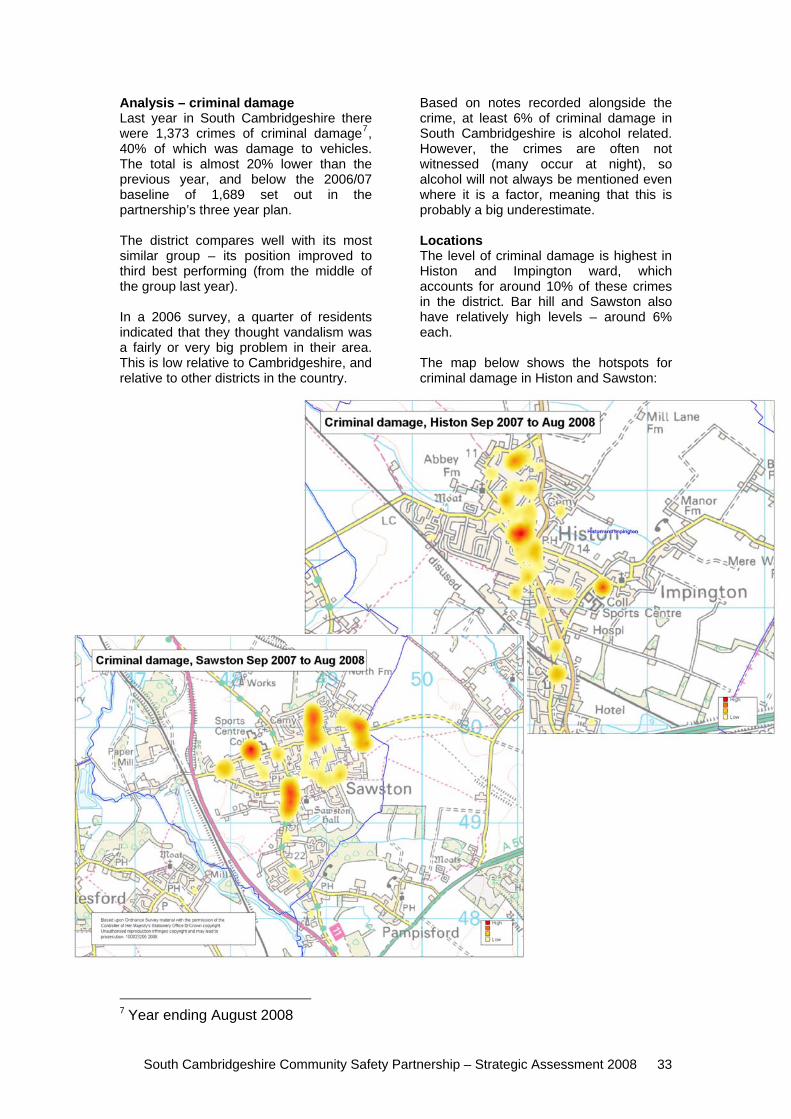
Analysis – criminal damage Last year in South Cambridgeshire there were 1,373 crimes of criminal damage7, 40% of which was damage to vehicles. The total is almost 20% lower than the previous year, and below the 2006/07 baseline of 1,689 set out in the partnership’s three year plan. The district compares well with its most similar group – its position improved to third best performing (from the middle of the group last year). In a 2006 survey, a quarter of residents indicated that they thought vandalism was a fairly or very big problem in their area. This is low relative to Cambridgeshire, and relative to other districts in the country.
7 Year ending August 2008
Based on notes recorded alongside the crime, at least 6% of criminal damage in South Cambridgeshire is alcohol related. However, the crimes are often not witnessed (many occur at night), so alcohol will not always be mentioned even where it is a factor, meaning that this is probably a big underestimate. Locations The level of criminal damage is highest in Histon and Impington ward, which accounts for around 10% of these crimes in the district. Bar hill and Sawston also have relatively high levels – around 6% each. The map below shows the hotspots for criminal damage in Histon and Sawston:
South Cambridgeshire Community Safety Partnership – Strategic Assessment 2008 33
ARSON
Data Sources Primary
• Police recorded crimes • Fire service data
Secondary • Police Arson problem profile
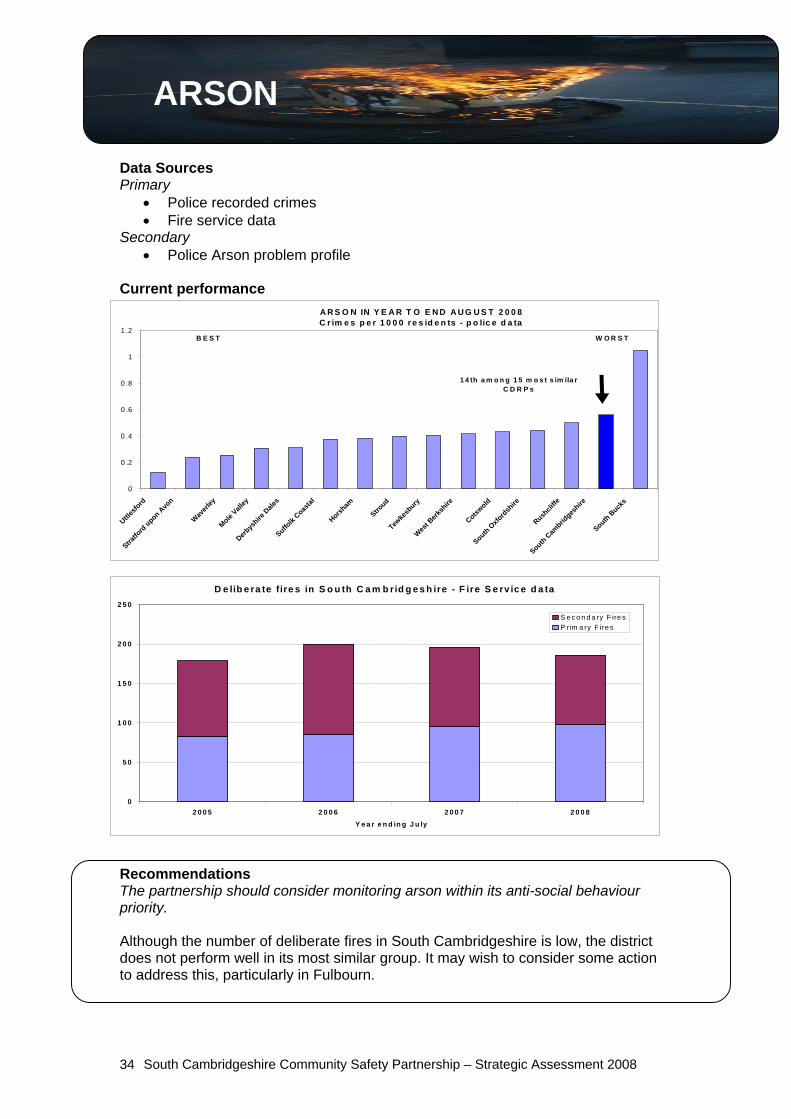
Current performance A R S O N IN Y E A R T O E N D A U G U S T 2 0 0 8 C r im e s p e r 1 0 0 0 r e s id e n ts - p o lic e d a ta
0
0 .2
0 .4
0 .6
0 .8
1
1 .2
Uttlesfo
rd
Stratfo
rd upon A
von
Waverl
ey
Mole Vall
ey
Derbys
hire D
ales
Suffolk
Coastal
Horsham
Stroud
Tewke
sbury
West B
erksh
ire
Cotswold
South Oxfo
rdsh
ire
Rushcli
ffe
South Cam
bridges
hire
South Buck
s
1 4 th a m o n g 1 5 m o s t s im ila r C D R P s
B E S T W O R S T
D e lib e ra te fire s in S o u th C a m b rid g e s h ire - F ire S e rv ic e d a ta
0
Recommendations The partnership should consider monitoring arson within its anti-social behaviour priority. Although the number of deliberate fires in South Cambridgeshire is low, the district does not perform well in its most similar group. It may wish to consider some action to address this, particularly in Fulbourn.
5 0
1 0 0
1 5 0
2 0 0
2 5 0
2 0 0 5 2 0 0 6 2 0 0 7 2 0 0 8Y e a r e n d in g J u ly
S e c o n d a ry F ire sP rim a ry F ire s
South Cambridgeshire Community Safety Partnership – Strategic Assessment 2008 34
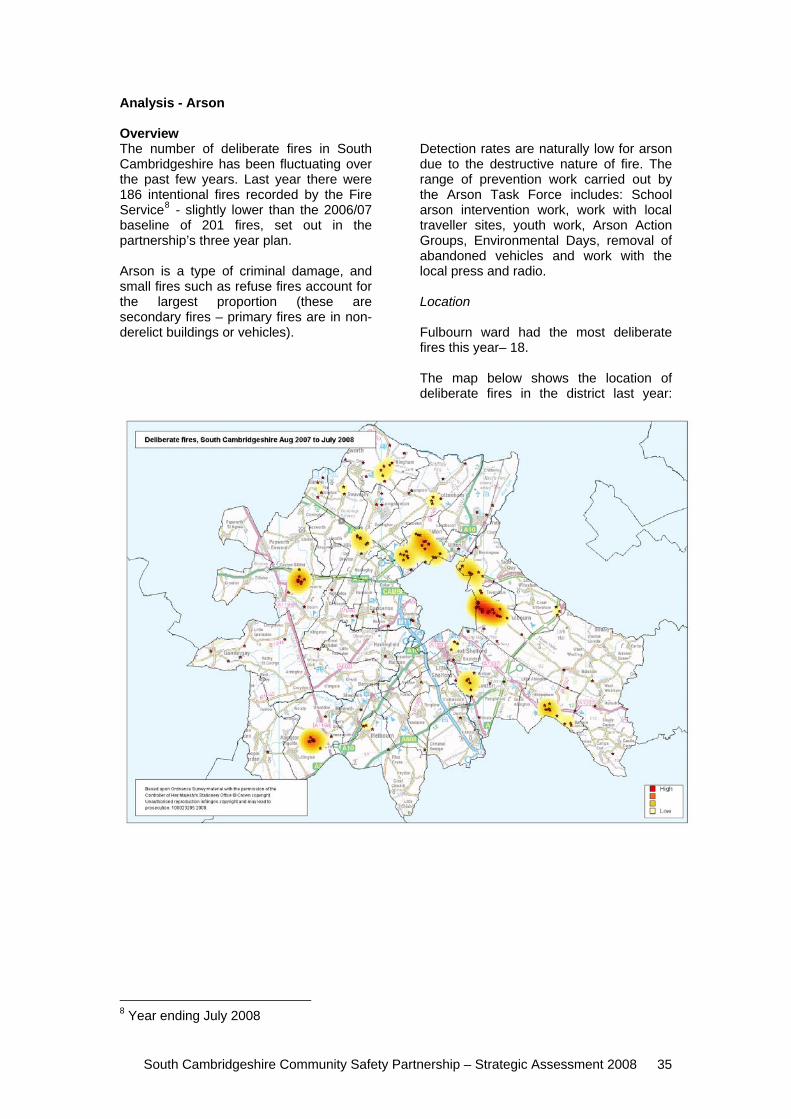
Analysis - Arson Overview The number of deliberate fires in South Cambridgeshire has been fluctuating over the past few years. Last year there were 186 intentional fires recorded by the Fire Service8 - slightly lower than the 2006/07 baseline of 201 fires, set out in the partnership’s three year plan. Arson is a type of criminal damage, and small fires such as refuse fires account for the largest proportion (these are secondary fires – primary fires are in non-derelict buildings or vehicles).
8 Year ending July 2008
Detection rates are naturally low for arson due to the destructive nature of fire. The range of prevention work carried out by the Arson Task Force includes: School arson intervention work, work with local traveller sites, youth work, Arson Action Groups, Environmental Days, removal of abandoned vehicles and work with the local press and radio. Location Fulbourn ward had the most deliberate fires this year– 18. The map below shows the location of deliberate fires in the district last year:
South Cambridgeshire Community Safety Partnership – Strategic Assessment 2008 35
Data Sources Primary:
MISUSE OF DRUGS
• Recorded crime data (covering years 2006/07 to 2008/09) • Numbers in Treatment, Cambridgeshire DAAT 2007/8 • DIP Client Profile, Cambridgeshire DAAT, 2007/08 • Cambridgeshire ‘Balding Survey 2007 Secondary: • General Statistics on Young People’s Drug Misuse, Drug-Scope, 2008 • Street Drug Trends, Drug-Scope, 2008 • ‘Drug Strategy Loses its Way’, Howard Parker, Drink & Drug News, 2007
Current Performance
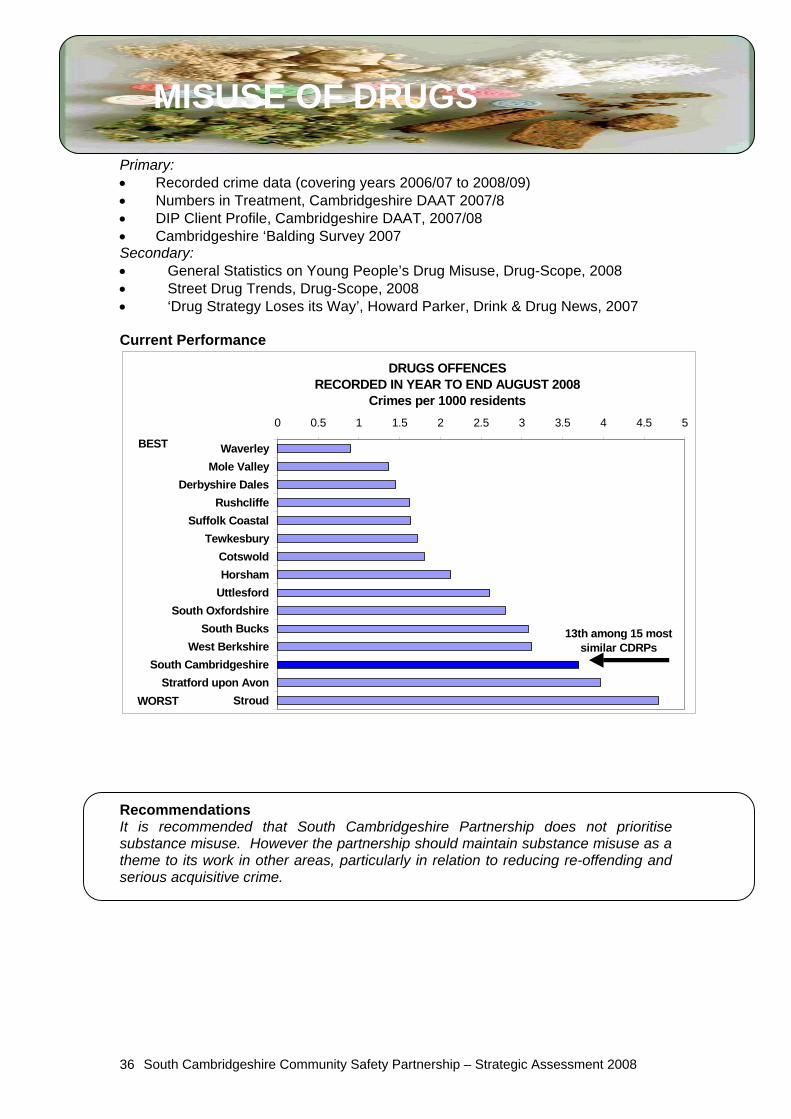
DRUGS OFFENCESRECORDED IN YEAR TO END AUGUST 2008
Crimes per 1000 residents0 0.5 1 1.5 2 2.5 3 3.5 4 4.5 5
WaverleyMole Valley
Derbyshire DalesRushcliffe
Suffolk CoastalTewkesbury
CotswoldHorsham
UttlesfordSouth Oxfordshire
South BucksWest Berkshire
South CambridgeshireStratford upon Avon
Stroud
13th among 15 most similar CDRPs
BEST
WORST
Recommendations It is recommended that South Cambridgeshire Partnership does not prioritise substance misuse. However the partnership should maintain substance misuse as a theme to its work in other areas, particularly in relation to reducing re-offending and serious acquisitive crime.
South Cambridgeshire Community Safety Partnership – Strategic Assessment 2008 36
ANALYSIS – Drug Misuse Drug Offences
The level and type of drug offences occurring within any twelve month period can be subject to misinterpretation. This type of offence is not generally reported so is only identified through police activity. Changes in the number of offences and their location are an indicator of police activity and geographical focus rather than general trends in drug misuse. The current trends in drug related offences are as follows: • Over the last twelve months the level
of offences identified in East Cambridgeshire has increased significantly.
• Possession offences have increased by 49% and supply offences by 163% (although the latter is from a small base and there have been some detections related to specific individuals resident in the partnership area).
• The majority of offences were for the possession of Cannabis.
• The possession offences are evenly distributed across the main population centres of the district.
• Apart from cannabis the only other possession offence of any significance relates to either the possession or supply of cocaine.
The Drug Misusing Population Information supplied by the Cambridgeshire Drug & Alcohol Action Team (DAAT) has proved useful in identifying the population of problematic drug users in South Cambridgeshire. • Overall, for Cambridge-based
treatment services 487 people have been in effective treatment during 2007/08. These services also cover East Cambs as well as South Cambridgeshire. However it is not possible to tell from current data what proportion of these will be from the partnership area.
• The Cambridgeshire DIP (Drug Intervention Program) works to provide drug treatment and support to individuals who have been identified as committing offences to support their drug addiction. For 2007/08 13 people from South Cambridge were treated / supported by the DIP.
• Interestingly South Cambridgeshire was the only partnership area where the DIP team was working with more non-heroin users than heroin users (cocaine was the most common drug, though the number of clients is small).
• The referral routes through to the DIP are varied but the most frequent include through voluntary drug testing in police custody suites and from prison drug treatment teams (for offenders returning to the area after completion of sentence).
• An analysis of the initial offences committed by this group of 13 shows that only 1 had committed at least one ‘serious acquisitive crime’. Although 46% had committed drugs offences.
Other Issues There has been no recent ‘Drug Market Profile’ produced locally. Nationally ‘Drug-Scope’ has recently produced a profile. Issues of concern included an increase in use of diazepam (Valium) mainly by existing heroin users to support their addiction. There is a reported shortage of heroin and a lessening of quality in some areas. Two identified trends that do match local data are, firstly the increase in ‘home grown’ cannabis available. The constabulary has seen an increase in the number of cannabis ‘factories’ in the County. There is also widespread concern about younger drug misusers described as ACCE (Alcohol, Cannabis, Cocaine & Ecstasy). This ‘poly’ drug use has a very harmful impact on health and it is felt in some quarters9 to be inadequately addressed by treatment services that mainly focus on heroin addiction. Whilst local surveys asking about drug misuse - The Balding Survey and the Ofsted ‘Tellus’ Survey - have been carried out this year, results are not yet available. General national statistics on the trends in young people’s drug misuse (Including the 2007/08 British Crime Survey) show that the level of misuse has fallen from a peak in 2001. Reported drug misuse amongst 16-24s is now at its lowest point since 1995. (Source: Drug Scope 2008)
9 Drug Strategy Loses its Way’, Howard Parker, Drink & Drug News, 2007
South Cambridgeshire Community Safety Partnership – Strategic Assessment 2008 37
OFFENDING
Data Sources Primary: • Analysis of Probation Clients, 2007/08 • Analysis of Youth Offending Service Clients, 2007/08 • Analysis of Southern Division PPO Scheme, 2007/08 • Analysis of Central Division PPO Scheme, 2007/08 Secondary: • National Probation Service, Cambridgeshire, Annual Report 2007/08 • Cambridgeshire Criminal Justice Board (CJB), Performance Report, Sept 2008 • Southern Division PPO Scheme Action Plan 2008/09 Current Performance There are many different aspects to performance relating to offenders, offending and criminal justice. A brief review of the CJB performance report highlights concerns regarding the proportion of offences brought to justice for ‘serious violent and sexual offences’. Performance reports on each of the PPO schemes in the County are regularly submitted to each CDRP and these show that generally the schemes are performing well. Recommendations It is recommended that offending remain a priority, particularly the effective management of the partnership’s PPO schemes and reducing re-offending. It is further recommended that consideration be given to the issue of housing offenders and clients on the PPO scheme. There are particular opportunities to link with other countywide partnerships/groups whose main focus is housing needs.
South Cambridgeshire Community Safety Partnership – Strategic Assessment 2008 38
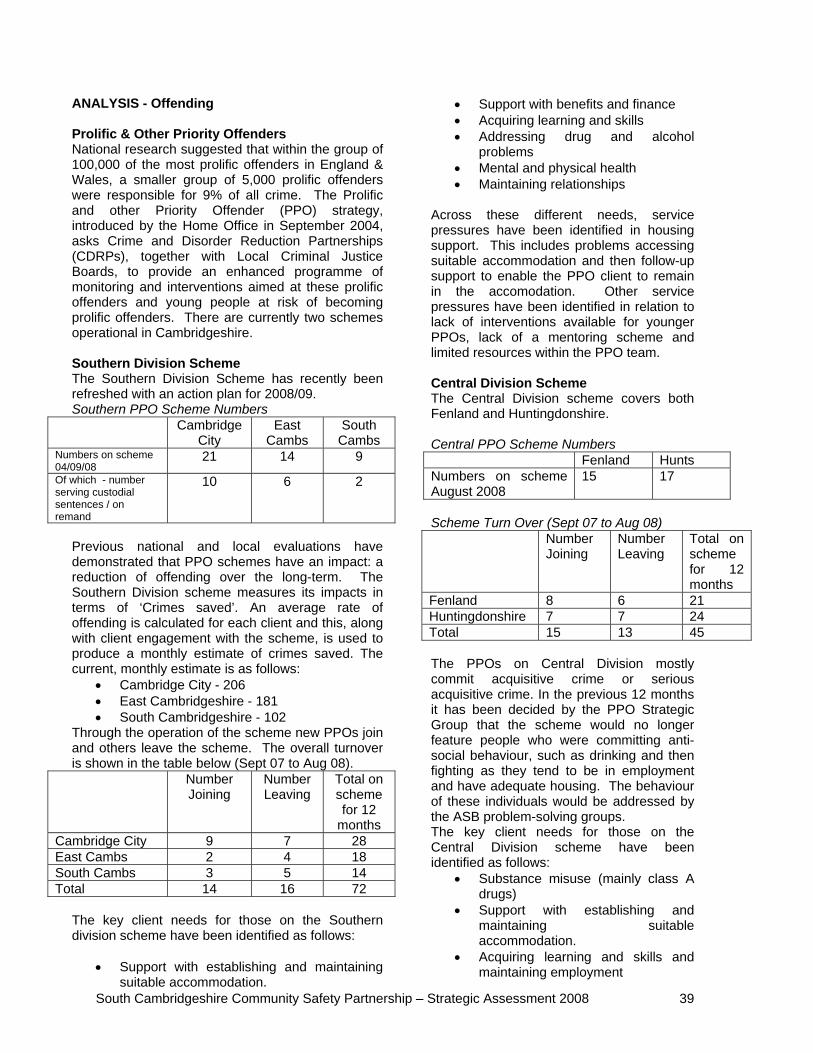
ANALYSIS - Offending Prolific & Other Priority Offenders National research suggested that within the group of 100,000 of the most prolific offenders in England & Wales, a smaller group of 5,000 prolific offenders were responsible for 9% of all crime. The Prolific and other Priority Offender (PPO) strategy, introduced by the Home Office in September 2004, asks Crime and Disorder Reduction Partnerships (CDRPs), together with Local Criminal Justice Boards, to provide an enhanced programme of monitoring and interventions aimed at these prolific offenders and young people at risk of becoming prolific offenders. There are currently two schemes operational in Cambridgeshire. Southern Division Scheme The Southern Division Scheme has recently been refreshed with an action plan for 2008/09. Southern PPO Scheme Numbers
Cambridge City
East Cambs
South Cambs
Numbers on scheme 04/09/08
21 14 9
Of which - number serving custodial sentences / on remand
10 6 2
Previous national and local evaluations have demonstrated that PPO schemes have an impact: a reduction of offending over the long-term. The Southern Division scheme measures its impacts in terms of ‘Crimes saved’. An average rate of offending is calculated for each client and this, along with client engagement with the scheme, is used to produce a monthly estimate of crimes saved. The current, monthly estimate is as follows:
• Cambridge City - 206 • East Cambridgeshire - 181 • South Cambridgeshire - 102
Through the operation of the scheme new PPOs join and others leave the scheme. The overall turnover is shown in the table below (Sept 07 to Aug 08).
Number Joining
Number Leaving
Total on scheme for 12
months Cambridge City 9 7 28 East Cambs 2 4 18 South Cambs 3 5 14 Total 14 16 72
The key client needs for those on the Southern division scheme have been identified as follows:
• Support with establishing and maintaining suitable accommodation.
• Support with benefits and finance • Acquiring learning and skills • Addressing drug and alcohol
problems • Mental and physical health • Maintaining relationships
Across these different needs, service pressures have been identified in housing support. This includes problems accessing suitable accommodation and then follow-up support to enable the PPO client to remain in the accomodation. Other service pressures have been identified in relation to lack of interventions available for younger PPOs, lack of a mentoring scheme and limited resources within the PPO team. Central Division Scheme The Central Division scheme covers both Fenland and Huntingdonshire. Central PPO Scheme Numbers Fenland Hunts Numbers on scheme August 2008
15 17
Scheme Turn Over (Sept 07 to Aug 08) Number
Joining Number Leaving
Total on scheme for 12 months
Fenland 8 6 21 Huntingdonshire 7 7 24 Total 15 13 45 The PPOs on Central Division mostly commit acquisitive crime or serious acquisitive crime. In the previous 12 months it has been decided by the PPO Strategic Group that the scheme would no longer feature people who were committing anti-social behaviour, such as drinking and then fighting as they tend to be in employment and have adequate housing. The behaviour of these individuals would be addressed by the ASB problem-solving groups. The key client needs for those on the Central Division scheme have been identified as follows:
• Substance misuse (mainly class A drugs)
• Support with establishing and maintaining suitable accommodation.
• Acquiring learning and skills and maintaining employment
South Cambridgeshire Community Safety Partnership – Strategic Assessment 2008 39
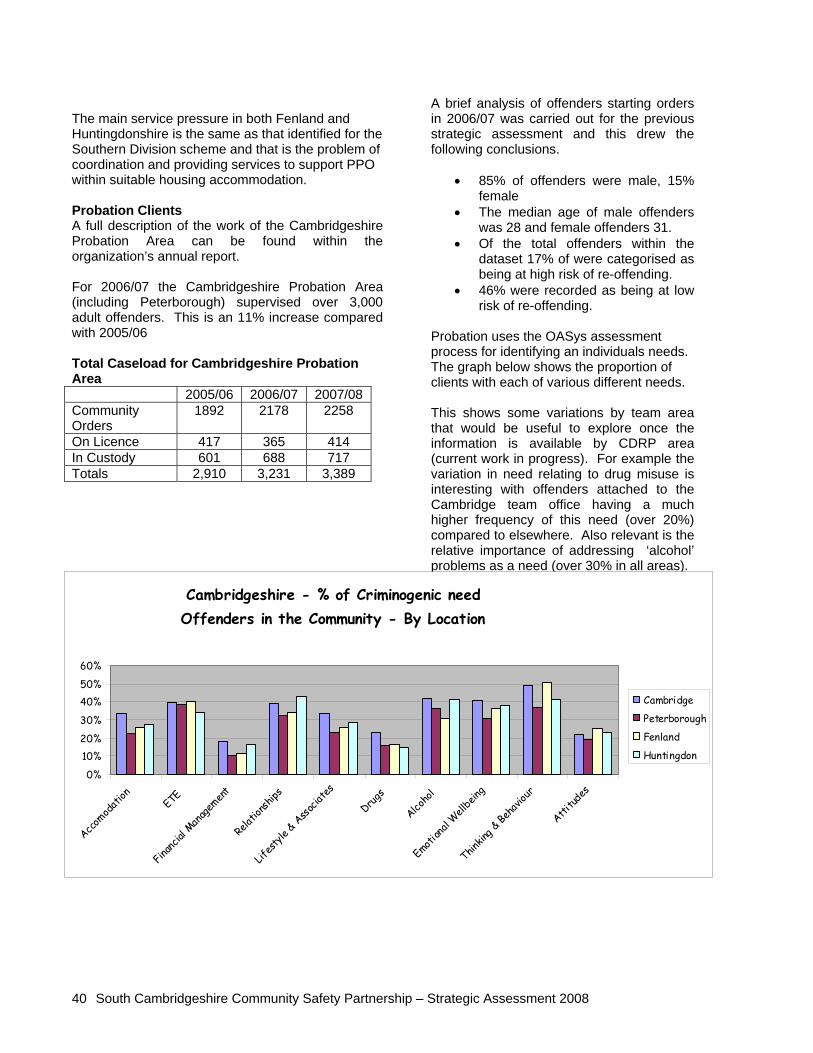
The main service pressure in both Fenland and Huntingdonshire is the same as that identified for the Southern Division scheme and that is the problem of coordination and providing services to support PPO within suitable housing accommodation. Probation Clients A full description of the work of the Cambridgeshire Probation Area can be found within the organization’s annual report. For 2006/07 the Cambridgeshire Probation Area (including Peterborough) supervised over 3,000 adult offenders. This is an 11% increase compared with 2005/06 Total Caseload for Cambridgeshire Probation Area 2005/06 2006/07 2007/08 Community Orders
1892 2178 2258
On Licence 417 365 414 In Custody 601 688 717 Totals 2,910 3,231 3,389
A brief analysis of offenders starting orders in 2006/07 was carried out for the previous strategic assessment and this drew the following conclusions.
• 85% of offenders were male, 15% female
• The median age of male offenders was 28 and female offenders 31.
• Of the total offenders within the dataset 17% of were categorised as being at high risk of re-offending.
• 46% were recorded as being at low risk of re-offending.
Probation uses the OASys assessment process for identifying an individuals needs. The graph below shows the proportion of clients with each of various different needs. This shows some variations by team area that would be useful to explore once the information is available by CDRP area (current work in progress). For example the variation in need relating to drug misuse is interesting with offenders attached to the Cambridge team office having a much higher frequency of this need (over 20%) compared to elsewhere. Also relevant is the relative importance of addressing ‘alcohol’ problems as a need (over 30% in all areas).
Cambridgeshire - % of Criminogenic needOffenders in the Community - By Location
0%
10%20%
30%
40%50%
60%
Accom
odat
ion ETE
Finan
cial M
anag
emen
t
Relat
ionsh
ips
Lifes
tyle
& Ass
ociat
es
Drugs
Alcoho
l
Emotion
al W
ellbe
ing
Thinkin
g & Be
havio
ur
Attitud
es
Cambridge
Peterborough
Fenland
Huntingdon
South Cambridgeshire Community Safety Partnership – Strategic Assessment 2008 40
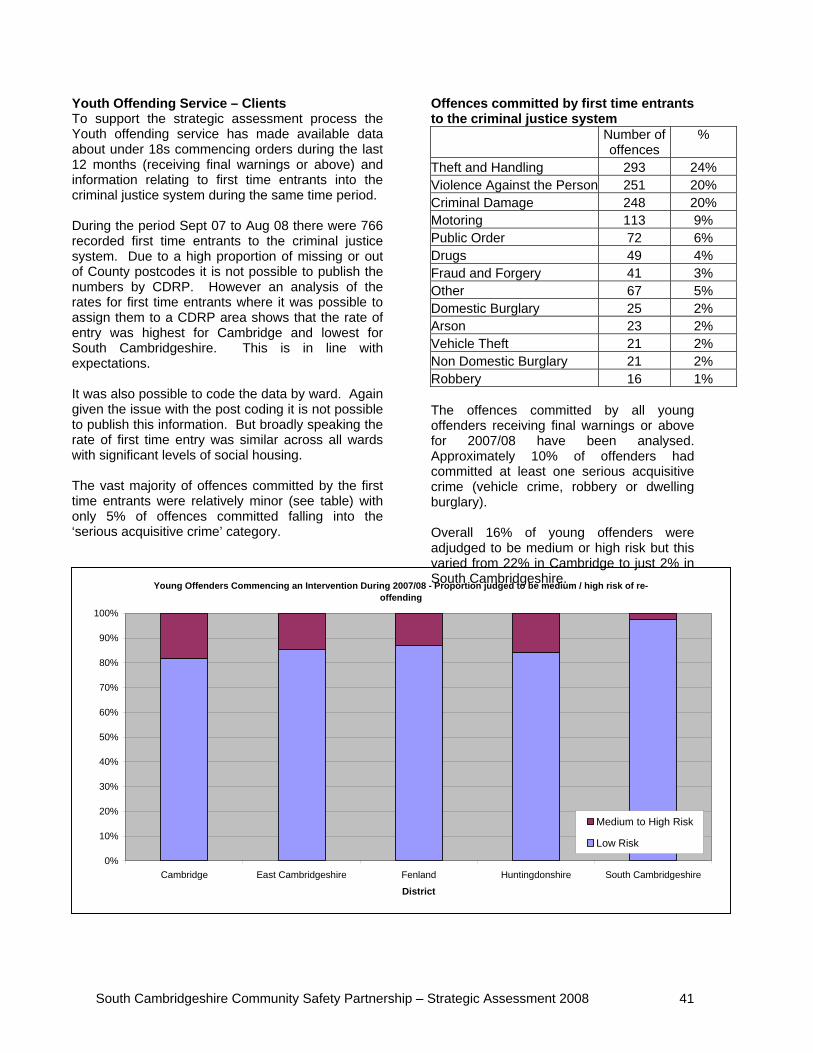
Youth Offending Service – Clients To support the strategic assessment process the Youth offending service has made available data about under 18s commencing orders during the last 12 months (receiving final warnings or above) and information relating to first time entrants into the criminal justice system during the same time period. During the period Sept 07 to Aug 08 there were 766 recorded first time entrants to the criminal justice system. Due to a high proportion of missing or out of County postcodes it is not possible to publish the numbers by CDRP. However an analysis of the rates for first time entrants where it was possible to assign them to a CDRP area shows that the rate of entry was highest for Cambridge and lowest for South Cambridgeshire. This is in line with expectations. It was also possible to code the data by ward. Again given the issue with the post coding it is not possible to publish this information. But broadly speaking the rate of first time entry was similar across all wards with significant levels of social housing. The vast majority of offences committed by the first time entrants were relatively minor (see table) with only 5% of offences committed falling into the ‘serious acquisitive crime’ category.
Offences committed by first time entrants to the criminal justice system
Number of offences
%
Theft and Handling 293 24% Violence Against the Person 251 20% Criminal Damage 248 20% Motoring 113 9% Public Order 72 6% Drugs 49 4% Fraud and Forgery 41 3% Other 67 5% Domestic Burglary 25 2% Arson 23 2% Vehicle Theft 21 2% Non Domestic Burglary 21 2% Robbery 16 1% The offences committed by all young offenders receiving final warnings or above for 2007/08 have been analysed. Approximately 10% of offenders had committed at least one serious acquisitive crime (vehicle crime, robbery or dwelling burglary). Overall 16% of young offenders were adjudged to be medium or high risk but this varied from 22% in Cambridge to just 2% in South Cambridgeshire.
Young Offenders Commencing an Intervention During 2007/08 - Proportion judged to be medium / high risk of re-offending
0%
10%
20%
30%
40%
50%
60%
70%
80%
90%
100%
Cambridge East Cambridgeshire Fenland Huntingdonshire South Cambridgeshire
District
Medium to High Risk
Low Risk
South Cambridgeshire Community Safety Partnership – Strategic Assessment 2008 41
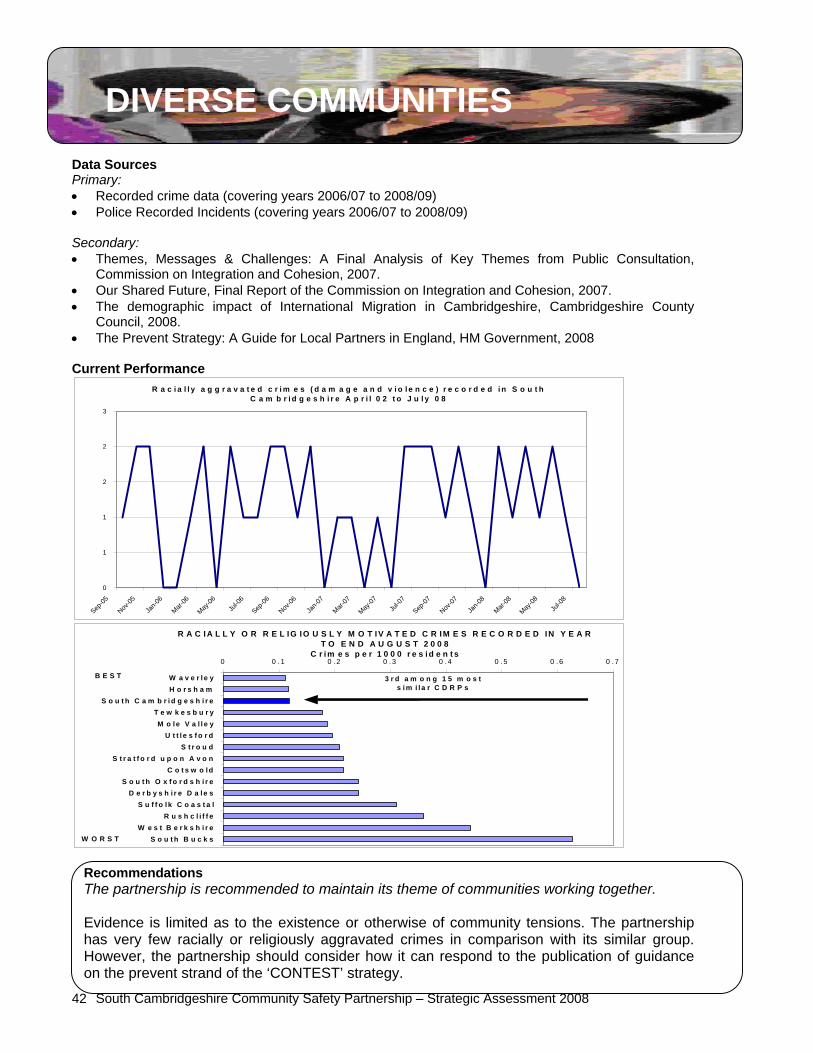
DIVERSE COMMUNITIES Data Sources Primary: • Recorded crime data (covering years 2006/07 to 2008/09) • Police Recorded Incidents (covering years 2006/07 to 2008/09) Secondary: • Themes, Messages & Challenges: A Final Analysis of Key Themes from Public Consultation,
Commission on Integration and Cohesion, 2007. • Our Shared Future, Final Report of the Commission on Integration and Cohesion, 2007. • The demographic impact of International Migration in Cambridgeshire, Cambridgeshire County
Council, 2008. • The Prevent Strategy: A Guide for Local Partners in England, HM Government, 2008
Current Performance
R a c i a l l y a g g r a v a t e d c r i m e s ( d a m a g e a n d v i o l e n c e ) r e c o r d e d i n S o u t h C a m b r i d g e s h i r e A p r i l 0 2 t o J u l y 0 8
0
1
1
2
2
3
Sep-05
Nov-05
Jan-0
6
Mar-06
May-06
Jul-0
6
Sep-06
Nov-06
Jan-0
7
Mar-07
May-07
Jul-0
7
Sep-07
Nov-07
Jan-0
8
Mar-08
May-08
Jul-0
8
R A C IA L L Y O R R E L IG IO U S L Y M O T IV A T E D C R IM E S R E C O R D E D IN Y E A R
T O E N D A U G U S T 2 0 0 8 C r im e s p e r 1 0 0 0 r e s i d e n t s
0 0 .1 0 .2 0 . 3 0 .4 0 .5 0 . 6 0 .7
W a v e r l e yH o r s h a m
S o u t h C a m b r i d g e s h i r eT e w k e s b u r yM o le V a l l e y
U t t l e s f o r dS t r o u d
S t r a t f o r d u p o n A v o nC o t s w o ld
S o u t h O x f o r d s h i r eD e r b y s h i r e D a le s
S u f f o lk C o a s t a lR u s h c l i f f e
W e s t B e r k s h i r eS o u t h B u c k s
3 r d a m o n g 1 5 m o s t s i m i la r C D R P s
B E S T
W O R S T Recommendations The partnership is recommended to maintain its theme of communities working together. Evidence is limited as to the existence or otherwise of community tensions. The partnership has very few racially or religiously aggravated crimes in comparison with its similar group. However, the partnership should consider how it can respond to the publication of guidance on the prevent strand of the ‘CONTEST’ strategy.
South Cambridgeshire Community Safety Partnership – Strategic Assessment 2008 42
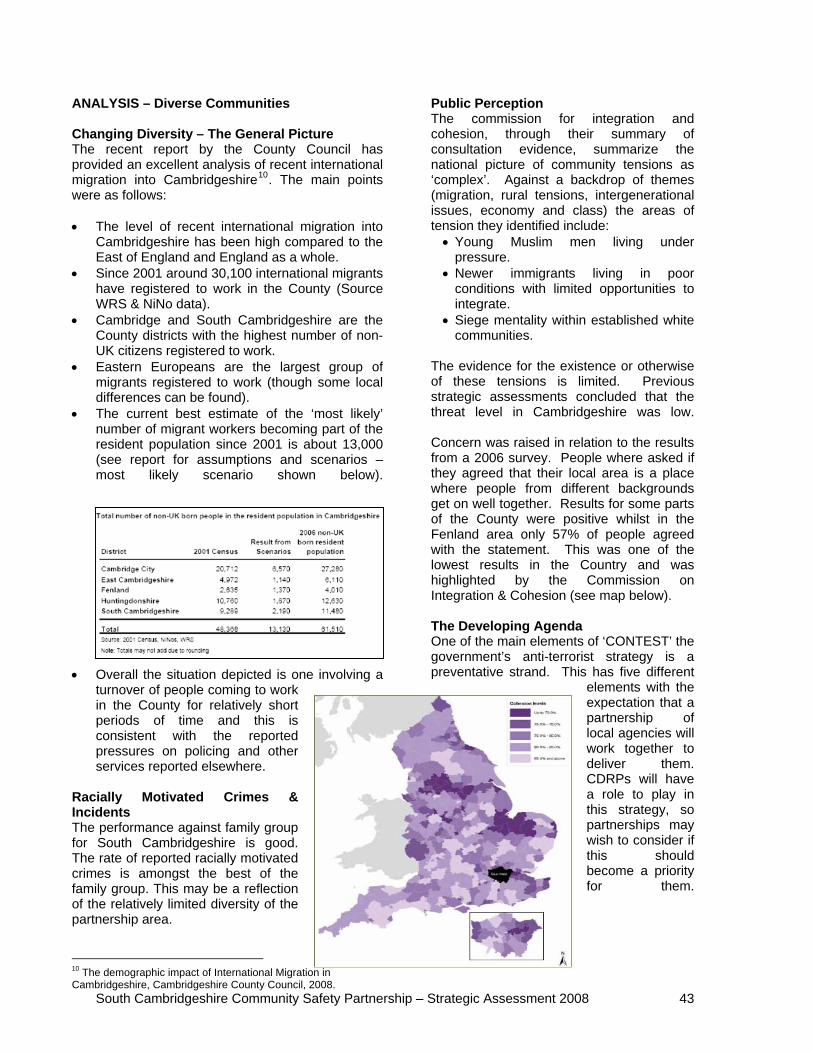
ANALYSIS – Diverse Communities Changing Diversity – The General Picture The recent report by the County Council has provided an excellent analysis of recent international migration into Cambridgeshire10. The main points were as follows: • The level of recent international migration into
Cambridgeshire has been high compared to the East of England and England as a whole.
• Since 2001 around 30,100 international migrants have registered to work in the County (Source WRS & NiNo data).
• Cambridge and South Cambridgeshire are the County districts with the highest number of non-UK citizens registered to work.
• Eastern Europeans are the largest group of migrants registered to work (though some local differences can be found).
• The current best estimate of the ‘most likely’ number of migrant workers becoming part of the resident population since 2001 is about 13,000 (see report for assumptions and scenarios – most likely scenario shown below).
• Overall the situation depicted is one involving a turnover of people coming to work in the County for relatively short periods of time and this is consistent with the reported pressures on policing and other services reported elsewhere.
Racially Motivated Crimes & Incidents The performance against family group for South Cambridgeshire is good. The rate of reported racially motivated crimes is amongst the best of the family group. This may be a reflection of the relatively limited diversity of the partnership area.
10 The demographic impact of International Migration in Cambridgeshire, Cambridgeshire County Council, 2008.
Public Perception The commission for integration and cohesion, through their summary of consultation evidence, summarize the national picture of community tensions as ‘complex’. Against a backdrop of themes (migration, rural tensions, intergenerational issues, economy and class) the areas of tension they identified include:
• Young Muslim men living under pressure.
• Newer immigrants living in poor conditions with limited opportunities to integrate.
• Siege mentality within established white communities.
The evidence for the existence or otherwise of these tensions is limited. Previous strategic assessments concluded that the threat level in Cambridgeshire was low. Concern was raised in relation to the results from a 2006 survey. People where asked if they agreed that their local area is a place where people from different backgrounds get on well together. Results for some parts of the County were positive whilst in the Fenland area only 57% of people agreed with the statement. This was one of the lowest results in the Country and was highlighted by the Commission on Integration & Cohesion (see map below). The Developing Agenda One of the main elements of ‘CONTEST’ the government’s anti-terrorist strategy is a preventative strand. This has five different
elements with the expectation that a partnership of local agencies will work together to deliver them. CDRPs will have a role to play in this strategy, so partnerships may wish to consider if this should become a priority for them.
South Cambridgeshire Community Safety Partnership – Strategic Assessment 2008 43
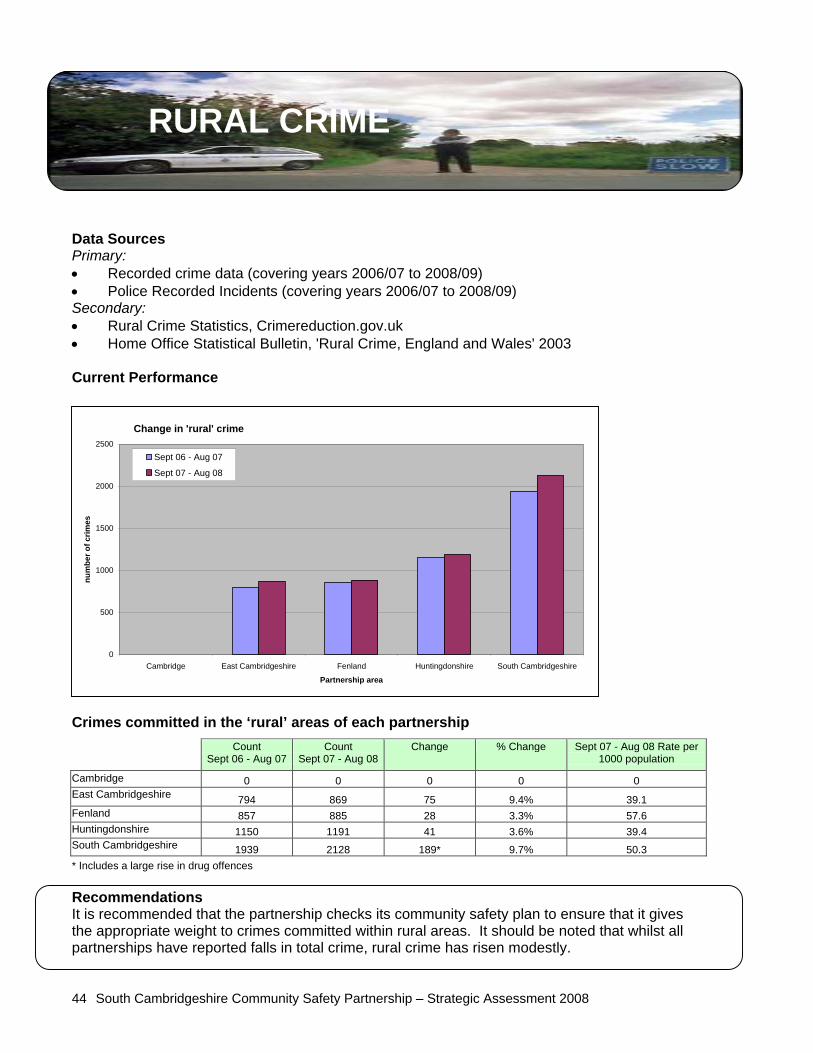
RURAL CRIME
Data Sources Primary: • Recorded crime data (covering years 2006/07 to 2008/09) • Police Recorded Incidents (covering years 2006/07 to 2008/09) Secondary: • Rural Crime Statistics, Crimereduction.gov.uk • Home Office Statistical Bulletin, 'Rural Crime, England and Wales' 2003
Current Performance
Change in 'rural' crime
0
500
1000
1500
2000
2500
Cambridge East Cambridgeshire Fenland Huntingdonshire South Cambridgeshire
Partnership area
num
ber o
f crim
es
Sept 06 - Aug 07
Sept 07 - Aug 08
Crimes committed in the ‘rural’ areas of each partnership
Count Sept 06 - Aug 07
Count Sept 07 - Aug 08
Change % Change Sept 07 - Aug 08 Rate per 1000 population
Cambridge 0 0 0 0 0 East Cambridgeshire 794 869 75 9.4% 39.1 Fenland 857 885 28 3.3% 57.6 Huntingdonshire 1150 1191 41 3.6% 39.4 South Cambridgeshire 1939 2128 189* 9.7% 50.3 * Includes a large rise in drug offences Recommendations It is recommended that the partnership checks its community safety plan to ensure that it gives the appropriate weight to crimes committed within rural areas. It should be noted that whilst all partnerships have reported falls in total crime, rural crime has risen modestly.
South Cambridgeshire Community Safety Partnership – Strategic Assessment 2008 44
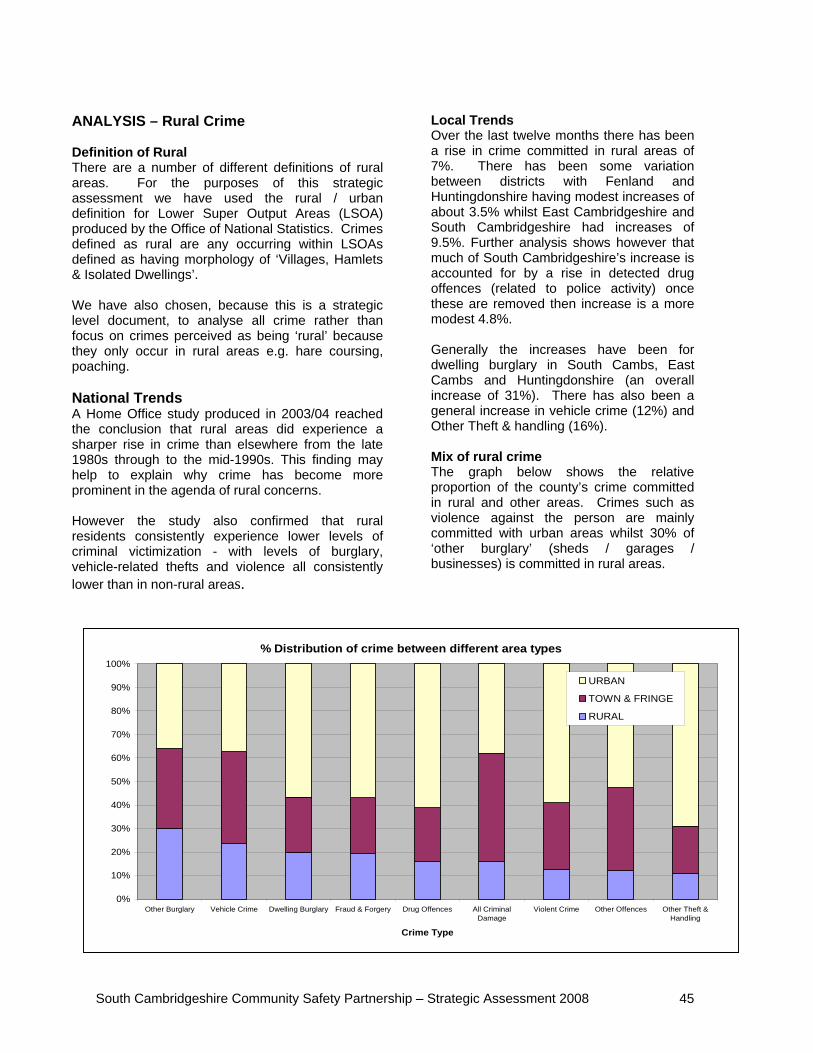
ANALYSIS – Rural Crime Definition of Rural There are a number of different definitions of rural areas. For the purposes of this strategic assessment we have used the rural / urban definition for Lower Super Output Areas (LSOA) produced by the Office of National Statistics. Crimes defined as rural are any occurring within LSOAs defined as having morphology of ‘Villages, Hamlets & Isolated Dwellings’. We have also chosen, because this is a strategic level document, to analyse all crime rather than focus on crimes perceived as being ‘rural’ because they only occur in rural areas e.g. hare coursing, poaching. National Trends A Home Office study produced in 2003/04 reached the conclusion that rural areas did experience a sharper rise in crime than elsewhere from the late 1980s through to the mid-1990s. This finding may help to explain why crime has become more prominent in the agenda of rural concerns. However the study also confirmed that rural residents consistently experience lower levels of criminal victimization - with levels of burglary, vehicle-related thefts and violence all consistently lower than in non-rural areas.
Local Trends Over the last twelve months there has been a rise in crime committed in rural areas of 7%. There has been some variation between districts with Fenland and Huntingdonshire having modest increases of about 3.5% whilst East Cambridgeshire and South Cambridgeshire had increases of 9.5%. Further analysis shows however that much of South Cambridgeshire’s increase is accounted for by a rise in detected drug offences (related to police activity) once these are removed then increase is a more modest 4.8%. Generally the increases have been for dwelling burglary in South Cambs, East Cambs and Huntingdonshire (an overall increase of 31%). There has also been a general increase in vehicle crime (12%) and Other Theft & handling (16%). Mix of rural crime The graph below shows the relative proportion of the county’s crime committed in rural and other areas. Crimes such as violence against the person are mainly committed with urban areas whilst 30% of ‘other burglary’ (sheds / garages / businesses) is committed in rural areas. % Distribution of crime between different area types
0%
10%
20%
30%
40%
50%
60%
70%
80%
90%
100%
Other Burglary Vehicle Crime Dwelling Burglary Fraud & Forgery Drug Offences All CriminalDamage
Violent Crime Other Offences Other Theft &Handling
Crime Type
URBAN
TOWN & FRINGE
RURAL
South Cambridgeshire Community Safety Partnership – Strategic Assessment 2008 45
PUBLIC PERCEPTION
Summary This section is about public perceptions of crime and disorder in South Cambridgeshire and uses four data sources:
• Mosaic UK and the British Crime Survey (BCS); • The 2006/07 Best Value User Satisfaction Survey (General Survey); • South Cambridgeshire Neighbourhood Policing Area priorities; and • The public consultation that was carried out recently to support this Strategic
Assessment. It shows that:
• In the British Crime Survey, people with similar characteristics (‘Mosaic types’) to people living in South Cambridgeshire were more concerned than the average about people being drunk or rowdy, litter and vandalism and graffiti. This means we may expect people in South Cambridgeshire to also worry about these things more than the average.
• However, the 2006 Best Value Survey asked people in South Cambridgeshire about the issues that concerned them - this is a representative survey and showed low levels of concern about most issues, relative to the average. The biggest problems highlighted were teenagers hanging around, and litter.
• A more detailed local view comes from Neighbourhood Policing priorities and the recent public consultation. Although this was smaller and less representative of the district’s population, it included more categories of issues than the Best Value Survey. The additional worries highlighted by the neighbourhood priorities and the recent consultation include anti-social behaviour, alcohol-related ASB, anti-social driving, vandalism, graffiti, criminal damage, and burglaries of sheds and other outhouses.
South Cambridgeshire Community Safety Partnership – Strategic Assessment 2008 46
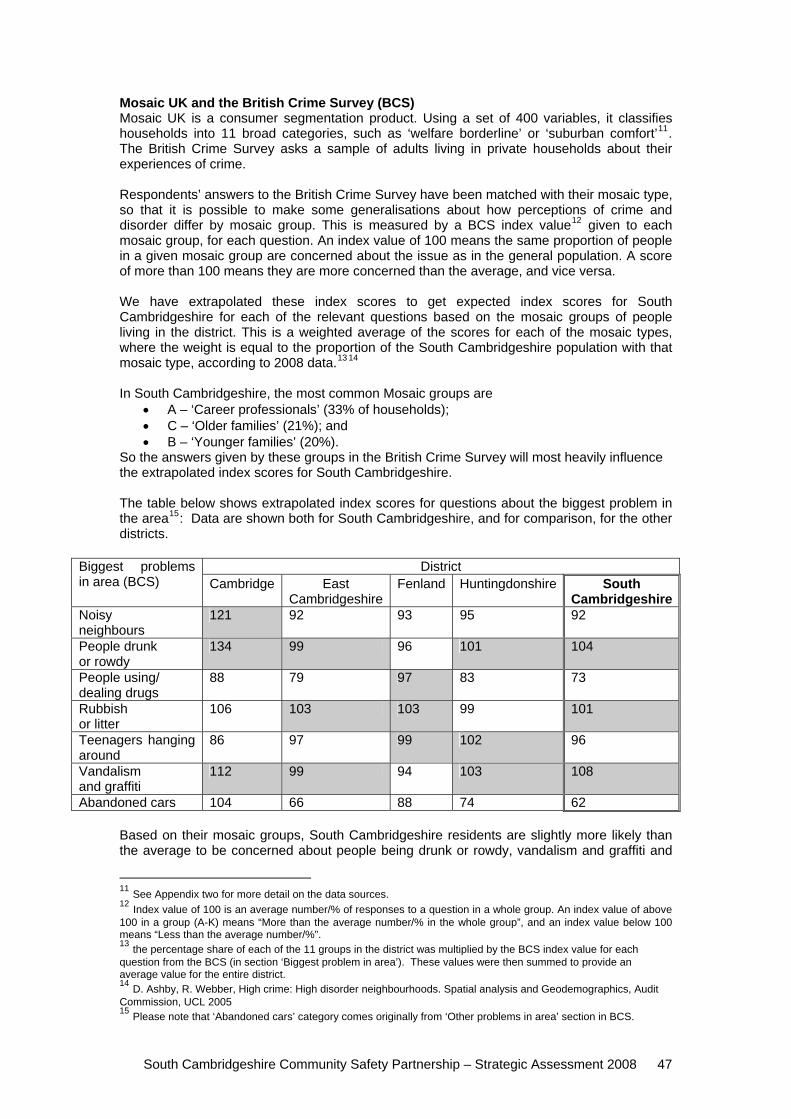
Mosaic UK and the British Crime Survey (BCS) Mosaic UK is a consumer segmentation product. Using a set of 400 variables, it classifies households into 11 broad categories, such as ‘welfare borderline’ or ‘suburban comfort’11. The British Crime Survey asks a sample of adults living in private households about their experiences of crime. Respondents’ answers to the British Crime Survey have been matched with their mosaic type, so that it is possible to make some generalisations about how perceptions of crime and disorder differ by mosaic group. This is measured by a BCS index value12 given to each mosaic group, for each question. An index value of 100 means the same proportion of people in a given mosaic group are concerned about the issue as in the general population. A score of more than 100 means they are more concerned than the average, and vice versa. We have extrapolated these index scores to get expected index scores for South Cambridgeshire for each of the relevant questions based on the mosaic groups of people living in the district. This is a weighted average of the scores for each of the mosaic types, where the weight is equal to the proportion of the South Cambridgeshire population with that mosaic type, according to 2008 data.13 14 In South Cambridgeshire, the most common Mosaic groups are
• A – ‘Career professionals’ (33% of households); • C – ‘Older families’ (21%); and • B – ‘Younger families’ (20%).
So the answers given by these groups in the British Crime Survey will most heavily influence the extrapolated index scores for South Cambridgeshire. The table below shows extrapolated index scores for questions about the biggest problem in the area15: Data are shown both for South Cambridgeshire, and for comparison, for the other districts.
District Biggest problems in area (BCS) Cambridge East
CambridgeshireFenland Huntingdonshire South
CambridgeshireNoisy neighbours
121 92 93 95 92
People drunk or rowdy
134 99 96 101 104
People using/ dealing drugs
88 79 97 83 73
Rubbish or litter
106 103 103 99 101
Teenagers hanging around
86 97 99 102 96
Vandalism and graffiti
112 99 94 103 108
Abandoned cars 104 66 88 74 62 Based on their mosaic groups, South Cambridgeshire residents are slightly more likely than the average to be concerned about people being drunk or rowdy, vandalism and graffiti and
11 See Appendix two for more detail on the data sources. 12 Index value of 100 is an average number/% of responses to a question in a whole group. An index value of above 100 in a group (A-K) means “More than the average number/% in the whole group”, and an index value below 100 means “Less than the average number/%”. 13 the percentage share of each of the 11 groups in the district was multiplied by the BCS index value for each question from the BCS (in section ‘Biggest problem in area’). These values were then summed to provide an average value for the entire district. 14 D. Ashby, R. Webber, High crime: High disorder neighbourhoods. Spatial analysis and Geodemographics, Audit Commission, UCL 2005 15 Please note that ‘Abandoned cars’ category comes originally from ‘Other problems in area’ section in BCS.
South Cambridgeshire Community Safety Partnership – Strategic Assessment 2008 47
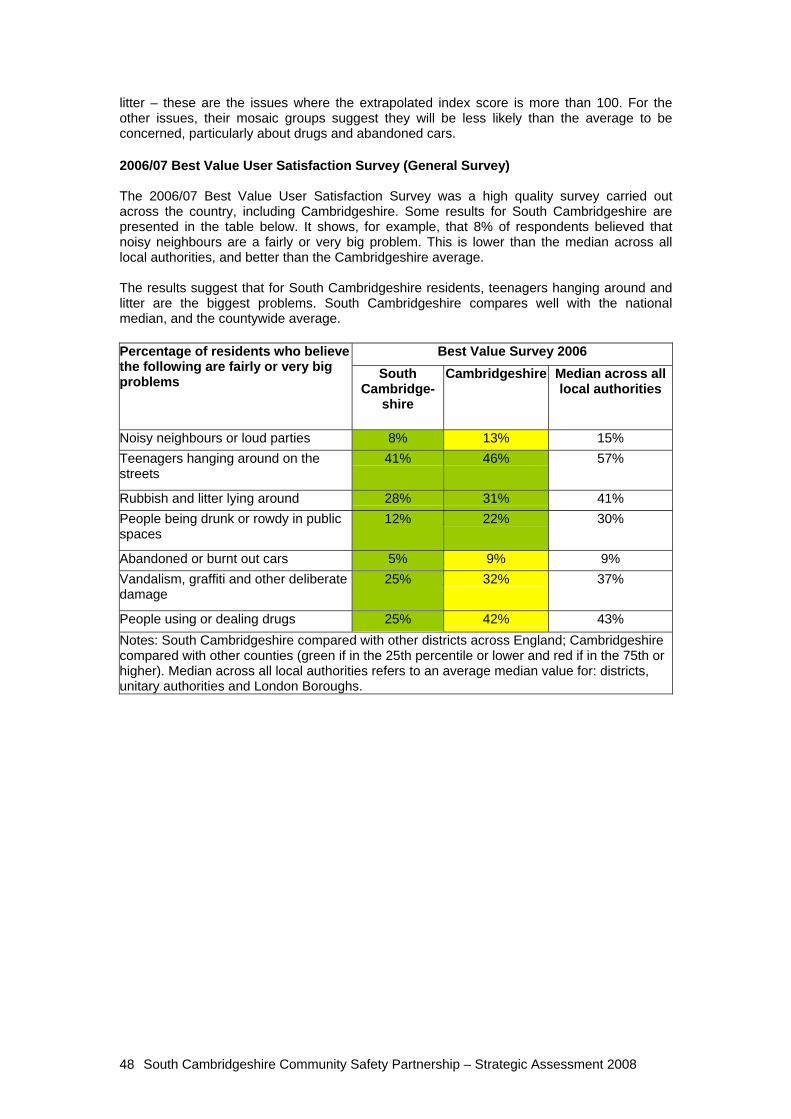
litter – these are the issues where the extrapolated index score is more than 100. For the other issues, their mosaic groups suggest they will be less likely than the average to be concerned, particularly about drugs and abandoned cars. 2006/07 Best Value User Satisfaction Survey (General Survey) The 2006/07 Best Value User Satisfaction Survey was a high quality survey carried out across the country, including Cambridgeshire. Some results for South Cambridgeshire are presented in the table below. It shows, for example, that 8% of respondents believed that noisy neighbours are a fairly or very big problem. This is lower than the median across all local authorities, and better than the Cambridgeshire average. The results suggest that for South Cambridgeshire residents, teenagers hanging around and litter are the biggest problems. South Cambridgeshire compares well with the national median, and the countywide average.
Best Value Survey 2006 Percentage of residents who believe the following are fairly or very big problems South
Cambridge-shire
Cambridgeshire Median across all local authorities
Noisy neighbours or loud parties 8% 13% 15% Teenagers hanging around on the streets
41% 46% 57%
Rubbish and litter lying around 28% 31% 41% People being drunk or rowdy in public spaces
12% 22% 30%
Abandoned or burnt out cars 5% 9% 9% Vandalism, graffiti and other deliberate damage
25% 32% 37%
People using or dealing drugs 25% 42% 43% Notes: South Cambridgeshire compared with other districts across England; Cambridgeshire compared with other counties (green if in the 25th percentile or lower and red if in the 75th or higher). Median across all local authorities refers to an average median value for: districts, unitary authorities and London Boroughs.
South Cambridgeshire Community Safety Partnership – Strategic Assessment 2008 48
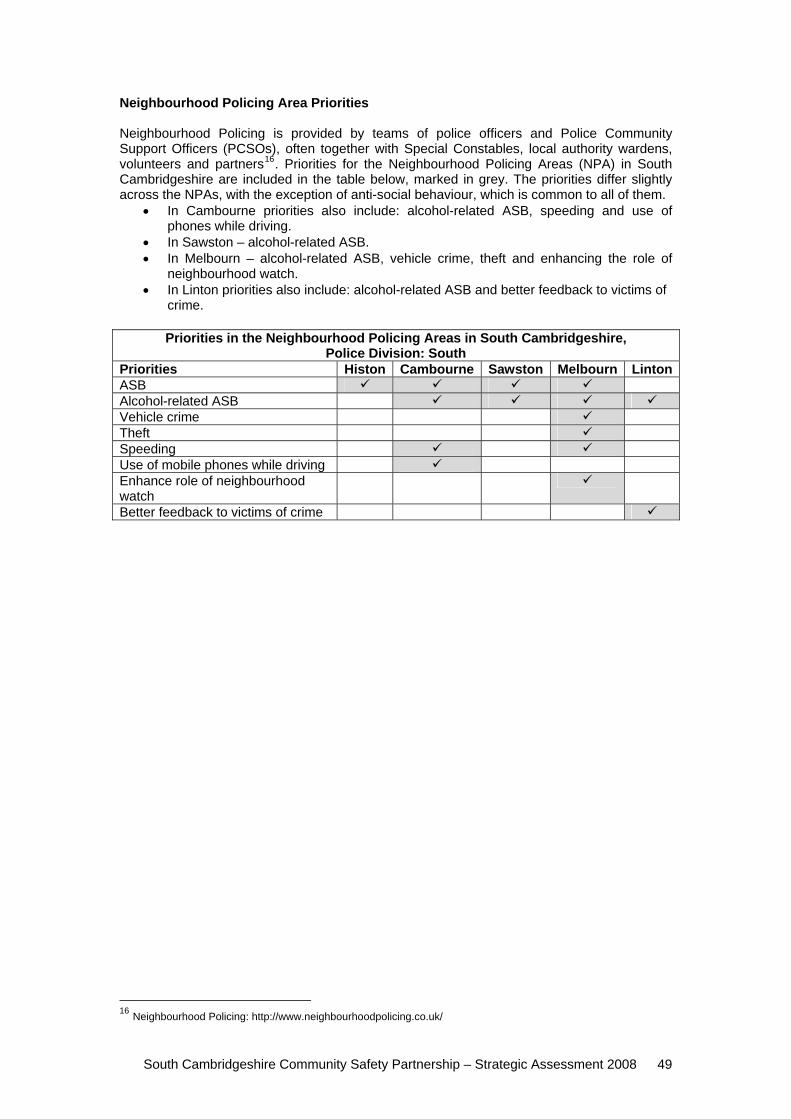
Neighbourhood Policing Area Priorities Neighbourhood Policing is provided by teams of police officers and Police Community Support Officers (PCSOs), often together with Special Constables, local authority wardens, volunteers and partners16. Priorities for the Neighbourhood Policing Areas (NPA) in South Cambridgeshire are included in the table below, marked in grey. The priorities differ slightly across the NPAs, with the exception of anti-social behaviour, which is common to all of them.
• In Cambourne priorities also include: alcohol-related ASB, speeding and use of phones while driving.
• In Sawston – alcohol-related ASB. • In Melbourn – alcohol-related ASB, vehicle crime, theft and enhancing the role of
neighbourhood watch. • In Linton priorities also include: alcohol-related ASB and better feedback to victims of
crime.
Priorities in the Neighbourhood Policing Areas in South Cambridgeshire, Police Division: South
Priorities Histon Cambourne Sawston Melbourn LintonASB Alcohol-related ASB Vehicle crime Theft Speeding Use of mobile phones while driving Enhance role of neighbourhood watch
Better feedback to victims of crime
16 Neighbourhood Policing: http://www.neighbourhoodpolicing.co.uk/
South Cambridgeshire Community Safety Partnership – Strategic Assessment 2008 49
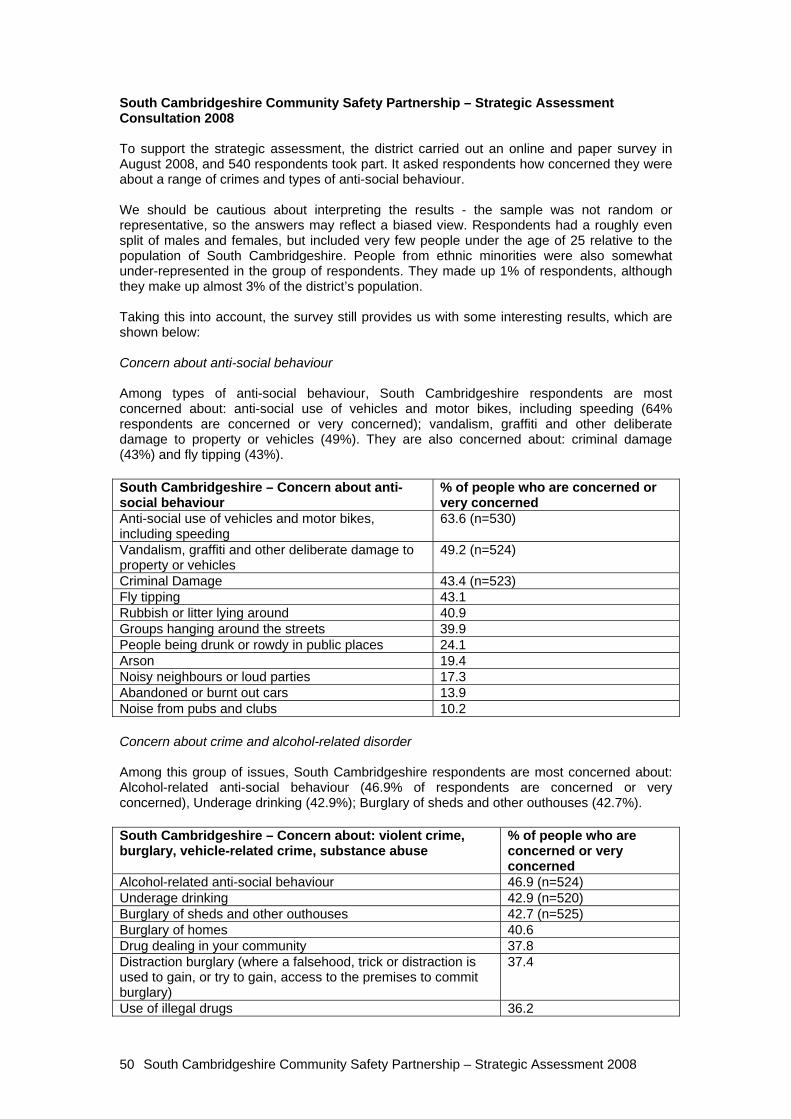
South Cambridgeshire Community Safety Partnership – Strategic Assessment Consultation 2008 To support the strategic assessment, the district carried out an online and paper survey in August 2008, and 540 respondents took part. It asked respondents how concerned they were about a range of crimes and types of anti-social behaviour. We should be cautious about interpreting the results - the sample was not random or representative, so the answers may reflect a biased view. Respondents had a roughly even split of males and females, but included very few people under the age of 25 relative to the population of South Cambridgeshire. People from ethnic minorities were also somewhat under-represented in the group of respondents. They made up 1% of respondents, although they make up almost 3% of the district’s population. Taking this into account, the survey still provides us with some interesting results, which are shown below: Concern about anti-social behaviour Among types of anti-social behaviour, South Cambridgeshire respondents are most concerned about: anti-social use of vehicles and motor bikes, including speeding (64% respondents are concerned or very concerned); vandalism, graffiti and other deliberate damage to property or vehicles (49%). They are also concerned about: criminal damage (43%) and fly tipping (43%). South Cambridgeshire – Concern about anti-social behaviour
% of people who are concerned or very concerned
Anti-social use of vehicles and motor bikes, including speeding
63.6 (n=530)
Vandalism, graffiti and other deliberate damage to property or vehicles
49.2 (n=524)
Criminal Damage 43.4 (n=523) Fly tipping 43.1 Rubbish or litter lying around 40.9 Groups hanging around the streets 39.9 People being drunk or rowdy in public places 24.1 Arson 19.4 Noisy neighbours or loud parties 17.3 Abandoned or burnt out cars 13.9 Noise from pubs and clubs 10.2 Concern about crime and alcohol-related disorder Among this group of issues, South Cambridgeshire respondents are most concerned about: Alcohol-related anti-social behaviour (46.9% of respondents are concerned or very concerned), Underage drinking (42.9%); Burglary of sheds and other outhouses (42.7%). South Cambridgeshire – Concern about: violent crime, burglary, vehicle-related crime, substance abuse
% of people who are concerned or very concerned
Alcohol-related anti-social behaviour 46.9 (n=524) Underage drinking 42.9 (n=520) Burglary of sheds and other outhouses 42.7 (n=525) Burglary of homes 40.6 Drug dealing in your community 37.8 Distraction burglary (where a falsehood, trick or distraction is used to gain, or try to gain, access to the premises to commit burglary)
37.4
Use of illegal drugs 36.2
South Cambridgeshire Community Safety Partnership – Strategic Assessment 2008 50
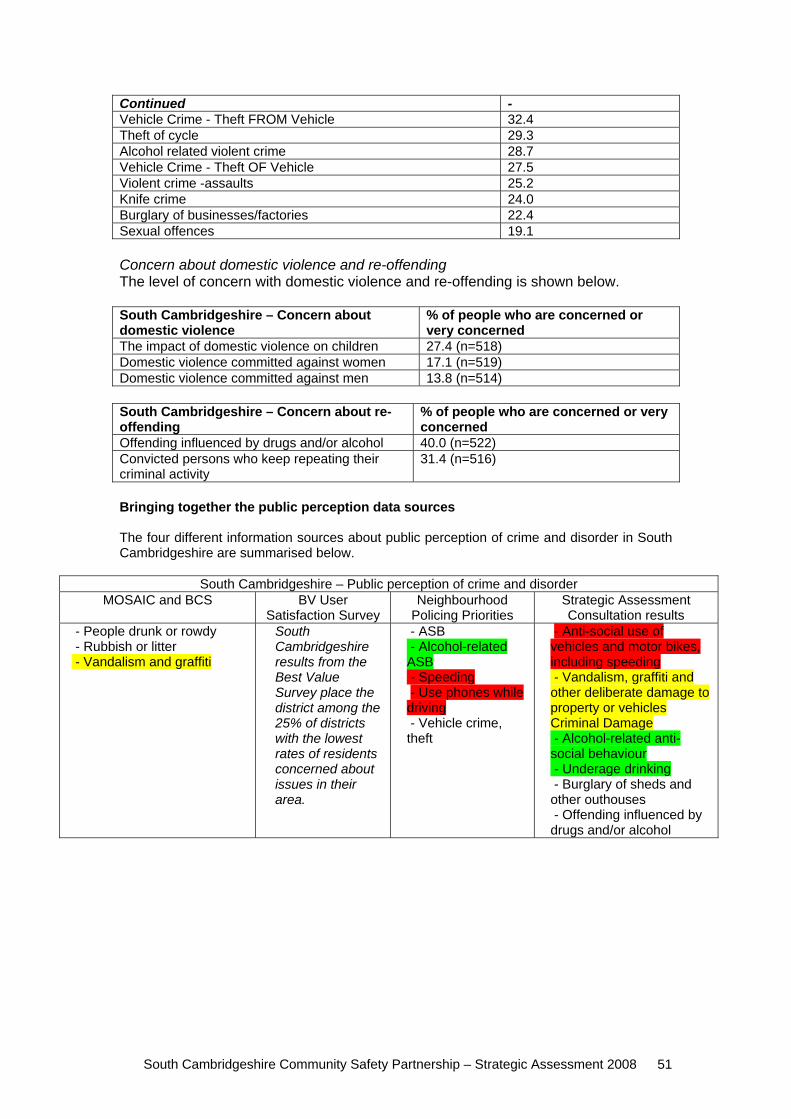
Continued - Vehicle Crime - Theft FROM Vehicle 32.4 Theft of cycle 29.3 Alcohol related violent crime 28.7 Vehicle Crime - Theft OF Vehicle 27.5 Violent crime -assaults 25.2 Knife crime 24.0 Burglary of businesses/factories 22.4 Sexual offences 19.1 Concern about domestic violence and re-offending The level of concern with domestic violence and re-offending is shown below. South Cambridgeshire – Concern about domestic violence
% of people who are concerned or very concerned
The impact of domestic violence on children 27.4 (n=518) Domestic violence committed against women 17.1 (n=519) Domestic violence committed against men 13.8 (n=514) South Cambridgeshire – Concern about re-offending
% of people who are concerned or very concerned
Offending influenced by drugs and/or alcohol 40.0 (n=522) Convicted persons who keep repeating their criminal activity
31.4 (n=516)
Bringing together the public perception data sources The four different information sources about public perception of crime and disorder in South Cambridgeshire are summarised below.
South Cambridgeshire – Public perception of crime and disorder MOSAIC and BCS BV User
Satisfaction Survey Neighbourhood
Policing Priorities Strategic Assessment Consultation results
- People drunk or rowdy - Rubbish or litter - Vandalism and graffiti
South Cambridgeshire results from the Best Value Survey place the district among the 25% of districts with the lowest rates of residents concerned about issues in their area.
- ASB - Alcohol-related ASB - Speeding - Use phones while driving - Vehicle crime, theft
- Anti-social use of vehicles and motor bikes, including speeding - Vandalism, graffiti and other deliberate damage to property or vehicles Criminal Damage - Alcohol-related anti-social behaviour - Underage drinking - Burglary of sheds and other outhouses - Offending influenced by drugs and/or alcohol
South Cambridgeshire Community Safety Partnership – Strategic Assessment 2008 51
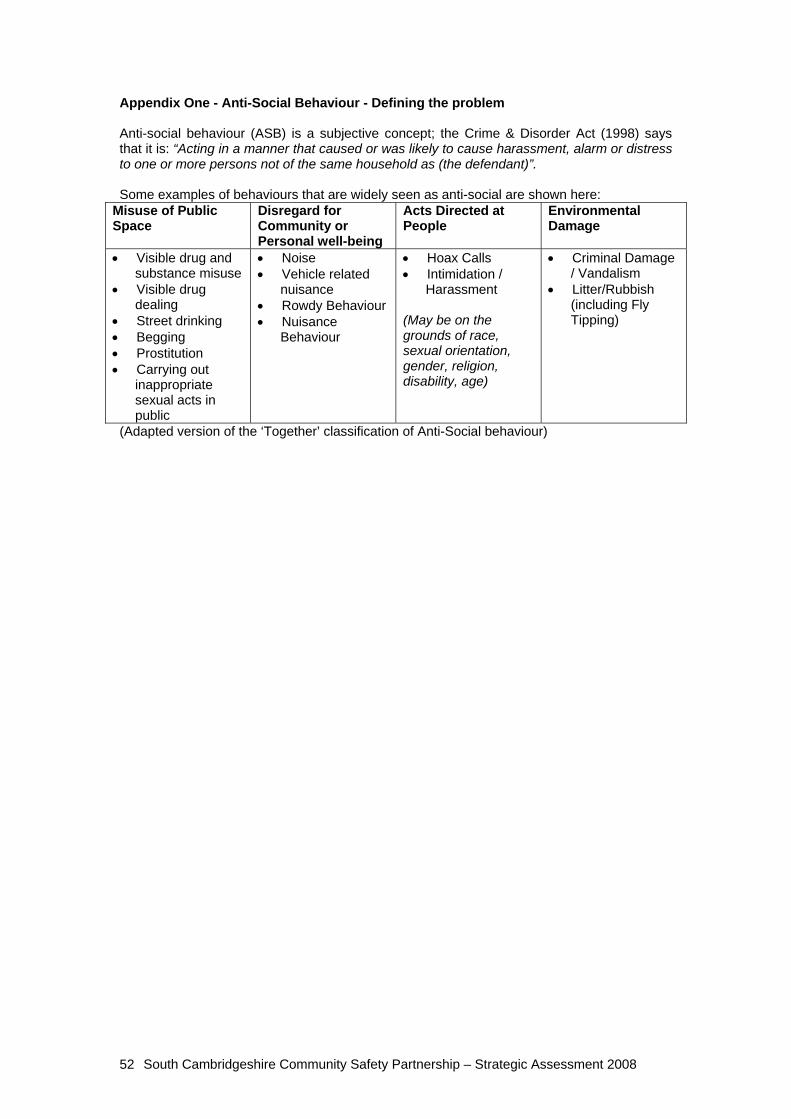
Appendix One - Anti-Social Behaviour - Defining the problem Anti-social behaviour (ASB) is a subjective concept; the Crime & Disorder Act (1998) says that it is: “Acting in a manner that caused or was likely to cause harassment, alarm or distress to one or more persons not of the same household as (the defendant)”. Some examples of behaviours that are widely seen as anti-social are shown here:
Misuse of Public Space
Disregard for Community or Personal well-being
Acts Directed at People
Environmental Damage
• Visible drug and substance misuse
• Visible drug dealing
• Street drinking • Begging • Prostitution • Carrying out
inappropriate sexual acts in public
• Noise • Vehicle related
nuisance • Rowdy Behaviour • Nuisance
Behaviour
• Hoax Calls • Intimidation /
Harassment (May be on the grounds of race, sexual orientation, gender, religion, disability, age)
• Criminal Damage / Vandalism
• Litter/Rubbish (including Fly Tipping)
(Adapted version of the ‘Together’ classification of Anti-Social behaviour)
South Cambridgeshire Community Safety Partnership – Strategic Assessment 2008 52
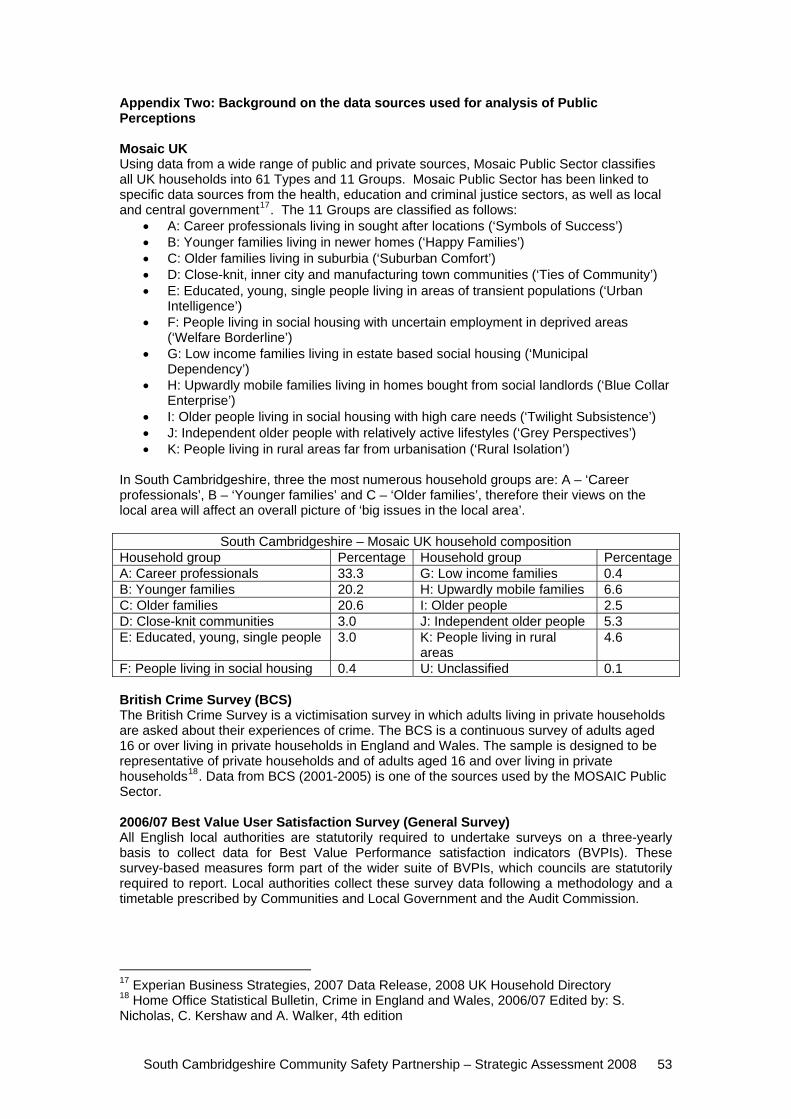
Appendix Two: Background on the data sources used for analysis of Public Perceptions Mosaic UK Using data from a wide range of public and private sources, Mosaic Public Sector classifies all UK households into 61 Types and 11 Groups. Mosaic Public Sector has been linked to specific data sources from the health, education and criminal justice sectors, as well as local and central government17. The 11 Groups are classified as follows:
• A: Career professionals living in sought after locations (‘Symbols of Success’) • B: Younger families living in newer homes (‘Happy Families’) • C: Older families living in suburbia (‘Suburban Comfort’) • D: Close-knit, inner city and manufacturing town communities (‘Ties of Community’) • E: Educated, young, single people living in areas of transient populations (‘Urban
Intelligence’) • F: People living in social housing with uncertain employment in deprived areas
(‘Welfare Borderline’) • G: Low income families living in estate based social housing (‘Municipal
Dependency’) • H: Upwardly mobile families living in homes bought from social landlords (‘Blue Collar
Enterprise’) • I: Older people living in social housing with high care needs (‘Twilight Subsistence’) • J: Independent older people with relatively active lifestyles (‘Grey Perspectives’) • K: People living in rural areas far from urbanisation (‘Rural Isolation’)
In South Cambridgeshire, three the most numerous household groups are: A – ‘Career professionals’, B – ‘Younger families’ and C – ‘Older families’, therefore their views on the local area will affect an overall picture of ‘big issues in the local area’.
South Cambridgeshire – Mosaic UK household composition Household group Percentage Household group PercentageA: Career professionals 33.3 G: Low income families 0.4 B: Younger families 20.2 H: Upwardly mobile families 6.6 C: Older families 20.6 I: Older people 2.5 D: Close-knit communities 3.0 J: Independent older people 5.3 E: Educated, young, single people 3.0 K: People living in rural
areas 4.6
F: People living in social housing 0.4 U: Unclassified 0.1 British Crime Survey (BCS) The British Crime Survey is a victimisation survey in which adults living in private households are asked about their experiences of crime. The BCS is a continuous survey of adults aged 16 or over living in private households in England and Wales. The sample is designed to be representative of private households and of adults aged 16 and over living in private households18. Data from BCS (2001-2005) is one of the sources used by the MOSAIC Public Sector. 2006/07 Best Value User Satisfaction Survey (General Survey) All English local authorities are statutorily required to undertake surveys on a three-yearly basis to collect data for Best Value Performance satisfaction indicators (BVPIs). These survey-based measures form part of the wider suite of BVPIs, which councils are statutorily required to report. Local authorities collect these survey data following a methodology and a timetable prescribed by Communities and Local Government and the Audit Commission.
17 Experian Business Strategies, 2007 Data Release, 2008 UK Household Directory 18 Home Office Statistical Bulletin, Crime in England and Wales, 2006/07 Edited by: S. Nicholas, C. Kershaw and A. Walker, 4th edition
South Cambridgeshire Community Safety Partnership – Strategic Assessment 2008 53
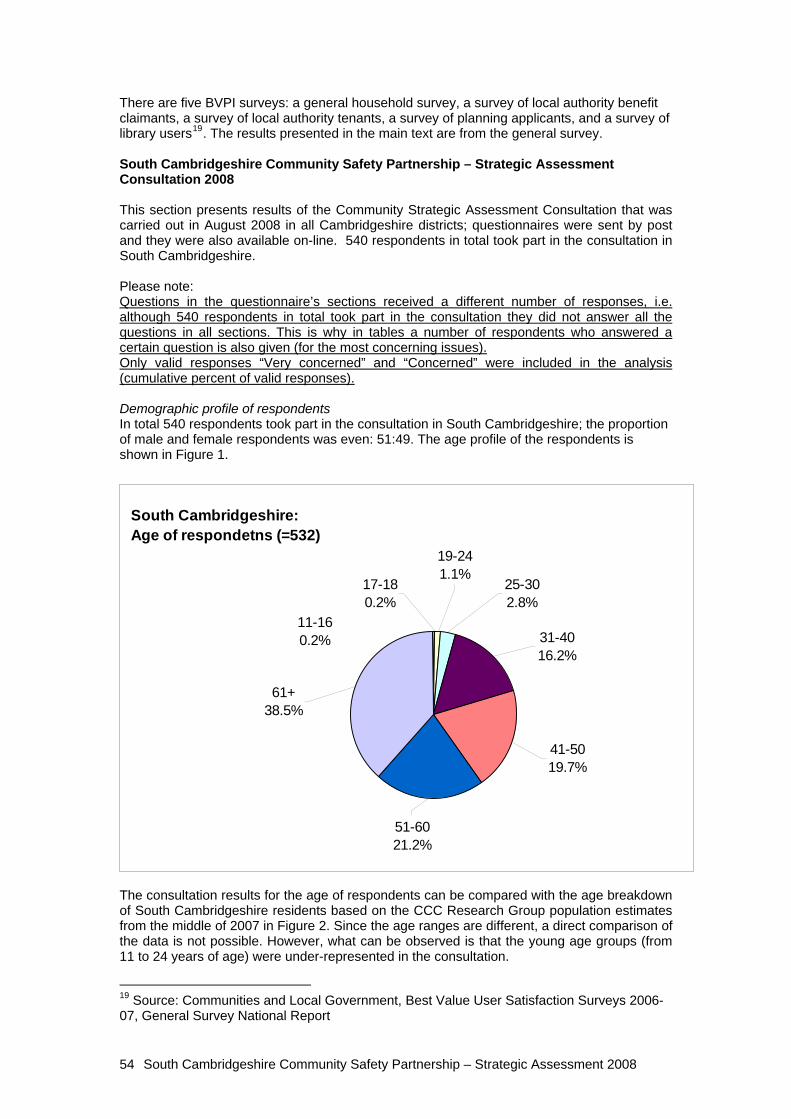
There are five BVPI surveys: a general household survey, a survey of local authority benefit claimants, a survey of local authority tenants, a survey of planning applicants, and a survey of library users19. The results presented in the main text are from the general survey. South Cambridgeshire Community Safety Partnership – Strategic Assessment Consultation 2008 This section presents results of the Community Strategic Assessment Consultation that was carried out in August 2008 in all Cambridgeshire districts; questionnaires were sent by post and they were also available on-line. 540 respondents in total took part in the consultation in South Cambridgeshire. Please note: Questions in the questionnaire’s sections received a different number of responses, i.e. although 540 respondents in total took part in the consultation they did not answer all the questions in all sections. This is why in tables a number of respondents who answered a certain question is also given (for the most concerning issues). Only valid responses “Very concerned” and “Concerned” were included in the analysis (cumulative percent of valid responses). Demographic profile of respondents In total 540 respondents took part in the consultation in South Cambridgeshire; the proportion of male and female respondents was even: 51:49. The age profile of the respondents is shown in Figure 1.
South Cambridgeshire: Age of respondetns (=532)
51-60 21.2%
11-160.2%
19-241.1%
61+38.5%
41-5019.7%
31-4016.2%
25-302.8%
17-180.2%
The consultation results for the age of respondents can be compared with the age breakdown of South Cambridgeshire residents based on the CCC Research Group population estimates from the middle of 2007 in Figure 2. Since the age ranges are different, a direct comparison of the data is not possible. However, what can be observed is that the young age groups (from 11 to 24 years of age) were under-represented in the consultation.
19 Source: Communities and Local Government, Best Value User Satisfaction Surveys 2006-07, General Survey National Report
South Cambridgeshire Community Safety Partnership – Strategic Assessment 2008 54
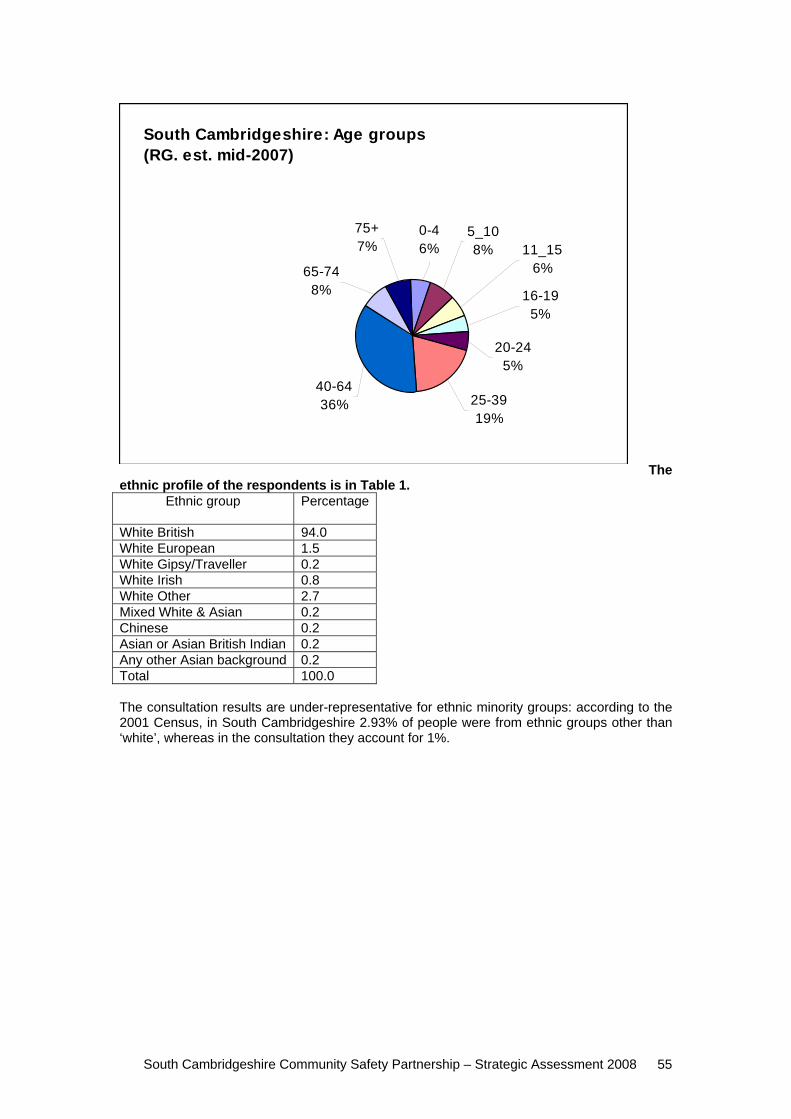
South Cambridgeshire: Age groups (RG. est. mid-2007)
40-6436%
11_156%
5_108%
16-195%
20-245%
25-3919%
0-46%
75+7%
65-748%
The ethnic profile of the respondents is in Table 1.
Ethnic group
Percentage
White British 94.0 White European 1.5 White Gipsy/Traveller 0.2 White Irish 0.8 White Other 2.7 Mixed White & Asian 0.2 Chinese 0.2 Asian or Asian British Indian 0.2 Any other Asian background 0.2 Total 100.0 The consultation results are under-representative for ethnic minority groups: according to the 2001 Census, in South Cambridgeshire 2.93% of people were from ethnic groups other than ‘white’, whereas in the consultation they account for 1%.
South Cambridgeshire Community Safety Partnership – Strategic Assessment 2008 55