Embed Size (px)
Citation preview
0
CRIME AND DISORDER AUDIT
DISTRICT OF SOUTH KESTEVEN
DECEMBER 2001
Prepared forSouth Kesteven Crime and Disorder Partnership by:
Neil Atkinson and Inspector Mick Start
1
CONTENTS
PAGEForeword 2
1 Introduction to the Partnership 32 Population 43 Crime
a) all crimeb) violent crimec) burglaryd) vehicle crimee) criminal damage
5
4 Drugs 115 Domestic violence 126 Disorder 147 Road safety 198 Cost of crime 209 Best Value – Family group comparisons 2510 Public opinion polls 2711 Offender profiles 3512 Housing 3813 Education and Employment 3814 National index of deprivation 3915 Beat profiles 4016 Conclusion 4417 References (source documents are
identified by the title anddate in brackets andreferenced fully in thissection)
45
18 Index of appendices 4619 Glossary (lookout for the superscript
numbers: eg. Crime Concern1
which refers to an explanationof Crime Concern, in thisexample in the Glossary
46

2
FOREWORD by Chris Farmer, Chief Executive of South KestevenDistrict Council and Partnership Chairman
It has been my pleasure to chair this partnership for the last three years. Thepartnership was set up in 1998 following the Crime and Disorder Act. Since then ithas seen crime fall generally in an area that already enjoyed low crime levels.
The level of co-operation between the Lincolnshire Police, Lincolnshire CountyCouncil, the Lincolnshire Police Authority and the health authorities has increasedsignificantly. The impact on crime has varied as you will see in this report.
Crime continues to occur and it is this partnership’s role to continue to strive for lowercrime levels.
Fear of crime is a greater problem. For every victim of crime the family andacquaintances of the victim gain a heightened awareness of crime and they will sharetheir concerns with their own acquaintances.
The purpose of this audit report is to share with you the issues raised by the statisticsfrom the police and other partner agencies and the issues people raised through asurvey of public’s perceptions and experiences of crime, which was conducted in theearly part of this summer.
We now want to know what you think.
• Are the issues raised a realistic assessment?
• Are the issues those you want the partners to tackle?
It is important that the strategy we develop both from this audit and the viewsexpressed is the right approach to further reduce crime and the fear of crime.
Your comments will be essential in helping us to develop the strategy for the period2002-2005 for this district.
Please send them by Friday 1 March 2002 to:
Neil AtkinsonCommunity Safety OfficerSKDCFREEPOST GM 48GranthamLincolnshireNG31 6PZ

3
1) Introduction
The South Kesteven Crime and Disorder Partnership
The Partnership involves a wide range of agencies that meet together as asteering group four times-a-year to discuss and co-ordinate action to tacklethe priorities identified in the current strategy.
The partners include:• Lincolnshire Police• Lincolnshire County Council (including the Youth Service and
Lincolnshire Fire and Rescue Service)• South Kesteven District Council• Lincolnshire Health and Lincolnshire South West Primary Care Trust• National Probation Service• Lincolnshire Police Authority• Grantham College• Army
The current strategic priorities are:
• Quality of life• Youth issues• Substance misuse• Domestic burglary• Road safety• Domestic violence
The South Kesteven Crime and Disorder Partnership has been in existencefor three years. During that time it has enabled a closer working relationshipbetween the partner organisations. Specific projects have been sponsoredincluding:
• Earlesfield burglary reduction initiative;• Earlesfield parenting project;• Harrowby Community and New Beacon Project• enhancing closed circuit television (CCTV) coverage;• supporting the expansion of Neighbourhood Watch;• introducing a domestic violence counselling service in Grantham;• emergency property repair service entitled ‘Keste -Van’ for victims of
crime whose home security has been damaged;• retail radio schemes covering licensed and retail premises linked to
CCTV;• various road safety initiatives including commissioning interactive
mobile speed warning signs;• driver training and drink driving campaign.
4
In response to recommendations from the district auditor and Crime Concern,1the partnership has adopted an approach that ensures that each strategicpriority is addressed by establishing priority implementation project groups
The purpose of the audit is to research the latest trends in the partnershiparea and to use that information effectively to help promote safer and healthiercommunities. The purpose of this consultation is to help the partnership toaddress community concerns and implement projects based on the evidencein the audit.
Your role is important: are these priorities still appropriate, or should thepartnership consider other issues?
The next steps
The consultation period for this document ends on Friday 1 March 2002.Afterwards, the Crime and Disorder Partnership Steering Group will meet inorder to consider what you and others have said. It will then consider whichoffence types and issues should be included as priorities for action in astrategy for the next three years, the period between April 2002 and the end ofMarch 2005.
Although we have set a deadline for comments that the partnership willconsider when developing the strategy, we want to encourage you to raiseany issue that is of concern to you at any stage during the life of the strategy.
2) Population
The administrative area of South Kesteven is in the south west corner ofLincolnshire. It borders the counties of Nottinghamshire, Leicestershire andCambridgeshire and the Lincolnshire districts of North Kesteven and SouthHolland. South Kesteven incorporates the market towns of Grantham,Stamford, Bourne and the Deepings, together with 100 villages and hamlets,covering 365 square miles or 943.1 square kilometres.
The population of South Kesteven is nearly 123,400, (ONS 2000) with thehighest concentration (40,000 people) in Grantham. The town is wellconnected to other areas, sitting as it does on the A1, Great North Road andserved by the East Coast main railway line. The main east – west link is A52,which passes through Grantham.
Stamford is at the southern tip of South Kesteven where 20,000 people live.
Bourne and the Deepings lay in the rural south eastern part of the district withpopulations of approximately 11,000 and 12,000 people respectively.
5
3) Crime
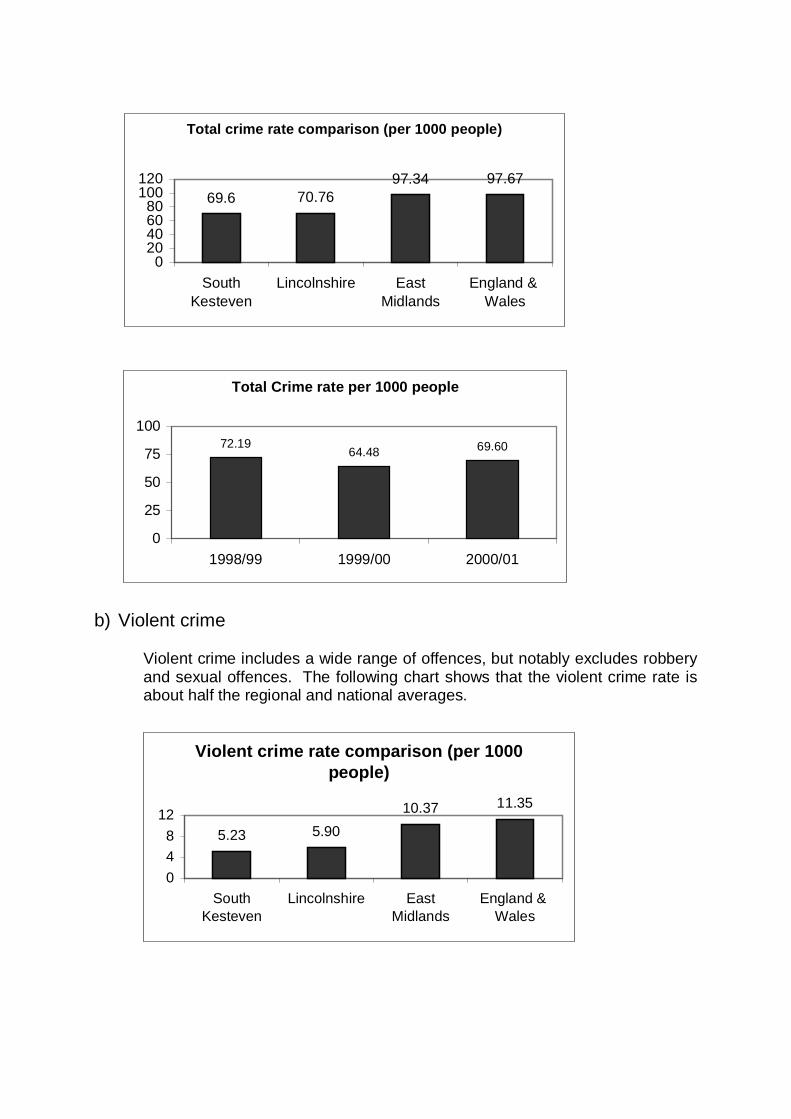
Crime levels in this report are expressed as a crime rate per 1000 people,unless otherwise stated. This helps us to compare the amount of crime withother areas that may have different population levels.
The charts below are taken from two different data sources.
The charts that show the county, regional and national comparisons are takenfrom the Home Office Statistical bulletin 12/01 of recorded crime statisticsbetween April 2000 and March 2001. This data includes a limited number ofcrimes, which are measured for the Best Value2 approach. These crimes are:domestic burglary, violent crime, sexual offences and theft of and theft fromvehicles.
Whereas the charts that show the change in recorded crime over the previousthree years have used data supplied by Lincolnshire Police (2001A). Thisdata includes a much wider range of crime recorded by Lincolnshire Police.They include, in addition to the Best Value crimes: all other burglaries,robbery, fraud and forgery, other theft, criminal damage, drugs, and othercrime.
a) All crime
The two charts below indicate two clear facts: the recorded crime rate in SouthKesteven is much lower than the national and regional averages andcomparable with the county average. Crime fell during the two years since1998/99.
The total number of recorded crimes between April 2000 and March 2001 was8695 offences. This compares with 8865 for the same period in 1998/99.
This is a small fall during a time when greater drops in crime have been seenelsewhere, notably in North Kesteven and nationally.
6
b) Violent crime
Violent crime includes a wide range of offences, but notably excludes robberyand sexual offences. The following chart shows that the violent crime rate isabout half the regional and national averages.
Total Crime rate per 1000 people
72.1964.48 69.60
0
25
50
75
100
1998/99 1999/00 2000/01
Total crime rate comparison (per 1000 people)
69.6 70.7697.34 97.67
020406080
100120
SouthKesteven
Lincolnshire EastMidlands
England & Wales
Violent crime rate comparison (per 1000 people)
5.23 5.9010.37 11.35
048
12
SouthKesteven
Lincolnshire EastMidlands
England & Wales
7
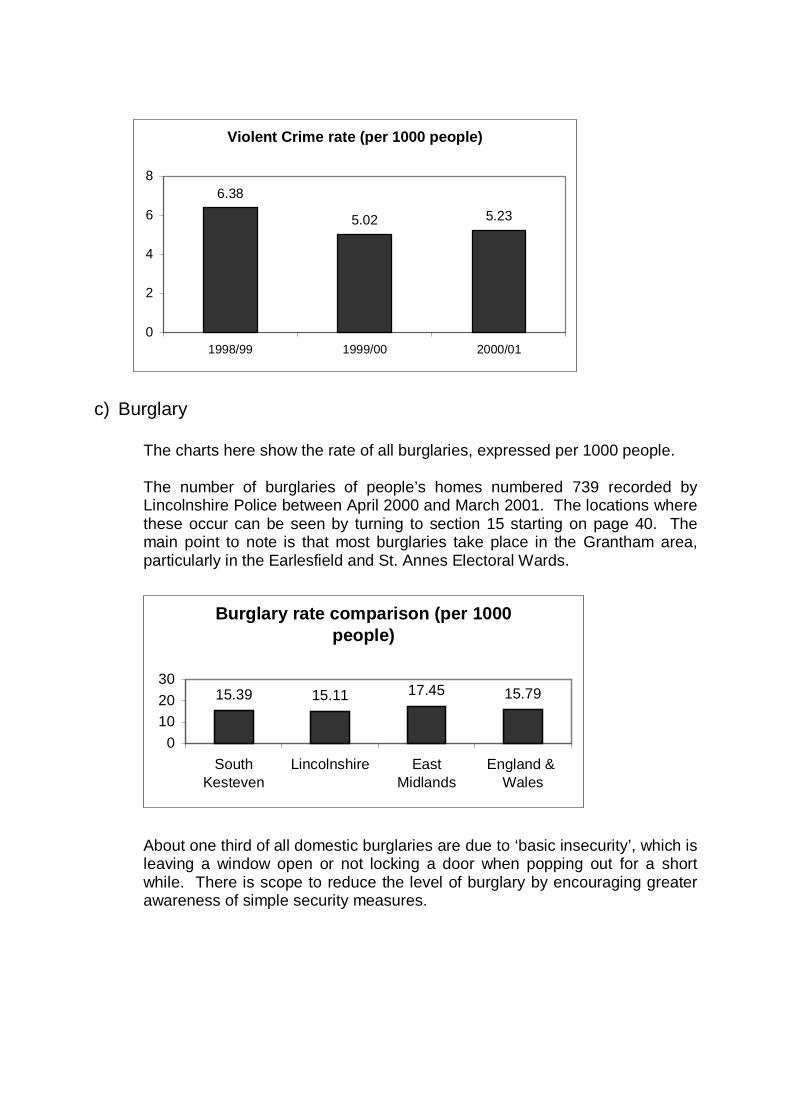
c) Burglary
The charts here show the rate of all burglaries, expressed per 1000 people.
The number of burglaries of people’s homes numbered 739 recorded byLincolnshire Police between April 2000 and March 2001. The locations wherethese occur can be seen by turning to section 15 starting on page 40. Themain point to note is that most burglaries take place in the Grantham area,particularly in the Earlesfield and St. Annes Electoral Wards.
About one third of all domestic burglaries are due to ‘basic insecurity’, which isleaving a window open or not locking a door when popping out for a shortwhile. There is scope to reduce the level of burglary by encouraging greaterawareness of simple security measures.
Violent Crime rate (per 1000 people)
6.38
5.02 5.23
0
2
4
6
8
1998/99 1999/00 2000/01
Burglary rate comparison (per 1000 people)
15.39 15.11 17.45 15.79
0102030
SouthKesteven
Lincolnshire EastMidlands
England & Wales
8
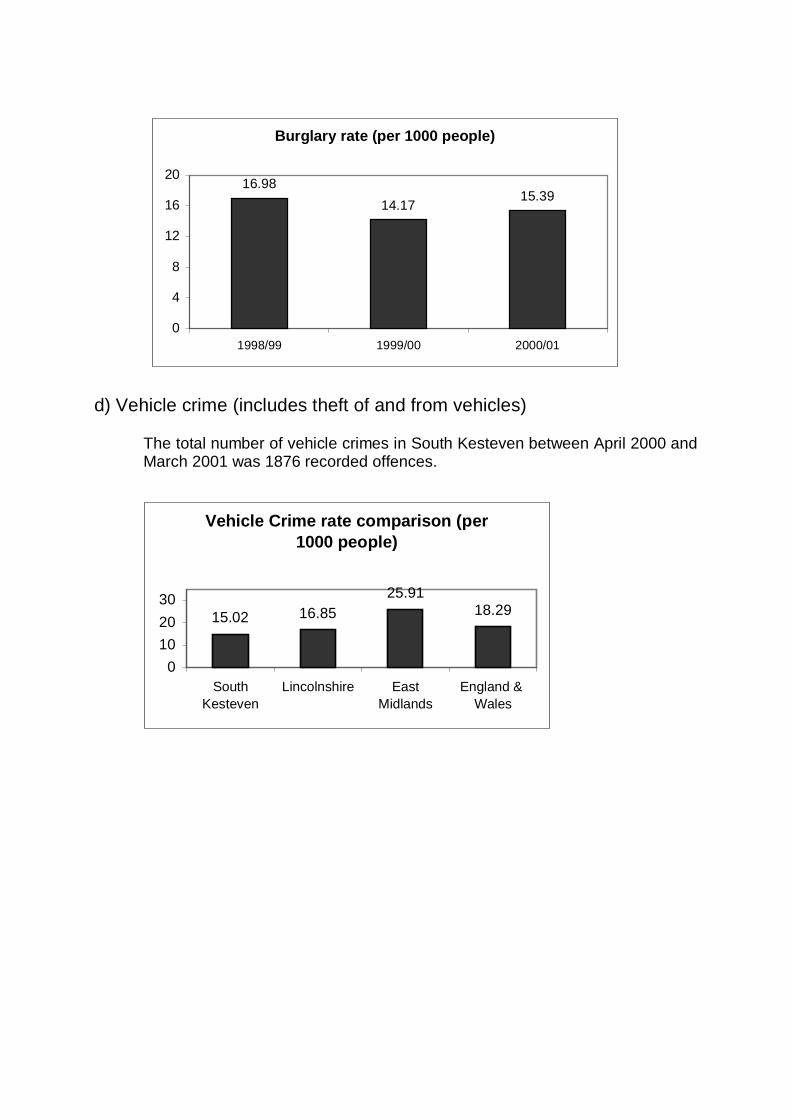
d) Vehicle crime (includes theft of and from vehicles)
The total number of vehicle crimes in South Kesteven between April 2000 andMarch 2001 was 1876 recorded offences.
Burglary rate (per 1000 people)
16.9814.17
15.39
0
4
8
12
16
20
1998/99 1999/00 2000/01
Vehicle Crime rate comparison (per 1000 people)
15.02 16.8525.91
18.29
0102030
SouthKesteven
Lincolnshire EastMidlands
England & Wales
9
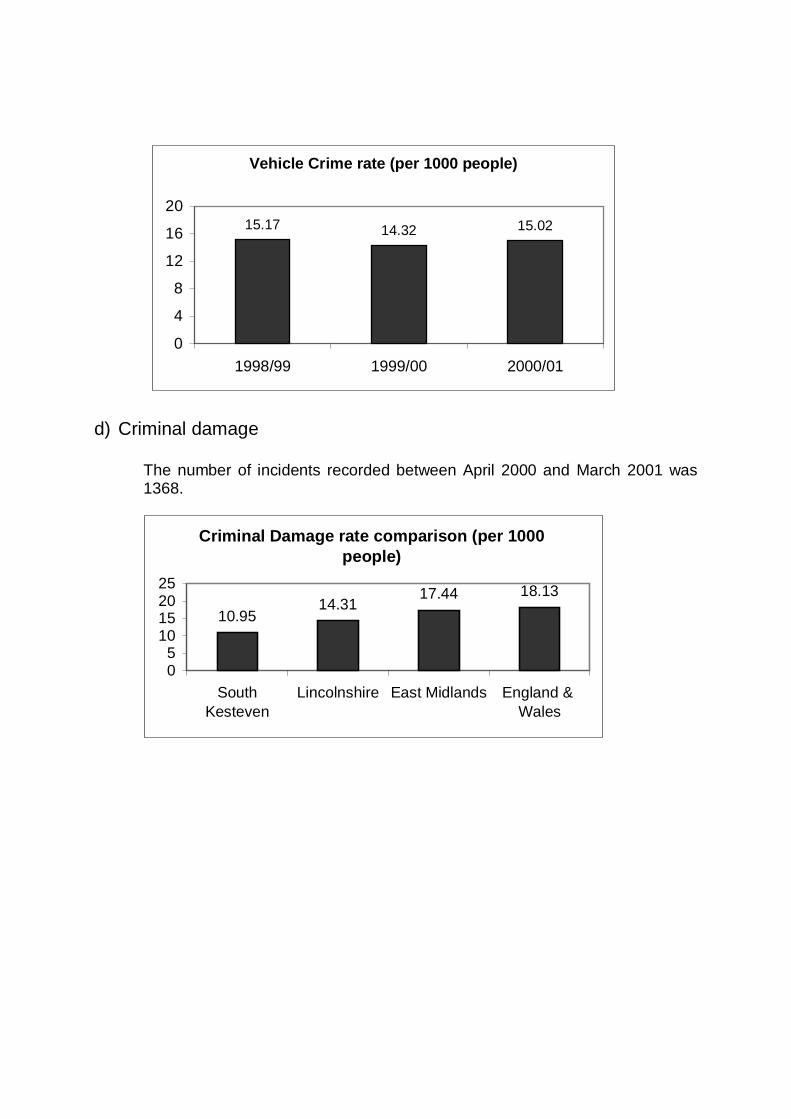
d) Criminal damage
The number of incidents recorded between April 2000 and March 2001 was1368.
Criminal Damage rate comparison (per 1000 people)
10.9514.31
17.44 18.13
05
10152025
SouthKesteven
Lincolnshire East Midlands England & Wales
Vehicle Crime rate (per 1000 people)
15.17 14.32 15.02
0
4
8
12
16
20
1998/99 1999/00 2000/01
10
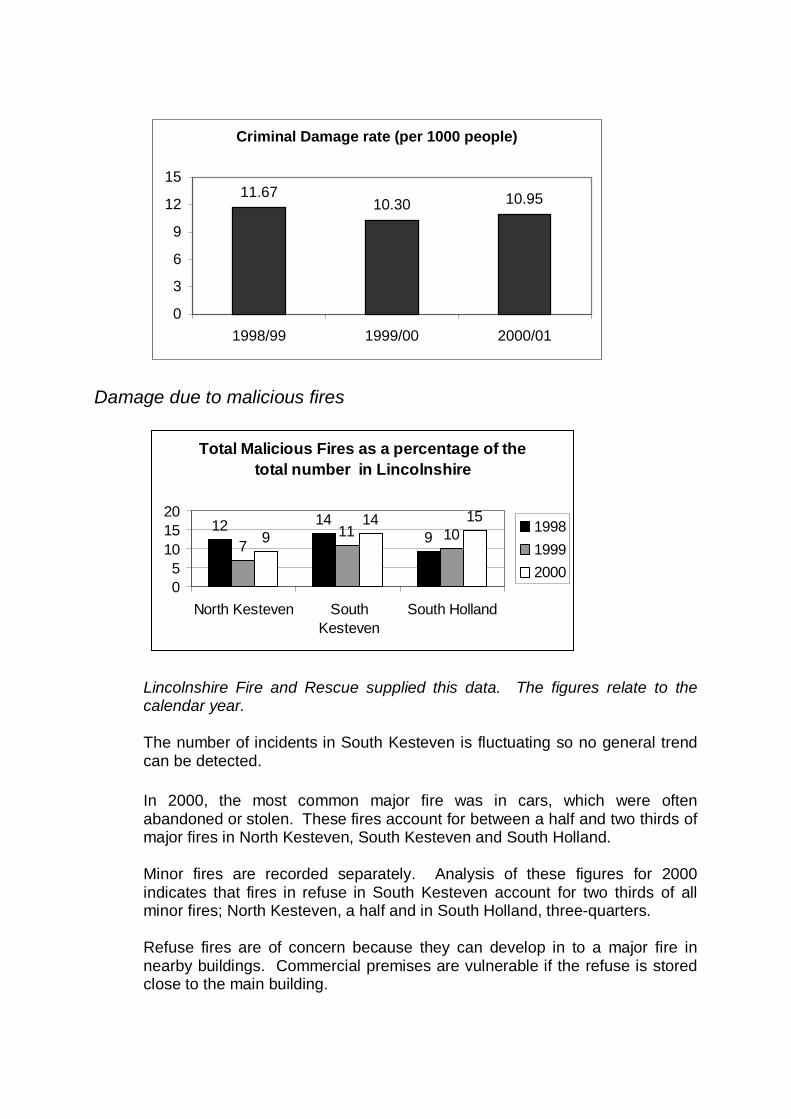
Damage due to malicious fires
Lincolnshire Fire and Rescue supplied this data. The figures relate to thecalendar year.
The number of incidents in South Kesteven is fluctuating so no general trendcan be detected.
In 2000, the most common major fire was in cars, which were oftenabandoned or stolen. These fires account for between a half and two thirds ofmajor fires in North Kesteven, South Kesteven and South Holland.
Minor fires are recorded separately. Analysis of these figures for 2000indicates that fires in refuse in South Kesteven account for two thirds of allminor fires; North Kesteven, a half and in South Holland, three-quarters.
Refuse fires are of concern because they can develop in to a major fire innearby buildings. Commercial premises are vulnerable if the refuse is storedclose to the main building.
Criminal Damage rate (per 1000 people)
11.6710.30 10.95
0
3
6
9
12
15
1998/99 1999/00 2000/01
Total Malicious Fires as a percentage of the total number in Lincolnshire
12 1497
11 10914 15
05
101520
North Kesteven SouthKesteven
South Holland
199819992000
11
In 2001, Lincolnshire Police and Lincolnshire Fire and Rescue established apartnership approach to address this problem under the banner of the ArsonTask Force.
4) Drugs
Substance misuse is a major issue in today’s society. There are the healthimpacts on users with the risk of death. There is also the associated crimesuch as burglary and shop lifting which is used to fund the purchase ofsubstances.
Action to address drug misuse is co-ordinated by the Lincolnshire Drug ActionTeam (DAT)3 and in October 2000, Addaction4 was commissioned as theprovider of counselling and referral for treatment services in Lincolnshire.
The Government has made money available to the Crime and DisorderPartnership to disrupt drug supply, tackle related crime and to strengthencommunities’ ability to resist drugs.
Statistics provided by Addaction show that more than a half of addicts whoseek help are abusing heroin. The next highest problem is alcohol abuse.
What these figures do not show is the level of cannabis abuse especiallyamong young people. Alcohol, tobacco and cannabis, some might say, arethe main gateway substances in to abuse of so-called ‘hard’ drugs such ascocaine and heroin.
The main focus of activity is on education and enforcement.
The drug problem affects all parts of society and is often the motivating factorto drive an individual to turn to crime to acquire money to buy drugs.Substance abuse is also a contributory cause to some road crashes. (Seesection on Road Safety starting on page 19 ).
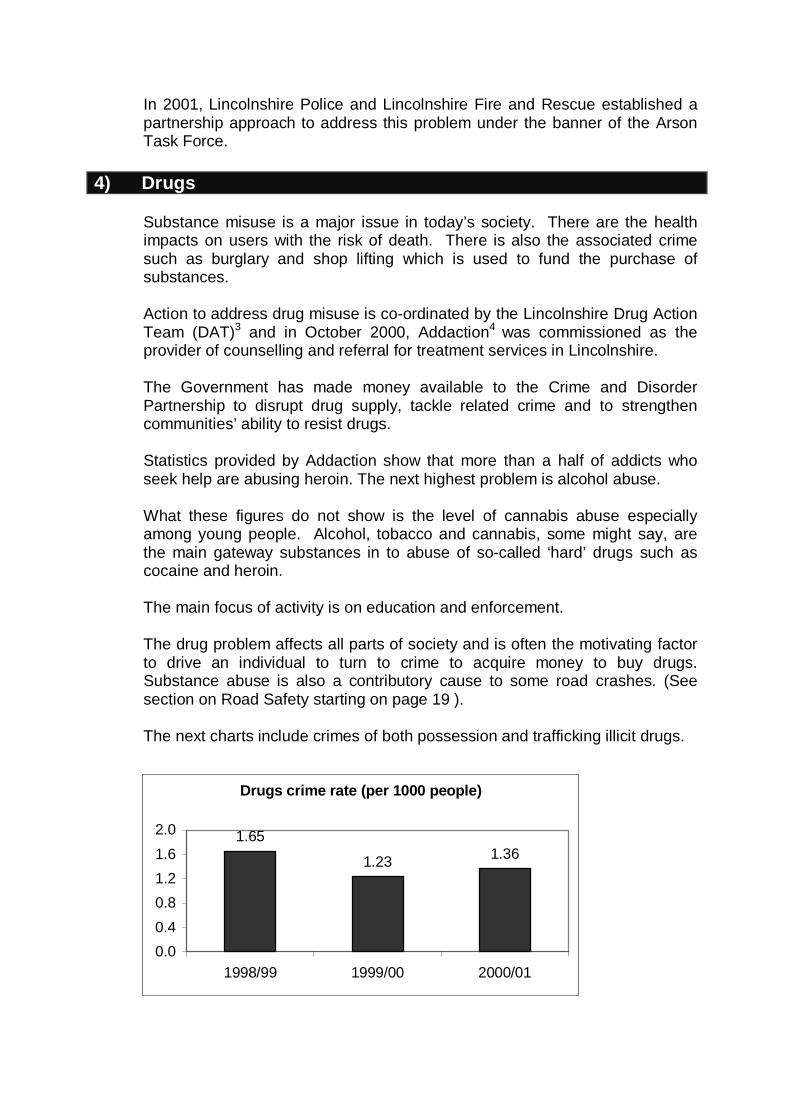
The next charts include crimes of both possession and trafficking illicit drugs.
Drugs crime rate (per 1000 people)
1.65
1.23 1.36
0.00.40.81.21.62.0
1998/99 1999/00 2000/01
12
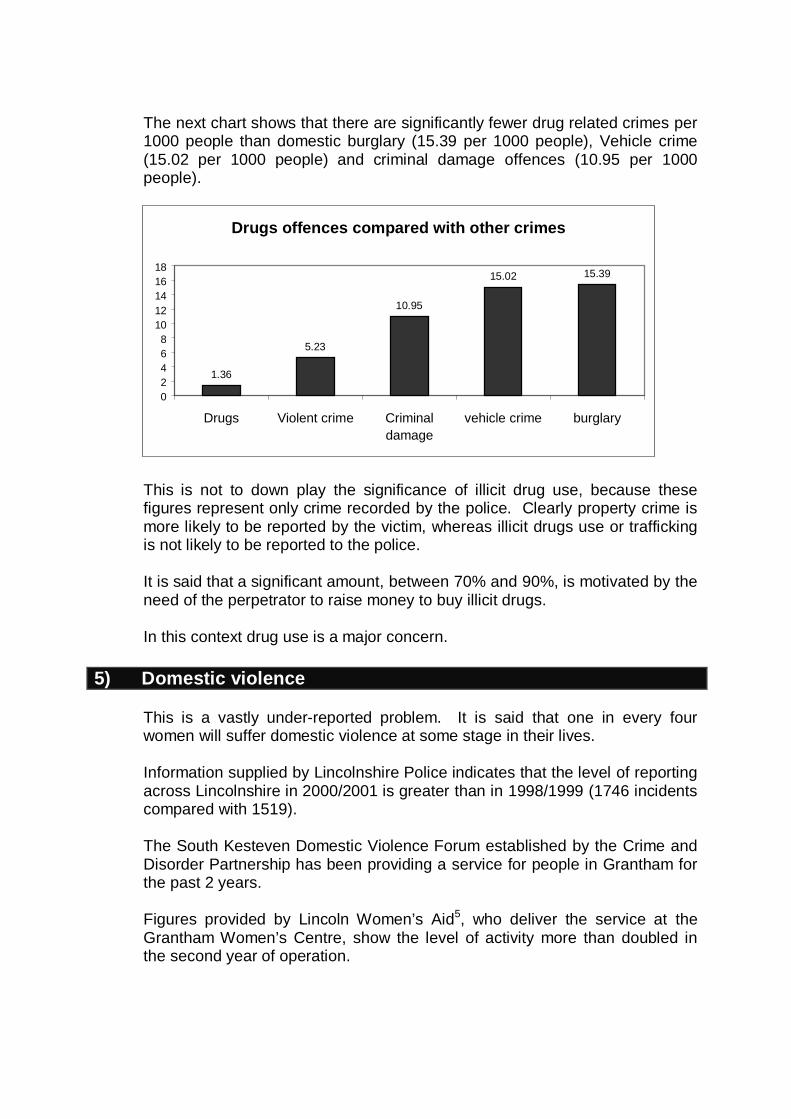
The next chart shows that there are significantly fewer drug related crimes per1000 people than domestic burglary (15.39 per 1000 people), Vehicle crime(15.02 per 1000 people) and criminal damage offences (10.95 per 1000people).
This is not to down play the significance of illicit drug use, because thesefigures represent only crime recorded by the police. Clearly property crime ismore likely to be reported by the victim, whereas illicit drugs use or traffickingis not likely to be reported to the police.
It is said that a significant amount, between 70% and 90%, is motivated by theneed of the perpetrator to raise money to buy illicit drugs.
In this context drug use is a major concern.
5) Domestic violence
This is a vastly under-reported problem. It is said that one in every fourwomen will suffer domestic violence at some stage in their lives.
Information supplied by Lincolnshire Police indicates that the level of reportingacross Lincolnshire in 2000/2001 is greater than in 1998/1999 (1746 incidentscompared with 1519).
The South Kesteven Domestic Violence Forum established by the Crime andDisorder Partnership has been providing a service for people in Grantham forthe past 2 years.
Figures provided by Lincoln Women’s Aid5, who deliver the service at theGrantham Women’s Centre, show the level of activity more than doubled inthe second year of operation.
Drugs offences compared with other crimes
1.36
5.23
10.95
15.02 15.39
02468
1012141618
Drugs Violent crime Criminaldamage
vehicle crime burglary

13
The increase is particularly reflected in the number of individual sessions forclients (up from 57 in 99/00 to 85 in 00/01) and the level of support to otheragencies (up from 47 to 121 over the two years).
This is partly explained by an extra half-day service at the New Beacon Centrefor part of that second year. But also, as the service became established andknown in the community and by other professionals, working with clients whoneeded support. This service is able to indirectly help victims by providingguidance and support to other agencies to which victims turn for help.
Even comparing this with the number of incidents recorded by the police andthe possibility that many incidents are not reported, it is likely that manyvictims are not seeking help, making it difficult to assess the true level of theproblem. It is therefore important to raise awareness about the availabledomestic violence services, particularly aiming at the rural areas, so thatpeople can access the resources available to help them.
THE PRINCIPAL AIMS AND OBJECTIVES OF THE PROJECT HAVE BEEN:-
• To provide confidential and independent advice, information, emotionalsupport and practical help to adults, and their children, experiencingdomestic violence in South Kesteven.
• To facilitate access to the multi-agency services available locally with theultimate aim of increasing the numbers of people able to get local accessto the help they need to free themselves from violence and abuse.
• To continue to provide and expand upon a domestic violence outreachproject (Grantham Women’s Centre), currently run 1½ days per week inGrantham, particularly extending the project to the rural areas of SouthKesteven.
PROVIDING OUTREACH SERVICES
The future aims are to maximise the service already provided in SouthKesteven by covering three distinct project areas:-
• Grantham Centre. Currently operating one and a half days per week froman office in central Grantham. Whilst this predominantly serves womenfrom Grantham, its services have been accessed by people from the widercommunity.
• The New Beacon Centre. This is a small shop converted into a communityinformation centre directly serving 14,000 people in the wards of Harrowby,St Annes and Belmont on the north-eastern edge of Grantham. Theservice was provided successfully here for 3 months.
• Rural Outreach. This would cover the rural south of the district andoperate one day per week from various secure venues.
14
Subject to funding, outreach services could be extended initially to twosouthern locations, on a weekly basis. They will offer the same range ofservices as the other two parts of the project.
The proposal for new outreach surgeries would provide a vital service tofamilies, living in the rural market towns and villages.
A new multi-agency client information system is being developed. A specialsub group of the Forum is examining a data collection model piloted in anotherauthority area with a view to introducing systems in South Kesteven during2002.
In future, more comprehensive data will be available to give a clearerindication as to the size of this problem.
A group of trained volunteers from the centre in Grantham has formed aSteering Group with the aim of establishing an affiliated South Kestevenwomen`s aid group. More volunteers are actively being sought to provideextra capacity and assist in building the services available whilst promotingawareness.
6) Disorder
The partnership has as one of its priorities “Quality of Life.” Disorder incidentsare most common in the town centres of Grantham and Stamford and impacton quality of life because it can cause people to restrict the times when theyare prepared to visit certain places such as the town centre.
Disorder incidents also occur in village communities and is still seen as apriority issue for many people in the district.
In itself disorder can take many different forms and degrees. The commonfactor with all types of disorder is the way it affects the lives of many peopleand at the same time reinforces the fear of crime.
The effects of disorder can also be felt in economic and social terms. It canaffect in-ward investment in the district as it can turn certain areas of townsand villages into ‘no go’ areas, when those areas acquire an oftenunwarranted reputation for disorder.
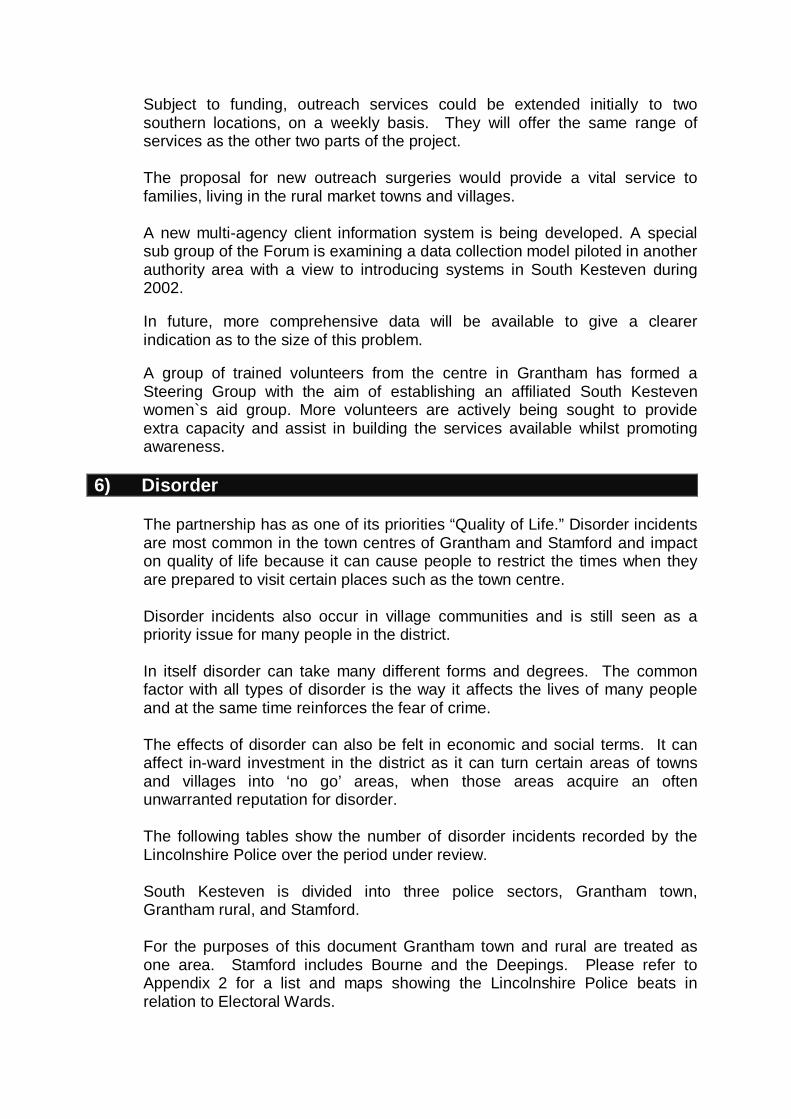
The following tables show the number of disorder incidents recorded by theLincolnshire Police over the period under review.
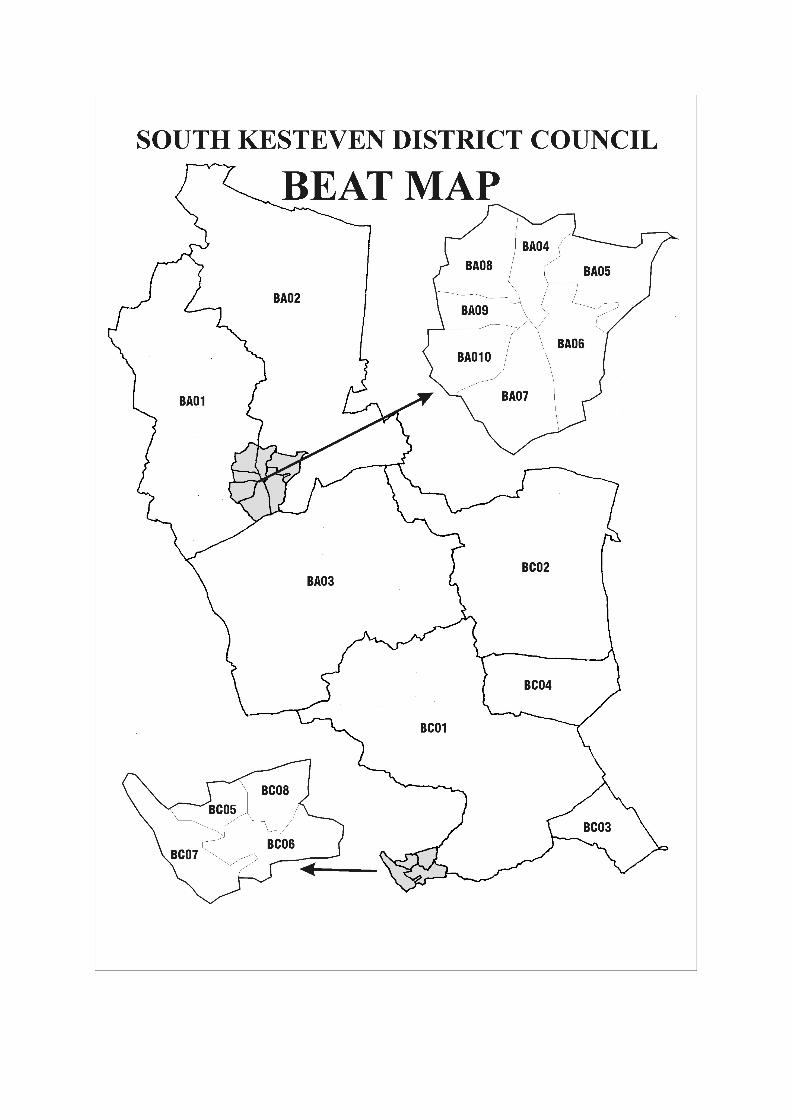
South Kesteven is divided into three police sectors, Grantham town,Grantham rural, and Stamford.
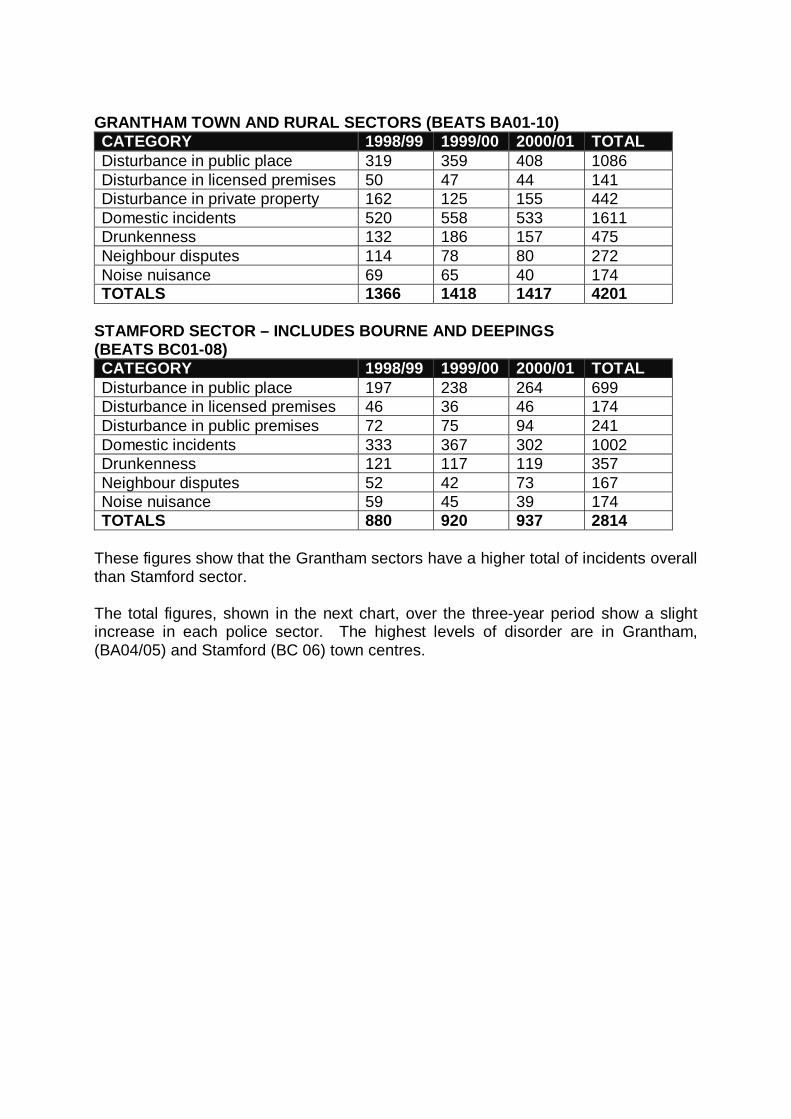
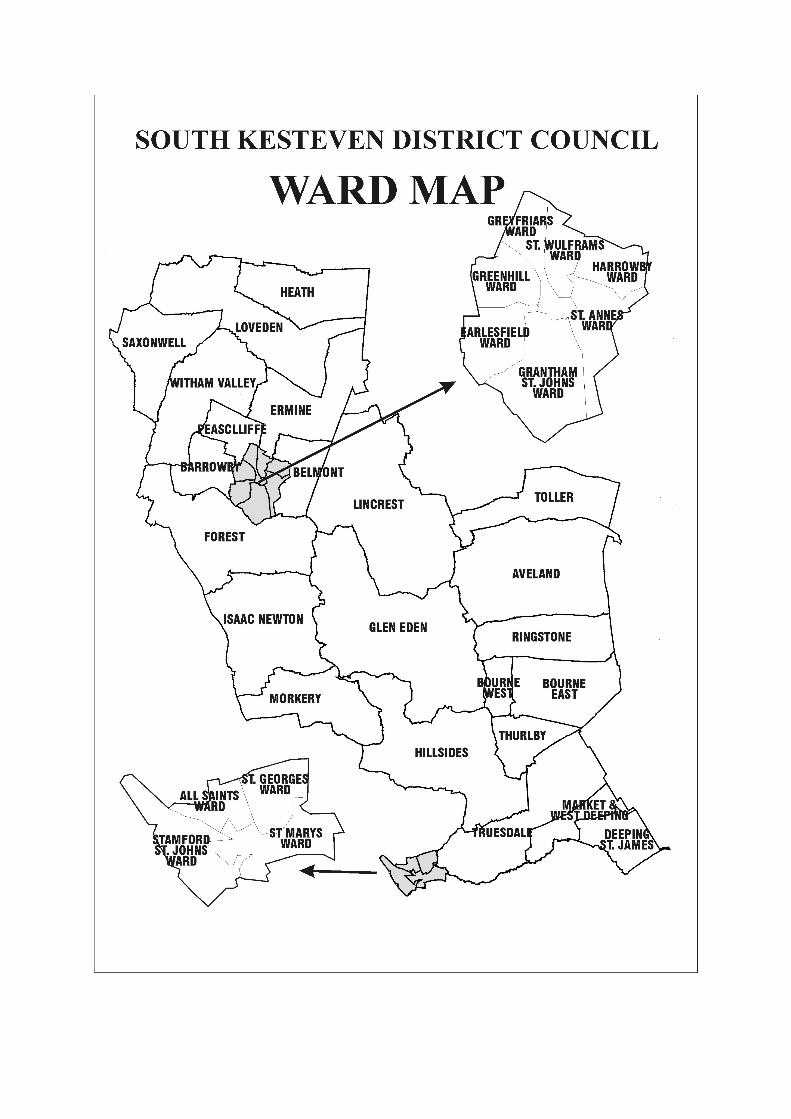
For the purposes of this document Grantham town and rural are treated asone area. Stamford includes Bourne and the Deepings. Please refer toAppendix 2 for a list and maps showing the Lincolnshire Police beats inrelation to Electoral Wards.
15
GRANTHAM TOWN AND RURAL SECTORS (BEATS BA01-10)CATEGORY 1998/99 1999/00 2000/01 TOTALDisturbance in public place 319 359 408 1086Disturbance in licensed premises 50 47 44 141Disturbance in private property 162 125 155 442Domestic incidents 520 558 533 1611Drunkenness 132 186 157 475Neighbour disputes 114 78 80 272Noise nuisance 69 65 40 174TOTALS 1366 1418 1417 4201
STAMFORD SECTOR – INCLUDES BOURNE AND DEEPINGS(BEATS BC01-08)CATEGORY 1998/99 1999/00 2000/01 TOTALDisturbance in public place 197 238 264 699Disturbance in licensed premises 46 36 46 174Disturbance in public premises 72 75 94 241Domestic incidents 333 367 302 1002Drunkenness 121 117 119 357Neighbour disputes 52 42 73 167Noise nuisance 59 45 39 174TOTALS 880 920 937 2814
These figures show that the Grantham sectors have a higher total of incidents overallthan Stamford sector.
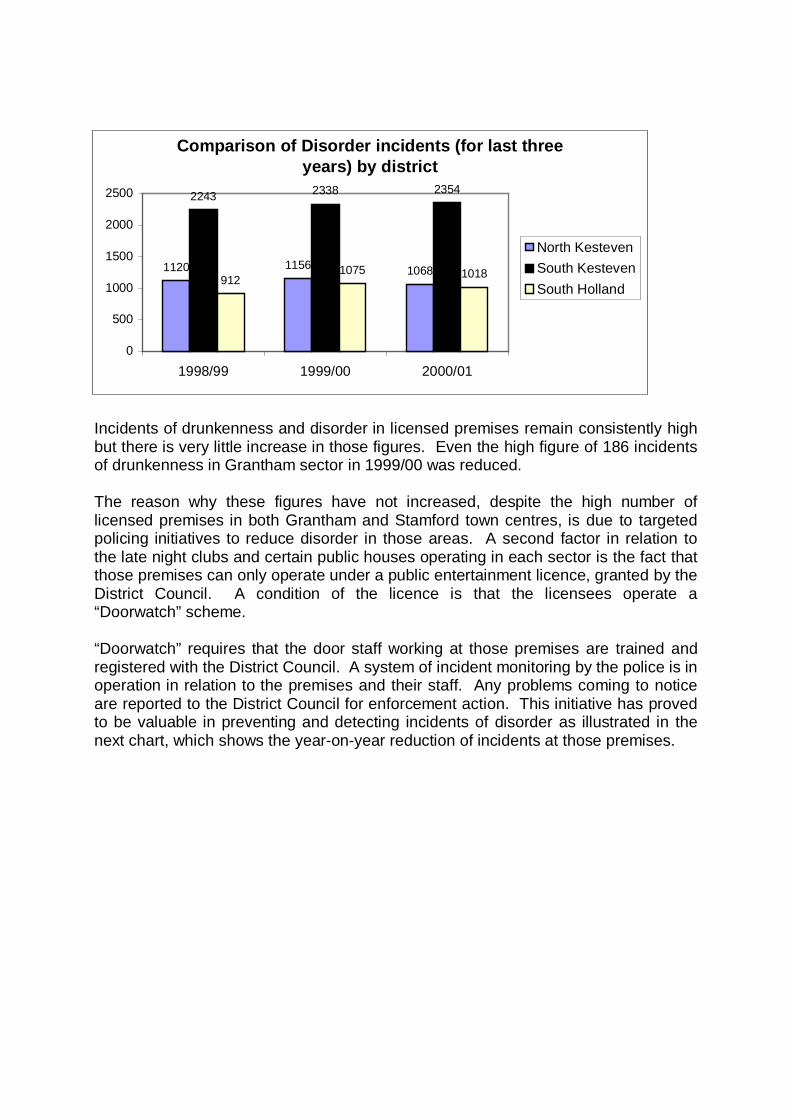
The total figures, shown in the next chart, over the three-year period show a slightincrease in each police sector. The highest levels of disorder are in Grantham,(BA04/05) and Stamford (BC 06) town centres.
16
Incidents of drunkenness and disorder in licensed premises remain consistently highbut there is very little increase in those figures. Even the high figure of 186 incidentsof drunkenness in Grantham sector in 1999/00 was reduced.
The reason why these figures have not increased, despite the high number oflicensed premises in both Grantham and Stamford town centres, is due to targetedpolicing initiatives to reduce disorder in those areas. A second factor in relation tothe late night clubs and certain public houses operating in each sector is the fact thatthose premises can only operate under a public entertainment licence, granted by theDistrict Council. A condition of the licence is that the licensees operate a“Doorwatch” scheme.
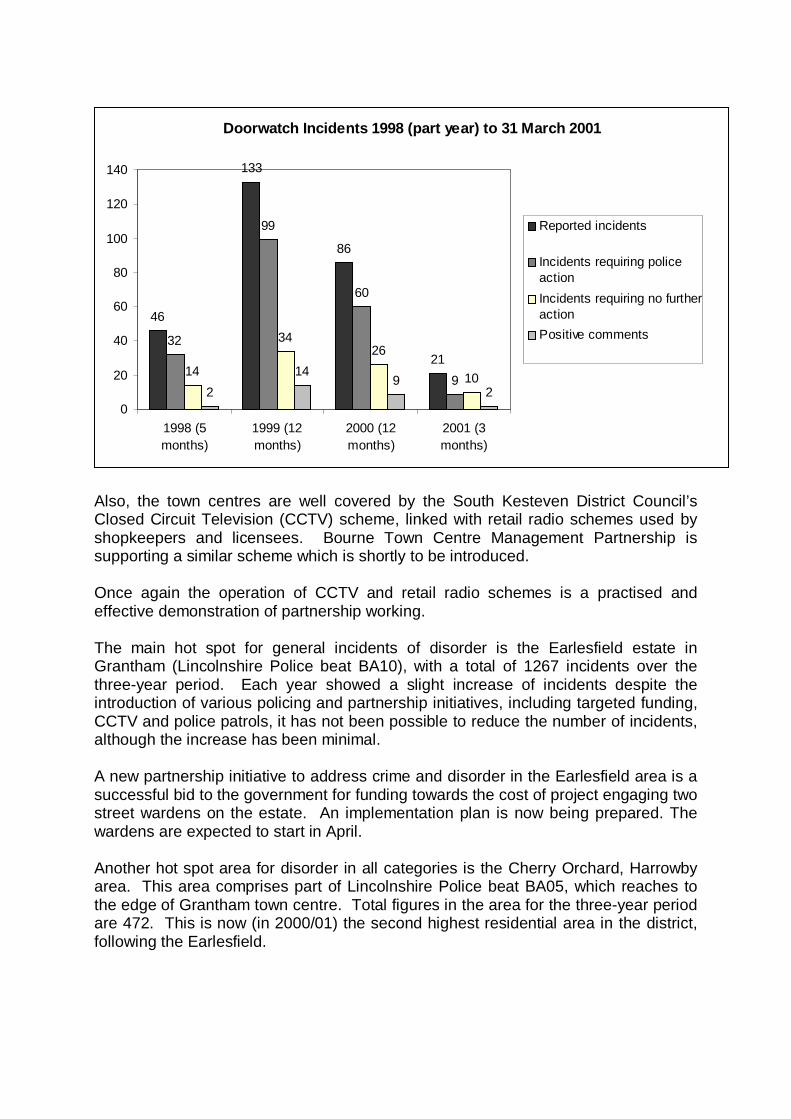
“Doorwatch” requires that the door staff working at those premises are trained andregistered with the District Council. A system of incident monitoring by the police is inoperation in relation to the premises and their staff. Any problems coming to noticeare reported to the District Council for enforcement action. This initiative has provedto be valuable in preventing and detecting incidents of disorder as illustrated in thenext chart, which shows the year-on-year reduction of incidents at those premises.
Comparison of Disorder incidents (for last three years) by district
1120 1156 1068
2243 2338 2354
9121075 1018
0
500
1000
1500
2000
2500
1998/99 1999/00 2000/01
North KestevenSouth KestevenSouth Holland
17
Also, the town centres are well covered by the South Kesteven District Council’sClosed Circuit Television (CCTV) scheme, linked with retail radio schemes used byshopkeepers and licensees. Bourne Town Centre Management Partnership issupporting a similar scheme which is shortly to be introduced.
Once again the operation of CCTV and retail radio schemes is a practised andeffective demonstration of partnership working.
The main hot spot for general incidents of disorder is the Earlesfield estate inGrantham (Lincolnshire Police beat BA10), with a total of 1267 incidents over thethree-year period. Each year showed a slight increase of incidents despite theintroduction of various policing and partnership initiatives, including targeted funding,CCTV and police patrols, it has not been possible to reduce the number of incidents,although the increase has been minimal.
A new partnership initiative to address crime and disorder in the Earlesfield area is asuccessful bid to the government for funding towards the cost of project engaging twostreet wardens on the estate. An implementation plan is now being prepared. Thewardens are expected to start in April.
Another hot spot area for disorder in all categories is the Cherry Orchard, Harrowbyarea. This area comprises part of Lincolnshire Police beat BA05, which reaches tothe edge of Grantham town centre. Total figures in the area for the three-year periodare 472. This is now (in 2000/01) the second highest residential area in the district,following the Earlesfield.
Doorwatch Incidents 1998 (part year) to 31 March 2001
46
133
86
2132
99
60
914
3426
102
149
20
20
40
60
80
100
120
140
1998 (5months)
1999 (12months)
2000 (12months)
2001 (3months)
Reported incidents
Incidents requiring policeactionIncidents requiring no furtheractionPositive comments
18
Steps taken to address problems include the opening of a resource centre by theDistrict Council, the appointment of a police resident beat officer and the support of astrong community group.
Other parts of Grantham town have higher total incidents of disorder than CherryOrchard/Harrowby, but this is likely to be due to the high number of licensedpremises and fast food outlets operating late at night and at weekends.
A report by Lincolnshire County Council, entitled the Condition of Lincolnshire 2000reflected these findings, showing Grantham town Wards of St. John’s and St. Anne’sand Stamford St. Mary’s were among the top 20 Wards recording the highest levelsof disorder incidents in 1998/99 (Lincolnshire County Council 2000).
On a positive note the Grantham rural areas, Lincolnshire Police beats BA01, BA02(including Great Gonerby) and BA03 have a generally very low rate of disorder, forsuch a large area, with a total of 667 incidents over the same period.
The concerns over disorder are not confined to Grantham area alone. The othercentres of population equally have problems proportionate to their size.
Figures for the three-year period show rural areas around Bourne, Lincolnshire Policebeats BC01 and BC02, have experienced 388 incidents of disorder. Bourne townitself, Lincolnshire Police beat BC04, had 470 incidents. The Deepings suffered atotal of 586 incidents, although the population of the Deepings is higher.
There are concerns about the situation in Stamford town centre. The LincolnshirePolice beats BC05 and 06 cover the town centre. There have been between 4-5nightclubs operating during the past three years. There are also several publichouses, some operating extended hours and a number of late night fast food outlets.
During the period under review there has been a total of 1184 incidents involvingpublic disorder, disorder in licensed premises or drunkenness. Steps have beentaken to address the problem. These involved a partnership approach between theLincolnshire Police, South Kesteven District Council, local Ministry of Defence basesand the licensees. It is hoped that the benefits of that partnership will come to fruitionin coming months.
Lincolnshire County Council, Trading Standards department has started to introducea "Proof of Age” scheme to contribute to reducing disorder by young people who maybe buying alcohol under-age. Also the South Kesteven District Council is developingthe introduction of more youth facilities and with Lincolnshire Police is pursuing amore proactive licensing enforcement policy respectively.
19
7) Road Safety
The South Kesteven Crime and Disorder Partnership works closely with theLincolnshire Road Safety Partnership6 (LRSP) and joint initiatives, such asyoung driver training, have been promoted in the district.
A recent development has been that the Master Driver at Prince William ofGloucester Barracks, a Royal Logistics Corps driver training centre, hasagreed to lead the road safety priority implementation project group, whichhas been formed by South Kesteven Crime and Disorder Partnership. Itincludes representatives from the police, army and fire and rescue service.This group is believed to be unique in the composition of its membership.
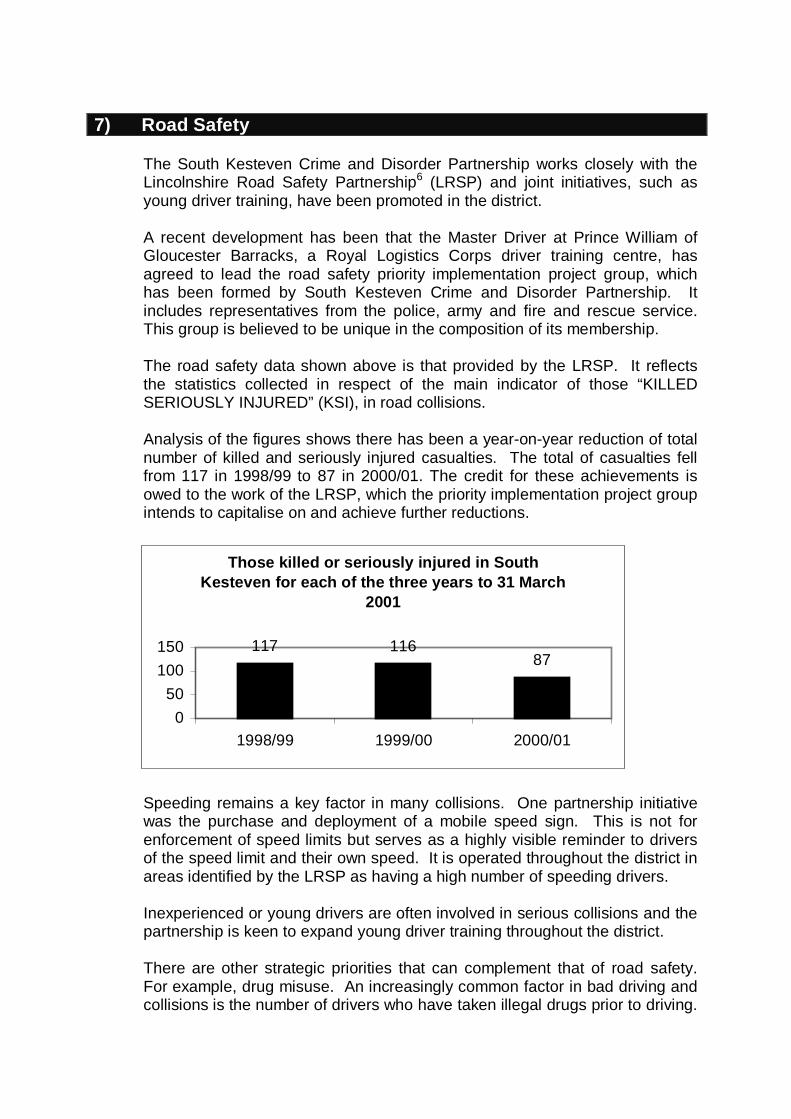
The road safety data shown above is that provided by the LRSP. It reflectsthe statistics collected in respect of the main indicator of those “KILLEDSERIOUSLY INJURED” (KSI), in road collisions.
Analysis of the figures shows there has been a year-on-year reduction of totalnumber of killed and seriously injured casualties. The total of casualties fellfrom 117 in 1998/99 to 87 in 2000/01. The credit for these achievements isowed to the work of the LRSP, which the priority implementation project groupintends to capitalise on and achieve further reductions.
Speeding remains a key factor in many collisions. One partnership initiativewas the purchase and deployment of a mobile speed sign. This is not forenforcement of speed limits but serves as a highly visible reminder to driversof the speed limit and their own speed. It is operated throughout the district inareas identified by the LRSP as having a high number of speeding drivers.
Inexperienced or young drivers are often involved in serious collisions and thepartnership is keen to expand young driver training throughout the district.
There are other strategic priorities that can complement that of road safety.For example, drug misuse. An increasingly common factor in bad driving andcollisions is the number of drivers who have taken illegal drugs prior to driving.
Those killed or seriously injured in South Kesteven for each of the three years to 31 March
2001
117 11687
050
100150
1998/99 1999/00 2000/01
20
Although this is clearly an enforcement issue for the police, there is also theeducation aspect which the substance misuse priority implementation projectgroup can consider.
Additionally there is the issue of vehicle related crime, which is on theincrease and a major ‘fear of crime’ factor.
Previously vehicle crime has been included in the road safety priority. Thelevel of that type of offence and the community concern may well merit itbecoming a separate priority for the partnership. Vehicle crime is currently apriority nationally for the government.
Although the public perception survey did not identify road safety as a majorconcern, a high number of respondents felt the Lincolnshire County Councilshould increase spending on road safety. It was also felt the LincolnshirePolice should be more active in the enforcement of road traffic law as a meansof improving road safety.
This belief was reflected by the focus groups that were held as part of theaudit.
8) Cost of crime
The cost of crime in South Kesteven has been calculated using Home Officesupplied data and formulae applied to the number of crimes recorded by theLincolnshire Police. The cost of crime is likely to be under-estimated owing tothe fact, confirmed by the British Crime Survey data and the audit informationgathered by the questionnaire responses, that some victims of crime do notreport them to the police.
The figures given are for year 2000/01 and are for the whole district.
Note: The data set used in this section is different from that used to constructthe charts in sections 3 and 15 and has therefore produced some minordiscrepancies between totals of specific crimes. These differences are small,but these figures are estimates and should not be regarded as absolute totals.They do show us how different crimes have different impacts comparingoverall volume (or total recorded incidents) with the relative financial impact.
The formula used includes all likely costs to the victim and society in general.For example the financial loss to the victim, the cost to the health service incases of assault, police investigation costs and they also include elements forthe cost to the criminal justice system. The same formula has been applied toeach district in Lincolnshire. They do not include the full emotional cost to thevictim.
21
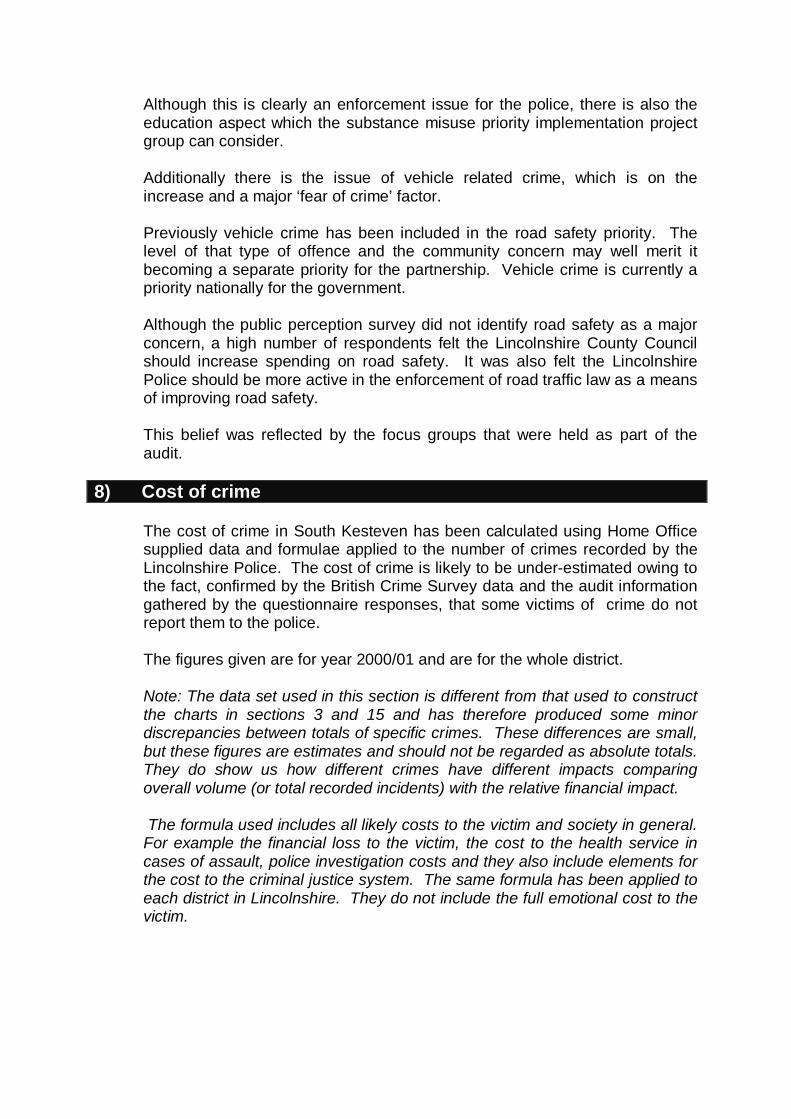
CRIME BY VOLUME – SOUTH KESTEVEN
CRIME TOTALS AVERAGE COST TOTAL COSTOther Vehicle Crime 1987 430 854410Other Theft 1506 340 512040Criminal Damage 892 510 454920Burglary Dwelling 744 2300 1711200Shop Theft 567 100 56700Theft of Vehicle 365 4800 175200Wounding 310 18000 5580000Common Assault 200 540 108000Sexual Assault 45 540 855000Personal Robbery 21 4700 98700CommercialRobbery
5 5000 25000
6642 1807.88 12007970
Crime By Volume
Other Vehicle Crime30%
Other Theft23%
Criminal Damage13%
Burglary Dwelling11%
Shop Theft9%
Theft of Vehicle5%
Common Assault3%
Wounding5%
Commercial Robbery0%
Personal Robbery0%
Sexual Assault1%
22
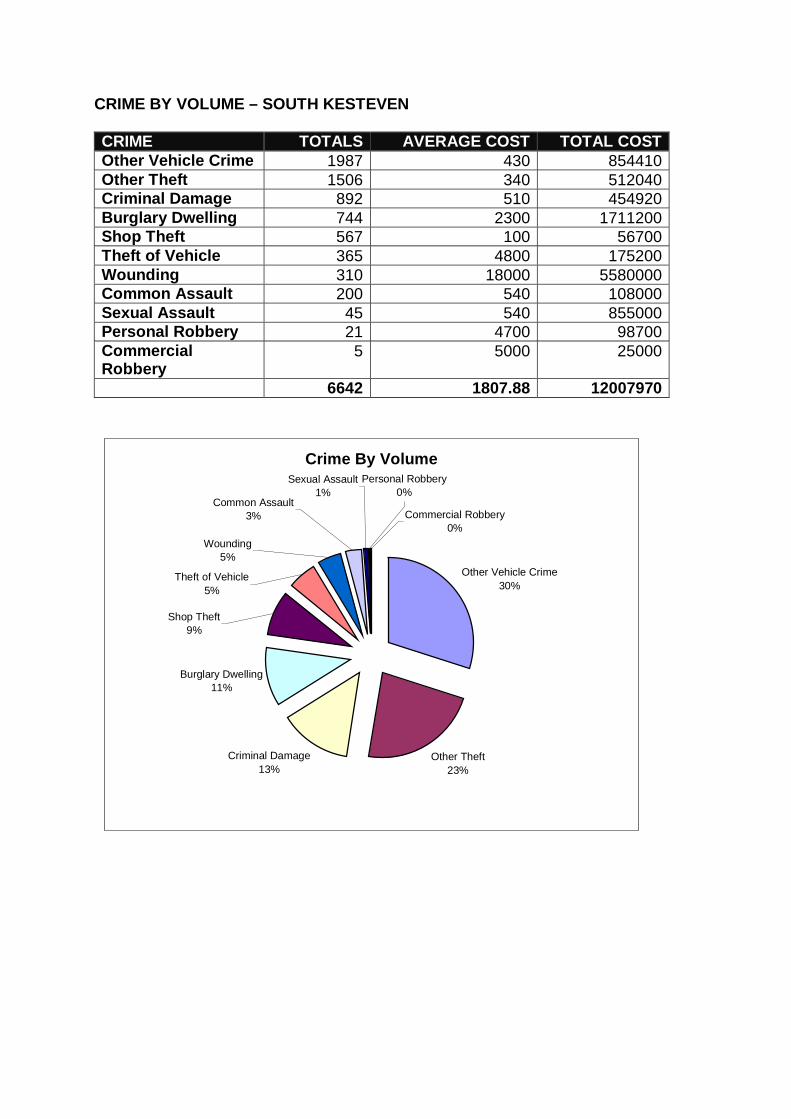
CRIME BY COST – SOUTH KESTEVEN
CRIME TOTALS AVERAGE COST TOTAL COSTWounding 310 18000 5580000Theft of Vehicle 365 4800 175200Burglary Dwelling 744 2300 1711200Sexual Assault 45 19000 855000Other Vehicle Crime 1987 430 854410Other Theft 1506 340 512040Criminal Damage 892 510 454920Common Assault 200 540 108000Personal Robbery 21 4700 98700Shop Theft 567 100 56700CommercialRobbery
5 5000 25000
6642 1807.88 12007970
Crime By Cost
Wounding47%
Theft of Vehicle15%
Burglary Dwelling14%
Sexual Assault7%
Other Vehicle Crime7%
Criminal Damage4%
Other Theft4%
Commercial Robbery0%
Shop Theft0%
Personal Robbery1%Common Assault
1%
23
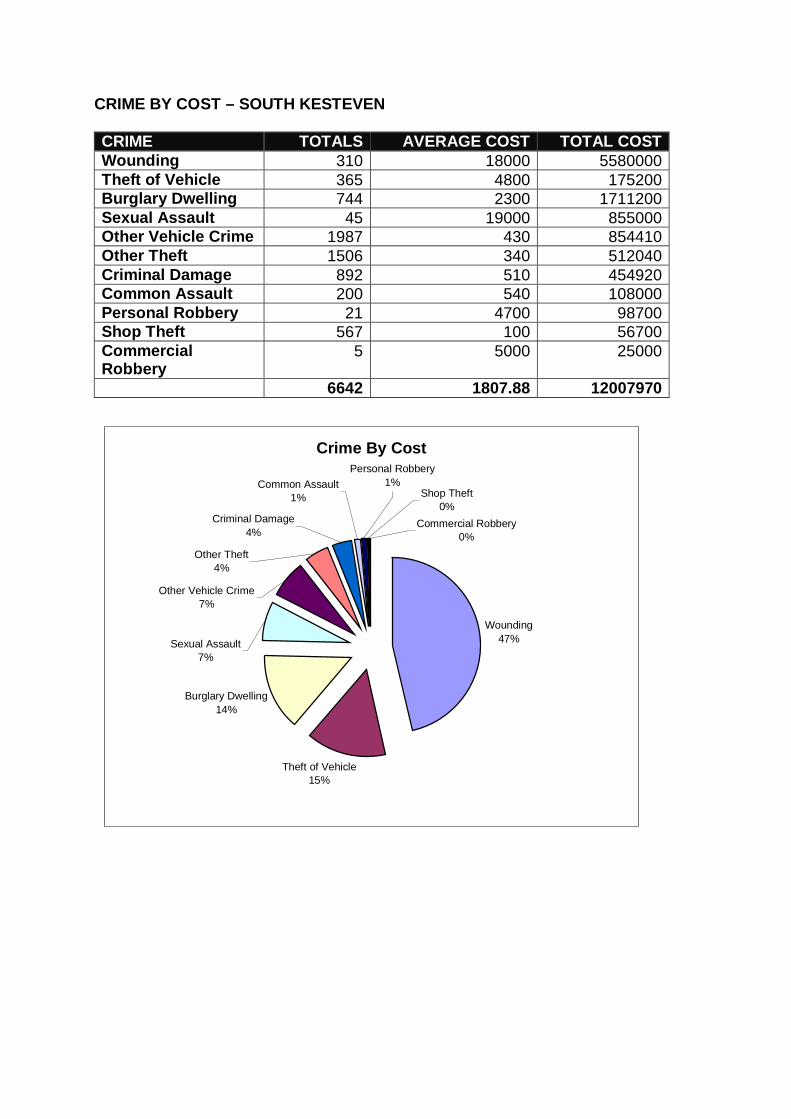
The following table gives a more precise picture of the cost of crime by sector,Stamford (including Bourne and the Deepings) and Grantham town and rural sectors.
CRIME STAMFORD GRANTHAMRURAL
GRANTHAMURBAN TOTALS AVERAGE
COST £TOTAL COST £
Wounding 14 3 17Other Wounding 101 34 140RA Wounding 0 0 1TOTAL WOUNDING 115 37 158 310 18000 5580000Common Assault 100 17 83 200 540 108000Sexual Assault 19 4 22 45 19000 855000Personal Robbery 2 0 19 21 4700 98700Business Robbery 0 1 4 5 5000 25000Burglary Dwelling 198 103 443 744 2300 1711200Theft of Motor Vehicle 151 63 142Aggrevated VehicleTaking 5 1 3TOTAL THEFTOFMOTOR VEHICLE 156 64 145 365 4800 1752000From Motor Vehicle 317 233 701Vehicle Interference 94 28 138Criminal Damage toMotor Vehicle 189 60 227TOTAL OTHER MOTORVEHICLE 600 321 1066 1987 430 854410From person 9 1 19Dwelling 13 8 54Employee 9 2 13Mail 1 0 0Electricity 0 0 0Cycles 139 12 177Meters 1 0 2Other 435 221 390TOTAL OTHER THEFT 607 244 655 1506 340 512040Shop Theft 138 8 421 567 100 56700Criminal Damage (lessMotor Vehicle) 324 134 434 892 510 454920
6642 12007970
Analysis of the costs shows that the highest volume crime is that of other vehiclecrime. Although the average cost per crime is relatively low at £430 the total cost is£854,410. Despite the cost factor, the results of the public perception survey (seesection 10 below) show this is regarded as a crime with a high concern factor to thecommunity. Thefts of vehicles, during the year between April 2000 and March 2001,cost a total of £1,752,000 at an average cost of £4,800 per crime.
The most expensive crime is that of sexual assault, at £19,000 per crime.Fortunately the incidence is low, but the total cost, £855,000 is higher than othervehicle crime.
The crime with a high incidence, second to vehicle crime, and high average cost percrime, is assault/wounding: 310 crimes at an average cost of £18,000 adds up to£558,000 in the year. The high cost of those crimes reflects the cost of healthservice treatment to the victim. Often these crimes are drink related and thepartnership has initiatives in hand to address those crimes (see Disorder, section 6above).
24
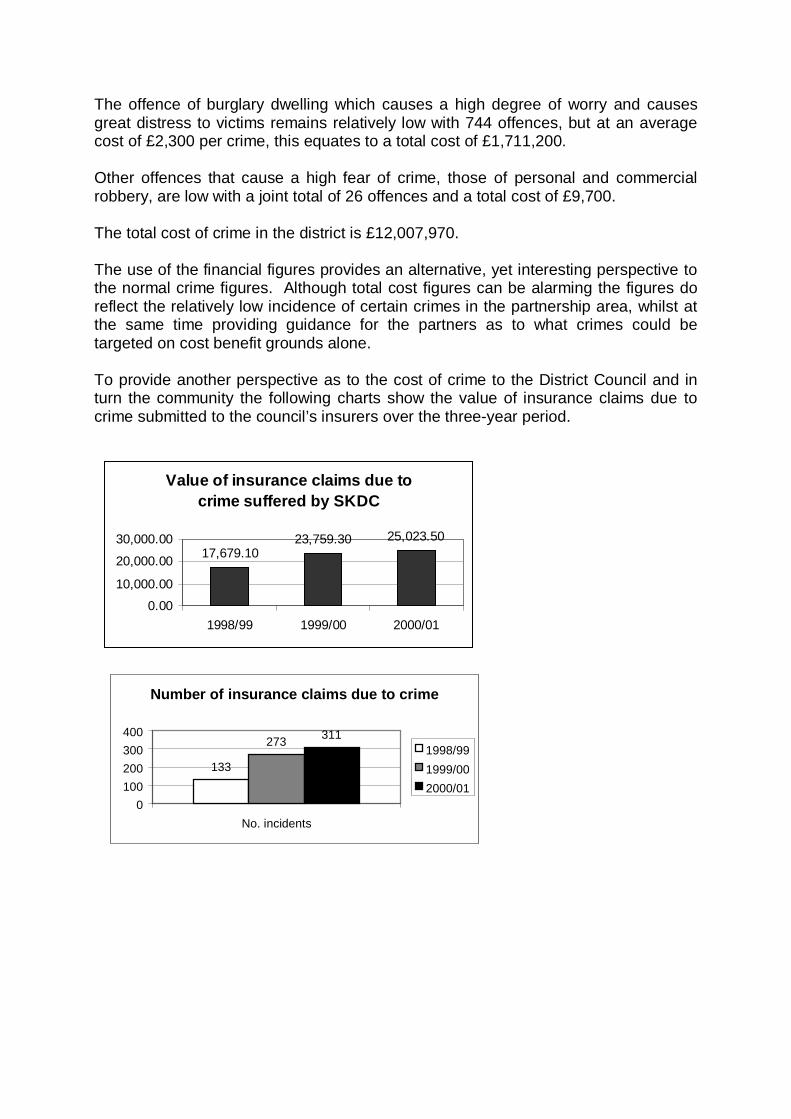
The offence of burglary dwelling which causes a high degree of worry and causesgreat distress to victims remains relatively low with 744 offences, but at an averagecost of £2,300 per crime, this equates to a total cost of £1,711,200.
Other offences that cause a high fear of crime, those of personal and commercialrobbery, are low with a joint total of 26 offences and a total cost of £9,700.
The total cost of crime in the district is £12,007,970.
The use of the financial figures provides an alternative, yet interesting perspective tothe normal crime figures. Although total cost figures can be alarming the figures doreflect the relatively low incidence of certain crimes in the partnership area, whilst atthe same time providing guidance for the partners as to what crimes could betargeted on cost benefit grounds alone.
To provide another perspective as to the cost of crime to the District Council and inturn the community the following charts show the value of insurance claims due tocrime submitted to the council’s insurers over the three-year period.
Value of insurance claims due to crime suffered by SKDC
17,679.1023,759.30 25,023.50
0.0010,000.00
20,000.0030,000.00
1998/99 1999/00 2000/01
Number of insurance claims due to crime
133
273 311
0100200300400
No. incidents
1998/991999/002000/01
25
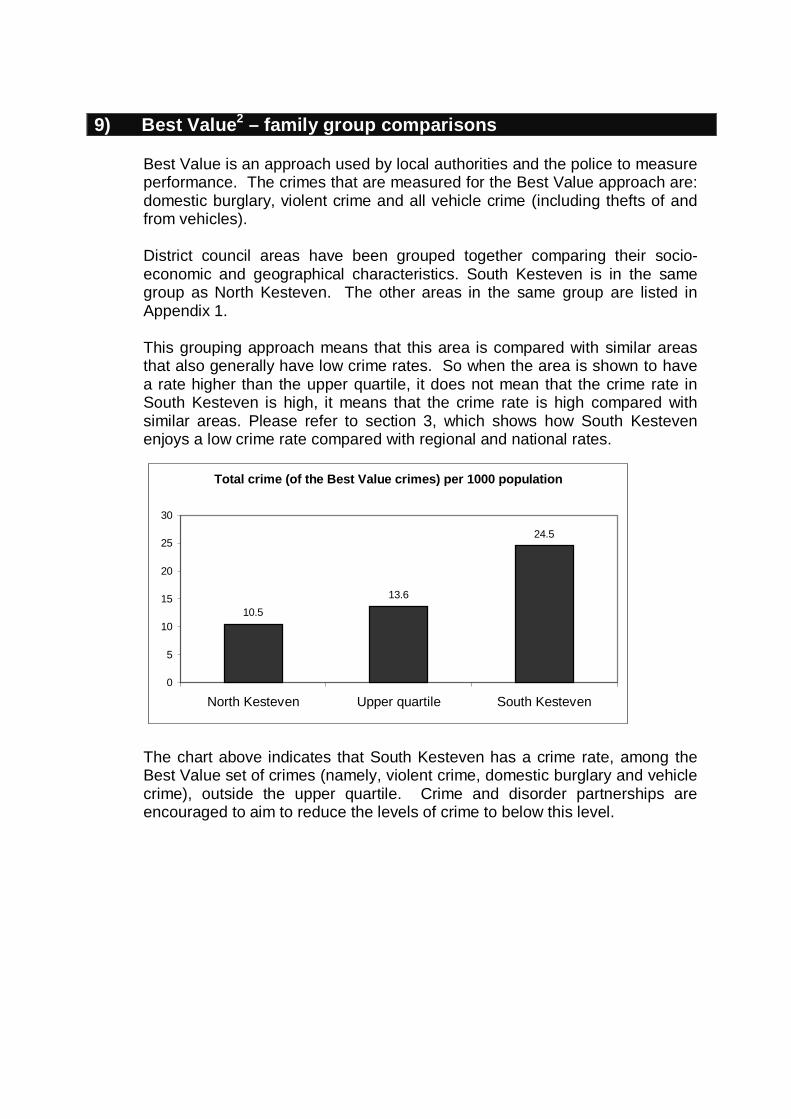
9) Best Value2 – family group comparisons
Best Value is an approach used by local authorities and the police to measureperformance. The crimes that are measured for the Best Value approach are:domestic burglary, violent crime and all vehicle crime (including thefts of andfrom vehicles).
District council areas have been grouped together comparing their socio-economic and geographical characteristics. South Kesteven is in the samegroup as North Kesteven. The other areas in the same group are listed inAppendix 1.
This grouping approach means that this area is compared with similar areasthat also generally have low crime rates. So when the area is shown to havea rate higher than the upper quartile, it does not mean that the crime rate inSouth Kesteven is high, it means that the crime rate is high compared withsimilar areas. Please refer to section 3, which shows how South Kestevenenjoys a low crime rate compared with regional and national rates.
The chart above indicates that South Kesteven has a crime rate, among theBest Value set of crimes (namely, violent crime, domestic burglary and vehiclecrime), outside the upper quartile. Crime and disorder partnerships areencouraged to aim to reduce the levels of crime to below this level.
Total crime (of the Best Value crimes) per 1000 population
10.513.6
24.5
0
5
10
15
20
25
30
North Kesteven Upper quartile South Kesteven
26
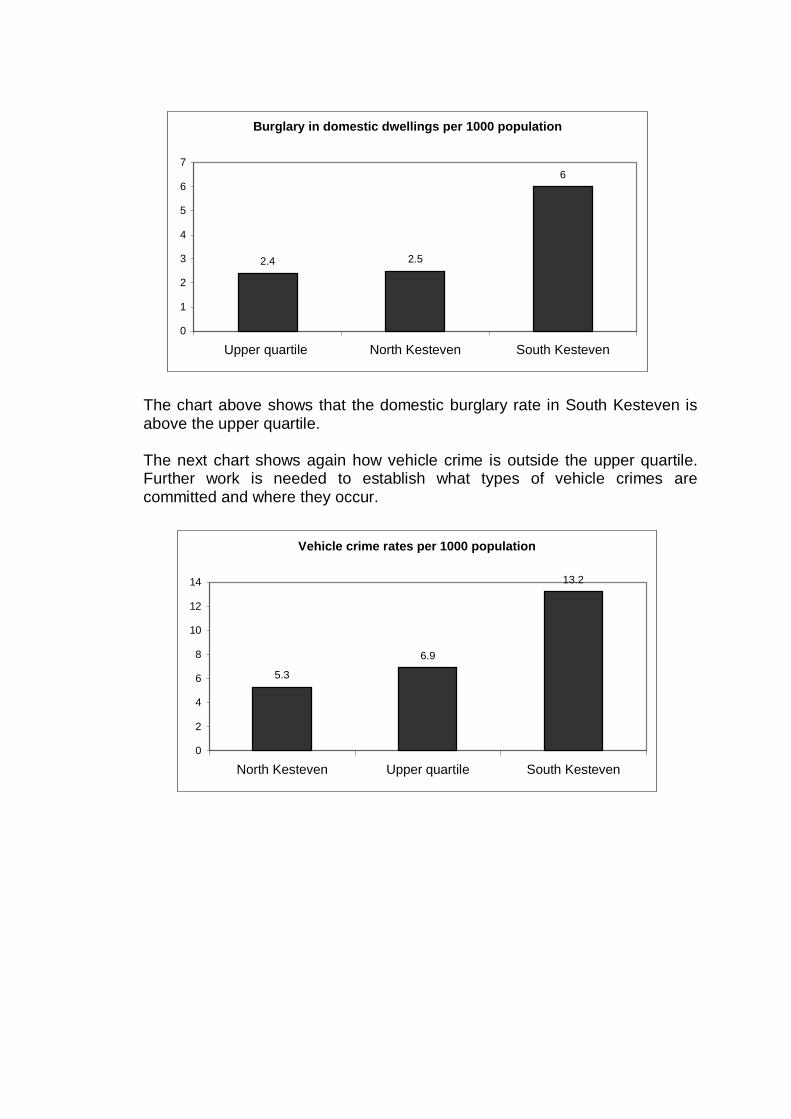
The chart above shows that the domestic burglary rate in South Kesteven isabove the upper quartile.
The next chart shows again how vehicle crime is outside the upper quartile.Further work is needed to establish what types of vehicle crimes arecommitted and where they occur.
Burglary in domestic dwellings per 1000 population
2.4 2.5
6
0
1
2
3
4
5
6
7
Upper quartile North Kesteven South Kesteven
Vehicle crime rates per 1000 population
5.3
6.9
13.2
0
2
4
6
8
10
12
14
North Kesteven Upper quartile South Kesteven
27
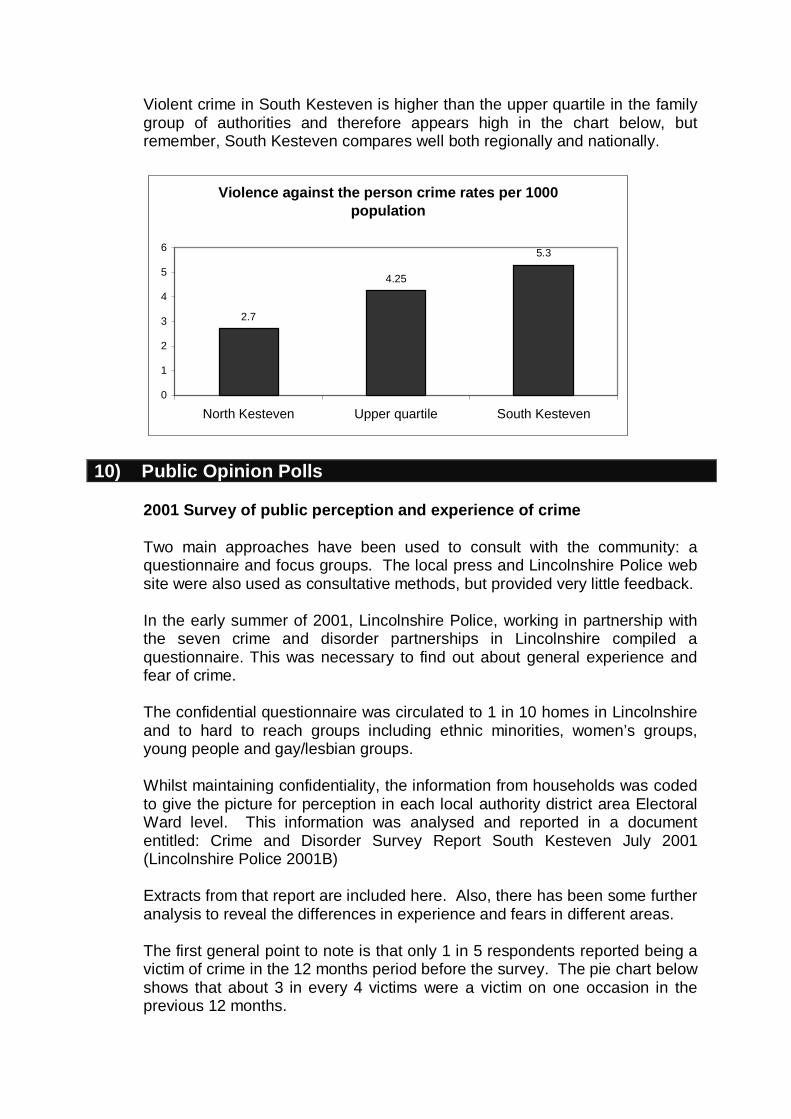
Violent crime in South Kesteven is higher than the upper quartile in the familygroup of authorities and therefore appears high in the chart below, butremember, South Kesteven compares well both regionally and nationally.
10) Public Opinion Polls
2001 Survey of public perception and experience of crime
Two main approaches have been used to consult with the community: aquestionnaire and focus groups. The local press and Lincolnshire Police website were also used as consultative methods, but provided very little feedback.
In the early summer of 2001, Lincolnshire Police, working in partnership withthe seven crime and disorder partnerships in Lincolnshire compiled aquestionnaire. This was necessary to find out about general experience andfear of crime.
The confidential questionnaire was circulated to 1 in 10 homes in Lincolnshireand to hard to reach groups including ethnic minorities, women’s groups,young people and gay/lesbian groups.
Whilst maintaining confidentiality, the information from households was codedto give the picture for perception in each local authority district area ElectoralWard level. This information was analysed and reported in a documententitled: Crime and Disorder Survey Report South Kesteven July 2001(Lincolnshire Police 2001B)
Extracts from that report are included here. Also, there has been some furtheranalysis to reveal the differences in experience and fears in different areas.
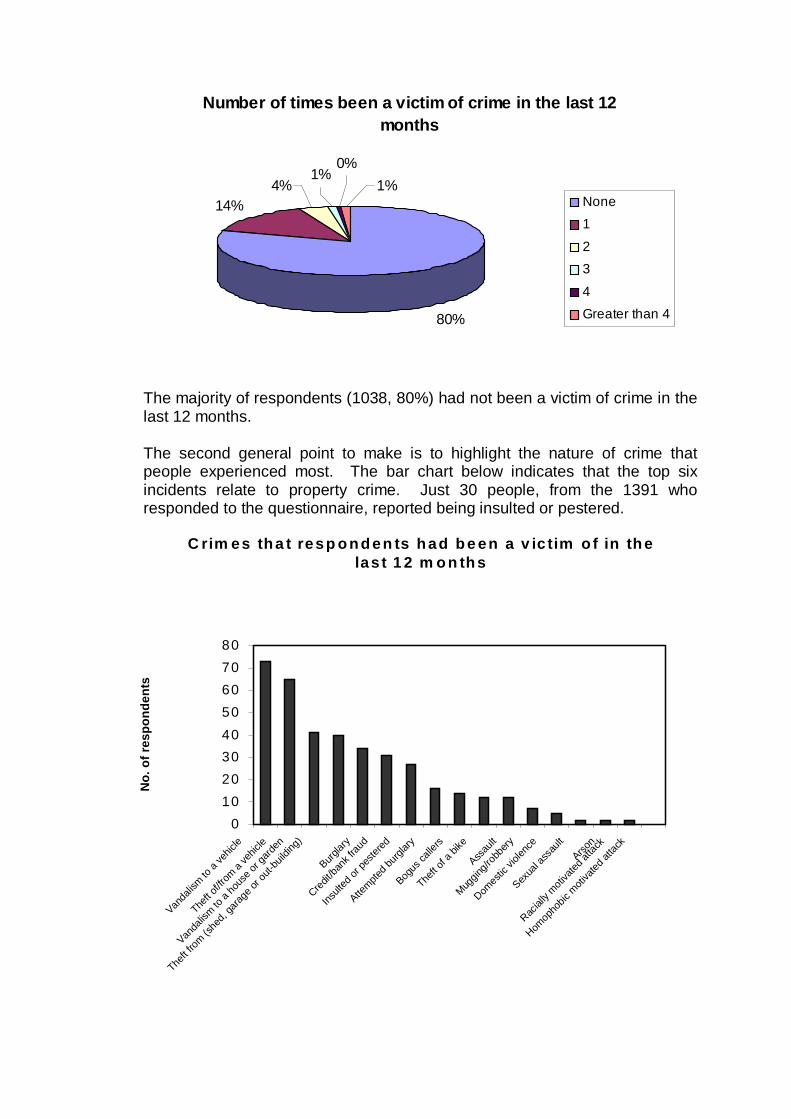
The first general point to note is that only 1 in 5 respondents reported being avictim of crime in the 12 months period before the survey. The pie chart belowshows that about 3 in every 4 victims were a victim on one occasion in theprevious 12 months.
Violence against the person crime rates per 1000 population
2.7
4.25
5.3
0
1
2
3
4
5
6
North Kesteven Upper quartile South Kesteven
28
The majority of respondents (1038, 80%) had not been a victim of crime in thelast 12 months.
The second general point to make is to highlight the nature of crime thatpeople experienced most. The bar chart below indicates that the top sixincidents relate to property crime. Just 30 people, from the 1391 whoresponded to the questionnaire, reported being insulted or pestered.
C rim es th a t resp o n d en ts h ad b e en a v ic tim o f in th e las t 1 2 m o n th s
01020304050607080
Vanda
lism to
a ve
hicle
Theft o
f/from
a ve
hicle
Vanda
lism to
a ho
use o
r gard
en
Theft f
rom (s
hed,
garag
e or o
ut-bu
ilding
)
Burglar
y
Credit/b
ank f
raud
Insult
ed or
peste
red
Attempte
d burg
lary
Bogus
calle
rs
Theft o
f a bi
ke
Assau
lt
Muggin
g/rob
bery
Domes
tic vi
olenc
e
Sexua
l ass
ault
Arson
Racial
ly moti
vated
attac
k
Homop
hobic
moti
vated
attac
k
No.
of r
espo
nden
ts
Number of times been a victim of crime in the last 12 months
80%
14%4%
0%1%
1%
None1234Greater than 4
29
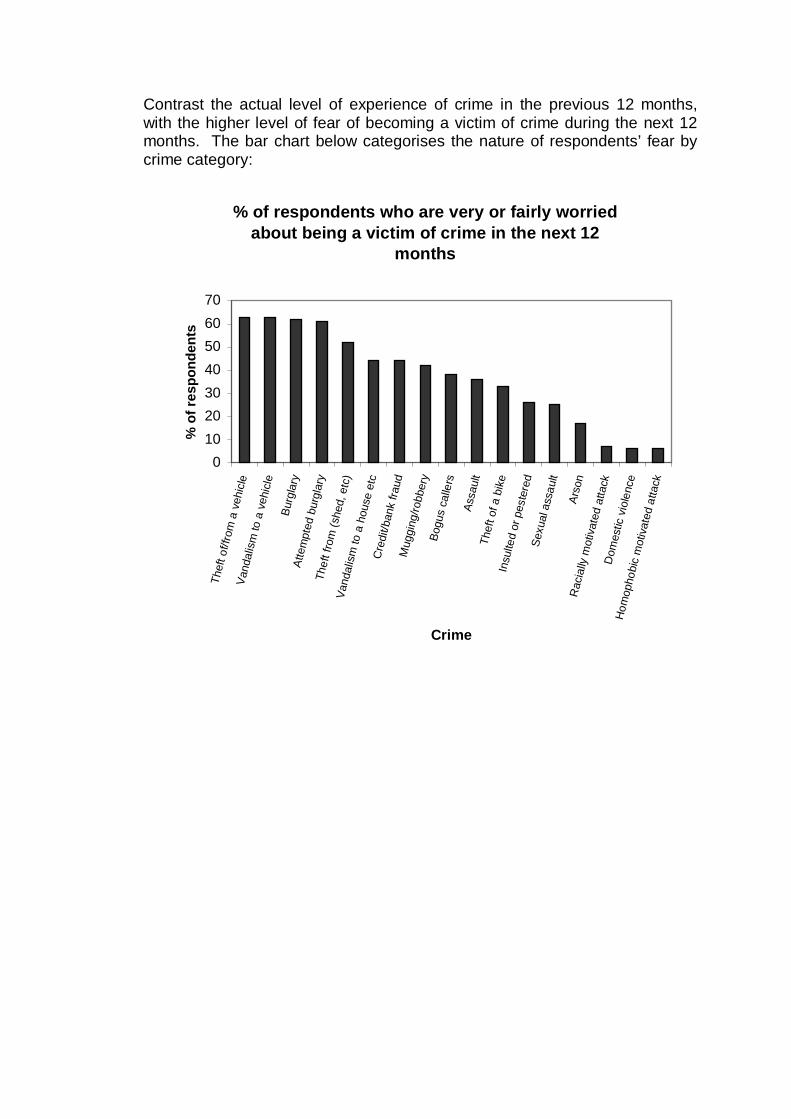
Contrast the actual level of experience of crime in the previous 12 months,with the higher level of fear of becoming a victim of crime during the next 12months. The bar chart below categorises the nature of respondents’ fear bycrime category:
% of respondents who are very or fairly worried about being a victim of crime in the next 12
months
010203040506070
Thef
t of/f
rom
a v
ehic
leVa
ndal
ism
to a
veh
icle
Burg
lary
Atte
mpt
ed b
urgl
ary
Thef
t fro
m (s
hed,
etc
)Va
ndal
ism
to a
hou
se e
tcC
redi
t/ban
k fra
udM
uggi
ng/ro
bber
yBo
gus
calle
rsAs
saul
tTh
eft o
f a b
ike
Insu
lted
or p
este
red
Sexu
al a
ssau
ltAr
son
Rac
ially
mot
ivat
ed a
ttack
Dom
estic
vio
lenc
eHo
mop
hobi
c m
otiv
ated
atta
ckCrime
% o
f res
pond
ents
30
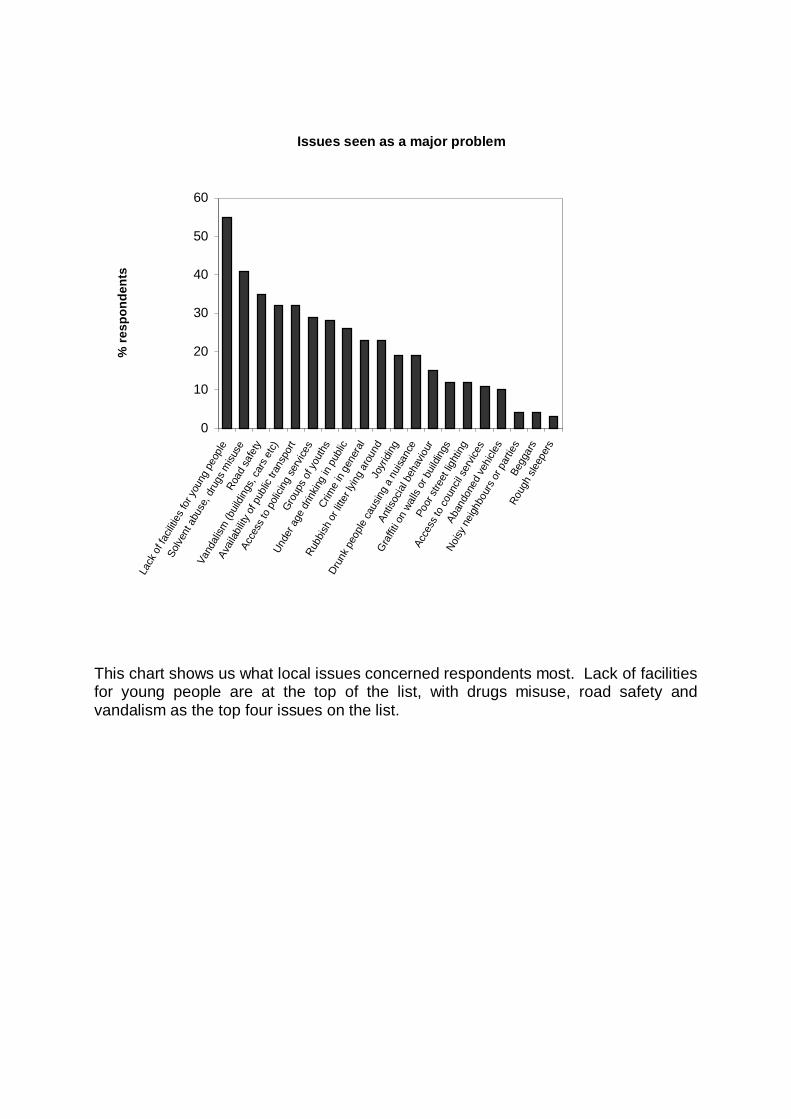
This chart shows us what local issues concerned respondents most. Lack of facilitiesfor young people are at the top of the list, with drugs misuse, road safety andvandalism as the top four issues on the list.
Issues seen as a major problem
0
10
20
30
40
50
60
Lack
of f
acilit
ies fo
r you
ng p
eople
Solve
nt a
buse
, dru
gs m
isuse
Road
safe
ty
Vand
alism
(buil
dings
, car
s etc)
Avail
abilit
y of p
ublic
tran
spor
t
Acce
ss to
poli
cing
serv
ices
Grou
ps o
f you
ths
Unde
r age
drin
king
in pu
blic
Crim
e in
gene
ral
Rubb
ish o
r litte
r lyin
g ar
ound
Joyr
iding
Drun
k peo
ple ca
using
a n
uisan
ce
Antis
ocial
beh
aviou
r
Graffit
i on
walls
or b
uildin
gs
Poor
stre
et lig
hting
Acce
ss to
coun
cil se
rvice
s
Aban
done
d ve
hicles
Noisy
neig
hbou
rs o
r par
ties
Begg
ars
Roug
h sle
eper
s
% re
spon
dent
s
31
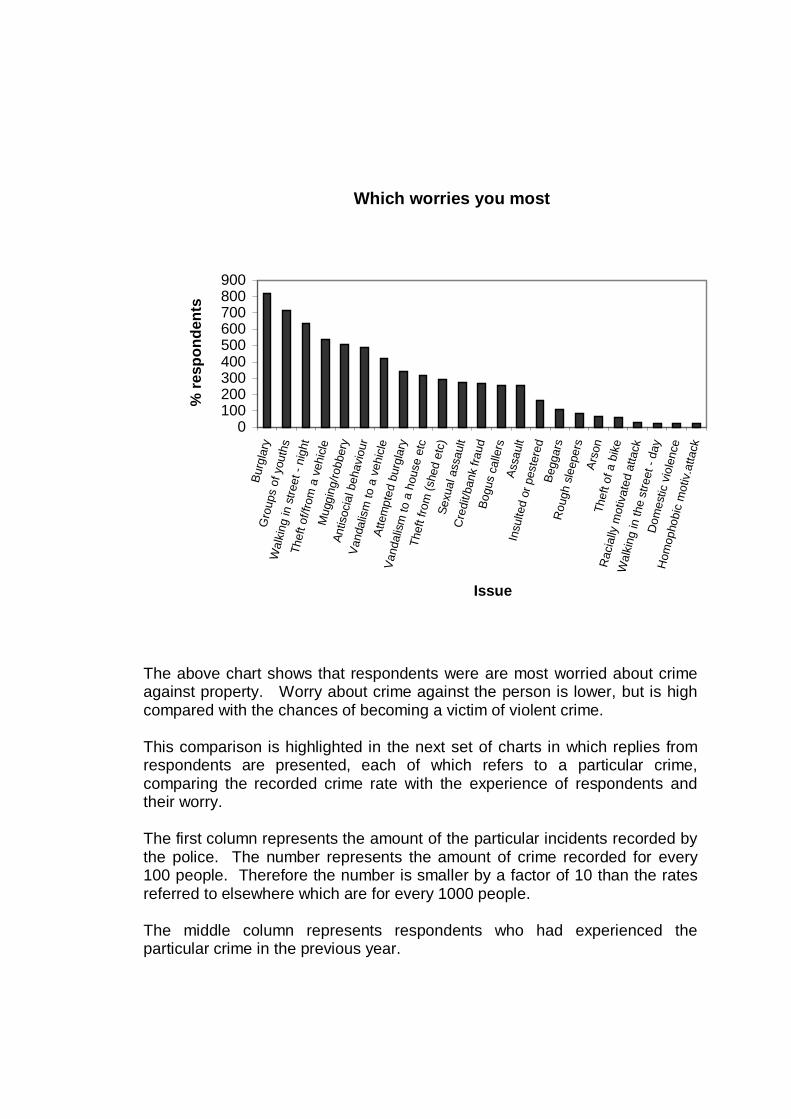
The above chart shows that respondents were are most worried about crimeagainst property. Worry about crime against the person is lower, but is highcompared with the chances of becoming a victim of violent crime.
This comparison is highlighted in the next set of charts in which replies fromrespondents are presented, each of which refers to a particular crime,comparing the recorded crime rate with the experience of respondents andtheir worry.
The first column represents the amount of the particular incidents recorded bythe police. The number represents the amount of crime recorded for every100 people. Therefore the number is smaller by a factor of 10 than the ratesreferred to elsewhere which are for every 1000 people.
The middle column represents respondents who had experienced theparticular crime in the previous year.
Which worries you most
0100200300400500600700800900
Burg
lary
Gro
ups
of y
outh
sW
alki
ng in
stre
et -
nigh
tTh
eft o
f/fro
m a
veh
icle
Mug
ging
/robb
ery
Antis
ocia
l beh
avio
urVa
ndal
ism
to a
veh
icle
Atte
mpt
ed b
urgl
ary
Vand
alism
to a
hou
se e
tcTh
eft f
rom
(she
d et
c)Se
xual
ass
ault
Cre
dit/b
ank
fraud
Bogu
s ca
llers
Assa
ult
Insu
lted
or p
este
red
Begg
ars
Rou
gh s
leep
ers
Arso
nTh
eft o
f a b
ike
Rac
ially
mot
ivat
ed a
ttack
Wal
king
in th
e st
reet
- da
yD
omes
tic v
iole
nce
Hom
opho
bic
mot
iv.a
ttack
Issue
% re
spon
dent
s
32
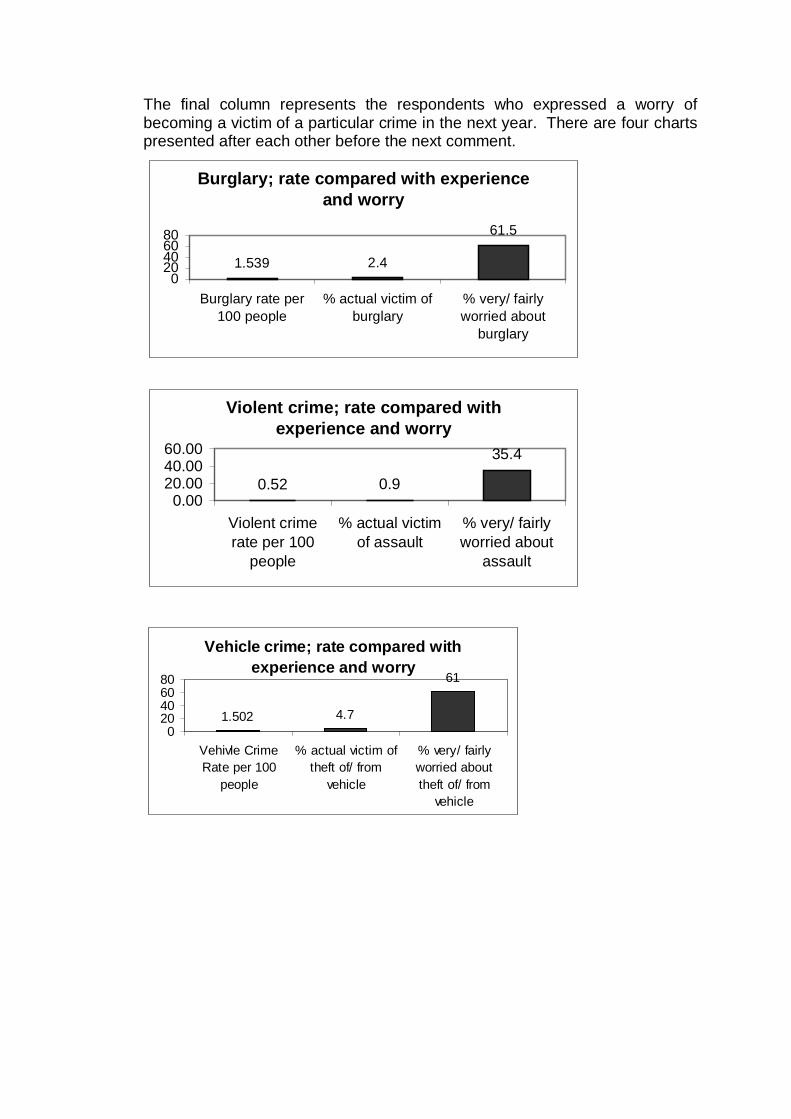
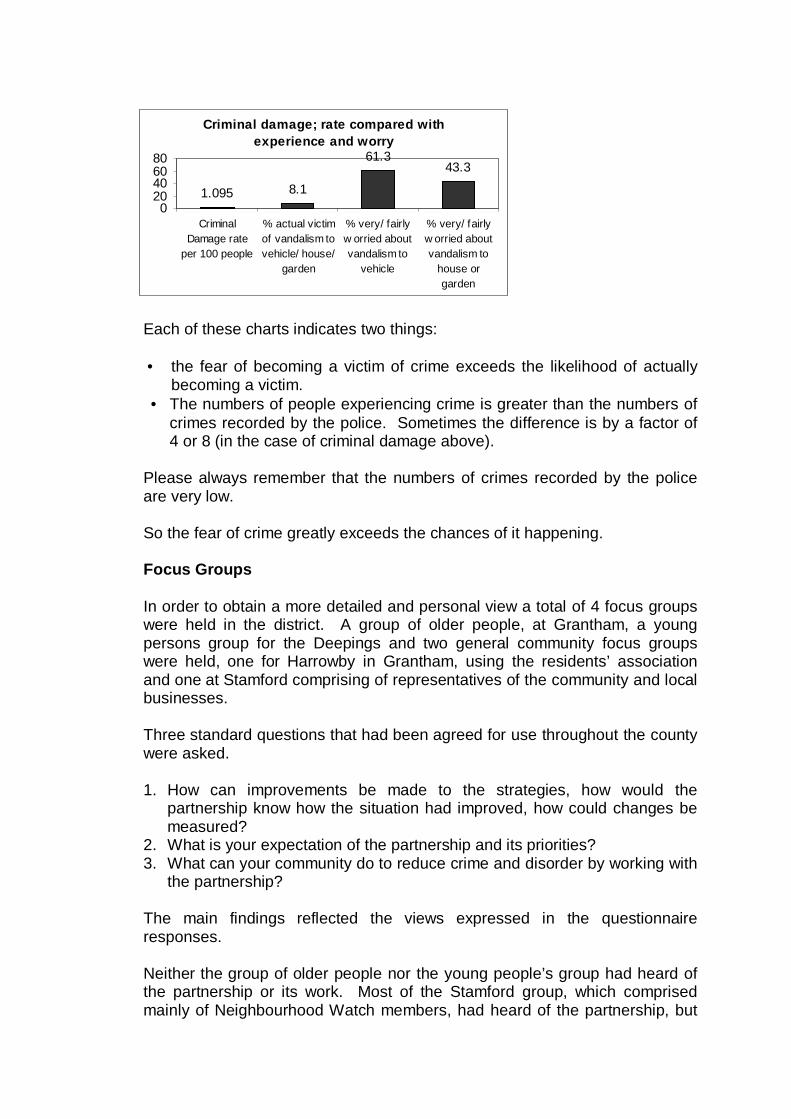
The final column represents the respondents who expressed a worry ofbecoming a victim of a particular crime in the next year. There are four chartspresented after each other before the next comment.
Violent crime; rate compared with experience and worry
0.52 0.9
35.4
0.0020.0040.0060.00
Violent crimerate per 100
people
% actual victimof assault
% very/ fairlyworried about
assault
Burglary; rate compared with experience and worry
1.539 2.4
61.5
020406080
Burglary rate per100 people
% actual victim ofburglary
% very/ fairlyworried about
burglary
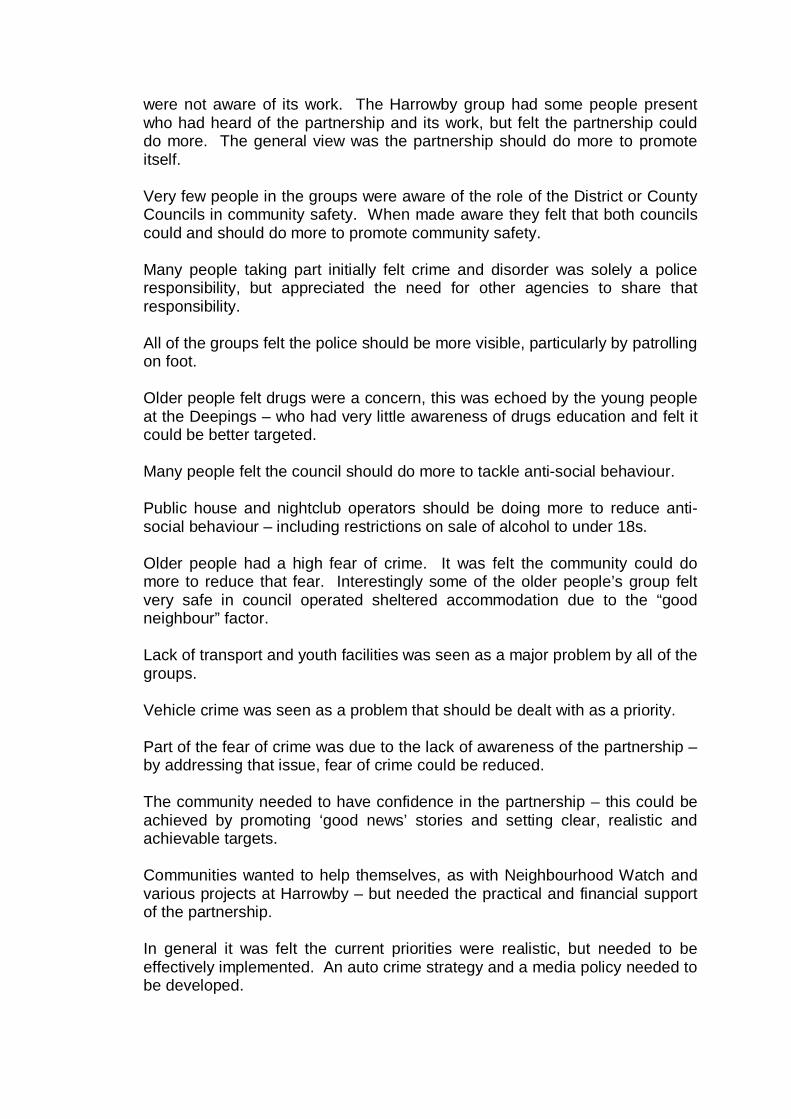
Vehicle crime; rate compared with experience and worry
1.502 4.7
61
020406080
Vehivle CrimeRate per 100
people
% actual victim oftheft of/ from
vehicle
% very/ fairlyworried abouttheft of/ from
vehicle
33
Each of these charts indicates two things:
• the fear of becoming a victim of crime exceeds the likelihood of actuallybecoming a victim.
• The numbers of people experiencing crime is greater than the numbers ofcrimes recorded by the police. Sometimes the difference is by a factor of4 or 8 (in the case of criminal damage above).
Please always remember that the numbers of crimes recorded by the policeare very low.
So the fear of crime greatly exceeds the chances of it happening.
Focus Groups
In order to obtain a more detailed and personal view a total of 4 focus groupswere held in the district. A group of older people, at Grantham, a youngpersons group for the Deepings and two general community focus groupswere held, one for Harrowby in Grantham, using the residents’ associationand one at Stamford comprising of representatives of the community and localbusinesses.
Three standard questions that had been agreed for use throughout the countywere asked.
1. How can improvements be made to the strategies, how would thepartnership know how the situation had improved, how could changes bemeasured?
2. What is your expectation of the partnership and its priorities?3. What can your community do to reduce crime and disorder by working with
the partnership?
The main findings reflected the views expressed in the questionnaireresponses.
Neither the group of older people nor the young people’s group had heard ofthe partnership or its work. Most of the Stamford group, which comprisedmainly of Neighbourhood Watch members, had heard of the partnership, but
Criminal damage; rate compared with experience and worry
1.095 8.1
61.343.3
020406080
CriminalDamage rate
per 100 people
% actual victimof vandalism tovehicle/ house/
garden
% very/ fairlyw orried aboutvandalism to
vehicle
% very/ fairlyw orried aboutvandalism to
house orgarden
34
were not aware of its work. The Harrowby group had some people presentwho had heard of the partnership and its work, but felt the partnership coulddo more. The general view was the partnership should do more to promoteitself.
Very few people in the groups were aware of the role of the District or CountyCouncils in community safety. When made aware they felt that both councilscould and should do more to promote community safety.
Many people taking part initially felt crime and disorder was solely a policeresponsibility, but appreciated the need for other agencies to share thatresponsibility.
All of the groups felt the police should be more visible, particularly by patrollingon foot.
Older people felt drugs were a concern, this was echoed by the young peopleat the Deepings – who had very little awareness of drugs education and felt itcould be better targeted.
Many people felt the council should do more to tackle anti-social behaviour.
Public house and nightclub operators should be doing more to reduce anti-social behaviour – including restrictions on sale of alcohol to under 18s.
Older people had a high fear of crime. It was felt the community could domore to reduce that fear. Interestingly some of the older people’s group feltvery safe in council operated sheltered accommodation due to the “goodneighbour” factor.
Lack of transport and youth facilities was seen as a major problem by all of thegroups.
Vehicle crime was seen as a problem that should be dealt with as a priority.
Part of the fear of crime was due to the lack of awareness of the partnership –by addressing that issue, fear of crime could be reduced.
The community needed to have confidence in the partnership – this could beachieved by promoting ‘good news’ stories and setting clear, realistic andachievable targets.
Communities wanted to help themselves, as with Neighbourhood Watch andvarious projects at Harrowby – but needed the practical and financial supportof the partnership.
In general it was felt the current priorities were realistic, but needed to beeffectively implemented. An auto crime strategy and a media policy needed tobe developed.
35
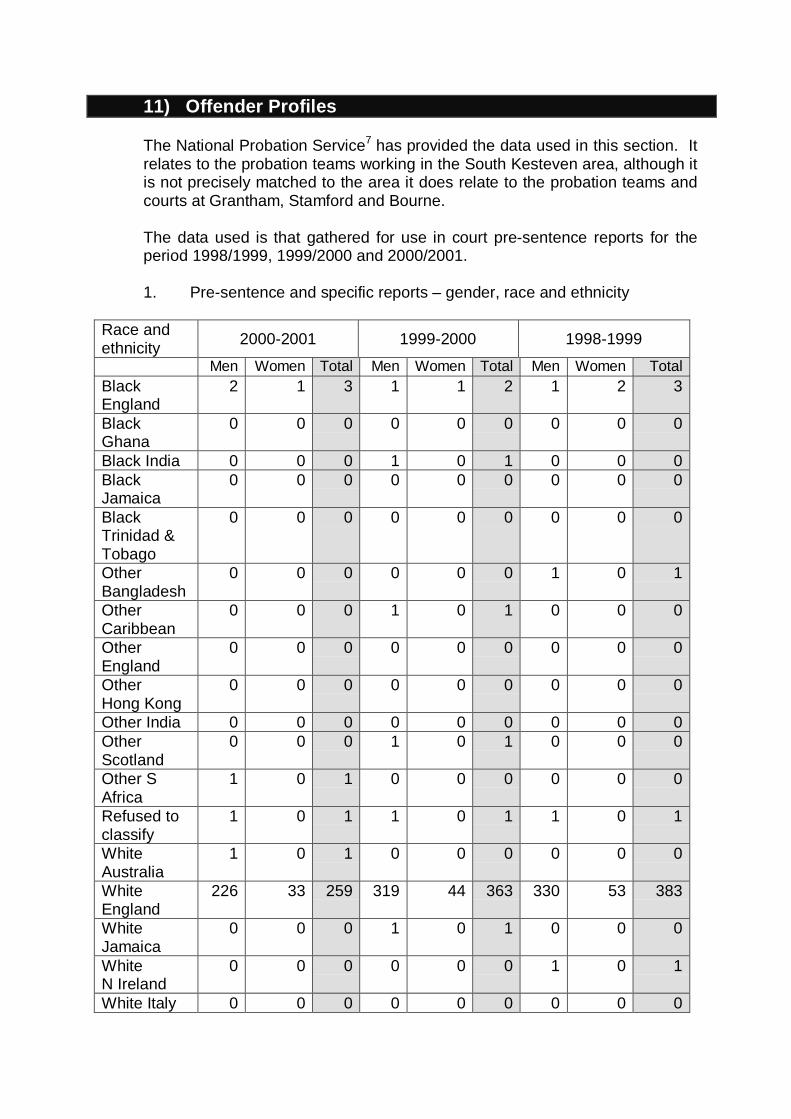
11) Offender Profiles
The National Probation Service7 has provided the data used in this section. Itrelates to the probation teams working in the South Kesteven area, although itis not precisely matched to the area it does relate to the probation teams andcourts at Grantham, Stamford and Bourne.
The data used is that gathered for use in court pre-sentence reports for theperiod 1998/1999, 1999/2000 and 2000/2001.
1. Pre-sentence and specific reports – gender, race and ethnicity
Race andethnicity 2000-2001 1999-2000 1998-1999
Men Women Total Men Women Total Men Women TotalBlackEngland
2 1 3 1 1 2 1 2 3
BlackGhana
0 0 0 0 0 0 0 0 0
Black India 0 0 0 1 0 1 0 0 0BlackJamaica
0 0 0 0 0 0 0 0 0
BlackTrinidad &Tobago
0 0 0 0 0 0 0 0 0
OtherBangladesh
0 0 0 0 0 0 1 0 1
OtherCaribbean
0 0 0 1 0 1 0 0 0
OtherEngland
0 0 0 0 0 0 0 0 0
OtherHong Kong
0 0 0 0 0 0 0 0 0
Other India 0 0 0 0 0 0 0 0 0OtherScotland
0 0 0 1 0 1 0 0 0
Other SAfrica
1 0 1 0 0 0 0 0 0
Refused toclassify
1 0 1 1 0 1 1 0 1
WhiteAustralia
1 0 1 0 0 0 0 0 0
WhiteEngland
226 33 259 319 44 363 330 53 383
WhiteJamaica
0 0 0 1 0 1 0 0 0
WhiteN Ireland
0 0 0 0 0 0 1 0 1
White Italy 0 0 0 0 0 0 0 0 0
36
White OtherAsian
0 0 0 1 0 1 0 0 0
White OtherEuropean
1 0 1 5 0 5 0 0 0
WhiteRep ofIreland
0 0 0 0 0 0 1 0 1
WhitePortugal
0 0 0 1 0 1 0 0 0
WhiteScotland
8 0 8 2 0 2 6 0 6
White Spain 0 0 0 1 0 1 0 0 0Notclassified
6 1 7 21 3 24 14 1 15
TOTAL 246 35 281 356 48 404 355 56 411
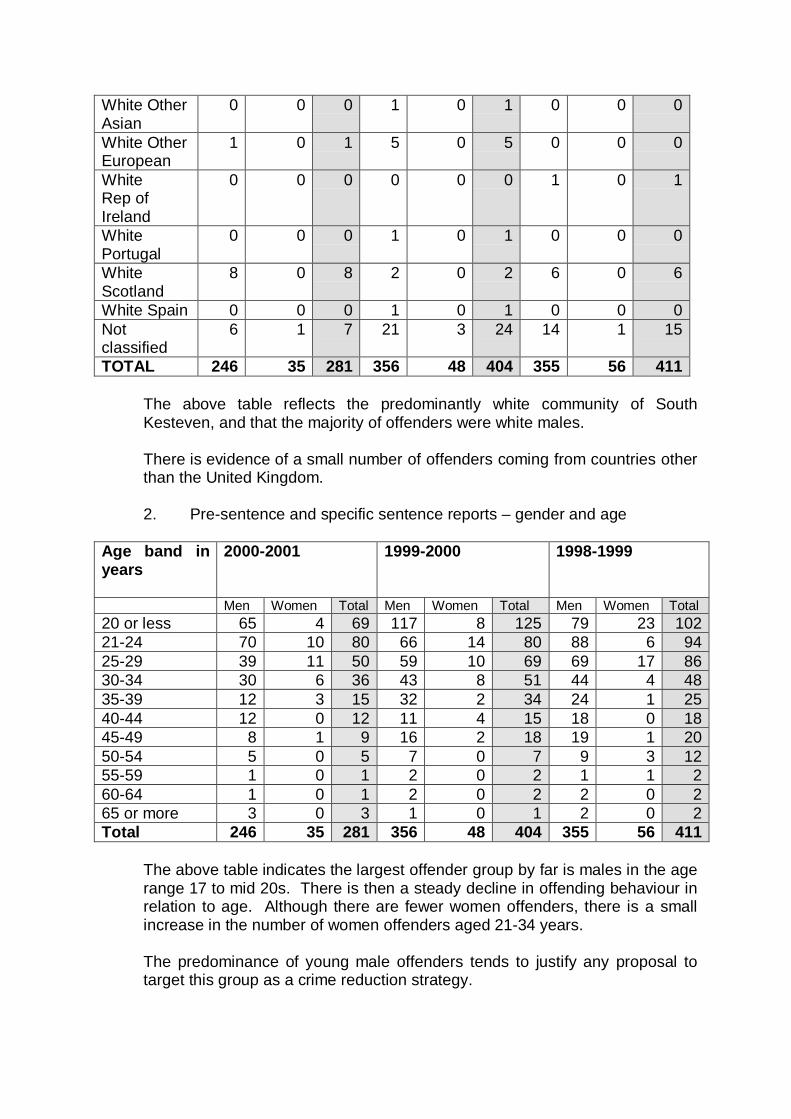
The above table reflects the predominantly white community of SouthKesteven, and that the majority of offenders were white males.
There is evidence of a small number of offenders coming from countries otherthan the United Kingdom.
2. Pre-sentence and specific sentence reports – gender and age
Age band inyears
2000-2001 1999-2000 1998-1999
Men Women Total Men Women Total Men Women Total20 or less 65 4 69 117 8 125 79 23 10221-24 70 10 80 66 14 80 88 6 9425-29 39 11 50 59 10 69 69 17 8630-34 30 6 36 43 8 51 44 4 4835-39 12 3 15 32 2 34 24 1 2540-44 12 0 12 11 4 15 18 0 1845-49 8 1 9 16 2 18 19 1 2050-54 5 0 5 7 0 7 9 3 1255-59 1 0 1 2 0 2 1 1 260-64 1 0 1 2 0 2 2 0 265 or more 3 0 3 1 0 1 2 0 2Total 246 35 281 356 48 404 355 56 411
The above table indicates the largest offender group by far is males in the agerange 17 to mid 20s. There is then a steady decline in offending behaviour inrelation to age. Although there are fewer women offenders, there is a smallincrease in the number of women offenders aged 21-34 years.
The predominance of young male offenders tends to justify any proposal totarget this group as a crime reduction strategy.
37
Over the three-year period the most common category of offences dealt withwere assaults of all types, totalling 152 offences, including:
• Burglary offences: 56 reports.
• Drug related offences: to 20 reports.
• Vehicle crime offences: 35 reports.
Information is also available relating to offending related problems oraggravating factors.
The most common factor influencing offenders was that of drugs in 277 casesof which 239 involved men.
The most commonly used drug in the period of 1999-2001 was heroin in 96cases, followed by amphetamine 23 cases and cannabis in 9 cases.
The specific drug offences figure reinforce the view that the South Kestevendistrict has a larger drugs problem than the other two districts in the south ofthe county.
Alcohol was another major factor in 226 cases, only 24 of which involvedfemales.
Therefore drug and alcohol abuse should be retained as a priority in its nextstrategy.
Peer influence and lack of social skills, including anger management werefactors in 297 instances. All three categories could be classed as socialfactors.
Clearly diversion strategies that include provision to improve social skillsdevelopment should be actively considered.
Employment status figures reveal the majority of offenders were unemployedwith 811 reports being completed, 451 of which showed the offender to beunemployed.

38
12) Housing
The council has a stock, which fluctuates around 7000 properties locatedthroughout the district. There were 152 vacant properties (SKDC 2001).
One particular estate has windows and doors grilled routinely to reducevandalism.
There was a major burglary reduction initiative funded by the Home Office in1999 to tackle the high rate of burglaries on the Earlesfield estate inGrantham. The programme combined door and window replacement oncouncil properties with a promotional campaign to encourage everyone to bevigilant and to lock their doors and windows. This is because analysis showedin a quarter to one third of burglaries, the burglar breaks in through anunlocked door or window. This method of entry is described as: ‘basicinsecurity’.
The initiative was successful in reducing burglaries through doors andwindows, but the numbers of incidents where ‘basic insecurity’ was at faultremained unchanged.
The graph of the burglary rate on the police beat for the Earlesfield areaappears at section 15, beat profiles: it shows an increase of burglaries lastyear to a level above that recorded in 1998/99.
The Housing department is represented on the Multi-Agency Public ProtectionPanel and the Sex Offenders Task Group, which were set-up to help managethe risk, which the most dangerous offenders pose to the community.
13) Education and employment
EducationUnauthorised absence from school is sometimes used as a proxy measure orexplanation for levels of crime and disorder in an area. The data supplied byLincolnshire County Council, Education and Cultural Services Departmentcannot be published, to protect confidentiality, but it shows wide variations inthe numbers of unauthorised absences and fixed and permanent exclusions inthe same school between the two academic years: 1998/1999 and 1999/2000.
Overall, across the district there was a reduction in the numbers ofunauthorised absences, but this was not a general trend in all schools.
Two years is too short a period from which to draw reliable conclusions abouttrends from this data. Aggregating data up to district level realistically doesnot allow inferences to be made about potential links with crime.
EmploymentUnemployment has fallen, to 1.6% (August 2001) (Lincolnshire Development2001). This is reflected across the whole of the district. Although the
39
Earlesfield remains the Ward with the highest unemployment rate in SouthKesteven, where unemployment is at it lowest level in recent times.
14) National Index of Deprivation
The key indicators consolidated together in the index of multiple deprivationwere:
Income supportSocial services open casesFree school mealsYouth CrimeTeenage pregnancyKey stage 2 attainmentHeadline unemployedIncapacity benefit claimantsStandard mortality rateLow birth weight
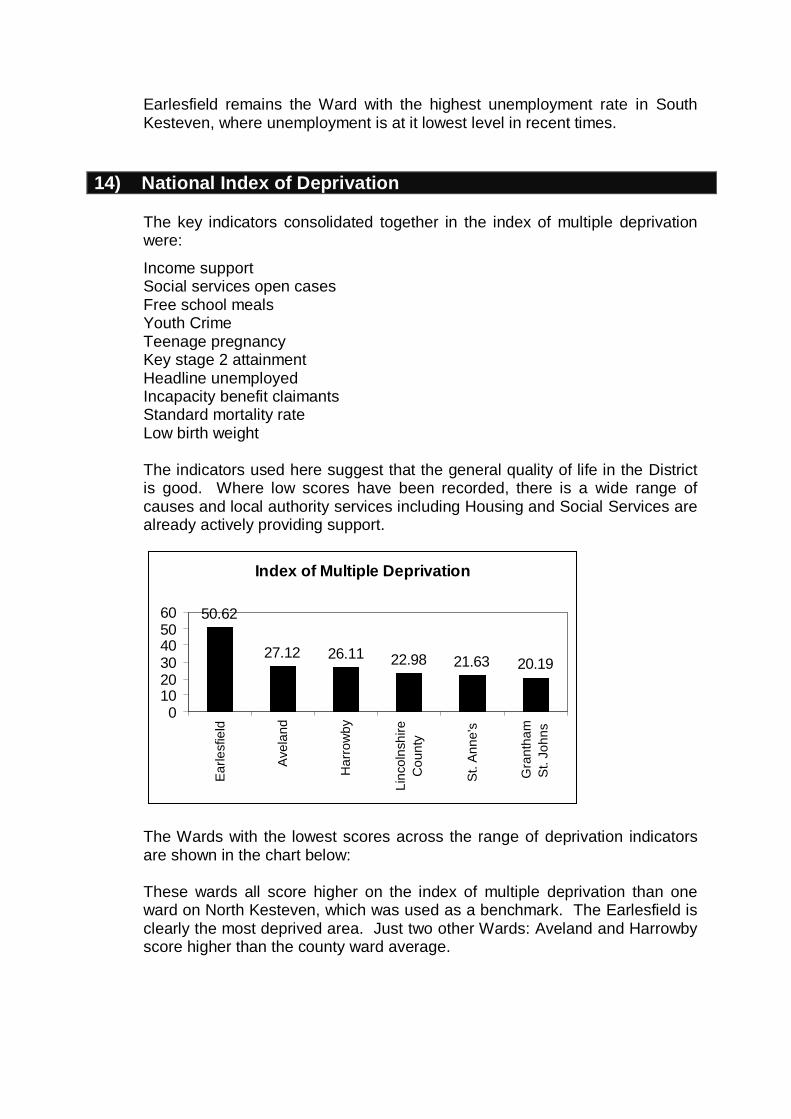
The indicators used here suggest that the general quality of life in the Districtis good. Where low scores have been recorded, there is a wide range ofcauses and local authority services including Housing and Social Services arealready actively providing support.
The Wards with the lowest scores across the range of deprivation indicatorsare shown in the chart below:
These wards all score higher on the index of multiple deprivation than oneward on North Kesteven, which was used as a benchmark. The Earlesfield isclearly the most deprived area. Just two other Wards: Aveland and Harrowbyscore higher than the county ward average.
Index of Multiple Deprivation
50.62
27.12 26.11 22.98 21.63 20.19
0102030405060
Earle
sfie
ld
Avel
and
Har
row
by
Linc
olns
hire
Cou
nty
St. A
nne'
s
Gra
ntha
mSt
. Joh
ns
40
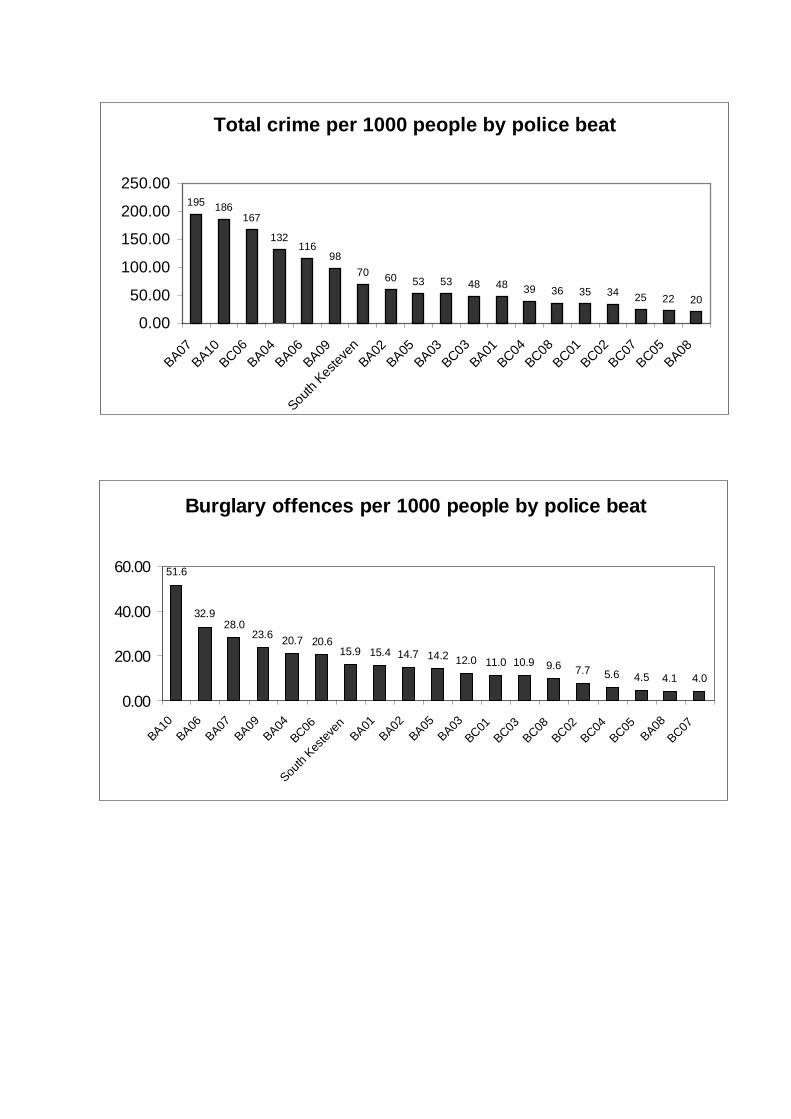
15) Beat Profiles
This section examines the different rates of crime between different policebeat areas an each shows the district average. The numbers in the followingcharts indicate a rate of crime expressed as a rate per 1000 people.
All the data relating to crime here has been provided by Lincolnshire Police:Force Information Unit (Lincolnshire Police 2001A).
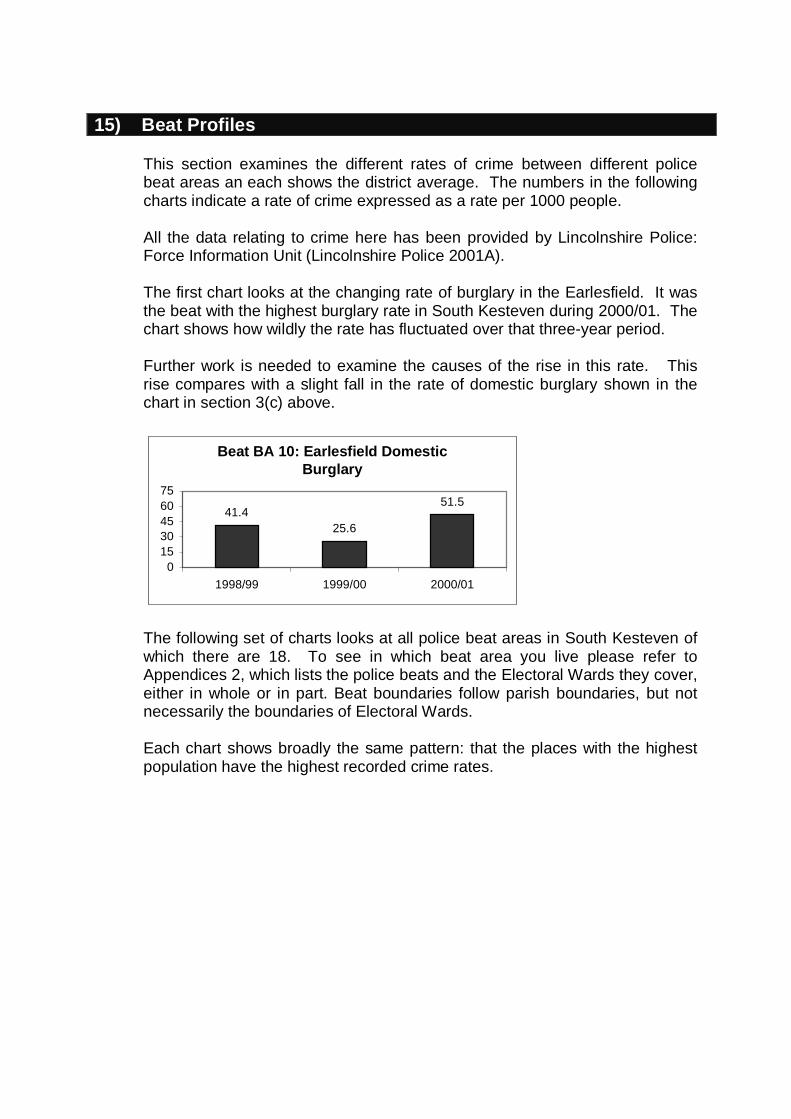
The first chart looks at the changing rate of burglary in the Earlesfield. It wasthe beat with the highest burglary rate in South Kesteven during 2000/01. Thechart shows how wildly the rate has fluctuated over that three-year period.
Further work is needed to examine the causes of the rise in this rate. Thisrise compares with a slight fall in the rate of domestic burglary shown in thechart in section 3(c) above.
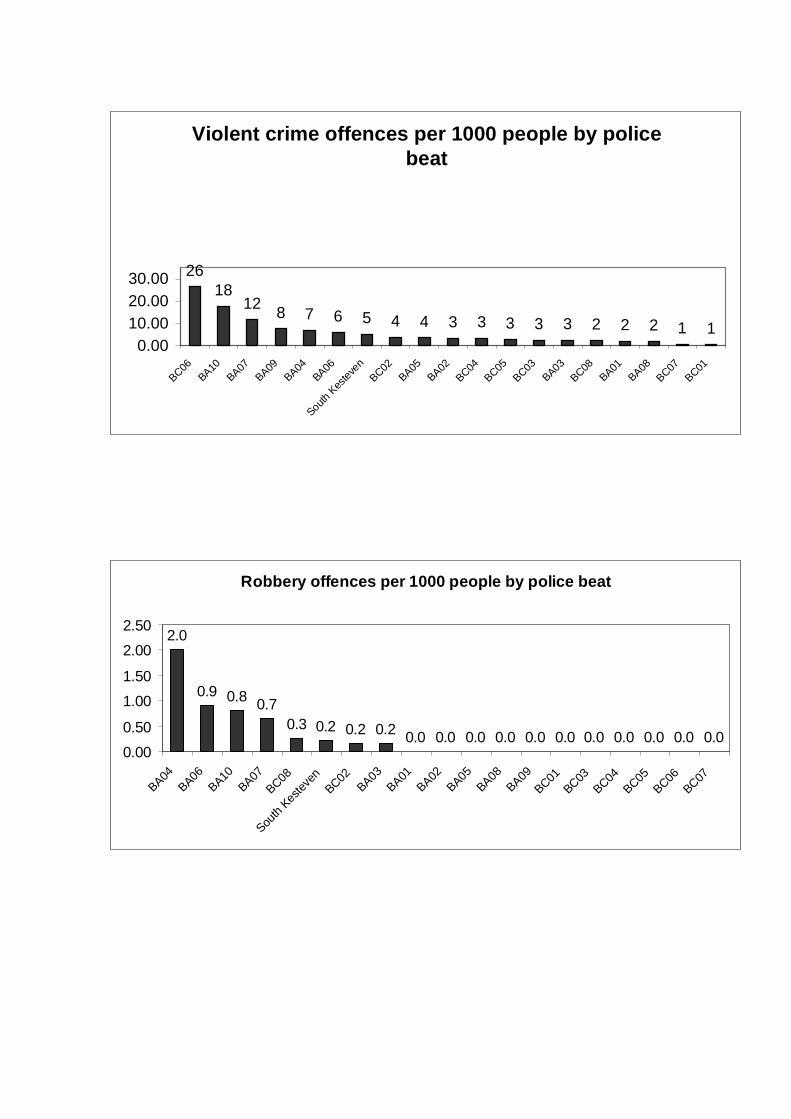
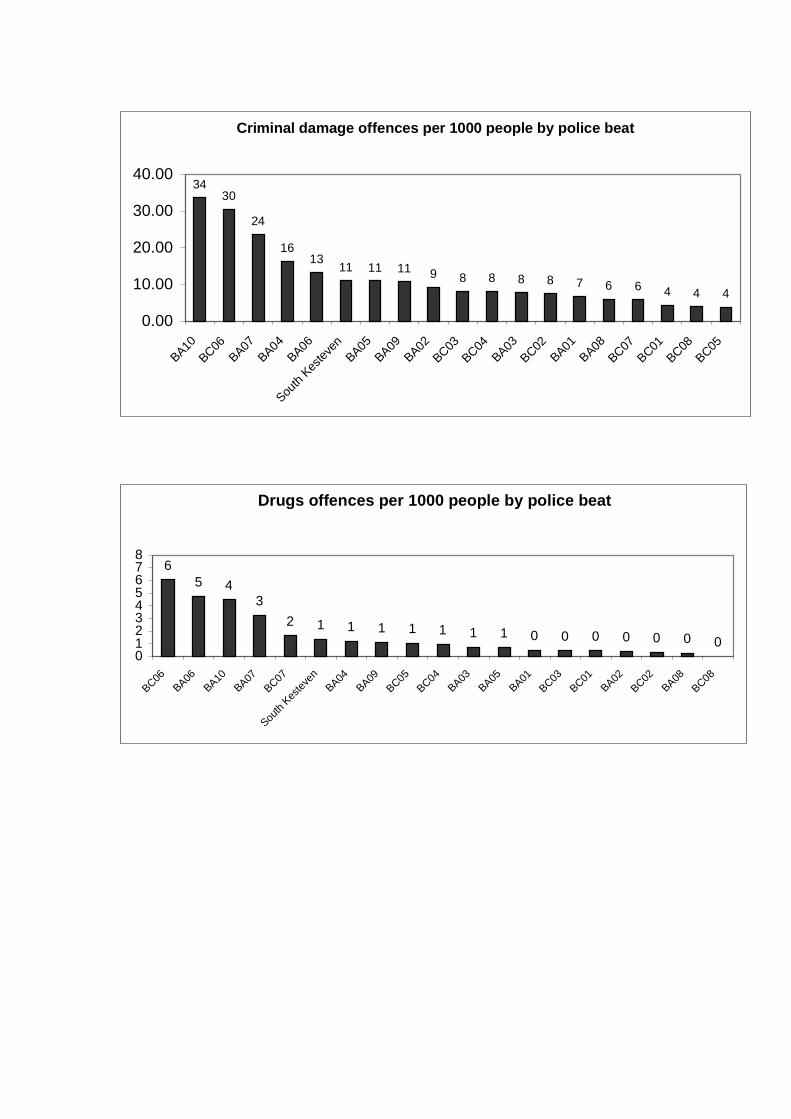
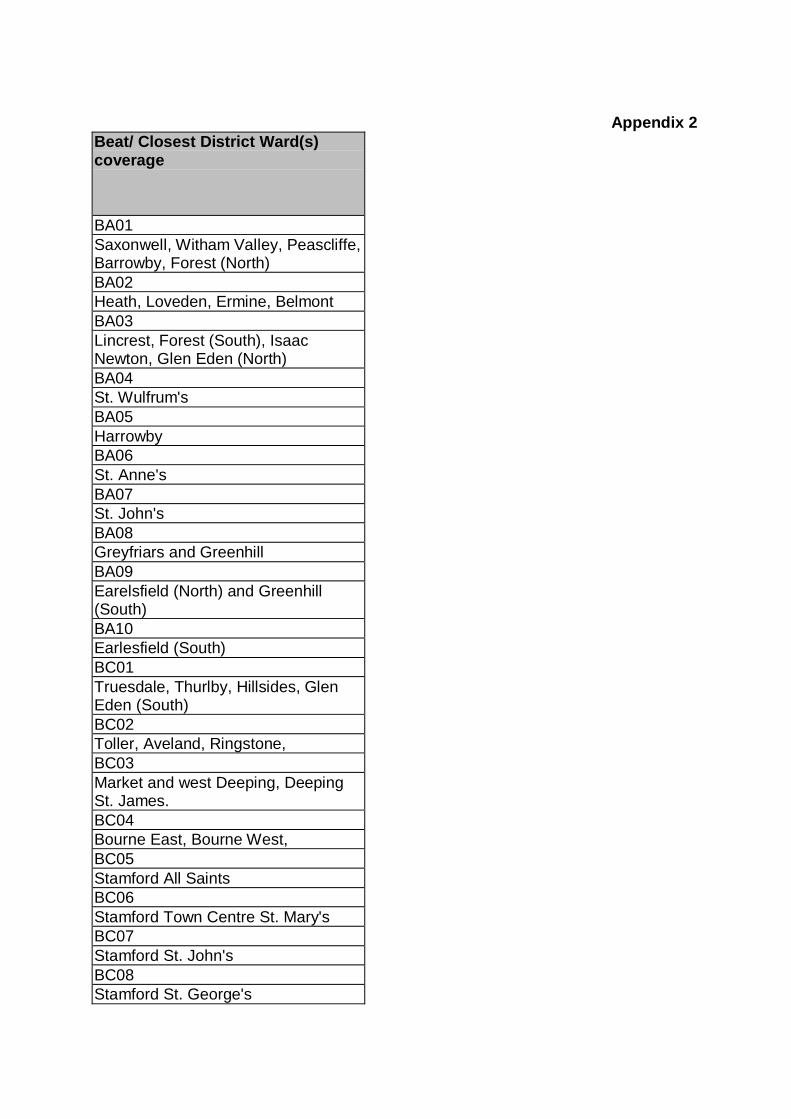
The following set of charts looks at all police beat areas in South Kesteven ofwhich there are 18. To see in which beat area you live please refer toAppendices 2, which lists the police beats and the Electoral Wards they cover,either in whole or in part. Beat boundaries follow parish boundaries, but notnecessarily the boundaries of Electoral Wards.
Each chart shows broadly the same pattern: that the places with the highestpopulation have the highest recorded crime rates.
Beat BA 10: Earlesfield Domestic Burglary
41.425.6
51.5
01530456075
1998/99 1999/00 2000/01
41
Total crime per 1000 people by police beat
195 186167
132116
9870 60 53 53 48 48 39 36 35 34 25 22 20
0.00
50.00
100.00
150.00
200.00
250.00
BA07BA10
BC06BA04
BA06BA09
South
Kestev
enBA02
BA05BA03
BC03BA01
BC04BC08
BC01BC02
BC07BC05
BA08
Burglary offences per 1000 people by police beat
51.6
32.928.0
23.6 20.7 20.615.9 15.4 14.7 14.2 12.0 11.0 10.9 9.6 7.7 5.6 4.5 4.1 4.0
0.00
20.00
40.00
60.00
BA10BA06
BA07BA09
BA04BC06
South
Kestev
enBA01
BA02BA05
BA03BC01
BC03BC08
BC02BC04
BC05BA08
BC07
42
Violent crime offences per 1000 people by police beat
2618
12 8 7 6 5 4 4 3 3 3 3 3 2 2 2 1 10.00
10.0020.0030.00
BC06BA10
BA07BA09
BA04BA06
South K
esteve
nBC02
BA05BA02
BC04BC05
BC03BA03
BC08BA01
BA08BC07
BC01
Robbery offences per 1000 people by police beat
2.0
0.9 0.8 0.70.3 0.2 0.2 0.2 0.0 0.0 0.0 0.0 0.0 0.0 0.0 0.0 0.0 0.0 0.0
0.000.50
1.001.50
2.002.50
BA04BA06
BA10BA07
BC08
South
Kestev
enBC02
BA03BA01
BA02BA05
BA08BA09
BC01BC03
BC04BC05
BC06BC07
43
Criminal damage offences per 1000 people by police beat
3430
24
1613 11 11 11 9 8 8 8 8 7 6 6 4 4 4
0.00
10.00
20.00
30.00
40.00
BA10BC06
BA07BA04
BA06
South
Kestev
enBA05
BA09BA02
BC03BC04
BA03BC02
BA01BA08
BC07BC01
BC08BC05
Drugs offences per 1000 people by police beat
65 4
32 1 1 1 1 1 1 1 0 0 0 0 0 0 0
012345678
BC06BA06
BA10BA07
BC07
South
Kestev
enBA04
BA09BC05
BC04BA03
BA05BA01
BC03BC01
BA02BC02
BA08BC08
44
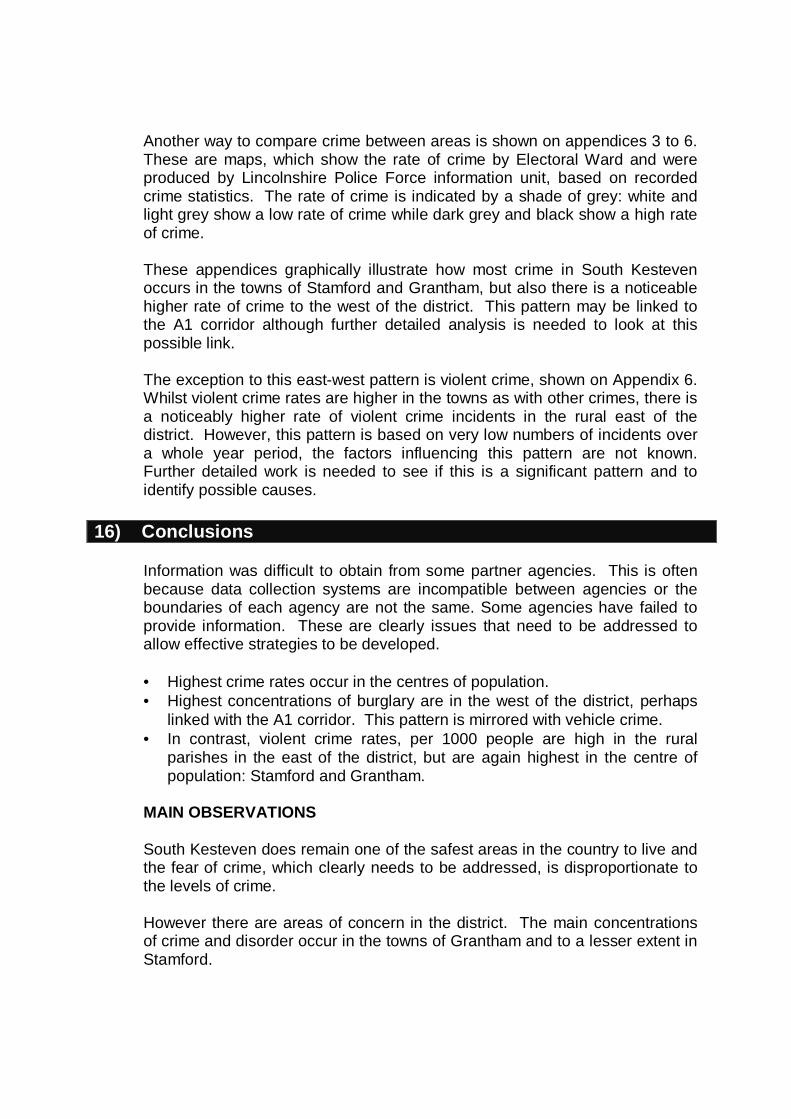
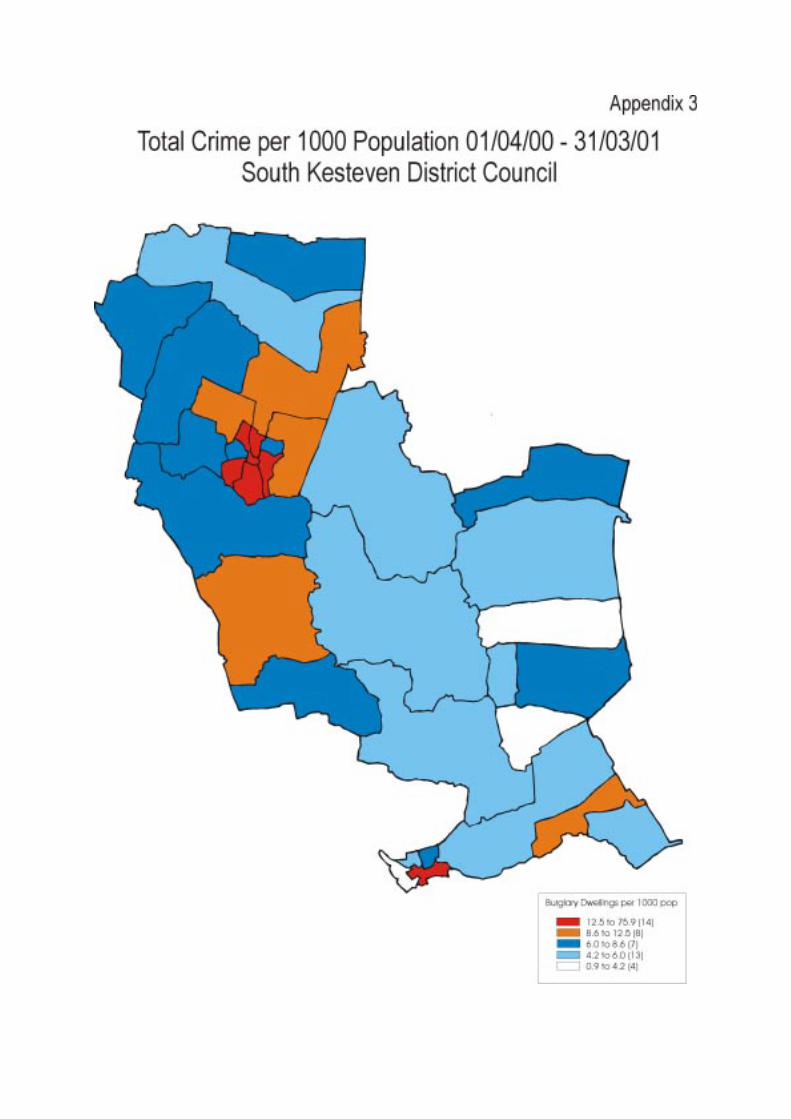
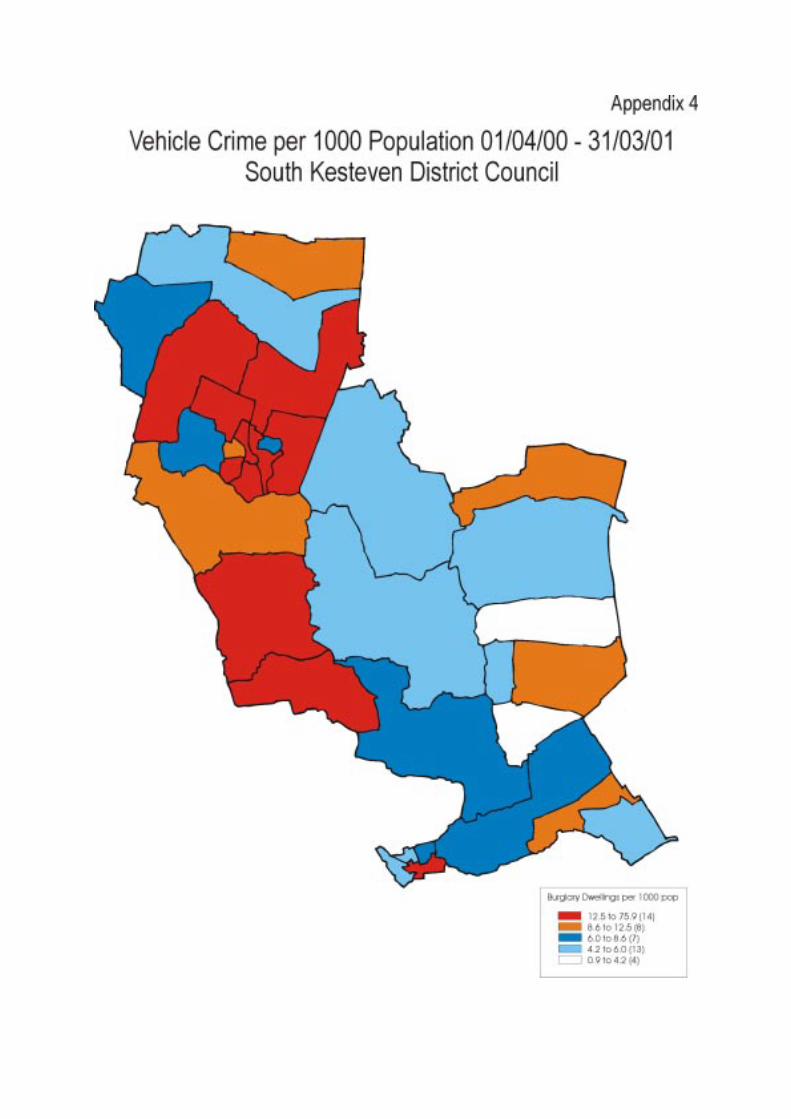
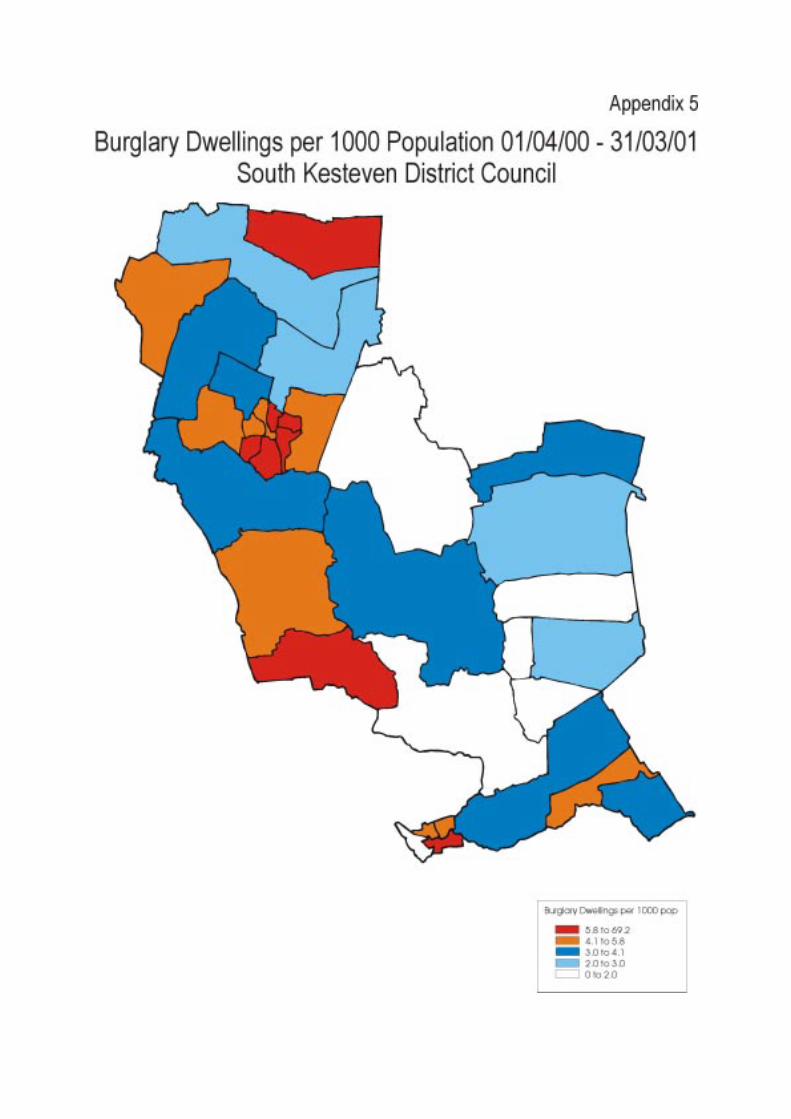
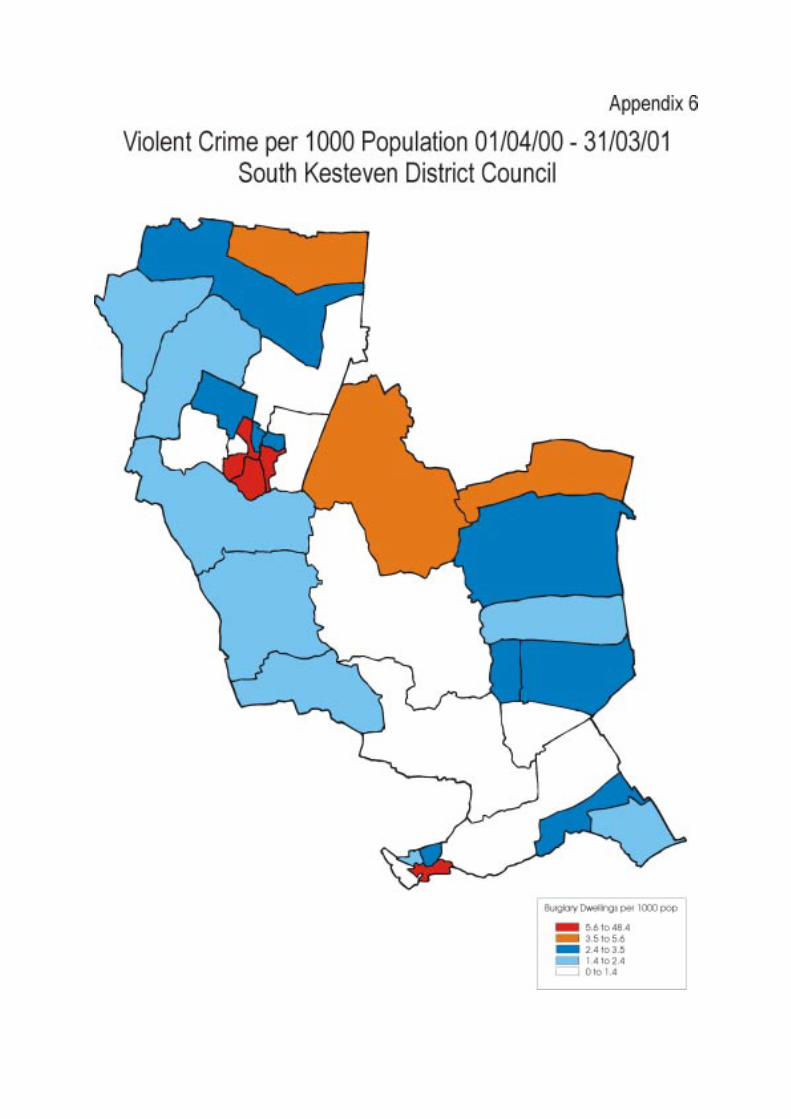
Another way to compare crime between areas is shown on appendices 3 to 6.These are maps, which show the rate of crime by Electoral Ward and wereproduced by Lincolnshire Police Force information unit, based on recordedcrime statistics. The rate of crime is indicated by a shade of grey: white andlight grey show a low rate of crime while dark grey and black show a high rateof crime.
These appendices graphically illustrate how most crime in South Kestevenoccurs in the towns of Stamford and Grantham, but also there is a noticeablehigher rate of crime to the west of the district. This pattern may be linked tothe A1 corridor although further detailed analysis is needed to look at thispossible link.
The exception to this east-west pattern is violent crime, shown on Appendix 6.Whilst violent crime rates are higher in the towns as with other crimes, there isa noticeably higher rate of violent crime incidents in the rural east of thedistrict. However, this pattern is based on very low numbers of incidents overa whole year period, the factors influencing this pattern are not known.Further detailed work is needed to see if this is a significant pattern and toidentify possible causes.
16) Conclusions
Information was difficult to obtain from some partner agencies. This is oftenbecause data collection systems are incompatible between agencies or theboundaries of each agency are not the same. Some agencies have failed toprovide information. These are clearly issues that need to be addressed toallow effective strategies to be developed.
• Highest crime rates occur in the centres of population.• Highest concentrations of burglary are in the west of the district, perhaps
linked with the A1 corridor. This pattern is mirrored with vehicle crime.• In contrast, violent crime rates, per 1000 people are high in the rural
parishes in the east of the district, but are again highest in the centre ofpopulation: Stamford and Grantham.
MAIN OBSERVATIONS
South Kesteven does remain one of the safest areas in the country to live andthe fear of crime, which clearly needs to be addressed, is disproportionate tothe levels of crime.
However there are areas of concern in the district. The main concentrationsof crime and disorder occur in the towns of Grantham and to a lesser extent inStamford.
45
The main hot spot areas are the Earlesfield and Cherry Orchard estates inGrantham. Both estates are consistently high in all categories of crime anddisorder, but especially in the case of the Earlesfield, which is high in thenational index of deprivation. These areas should remain targeted for action.
The town centres of Grantham and especially Stamford suffer from drinkrelated disorder and anti-social behaviour. Although those issues have beenaddressed by the introduction of CCTV systems and high profile policinginitiatives there still remains much that can be done by the partners to reducedisorder by joint quality of life initiatives aimed at licensed premises of alltypes.
The public opinion questionnaire results show burglary causes a high fear ofcrime, followed by anti-social behaviour and vehicle crime. Those feelingsalone justify those matters as worthy of inclusion in the strategy.
Drug and substance misuse remain high on the list of people’s concerns andmuch evidence supports the inclusion of those issues as a priority.
Young people’s issues are also of concern.
Domestic violence, although low on the list of concerns, remains a hiddencrime that is being increasingly uncovered by the partnership and isrecognised as a problem.
Public opinion also supports road safety issues as matters worthy of thepartnerships attention.
Information sharing between agencies needs to be better developed to tacklecommon factors in crime and disorder.
The initiatives to deal with town centre disorder need to be continued anddeveloped with each partner playing its full part.
Given the information presented, it is suggested the South Kesteven Crimeand Disorder Partnership retains its current priorities and consider addingvehicle crime and adopting a media strategy to raise the profile of thepartnership, its activity, the low crime levels, in an effort to reduce the fear ofcrime.
17) References
Office of National Statistics (ONS) (2001), Mid Year Population estimates.South Kesteven District Council (SKDC) (2001): Housing Strategy 2001.Lincolnshire Development (2001) Monthly Series AugustLincolnshire Fire and Rescue (2001): recorded incidents of malicious firesLincolnshire Police (2001A) Crime Statistics (Force Information Unit)Lincolnshire Police (2001B South Kesteven, Survey Report (Quality of ServiceUnit)Lincolnshire County Council (2000): The Condition of Lincolnshire
46
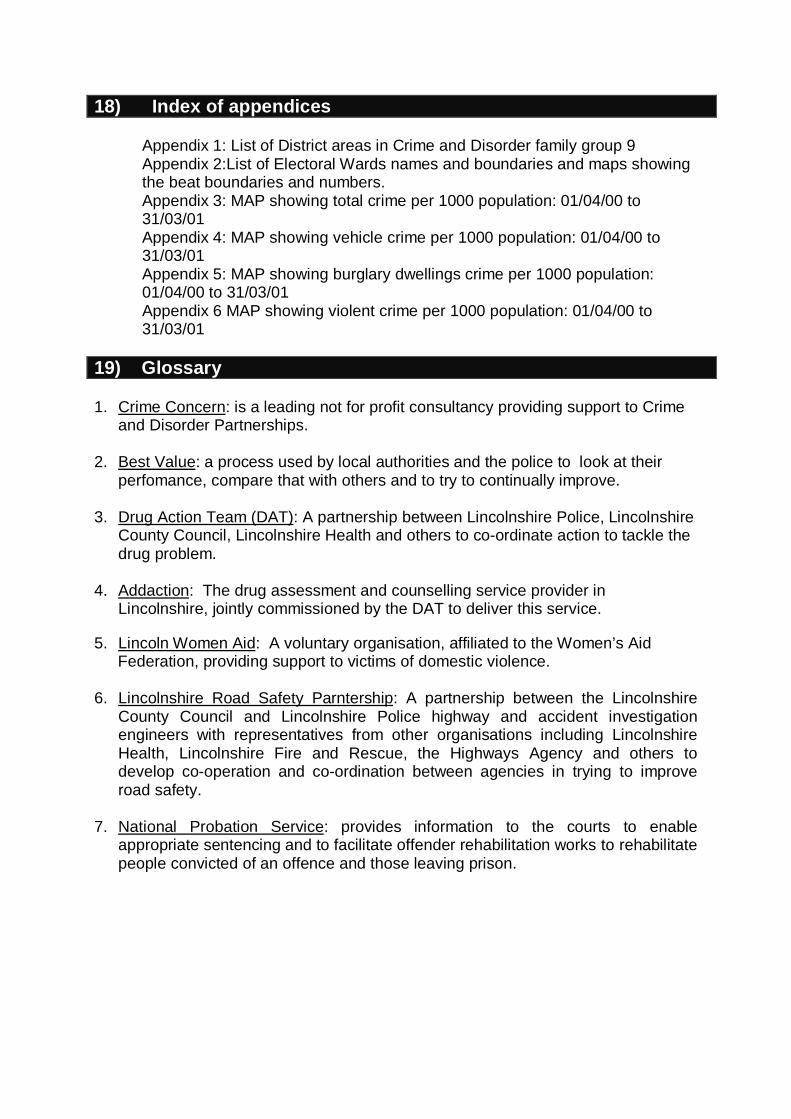
18) Index of appendices
Appendix 1: List of District areas in Crime and Disorder family group 9Appendix 2:List of Electoral Wards names and boundaries and maps showingthe beat boundaries and numbers.Appendix 3: MAP showing total crime per 1000 population: 01/04/00 to31/03/01Appendix 4: MAP showing vehicle crime per 1000 population: 01/04/00 to31/03/01Appendix 5: MAP showing burglary dwellings crime per 1000 population:01/04/00 to 31/03/01Appendix 6 MAP showing violent crime per 1000 population: 01/04/00 to31/03/01
19) Glossary
1. Crime Concern: is a leading not for profit consultancy providing support to Crimeand Disorder Partnerships.
2. Best Value: a process used by local authorities and the police to look at theirperfomance, compare that with others and to try to continually improve.
3. Drug Action Team (DAT): A partnership between Lincolnshire Police, LincolnshireCounty Council, Lincolnshire Health and others to co-ordinate action to tackle thedrug problem.
4. Addaction: The drug assessment and counselling service provider inLincolnshire, jointly commissioned by the DAT to deliver this service.
5. Lincoln Women Aid: A voluntary organisation, affiliated to the Women’s AidFederation, providing support to victims of domestic violence.
6. Lincolnshire Road Safety Parntership: A partnership between the LincolnshireCounty Council and Lincolnshire Police highway and accident investigationengineers with representatives from other organisations including LincolnshireHealth, Lincolnshire Fire and Rescue, the Highways Agency and others todevelop co-operation and co-ordination between agencies in trying to improveroad safety.
7. National Probation Service: provides information to the courts to enableappropriate sentencing and to facilitate offender rehabilitation works to rehabilitatepeople convicted of an offence and those leaving prison.
47
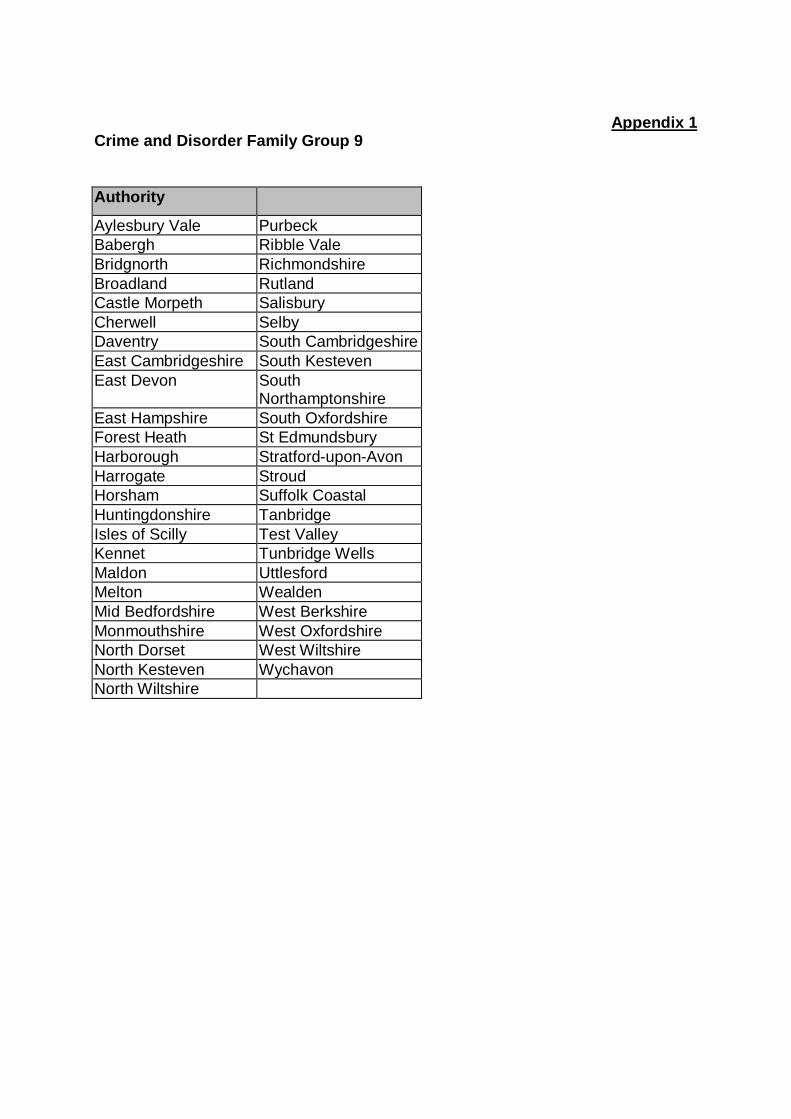
Appendix 1Crime and Disorder Family Group 9
Authority
Aylesbury Vale PurbeckBabergh Ribble ValeBridgnorth RichmondshireBroadland RutlandCastle Morpeth SalisburyCherwell SelbyDaventry South CambridgeshireEast Cambridgeshire South KestevenEast Devon South
NorthamptonshireEast Hampshire South OxfordshireForest Heath St EdmundsburyHarborough Stratford-upon-AvonHarrogate StroudHorsham Suffolk CoastalHuntingdonshire TanbridgeIsles of Scilly Test ValleyKennet Tunbridge WellsMaldon UttlesfordMelton WealdenMid Bedfordshire West BerkshireMonmouthshire West OxfordshireNorth Dorset West WiltshireNorth Kesteven WychavonNorth Wiltshire
48
Appendix 2Beat/ Closest District Ward(s)coverage
BA01Saxonwell, Witham Valley, Peascliffe,Barrowby, Forest (North)BA02Heath, Loveden, Ermine, BelmontBA03Lincrest, Forest (South), IsaacNewton, Glen Eden (North)BA04St. Wulfrum'sBA05HarrowbyBA06St. Anne'sBA07St. John'sBA08Greyfriars and GreenhillBA09Earelsfield (North) and Greenhill(South)BA10Earlesfield (South)BC01Truesdale, Thurlby, Hillsides, GlenEden (South)BC02Toller, Aveland, Ringstone,BC03Market and west Deeping, DeepingSt. James.BC04Bourne East, Bourne West,BC05Stamford All SaintsBC06Stamford Town Centre St. Mary'sBC07Stamford St. John'sBC08Stamford St. George's
49
50
51
52
53
54