Embed Size (px)
Citation preview

Ananyo Choudhury,Shaun Aron, Sco/ Hazelhurst, Zané Lombard
Wits Bioinforma?cs
Sources of Human Genome Varia?on Data

n 1000 Genomes n HapMap n Human Gene?c Varia?on Project n Research data
North African Southern Africa Other African New Data coming soon….

1000 Genomes A Deep Catalogue of Human Gene?c Varia?on

2001
draQ human genome sequence
2004
“finished” human genome
Whose genome was sequenced?
The human genome reference sequence does not represent an exact match for any one person's genome.
The draft genome is composed of the DNA of an estimated 10 to 20 anonymous individuals across different racial and ethnic groups.
International Human Genome Sequencing Consortium
IHGSC. Nature (2001) 409 860-921

Human Genetic Variation
American Express 1990 Advertisement
With the exception of monozygotic twins,
every one of us is genetically different from every other human who ever lived.
http
://w
ww
.chi
ldre
nofs
alem
.com
/day
s/ki
ds/e
ricbr
an/e
ricbr
an1.
htm
l

Genetic variation to drug responses
§ Example: § In the 1950s, anaesthestists began using the
muscle relaxant succinylcholine § A small proportion of patients went into life-
threatening breathing arrest. § Succinylcholine is normally metabolized by
cholinesterase but in 1 out of 2,500 people carry two defective copies of the gene for this enzyme
See: http://www.mdbrowse.com/Druginf/S/succinylcholine.htm
Because of genetic differences, different people respond differently to the same drug.

Diseases associated with gene3c varia3ons
Disease Type of Inheritance Gene Responsible
Phenylketonuria (PKU) Autosomal recessive Phenylalanine hydroxylase (PAH)
Cys?c fibrosis Autosomal recessive
Cys?c fibrosis conductance transmembrane regulator (CFTR)
Sickle-‐cell anemia
Autosomal recessive Beta hemoglobin (HBB)
Hun?ngton's disease Autosomal dominant Hun?ng?n (HTT)
Myotonic dystrophy type 1
Autosomal dominant
Dystrophia myotonica-‐protein kinase (DMPK)
Polycys?c kidney disease 1 and 2
Autosomal dominant
Polycys?c kidney disease 1 (PKD1) and polycys?c kidney disease 2 (PKD2), respec?vely
Hemophilia A X-‐linked recessive Coagula?on factor VIII (F8)
Muscular dystrophy, Duchenne type
X-‐linked recessive Dystrophin (DMD)
Hypophosphatemic rickets, X-‐linked dominant
X-‐linked dominant
Phosphate-‐regula?ng endopep?dase homologue, X-‐linked (PHEX)
Re/'s syndrome X-‐linked dominant Methyl-‐CpG-‐binding protein 2 (MECP2)
Spermatogenic failure, nonobstruc?ve, Y-‐linked
Y-‐linked Ubiqui?n-‐specific pep?dase 9Y, Y-‐linked (USP9Y)
Phenotype descrip?on, molecular basis known
Autosomal
3,732 X-‐Linked
282 Y-‐Linked
4 Mito
28 4,046
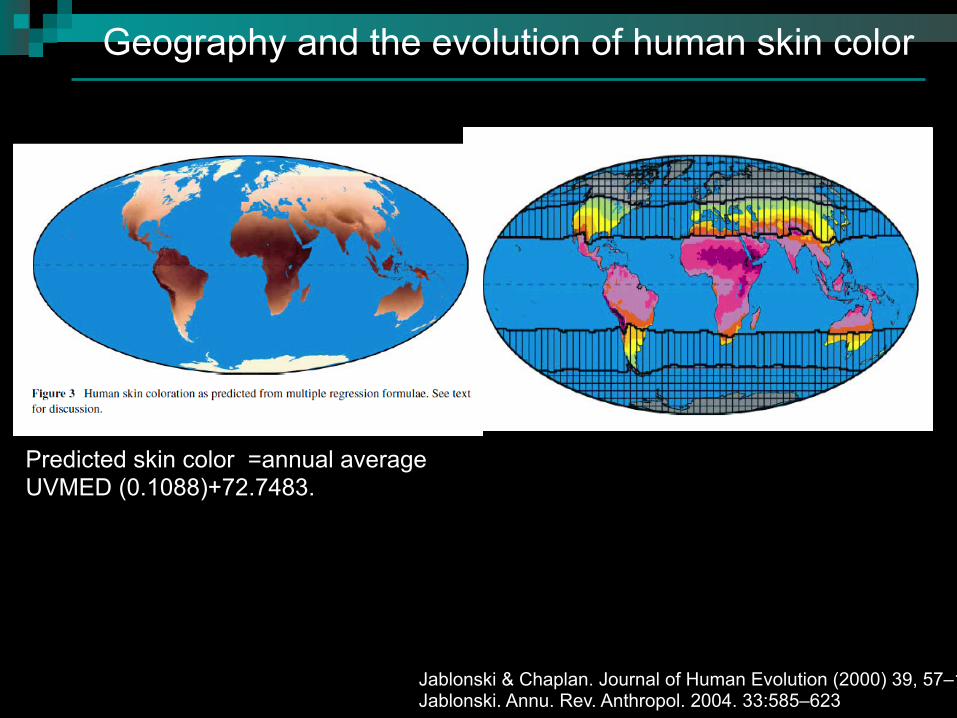
Geography and the evolution of human skin color
Jablonski & Chaplan. Journal of Human Evolution (2000) 39, 57–106 Jablonski. Annu. Rev. Anthropol. 2004. 33:585–623
Predicted skin color =annual average UVMED (0.1088)+72.7483.

Evolu?onary Histories and cause of death of death are oQen correlated
Ramos E and Rotimi C, BMC Medical Genomics, 2009

Most diseases and traits involve both environmental and gene3c components
0
20
40
60
80
100
120
140
160
180
200
A1
A4
A7
A10
A13
A16
A19
A22
A25
A28
A31
A34
A37
A40
Environmental component
Gene?c component
Nutri?on, Pathogens, Pollutants, Lifestyle & also other genes/SNPS

Era of GWAS
As of 03/02/14, the catalogue includes 1823 publica3ons and 12508 SNPs h/p://www.genome.gov/GWAStudies/

Moving beyond the genome …
The 2008 SNP Submissions for the James Watson Genome totaled
3,542,364
The 2008 SNP Submissions for the J. Craig Venter Genome totaled
4,018,050
The 2008 SNP Submissions for the Individual Chinese Genome totaled
5,077,954
The 2008 SNP Submissions for the Individual Korean Genome totaled
1,750,224

2001
DraQ Human genome
2007
First individual human genome
2009
1000 Genomes Project

Popula3ons in 1000 Genomes Phase 1
Why do we need to sequence so many popula?ons??

Ramos E and Rotimi C, BMC Medical Genomics, 2009
Journey of Homo sapiens
Khoisan
100 k years ago

Evolu3onary histories are strongly engraved in genomes
Ancestry Informa?ve Markers
SNPs specific to a popula?on
Allele frequencies of a large number of SNPs show
strong popula?on biases


1000 Genomes Projected popula?ons
Hapmap Hapmap 3 1000 Genomes
New popula?ons

STEPS

Structural Varia?ons SNP Calling

Formats

Trio project (Pilot II) Ø whole-‐genome shotgun sequencing at high coverage
(average 42X) of two families Ø one Yoruba from Ibadan, Nigeria (YRI) Ø one of European ancestry in Utah (CEU)
Ø Each trio includes two parents and one daughter. Each of the offspring was sequenced using three plarorms and by mul?ple centers.
Low-‐coverage project(Pilot I) Ø whole-‐genome shotgun sequencing at low
coverage (2–6X) of 1092 genomes from more that 10 popula?ons

Exon project(Pilot III) Ø targeted capture of 8,140 exons from 906
randomly selected genes (total of 1.4 Mb) followed by sequencing at high coverage (average 50X) in 697 individuals from 7 popula?ons of
Ø 1092 individuals from >10 popula?ons

Outcomes

What differs between individuals?
Ø 3-‐4,000,000 variants Ø 10-‐11,000 nonsynonymous
changes Ø 220-‐250 in-‐frame indels Ø 80-‐100 premature stop codons Ø 40-‐50 splice site disrup?ons Ø 50-‐100 HGMD “recessive
disease causing” muta?ons
How different is your genome from the reference Human genome?

De novo muta?on in trios
n 1001 muta?ons selected(CEU) ¨ 49 true germline muta?on ¨ Es?mated rate :1.2 X 10-‐8 ¨ Other 952 were either soma?c or
cell line muta?ons n 669 Muta?ons (YRI)
¨ 35 true germline muta?ons ¨ Es?mated rate 1.0 X 10-‐8 ¨ Other 634 were either soma?c or
cell line muta?ons
n Across the two trio offspring, a single, synonymous, coding germline muta?on was observed
What is new in me????

Revisi?ng Disease associa?on

Phase 3 Data
n African data ¨ ACB ¨ ASW ¨ ESN ¨ GWD ¨ LWK ¨ MSL ¨ YRI

n Asian ¨ BEB ¨ CDX ¨ CHB ¨ CHS ¨ GIH
ITU JPT KHV PJL STU

n American ¨ CLM ¨ MXL ¨ PEL ¨ PUR

n European ¨ CEU ¨ FIN ¨ GBR ¨ IBS ¨ TSI

Take home …. ü Measurement of human DNA important ü 1000 Genomes key project: provides
loca?on, allele frequency and local haplotype structure of approx 36M SNPs, 1M short dels, and 14k SVs, >50%
ü Expect contains 95% of the currently accessible variants
ü Each person has ~275 loss-‐of-‐func?on vars in annotated genes and 50-‐100 vars previously implicated in inherited disorders
ü rate of de novo germline base subs?tu?on muta?ons approxy 10-‐8 per bp per gen
ü More out there

Thank You

HapMap

Single nucleo3de polymorphisms (SNPs) n Most common gene?c variant n SNPs are used as markers to locate genes in DNA sequences -‐
useful in disease mapping n Tes?ng 12 million common SNPs would be extremely
expensive ¨ For a case-‐control study with 1,000 cases & 1,000 controls ¨ Genotype all DNAs for all SNPs ¨ That adds up to 24 billion genotypes ¨ Imagine, this approach cost 50 cents a genotype. ¨ That’s R12 billion for each disease – completely out of the ques3on!!

How HAPMAP could benefit human health
n Provide an extensive resource that researchers can use to discover the gene?c variants involved in disease and individual responses to therapeu?c agents
n Learn much more about the origins of illnesses and about ways to prevent, diagnose and treat
n Associa?on studies
n Customizable treatment, new therapies

GOAL OF HAPMAP
n The Interna?onal HapMap Project aims to iden?fy a large frac?on of the gene?c diversity in the human species
n Enable scien?sts to take advantage of how SNPs and other gene?c variants are organised on chromosomes ¨ Gene?c variants that are near each other tend to be inherited together.
¨ E.g. people who have an A rather than a G at a par?cular can have iden?cal gene?c variants at other SNPs in the chromosomal region surrounding the A.
¨ These regions of linked variants are known as haplotypes. This phenomenon is influenced by recombina?on & linkage disequilibrium

Recombina3on

Linkage Disequilibrium
n Origins of haplotypes ¨ The non-‐random associa?on between alleles in a popula?on
Low LD Linkage Equilibrium
2 SNPs = 4 Haplotypes
High LD
2 SNPs = 2 Haplotypes

Premise of HapMap

SNPs, Haplotypes & tagSNPs

SNPs, Haplotypes & tagSNPs
SNPs and haplotype blocks. (A) SNPs. Shown is a short stretch of DNA from four versions of the same chromosome region in different people. Most of the DNA sequence is identical in these chromosomes, but three bases are shown where variation occurs. Each SNP has two possible alleles; the first SNP in panel A has the alleles cytosine and thymine. (B) Haplotypes. A haplotype is made up of a particular combination of alleles at nearby SNPs. Shown here are the observed genotypes for 20 SNPs that extend across 6,000 bases of DNA. Only the variable bases are shown, which include the three SNPs that are shown in panel A. For this region, most of the chromosomes in a population survey turn out to have haplotypes 1-4. (C) Tag SNPs. Genotyping just the three tag SNPs out of the 20 SNPs is sufficient to identify these four haplotypes uniquely. For instance, if a particular chromosome has the pattern A-T-C at these three tag SNPs, this pattern matches the pattern determined for haplotype 1.

Haplotypes n SNPs that occur together suggests underlying structure to
genome n SNPs occurr in blocks of which there are common varie?es n ~65% to 85% of the human genome is organized in haplotypes n If blocks easily iden?fied could be important tool for studying
gene?c varia?on in rela?on to disease, drug response etc..

n Founded in 2002
n Par?cipa?ng ins?tu?ons and funding from Japan, UK, Canada, China, USA and Nigeria
n “ ...develop a haplotype map of the human genome, which will describe the common pa/erns of human DNA sequence varia?on”

Strategy
1. Recruit individuals that represent global diversity 2. Genotype SNPS for all individuals 3. Iden?fy chromosomal regions with groups of strongly
associated SNPs – haplotypes 4. Determine linkage disequilibrium between SNPs 5. Iden?fy tagSNPs for the haplotypes

Popula3ons sampled
n Yoruba people in Ibadan, Nigeria ¨ 30 both-‐parent-‐and-‐adult-‐child trios
n Japanese in Tokyo ¨ 45 unrelated individuals
n Han Chinese in Beijing ¨ 45 unrelated individuals
n The U.S. Utah residents of northern and western European ancestry ¨ 30 trios ¨ Residents with ancestry from Northern and Western Europe

Genotyping
n 11 Centers for typing: Canada, China, Japan, UK, USA n Genotyped at least one common SNP every 5 kb n The Phase I HapMap contained 1,007,329 SNPs that passed a
set of quality control filters ¨ SNPs at f > or = 0.05 MAF chosen
n The HapMap Project contributed ~6 million new SNPs to dbSNP ¨ In 2005 dbSNP contained 9.2 million candidate human SNPs, of which
3.6 million have been validated by both alleles having been seen two or more ?mes during discovery (‘double-‐hit’ SNPs), and 2.4 million have genotype data

Haplotyping
n Phased haplotypes were generated using the program PHASE version 2.0
n Each allele in a genotype is assigned to one or the other parental chromosome using computer algorithms
n The numbers and size of possible haplotypes are limited because of recombina?on events

Haplotype output
Nature 2005

LD Measures n D prime (D’)
¨ D’ is the difference between the expected and the observed haplotype frequency.
¨ D' (normalised LD) is the only measure of LD not sensi3ve to allele frequencies.
¨ A score of 1 = LD n R square (r2)
¨ The square of the correla?on coefficient r, a measure of the effect of X in reducing the uncertainty in predic?ng Y .
¨ Gives informa3on on sample size required to detect associa3on. ¨ A score of 1 = LD
n Likelihood of Odds (LOD) Score ¨ The logarithm of odds -‐ a sta?s?cal measure of the likelihood that two gene?c
markers occur together on the same chromosome and are inherited as a single unit of DNA (co-‐segrega?on).
¨ A score of >2 =LD

LD Plots
§ The triangle plot is constructed by connecting every pair of SNPs along lines at 45 degrees to the horizontal track line. § The colour of the diamond at the position that two SNPs intersect indicates the amount of LD: more intense colours indicate higher LD. § A grey diamond indicates missing data

LD AND tagSNPs
n Reduce the number of SNPs needed to genotype region (use few tagSNPs)
¨ High LD -‐ few SNPs sampled ¨ Low LD – more SNPs sampled

Interes3ng findings
A: Similarity of allele frequencies in CHB/JPT samples. § These were subsequently analyzed jointly
B: Iden?fica?on of recombina?on hot spots
§ 21,617 iden?fied recombina?on hotspots § ~1 per 122 kb

Interes3ng findings C: Haplotype sizes vary across popula?ons due to migra?onal history ¨ Haplotypes in non-‐African popula?ons tend to be longer than in African popula?ons
D: LD correlates to genomic features ¨ Areas of very high and very low LD have the highest density of genes ¨ LD low
n associated with immune and neuro-‐physiological genes ¨ LD elevated
n associated with cell cycle regulators, DNA damage responses, DNA/RNA metabolism.

HAPMAP – Phase Comparison Phase 1 Phase 2 Phase 3
Samples & POP panels
269 samples (4 panels)
270 samples (4 panels)
1,184 samples (11 panels)
Genotyping centers HapMap Interna?onal Consor?um
Perlegen
Broad & Sanger
Unique SNPs 1.1 M 3.8 M (phase I+II)
1.6 M (Affy 6.0 & Illumina 1M)
Sequence Data
-‐-‐-‐
-‐-‐-‐ Sequenced ten 100-‐kb regions (n=692)
Reference Nature (2005) 437:p1299-‐1320
Nature (2007) 449:p851-‐861
Nature (2010) 467: p52-‐58

Human Genome Diversity Project
Aim to collect wide range of human diversity — endogenous populations http://web.stanford.edu/group/rosenberglab/diversity.html

Key African Data Sets Publicly available
May et al, 2013. 10.1186/1471-2164-14-644. Black South Africans from Soweto Henn et al 2013. 10.1371/journal.pgen.1002397. North Africans. Pickrell et al. 2012. 10.1038/ncomms2140. Khoi-san data Schlebusch et al. 10.1126/science.1227721. Khoi-san, Coloured SA, “SW” and “SE” Bantu spearks

Other key data African Genome Variation Project genotyping 2.5 million genetic variants in 100 individuals each from over 10 ethnic groups across sub-Saharan Africa Other data not public Some key papers, data sets not available

HAPMAP Phase III
LABEL POPULATION SAMPLE # Samples
ASW African ancestry in Southwest USA 90
CEU Utah residents with Northern and Western European ancestry from the CEPH collection 180
CHB Han Chinese in Beijing, China 90
CHD Chinese in Metropolitan Denver, Colorado 100
GIH Gujarati Indians in Houston, Texas 100 JPT Japanese in Tokyo, Japan 91 LWK Luhya in Webuye, Kenya 100
MEX Mexican ancestry in Los Angeles, California 90
MKK Maasai in Kinyawa, Kenya 180 TSI Toscans in Italy 100 YRI Yoruba in Ibadan, Nigeria 180
1,301

HapMap 3 Samples
• 1,184 samples from diverse populations (N=11) • Individual and community consent for thorough genetic ascertainment (up to complete
resequencing) and public sharing of data on Internet

Interes3ng Outcomes n Of the SNPs iden?fied through sequencing, 77% were new
(i.e. not previously in dbSNP) and 99% of those had a MAF < 5% ¨ Reveal that many more variants remain to be found, especially rare variants
The International HapMap 3 Consortium, Nature Sept 2010; 467:52-58

Interes3ng Outcomes
n Confirmed that non-‐African diversity is largely a subset of African diversity
n African samples provided a more complete discovery resource for variant sites in non-‐African than the converse
n However, it does not work as well for rare variants ¨ Rare variants could likely be more NB in popula?on-‐specific contribu?ons to disease?
¨ Underscores the value of next-‐gen sequencing of whole genomes within various popula?ons to find rare variants that contribute to disease.
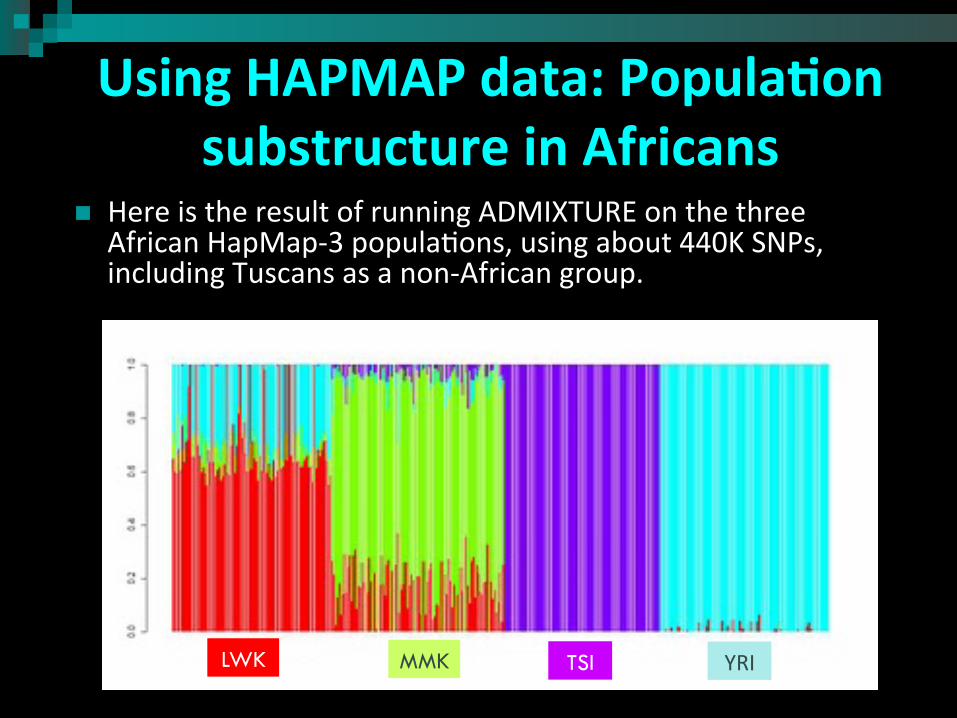
Using HAPMAP data: Popula3on substructure in Africans
n Here is the result of running ADMIXTURE on the three African HapMap-‐3 popula?ons, using about 440K SNPs, including Tuscans as a non-‐African group.
TSI YRI LWK MMK