Embed Size (px)
Citation preview

RMP
NOV 08
Sources, Pathways, and Loadings
Lester McKeeWatershed Program Manager
Chair: Sources, Pathways, and Loadings WorkgroupSan Francisco Estuary Institute
Richmond California
4911 Central Avenue, Richmond, CA 94804
1
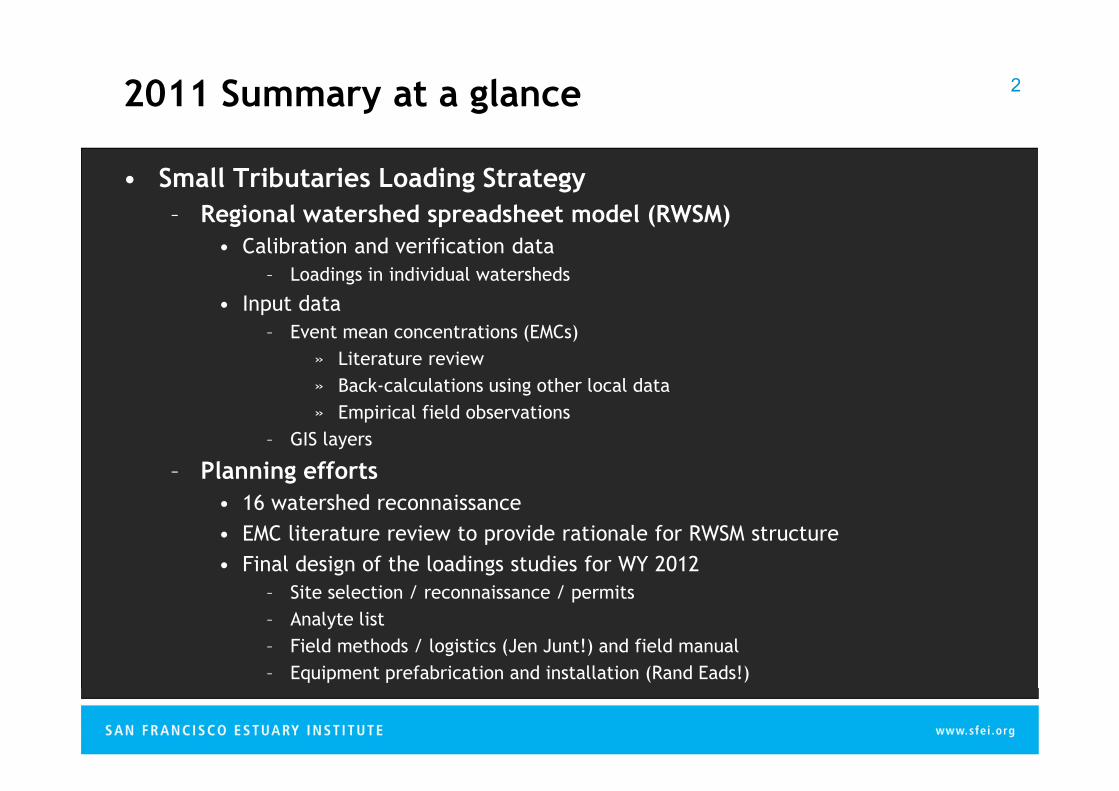
2011 Summary at a glance
• Small Tributaries Loading Strategy– Regional watershed spreadsheet model (RWSM)
• Calibration and verification data– Loadings in individual watersheds
• Input data– Event mean concentrations (EMCs)
» Literature review» Back-calculations using other local data» Empirical field observations
– GIS layers
– Planning efforts• 16 watershed reconnaissance• EMC literature review to provide rationale for RWSM structure• Final design of the loadings studies for WY 2012
– Site selection / reconnaissance / permits– Analyte list– Field methods / logistics (Jen Junt!) and field manual– Equipment prefabrication and installation (Rand Eads!)
2

2011 Summary at a glance – continued
• Technical reports– Mallard Island final report– Z4LA final report
• Linkages– Dioxins strategy – collected field data and presented congener profiles
and loadings (Sacramento River at Mallard Island; Guadalupe River at Hwy 101;Guadalupe River at Foxworthy (Almaden Expwy); Zone 4 Line at Cabot BLVD)
– Emerging contaminants• Erika Houtz, UCB student, PFC loads (PFOA/PFOS)• Pyrethriod pesticides, carbaryl and fipronyl
– Nutrients• The Y1 results of the hydrology component used for new nutrient loads estimate
• Other SFEI projects (enhanced by and enhance the RMP)– LID projects (Daly city, El Cerrito, Fremont) (analyte list includes PCBs, Hg, others)
– Richmond pump station (analyte list includes PCBs, Hg and dioxins, others)
– Alameda geomorphology projects (support for improvements to regional sediment loads)
3

Small Tributaries Loading Strategy• STLS framework document Multi-year
plan (MYP) Version “2011” completed
– Largely lead by Arleen Feng /BASMAA but supported bySFEI/RMP staff
• Edited and wrote components ofthe main text
• Provided content for appendices– Appendix B: RWSM Construction and calibration– Appendix C: Optimizing sampling methods for loads/ trends– Appendix D: Exploratory watersheds characterization– Appendix E: WY 2011 Watershed Characterization Field Study
– Submitted to the Water Board in September
MQ1:Contributions to
Impairment
MQ2:Bay-wide Loads
MQ3:Trends
MQ4:ManagementEffectiveness
WatershedSpreadsheet
Model
(Element 1A)
Bay - MarginsModel
(Element 1B)
MonitorRepresentative
Set ofWatersheds
(Element 3A)
MonitorDownstream ofManagement
Actions
(Element 3B)
MonitorSourceAreas
(Element 2)
4

RWSM
• Objective– Improve regional average annual estimates of suspended
sediment and contaminant loads• Support prioritization and management of “high leverage”
watersheds in relation to sensitive areas of the Bay margin• Provide input into food web models of the Bay
• Progress– 2010 – base hydrology model and initial contaminant
models – Y1 report– 2011 – improved hydrology model + model
documentation
5

Runoff Coefficient Rainfall Runoffx =
by % impervious
by land use type
x
x
=
=
Approach 1
Approach 2
Tested two approaches to Rainfall-RunoffModel…
6

Hydrologic Results
0% 100%-100%
Original ICM (0.9, 0.05)
Land Use Model (Rantz)
Land Use Model (Browne)
Land Use Model (Calib. Browne w/ rock)
Range of annual flow volume results shown for 18 watersheds
% Diff. between Sim. & Obs.
Calib. ICM (0.45, 0.25) w/ rock
-42% +46%
+66%-48%
-75% +70%New model (ABAG 2005 with LU++)(consistent resolution refined definitionsImproved calibration data)
7

WY 2011 16-watershedsreconnaissance• 1-2 storms for each
site
• 4-7 samples per site(PCBs, HgT, SSC, TOC,PBDEs, PAHs, SeT,SeD)
• Manual turbidity andstage data
8

SeT• Range 0.2 to 6 ug/L• Surprising tight
relationship toturbidity
• The very urban SantaFe Channel had asexpected lowerconcentrations thanthe other two largerand open-spacedominatedwatersheds by aboutan order ofmagnitude.
9

PCB Data (pending final QA) 10

Results Summary
WatershedPCB/Turb AvgRatio (pg/NTU)
HgT/SSC Avg Ratio(ng/mg) PCB Rank
HgRank Rank Sum
Guadalupe River 1883 4.7 2 1 3Santa Fe 2882 0.68 1 5 6Ettie St 1094 0.78 3 4 7Pulgas South 639 0.83 5 2 7Pulgas North 822 0.47 4 6 10San Leandro 98 0.8 8 3 11Glen Echo 420 0.41 6 7 13Sunnyvale Channel 369 0.34 7 9 16Z5LM 85 0.4 9 8 17San Lorenzo 74 0.28 10 10 20Stevens 30 0.26 11 12 23San Tomas 20 0.27 13 11 24Calabazas 29 0.16 12 16 28Belmont 15 0.24 17 13 30Lower Penetencia 20 0.16 14 17 31Borel 17 0.17 16 15 31Walnut 18 0.1 15 18 33Lower Marsh 4 0.2 18 14 34
11

Mallard Island / Z4LA FINAL reports
• e.g. the loads table forZ4LA
• Table for Mallard Is. lookssimilar but fewer analytes
12
Min Max Min MaxSSC mg/l 1.4 299 8.0 2,744 166Aluminum µg/l 66 982 940 11,337 1,840Arsenic µg/l 1.0 3.2 0.68 2.8 1.2Cadmium µg/l 0.01 0.20 0.11 0.67 0.22Chromium µg/l 0.57 3.3 4.0 39.2 5.8Copper µg/l 2.3 10.4 6.9 50.0 14.4Copper - Dissolved µg/l 5.9 5.9 1.4 10.9 pilot dataIron µg/l 27 252 2,415 75,000 7,687Lead µg/l 0.18 4.6 4.5 40.1 10.3Nickel µg/l 3.3 10.0 5.1 60.0 10.3Selenium µg/l 0.11 2.9 0.053 1.2 0.14Selenium(IV) µg/l NS NS 0.027 0.027 pilot dataSelenium(VI) µg/l NS NS 0.027 0.085 pilot dataSelenium - Dissolved µg/l NS NS 0.041 0.10 pilot dataSilver µg/l 0.020 0.020 0.020 0.11 0.032Zinc µg/l 2.4 62 39 284 91DOC µg/l 2.0 7,460 107 12,000 4,423POC µg/l 150 1,239 60 16,200 7,004TOC µg/l 3,390 9,431 3,950 22,541 11,608Total Nitrogen - Dissolved mg/l NS NS 0.31 1.3 0.42Total Phosphorous - Dissolved mg/l NS NS 0.038 0.23 0.069NO3+NO2 - Dissolved mg/l NS NS 0.012 0.67 0.091PO4 - Dissolved mg/l NS NS 0.024 0.24 0.063Ammonium - Dissolved mg/l NS NS 0.056 0.17 0.080Sum of PCBs ng/l 0.33 11.0 4.0 109 15.9Sum of Dioxins and Furans pg/l 226 226 977 6,254 3,579Sum of PBDEs ng/l 0.35 24.9 9.4 425 50.3BDE 47 ng/l 0.11 2.5 0.75 19.6 3.1BDE 209 ng/l 0.58 13.6 5.0 241 29.2Sum of PAHs ng/l 13.9 1,415 1,395 22,640 6,392Sum of DDTs ng/l 0.41 7.4 5.1 59.5 15.4Sum of Chlordanes ng/l 0.35 6.4 2.5 16.4 6.7Sum of HCHs ng/l 0.087 0.40 0.30 0.89 0.40Dieldrin ng/l 0.28 0.85 0.74 4.6 1.4Bifenthrin ng/l 0.18 11.8 2.2 46.3 22.0Delta/Tralomethrin ng/l 0.64 0.64 0.46 5.5 2.9Permethrin ng/l 1.6 25.6 4.6 285 89
Low Flow (<0.05 CMS) Storm Flow (>= 0.05 CMS) 4 Year AverageFWMCAnalyte Unit

2012 loads studies
• 4 watersheds• 3 years• 4 storms per year per watershed• A 1st flush; a large storm, and 2 others• Hybrid POC sampling approach
– 6712 ISCO – composite and discrete sample collection– D95 – total mercury and total methylmercury– DH84 – total methylmercury wading stage
• Continuous turbidity and stage measurements• Manual discharge measurements
13

Analytes and collection method
• Note – Guadalupe will be all manual this year due to permit delays– Turbidity surrogate / USGS flow– D95 / composites completed by staff also (with great effort)
Sample MethodDiscrete orComposite Analysis
SampleNumber
Manual ISCO Discrete PCBs (40) 18Manual ISCO Discrete PAH 4Manual ISCO Discrete PBDE 4Manual ISCO Discrete SSC (GMA) 17Manual ISCO Discrete TOC 18Manual ISCO Discrete Total Phosphorous 18
Manual ISCO Discrete Dissolved phosphorus and Nitrate as N 18Manual ISCO Discrete SSC (GMA) 17
Automated ISCO Composite Toxicity – water column 4Automated ISCO Composite Pyrethoids** 6Automated ISCO Composite Carbaryl 6Automated ISCO Composite Fipronil 6Automated ISCO Composite Total Cu and Total Se and Hardness 6Automated ISCO Composite Dissolved Cu and Dissolved Se 6Automated ISCO Composite SSC 6
Manual Grab Discrete Total methylmercury 10Manual Grab Discrete Total Mercury 18Manual Grab Discrete SSC 19
14
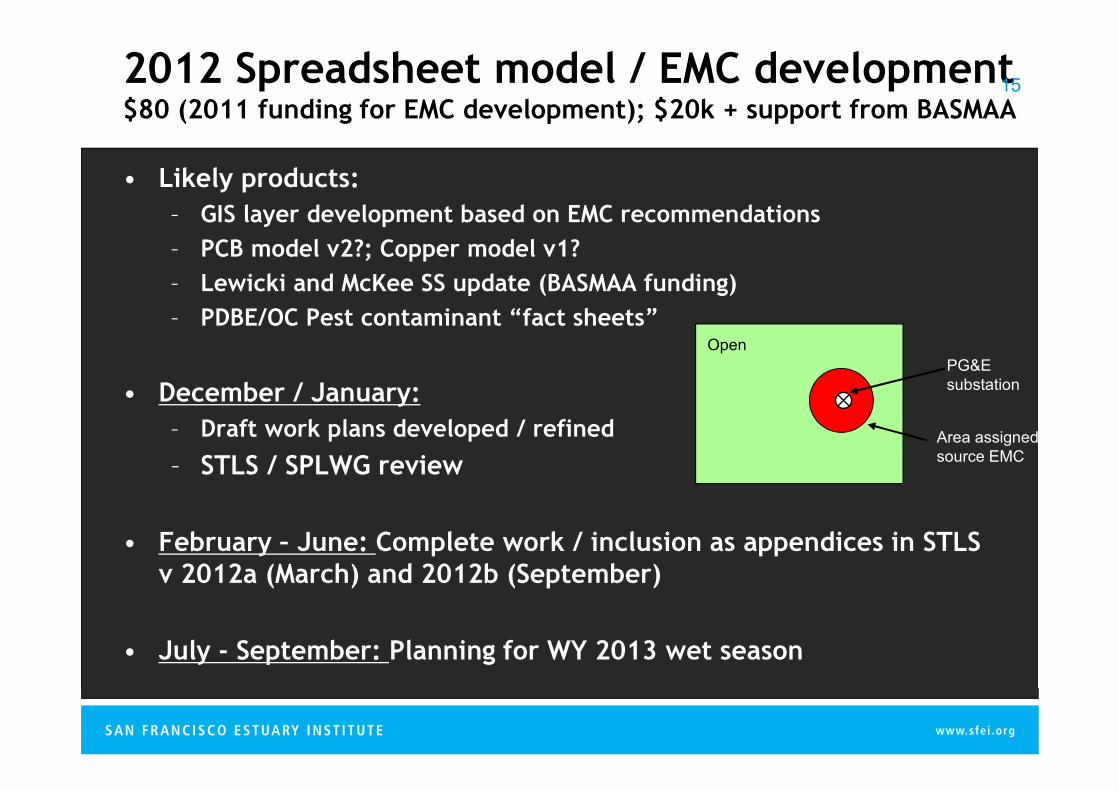
2012 Spreadsheet model / EMC development$80 (2011 funding for EMC development); $20k + support from BASMAA
• Likely products:– GIS layer development based on EMC recommendations– PCB model v2?; Copper model v1?– Lewicki and McKee SS update (BASMAA funding)– PDBE/OC Pest contaminant “fact sheets”
• December / January:– Draft work plans developed / refined
– STLS / SPLWG review
• February – June: Complete work / inclusion as appendices in STLSv 2012a (March) and 2012b (September)
• July - September: Planning for WY 2013 wet season
PG&Esubstation
Open
Area assignedsource EMC
15

2013 possibilities / options
• EMC development depending on 2012 results– Field studies to fill data gaps ($~40k 2011 budget; further TRC
approved budget $100k?)– Further desktop work (e.g. back calculations from regional/ world
data)– Combination?
• Municipal Regional Permit (MRP) calls for 2 more loadings studies(or equivalent effort)– Implement in two more selected watersheds
• Existing reconnaissance data• Sediment / soil results from CW4CB project• Targeted towards addressing source areas identified through the EMC lit.rev.
contaminants “fact sheets”
– One loads study / more reconnaissance or EMC field study
16