Embed Size (px)
Citation preview
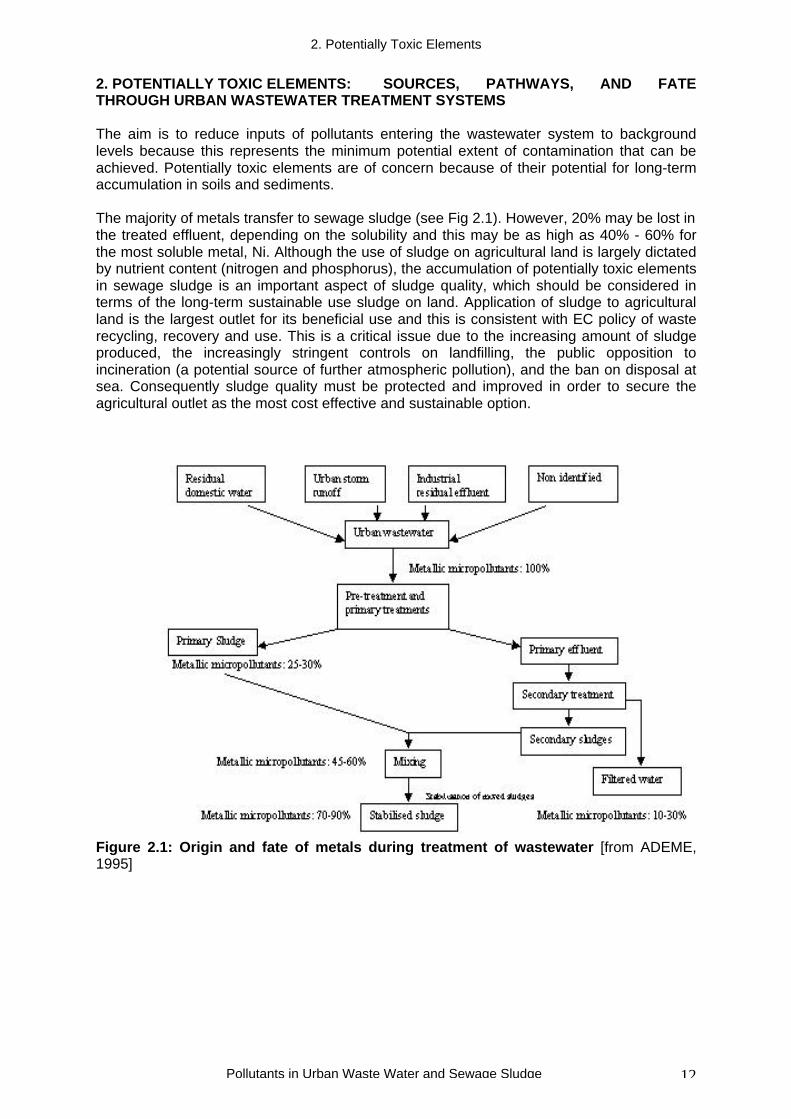
2. Potentially Toxic Elements
Pollutants in Urban Waste Water and Sewage Sludge 12
2. POTENTIALLY TOXIC ELEMENTS: SOURCES, PATHWAYS, AND FATETHROUGH URBAN WASTEWATER TREATMENT SYSTEMS
The aim is to reduce inputs of pollutants entering the wastewater system to backgroundlevels because this represents the minimum potential extent of contamination that can beachieved. Potentially toxic elements are of concern because of their potential for long-termaccumulation in soils and sediments.
The majority of metals transfer to sewage sludge (see Fig 2.1). However, 20% may be lost inthe treated effluent, depending on the solubility and this may be as high as 40% - 60% forthe most soluble metal, Ni. Although the use of sludge on agricultural land is largely dictatedby nutrient content (nitrogen and phosphorus), the accumulation of potentially toxic elementsin sewage sludge is an important aspect of sludge quality, which should be considered interms of the long-term sustainable use sludge on land. Application of sludge to agriculturalland is the largest outlet for its beneficial use and this is consistent with EC policy of wasterecycling, recovery and use. This is a critical issue due to the increasing amount of sludgeproduced, the increasingly stringent controls on landfilling, the public opposition toincineration (a potential source of further atmospheric pollution), and the ban on disposal atsea. Consequently sludge quality must be protected and improved in order to secure theagricultural outlet as the most cost effective and sustainable option.
Figure 2.1: Origin and fate of metals during treatment of wastewater [from ADEME,1995]
2. Potentially Toxic Elements
Pollutants in Urban Waste Water and Sewage Sludge 13
2.1. Sources and pathways of potentially toxic elements in UWW
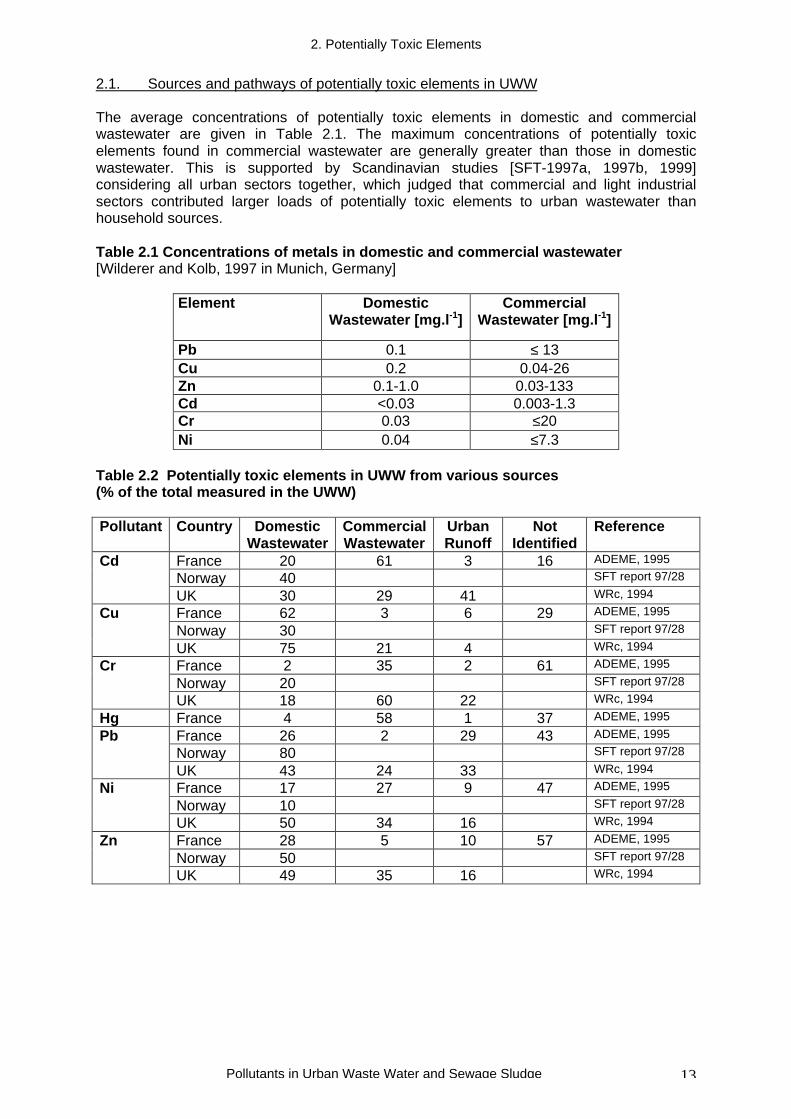
The average concentrations of potentially toxic elements in domestic and commercialwastewater are given in Table 2.1. The maximum concentrations of potentially toxicelements found in commercial wastewater are generally greater than those in domesticwastewater. This is supported by Scandinavian studies [SFT-1997a, 1997b, 1999]considering all urban sectors together, which judged that commercial and light industrialsectors contributed larger loads of potentially toxic elements to urban wastewater thanhousehold sources.
Table 2.1 Concentrations of metals in domestic and commercial wastewater[Wilderer and Kolb, 1997 in Munich, Germany]
Element DomesticWastewater [mg.l-1]
CommercialWastewater [mg.l-1]
Pb 0.1 ≤ 13Cu 0.2 0.04-26Zn 0.1-1.0 0.03-133Cd <0.03 0.003-1.3Cr 0.03 ≤20Ni 0.04 ≤7.3
Table 2.2 Potentially toxic elements in UWW from various sources(% of the total measured in the UWW)
Pollutant Country DomesticWastewater
CommercialWastewater
UrbanRunoff
NotIdentified
Reference
France 20 61 3 16 ADEME, 1995
Norway 40 SFT report 97/28Cd
UK 30 29 41 WRc, 1994
France 62 3 6 29 ADEME, 1995
Norway 30 SFT report 97/28Cu
UK 75 21 4 WRc, 1994
France 2 35 2 61 ADEME, 1995
Norway 20 SFT report 97/28Cr
UK 18 60 22 WRc, 1994
Hg France 4 58 1 37 ADEME, 1995
France 26 2 29 43 ADEME, 1995
Norway 80 SFT report 97/28Pb
UK 43 24 33 WRc, 1994
France 17 27 9 47 ADEME, 1995
Norway 10 SFT report 97/28Ni
UK 50 34 16 WRc, 1994
France 28 5 10 57 ADEME, 1995
Norway 50 SFT report 97/28Zn
UK 49 35 16 WRc, 1994
2. Potentially Toxic Elements
Pollutants in Urban Waste Water and Sewage Sludge 14
Cd distribution
DomesticStorm eventsCommercialNon Identified
Cu distribution
DomesticStorm eventsCommercialNon Identified
Cr distribution
DomesticStorm eventsCommercialNon Identified
Hg distribution
DomesticStorm eventsCommercialNon Identified
Pb distribution
DomesticStorm eventsCommercialNon Identified
Ni distribution
DomesticStorm eventsCommercialNon Identified
Zn distribution
DomesticStorm eventsCommercialNon Identified
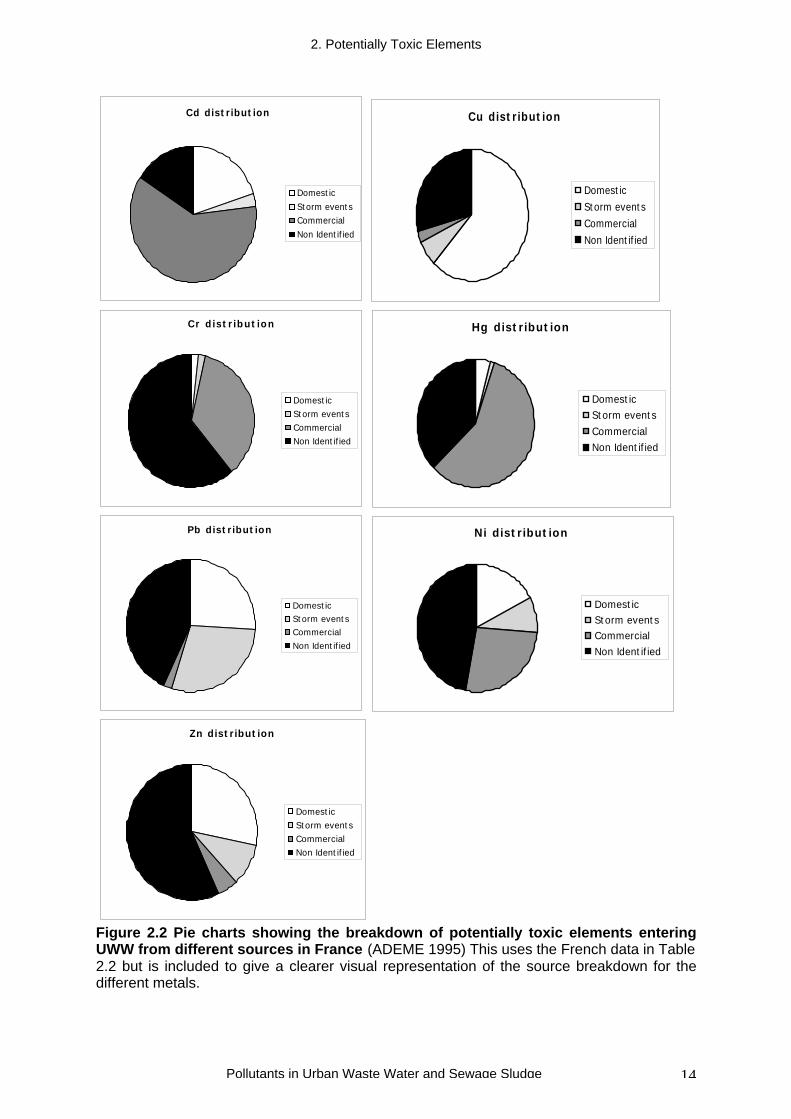
Figure 2.2 Pie charts showing the breakdown of potentially toxic elements enteringUWW from different sources in France (ADEME 1995) This uses the French data in Table2.2 but is included to give a clearer visual representation of the source breakdown for thedifferent metals.
2. Potentially Toxic Elements
Pollutants in Urban Waste Water and Sewage Sludge 15
The data in Table 2.2 and Figure 2.2 show that for some elements over 50% of thepotentially toxic elements in wastewater are unaccounted for. This is in line with findings byCritchley & Agy [1994] Better source inventory data is essential in order to effectively targetreductions in emissions from all the different sources. It may be that identification of some ofthe industrial sources will require increased trade effluent discharge controls ifconcentrations of pollutants are to be reduced. Domestic and urban run-off sources mayrequire different types of action, such as changes in products used.
Emissions of potentially toxic elements from industrial point sources were the major sourcesof pollution to urban wastewater. However, stringent and more widespread limits applied toindustrial users has reduced the levels of potentially toxic elements emitted by industry intourban wastewater considerably. This continues a general decline of potentially toxicelements from industrial sources since the 1960s, due to factors such as cleaner industrialprocesses, trade effluent controls and heavy industry recession. For example, the liquidsused in metal finishing typically contain 3-5 mg.l-1 of copper, 5-10 mg.l-1 of chromium, 3-5mg.l-1 of zinc, 5-10 mg.l-1 of zinc, 1-5 mg.l-1 of cyanide, and 10-50 mg.l-1 of suspended solids[Barnes, 1987]. However, metal finishing industries are now required to pre-treat theseliquids before disposal, reducing toxic discharges by 80-90%.
In the Netherlands, a survey of potentially toxic element load in UWW influent [SPEED,1993], also made estimations for 1995 and forecasts up to 2010. The overall prevalence ofpotentially toxic elements in the UWW system is expected to decrease, mainly due to adecrease in runoff and industrial sources, while the potentially toxic elements share inWWTS loads from households was expected to increase. As industrial sources of potentiallytoxic elements in UWW decline, the relevant importance of diffuse sources will increase.
Wiart and Reveillere [1995] carried out studies at the Achères WWTS in France. Theirstudies showed a significant decrease (50-90%) in the potentially toxic element content ofsewage sludge since 1978, following the application of the "at-source discharge reduction"policy [Bebin, 1997]. However, the main concern is now with organic pollutants, and currentregulations require monitoring of the influent, in order to set up a baseline database fromwhich limits may then be devised.
2. Potentially Toxic Elements
Pollutants in Urban Waste Water and Sewage Sludge 16
2.1.1 Domestic sources
Domestic sources of potentially toxic elements in wastewater are rarely quantified due to thedifficulty in isolating them. Domestic sources include the potentially toxic elementsdischarged from the household to UWW collecting systems and, in addition, corrosion frommaterials used in distribution and plumbing networks, tap water and detergents.
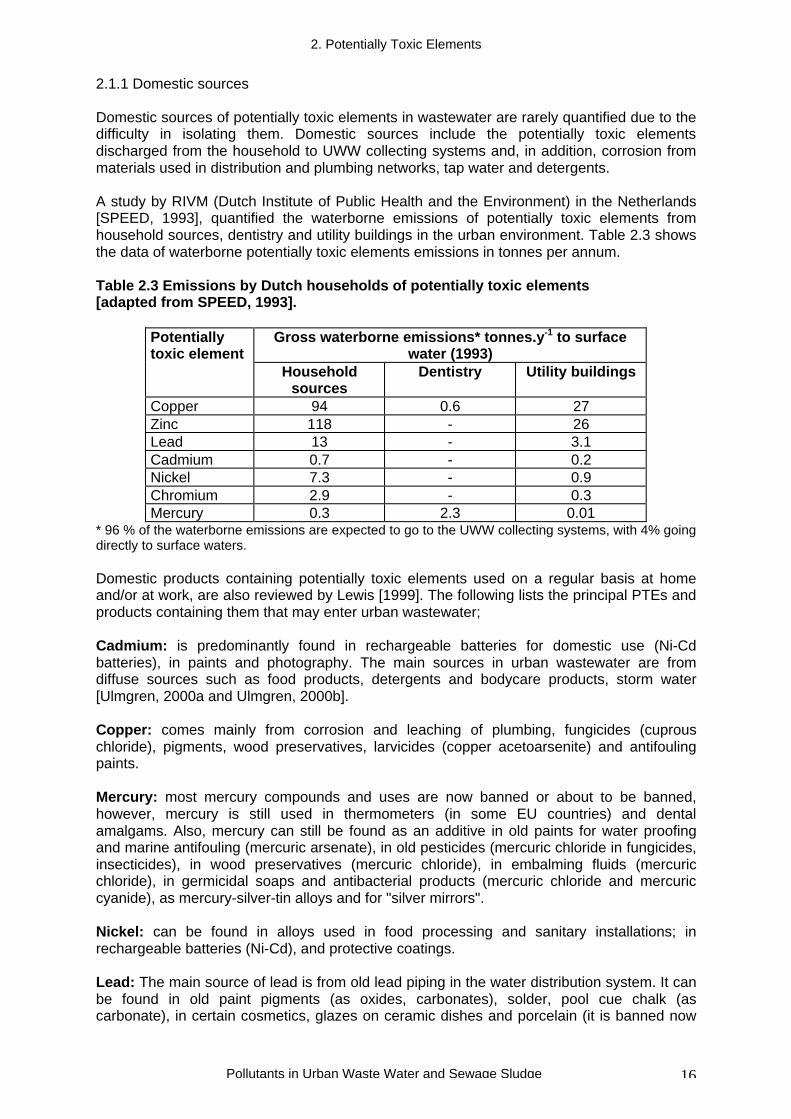
A study by RIVM (Dutch Institute of Public Health and the Environment) in the Netherlands[SPEED, 1993], quantified the waterborne emissions of potentially toxic elements fromhousehold sources, dentistry and utility buildings in the urban environment. Table 2.3 showsthe data of waterborne potentially toxic elements emissions in tonnes per annum.
Table 2.3 Emissions by Dutch households of potentially toxic elements[adapted from SPEED, 1993].
Gross waterborne emissions* tonnes.y-1 to surfacewater (1993)
Potentiallytoxic element
Householdsources
Dentistry Utility buildings
Copper 94 0.6 27Zinc 118 - 26Lead 13 - 3.1Cadmium 0.7 - 0.2Nickel 7.3 - 0.9Chromium 2.9 - 0.3Mercury 0.3 2.3 0.01
* 96 % of the waterborne emissions are expected to go to the UWW collecting systems, with 4% goingdirectly to surface waters.
Domestic products containing potentially toxic elements used on a regular basis at homeand/or at work, are also reviewed by Lewis [1999]. The following lists the principal PTEs andproducts containing them that may enter urban wastewater;
Cadmium: is predominantly found in rechargeable batteries for domestic use (Ni-Cdbatteries), in paints and photography. The main sources in urban wastewater are fromdiffuse sources such as food products, detergents and bodycare products, storm water[Ulmgren, 2000a and Ulmgren, 2000b].
Copper: comes mainly from corrosion and leaching of plumbing, fungicides (cuprouschloride), pigments, wood preservatives, larvicides (copper acetoarsenite) and antifoulingpaints.
Mercury: most mercury compounds and uses are now banned or about to be banned,however, mercury is still used in thermometers (in some EU countries) and dentalamalgams. Also, mercury can still be found as an additive in old paints for water proofingand marine antifouling (mercuric arsenate), in old pesticides (mercuric chloride in fungicides,insecticides), in wood preservatives (mercuric chloride), in embalming fluids (mercuricchloride), in germicidal soaps and antibacterial products (mercuric chloride and mercuriccyanide), as mercury-silver-tin alloys and for "silver mirrors".
Nickel: can be found in alloys used in food processing and sanitary installations; inrechargeable batteries (Ni-Cd), and protective coatings.
Lead: The main source of lead is from old lead piping in the water distribution system. It canbe found in old paint pigments (as oxides, carbonates), solder, pool cue chalk (ascarbonate), in certain cosmetics, glazes on ceramic dishes and porcelain (it is banned now
2. Potentially Toxic Elements
Pollutants in Urban Waste Water and Sewage Sludge 17
for uses in glazes), also in "crystal glass". Lead has also been found in wines, possibly fromthe lead-tin capsules used on bottles and from old wine processing installations.
Zinc: comes from corrosion and leaching of plumbing, water-proofing products (zincformate, zinc oxide), anti-pest products (zinc arsenate - in insecticides, zinc dithioamine asfungicide, rat poison, rabbit and deer repellents, zinc fluorosilicate as anti-moth agent), woodpreservatives (as zinc arsenate), deodorants and cosmetics (as zinc chloride and zincoxide), medicines and ointments (zinc chloride and oxide as astringent and antiseptic, zincformate as antiseptic), paints and pigments (zinc oxide, zinc carbonate, zinc sulphide),printing inks and artists paints (zinc oxide and carbonate), colouring agent in variousformulations (zinc oxide), a UV absorbent agent in various formulations (zinc oxide), "healthsupplements" (as zinc ascorbate or zinc oxide).
Silver: originates mainly from small scale photography, household products such aspolishes, domestic water treatment devices, etc. [Shafer, et.al, 1998, Adams and Kramer,1999]
Arsenic and Selenium: are among the potentially toxic metalloids found in urbanwastewaters. These are of importance due to their potential effects on human/animal health.Only a limited number of studies have taken these into account. Arsenic inputs come fromnatural background sources and from household products such as washing products,medicines, garden products, wood preservatives, old paints and pigments. Selenium comesfrom food products and food supplements, shampoos and other cosmetics, old paints andpigments. Arsenic is present mainly as DMAA (dimethylarsinic acid) and as As (III) (arsenite)in urban effluents and sewage sludge [Carbonell-Barrachina et.al., 2000].
2. Potentially Toxic Elements
Pollutants in Urban Waste Water and Sewage Sludge 18
Household products
Household products were investigated as potential sources of PTE pollution entering theWWTS. Table 2.4 shows metal concentrations in various household products in UKTable 2.4 Metal concentrations in household products[Comber and Gunn, 1996, WRc report, 1994].
Product Zinc(µg g-1)
Copper(µg g-1)
Cadmium(µg g-1)
Nickel(µg g-1)
Washing Powders‘Big Box’
abc
37.935.93.3
1.4<0.5<0.5
74.3136.0
6.6
<0.5<0.5<0.5
Washing Powders ‘Ultra’ abc
<0.12.31.0
<0.51.401.38
24.010.611.8
<0.5<0.5<0.5
Fabric Conditioners abc
0.1<0.10.1
<0.5<0.5<0.5
9.49.0
10.7
0.6<0.5<0.5
Hair Conditioners abcd
<0.11.01.70.5
<0.51.4
<0.51.4
16.817.28.6
68.0
<0.5<0.5<0.51.0
Cleaners ab
0.3<0.1
2.8<0.5
26.017.8
<0.5<0.5
Shampoo (medicated) a 4900 1.4 17.4 <0.5Washing Up Liquid a 0.2 1.1 11.0 0.8Bubble bath a
b0.2
<0.1<0.51.4
13.610.4
<0.5
As can be seen from Table 2.4 there is a great deal of variability between products and alsobetween types of the same products in terms of potentially toxic element content.
The high variability of cadmium concentrations found in the big box washing powders can beexplained by the differences in the composition of phosphate ores used in their production.Cadmium impurities in these phosphate ores have been shown to vary greatly depending onmining source [Hutton et al reported in WRc report 1994]. Reducing the amount ofphosphate in washing powders, or choosing phosphate ores with low Cd concentration couldlead to a reduction in Cd in wastewater from diffuse sources. In Sweden the amount ofcadmium in sewage sludge was reduced from 2 mg kg-1 ds to 0.75 mg kg-1 ds [Ulmgren,1999], and cadmium discharges from households in the Netherlands have been substantiallyreduced due to the switch to phosphate-free detergents [SPEED, 1993]. The 'Ultra' washingpowders, usually phosphate-free, have smaller potentially toxic element contents than thetraditional powders, and are designed to be used in smaller quantities. A shift to these newerproducts will reduce the overall metal load from this source.
The products with the highest metal contents are shown in bold in Table 2.4. The medicated(anti-dandruff) shampoos contain zinc pyrithione and the high zinc concentrations will thusraise the zinc inputs to the UWW collecting system. In 1991 these shampoos were estimatedto represent 26% of the market [*BLA Group 1991- reported in Comber and Gunn 1996 andWRc 1994]. Cosmetics are not included here but they may also contain high levels of zincand several of these products are likely, at least in part, to enter in the waste water system.One study in France [ADEME, 1995a] identified that the main sources of potentially toxicelements in domestic wastewater came from cosmetic products, medicines, cleaningproducts and liquid wastes (including paint), which were directly discharged from thehousehold sink.
2. Potentially Toxic Elements
Pollutants in Urban Waste Water and Sewage Sludge 19
Table 2.5 provides a general picture of some of the potentially toxic elements in variousdomestic products including food products [after Lester, 1987 and WRc report 1994].Sources for each metal are marked with a tick. In addition to the main metals considered inthis study, cadmium, chromium (III and VI), copper, mercury, nickel, lead and zinc, silver,arsenic, selenium and cobalt are also included. Other metals and metalloids for which moreinformation is necessary include manganese, molybdenum, vanadium, antimony and tin.
TABLE 2.5 Domestic sources of potentially toxic elements in urban wastewater[modified from Lester, 1987, and WRc, 1994]Product type Ag As Cd Co Cr Cu Hg Ni Pb Se ZnAmalgam fillingsand thermometers
√
Cleaning products √ √Cosmetics,shampoos
√ √ √ √ √ √ √
Disinfectants √Fire extinguishers √Fuels √ √ √ √Inks √ √Lubricants √ √ √Medicines andOintments
√ √ √ √ √
Health supplements √ √ √ √ √Food products √ √ √ √ √Oils and lubricants √ √ √ √Paints andpigments
√ √ √ √ √ √ √ √ √ √
Photographic(hobby)
√ √ √
Polish √ √ √Pesticides andgardening products
√ √ √ √ √
Washing powders √ √ √Wood-preservatives
√ √ √
Other sources
Faeces and Urine √ √ √ √ √ √ √ √ √Tap Water √ √ √ √ √Water treatmentand heatingsystems
√ √ √ √ √
Domestic activities
The main domestic sources of potentially toxic elements in wastewater were estimated byWRc [1994] to be (in order of importance):cadmium: faeces > bath water > laundry > tap water > kitchenchromium: laundry > kitchen > faeces > bath water > tap watercopper: faeces > plumbing >tap water > laundry > kitchenlead: plumbing > bath water > tap water > laundry > faeces > kitchennickel: faeces > bath water > laundry > tap water > kitchenzinc: faeces > plumbing > tap water > laundry > kitchen.
2. Potentially Toxic Elements
Pollutants in Urban Waste Water and Sewage Sludge 20
Estimates of the mean potentially toxic element inputs to UWW collecting systems fromdomestic activities are presented in Table 2.6. The results show that for the particular UK(hard water) catchment studied in 1994, the domestic inputs of copper and zinc are majorcontributors to the overall level of potentially toxic elements reaching the WWTS. Most of thezinc is derived from faeces and household activities such as washing and cleaning.Chromium, lead and cadmium were also found to be mainly from domestic activities ratherthan from plumbing.
Table 2.6 Potentially toxic element loads to the UWW collecting systems fromdomestic activities [adapted from Comber and Gunn, 1996]
Load (µg.person-1.day-1)Activity (study in a hardwater catchment area) Zn Cu Pb Cd Ni CrWashing Machine Input Water
Washing6624452
6859977
36.0515
0.611
2752
4238
Dishwashing(machine)
Input WaterWashing
3942
698
2.96
0.031.3
22
0.310
Dishwashing(hand)
Input WaterWashing
5911010
6125<20
3246
0.57.8
24138
3.7136.7
Bathing Input WaterBathing
11401095
1065167
4645
1.013.1
409
5.97.4
Toilet Input WaterFaeces
253111400
80822104
63121
2.048.0
77284
8.551.5
Miscellaneous Input Water 1453 6951 62.7 1.2 54 7.0
Predicted Total 24416 41894 978 86 710 464.2Measured mean fromhousing estates
CatchmentPopulation
50 000
15314 46772 1237 71 925 686
Predicted load to UWWcollecting systems fromdomestic sources (kg/day)
1.2 2.1 0.05 0.01 0.04 0.02
Measured mean total load tothe WWTS kg per day
2.6 3.3 0.3 N/A 0.1 0.15
% of potentially toxicelements from domesticsources in the UK
46.0 64.2 16.9 N/A 25.7 15.3
Based on the above results, changes in population behaviour, such as a shift to dishwasheruse rather than washing up by hand, would reduce potentially toxic element input into theWWTS.
It is noted that, while the quantities of potentially toxic elements dissolved in water fromplumbing will vary across the Europe they will make up a significant proportion of thepotentially toxic element loading going to any WWTS.
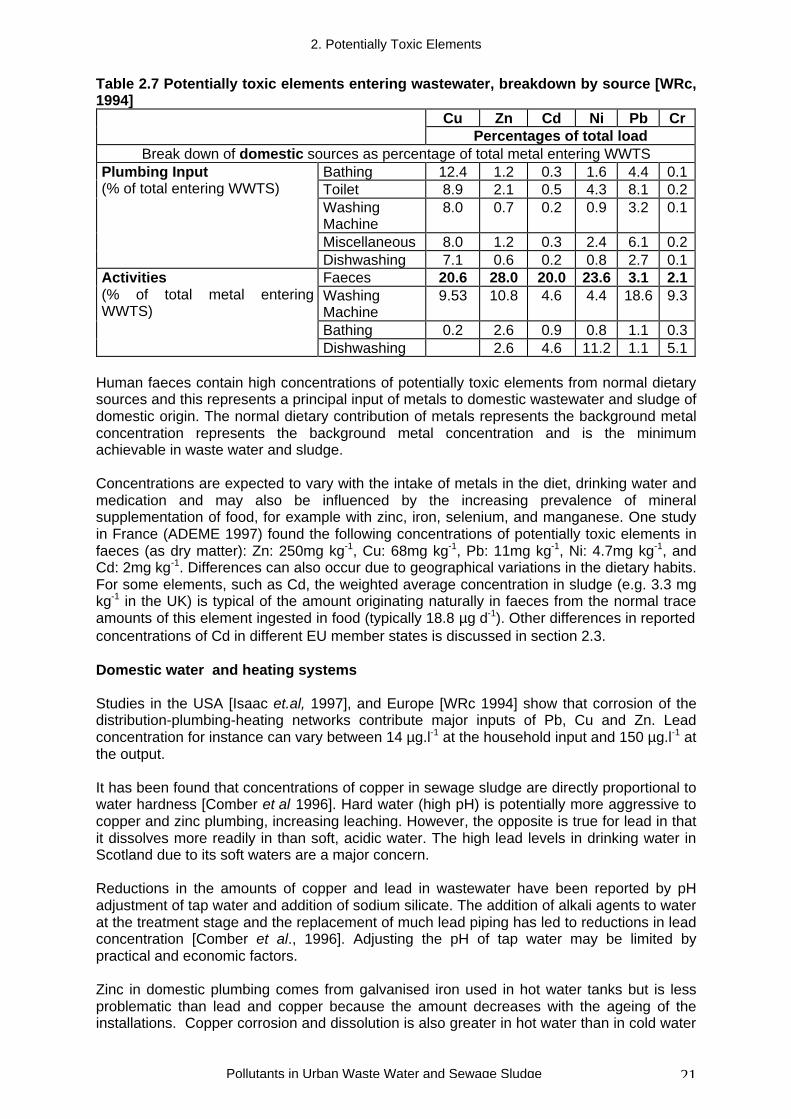
Table 2.7 summarises the percentages of the domestic inputs at the Shrewsbury WWTS, inthe UK. As can be seen over a fifth of the copper, zinc, cadmium and nickel entering thewastewater treatment plant from domestic sources are from faeces. This emphasises thefact that faeces are an important source of potentially toxic elements pollution. This source isalso very difficult to reduce. The percentage inputs of chromium and lead from this sourceare much lower.
2. Potentially Toxic Elements
Pollutants in Urban Waste Water and Sewage Sludge 21
Table 2.7 Potentially toxic elements entering wastewater, breakdown by source [WRc,1994]
Cu Zn Cd Ni Pb CrPercentages of total load
Break down of domestic sources as percentage of total metal entering WWTSBathing 12.4 1.2 0.3 1.6 4.4 0.1Toilet 8.9 2.1 0.5 4.3 8.1 0.2WashingMachine
8.0 0.7 0.2 0.9 3.2 0.1
Miscellaneous 8.0 1.2 0.3 2.4 6.1 0.2
Plumbing Input(% of total entering WWTS)
Dishwashing 7.1 0.6 0.2 0.8 2.7 0.1Faeces 20.6 28.0 20.0 23.6 3.1 2.1WashingMachine
9.53 10.8 4.6 4.4 18.6 9.3
Bathing 0.2 2.6 0.9 0.8 1.1 0.3
Activities(% of total metal enteringWWTS)
Dishwashing 2.6 4.6 11.2 1.1 5.1
Human faeces contain high concentrations of potentially toxic elements from normal dietarysources and this represents a principal input of metals to domestic wastewater and sludge ofdomestic origin. The normal dietary contribution of metals represents the background metalconcentration represents the background metal concentration and is the minimumachievable in waste water and sludge.
Concentrations are expected to vary with the intake of metals in the diet, drinking water andmedication and may also be influenced by the increasing prevalence of mineralsupplementation of food, for example with zinc, iron, selenium, and manganese. One studyin France (ADEME 1997) found the following concentrations of potentially toxic elements infaeces (as dry matter): Zn: 250mg kg-1, Cu: 68mg kg-1, Pb: 11mg kg-1, Ni: 4.7mg kg-1, andCd: 2mg kg-1. Differences can also occur due to geographical variations in the dietary habits.For some elements, such as Cd, the weighted average concentration in sludge (e.g. 3.3 mgkg-1 in the UK) is typical of the amount originating naturally in faeces from the normal traceamounts of this element ingested in food (typically 18.8 µg d-1). Other differences in reportedconcentrations of Cd in different EU member states is discussed in section 2.3.
Domestic water and heating systems
Studies in the USA [Isaac et.al, 1997], and Europe [WRc 1994] show that corrosion of thedistribution-plumbing-heating networks contribute major inputs of Pb, Cu and Zn. Leadconcentration for instance can vary between 14 µg.l-1 at the household input and 150 µg.l-1 atthe output.
It has been found that concentrations of copper in sewage sludge are directly proportional towater hardness [Comber et al 1996]. Hard water (high pH) is potentially more aggressive tocopper and zinc plumbing, increasing leaching. However, the opposite is true for lead in thatit dissolves more readily in than soft, acidic water. The high lead levels in drinking water inScotland due to its soft waters are a major concern.
Reductions in the amounts of copper and lead in wastewater have been reported by pHadjustment of tap water and addition of sodium silicate. The addition of alkali agents to waterat the treatment stage and the replacement of much lead piping has led to reductions in leadconcentration [Comber et al., 1996]. Adjusting the pH of tap water may be limited bypractical and economic factors.
Zinc in domestic plumbing comes from galvanised iron used in hot water tanks but is lessproblematic than lead and copper because the amount decreases with the ageing of theinstallations. Copper corrosion and dissolution is also greater in hot water than in cold water
2. Potentially Toxic Elements
Pollutants in Urban Waste Water and Sewage Sludge 22
supplies [Comber et al 1996]. The 'first draw' (initial flow of water in the morning) has higheramounts of copper and lead compared to subsequent draws [Isaac et.al., 1997]. The Cucontent was found to be between 73.7 and 1430 µg l-1, and Pb content between 8.3 and22.3 µg l-1, much greater than in the average effluent from households. Water treatmentwould be recommended for certain water domestic uses, such as boilers and heatingsystems, in order to reduce the metal corrosion.
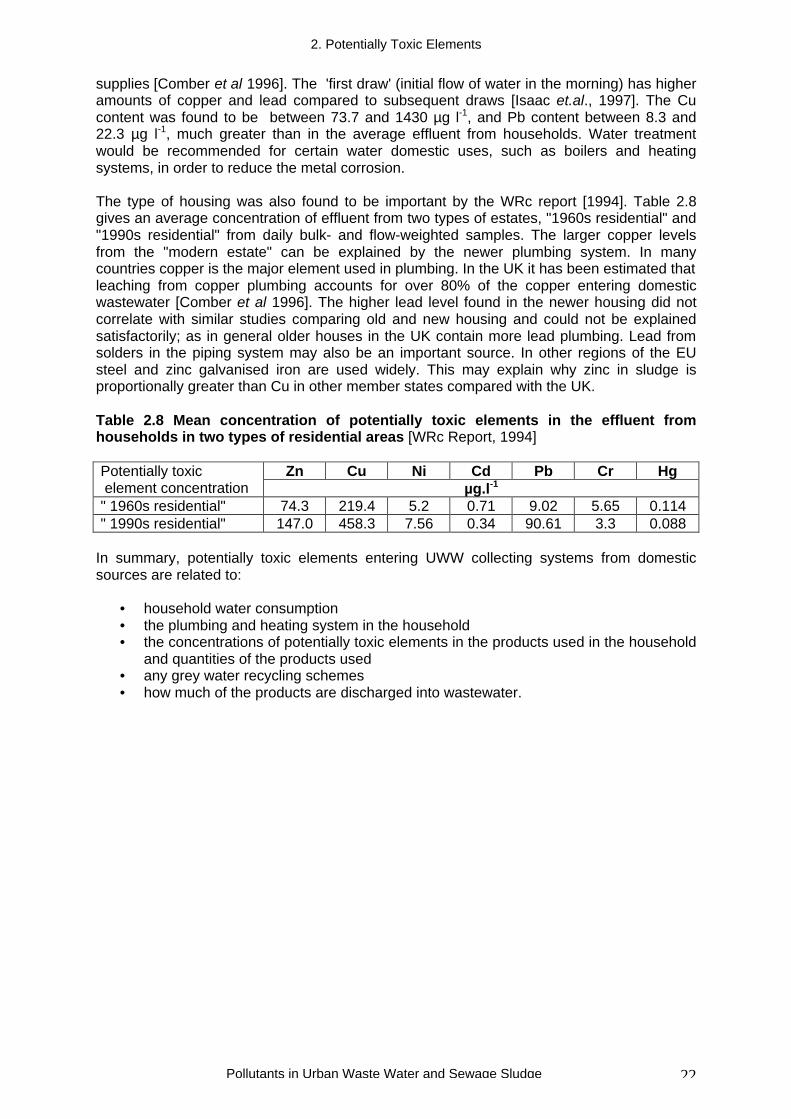
The type of housing was also found to be important by the WRc report [1994]. Table 2.8gives an average concentration of effluent from two types of estates, "1960s residential" and"1990s residential" from daily bulk- and flow-weighted samples. The larger copper levelsfrom the "modern estate" can be explained by the newer plumbing system. In manycountries copper is the major element used in plumbing. In the UK it has been estimated thatleaching from copper plumbing accounts for over 80% of the copper entering domesticwastewater [Comber et al 1996]. The higher lead level found in the newer housing did notcorrelate with similar studies comparing old and new housing and could not be explainedsatisfactorily; as in general older houses in the UK contain more lead plumbing. Lead fromsolders in the piping system may also be an important source. In other regions of the EUsteel and zinc galvanised iron are used widely. This may explain why zinc in sludge isproportionally greater than Cu in other member states compared with the UK.
Table 2.8 Mean concentration of potentially toxic elements in the effluent fromhouseholds in two types of residential areas [WRc Report, 1994]
Zn Cu Ni Cd Pb Cr HgPotentially toxic element concentration µg.l-1
" 1960s residential" 74.3 219.4 5.2 0.71 9.02 5.65 0.114" 1990s residential" 147.0 458.3 7.56 0.34 90.61 3.3 0.088
In summary, potentially toxic elements entering UWW collecting systems from domesticsources are related to:
• household water consumption• the plumbing and heating system in the household• the concentrations of potentially toxic elements in the products used in the household
and quantities of the products used• any grey water recycling schemes• how much of the products are discharged into wastewater.
2. Potentially Toxic Elements
Pollutants in Urban Waste Water and Sewage Sludge 23
2.1.2 COMMERCIAL SOURCES
Limited data is available for the potentially toxic element contribution from commercialsources and health care inputs (such as hospital and clinical wastes). Inputs from artisanalsources are looked at in more detail in a separate Case Study in Section 6.
Cadmium could originate from laundrettes, small electroplating and coating shops, plasticmanufacture, and also used in alloys, solders, pigments, enamels, paints, photography,batteries, glazes, artisanal shops, engraving, and car repair shops. Data from ADEME[1995], estimated that worldwide, 16000 tonnes of cadmium were consumed each year; 50-60% of this in the manufacture of batteries and 20-25% in the production of colouredpigments.
Chromium is present in alloys and is discharged from diffuse sources and products such aspreservatives, dying, and tanning activities. Chromium III is widely used as a tanning agentin leather processing. Chromium VI uses are now restricted and there are few commercialsources.
Copper is used in electronics, plating, paper, textile, rubber, fungicides, printing, plastic, andbrass and other alloy industries and it can also be emitted from various small commercialactivities and warehouses, as well as buildings with commercial heating systems.
Lead, as well as being used as a fuel additive (now greatly reduced or banned in the EU) itis also used in batteries, pigments, solder, roofing, cable covering, lead jointed waste pipesand PVC pipes (as an impurity), ammunition, chimney cases, fishing weights (in somecountries), yacht keels and other sources.
Mercury is used in the production of electrical equipment and is also used as a catalyst inchlor-alkali processes for chlorine and caustic soda production. The main sources in effluentare from dental practices, clinical thermometers, glass mirrors, electrical equipment andtraces in disinfectant products (bleach) and caustic soda solutions.
Nickel is used in the production of alloys, electroplating, catalysts and nickel-cadmiumbatteries. The main emission of nickels are from corrosion of equipment from launderettes,small electroplating shops and jewellery shops, from old pigments and paints. It also occursin used waters from hydrogenation of vegetable oils (catalysts).
Zinc is used in galvanisation processes, brass and bronze alloy production, tyres, batteries,paints, plastics, rubber, fungicides, paper, textiles, taxidermy (zinc chloride), embalming fluid(zinc chloride), building materials and special cements (zinc oxide, zinc fluorosilicate),dentistry (zinc oxide), and also in cosmetics and pharmaceuticals. The current trend towardselectrolytic production of zinc which, in contrast to thermally produced zinc, has virtually nocadmium contamination. This means that cadmium pollution to UWW due to the corrosion ofgalvanised steel will in time become negligible. [SPEED 1993].
Platinum and platinum group metals (PGMs) such as palladium and osmium can enterUWW from medical and clinical uses, mainly as anti-neoplastic drugs. The amount inhospital/clinical effluent has been estimated to be between 115 and 125 ng l-1 [Kümmererand Helmers, 1997, Kümmerer et.al., 1999] giving a total emission of 84-99 kg per annumfrom hospitals in Germany. Other sources of platinum metals in the environment related tocommercial activities come from catalysts used in petroleum/ammonia processing andwastewaters, from the small electronic shops, jewellery shops, laboratories and glassmanufacturing. Section 6 contains a detailed Case Study (a) on PGMs in urban waste waterand sewage sludge.
2. Potentially Toxic Elements
Pollutants in Urban Waste Water and Sewage Sludge 24
Silver could potentially be emitted from photographic and printing shops, from jewellerymanufacturers and repairers, plating and craft shops, glass mirror producers and small-scale water filters.
Studies in Spain showed the presence of elevated concentrations of Cd, Cu, Hg, Pb and Znin urban wastewater and in the coastal environment [Castro, et.al., 1996], with largeconcentrations of copper and zinc possibly due to the use of fungicides in glass-houses.
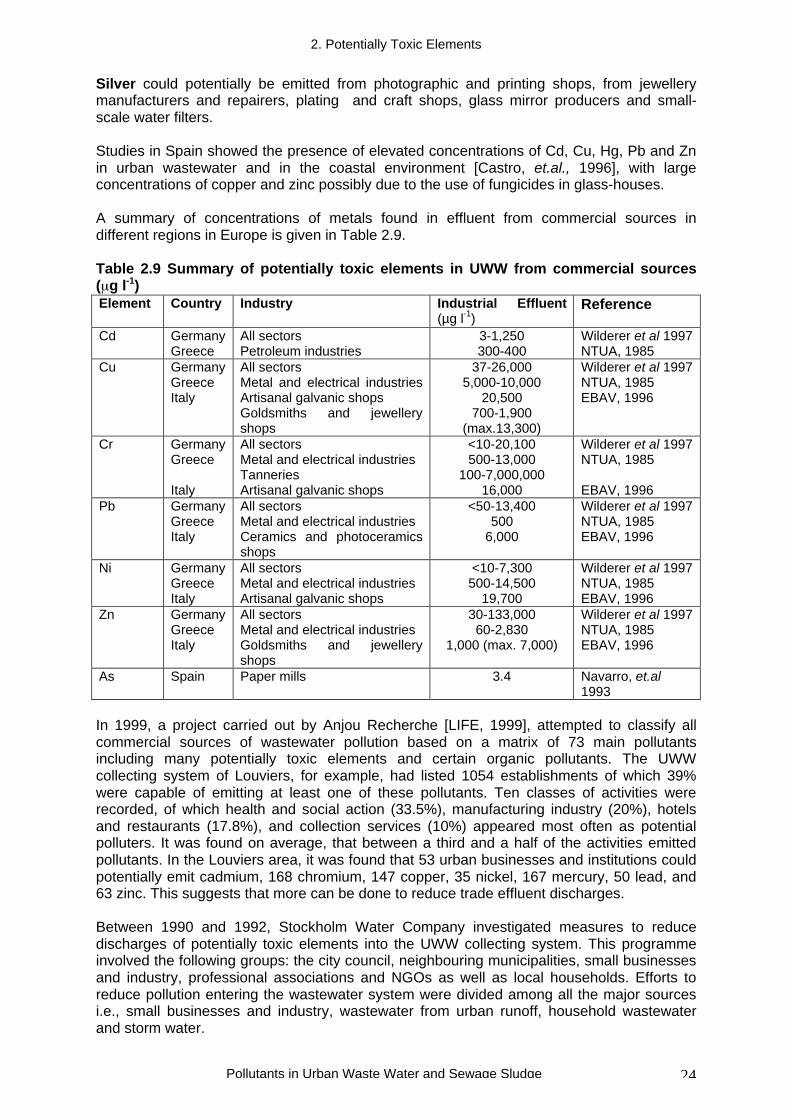
A summary of concentrations of metals found in effluent from commercial sources indifferent regions in Europe is given in Table 2.9.
Table 2.9 Summary of potentially toxic elements in UWW from commercial sources( g l-1)Element Country Industry Industrial Effluent
(µg l-1)Reference
Cd GermanyGreece
All sectorsPetroleum industries
3-1,250300-400
Wilderer et al 1997NTUA, 1985
Cu GermanyGreeceItaly
All sectorsMetal and electrical industriesArtisanal galvanic shopsGoldsmiths and jewelleryshops
37-26,0005,000-10,000
20,500700-1,900
(max.13,300)
Wilderer et al 1997NTUA, 1985EBAV, 1996
Cr GermanyGreece
Italy
All sectorsMetal and electrical industriesTanneriesArtisanal galvanic shops
<10-20,100500-13,000
100-7,000,00016,000
Wilderer et al 1997NTUA, 1985
EBAV, 1996Pb Germany
GreeceItaly
All sectorsMetal and electrical industriesCeramics and photoceramicsshops
<50-13,400500
6,000
Wilderer et al 1997NTUA, 1985EBAV, 1996
Ni GermanyGreeceItaly
All sectorsMetal and electrical industriesArtisanal galvanic shops
<10-7,300500-14,500
19,700
Wilderer et al 1997NTUA, 1985EBAV, 1996
Zn GermanyGreeceItaly
All sectorsMetal and electrical industriesGoldsmiths and jewelleryshops
30-133,00060-2,830
1,000 (max. 7,000)
Wilderer et al 1997NTUA, 1985EBAV, 1996
As Spain Paper mills 3.4 Navarro, et.al1993
In 1999, a project carried out by Anjou Recherche [LIFE, 1999], attempted to classify allcommercial sources of wastewater pollution based on a matrix of 73 main pollutantsincluding many potentially toxic elements and certain organic pollutants. The UWWcollecting system of Louviers, for example, had listed 1054 establishments of which 39%were capable of emitting at least one of these pollutants. Ten classes of activities wererecorded, of which health and social action (33.5%), manufacturing industry (20%), hotelsand restaurants (17.8%), and collection services (10%) appeared most often as potentialpolluters. It was found on average, that between a third and a half of the activities emittedpollutants. In the Louviers area, it was found that 53 urban businesses and institutions couldpotentially emit cadmium, 168 chromium, 147 copper, 35 nickel, 167 mercury, 50 lead, and63 zinc. This suggests that more can be done to reduce trade effluent discharges.
Between 1990 and 1992, Stockholm Water Company investigated measures to reducedischarges of potentially toxic elements into the UWW collecting system. This programmeinvolved the following groups: the city council, neighbouring municipalities, small businessesand industry, professional associations and NGOs as well as local households. Efforts toreduce pollution entering the wastewater system were divided among all the major sourcesi.e., small businesses and industry, wastewater from urban runoff, household wastewaterand storm water.
2. Potentially Toxic Elements
Pollutants in Urban Waste Water and Sewage Sludge 25
Collaborative projects were developed both for research, product development andeducational programmes. Local commercial organisations (particularly the Swedish DentalFederation) co-operated in the project; new technologies were developed and an evaluationof alternative products was carried out. Pollution limits were imposed that were determinedto be appropriate to encourage the purchase of the endorsed environmental products. Thisprogramme of research, and earlier work during the 1980s led to a reduction of between 50and 80% of potentially toxic elements in sewage sludge [Ulmgren 2000a].
The results of some more specific investigations into sources of potentially toxic elements inUWW are outlined below.
Motor industry - vehicle washing
Scandinavian studies [SFT-1997a, 1997b, 1999] showed that the motor industry, followed byvehicle workshops contribute most to the potentially toxic element load in UWW. Vehiclewashing, particularly heavy goods vehicles (HGVs), was found to be an important source ofpotentially toxic element contamination.
In Sweden, oil separators are commonly used in vehicle washing and motor industriesbefore discharging effluent to UWW collecting systems. Most facilities in Sweden arereported to be equipped with combined oil separators and sludge traps where the dispersedoil and sludge should be retained. However, tests at one of the light vehicle (LV) washingfacilities showed that this equipment was ineffective with practically no difference betweenthe influent (before the separator) and the effluent (after the separator). This was due to theformation of stable emulsions in the wastewater caused by the detergents in themicroemulsion formulations used for vehicle washing [Paxéus, 1996b].
A study by the Norwegian Pollution Control Authority [SFT, 1999] examining potentially toxicelement pollutants in Norway found that out of six petrol stations investigated, only one hadan oil separator/sand trap that worked effectively. Although designed to reduce thecontamination of urban wastewater, oil separating devices are generally ineffective atreducing pollutant emissions from vehicle washing and motor industry facilities.
Dental practices and healthcare (mercury)
In the late 1980s, the high concentration of mercury in sewage sludge (SS) at HenrikdalWWTS, Stockholm, prompted an investigation to identify potential sources (Table 2.10). Itwas concluded that the high mercury content of sludge was attributable to dental practicesand the use of mercury in dental amalgams. Amalgam separators were ineffective atretaining mercury and new legislation was introduced to combat this [Ulmgren, 2000a].Recent reduction or bans on the use of mercury in various products, such as batteries andthermometers, has led to a reduction of mercury input into UWW [Ulmgren, 2000a andUlmgren, 2000b]. Mercury recycling schemes have also proved to be successful, and couldbe extended to other countries and activities.
Other discharges from dental technicians shops are covered in detail in Section 6, CaseStudies.
2. Potentially Toxic Elements
Pollutants in Urban Waste Water and Sewage Sludge 26
Table 2.10 Sources of mercury in urban wastewater in Sweden[Table adapted from text, Ulmgren 2000a]
Source CommentsHeavy Industry no Ruled out as a source of mercury to UWW and SS as these were
not connected to the UWW collecting systemSmall andMediumEnterprises(18 Companies)
no Ruled out as they were operated in such a way that nocontamination of the wastewater was likely
Storm Drains yes 20% of the total mercury load came from storm drains. This waslargely traced to the deposition of particulates emitted fromcrematoria which are estimated to be about 50 kg of mercury a year
HouseholdWastewater
yes About 15% of the mercury entered the waste water system throughthe use of mercury thermometers in the home, and also from smallamounts of mercury in food and amalgam fillings in teeth
Dentists andDentalTechnicians
yes High mercury content of sludge was largely attributable to dentalpractices and the use of mercury in dental amalgams
Hospitals yes Samples indicated that hospitals emit 10% of the mercury loadingOld SewagePipes
yes Investigations in the last few years have found many sources ofmercury in old pipes
Similar findings have been reported in other countries. A WRc report [1994] established thatin the UK mercury emissions are much higher from commercial, rather than domesticsources, mainly due to dental practices. In France, it is estimated [Agence de l'Eau, 1992]that between 73 and 80 % of the mercury in UWW is from dental practices and amalgamfillings corrosion. In the Louviers area of France, the analysis of wastewater and sewagesludge showed that out of the total load of mercury, 50% was lost from medical practices,13% from dentistry practices, 28% from medical auxiliaries (nurses etc.), 4% from hospitalactivities, 4% from veterinary activities, and 1% from ambulance activities. Thus, in thisinstance, targeting medical/dental practices may help reduce pollution from mercury [LIFE,1999].
Other sources of mercuryIn 1993, the amount of mercury entering France was 209 tonnes, the amount leaving Francewas 87 tonnes, and hence 122 tonnes were entering the environment in the form of waste[AGHTM, 1999-2000] (see Table 2.11).
Table 2.11: Mercury contained in waste[from Dossier sur les dechets mercuriels en France: AGHTM, 1999].
Activity Amount (tonnes) % Treated and recycledZinc and lead metallurgy 18 4.8
Thermometers 9 5.6
Dentistry amalgams 9 11.4Batteries 6.8 7.4Laboratories 0.9 0.0Fluorescent tubes 0.8 12.5Barometers 0.4 10.0High intensity lamps 0.2 10.0Chlorine production 77 ?
Table 2.11 highlights the amount of mercury waste produced by zinc/lead metallurgy andchlorine production. In Galicia, north-western Spain, high mercury levels in UWW andsewage sludge are attributed to chlor-alkali production in the Pontevedra area [Cela et.al.1992]. In Portugal too, the presence of mercury in treated wastewater, sewage sludge andthe lagoons of Aveira is linked with chlor-alkali production [Lucas et.al, 1986 and Pereira
2. Potentially Toxic Elements
Pollutants in Urban Waste Water and Sewage Sludge 27
et.al, 1998]. There appears to be potential for improved control and recycling of mercurywaste associated with these activities.
Sources of chromium
Mine production of chromium in Finland has increased from 348 thousand tonnes to justover a million tonnes in 1990 [Mukherjee 1998], representing just under 10% of worldproduction. The main sources of chromium in wastewater are from the metal, chemical andleather industries (Table 2.12). As can be seen, the chemical industry contributes over halfof the total emissions to UWW and surface waters in this region.
Table 2.12 Chromium emissions to water in Finland [adapted from Mukherjee, 1998]Emissions to water (not exclusively UWW)Source Categorytonnes per annum % of total contribution
Chemical Industry 14.3 58.1Paint Manufacture 0.01 <0.1Electroplating 0.1 0.4Ferro-chrome and Stainless SteelPlants
4.6 18.7
Leather Processing 5.5 22.5Total 24.6 100.0
Mukherjee [1998] reports that in Scandinavia, chromium compounds are also used in woodpreservatives, along with arsenic compounds (As2O5) and an oily mixture of organicchemicals (phenol and creosol).
All wet-textile processing in Finland discharges its wastewater, containing chromium andother metals, to the WWTS. The textile companies studied [Kalliala, 2000] producedbetween 50 and 500 litres of wastewater per kg of textile produced. Wastewater analyseswere carried out at six major Finnish textile companies (two of these include analysis forpotentially toxic elements (Table 2.13)):
Table 2.13 Potentially toxic elements in wastewater from textile processing in Finland[Kalliala, 2000]
Wastewater analysis (µg l-1)Company 2 Company 4
Lead 0.11 -Chromium 0.03 60Copper 0.4 80Zinc - 20
There is a very high variation in the process emissions between these two plants. Company2 was noted to use cellulose blends while company 4 was noted to have mainly polyesterand polyester blends.
2. Potentially Toxic Elements
Pollutants in Urban Waste Water and Sewage Sludge 28
Sources of lead
Data from ADEME [1995] showed that worldwide consumption of lead is around 5.4 milliontonnes per year. In a Swedish study [Palm, Östlund, 1996] in the Stockholm area the totalamount of lead used in products such as those listed previously, was estimated at between44,000 and 47,000 tonnes per annum. Clearly the potential for lead entering UWW fromthese sources will vary greatly. The largest amount of lead that finds its way to the WWTS islikely to be contributed by piping. Estimates for the amount of lead used are 8,000 tonnes inlead jointed water pipes used inside buildings, followed by 2,000 tonnes used in lead jointedwater pipes used outdoors (higher replacing rate), and 120 tonnes used in PVC piping.
In the case of Finland, the Ministry of the Environment report that the drinking waterpipelines are predominantly plastic (85% PVC and PEH), with 11% cast iron; no lead is usedfor pipes conveying water. The wastewater pipes for the UWW collecting system are 57%concrete and 41% plastic.
2. Potentially Toxic Elements
Pollutants in Urban Waste Water and Sewage Sludge 29
2.1.3 URBAN RUNOFF
Runoff to UWW collecting systems and waterways has been intensely studied due to itspotentially high loading of potentially toxic elements [WRc, 1994]. Atmospheric inputs to theurban runoff depend on the nature of surrounding industries, on the proximity of majoremission sources such as smelters and coal fired power stations and the direction of theprevailing wind. Potentially toxic element loads can be five fold greater in runoff nearcommercial activities, than in residential areas far from industrial emitters. Roof runoff andbuilding runoff also contribute to the total runoff loading and may be a source of considerableamounts of potentially toxic elements such as zinc, lead, copper and cadmium. Road androof runoff sources are particularly important during storm events, which will allow flushing ofpotentially toxic elements and other pollutants from surfaces. Furthermore, it is important tonote that the metal species released are usually in a freely dissolved, bioavailable form.Nevertheless, these sources are very variable, as every event is different and depends ontraffic, material and age of roofs and other surfaces, and meteorological and environmentalconditions.
Although a number of studies had focused on the effects of urban land use in thequantification of precipitation runoff, it was not until the 1950s that the first qualitative1
studies were undertaken [Palmer, 1950 and 1963; Wilkinson, 1956]. Table 2.14 providesconcentrations for a number of potentially toxic elements in urban runoff, as a summary ofvarious investigations from 1975 to 1978. It is important to note that the measuredconcentrations differ considerably. The main sources of pollution in urban precipitation runoffcan be summarised as follows [based on Mitchell, 1985]:
• Road and vehicle related pollution• Degradation of roofing materials• Construction• Litter, vegetation and associated human activities• Erosion of soil
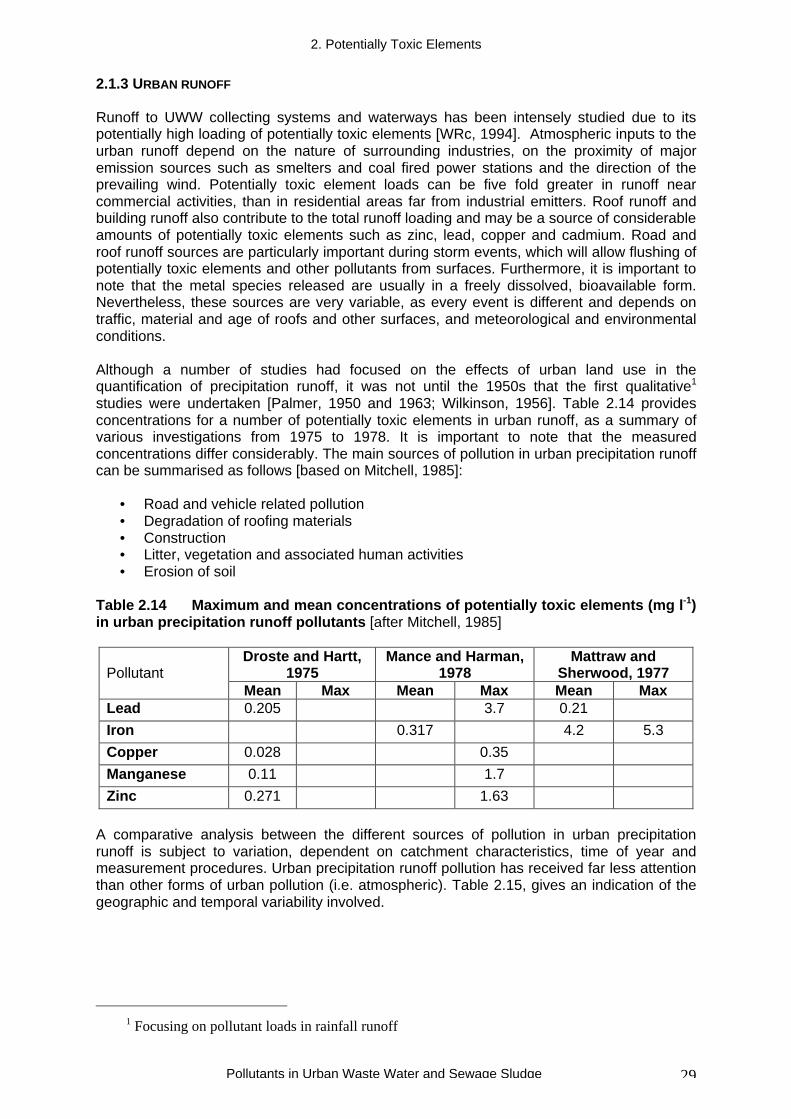
Table 2.14 Maximum and mean concentrations of potentially toxic elements (mg l-1)in urban precipitation runoff pollutants [after Mitchell, 1985]
Droste and Hartt,1975
Mance and Harman,1978
Mattraw andSherwood, 1977Pollutant
Mean Max Mean Max Mean MaxLead 0.205 3.7 0.21
Iron 0.317 4.2 5.3
Copper 0.028 0.35
Manganese 0.11 1.7
Zinc 0.271 1.63
A comparative analysis between the different sources of pollution in urban precipitationrunoff is subject to variation, dependent on catchment characteristics, time of year andmeasurement procedures. Urban precipitation runoff pollution has received far less attentionthan other forms of urban pollution (i.e. atmospheric). Table 2.15, gives an indication of thegeographic and temporal variability involved.
1 Focusing on pollutant loads in rainfall runoff
2. Potentially Toxic Elements
Pollutants in Urban Waste Water and Sewage Sludge 30
Table 2.15 Mean concentrations in rainwater runoff (in µg/l)
Site Cd Cu Pb Zn ReferenceUrban (Netherlands) 0.9 8 20 31 Van Daalen, 1991
Central Paris 2.4 60 140 Granier, 1991
Central Paris 0.11 6 13.7 38.8 Garnaud et al., 1996-1997
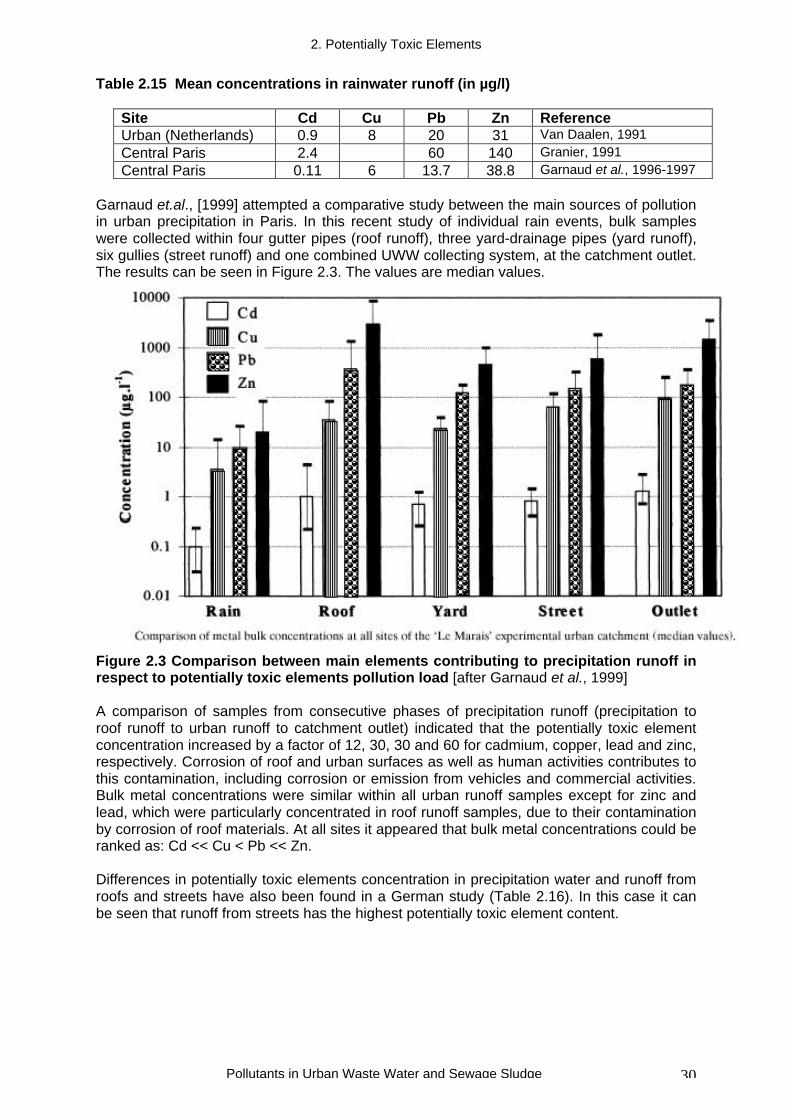
Garnaud et.al., [1999] attempted a comparative study between the main sources of pollutionin urban precipitation in Paris. In this recent study of individual rain events, bulk sampleswere collected within four gutter pipes (roof runoff), three yard-drainage pipes (yard runoff),six gullies (street runoff) and one combined UWW collecting system, at the catchment outlet.The results can be seen in Figure 2.3. The values are median values.
Figure 2.3 Comparison between main elements contributing to precipitation runoff inrespect to potentially toxic elements pollution load [after Garnaud et al., 1999]
A comparison of samples from consecutive phases of precipitation runoff (precipitation toroof runoff to urban runoff to catchment outlet) indicated that the potentially toxic elementconcentration increased by a factor of 12, 30, 30 and 60 for cadmium, copper, lead and zinc,respectively. Corrosion of roof and urban surfaces as well as human activities contributes tothis contamination, including corrosion or emission from vehicles and commercial activities.Bulk metal concentrations were similar within all urban runoff samples except for zinc andlead, which were particularly concentrated in roof runoff samples, due to their contaminationby corrosion of roof materials. At all sites it appeared that bulk metal concentrations could beranked as: Cd << Cu < Pb << Zn.
Differences in potentially toxic elements concentration in precipitation water and runoff fromroofs and streets have also been found in a German study (Table 2.16). In this case it canbe seen that runoff from streets has the highest potentially toxic element content.
2. Potentially Toxic Elements
Pollutants in Urban Waste Water and Sewage Sludge 31
Table 2.16 Concentration changes of certain contaminants in precipitation water andrunoff from different outflow paths, Germany.[Xanthopoulos and Hahn, 1993] LOD Limit of detection
Pollutant Precipitation[µg/l]
Run-off fromroofs [µg l-1]
Run-off fromstreets [µg l-1]
Pb 5 104 311Cd 1 1 6.4Zn 5 24 603Cu 1.5 35 108Ni 5 <LOD 57
A study carried out by Rougemaille (1994) analysed the wastewaters of the treatment plantin Achères in the Paris region and found that lead concentrations varied between 0.05 and0.5mg l -1 and that the average concentration was 0.1mg l-1. These wastewaters come fromfour different urban areas. The study showed that lead concentrations were 3 times largerduring wet weather than during dry weather, hence proving the importance of the runoffsources.
A study carried out around the region of Nantes in France in 1999, analysed road runoff froma major highway for a year showing that lead and zinc are the main pollutants present inrunoff waters (Table 2.17).
Table 2.17: Analysis of raw runoff waters [Legret, 1999]
PAH(ng l-1)
Pb( g l-1)
Cu( g l-1)
Cd( g l-1)
Zn( g l-1)
Mean <96 58 45 1 356Median <74 43 33 0.74 254Range <11-474 14-188 11-146 0.2-4.2 104-1544SD 76 44 27 0.86 288
The Swedish study mentioned in previous sections [Palm, Östlund, 1996], estimated thetotal amount of zinc passing into wastewater at 6,300 tonnes per annum. Most of the zincpresent in the urban environment was generated by urban runoff and rain; from roofs andbuilding surfaces (1,600 tonnes), from cars excluding tyres (1,500 tonnes), from tyres (200tonnes), and from lampposts and street furniture (an estimated 1,142 tonnes). Zinc was alsoattributed to water pipe couplings (1,000 tonnes).
2. Potentially Toxic Elements
Pollutants in Urban Waste Water and Sewage Sludge 32
A Road and vehicle contribution
Roads are a major source of pollution in urban environments and contribute to wastewaterpollution both directly and indirectly (airborne pollutants generation). Sartor and Boyd[USEPA, 1972] determined the major constituents of road related runoff to be inorganicmatter, but the total mass of inorganic matter present seemed to increase as the antecedentdry period (ADP) increased. Sources of the organic and inorganic fraction of road-producedpollutants are summarised as follows:
• Vehicle lubrication systems losses• Vehicle exhaust emissions• Degradation of automobile tyres and brakes• Road maintenance• Road surface degradation• Load losses from vehicles (accidental spillages)• Precipitation (wet deposition)• Atmospheric deposition (dry deposition)
Potentially toxic elements in runoff occur from motor fuel combustion, brake linings, tyrewear and road surface wear. Motor fuel combustion was the largest source of lead to runoffbut it is on the decrease due to the gradual phasing out of leaded fuel in the EU. Othermetals emitted from exhausts are zinc, chromium and more recently tin from thereplacement anti-knock compounds in petrol. The presence of Zn and Cd in road surfacesediments can also be explained by the addition of Zn dithiophosphate in the manufacturingof lubricating oil, Cd being present as an impurity of the original Zn. Brake lining wearcontributes copper, nickel, chromium and lead to runoff. Tyre abrasion contributes to theload of zinc, lead, chromium and nickel due to the soot and metal oxides constituents.Cadmium in car tyres is attributed to zinc-diethylcarbonate, which is used during thevulcanisation process. Road surface wear contributes to emissions of nickel, chromium,lead, zinc and copper.
Legret and Pagotto (1999) produced estimates of potentially toxic element content fromvehicle related pollution sources (Table 2.18), and contributions to road runoff (Table 2.19).
Table 2.18 Potentially toxic element contents in vehicle and road materials (mg kg-1)[after Legret and Pagotto, 1999]
Sources Pb Cu Cd Zn
Leaded petrol 200 - - -
Unleaded petrol 17 - - -
Brake linings 3900 142000 2.7 21800
Tyre rubber 6.3 1.8 2.6 10250
De-icing agent 3.3 0.5 0.2 0.5
2. Potentially Toxic Elements
Pollutants in Urban Waste Water and Sewage Sludge 33
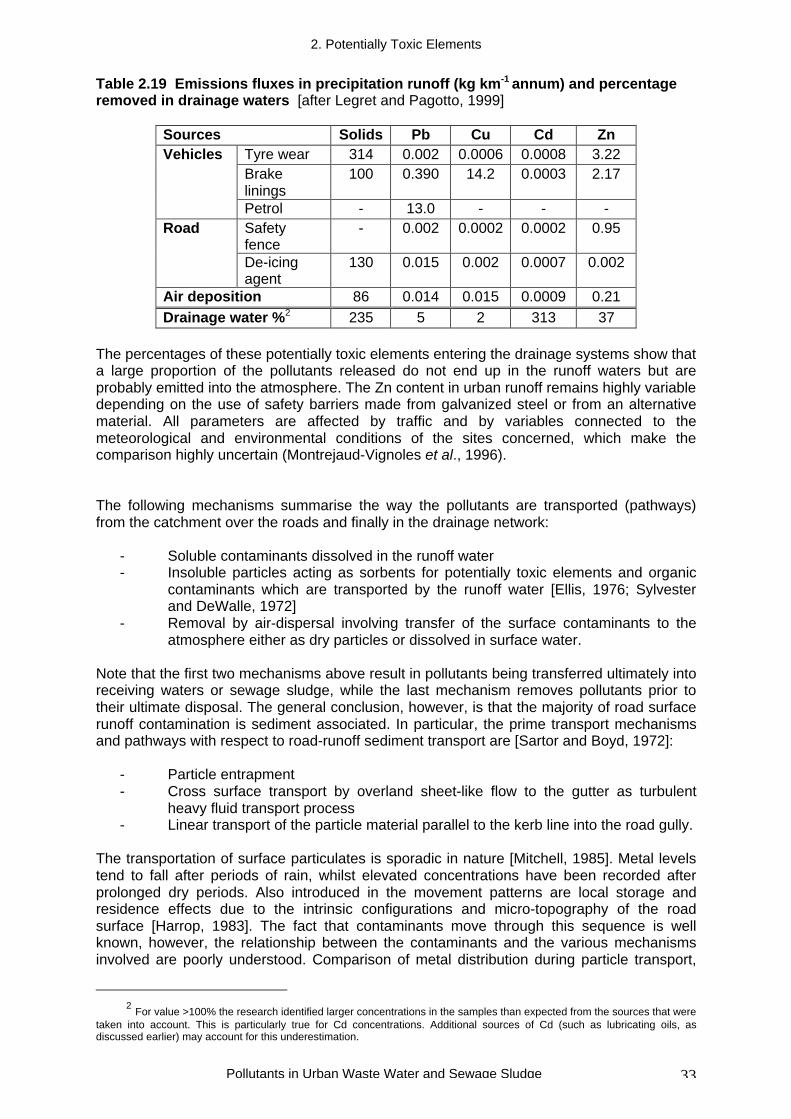
Table 2.19 Emissions fluxes in precipitation runoff (kg km-1 annum) and percentageremoved in drainage waters [after Legret and Pagotto, 1999]
Sources Solids Pb Cu Cd ZnTyre wear 314 0.002 0.0006 0.0008 3.22Brakelinings
100 0.390 14.2 0.0003 2.17Vehicles
Petrol - 13.0 - - -Safetyfence
- 0.002 0.0002 0.0002 0.95Road
De-icingagent
130 0.015 0.002 0.0007 0.002
Air deposition 86 0.014 0.015 0.0009 0.21
Drainage water %2 235 5 2 313 37
The percentages of these potentially toxic elements entering the drainage systems show thata large proportion of the pollutants released do not end up in the runoff waters but areprobably emitted into the atmosphere. The Zn content in urban runoff remains highly variabledepending on the use of safety barriers made from galvanized steel or from an alternativematerial. All parameters are affected by traffic and by variables connected to themeteorological and environmental conditions of the sites concerned, which make thecomparison highly uncertain (Montrejaud-Vignoles et al., 1996).
The following mechanisms summarise the way the pollutants are transported (pathways)from the catchment over the roads and finally in the drainage network:
- Soluble contaminants dissolved in the runoff water- Insoluble particles acting as sorbents for potentially toxic elements and organic
contaminants which are transported by the runoff water [Ellis, 1976; Sylvesterand DeWalle, 1972]
- Removal by air-dispersal involving transfer of the surface contaminants to theatmosphere either as dry particles or dissolved in surface water.
Note that the first two mechanisms above result in pollutants being transferred ultimately intoreceiving waters or sewage sludge, while the last mechanism removes pollutants prior totheir ultimate disposal. The general conclusion, however, is that the majority of road surfacerunoff contamination is sediment associated. In particular, the prime transport mechanismsand pathways with respect to road-runoff sediment transport are [Sartor and Boyd, 1972]:
- Particle entrapment- Cross surface transport by overland sheet-like flow to the gutter as turbulent
heavy fluid transport process- Linear transport of the particle material parallel to the kerb line into the road gully.
The transportation of surface particulates is sporadic in nature [Mitchell, 1985]. Metal levelstend to fall after periods of rain, whilst elevated concentrations have been recorded afterprolonged dry periods. Also introduced in the movement patterns are local storage andresidence effects due to the intrinsic configurations and micro-topography of the roadsurface [Harrop, 1983]. The fact that contaminants move through this sequence is wellknown, however, the relationship between the contaminants and the various mechanismsinvolved are poorly understood. Comparison of metal distribution during particle transport,
2 For value >100% the research identified larger concentrations in the samples than expected from the sources that were
taken into account. This is particularly true for Cd concentrations. Additional sources of Cd (such as lubricating oils, asdiscussed earlier) may account for this underestimation.
2. Potentially Toxic Elements
Pollutants in Urban Waste Water and Sewage Sludge 34
from atmosphere to receiving water body, clearly demonstrates a metal mobility evolution(Garnaud et al., 1999). Extremely labile (i.e. hydrosoluble or exchangeable), within dryatmospheric deposits Cd, Pb and Zn, become bio-available within street runoff and stablewithin UWW collecting system or river sediment. In conclusion particulate metal mobility maybe classified as: Cu<<Cd<Pb<Zn<Fe.
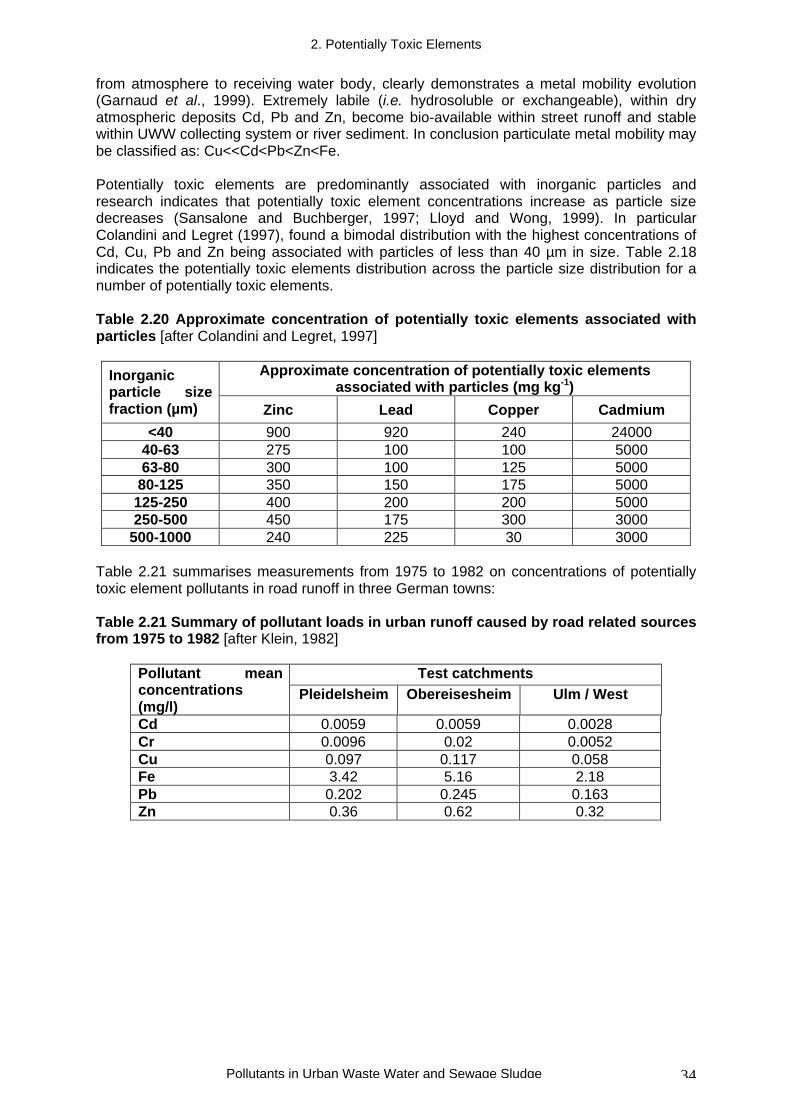
Potentially toxic elements are predominantly associated with inorganic particles andresearch indicates that potentially toxic element concentrations increase as particle sizedecreases (Sansalone and Buchberger, 1997; Lloyd and Wong, 1999). In particularColandini and Legret (1997), found a bimodal distribution with the highest concentrations ofCd, Cu, Pb and Zn being associated with particles of less than 40 µm in size. Table 2.18indicates the potentially toxic elements distribution across the particle size distribution for anumber of potentially toxic elements.
Table 2.20 Approximate concentration of potentially toxic elements associated withparticles [after Colandini and Legret, 1997]
Approximate concentration of potentially toxic elementsassociated with particles (mg kg-1)
Inorganicparticle sizefraction (µm) Zinc Lead Copper Cadmium
<40 900 920 240 2400040-63 275 100 100 500063-80 300 100 125 500080-125 350 150 175 5000125-250 400 200 200 5000250-500 450 175 300 3000
500-1000 240 225 30 3000
Table 2.21 summarises measurements from 1975 to 1982 on concentrations of potentiallytoxic element pollutants in road runoff in three German towns:
Table 2.21 Summary of pollutant loads in urban runoff caused by road related sourcesfrom 1975 to 1982 [after Klein, 1982]
Test catchmentsPollutant meanconcentrations(mg/l)
Pleidelsheim Obereisesheim Ulm / West
Cd 0.0059 0.0059 0.0028Cr 0.0096 0.02 0.0052Cu 0.097 0.117 0.058Fe 3.42 5.16 2.18Pb 0.202 0.245 0.163Zn 0.36 0.62 0.32
2. Potentially Toxic Elements
Pollutants in Urban Waste Water and Sewage Sludge 35
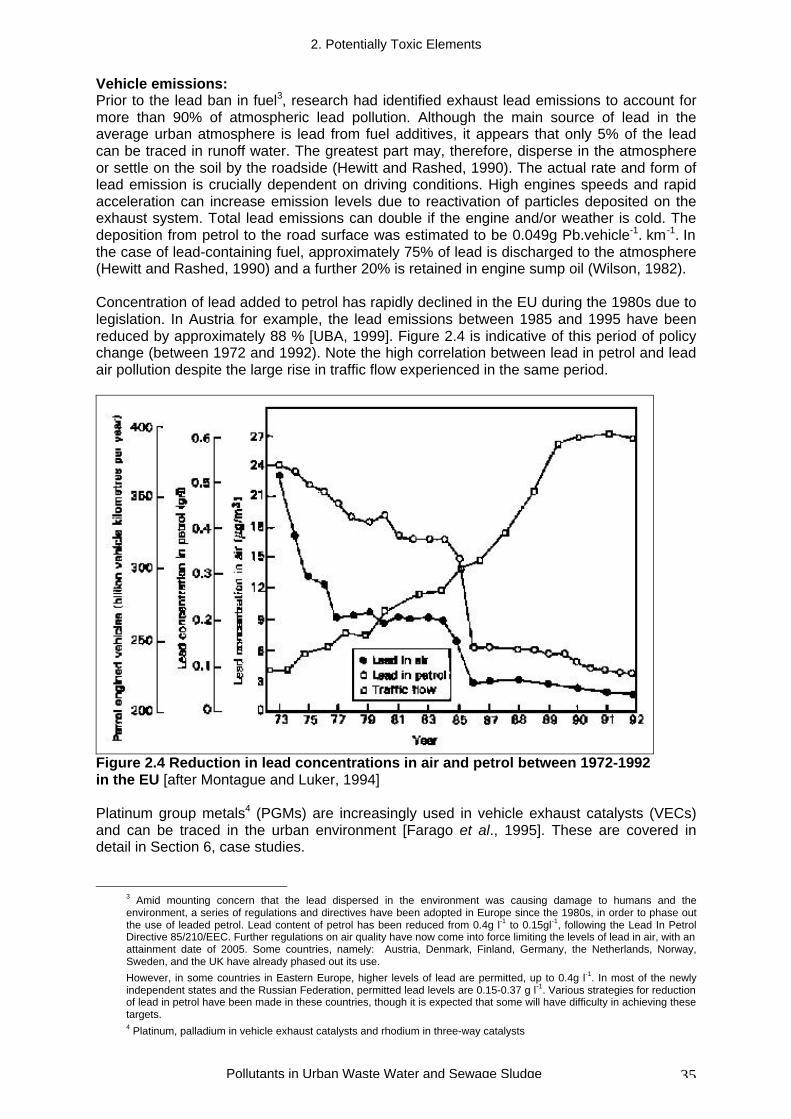
Vehicle emissions:Prior to the lead ban in fuel3, research had identified exhaust lead emissions to account formore than 90% of atmospheric lead pollution. Although the main source of lead in theaverage urban atmosphere is lead from fuel additives, it appears that only 5% of the leadcan be traced in runoff water. The greatest part may, therefore, disperse in the atmosphereor settle on the soil by the roadside (Hewitt and Rashed, 1990). The actual rate and form oflead emission is crucially dependent on driving conditions. High engines speeds and rapidacceleration can increase emission levels due to reactivation of particles deposited on theexhaust system. Total lead emissions can double if the engine and/or weather is cold. Thedeposition from petrol to the road surface was estimated to be 0.049g Pb.vehicle-1. km -1. Inthe case of lead-containing fuel, approximately 75% of lead is discharged to the atmosphere(Hewitt and Rashed, 1990) and a further 20% is retained in engine sump oil (Wilson, 1982).
Concentration of lead added to petrol has rapidly declined in the EU during the 1980s due tolegislation. In Austria for example, the lead emissions between 1985 and 1995 have beenreduced by approximately 88 % [UBA, 1999]. Figure 2.4 is indicative of this period of policychange (between 1972 and 1992). Note the high correlation between lead in petrol and leadair pollution despite the large rise in traffic flow experienced in the same period.
Figure 2.4 Reduction in lead concentrations in air and petrol between 1972-1992in the EU [after Montague and Luker, 1994]
Platinum group metals4 (PGMs) are increasingly used in vehicle exhaust catalysts (VECs)and can be traced in the urban environment [Farago et al., 1995]. These are covered indetail in Section 6, case studies.
3 Amid mounting concern that the lead dispersed in the environment was causing damage to humans and theenvironment, a series of regulations and directives have been adopted in Europe since the 1980s, in order to phase outthe use of leaded petrol. Lead content of petrol has been reduced from 0.4g l-1 to 0.15gl-1, following the Lead In PetrolDirective 85/210/EEC. Further regulations on air quality have now come into force limiting the levels of lead in air, with anattainment date of 2005. Some countries, namely: Austria, Denmark, Finland, Germany, the Netherlands, Norway,Sweden, and the UK have already phased out its use.
However, in some countries in Eastern Europe, higher levels of lead are permitted, up to 0.4g l-1. In most of the newlyindependent states and the Russian Federation, permitted lead levels are 0.15-0.37 g l-1. Various strategies for reductionof lead in petrol have been made in these countries, though it is expected that some will have difficulty in achieving thesetargets.4 Platinum, palladium in vehicle exhaust catalysts and rhodium in three-way catalysts
2. Potentially Toxic Elements
Pollutants in Urban Waste Water and Sewage Sludge 36
Vehicle degradation:
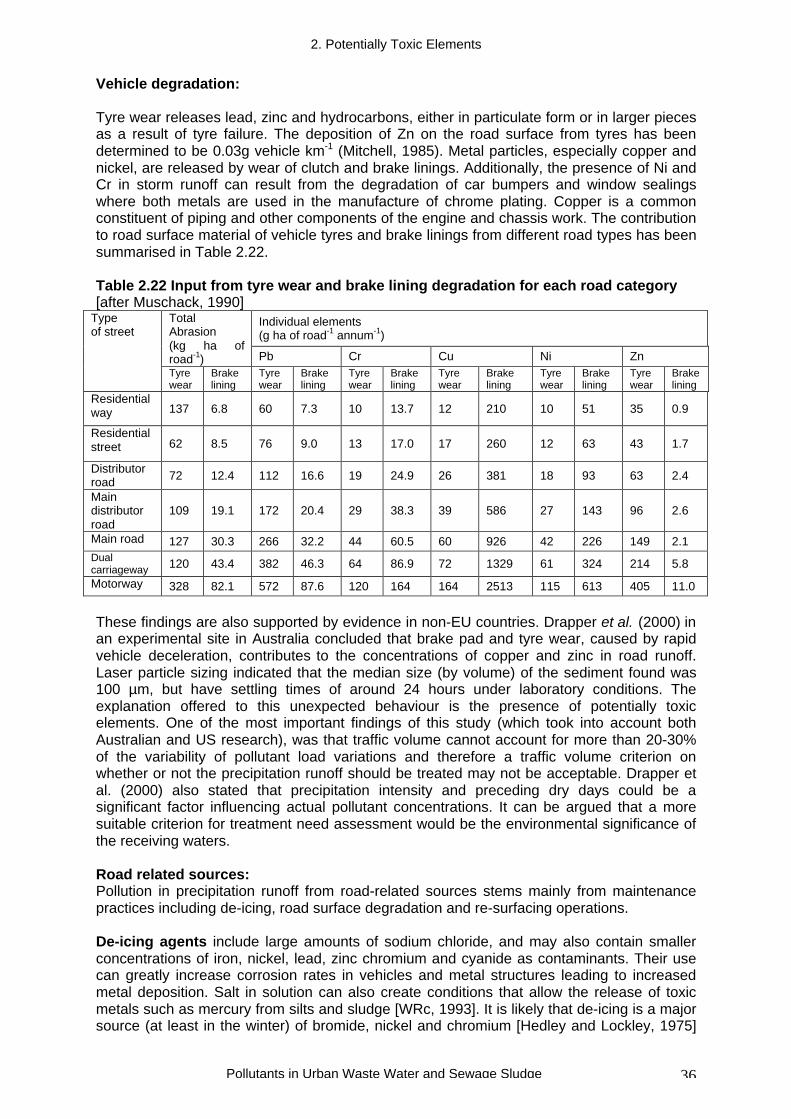
Tyre wear releases lead, zinc and hydrocarbons, either in particulate form or in larger piecesas a result of tyre failure. The deposition of Zn on the road surface from tyres has beendetermined to be 0.03g vehicle km-1 (Mitchell, 1985). Metal particles, especially copper andnickel, are released by wear of clutch and brake linings. Additionally, the presence of Ni andCr in storm runoff can result from the degradation of car bumpers and window sealingswhere both metals are used in the manufacture of chrome plating. Copper is a commonconstituent of piping and other components of the engine and chassis work. The contributionto road surface material of vehicle tyres and brake linings from different road types has beensummarised in Table 2.22.
Table 2.22 Input from tyre wear and brake lining degradation for each road category[after Muschack, 1990]
Individual elements(g ha of road-1 annum-1)
TotalAbrasion(kg ha ofroad-1) Pb Cr Cu Ni Zn
Typeof street
Tyrewear
Brakelining
Tyrewear
Brakelining
Tyrewear
Brakelining
Tyrewear
Brakelining
Tyrewear
Brakelining
Tyrewear
Brakelining
Residentialway 137 6.8 60 7.3 10 13.7 12 210 10 51 35 0.9
Residentialstreet 62 8.5 76 9.0 13 17.0 17 260 12 63 43 1.7
Distributorroad
72 12.4 112 16.6 19 24.9 26 381 18 93 63 2.4
Maindistributorroad
109 19.1 172 20.4 29 38.3 39 586 27 143 96 2.6
Main road 127 30.3 266 32.2 44 60.5 60 926 42 226 149 2.1Dualcarriageway 120 43.4 382 46.3 64 86.9 72 1329 61 324 214 5.8
Motorway 328 82.1 572 87.6 120 164 164 2513 115 613 405 11.0
These findings are also supported by evidence in non-EU countries. Drapper et al. (2000) inan experimental site in Australia concluded that brake pad and tyre wear, caused by rapidvehicle deceleration, contributes to the concentrations of copper and zinc in road runoff.Laser particle sizing indicated that the median size (by volume) of the sediment found was100 µm, but have settling times of around 24 hours under laboratory conditions. Theexplanation offered to this unexpected behaviour is the presence of potentially toxicelements. One of the most important findings of this study (which took into account bothAustralian and US research), was that traffic volume cannot account for more than 20-30%of the variability of pollutant load variations and therefore a traffic volume criterion onwhether or not the precipitation runoff should be treated may not be acceptable. Drapper etal. (2000) also stated that precipitation intensity and preceding dry days could be asignificant factor influencing actual pollutant concentrations. It can be argued that a moresuitable criterion for treatment need assessment would be the environmental significance ofthe receiving waters.
Road related sources:Pollution in precipitation runoff from road-related sources stems mainly from maintenancepractices including de-icing, road surface degradation and re-surfacing operations.
De-icing agents include large amounts of sodium chloride, and may also contain smallerconcentrations of iron, nickel, lead, zinc chromium and cyanide as contaminants. Their usecan greatly increase corrosion rates in vehicles and metal structures leading to increasedmetal deposition. Salt in solution can also create conditions that allow the release of toxicmetals such as mercury from silts and sludge [WRc, 1993]. It is likely that de-icing is a majorsource (at least in the winter) of bromide, nickel and chromium [Hedley and Lockley, 1975]
2. Potentially Toxic Elements
Pollutants in Urban Waste Water and Sewage Sludge 37
and it is suggested it may affect the solubility and mobility of other metals, notably of lead,which may precipitate more readily in the presence of sodium [Laxen and Harrison, 1977].
The use of NaCl as a de-icing agent may change the behaviour of the accumulatedcontaminants in roadside soils. In soils exposed to high Na concentrations with asubsequent supply of lower salinity water, as in snowmelt periods and storm flow events,there is a risk of colloid dispersion and mobilization [Norrstrom and Jacks, 1998]. Soilcolumn leaching experiments with NaCl and low-electrolyte water have provided evidencefor the mobilisation of organic colloids and Fe-oxides, suggesting that potentially toxicelements may reach the groundwater via colloid-assisted transport [Amrhein et al., 1992,1993]. Moreover, the use of road-salt may result in the increased mobilisation of potentiallytoxic elements due to complexation with chloride ions [Doner, 1978; Lumsdon et al., 1995].
Complexed cyanide ion (in the form of sodium ferrocyanide) is added as anti-cakingagent to de-icing agents, and compounds containing phosphorus may also be added asrust inhibitors. Novotny et al. (1998) argue that although ferrocyanide is non-toxic in itsoriginal form, its instability under predominant natural surface waters conditions, results indecomposition to free cyanide which is toxic (free cyanide↔HCN(aq)+CN-(aq)). The initialcyanide form is only stable within the pH range 8 to 14 and zero to –600mV redox potential(Eh). The rate of decomposition is estimated around 10.2µg l-1 h-1 in salt water. Meeusen etal. (1992) estimated similar rates of decomposition.
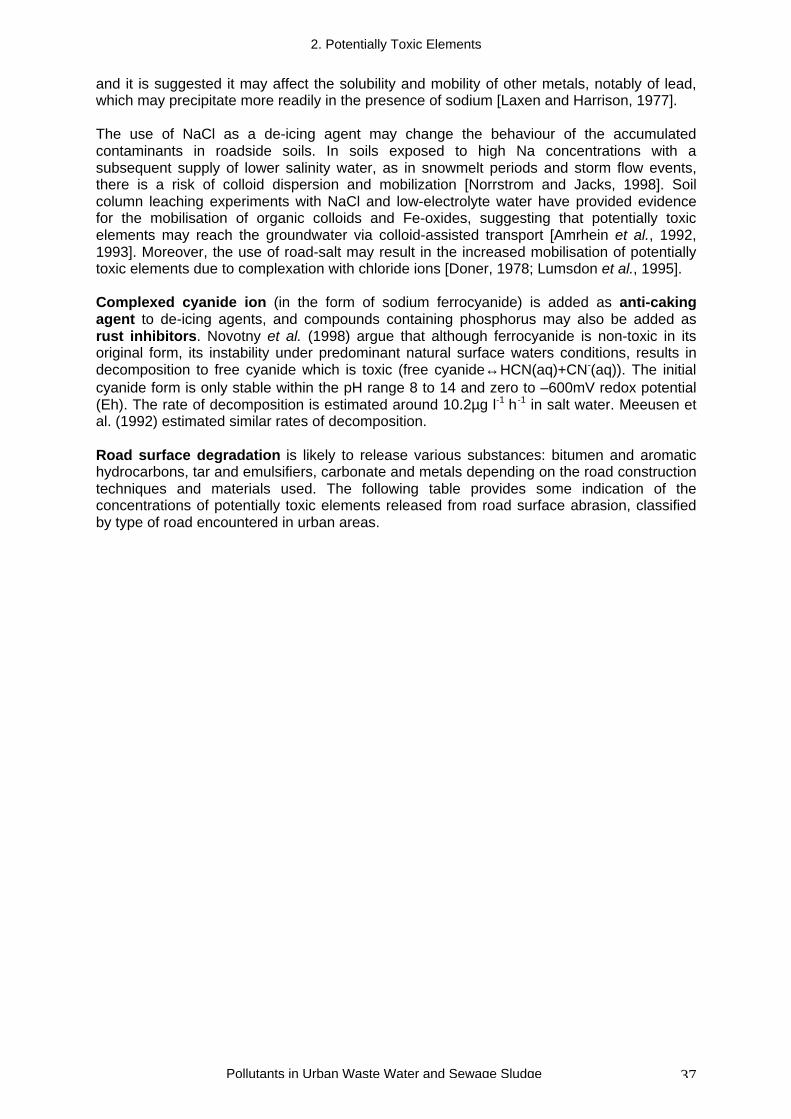
Road surface degradation is likely to release various substances: bitumen and aromatichydrocarbons, tar and emulsifiers, carbonate and metals depending on the road constructiontechniques and materials used. The following table provides some indication of theconcentrations of potentially toxic elements released from road surface abrasion, classifiedby type of road encountered in urban areas.
2. Potentially Toxic Elements
Pollutants in Urban Waste Water and Sewage Sludge 38
Table 2.23 Emissions from abrasion of urban streets surface material[after Muschack, 1990]
Individual elements(g ha of road-1annum-1)
Typeof street
Total abrasion(kg ha of road-1
annum-1) Pb Cr Cu Ni ZnResidential way 1734 177 619 88 2030 285
Residential street 2148 219 767 110 2513 352
Distributor road 3152 322 1125 161 3688 517
Main distributorroad
4850 495 1731 247 5674 795
Main road 7665 782 2736 391 8965 1257
Dual carriageway 11000 1124 3927 561 12870 1804
Motorway 10000 1020 3570 510 11700 1640
Accidental discharges:Although spillages can be considered a minor add-in in terms of total pollutant loading, theycan be one of the most serious sources of contaminants in urban areas. They can rangefrom minor losses of fuel to major losses from fractured tanker vehicles. The resulting impacton wastewater treatment plants or directly to water receptors is hard to estimate due to therandom nature and the unpredictability to both the extent of the spill and its position relativeto the precipitation runoff system.
In the case of chemical accidents, water or foam medium are used for road cleaningpurposes or for fire fighting. The compositions of a typical and unusual load of the surfacerun-off are compared in Table 2.24.
Table 2.24 Example of a typical and unusual load in run-off water from a Germanmotorway [Ascherl, 1997, Krauth and Klein, 1982]
Parameter Run-off rain water- mean value[mg l-1]
Water for firefighting- [mg l-1]
Cd 0.0059 0.057Cr 0.0096 0.053Cu 0.097 0.203Fe 3.42 4.0Pb 0.202 0.439Zn 0.36 4.7
Information relating to the frequency of accidental spillages is presented in Table 2.25,based on data extracted from NRA (Thames Region, UK), indicating pollution incidentsregistered from 1988 to 1993 (July):
Table 2.25 Accidental spillages in Thames Region (UK)
Year 1988 1989 1990 1991 1992 1993(July)Number of incidents reported 2811 3613 3444 3417 3598 1979Road incidents reported 125 177 175 136 212 104Road incidents where pollutionsubstantiated
88 63 64 42 58 36
2. Potentially Toxic Elements
Pollutants in Urban Waste Water and Sewage Sludge 39
B Roof runoff
Runoff from roof surfaces constitutes a significant fraction of the total sealed surface runoffand is often regarded as unpolluted. Assessment of roof runoff quality found in literaturegives rather contradictory results. Some authors conclude that rain runoff from roof surfacesis polluted (e.g. Zillich 1991; Good 1993); others found that there is a low pollution potentialassociated with roof runoff (Shinoda 1990). For the specific case of potentially toxicelements pollution however, the literature seems to agree that roof runoff can be at least aspolluted as road runoff (Herrmann et al., 1994; Förster, 1999). The pollution effect is muchgreater when the source of pollutants is the roof material itself. Förster (1999) found that zincconcentrations in runoff from zinc sheet roof were actually two or three orders of magnitudeabove those measured in runoff from roofs without any metal components (i.e. fibrouscement roof).
However, even in the case of normal rooftops (non-metal dominated) there is aconcentration of potentially toxic elements to be expected due to various metal components(gutters, downspouts, fittings etc.). The main pollutants in this case are zinc and copper. Therunoff rate of zinc was proven to be considerably lower than its corrosion rate, varyingbetween 50±90% for zinc and 20±50% for copper during exposures up to five and two years,respectively (Wallinder et al., 2000). Similar to its corrosion rate, runoff rates of zinc arestrongly related to the atmospheric SO2 concentration and are, as such, different for a rural,compared to an urban or an industrial, environment. Observed lead pollution from roof runoff(which can be considered significant in many cases compared to other sources) can beexplained by the use of lead in window frames and rooftops (the case of slate roofs in Figure2.5) and the use of lead sheeting, particularly in the UK. The lead emission factor from leadflashing and roofing in Denmark is estimated at 5.10-4 kg kg-1year-1 (Jøergensen andWillems, 1987]. The presence of cadmium can be explained by the fact that cadmium is aminor contaminant of zinc products.
A study in Calais, France, and its surrounding area found that concentrations of cadmium,mercury, and lead in roof sludge were: 34.5 mg kg-1, 4.4 mg kg-1, and 4mg kg-1 respectivelyin the urban areas [ADEME, 1997]. A study carried out in Nancy in 1996 analysed wetweather runoff and determined the main metal-contributing sources. For zinc, roof runoff wasthe largest source as it contributed 72%, and road runoff only contributed 12%. For lead, themain source was again roof runoff with 33% contribution and then road runoff with 32%[Autugelle et al., AGHTM, 1996]. However, these data may not be typical, as they representone storm event.
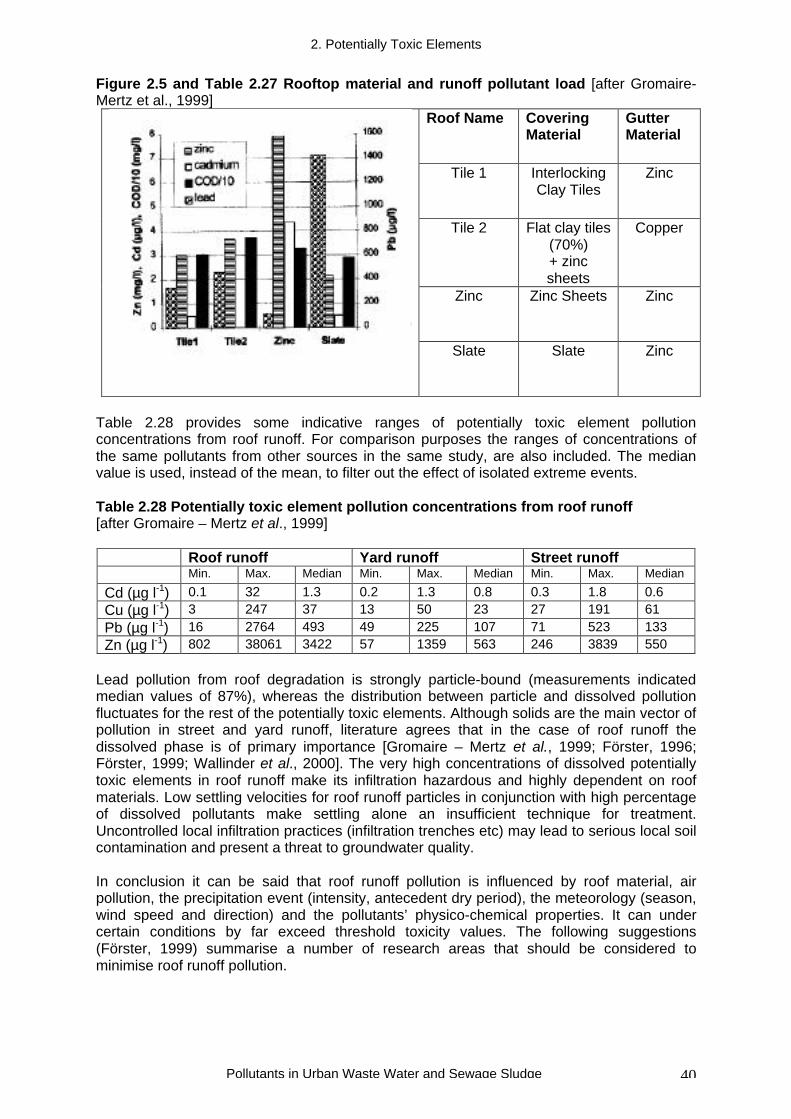
Relationships between rooftop material and runoff pollutant load can be observed in Figure2.5 and Table 2.27
2. Potentially Toxic Elements
Pollutants in Urban Waste Water and Sewage Sludge 40
Figure 2.5 and Table 2.27 Rooftop material and runoff pollutant load [after Gromaire-Mertz et al., 1999]
Roof Name CoveringMaterial
GutterMaterial
Tile 1 InterlockingClay Tiles
Zinc
Tile 2 Flat clay tiles(70%)+ zincsheets
Copper
Zinc Zinc Sheets Zinc
Slate Slate Zinc
Table 2.28 provides some indicative ranges of potentially toxic element pollutionconcentrations from roof runoff. For comparison purposes the ranges of concentrations ofthe same pollutants from other sources in the same study, are also included. The medianvalue is used, instead of the mean, to filter out the effect of isolated extreme events.
Table 2.28 Potentially toxic element pollution concentrations from roof runoff[after Gromaire – Mertz et al., 1999]
Roof runoff Yard runoff Street runoffMin. Max. Median Min. Max. Median Min. Max. Median
Cd (µg l-1) 0.1 32 1.3 0.2 1.3 0.8 0.3 1.8 0.6
Cu (µg l-1) 3 247 37 13 50 23 27 191 61
Pb (µg l-1) 16 2764 493 49 225 107 71 523 133
Zn (µg l-1) 802 38061 3422 57 1359 563 246 3839 550
Lead pollution from roof degradation is strongly particle-bound (measurements indicatedmedian values of 87%), whereas the distribution between particle and dissolved pollutionfluctuates for the rest of the potentially toxic elements. Although solids are the main vector ofpollution in street and yard runoff, literature agrees that in the case of roof runoff thedissolved phase is of primary importance [Gromaire – Mertz et al., 1999; Förster, 1996;Förster, 1999; Wallinder et al., 2000]. The very high concentrations of dissolved potentiallytoxic elements in roof runoff make its infiltration hazardous and highly dependent on roofmaterials. Low settling velocities for roof runoff particles in conjunction with high percentageof dissolved pollutants make settling alone an insufficient technique for treatment.Uncontrolled local infiltration practices (infiltration trenches etc) may lead to serious local soilcontamination and present a threat to groundwater quality.
In conclusion it can be said that roof runoff pollution is influenced by roof material, airpollution, the precipitation event (intensity, antecedent dry period), the meteorology (season,wind speed and direction) and the pollutants’ physico-chemical properties. It can undercertain conditions by far exceed threshold toxicity values. The following suggestions(Förster, 1999) summarise a number of research areas that should be considered tominimise roof runoff pollution.
2. Potentially Toxic Elements
Pollutants in Urban Waste Water and Sewage Sludge 41
• First flush diversion valves and their automated control• Sorbents for potentially toxic elements• Durable coating for potentially toxic element surfaces• Alternative materials for gutters and downpipes (eg plastics or carbon fibre based
materials, not metals or PVC)• Roof runoff quality database sufficient for predictive modelling.
C Construction and building maintenance
Contaminants from paints:While lead concentrations in consumer products (i.e. petrol) continue to decrease, thereseems to be enough residual material from historic lead use to cause high leadconcentrations in the environment. In a recent study by Davis and Burns (1998) in the US,lead runoff from painted structures in an urban setting was assessed. Although constructionpractices in the US can be considered different from those in EU, the conclusions of theDavis and Burns (1998) study should be taken into account due to the variability of thestructures investigated. In many cases, high lead concentrations were found. Leadconcentrations (100 ml over 1600 cm) from washes of 169 different structures followed theorder (geometric mean, median, Q10±Q90): wood (40, 49, 2.6±380 mg.l-1)>brick (22, 16,3.3±240 mg.l-1)>block (9.7, 8.0, <2±110 mg.l-1). Lead concentration depended strongly onpaint age and condition. Lead levels from washes of older paints were much higher thanfrom freshly painted surfaces, which were demonstrated quantitatively as: paint age [>10 y](77, 88, 6.9±590 mg.l-1)>>[5±10 y] (22, 16, <2±240 mg.l-1)>[0±5 y] (8.4, 8.1, <2±64 mg.l-1).Lead from surface washes was found to be 70% or greater in particulate lead form,suggesting the release of lead pigments from weathered paints. High intensity washes werefound to liberate more particulate lead than lower intensities. It can be concluded that oldsurface paints can contribute high masses of lead into a watershed, targeting thesestructures for source preventive actions to curtail future lead input into the environment.
Contaminants from concrete leaching:Concrete is one of the main materials used in building and road construction and issystematically in contact with precipitation, much of which ends up in the UWW collectionsystems. Recent work (PCA, 1992) identified As, Be, Cd, Cr, Hg, Ni, Pb, Sb, Se and Th inconcrete in detectable concentrations. Hillier et al. (1999) discuss the importance of theconcentrations of these pollutants in leachate from Portland cement. They concluded thatleaching of well-cured Portland cement produces undetectable concentrations of toxicmetals (such as the ones outlined in 80/778/EEC for water fit for human consumption). Inpoorly cured (1 day) Portland cement there were detectable concentrations of vanadium(reaching concentrations of 61.7 ppb). However, even this cannot be considered verysignificant, as the leaching was restricted to the surface of the samples. Furthermore, thewater-to-cement ratio has no significant impact on the leaching potential of the cement. Thisstudy suggests that concrete leaching is not a major source of metals to UWW.
D Wet and dry deposition
Rainwater can add its own absorbed and dissolved pollutants to the loads generated fromother sources. This was shown in Figure 2.3, which shows the initial potentially toxic elementloading of precipitation and the subsequent additional loading from roof, pavement and roadsurfaces. Both traffic density and location of industry have a strong influence on thedeposition of potentially toxic elements in precipitation.
The composition of atmospheric loaded precipitation water in urban regions in Germany,contaminated with atmospheric wash-out, is represented in Table 2.29.
2. Potentially Toxic Elements
Pollutants in Urban Waste Water and Sewage Sludge 42
Table 2.29 Composition of atmospheric loaded run-off water in German urban regions[Freitag et al. 1987, Göttle 1988, Hahn 1995].
PTE Values Munich(Pullach/ Harlaching)
Mean value[mg l-1]
Extreme values[mg l-1]
1988[mg l-1]
Zn 0.05-0.15 0.02-1.9 0.0945Cu 0.007-0.2 <0.06 0.0355Pb 0.03-0.11 <0.24 0.0121Cd 0.001-0.003 <0.13 0.0014Mn 0.05 <0.1 -Cr 0.002 <0.08 -
Currently, vehicle traffic, steel and glass production, and combustion processes representthe main sources of lead in the atmosphere. Data by ADEME studies have shown thatatmospheric fallout contributes 87-536 g ha-1year-1 of lead, and is particularly high in urbanareas. These studies determined that 70-80% of lead present in UWW comes from runoff,15-20% from commercial sources and 5% from domestic sources. The main cadmiumsources are from combustion processes (vehicle traffic, waste combustion in incinerationplants). Combustion processes and chlorine and steel production represent the mainsources of the atmospheric mercury emissions in the Central Region. Table 2.30 shows thereduction in Cd, Hg and Pb emissions in Austria between 1985 and 1995 as a result oflegislative controls.
Table 2.30 Emissions and predicted yearly emissions of potentially toxic elements inAustria, 1985-2010 [UBA, 1999].
PTEs 1985[t y-1]
1990[t y-1]
1995[t y-1]
Prediction2005[t y-1]
Prediction2010[t y-1]
Cadmium 4.80 3.10 1.80 1.20 1.30Mercury 4.30 2.70 1.50 1.20 1.10Lead 320.00 202.00 39.00 24.00 21.00
The presence of impermeable surfaces in urban areas prevents natural filtration processesin the soil zone from removing the pollution. The actual quality of the rain can varydependent on pollution sources other than urban traffic. In coastal areas the increasedconcentrations of sodium and chloride in precipitation will increase the susceptibility ofvehicles to corrosion. A road drainage study in Sweden noted precipitation pH of between3.8 and 4.9 [Morrison et al. 1988].
Atmospheric sources contribute significantly to the mass of contaminant available on animpervious urban surface for transport by surface runoff. This deposition may occur during astorm event or as dust fall during dry periods. Cattell and White (1989) [as reported in Ball etal. 2000] in their study in Sydney reported that the geometric mean of the total phosphorousconcentration is 29 µg l-1. If the mean annual precipitation for Sydney of approximately 1600mm is considered, then the likely annual phosphorus load is approximately 0.5kg ha-1y-1,which is more than half the likely annual phosphorus load from an urban catchment of 0.7kgha-1y-1 [Lawrence and Goyen, 1987] to 1.1kg ha-1y-1 [Cullen, 1995].
The second of the two atmospheric sources of contamination is dry deposition in the periodbetween storm events. For dry deposition, removal by stormwater runoff is not the solemechanism responsible for depletion of the contaminant store, which is developed on thecatchment surface. As well as removal by storm events, removal also can occur throughstreet sweeping, through the local turbulence arising from the motion of vehicles on roads,and through wind events where the wind has sufficient capacity to entrain the contaminantand to move it from the surface of the urban catchment [Ball et al., 2000].
2. Potentially Toxic Elements
Pollutants in Urban Waste Water and Sewage Sludge 43
Table 2.31 Dry Weather Build-up of Contaminants on Road Surfaces[after Ball et al., 1998]
Constituent Load (mg/m of gutter)Constituent Minimum Maximum MeanPb 1.4 7.4 3.7Zn 0.7 3.9 1.8Cu 0.3 1.8 0.9Cr 0.02 0.61 0.14P 0.23 1.9 0.8
Dry atmospheric fallout can be responsible for large proportions of road dust but estimatesvary according to atmospheric and weather patterns, as well as with different sampling andestimation methods. Nevertheless, atmospheric deposition can be very significant proportionof the total particulate/sediment input to a highway and since much of it is inert, inorganicand often calcareous in nature (depending upon local geology and building stone), it canprove beneficial in neutralising acid emissions, reducing potentially toxic element solubilityand assisting in the binding of organic and other pollutants [Luker and Montague, 1994].
Snowfall has an increased pollutant scavenging efficiency because of the large snowflakesurface area and the increased ionic strength of the melt water provides enhanced metalexchange capabilities. Trees in urban settings are also effective scavengers of metals, whichare deposited on surfaces at leaf fall.
Atmospheric contaminants are deposited during the early stages of a precipitation event andtherefore the resulting impermeable surface loading tends to be independent of bothprecipitation volume and intensity, with the pollutant load tending to increase with the lengthof antecedent dry period and with local traffic density.
E Sewer cleaningSewer cleaning is carried out for a number of reasons, but principally to deal with blockagesor to remove sediment in order to restore hydraulic capacity and limit pollutant accumulation.A number of cleaning techniques and methods is in use, depending particularly on locationand severity, including rodding, winching, jetting, flushing and hand excavation (Lester &Gale, 1979). A combination of more than one method may well be used in any particularlocality.
The frequency with which sewers are cleaned will depend on the maintenance strategy inoperation. If reactive maintenance is used, problems are dealt with on a corrective basis asthey arise (i.e. after failure). This approach will always be required to a certain extent, asproblems and emergencies occur from time-to-time in every system. However, its frequencycannot be predicted. In planned maintenance, potential problems are dealt with prior tofailure. Unlike reactive maintenance, planned maintenance is proactive and has the objectiveof reducing the frequency or risk of failure (Butler & Davies, 2000). Planned maintenancediffers from routine maintenance (operations at standard intervals, regardless of need), andinvolves identifying elements that require maintenance and then determining the optimumfrequency of attention. Frequency of cleaning will thus vary from place to place but is usuallyless than once per year even in heavily affected sewers.
Sediment removed from sewers during cleaning is normally classified as a controlled waste,and is therefore disposed of to licensed landfill sites.
2. Potentially Toxic Elements
Pollutants in Urban Waste Water and Sewage Sludge 44
2.2 Influence of various treatment processes on the fate of potentially toxic elementsthrough WWTS and SST
PTE transfers to sewage sludgeSludges from conventional sewage treatment plants are derived from primary, secondaryand tertiary treatment processes. The polluting load in the raw waste water is transferred tothe sludge as settled solids at the primary stage and as settled biological sludge at thesecondary stage. Potentially toxic elements are also removed with the solids during theprimary and secondary sedimentation stages of conventional wastewater treatment. Metalremoval during primary sedimentation is a physical process, dependent on the settlement ofprecipitated, insoluble metal or the association of metals with settleable particulate matter.Minimal removal of dissolved metals occurs at this stage and the proportion of dissolvedmetal to total metal in the effluent increases as a result. The efficiency of suspended solidsremoval is the main process influencing the extent of metal removal during primarywastewater treatment. However, the relative solubilities of different elements present in thewastewater are also important. Thus, nickel shows the poorest removal (24 %) duringprimary treatment whereas 40 % of the Cd and Cr in raw influent is transferred to the primarysludge. Primary treatment typically removes more than 50 % of the Zn, Pb and Cu present inraw sewage.
The removal of metals during secondary wastewater treatment is dependent upon theuptake of metals by the microbial biomass and the separation of the biomass duringsecondary sedimentation. Several mechanisms control metal removal during biologicalsecondary treatment including:
• physical trapping of precipitated metals in the sludge floc;• binding of soluble metal to bacterial extracellular polymers;
In general; the patterns in metal removal from settled sewage by secondary treatment aresimilar to those recorded for primary sedimentation. However, the general survey of removalefficiencies listed in Table 2.32 suggests that secondary treatment (by the activated sludgeprocess) is more efficient at removing Cr than the primary stage. Operational experience andmetal removals measured by experimental pilot plant systems provide guidance on theoverall likely removal and transfers to sludge of potentially toxic elements from raw sewageduring conventional primary and secondary wastewater treatment. This shows thatapproximately 70 – 75 % of the Zn, Cu, Cd, Cr, Hg, Se, As and Mo in raw sewage isremoved and transferred to the sludge (Blake, 1979) and concentrations of these elementsin the final effluent would be expected to decrease by the same amount compared with theinfluent to the works. Lead may achieve a removal of 80 %, whereas the smallest overallreductions are obtained for Ni and approximately 40 % of this metal may be transferred tothe sludge.
The majority of potentially toxic elements in raw sewage are partitioned during wastewatertreatment into the sewage sludge or the treated effluent. However, atmospheric volatilisationof Hg as methylmercury, formed by aerobic methylation biotransformation processes, is alsosuggested as a possible mechanism contributing to the removal of this element duringsecondary wastewater treatment by the activated sludge system (Yamada et al., 1959).Whilst some of the Hg removal observed in activated sludge may be attributed to bacteriallymediated volatilisation, it is unlikely that this is a major route of Hg loss because of thesignificant quantities of Hg recovered in surplus activated sludge (Lester, 1981).
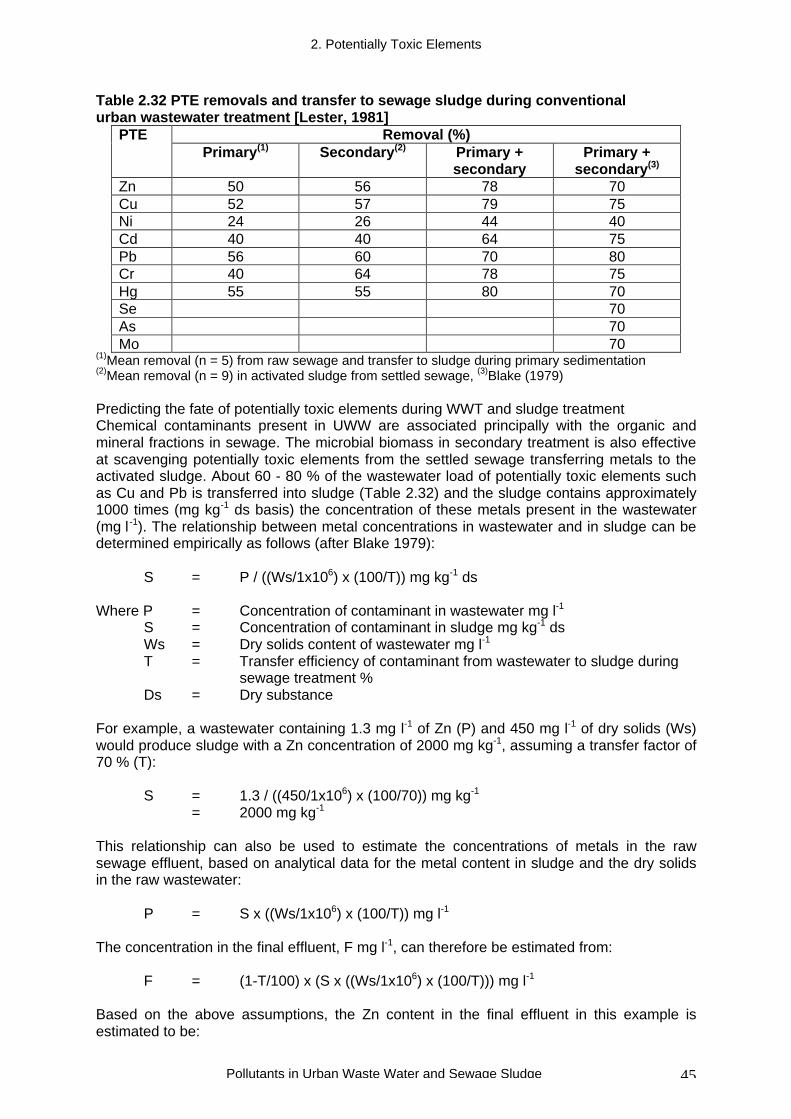
2. Potentially Toxic Elements
Pollutants in Urban Waste Water and Sewage Sludge 45
Table 2.32 PTE removals and transfer to sewage sludge during conventionalurban wastewater treatment [Lester, 1981]
PTE Removal (%)Primary(1) Secondary(2) Primary +
secondaryPrimary +
secondary(3)
Zn 50 56 78 70Cu 52 57 79 75Ni 24 26 44 40Cd 40 40 64 75Pb 56 60 70 80Cr 40 64 78 75Hg 55 55 80 70Se 70As 70Mo 70
(1)Mean removal (n = 5) from raw sewage and transfer to sludge during primary sedimentation(2)Mean removal (n = 9) in activated sludge from settled sewage, (3)Blake (1979)
Predicting the fate of potentially toxic elements during WWT and sludge treatmentChemical contaminants present in UWW are associated principally with the organic andmineral fractions in sewage. The microbial biomass in secondary treatment is also effectiveat scavenging potentially toxic elements from the settled sewage transferring metals to theactivated sludge. About 60 - 80 % of the wastewater load of potentially toxic elements suchas Cu and Pb is transferred into sludge (Table 2.32) and the sludge contains approximately1000 times (mg kg-1 ds basis) the concentration of these metals present in the wastewater(mg l -1). The relationship between metal concentrations in wastewater and in sludge can bedetermined empirically as follows (after Blake 1979):
S = P / ((Ws/1x106) x (100/T)) mg kg-1 ds
Where P = Concentration of contaminant in wastewater mg l-1
S = Concentration of contaminant in sludge mg kg-1 dsWs = Dry solids content of wastewater mg l-1
T = Transfer efficiency of contaminant from wastewater to sludge during sewage treatment %
Ds = Dry substance
For example, a wastewater containing 1.3 mg l-1 of Zn (P) and 450 mg l-1 of dry solids (Ws)would produce sludge with a Zn concentration of 2000 mg kg-1, assuming a transfer factor of70 % (T):
S = 1.3 / ((450/1x106) x (100/70)) mg kg-1
= 2000 mg kg-1
This relationship can also be used to estimate the concentrations of metals in the rawsewage effluent, based on analytical data for the metal content in sludge and the dry solidsin the raw wastewater:
P = S x ((Ws/1x106) x (100/T)) mg l-1
The concentration in the final effluent, F mg l-1, can therefore be estimated from:
F = (1-T/100) x (S x ((Ws/1x106) x (100/T))) mg l-1
Based on the above assumptions, the Zn content in the final effluent in this example isestimated to be:
2. Potentially Toxic Elements
Pollutants in Urban Waste Water and Sewage Sludge 46
F = (1-70/100) x (2000 x ((450/1x106) x (100/70))) mg l-1
= 0.4 mg l-1
A more mechanistic approach to predicting the fate of metals during wastewater treatment isdescribed by Monteith et al. (1993) using a computer-based mathematical model. Themechanistic model, TOXCHEM (Bell et al., 1989), includes both steady state and dynamicmodels to simulate operation of a conventional activated sludge plant, incorporating gritremoval, primary clarification, aeration and secondary clarification unit processes.Biodegradation, surface volatilisation, air stripping, precipitation and sorption removalmechanisms are determined for trace metallic and organic contaminants in the model’sdatabase. A sensitivity analysis feature allows the user to investigate the impact of designand operating conditions and the contaminant’s physical/chemical properties on removal byunit process and by mechanism.
Inputs to the TOXCHEM model include influent wastewater flow rate, influent metalsconcentrations, dimensions of individual process units, plant operation conditions (e.g. mixedliquor suspended solids concentration), and raw wastewater, primary effluent, andsecondary effluent suspended solids concentrations. The model then predicts metalconcentrations in primary sludge, return activated sludge, surplus activated sludge, andsecondary settler effluent, based on mass balance calculations and removals throughprecipitation and sorption. The steady-state model accounts for removal by sorption ofsoluble metals onto settleable solids and precipitation of the metals into a settleable form.The following assumptions were used to develop the model equations:
1, The system is at equilibrium with regard to sorption and desorption;2, Sorption follows a linear isotherm;3, Precipitation and dissolution are instantaneous;4, Precipitated metals are integrated into the biomass and are removed at the same
efficiency as the bulk solids during primary and secondary settlement.
In both the primary settlement and aeration tanks, the model calculates the metalconcentrations in the soluble and solid phases:
Ct = Cs + Cx
Cx = Cp + KpXCs
Where:
Ct = total metal concentration, mg l-1
Cs = soluble metal concentration, mg l-1
Cx = solid-phase metal concentration, mg l-1
Cp = concentration of precipitated metal, mg l-1
Kp = linear sorption coefficient, l g-1
X = mixed liquor volatile suspended solids (MLVSS) concentration, g l-1
The values of Kp and metal solubilities are experimentally defined. Solubility was determinedfrom dosing studies in which metal concentrations were measured in filtered and unfilteredwastewater samples at equilibrium.The soluble, sorbed and precipitated metal fractions are calculated by the expression:
Ctest = CT,0/(1 + KP.1Xo)Where
CT,0 = influent total metal concentrationKP.1 = primary clarifier sorption coefficientXo = influent volatile suspended solids (VSS) concentration.
2. Potentially Toxic Elements
Pollutants in Urban Waste Water and Sewage Sludge 47
Fractional removal of metals in the primary and secondary settlers is calculated by:FRm = (FRsolidsCx)/CT,0
WhereFRm = fractional removal of metal in settler, andFRsolid = fractional removal of solids in settler.
Fractional removal of the solids is input by the user based on site-specific experience. Theoutput for the primary and secondary settlers is calculated by:
Ct,out = (1-FRm) CT,0
Where Ct,out = total outlet metal concentration.
The TOXCHEM model was validated against operational data on effluent metal contentscollected from a full-scale wastewater treatment plant (Table 2.33). The predictions werecompared to observed values in the final effluent using linear regression analysis and the r2
statistic. Copper exhibited the highest correlation between predicted and observed effluentconcentrations of the elements tested and the r2 value for this metal was 0.96. The modelpredicted that 70 % of this element would be transferred to the sewage sludge. Zinc alsogave relatively good agreement between predicted and observed effluent concentrations andthe results showed that 50 – 60 % of Zn in wastewater would be recovered in the sludge.The poorest correlation of modelled and actual values was obtained for Ni and the r2 was0.41 in this case. The model underestimated the removal of Ni by the wastewater treatmentplant and the predicted value was 26 % compared with the observed removal of 37 %. Leadand Cr have low solubilities and in both cases, the TOXCHEM model predicted much largerremovals of approximately 70 % for these metals than was observed in practice at thesewage treatment works. However, the model predictions for Pb and Cr were comparablewith operational experience at other wastewater treatment plant (Table 2.32). The slopes ofthe regressions lines fell within the range 0.58 – 1.96 bracketing the ideal slope of 1.0. Themodel provided good representations of the concentrations of Cu, Ni and Zn in the finaleffluent, but was less satisfactory for Pb or Cr. Cadmium was not subject to the verificationexercise because concentrations in the effluent were below the analytical limit of detection.The modelling and experimental studies showed that Cd and Ni were the most solublemetals, and the most poorly removed, while Pb and Cr were the least soluble. The majorityof metals, with the exception of Ni, were maintained in the mixed liquor, and the masscollected in effluent was small in comparison to the total influent mass. At low metalconcentrations (0.02 – 0.1 mg l-1), the soluble fraction is controlled by sorption to solids. Atlarger influent metal concentrations, precipitation is the main process controlling solublemetal fractions. In consequence of this differential fate of metals in WWTS, nickel may needtighter regulation at source to reduce the amount in the effluent.
The mechanistic approach to model development incorporates the main chemical andphysical processes that are recognised as being important in removing metals fromwastewater. However, in some circumstances, there may be specific properties of awastewater at a particular treatment works that influence metal behaviour and removalefficiency that are not accounted for by these basic assumptions. For example, recoveries ofinsoluble elements such as Cr or Pb in sewage sludge are usually relatively high and of theorder >75 % (Table 2.33). This contrasts with the recoveries of these elements measured byMonteith et al. (1993), which were much lower than those normally observed in practice.Operational and mechanistic models have the capability to predict partitioning anddistribution of potentially toxic elements from raw sewage during conventional wastewatertreatment. They provide insights into the physico-chemical processes controlling metalremoval in terms of solubility, sorption and precipitation mechanisms, and calculate the massbalance and partitioning of metals into sewage sludge and the final effluent. The metalconcentration in sludge can be calculated using the estimated partitioning coefficients andthe mass of primary and biological sludge produced by primary sedimentation andsecondary wastewater treatment.
2. Potentially Toxic Elements
Pollutants in Urban Waste Water and Sewage Sludge 48
Table 2.33 Predicted metal concentrations in sewage effluents estimated by theTOXCHEM model relative to observed values at a full-scale sewage treatment plant(adapted from Monteith et al., 1993)
PTE Mean concentration (mg l-1) Removal (%)Influent Observed
effluentPredictedeffluent
r2 forpredicted
vs.observed
Observed Predicted
Zn 0.120 0.051 0.057 0.61 58 53Cu 0.120 0.041 0.034 0.96 66 72Ni 0.027 0.017 0.020 0.41 37 26Pb 0.069 0.051 0.022 0.66 26 68Cr 0.026 0.016 0.007 0.63 39 73
Effect of stabilization processes on metal concentrations in sewage sludgePotentially toxic element concentrations in sewage sludge are influenced significantly by thetype of stabilization process operated at a WWTS. For example, the destruction of volatilesolids by microbial decomposition of putrescible organic matter in sludge by mesophilicanaerobic digestion or aerobic composting processes increase the metal content in directrelation to the extent of volatile solids removal by microbial decomposition.
Unstabilised, co-settled primary + activated sludge typically contains 75 % of volatile matteron a dry solids basis. During anaerobic digestion, 40 % of the volatile matter is destroyedreducing the volatile solids concentration in digested sludge by about 50 % compared to theundigested product. Potentially toxic elements are conserved and are retained in the sludgeduring the digestion process. As a consequence of the microbial decomposition of organicmatter, metal concentrations increase in direct proportion to the loss of solids and aretypically raised by approximately 40 % compared with undigested sludge.
Volatile matter is also lost during aerobic composting of sewage sludge (Figure 2.6).Composting dewatered sewage sludge cake requires a bulking agent, such as straw orwoodchips, to increase porosity and reduce moisture content to values that will supportaerobic microbial decomposition processes. Straw is often used for this purpose and may bemixed with sludge cake at 25 % ds at a rate of 5 – 10 % on a fresh weight basis (Smith andHall, 1991). The addition of bulking agent to sludge reduces the initial metal concentration.However, metal concentrations in the composting material increase proportionally in linearrelation to the extent of volatile matter destruction by microbial activity. In windrowcomposting trials (Smith and Hall, 1991), for example, the volatile solids concentration ofcomposting sewage sludge and straw decreased by 21 % during a period of 100 days(Figure 2.6). During that period, the metal concentration in the composted product wasincreased above the value in the original sludge (Figure 2.7).
2. Potentially Toxic Elements
Pollutants in Urban Waste Water and Sewage Sludge 49
Figure 2.6 Volatile solids content of sludge-straw compost at different rates of strawaddition (fresh weight) to sludge cake (25 % ds) over time (Smith and Hall, 1991)
Sludge stabilisation processes reduce the fermentability of the sludge and the potentialodour nuisance and health hazards associated with its use on agricultural land. However,the loss of volatile matter during microbial decomposition also significantly increases itsmetal content by as much as 40 % compared with material that has not been subject to abiological stabilisation process. More than 75 % of the sludge produced in the EU is treatedby anaerobic or aerobic digestion. Despite the wide adoption of biological stabilisationprocesses for sludge throughout the EU, which generally increase the metal content ofsludge, reported potentially toxic element concentrations in sewage sludge continue todecline (e.g. Figure 2.7).
This further emphasizes the major and significant improvements in sludge quality, in terms ofpotentially toxic element content, that have been achieved in the past 20 years throughimproved industrial practices and the successful and effective implementation of tradeeffluent controls.
50
55
60
65
70
75
0 20 40 60 80 100 120
5.0%7.0%8.5%
Time (days)
VolatileSolidsContent (%)
2. Potentially Toxic Elements
Pollutants in Urban Waste Water and Sewage Sludge 50
Figure 2.7 (a) Cu and (b) Zn concentrations in sewage sludge-straw compost inrelation to volatile solids content (Smith and Hall, 1991)
500
600700
800900
1000
11001200
1300
50 55 60 65 70 75
Cu
(mg
kg-1 d
s)
0200400600800
1000120014001600
50 55 60 65 70 75
Zn
(mg
kg-1 d
s)
Volatile Solids Content (%)
2. Potentially Toxic Elements
Pollutants in Urban Waste Water and Sewage Sludge 51
Figure 2.8 Reduction in (a) zinc and (b) cadmium concentrations (untransformed andlog10 transformed data, respectively) in sewage sludge from Nottingham STW, UKduring the period 1978 – 1999
Tot
al Z
n (m
g kg
-1 d
s)
400
600
800
1000
1200
1400
1600
1800
2000
1978 1983 1988 1993 1998
(a) Zinc (b) Cadmium
Tot
al C
d (L
og m
g kg
-1 d
s)
0
0.2
0.4
0.6
0.8
1
1.2
1.4
1.6
1.8
2
1978 1983 1988 1993 1998
YearYear
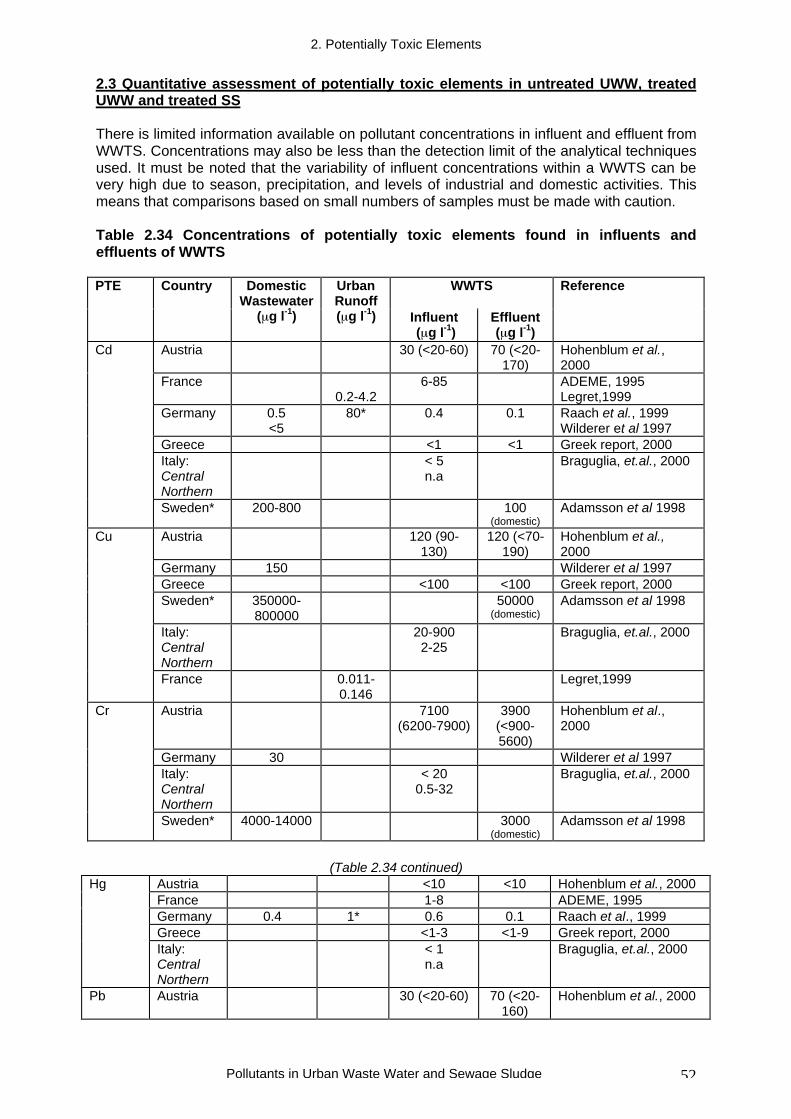
2. Potentially Toxic Elements
Pollutants in Urban Waste Water and Sewage Sludge 52
2.3 Quantitative assessment of potentially toxic elements in untreated UWW, treatedUWW and treated SS
There is limited information available on pollutant concentrations in influent and effluent fromWWTS. Concentrations may also be less than the detection limit of the analytical techniquesused. It must be noted that the variability of influent concentrations within a WWTS can bevery high due to season, precipitation, and levels of industrial and domestic activities. Thismeans that comparisons based on small numbers of samples must be made with caution.
Table 2.34 Concentrations of potentially toxic elements found in influents andeffluents of WWTS
WWTSPTE Country DomesticWastewater
( g l-1)
UrbanRunoff( g l-1) Influent
( g l-1)Effluent( g l-1)
Reference
Austria 30 (<20-60) 70 (<20-170)
Hohenblum et al.,2000
France0.2-4.2
6-85 ADEME, 1995Legret,1999
Germany 0.5<5
80* 0.4 0.1 Raach et al., 1999Wilderer et al 1997
Greece <1 <1 Greek report, 2000Italy:CentralNorthern
< 5n.a
Braguglia, et.al., 2000
Cd
Sweden* 200-800 100(domestic)
Adamsson et al 1998
Austria 120 (90-130)
120 (<70-190)
Hohenblum et al.,2000
Germany 150 Wilderer et al 1997Greece <100 <100 Greek report, 2000Sweden* 350000-
80000050000
(domestic)Adamsson et al 1998
Italy:CentralNorthern
20-9002-25
Braguglia, et.al., 2000
Cu
France 0.011-0.146
Legret,1999
Austria 7100(6200-7900)
3900(<900-5600)
Hohenblum et al.,2000
Germany 30 Wilderer et al 1997Italy:CentralNorthern
< 200.5-32
Braguglia, et.al., 2000
Cr
Sweden* 4000-14000 3000(domestic)
Adamsson et al 1998
(Table 2.34 continued)Austria <10 <10 Hohenblum et al., 2000France 1-8 ADEME, 1995Germany 0.4 1* 0.6 0.1 Raach et al., 1999Greece <1-3 <1-9 Greek report, 2000
Hg
Italy:CentralNorthern
< 1n.a
Braguglia, et.al., 2000
Pb Austria 30 (<20-60) 70 (<20-160)
Hohenblum et al., 2000
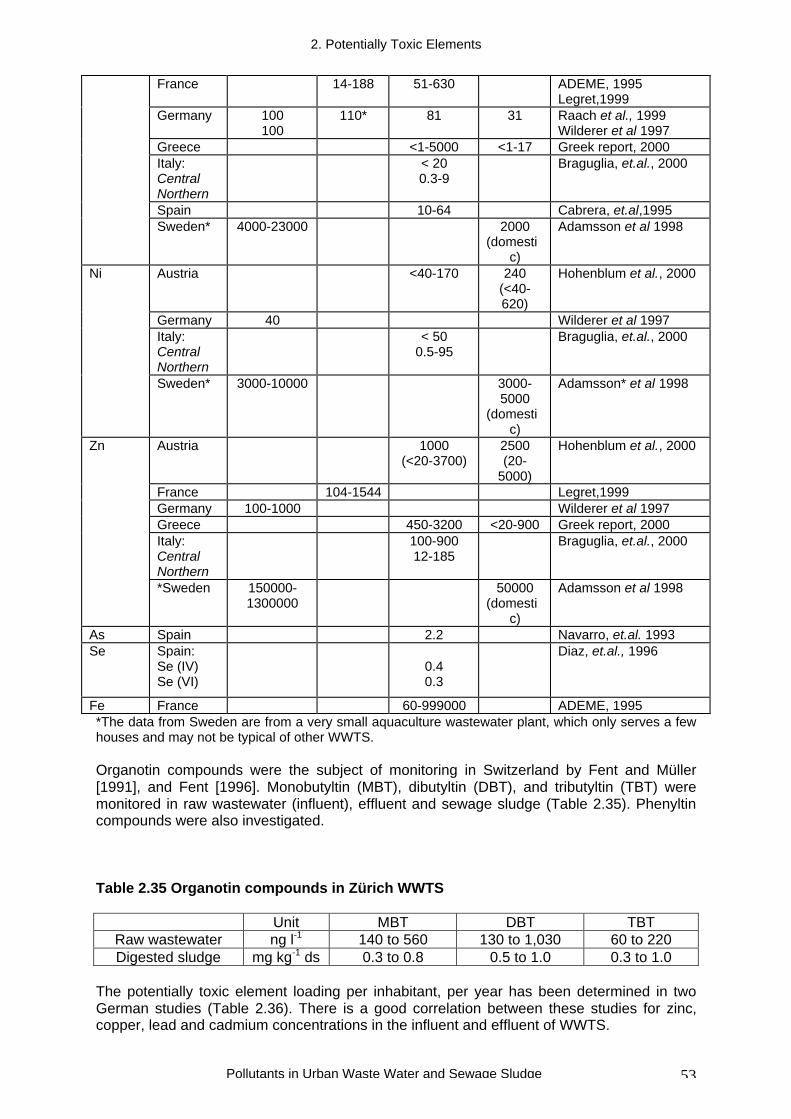
2. Potentially Toxic Elements
Pollutants in Urban Waste Water and Sewage Sludge 53
France 14-188 51-630 ADEME, 1995Legret,1999
Germany 100100
110* 81 31 Raach et al., 1999Wilderer et al 1997
Greece <1-5000 <1-17 Greek report, 2000Italy:CentralNorthern
< 200.3-9
Braguglia, et.al., 2000
Spain 10-64 Cabrera, et.al,1995Sweden* 4000-23000 2000
(domestic)
Adamsson et al 1998
Austria <40-170 240(<40-620)
Hohenblum et al., 2000
Germany 40 Wilderer et al 1997Italy:CentralNorthern
< 500.5-95
Braguglia, et.al., 2000
Ni
Sweden* 3000-10000 3000-5000
(domestic)
Adamsson* et al 1998
Austria 1000(<20-3700)
2500(20-
5000)
Hohenblum et al., 2000
France 104-1544 Legret,1999Germany 100-1000 Wilderer et al 1997Greece 450-3200 <20-900 Greek report, 2000Italy:CentralNorthern
100-90012-185
Braguglia, et.al., 2000
Zn
*Sweden 150000-1300000
50000(domesti
c)
Adamsson et al 1998
As Spain 2.2 Navarro, et.al. 1993Se Spain:
Se (IV)Se (VI)
0.40.3
Diaz, et.al., 1996
Fe France 60-999000 ADEME, 1995*The data from Sweden are from a very small aquaculture wastewater plant, which only serves a fewhouses and may not be typical of other WWTS.
Organotin compounds were the subject of monitoring in Switzerland by Fent and Müller[1991], and Fent [1996]. Monobutyltin (MBT), dibutyltin (DBT), and tributyltin (TBT) weremonitored in raw wastewater (influent), effluent and sewage sludge (Table 2.35). Phenyltincompounds were also investigated.
Table 2.35 Organotin compounds in Zürich WWTS
Unit MBT DBT TBTRaw wastewater ng l-1 140 to 560 130 to 1,030 60 to 220Digested sludge mg kg-1 ds 0.3 to 0.8 0.5 to 1.0 0.3 to 1.0
The potentially toxic element loading per inhabitant, per year has been determined in twoGerman studies (Table 2.36). There is a good correlation between these studies for zinc,copper, lead and cadmium concentrations in the influent and effluent of WWTS.
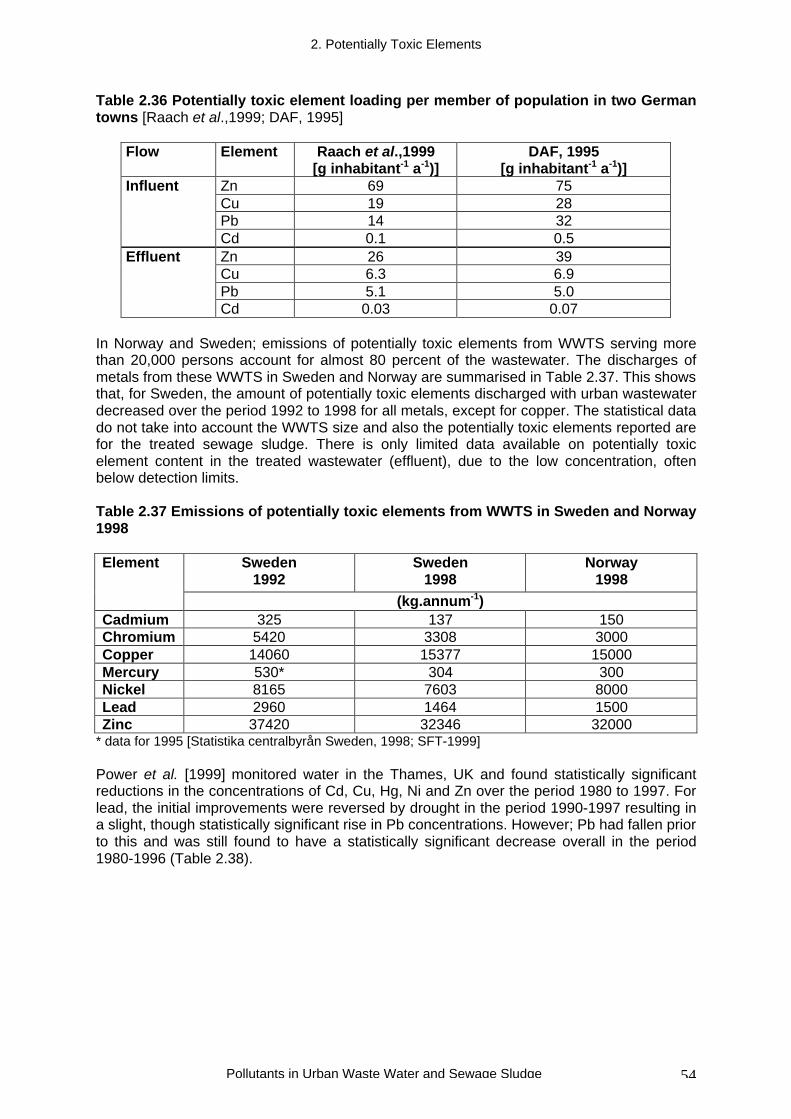
2. Potentially Toxic Elements
Pollutants in Urban Waste Water and Sewage Sludge 54
Table 2.36 Potentially toxic element loading per member of population in two Germantowns [Raach et al.,1999; DAF, 1995]
Flow Element Raach et al.,1999[g inhabitant-1 a-1)]
DAF, 1995[g inhabitant-1 a-1)]
Zn 69 75Cu 19 28Pb 14 32
Influent
Cd 0.1 0.5Zn 26 39Cu 6.3 6.9Pb 5.1 5.0
Effluent
Cd 0.03 0.07
In Norway and Sweden; emissions of potentially toxic elements from WWTS serving morethan 20,000 persons account for almost 80 percent of the wastewater. The discharges ofmetals from these WWTS in Sweden and Norway are summarised in Table 2.37. This showsthat, for Sweden, the amount of potentially toxic elements discharged with urban wastewaterdecreased over the period 1992 to 1998 for all metals, except for copper. The statistical datado not take into account the WWTS size and also the potentially toxic elements reported arefor the treated sewage sludge. There is only limited data available on potentially toxicelement content in the treated wastewater (effluent), due to the low concentration, oftenbelow detection limits.
Table 2.37 Emissions of potentially toxic elements from WWTS in Sweden and Norway1998
Sweden1992
Sweden1998
Norway1998
Element
(kg.annum-1)Cadmium 325 137 150Chromium 5420 3308 3000Copper 14060 15377 15000Mercury 530* 304 300Nickel 8165 7603 8000Lead 2960 1464 1500Zinc 37420 32346 32000
* data for 1995 [Statistika centralbyrån Sweden, 1998; SFT-1999]
Power et al. [1999] monitored water in the Thames, UK and found statistically significantreductions in the concentrations of Cd, Cu, Hg, Ni and Zn over the period 1980 to 1997. Forlead, the initial improvements were reversed by drought in the period 1990-1997 resulting ina slight, though statistically significant rise in Pb concentrations. However; Pb had fallen priorto this and was still found to have a statistically significant decrease overall in the period1980-1996 (Table 2.38).
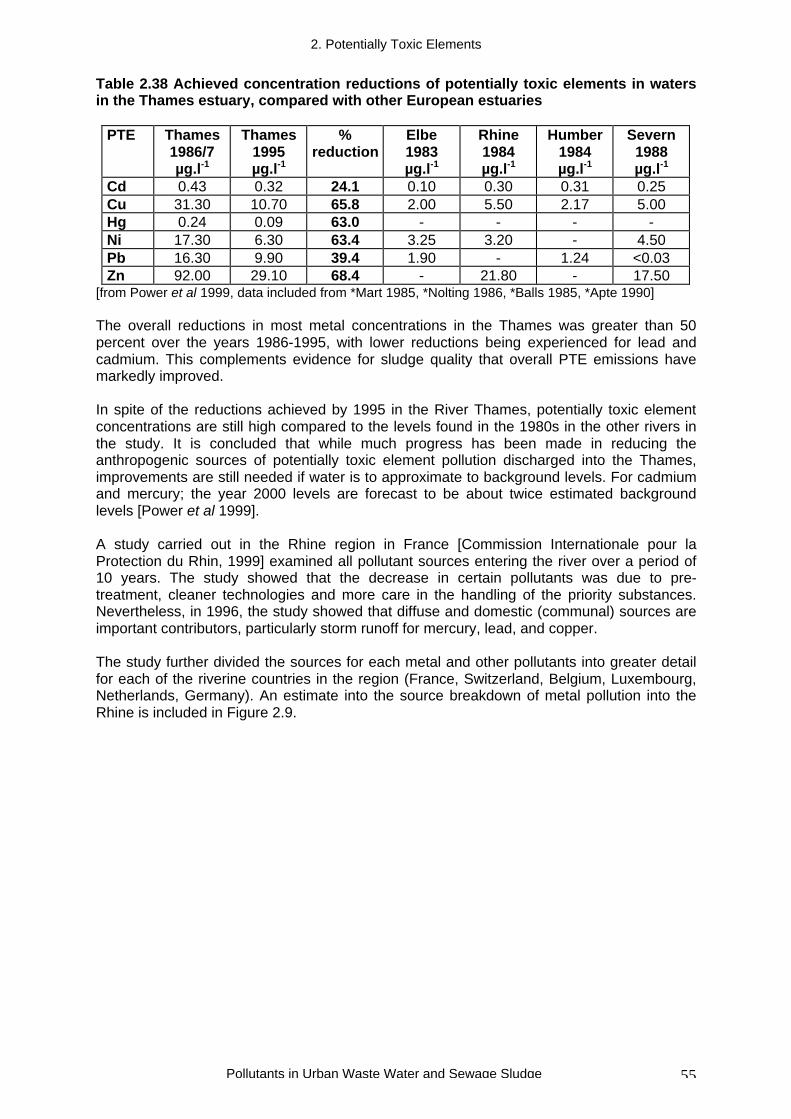
2. Potentially Toxic Elements
Pollutants in Urban Waste Water and Sewage Sludge 55
Table 2.38 Achieved concentration reductions of potentially toxic elements in watersin the Thames estuary, compared with other European estuaries
PTE Thames1986/7µg.l-1
Thames1995µg.l-1
%reduction
Elbe1983µg.l-1
Rhine1984µg.l-1
Humber1984µg.l-1
Severn1988µg.l-1
Cd 0.43 0.32 24.1 0.10 0.30 0.31 0.25Cu 31.30 10.70 65.8 2.00 5.50 2.17 5.00Hg 0.24 0.09 63.0 - - - -Ni 17.30 6.30 63.4 3.25 3.20 - 4.50Pb 16.30 9.90 39.4 1.90 - 1.24 <0.03Zn 92.00 29.10 68.4 - 21.80 - 17.50
[from Power et al 1999, data included from *Mart 1985, *Nolting 1986, *Balls 1985, *Apte 1990]
The overall reductions in most metal concentrations in the Thames was greater than 50percent over the years 1986-1995, with lower reductions being experienced for lead andcadmium. This complements evidence for sludge quality that overall PTE emissions havemarkedly improved.
In spite of the reductions achieved by 1995 in the River Thames, potentially toxic elementconcentrations are still high compared to the levels found in the 1980s in the other rivers inthe study. It is concluded that while much progress has been made in reducing theanthropogenic sources of potentially toxic element pollution discharged into the Thames,improvements are still needed if water is to approximate to background levels. For cadmiumand mercury; the year 2000 levels are forecast to be about twice estimated backgroundlevels [Power et al 1999].
A study carried out in the Rhine region in France [Commission Internationale pour laProtection du Rhin, 1999] examined all pollutant sources entering the river over a period of10 years. The study showed that the decrease in certain pollutants was due to pre-treatment, cleaner technologies and more care in the handling of the priority substances.Nevertheless, in 1996, the study showed that diffuse and domestic (communal) sources areimportant contributors, particularly storm runoff for mercury, lead, and copper.
The study further divided the sources for each metal and other pollutants into greater detailfor each of the riverine countries in the region (France, Switzerland, Belgium, Luxembourg,Netherlands, Germany). An estimate into the source breakdown of metal pollution into theRhine is included in Figure 2.9.
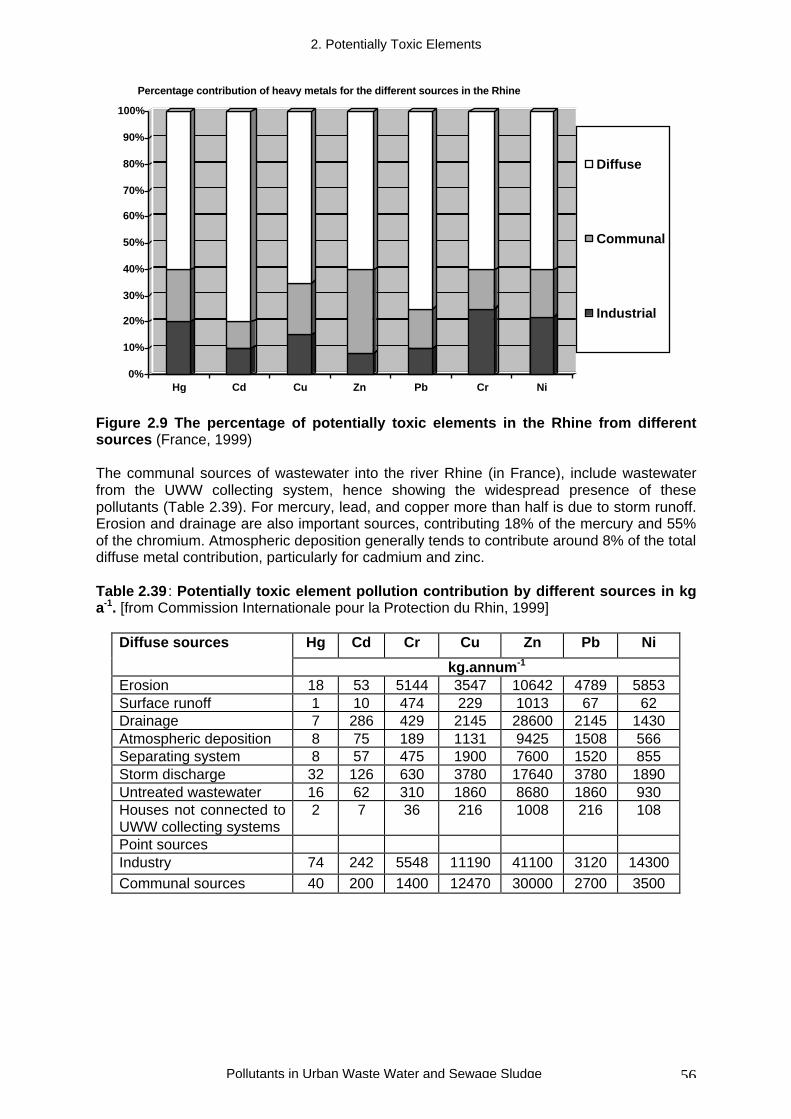
2. Potentially Toxic Elements
Pollutants in Urban Waste Water and Sewage Sludge 56
0%
10%
20%
30%
40%
50%
60%
70%
80%
90%
100%
Hg Cd Cu Zn Pb Cr Ni
Percentage contribution of heavy metals for the different sources in the Rhine
Diffuse
Communal
Industrial
Figure 2.9 The percentage of potentially toxic elements in the Rhine from differentsources (France, 1999)
The communal sources of wastewater into the river Rhine (in France), include wastewaterfrom the UWW collecting system, hence showing the widespread presence of thesepollutants (Table 2.39). For mercury, lead, and copper more than half is due to storm runoff.Erosion and drainage are also important sources, contributing 18% of the mercury and 55%of the chromium. Atmospheric deposition generally tends to contribute around 8% of the totaldiffuse metal contribution, particularly for cadmium and zinc.
Table 2.39 : Potentially toxic element pollution contribution by different sources in kga-1. [from Commission Internationale pour la Protection du Rhin, 1999]
Hg Cd Cr Cu Zn Pb NiDiffuse sources
kg.annum-1
Erosion 18 53 5144 3547 10642 4789 5853Surface runoff 1 10 474 229 1013 67 62Drainage 7 286 429 2145 28600 2145 1430Atmospheric deposition 8 75 189 1131 9425 1508 566Separating system 8 57 475 1900 7600 1520 855Storm discharge 32 126 630 3780 17640 3780 1890Untreated wastewater 16 62 310 1860 8680 1860 930Houses not connected toUWW collecting systems
2 7 36 216 1008 216 108
Point sourcesIndustry 74 242 5548 11190 41100 3120 14300
Communal sources 40 200 1400 12470 30000 2700 3500
2. Potentially Toxic Elements
Pollutants in Urban Waste Water and Sewage Sludge 57
A comparison of potentially toxic element concentrations in sewage sludge applied tofarmland in different countries within the EU (Table 2.40) indicates there is some variationapparent in the metal contents of sludges used in agriculture. For example the reportedaverage concentrations of Cd in German and UK sludges in 1996 were 1.5 and 3.5 mg kg-1,respectively (CEC, 2000a). This could indicate differences in the amount of Cd discharged tosewer in these countries from industrial, domestic and diffuse inputs or the adoption ofdifferent sludge treatment practices and regulatory procedures influencing metal content.However, these issues are difficult to reconcile given the policies on preventing industrialdischarges of Cd followed in both countries and that both states practice extensive sludgestabilisation treatment. A possible explanation may be related to the statistical characteristicsof metal concentration data and how data on metal contents in sludge are reported. Forexample, CEC (2000a) does not state whether arithmetic averages or weighted averagesare given for metal contents. The UK figures are weighted according to works size andprovide a conservative estimate of sludge metal content because sludge from largetreatment works usually have larger metal concentrations compared with smaller works (EA,1999). For example, the median Cd concentration in sludge used on to farmland from largeworks (2.9 mg Cd kg-1, pe>150000) in the UK was more than twice that from small works(1.3 mg Cd kg-1, pe<10000) in 1996/97. This trend could be interpreted as being the result ofhigher industrial inputs of metals to the large works, although it may also be explained by thegreater interception of atmospheric deposition of metals by paved areas in urban centresthat are served by the largest sewage treatment works. The majority of sludge recycled toland in the UK is produced by 55 large works (160,000 t ds y-1) whereas approximately 840small works generate sludge (45,000 t ds y-1) for agricultural use. Therefore, an arithmeticmean would indicate a significantly lower concentration was apparent for sludge because allworks would have equal weighting. Indeed, the median concentrations recorded for UKsludge are comparable to the values reported for Germany.
Table 2.40 Comparison of potentially toxic element concentrations (mg kg-1) insewage sludge applied to agricultural land in Germany and the United Kingdom in1996 (CEC, 2000)
Potentially toxicelement
Germany(average)
United Kingdom(weighted average)
United Kingdom(median)
Zn 776 792 559Cu 305 568 373Ni 24 57 20Cd 1.45 3.3 1.6Pb 57 221 99Cr 40 157 24Hg 1.35 2.4 1.5
2. Potentially Toxic Elements
Pollutants in Urban Waste Water and Sewage Sludge 58
Table 2.41 Survey of potentially toxic elements in sewage sludge: values in mg.kg-1
DS-Cadmium
CADMIUM Country Mean Median Min. Max. Survey Year/sAustria 1.5 1.2 0.4 3.4 1994/95 (11)Germany 1.5 1995-97 (4)Denmark 1.4 1995-97 (4)France 4.1 1995/97 (4)Finland 1.0 1995-97 (4)Greece (a) (b)
1.61.4
1996 (6)1997 (1)
Italy 0.8 23 1998/99 (10)Ireland 2.8 1997 (4)Luxembourg 3.8 1997 (4)Netherlands 3 1990 (16)Sweden 1.5 1995/96 (4)UK 3.5 1995/96 (4)Norway 0.97 1998 (12)Poland 9.93 13.5 0.8 15.3 1999 (3)EU 4.0
2.21992 (9)1994-98
USA 38.125
8.95 1988 (13)1992 (2)
Limits AgriculturalSoils
Sewage Sludge
EU 1-3 10 1* (4)WHO 7 (5)USEPA 39 (14)
Table 2.41b Survey of potentially toxic elements in sewage sludge: values in mg.kg-1
DS-ChromiumCHROMIUM Country Mean Median Min. Max. Survey Year/s
Austria 62 54 25 130 1994/95 (11)Germany 50 52 46 52 1995-97 (4)Denmark 33 34 24.8 40.3 1995-97 (4)France 69.4 58.8 80 1995/97 (4)Finland 85.7 84 82 91 1995-97 (4)Greece (a) (b)
885.843.8
1996 (6)1997 (1)
Italy 14.8 1400 1998/99 (10)Ireland 165 1997 (4)Luxembourg 51 1997 (4)Netherlands 64 1990 (16)Sweden 38.4 37.7 39 1995/96 (4)UK 159.5 157 162 1995/96 (4)Norway 28.5 1998 (12)Poland 144.2 136.5 6.8 289.0 1999 (3)EU 145
741992 (9)1994-98
USA 589178
150 1988 (13)1992 (2)
Limits AgriculturalSoils
Sewage Sludge
EU 30 –100(proposed)
1000 600* (8)
USEPA 1200 (14)
2. Potentially Toxic Elements
Pollutants in Urban Waste Water and Sewage Sludge 59
Table 2.41c Survey of potentially toxic elements in sewage sludge: values in mg.kg-1
DS-CopperCOPPER Country Mean Median Min. Max. Survey Year/s
Austria 264 240 170 540 1994/95 (11)Germany 275 1995-97 (4)Denmark 284 1995-97 (4)France 322 1995/97 (4)Finland 288 1995-97 (4)Greece (a) (b)
302103
1996 (6)1997 (1)
Italy 160 373 1998/99 (10)Ireland 641 1997 (4)Luxembourg 206 1997 (4)Netherlands 190 1990 (16)Sweden 522 1995/96 (4)UK 562 1995/96 (4)Norway 287.1 1998 (12)Poland 237.5 183.4 24.1 592.0 1999 (3)EU 380
3651992 (9)1994-98
USA 639616
444 1988 (13)1992 (2)
Limits AgriculturalSoils
SewageSludge
EU 50-140 1000-50* (4)USEPA 1500 (14)
Table 2.41d Survey of potentially toxic elements in sewage sludge: values in mg.kg-1
DS-Mercury
MERCURY Country Mean Median Min. Max. Year/s of SurveyAustria 5.1 2.1 1.0 48.0 1994/95 (11)Germany 1.2 1995-97 (4)Denmark 1.29 1995-97 (4)France 2.85 1995/97 (4)Finland 1.4 1995-97 (4)Greece 4.1 1996 (6)Italy 0.46 5 1998/99 (10)Ireland 0.6 1997 (4)Luxembourg 1.9 1997 (4)Netherlands 1.8 1990 (16)Sweden 1.85 1995/96 (4)UK 2.50 1995/96 (4)Norway 1.34 1998 (12)
EU 2.72.0
1992 (9)1994-98
USA 3.242.3
2.3 1988 (13)1992 (2)
Limits AgriculturalSoils
SewageSludge
EU 1-1.5 10 0.5* (4)WHO 5 (15)USEPA 17 (14)
2. Potentially Toxic Elements
Pollutants in Urban Waste Water and Sewage Sludge 60
Table 2.41e Survey of potentially toxic elements in sewage sludge: values in mg.kg-1
DS-Nickel
NICKEL Country Mean Median Min. Max. Year/s of SurveyAustria 39 35 14 94 1994/95 (11)Germany 23.3 1995-97 (4)Denmark 22.8 1995-97 (4)France 35.5 1995/97 (4)Finland 41 1995-97 (4)Greece (a) (b)
6723.6
1996 (6)1997 (1)
Italy 25 182.5 1998/99 (10)Ireland 54 1997 (4)Luxembourg 24 1997 (4)Netherlands 37 1990 (16)Sweden 19.3 1995/96 (4)UK 58.5 1995/96 (4)Norway 15.4 1998 (12)Poland 41.1 36.7 8.4 78.8 1999 (3)EU 44
331992 (9)1994-98
USA 90.671
46.5 1988 (13)1992 (2)
Limits AgriculturalSoils
Sewage Sludge
EU 30-75 300 50* (4)WHO 850 (5)USEPA 420 (14)
Table 2.41f Survey of potentially toxic elements in sewage sludge: values in mg.kg-1
DS-Lead
LEAD Country Mean Median Min. Max. Year/s of SurveyAustria 109 100 40 290 1994/95 (11)Germany 67.7 1995-97 (4)Denmark 59.9 1995-97 (4)France 119.9 1995/97 (4)Finland 43 1995-97 (4)Greece (a) (b)
283140.6
1996 (6)1997 (1)
Italy 41 560 1998/99 (10)Ireland 150 1997 (4)Luxembourg 128 1997 (4)Netherlands 145 1990 (16)Sweden 48.2 1995/96 (4)UK 221.5 1995/96 (4)Norway 21.7 1998 (12)Poland 211.8 190.6 27.7 456.5 1999 (3)EU 97 1994-98
USA 204170
152 1988 (13)1992 (2)
Limits AgriculturalSoils
Sewage Sludge
EU 50-300 750-70* (4)WHO 150 (5)USEPA 300 (14)
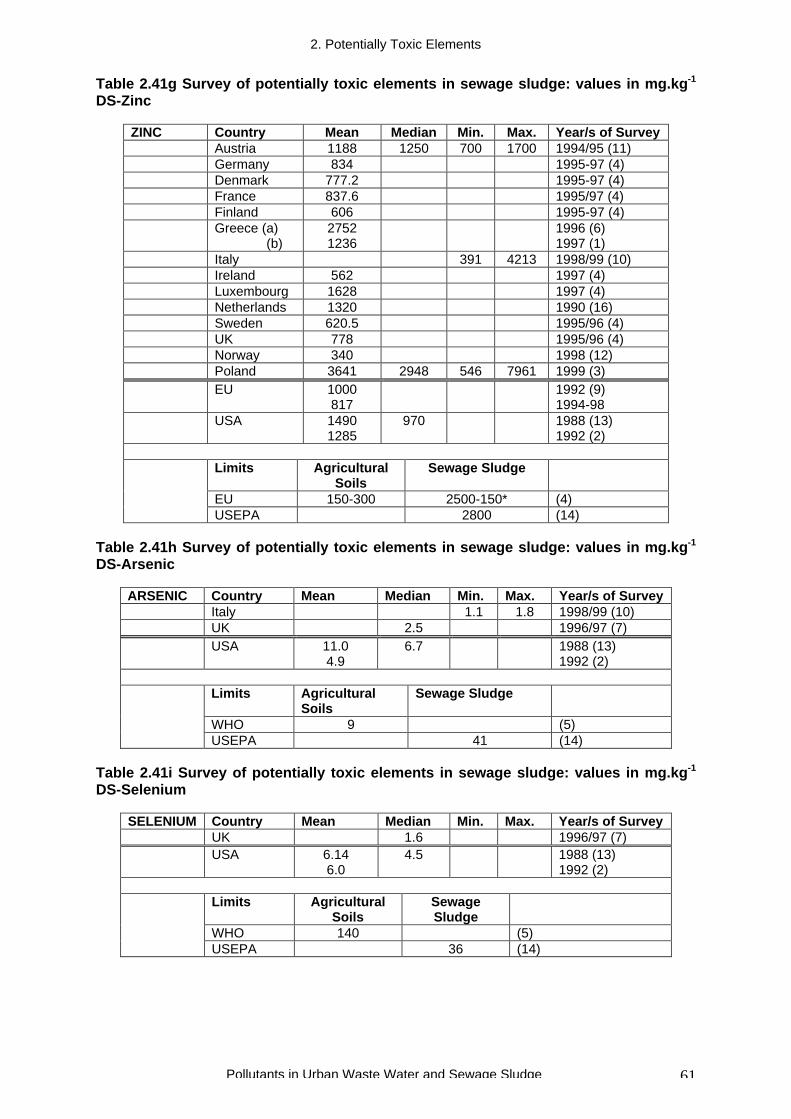
2. Potentially Toxic Elements
Pollutants in Urban Waste Water and Sewage Sludge 61
Table 2.41g Survey of potentially toxic elements in sewage sludge: values in mg.kg-1
DS-Zinc
ZINC Country Mean Median Min. Max. Year/s of SurveyAustria 1188 1250 700 1700 1994/95 (11)Germany 834 1995-97 (4)Denmark 777.2 1995-97 (4)France 837.6 1995/97 (4)Finland 606 1995-97 (4)Greece (a) (b)
27521236
1996 (6)1997 (1)
Italy 391 4213 1998/99 (10)Ireland 562 1997 (4)Luxembourg 1628 1997 (4)Netherlands 1320 1990 (16)Sweden 620.5 1995/96 (4)UK 778 1995/96 (4)Norway 340 1998 (12)Poland 3641 2948 546 7961 1999 (3)EU 1000
8171992 (9)1994-98
USA 14901285
970 1988 (13)1992 (2)
Limits AgriculturalSoils
Sewage Sludge
EU 150-300 2500-150* (4)USEPA 2800 (14)
Table 2.41h Survey of potentially toxic elements in sewage sludge: values in mg.kg-1
DS-Arsenic
ARSENIC Country Mean Median Min. Max. Year/s of SurveyItaly 1.1 1.8 1998/99 (10)UK 2.5 1996/97 (7)USA 11.0
4.96.7 1988 (13)
1992 (2)
Limits AgriculturalSoils
Sewage Sludge
WHO 9 (5)USEPA 41 (14)
Table 2.41i Survey of potentially toxic elements in sewage sludge: values in mg.kg-1
DS-Selenium
SELENIUM Country Mean Median Min. Max. Year/s of SurveyUK 1.6 1996/97 (7)USA 6.14
6.04.5 1988 (13)
1992 (2)
Limits AgriculturalSoils
SewageSludge
WHO 140 (5)USEPA 36 (14)
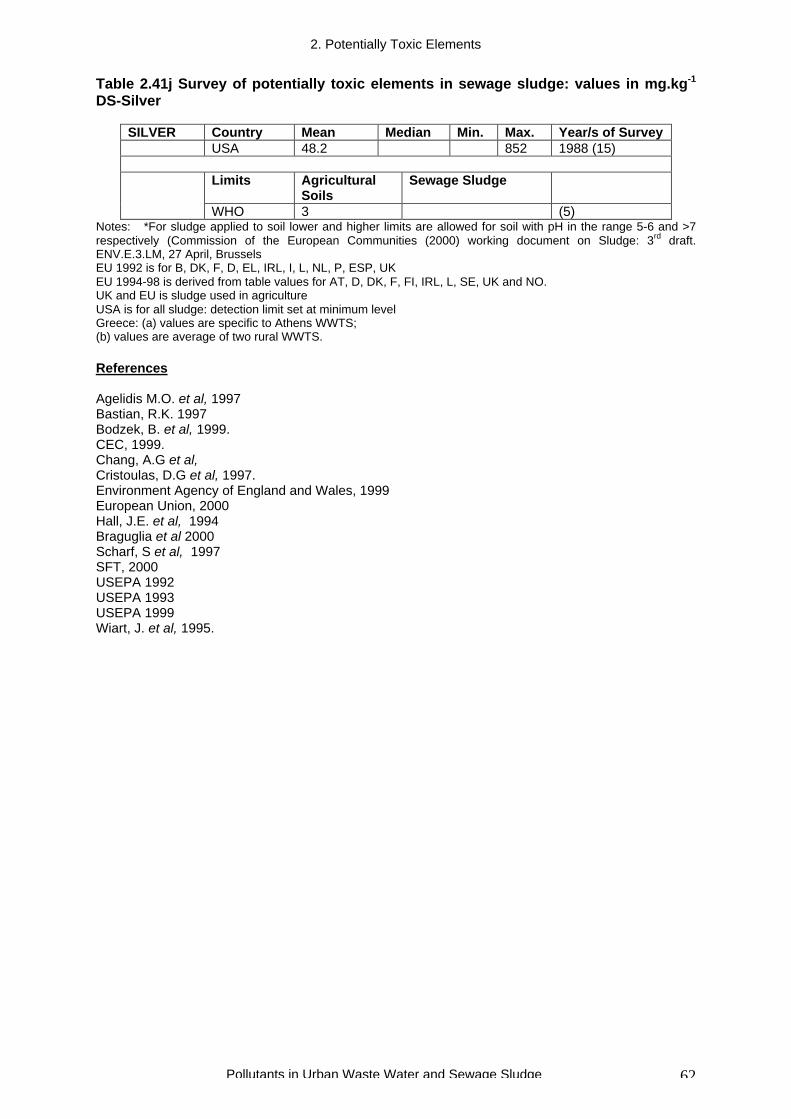
2. Potentially Toxic Elements
Pollutants in Urban Waste Water and Sewage Sludge 62
Table 2.41j Survey of potentially toxic elements in sewage sludge: values in mg.kg-1
DS-Silver
SILVER Country Mean Median Min. Max. Year/s of SurveyUSA 48.2 852 1988 (15)
Limits AgriculturalSoils
Sewage Sludge
WHO 3 (5)Notes: *For sludge applied to soil lower and higher limits are allowed for soil with pH in the range 5-6 and >7respectively (Commission of the European Communities (2000) working document on Sludge: 3rd draft.ENV.E.3.LM, 27 April, BrusselsEU 1992 is for B, DK, F, D, EL, IRL, I, L, NL, P, ESP, UKEU 1994-98 is derived from table values for AT, D, DK, F, FI, IRL, L, SE, UK and NO.UK and EU is sludge used in agricultureUSA is for all sludge: detection limit set at minimum levelGreece: (a) values are specific to Athens WWTS;(b) values are average of two rural WWTS.
References
Agelidis M.O. et al, 1997Bastian, R.K. 1997Bodzek, B. et al, 1999.CEC, 1999.Chang, A.G et al,Cristoulas, D.G et al, 1997.Environment Agency of England and Wales, 1999European Union, 2000Hall, J.E. et al, 1994Braguglia et al 2000Scharf, S et al, 1997SFT, 2000USEPA 1992USEPA 1993USEPA 1999Wiart, J. et al, 1995.
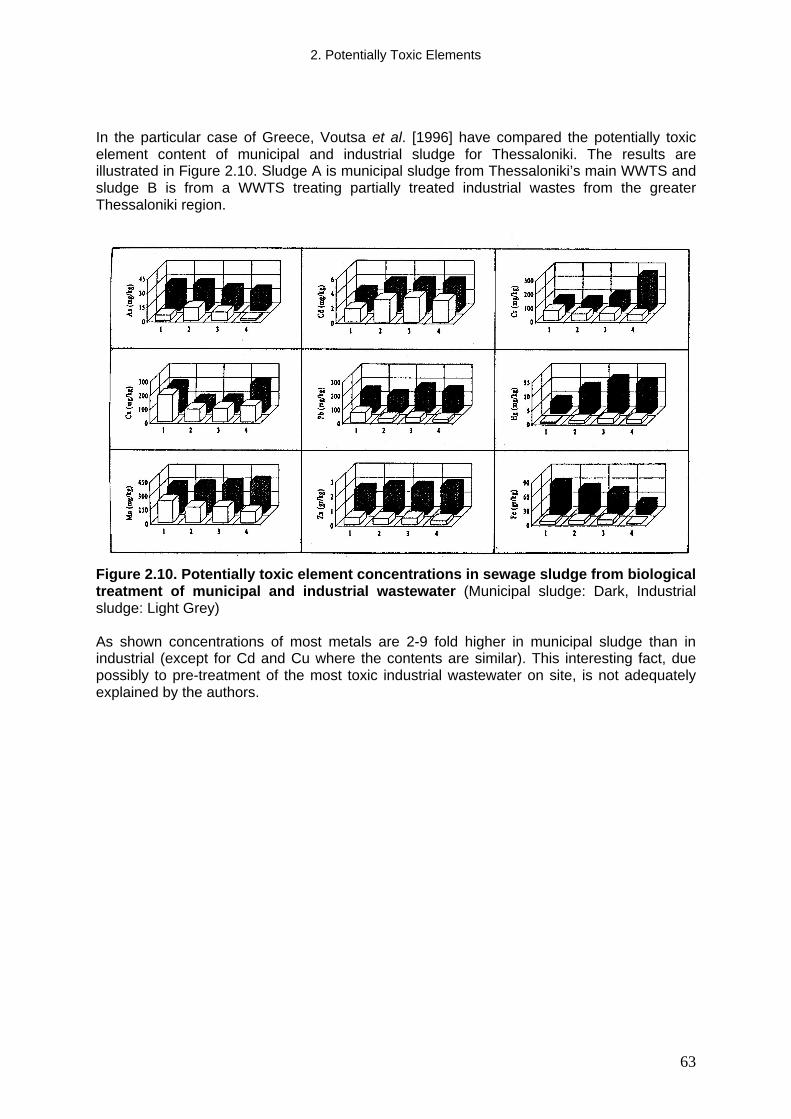
2. Potentially Toxic Elements
63
In the particular case of Greece, Voutsa et al. [1996] have compared the potentially toxicelement content of municipal and industrial sludge for Thessaloniki. The results areillustrated in Figure 2.10. Sludge A is municipal sludge from Thessaloniki’s main WWTS andsludge B is from a WWTS treating partially treated industrial wastes from the greaterThessaloniki region.
Figure 2.10. Potentially toxic element concentrations in sewage sludge from biologicaltreatment of municipal and industrial wastewater (Municipal sludge: Dark, Industrialsludge: Light Grey)
As shown concentrations of most metals are 2-9 fold higher in municipal sludge than inindustrial (except for Cd and Cu where the contents are similar). This interesting fact, duepossibly to pre-treatment of the most toxic industrial wastewater on site, is not adequatelyexplained by the authors.