Embed Size (px)
Citation preview
MARINE ECOLOGY - PROGRESS SERIES Mar. Ecol. Prog. Ser.
Published February 18
Sources of variability in measurements of copepod lipids and gut fluorescence in the California
Current coastal zone
M. D. Ohman
Marine Life Research Group A-027, Scripps Institution of Oceanography, La Jolla, California 92093-0227, USA
ABSTRACT: The spatial association of zooplankton nutritional state with particulate food abundance was tested along the central California coast in March 1986. Suspension-feeding copepods (Metn'da pacifica, Calanus pacificus californicus, Rhincalanus nasutus, Eucalanus cahfornicus) and suspended particulate matter were sampled at stations with median nearest neighbor distance of 19.6 km. In this field condition of relatively small horizontal gradients in food supply, copepod gut fluorescence, triacylglycerols and wax esters showed little or no association with spatial variations in particulate nitrogen, particulate carbon or chlorophyll a. In contrast, strong diel variation in gut fluorescence was observed including post-sunset increases in ingestion. For the conditions observed during this study, diel variations in feeding behavior explained more of the variance in copepod ingestion than did horizontal variations in food supply. Efficiency of extraction of copepod lipids by homogenization and by standng in chloroform: methanol was also compared. A new double development, single scan method for separation and analysis of zooplankton lipids by Thin Layer Chromatography/Flame Ionization Detection is presented.
INTRODUCTION
Responses of marine zooplankton to spatial varia- tions in food supply are of broad interest because of the effects of resource limitation on recruitment rates of natural populations (e.g. Checkley 1980, Frost 1985, Lampert 1985, Runge 1985, Razouls et al. 1986, Hirche & Bohrer 1987). This article reports on the spatial association of zooplankton nutritional state with sus- pended particulate concentrations in a nearshore re- gion of the California Current. The study was con- ducted in late winter conditions of relatively small lateral gradients, as determined on a scale of 9 to 30 km. The magnitude of spatial variations in zoo- plankton nutrition is also contrasted with that of die1 variations.
Zooplankton nutritional state was inferred from 3 measures that differ in characteristic response time to altered concentrations of food substrates. Gut fluores- cence, an index of recent ingestion of phytoplankton containing chlorophyll a (Nemoto 1968), responds within minutes to altered food concentrations (e.g. Dagg 1983, Mackas & Burns 1986). Triacylglycerols, a class of storage lipids common among both aquatic and
O Inter-Research/Printed in F. R. Germany
terrestrial organisms (Hadley 1985), change within sev- eral hours to a day or more of exposure to altered food abundance (Lee et al. 1971, Sargent et al. 1977a, Hakanson 1984). Wax esters, another class of depot lipids that is widely distributed among marine meta- zoans (Benson & Lee 1975, Sargent et al. 1977b), are usually metabolized more slowly than triacylglycerols. Biosynthesis of copepod wax esters occurs within 1 to 4 d of exposure to high substrate concentrations (Sar- gent et al. 1977a, Hakanson 1984) and depletion begins within 2 to 7 d after the onset of starvation (Lee et al. 1971, Sargent et al. 1977a, Hakanson 1984). For zoo- plankton in a state of reduced metabolic activity, how- ever, wax ester catabolism may extend to several weeks to months (Lee 1974, Ohman 1987), in which case lipid content will reflect not recent, but rather previous ingestion.
Four species of calanoid copepod commonly found in the California Current are contrasted in their nutri- tional status: Mem.dia pacifica Brodskii, Calanus pacificus californicus Brodskii (hereafter C. pacificus), Rhincalanus nasutus Giesbrecht, and Eucalanus californicus Johnson. In addition, the efficiency of extraction of copepod lipids by 2 methods is compared,
144 Mar. Ecol. Prog. Ser
and a new solvent system is proposed for separating copepod lipids for analysis by Thin Layer Chromato- graphy/Flame Ionization Detection.
METHODS
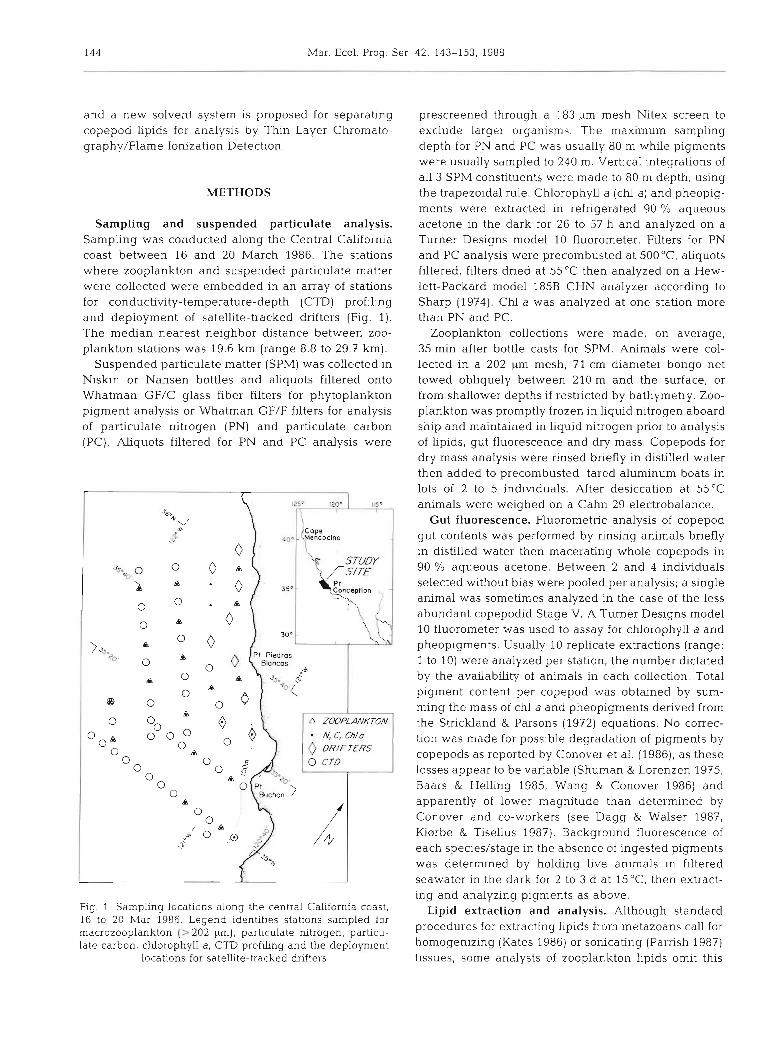
Sampling and suspended particulate analysis. Sampling was conducted along the Central California coast between 16 and 20 March 1986. The stations where zooplankton and suspended particulate matter were collected were embedded in an array of stations for conductivity-temperature-depth (CTD) profiling and deployment of satellite-tracked drifters (Fig. 1). The median nearest neighbor distance between zoo- plankton stations was 19.6 km (range 8.8 to 29.7 km).
Suspended particulate matter (SPM) was collected in Niskin or Nansen bottles and aliquots filtered onto Whatman GF/C glass fiber filters for phytoplankton pigment analysis or Whatman GF/F filters for analysis of particulate nitrogen (PN) and particulate carbon (PC). Aliquots filtered for PN and PC analysis were
Fig. 1 Sampling locations along the central Cahfornia coast. 16 to 20 Mar 1986. Legend identifies stations sampled for macrozooplankton (> 202 pm), particulate nitrogen, particu- late carbon, cNorophylI a, CTD profiling and the deployment
locations for satellite-tracked dnfters
prescreened through a 183 LLm mesh Nitex screen to exclude larger organisms. The maximum sampling depth for PN and PC was usually 80 m while pigments were usually sampled to 240 m. Vertical integrations of all 3 SPM constituents were made to 80 m depth, using the trapezoidal rule. Chlorophyll a (chl a) and pheopig- ments were extracted in refrigerated 90 % aqueous acetone in the dark for 26 to 57 h and analyzed on a Turner Designs model 10 fluorometer. Filters for PN and PC analysis were precombusted a t 500°C, aliquots filtered, filters dried at 55°C then analyzed on a Hew- lett-Packard model 185B CHN analyzer according to Sharp (1974). Chl a was analyzed at one station more than PN and PC.
Zooplankton collections were made, on average, 35 min after bottle casts for SPM. Animals were col- lected in a 202 llm mesh, 71 cm diameter bongo net towed obliquely between 210 m and the surface, or from shallower depths if restricted by bathymetry. Zoo- plankton was promptly frozen in liquid nitrogen aboard ship and maintained in liquid nitrogen prior to analysis of lipids, gut fluorescence and dry mass. Copepods for dry mass analysis were rinsed briefly in distilled water then added to precombusted, tared aluminum boats in lots of 2 to 5 individuals. After desiccation at 55°C animals were weighed on a Cahn 29 electrobalance.
Gut fluorescence. Fluorometric analysis of copepod gut contents was performed by rinsing animals briefly in distilled water then macerating whole copepods in 90 % aqueous acetone. Between 2 and 4 individuals selected without bias were pooled per analysis; a single animal was sometimes analyzed in the case of the less abundant copepodid Stage V. A Turner Designs model 10 fluorometer was used to assay for chlorophyll a and pheopigments. Usually 10 replicate extractions (range: 1 to 10) were analyzed per station, the number dictated by the availabhty of animals in each collection. Total pigment content per copepod was obtained by sum- ming the mass of chl a and pheopigments derived from the Strickland & Parsons (1972) equations. No correc- tion was made for possible degradation of pigments by copepods as reported by Conover et al. (1986), as these losses appear to be variable (Shuman & Lorenzen 1975, Baars & Helling 1985, Wang & Conover 1986) and apparently of lower magnitude than determined by Conover and co-workers (see Dagg & Walser 1987, I(l0rbe & Tiselius 1987). Background fluorescence of each species/stage in the absence of ingested pigments was determined by holding live animals in filtered seawater in the dark for 2 to 3 d at 15 "C, then extract- ing and analyzing pigments as above.
Lipid extraction and analysis. Although standard procedures for extracting lipids from metazoans call for homogenizing (Kates 1986) or sonicating (Parrish 1987) tissues, some analysts of zooplankton lipids omit this
Ohman: Copepod lipids and gut fluorescence
step. An extraction experiment was therefore con- ducted to compare the efficiency of extraction of differ- ent copepod lipid classes by standing in a solvent mixture versus mechanical homogenization according to the method of Bligh & Dyer (1959). The temperature- dependence of extraction rate was also evaluated. Replicate lots of adult females of Calanuspacificus (n =
40 ind. per extraction) and Rhincalanus nasutus (n = 20) collected from a single net haul in the study site were sorted into vials. Chloroform: methanol ( 2 : 1, v/v) was added to the vials which were then purged with nitrogen gas and placed in the dark at -20 'C, + 1 "C or +23"C. At intervals (12, 24, 48 and 72 h) the extracting solvent was removed, copepods were washed 2 X with CH3C1: MeOH and the total solution analyzed for lipid content by Thin Layer Chromatography/Flame Ioniza- tion Detection (TLC/FID). After solvent removal, fresh CH3C1: MeOH was added to each vial and extraction continued under nitrogen. After 72 h, the CH3Cl: MeOH mixture was removed, animals macerated in CH3Cl: MeOH: H 2 0 (1 : 2 : 0.8, v/v/v) with a glass homogenizer, then taken through the remaining ex- traction procedure of Bligh & Dyer (1959) with the addition of a benzene washing step (Kates 1986). Bligh & Dyer extraction was conducted twice then all lipids analyzed by TLC/FID. Extracted copepod lipids were maintained at -20°C in a N2 atmosphere for less than 2 wk prior to analysis.
Lipids were analyzed by Thin Layer Chromatogra- phy/Flame Ionization Detection (TLC/FID) using an !citioscan TH-?C (sec Ackman ?95?, Parrish P.ckmar. 1985). Lipids were spotted onto S11 Chromarods then separations performed using a new double develop- ment, single scan procedure that was suggested by the results of Parrish & Ackman (1983). No single solvent system was found adequate for consistent baseline separation of copepod lipid classes. Chromarods were humidified over saturated CaC12 and developed first in hexane : diethyl ether (95 : 5, v/v) for 30 min to separate wax esters. They were then dried at llO°C, rehumidified and developed in hexane : diethyl ether: formic acid (82: 18: 1.0, v/v/v) for 20 min to separate triacylglycerols, free fatty acids, free alcohols, sterols and phospholipids. Rods were scanned in one unin- terrupted pass at 40 S scan-' with hydrogen flow at 160 m1 min-' and air flow at 2000 m1 min-l. Peak area was recorded on a Shimadzu CR3A integrator. The above solvent systems do not separate sterol esters from wax esters, but no sterol esters were detected in these samples using plate thin-layer chromatography and the reaction of Jatzkewitz & Mehl (1960).
Because standing in solvents without homogeniza- tion failed to give complete extraction of all lipid classes, extractions of field samples were performed using the Bligh & Dyer (1959) procedure. Thawed
copepods were sorted by developmental stage and species, rinsed briefly in distilled water, lipids extracted and analyzed by TLC/FID. Between 4 and 8 (mode = 5) replicate analyses were done per extrac- tion. The coefficient of variation of replicate analyses varied with mass of lipid applied, declining from an average of 15.5 % at the 1.0 vg lipid application level to 6.2 % at the 10.0 yg level.
Iatroscan calibration was performed with authentic lipid standards purchased from Sigma: phospho- lipids (PL) - L-LY-phosphatidylcholine; sterols (ST) - cholesterol; free fatty acids (FFA) - palmitic acid; triacylglycerols (TAG) - tripalmitin; wax esters (WE) - palmitic acid palmityl ester. The calibration relation- ship between peak area and lipid concentration was described by power functions which provided better statistical fits than rectilinear functions, based on minimizing the error term and randomizing residuals.
Lipid content and dry mass were determined on separate lots of animals drawn from the same sample. Because the t-distribution is inappropriate for the ratio of these 2 quantities, the standard error of the ratio of lipid/dry mass was estimated as indicated in Enright (1967) and the confidence limit of this ratio approxi- mated as twice the standard error.
RESULTS
Extraction method
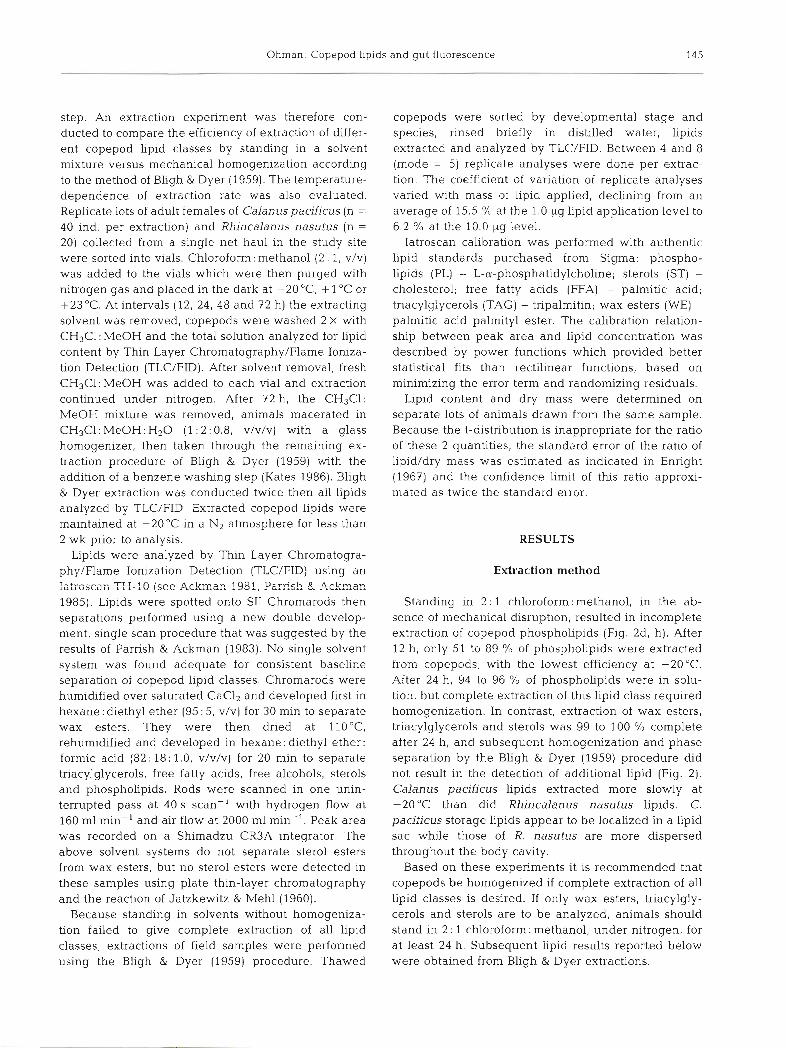
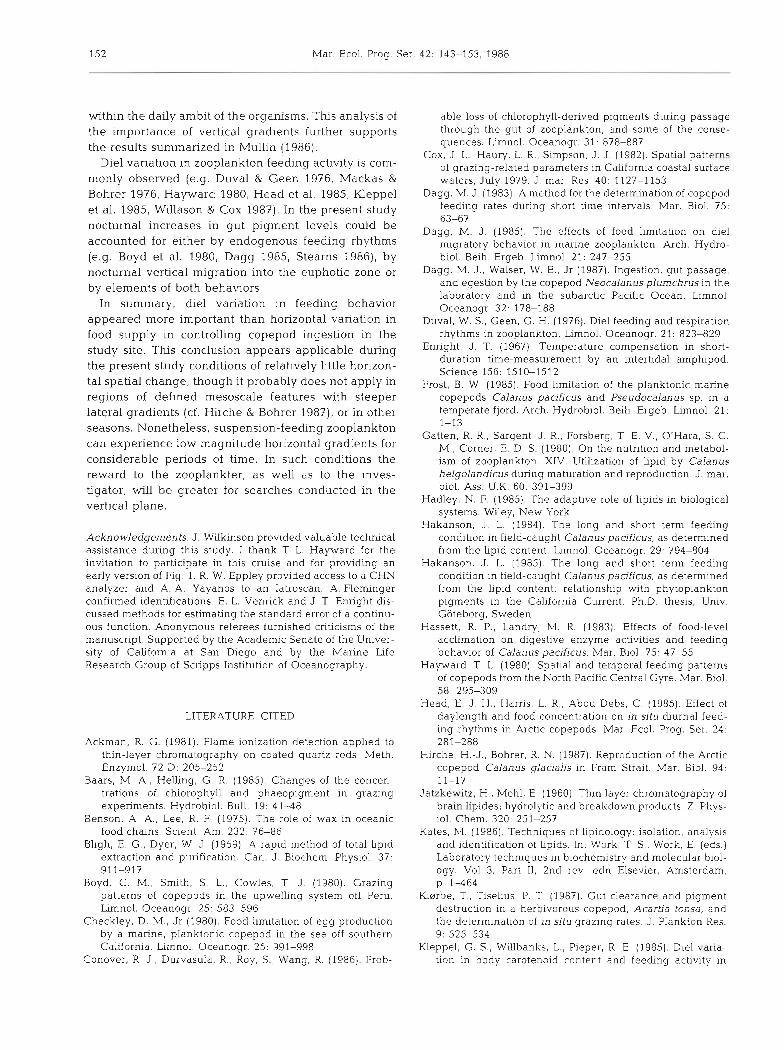
Standing in 2 : 1 chloroform: methanol, in the ab- sence of mechanical disruption, resulted in incomplete extraction of copepod phospholipids (Fig. 2d, h). After 12 h, only 51 to 89 % of phospholipids were extracted from copepods, with the lowest efficiency at -20°C. After 24 h, 94 to 96 % of phospholipids were in solu- tion, but complete extraction of this lipid class required homogenization. In contrast, extraction of wax esters, triacylglycerols and sterols was 99 to 100 % complete after 24 h, and subsequent homogenization and phase separation by the Bligh & Dyer (1959) procedure did not result in the detection of additional lipid (Fig. 2). Calanus pacificus lipids extracted more slowly at -20°C than did Rhincalanus nasutus lipids. C. pacificus storage lipids appear to be localized in a lipid sac while those of R. nasutus are more dispersed throughout the body cavity.
Based on these experiments it is recommended that copepods be homogenized if complete extraction of all lipid classes is desired. If only wax esters, triacylgly- cerols and sterols are to be analyzed, animals should stand in 2 : 1 chloroform: methanol, under nitrogen, for at least 24 h. Subsequent lipid results reported below were obtained from Bligh & Dyer extractions.
146 Mar Ecol. Prog. Ser. 42: 143-153. 1988
Cu/onus poc/flcus Rh/ilcu/unus nosutus
W A , X ESTER- I
p
EXTRACTION TIME (h)
P H O S P H ~ L I P I D
Lipid composition
p
103, -54
90.- 3-3-
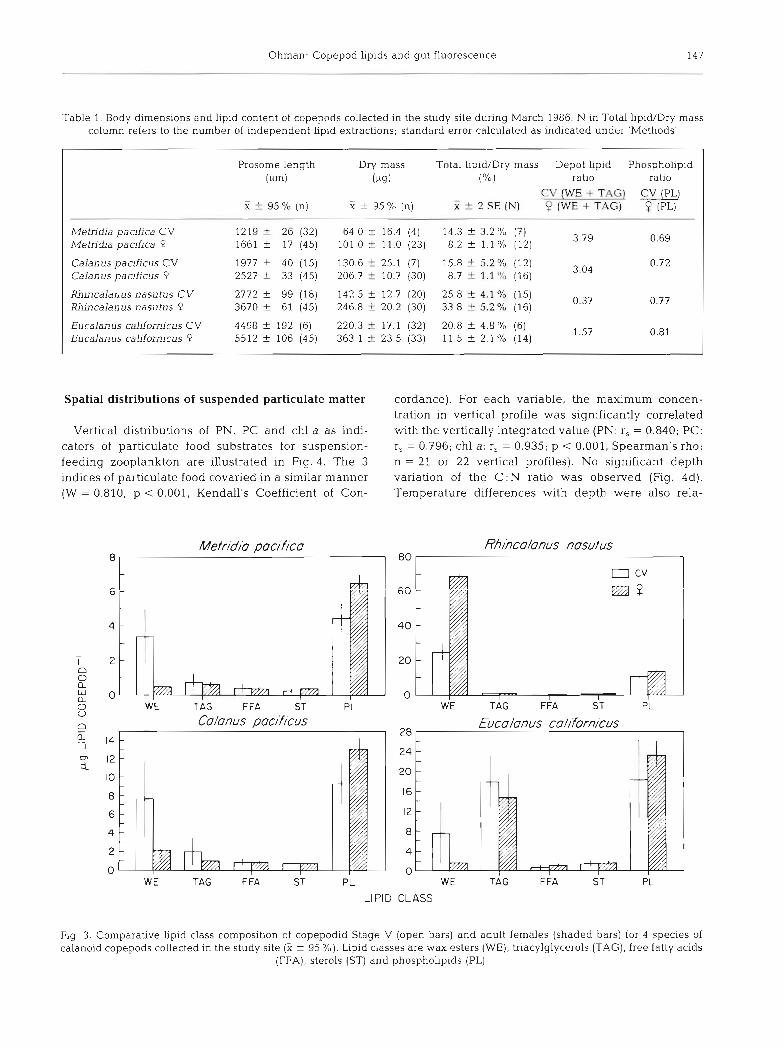
Table 1 presents the body dimensions and Lipid con- tent of copepods collected in the study site. Total lipid as a percentage of dry mass varied by developmental stage within a species. In 3 of the 4 species the percent- age of dry mass as lipid was nearly twice as high for the copepodid Stage V (CV) as for the copepodid Stage V1 female. In Rhincalanus nasutus, females had higher lipid content. For all species but R. nasutus the depot lipid ratio, i.e, the sum of wax esters and triacylgly- cerols in CV's divided by that in adult females, was greater than 1. The quantity of depot lipid of CV's was significantly dfferent from that of females for all 4 species (p < 0.05, Mann-Whitney U test, 2-tailed). The
Fig. 2.Calanus pacificus and Rhin- calanus nasutus. Time course of extraction of different Lipid classes from adult females. After standing
phospholipid ratio, by contrast, was less than 1 for all 4 species (Table l ) . Copepodid Stage V and females differed significantly in quantity of phospholipid in Metridia pacifica and Calanus pacificus (p < 0.01, Mann-Whitney U, 2-tailed) but not in R. nasutus and Eucalanus californicus (p > 0.05).
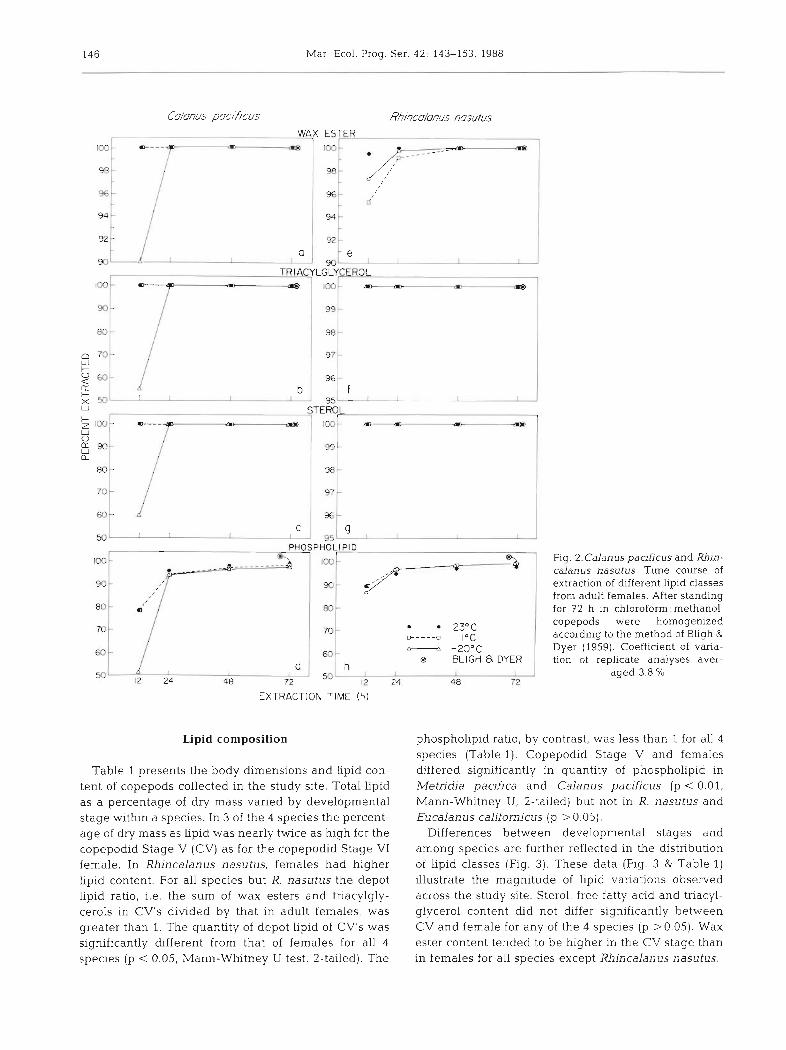
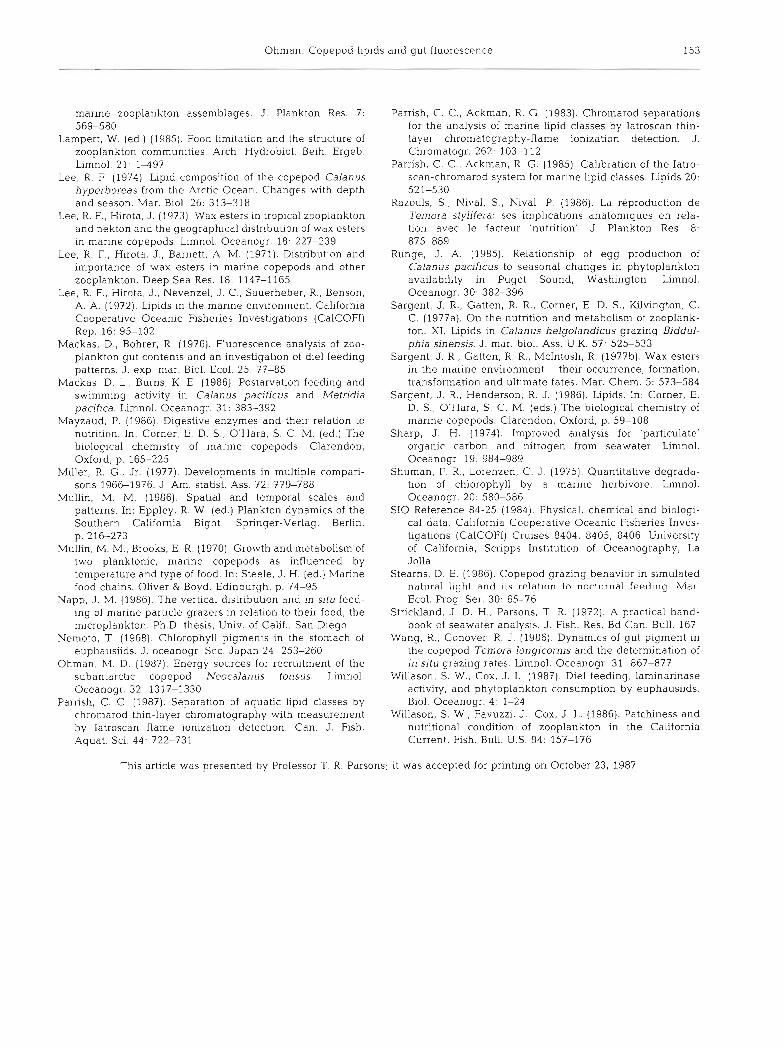
Differences between developmental stages and among species are further reflected in the distribution of lipid classes (Fig. 3). These data (Fig. 3 & Table 1) illustrate the magnitude of lipid variations observed across the study site. Sterol, free fatty acid and triacyl- glycerol content did not differ significantly between CV and female for any of the 4 species (p >0.05). Wax ester content tended to be higher in the CV stage than in females for all speci.es except Rhincalanus nasutus.
for 72 h in chloroform: methanol,
23°C 1 copepods were homogenized m----,, 1°C according to the method of Bligh & - -2OoC Dyer (1959). Coefficient of varia- 60 -
d @ BClGll 8 DYER 1 tion of replicate analyser aver-
%' 17 24 h , I I I . aged 3.8 %
48 72 5C ~i 24 48 72
Ohman: Copepod lipids and gut fluorescence 147
Table 1. Body dimensions and l ip~d content of copepods collected in the study site during March 1986. N in Total lipid/Dry mass column refers to the number of independent lipid extractions; standard error calculated as indicated under 'Methods'
Prosome length Dry mass Total lipid/Drp mass Depot lipid Phospholipid (Pm) (M) ("/.l ratio ratio
- CV (WE - T A 3 CV (PL)
X i- 95 O/O (n) 2 f 95 % (n) i 5 2 SE (N) 9 (WE + TAG) (PL)
Metridia paafica CV Metn'dia pacifica Q
Calanus pacificus CV Calan us pacjfjcus P
Rhincalanus nasutus CV Rhincalanus nasutus 9
Eucalanus caldornicus CV Eucalanus californicus P
Spatial distributions of suspended particulate matter cordance). For each variable, the maxinlum concen- tration in vertical profile was significantly correlated
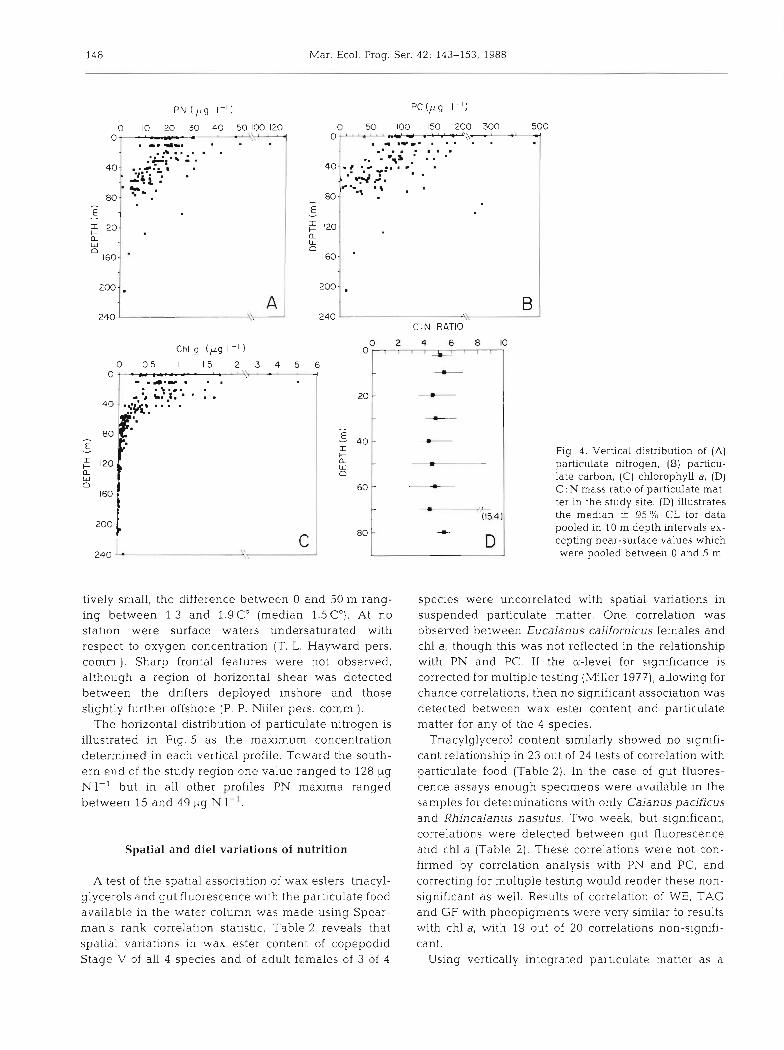
Vertical distributions of PN, PC and chl a as indi- with the vertically integrated value (PN: r, = 0.840; PC: cators of particulate food substrates for suspension- r, = 0.796; chl a: r, = 0.935; p < 0.001, Spearman's rho; feeding zooplankton are illustrated in Fig. 4 . The 3 n = 21 or 22 vertical profiles). No significant depth indices of particulate food covaried in a similar manner variation of the C : N ratio was observed (Fig. 4d). (W = 0.810, p < 0.001, Kendall's Coefficient of Con- Temperature differences with depth were also rela-
24
20
16
12
8
4
0 W E TAG FFA S T PL
CLASS
Fig. 3. Comparative lipid class composition of copepodid Stage V (open bars) and adult females (shaded bars) for 4 species of calanoid copepods collected in the study site (C 5 95 %). Lipid classes are wax esters (WE), tnacylglycerols (TAG), free fatty acids
(FFA), sterols (ST) and phospholipids (PL)
148 Mar. Ecol. Prog. Ser. 42: 143-153, 1988
Chl g (pg I - l )
0 0 5 1 1 5 2 3 4 5 6 0 - , : .,\\-1
Fig. 4. Vertical distribution of (A) particulate nitrogen. (B) particu- late carbon, (C) chlorophyll a, (D) C . N mass ratio of particulate mat- ter in the study site. (D) illustrates the medan 2 95 % CL for data pooled in 10 m depth intervals ex- cepting near-surface values which were pooled between 0 and 5 m
tively small, the difference between 0 and 50 m rang- ing between 1.3 and 1.9 C" (median 1.5 C"). At no station were surface waters undersaturated with respect to oxygen concentration (T. L. Hayward pers. comm.). Sharp frontal features were not observed, although a region of horizontal shear was detected between the drifters deployed inshore and those slightly further offshore (P. P. Niiler pers. comm.).
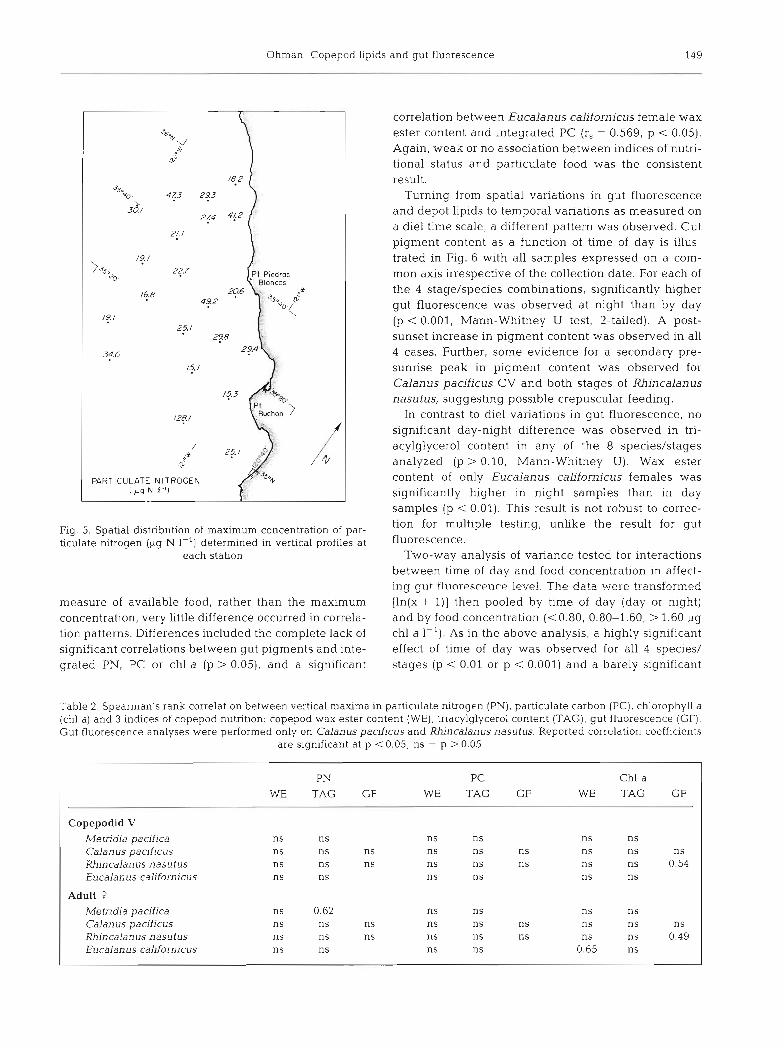
The horizontal distribution of particulate nitrogen is illustrated in Fig. 5 as the maximum concentration determined in each vertical profile. Toward the south- ern end of the study region one value ranged to 128 ug N1-' but in all other profiles PN maxima ranged between 15 and 49 pg N I-'.
species were uncorrelated with spatial variations in suspended particulate matter. One correlation was observed between Eucalanus californicus females and chl a, though this was not reflected in the relationship with PN and PC. If the a-level for significance is corrected for multiple testing (Miller 1977), allowing for chance correlations, then no significant association was detected between wax ester content and particulate matter for any of the 4 species.
Triacylglycerol content similarly showed no signifi- cant relationship in 23 out of 24 tests of correlation with particulate food (Table 2 ) . In the case of gut fluores- cence assays enough specimens were available in the samples for determinations with only Calanuspacificus and Rhincalanus nasutus. Two weak, but significant, correlations were detected between gut fluorescence and chl a (Table 2). These correlations were not con- firmed by correlation analysis with PN and PC, and correcting for multlple testing would render these non- significant as well. Results of correlation of WE, TAG and GF with pheopigments were very similar to results with chl a, with 19 out of 20 correlations non-signifi- cant.
Using vertically integrated particulate matter as
Spatial and die1 variations of nutrition
A test of the spatial association of wax esters, tnacyl- glycerols and gut fluorescence with the particulate food available in the water column was made using Spear- man's rank correlation statistic. Table 2 reveals that spatial variations in wax ester content of copepodid Stage V of all 4 species and of adult females of 3 of 4
Ohman: Copepod lipids and gut fluorescence 149
3's. qo
3d\/
/: 1
)J$. '0
168
l?. I
3f.o
PARTICULATE NITROGEN lpg N l")
Fig. 5. Spatial hstribution of maximum concentration of par- ticulate nitrogen (pg N I-') determined in vertical profiles at
each station
measure of available food, rather than the maximum concentration, very little difference occurred in correla- tion patterns. Differences included the complete lack of significant correlations between gut pigments and inte- grated PN, PC or chl a (p > 0.05), and a significant
correlation between Eucalanus californicus female wax ester content and integrated PC (r, = 0.569, p < 0.05). Again, weak or no association between indices of nutri- tional status and particulate food was the consistent result.
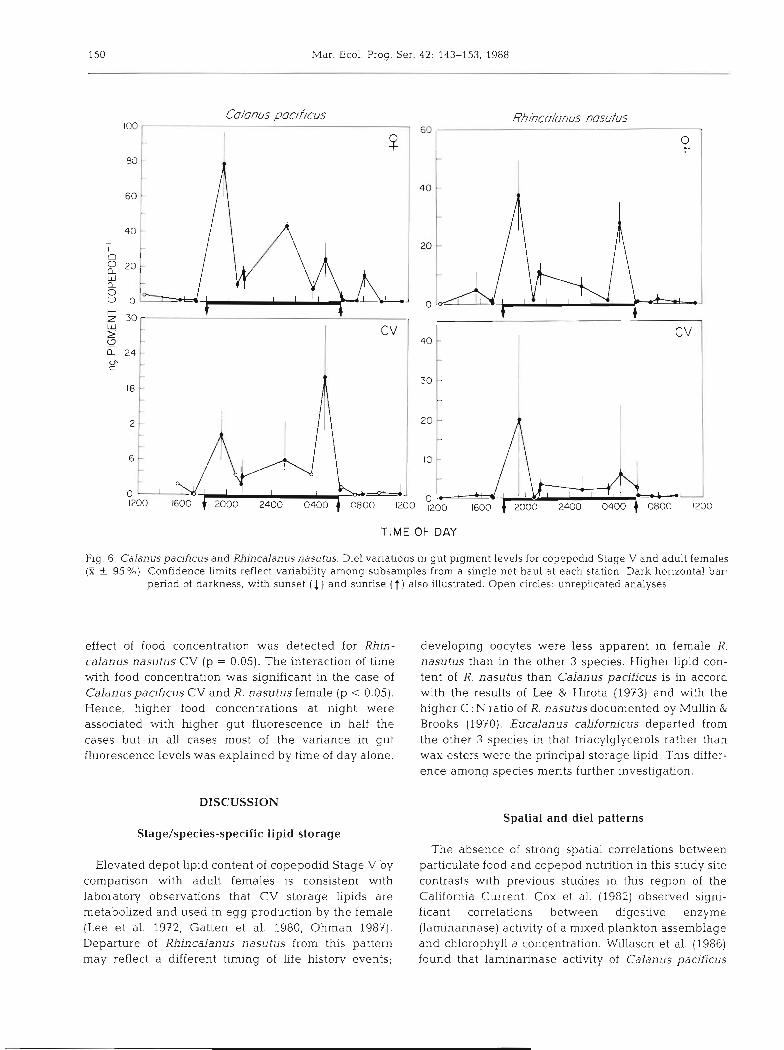
Turning from spatial variations in gut fluorescence and depot lipids to temporal variations as measured on a diel time scale, a different pattern was observed. Gut pigment content as a function of time of day is illus- trated in Fig. 6 with all samples expressed on a com- mon axis irrespective of the collection date. For each of the 4 stage/species combinations, significantly higher gut fluorescence was observed at night than by day (p < 0.001, Mann-Whitney U test, 2-tailed). A post- sunset increase in pigment content was observed in all 4 cases. Further, some evidence for a secondary pre- sunrise peak in pigment content was observed for Calanus pacificus CV and both stages of Rhincalanus nasutus, suggesting possible crepuscular feeding.
In contrast to diel variations in gut fluorescence, no significant day-night difference was observed in tri- acylglycerol content in any of the 8 speciedstages analyzed (p > 0.10, Mann-Whitney U). Wax ester content of only Eucalanus californicus females was significantly higher in night samples than in day samples (p < 0.02). This result is not robust to correc- tion for multiple testing, unlike the result for gut fluorescence.
Two-way analysis of variance tested for interactions between time of day and food concentration in affect- i n 5 gut fluorescence level. The dats. were tracsformed [ln(x + l ) ] then pooled by time of day (day or night) and by food concentration (<0.80, 0.80-1.60, > 1.60 yg chl a 1-'1. As in the above analysis, a highly significant effect of time of day was observed for all 4 species/ stages (p < 0.01 or p < 0.001) and a barely significant
Table 2. Spearman's rank correlat~on between vertical maxima in partlculate nitrogen (PN) , particulate carbon (PC), chlorophyll a (chl a) and 3 indices of copepod nutrition: copepod wax ester content (WE), tr~acylglycerol content (TAG), gut fluorescence (GF). Gut fluorescence analyses were performed only on Calanus pacificus and Rhincalanus nasutus. Reported correlation coefficients
are significant at p < 0.05; ns = p > 0.05
PN PC Chl a WE TAG GF WE TAG GF WE TAG GF
Copepodid V Metridia pacifica Calan us pacificus Rhincalanus nasutus Eucalanus californicus
Adult 9
Metridia pacifica Calanus pacificus Rhincalanus nasutus Eucalanus californicus
150 mar. Ecol. Prog. Ser. 42: 143-153, 1988
TIME OF DAY
Fig. 6. Calanus pacificus and Rhincalanus nasutus. Die1 variations in gut pigment levels for copepodid Stage V and adult females (X f 95 %). Confidence limits reflect variability among subsamples from a single net haul at each station. Dark horizontal bar,
period of darkness, with sunset (1) and sunrise ( t ) also illustrated. Open circles: unreplicated analyses
effect of food concentration was detected for Rhin- calanus nasutus CV (p = 0.05). The interaction of time with food concentration was significant in the case of Calanuspacificus CV and R. nasutus female (p < 0.05). Hence, higher food concentrations at night were associated with higher gut fluorescence in half the cases but in all cases most of the variance in gut fluorescence levels was explained by time of day alone.
DISCUSSION
Stage/species-specific lipid storage
Elevated depot lipid content of copepodid Stage V by comparison with adult females is consistent with laboratory observations that CV storage lipids are metabolized and used in egg production by the female (Lee et al. 1972, Gatten et al. 1980, Ohman 1987). Departure of Rhincalanus nasutus from this pattern may reflect a different timing of life history events;
developing oocytes were less apparent in female R. nasutus than in the other 3 species. Higher lipid con- tent of R. nasutus than Calanus pacificus is in accord with the results of Lee & Hirota (1973) and with the higher C : N ratio of R. nasutus documented by Mullin & Brooks (1970). Eucalanus californicus departed from the other 3 species in that triacylglycerols rather than wax esters were the principal storage lipid. This differ- ence among species merits further investigation.
Spatial and die1 patterns
The absence of strong spatial correlations between particulate food and copepod nutrition in this study site contrasts with previous studies in this region of the California Current. Cox et al. (1982) observed signi- ficant correlations between digestive enzyme (laminarinase) activity of a mixed plankton assemblage and chlorophyll a concentration. Willason et al. (1986) found that laminarinase activity of Calanus pacificus
Ohman: Copepod lipids and gut fluorescence 151
collected in the upper 210 m was correlated with sur- face chl a. It should be noted, however, that digestive enzyme activity is not related in a simple manner to substrate concentration (Mayzaud 1986) or to ingestion rate (Hassett & Landry 1983). In the study of Willason et al. (1986), total lipid content of C. pacificus showed little spatial association with surface chl a concen- tration, although the relationship was not analyzed statistically and depot lipids were not distinguished from other lipid classes. Hakanson (1985) reported an association between ambient chl a and the wax ester and triacylglycerol content of copepodid Stage V of C. pacificus. He also suggested that lipid content was better correlated with primary production rate than with chl a, although analysis of only those stations where both primary production rate and chl a were measured suggests that the strength of the 2 correla- tions was similar. The apparent association of lipid content with primary production rates may be influ- enced by a cross correlation between integrated pri- mary production rates and integrated chl a (r, = 0.93, p < 0.01, n = 12).
The range of phytoplankton concentrations observed in the preceeding studies was considerably greater than in the present study. Previous investigations were conducted somewhat later in the year than the present March study: April (Willason et al. 1986); April-May (Hakanson 1985), or July (Cox e t al. 1982). In each case spatial gradients were well-defined and surface chlorophyll concentrations ranged by over a factor of 100 (L. R. Ha.ury pers. comm., based on discrete cali- bration samples for undenvay data in Cox et al. 1982; S10 Reference 84-25 for the study of Hakanson 1985; Willason et al. 1986). In the present study, the range of
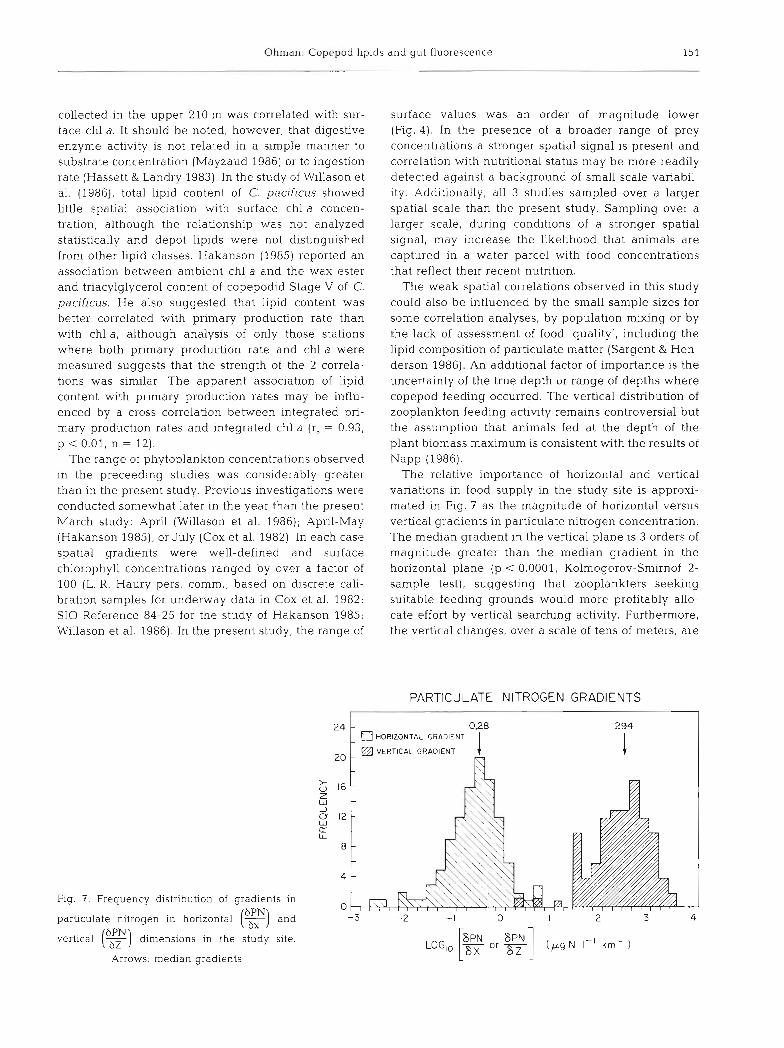
Fig. 7 . Frequency distribut~on of gradents in 6PN particulate nitrogen in horizontal and
vertical (g) dimensions in the study rite.
Arrows: median gradients
surface values was an order of magnitude lower (Fig. 4 ) . In the presence of a broader range of prey concentrations a stronger spatial signal is present and correlation with nutritional status may be more readily detected against a background of small scale variabil- ity. Additionally, all 3 studies sampled over a larger spatial scale than the present study. Sampling over a larger scale, during conditions of a stronger spatial signal, may increase the likelihood that animals are captured in a water parcel with food concentrations that reflect their recent nutrition.
The weak spatial correlations observed in this study could also be influenced by the small sample sizes for some correlation analyses, by population mixing or by the lack of assessment of food 'quality', including the lipid composition of particulate matter (Sargent & Hen- derson 1986). An additional factor of importance is the uncertainty of the true depth or range of depths where copepod feeding occurred. The vertical distribution of zooplankton feeding activity remains controversial but the assumption that animals fed a t the depth of the plant biomass maximum is consistent with the results of Napp (1986).
The relative importance of horizontal and vertical variations in food supply in the study site is approxi- mated in Fig. 7 as the magnitude of horizontal versus vertical gradients in particulate nitrogen concentration. The median gradient in the vertical plane is 3 orders of magnitude greater than the median gradient in the horizontal plane (p < 0.0001, Kolmogorov-Smirnof 2- sample test), suggestinq that zooplankters seelung suitable feeding grounds would more profitably allo- cate effort by vertical searching activity. Furthermore, the vertical changes, over a scale of tens of meters, are
PARTlCULATE NITROGEN GRADIENTS
HORIZONTAL GRADIENT
20 VERTICAL GRADIENT
152 Mar. Ecol. Prog. Ser.
withln the daily ambit of the organisms. This analysis of the importance of vertical gradients further supports the results summarized in Mullln (1986).
Diel variation in zooplankton feeding activity is com- monly observed (e.g. Duval & Geen 1976, Mackas &
Bohrer 1976, Hayward 1980, Head et al. 1985, Kleppel et al. 1985, Willason & Cox 1987). In the present study nocturnal increases in gut pigment levels could be accounted for either by endogenous feeding rhythms (e.g. Boyd et al. 1980, Dagg 1985, Stearns 1986), by nocturnal vertical migration into the euphotic zone or by elements of both behaviors.
In summary, diel variation in feeding behavior appeared more important than horizontal variation in food supply in controlling copepod ingestion in the study site. This conclusion appears applicable during the present study conditions of relatively little horizon- tal spatial change, though it probably does not apply in regions of defined mesoscale features with steeper lateral gradients (cf. Hirche & Bohrer 1987), or in other seasons. Nonetheless, suspension-feeding zooplankton can experience low magnitude horizontal gradients for considerable periods of time. In such conditions the reward to the zooplankter, as well as to the inves- tigator, will be greater for searches conducted in the vertical plane.
Acknowledgements. J. Wilkinson provided valuable technical assistance during this study. I thank T L. Hayward for the invitation to participate in thls cruise and for providing an early version of Fig. 1. R. W. Eppley provided access to a CHN analyzer and A. A. Yayanos to an Iatroscan. A. Fleminger confirmed identifications. E. L. Venrick and J. T Enright dis- cussed methods for estimating the standard error of a continu- ous function. Anonymous referees furnished criticisms of the manuscript. Supported by the Academic Senate of the Univer- sity of California at San Diego and by the Marine Life Research Group of Scripps Institution of Oceanography.
LITERATURE CITED
Ackman, R. G. (1981). Flame ionization detection applied to thin-layer chromatography on coated quartz rods. Meth. Enzymol. 72 D: 205-252
Baars, M. A., Helling, G. R. (1985). Changes of the concen- trations of chlorophyll and phaeopigment in grazing experiments. Hydrobiol. Bull. 19: 41-48
Benson, A. A . , Lee, R. F (1975) The role of wax in oceanlc food chains. Scient Am 232: 76-86
Bligh, E. G . , Dyer, W J (1959) A rapid method of total hpid extraction and purification. Can. J . Biochem. Phys~ol 37 91 1-917
Boyd, C. M., Smith, S. L., Cocvles, T J . (1980). Grazing patterns of copepods in the upwelling system off Peru. Limnol. Oceanogr 25: 583-596
Checkley. D. M., J r (1980). Food limitation of egg production by a marine, planktonic copepod in the sea off southern California. Limnol. Oceanogr. 25: 991-998
Conover, R . J . , Durvasula, R.. Roy, S., LVang, R. (1986). Prob-
able loss of chlorophyll-derived plgments during passage through the gut of zooplankton, and some of the conse- quences. Limnol. Oceanogr 31. 838-887
Cox, J. L., Haury, L. R . , Slmpson, J. J. (1982). Spatial patterns of grazing-related parameters in California coastal surface waters, July 1979. J. mar Res. 40: 1127-1153
Dagg. M. J. (1983). A method for the determination of copepod feeding rates during short time intervals. Mar. Biol. 75: 63-67
Dagg, M. J. (1985). The effects of food limitation on diel migratory behavior in marine zooplankton. Arch. Hydro- biol. Beih. Ergeb. Limnol. 21: 247-255
Dagg, M. J., Walser, W. E., Jr (1987). Ingestion, gut passage, and egestion by the copepod Neocalanusplumchrus in the laboratory and in the subarctic Pacific Ocean. Llmnol Oceanogr. 32: 178-188
Duval, W. S., Geen, G. H. (1976). Diel feeding and respiration rhythms in zooplankton. Limnol. Oceanogr. 21: 823-829
Enright, J. T. (1967). Temperature compensation in short- duration time-measurement by an intertidal amphipod. Science 156: 1510-1512
Frost, B. W (1985). Food limitation of the planktonic marine copepods Calanus pacificus and Pseudocalanus sp. In a temperate fjord. Arch. Hydrobiol. Beih. Ergeb. Limnol. 21: 1-13
Gatten, R. R . , Sargent, J. R., Forsberg, T E. V., O'Hara, S. C M,, Corner, E. D. S. (1980) On the nutrition and metabol- ism of zooplankton. XIV. Utilization of lipid by Calanus helgolandicus during maturation and reproduction. J. mar. biol. Ass. U.K. 60: 391-399
Hadley, N. F. (1985). The adaptive role of lipids in biological systems. Wiley, New York
Hakanson, J . L. (1984). The long and short term feeding condition in field-caught Calanus pacificus, as determined from the lipid content. Limnol. Oceanogr. 29: 794-804
Hakanson, J . L. (1985) The long and short term feeding condition in field-caught Calanus pacificus, as determined from the lipid content. relationship with phytoplankton pigments in the California Current. Ph.D. thesis, Univ. Goteborg, Sweden
Hassett, R. P., Landry, M. R. (1983). Effects of food-level acclimation on digestive enzyme activities and feeding behavior of Calanus pacificus. Mar. Biol. 75: 47-55
Hayward, T L. (1980). Spatial and temporal feeding patterns of copepods from the North Pacific Central Gyre. Mar. Blol. 58: 295-309
Head, E. J . H. , Harns, L. R . , Abou Debs, C. (1985) Effect of daylength and food concentration on in situ l u r n a l feed- ing rhythms in Arctlc copepods. Mar Ecol. Prog. Ser. 24: 281-288
Hirche, H.-J., Bohrer, R. N. (1987). Reproduction of the Arctic copepod Calanus glacialis in Fram Strait. Mar. Biol. 94: 11-17
Jatzkewitz, H., Mehl, E. (1960). Thin layer chromatography of brain lipides; hydrolytic and breakdown products. Z. Phys- iol. Chem. 320- 251-257
Kates, M. (1986) Techniques of lipidology: sola at ion, analysis and identification of Liplds. In. Work, T S , Work, E (eds.) Laboratory techniques in biochemistry and molecular biol- ogy. Vol. 3, Part 11, 2nd rev. edn Elsevier, Amsterdam, p. 1-464
Kisrbe, T., Tiselius, P. T (1987). Gut clearance and pigment destruction in a herbivorous copepod, Acartia tonsa, and the determination of In situ grazing rates. J. Plankton Res. 9: 525-534
Kleppel, G. S., Willbanks, L., Pieper, R. E. (1985). Diel varia- tion in body carotenoid content and feeding activity in
Ohman. Copepod lipids and gut fluorescence 153
marine zooplankton assemblages. J. Plankton Res. 7. 569-580
Lampert, W. (ed.) (1985). Food limitation and the structure of zooplankton communities. Arch. Hydrobiol. Beih. Ergeb. Limnol 21- 1-497
Lee. R. F. (1974). Lipid composition of the copepod Calanus hyperboreas from the Arctic Ocean. Changes with depth and season. Mar. Biol. 26: 313-318
Lee, R . F., Hirota, J . (1973). Wax esters in tropical zooplankton and nekton and the geographlcai distribution of wax esters in marine copepods. Limnol. Oceanogr. 18: 227-239
Lee, R. F., Hirota, J . , Barnett, A. M. (1971). Distribution and Importance of wax esters in marine copepods and other zooplankton. Deep Sea Res. 18: 1147-1165
Lee, R. F., Hirota, J., Nevenzel, J. C., Sauerheber, R., Benson, A. A. (1972). Lipids in the manne env~ronment. California Cooperative Oceanic Fisheries Investigations (CalCOFI) Rep. 16: 95-102
Mackas, D., Bohrer, R. (1976). Fluorescence analysis of zoo- plankton gut contents and an investigation of d e l feedng patterns. J . exp. mar. Biol. Ecol. 25: 77-85
Mackas, D. L.. Bums. K. E. (1986). Postarvation feeding and swimming activity in Calanus pacificus and Metridia pacifica Limnol. Oceanogr. 31: 383-392
Mayzaud, P. (1986). Digestive enzymes and their relation to nutrition. In: Corner, E. D. S., O'Hara, S. C. M. (ed.) The biological chemistry of marine copepods. Clarendon, Oxford, p. 165-225
Miller, R. G.. Jr. (1977). Developments in multiple compari- sons 1966-1976. J. Am. statist. Ass. 72: 779-788
Mullin, M. M. (1986). Spatial and temporal scales and patterns. In: Eppley, R. W. (ed.) Plankton dynamlcs of the Southern California Bight. Springer-Verlag, Berlin, p. 216-273
Mullin, M. M., Brooks, E. R. (1970) Growth and metabolism of two planktonic, marine copepods as influenced by temperature and type of food. In: Steele, J . H. (ed.) Marine food chains. Oliver & Boyd. Edinburgh. p. 74-95
Napp, J . M (1986). The vertical distribution and in situ feed- Ing of manne particle-grazers in relation to their food, the microplankton. Ph.D. thesis, Univ. of Calif.. San Diego
Nemoto, T (1968). Chlorophyll pigments in the stomach of euphausiids. J . oceanogr Soc. Japan 24. 253-260
Ohman, h4 D. (1987). Energy sources for recruitment of the subantarctic copepod Neocalanus tonsus. Limnol. Oceanogr. 32: 1317-1330
Parrish, C. C. (1987). Separation of aquatic lipid classes by chromarod thin-layer chromatography with measurement by Iatroscan flame ionization detection. Can. J. Fish. Aquat. Sci 44: 722-731
Parrish, C. C., Ackman, R. G . (1983). Chromarod separations for the analysis of manne lipid classes by Iatroscan thin- layer chromatography-flame ionization detection. J. Chromatogr. 262: 103-1 12
Parrish, C. C., Ackman, R G. (1985). Calibration of the Iatro- scan-chromarod system for marine lipid classes. Lipids 20: 521-530
Razouls, S., Nival, S., Nival, P. (1986). La reproduction de Temora stylifera: ses implications anatomiques en rela- tion avec le facteur 'nutrition' J. Plankton Res. 8: 875-889
Runge, J. A. (1985). Relationship of egg production of Calanus paclficus to seasonal changes in phytoplankton availability in Puget Sound, Washington. Limnol. Oceanogr. 30: 382-396
Sargent, J . R., Gatten, R. R. , Corner, E. D. S. , IOlvington, C. C. (1977a). On the nutntion and metabolism of zooplank- ton. XI. Lipids in Calanus helgolandicus grazing B~ddul- phia sinensis. J. mar. biol. Ass. U.K. 57. 525-533
Sargent, J. R., Gatten, R. R., McIntosh, R. (1977b). Wax esters in the manne environment - thelr occurrence, formation, transformation and ultimate fates. Mar. Chem. 5: 533-584
Sargent, J. R., Henderson, R. J. (1986). Lipids. In: Corner, E. D. S., O'Hara, S. C. M. (eds.) The biological chemistry of manne copepods. Clarendon, Oxford, p. 59-108
Sharp, J. H. (1974). Improved analysis for 'particulate' organic carbon and nitrogen from seawater Limnol. Oceanogr 19. 984-989
Shuman, F. R., Lorenzen, C. J . (1975). Quantitative degrada- tion of chlorophyll by a marine herbivore. Limnol. Oceanogr. 20: 580-586
S10 Reference 84-25 (1984). Physical, chemical and biologi- cal data. California Cooperative Oceanic Fisheries Inves- tigations (CalCOFI) Cruises 8404, 8405, 8406. University of California, Scripps Institution of Oceanography, La Jolla
Stearns. D. E. (1986). Copepod grazing behavior in simulated nat.ura1 lirjht and i ts relation to nnctllrnal feeding Mar Ecol. Prog. Ser. 30: 65-76
Strickland, J . D. H. , Parsons, T R. (1972). A practical hand- book of seawater analysis. J . Fish. Res. Bd Can. Bull. 167
Wang, R., Conover, R. J. (1986). Dynamics of gut pigment in the copepod Temora longicornis and the determination of in situ grazing rates. Limnol. Oceanogr 31 867-877
Willason, S. M'., Cox, J. L. (1987). Die1 feeding, laminannase activity, and phytoplankton consumption by euphausiids. Biol. Oceanogr. 4: 1-24
Willason, S. W , Favuzzi, J . , Cox, J. L. (1986). Patchiness and nutritional condition of zooplankton in the California Current. Fish. Bull. U.S. 84: 157-176
This article was presented by Professor T. R. Parsons: it was accepted for printlng on October 23, 1987