Embed Size (px)
Citation preview

Sound transmission rooms : a comparison
Citation for published version (APA):Martin, H. J. (1986). Sound transmission rooms : a comparison. Eindhoven: Technische Universiteit Eindhoven.https://doi.org/10.6100/IR250620
DOI:10.6100/IR250620
Document status and date:Published: 01/01/1986
Document Version:Publisher’s PDF, also known as Version of Record (includes final page, issue and volume numbers)
Please check the document version of this publication:
• A submitted manuscript is the version of the article upon submission and before peer-review. There can beimportant differences between the submitted version and the official published version of record. Peopleinterested in the research are advised to contact the author for the final version of the publication, or visit theDOI to the publisher's website.• The final author version and the galley proof are versions of the publication after peer review.• The final published version features the final layout of the paper including the volume, issue and pagenumbers.Link to publication
General rightsCopyright and moral rights for the publications made accessible in the public portal are retained by the authors and/or other copyright ownersand it is a condition of accessing publications that users recognise and abide by the legal requirements associated with these rights.
• Users may download and print one copy of any publication from the public portal for the purpose of private study or research. • You may not further distribute the material or use it for any profit-making activity or commercial gain • You may freely distribute the URL identifying the publication in the public portal.
If the publication is distributed under the terms of Article 25fa of the Dutch Copyright Act, indicated by the “Taverne” license above, pleasefollow below link for the End User Agreement:
www.tue.nl/taverne
Take down policyIf you believe that this document breaches copyright please contact us at:
providing details and we will investigate your claim.
Download date: 25. Jan. 2020
A
SOUND TRANSMISSION ROOMS -A COMPARISON
HEIKO JAN MARTIN
8

SOUND TRANSMISSION ROOMS
-A COMPARISON
SOUND TRANSMISSION ROOMS - A COMPARISON
PROEFSCHRIFT
TER VERKRIJGING VAN DE GRAAD VAN DOCTOR AAN DE TECHNISCHE UNIVERSITEIT EINDHOVEN,' OP GEZAG VAN DE RECTOR MAGNIFICUS, PROF. DR. F. N. HOOGE, VOOR EEN COMMISSIE
AANGEWEZEN DOOR HET COLLEGE VAN DECANEN, IN HET OPENBAAR TE VERDEDIGEN
OP DINSDAG 9 SEPTEMBER 1986 TE 16.00 UUR
DOOR
HEIKO JAN MARTIN
NATUURKUNDIG INGENIEUR GEBOREN TE WINSCHOTEN
1986 Drukkerij van Aken
Terneuzen

Dit proefschrift is got:dgekeurd door de promotoren:
prof. ir. P. A. de Lange, en prof. dr. J. A. Poulis

Voor Eipie, Anneke en Gert.
Preface
The sound reduction index of a building element is an important quantity
in noise abatement. It is determined in sound transmission rooms of which
there are six in The Netherlands. These rooms all differ in size, shape
and construction. These diEferences affect the test results.
The idea for an inter-laboratory investigation arose Erom the many quest
ions we encountered during the design and the construction of the Acous
tics Labaratory at Eindhoven University of Technology. In the same period
of time the cooperation started between the Institute of Applied Physics
TNO at Delft and the group Physical Aspects of the Built Environment at
Eindhoven University of Technology: it gave us another reason to carry out
the investigation.
The idea was worked out by my TNCrcolleague Renz van Luxemburg and myself
in the usual good understanding.
This thesis which deals with the uncertanties that occur in laboratory
sound insulation measurements gives some recommendations to improve the
precision of this type of measurement.
An inter-laboratory investigation like this has no chance to succeed with
out the full cooperation of all participating laboratories. Therefore I
would like to express my thanks to the people in charge of the laborato
ries who put their transmission rooms at the disposal of this investiga
tion. This includes also each measuring team and the people we met on our
tour along the laboratorles who gave us a Eriendly reception.
A few names have to be mentioned: Renz van Luxemburg with hls organizing
talents, Wieger cornelissen and Martijn Vercammen assisting during the
measuring tours. I owe them a lot. I feel obliged to my colleagues of the
group Physical Aspects of the Built Environment who gave me the opportu
nity to write this thesis. Without the mental support of my promotor and
copromotor this thesis would never have been written.
I also thank our secretary Marianne Hafmans for her fast and accurate ty
ping.
Heiko Martin
september 1986
TABLE OF CONTENTS
~:
1. General introduction ............................................ .
1.1. Transmission of sound from outside to inside ............... .
1.2. Transmission of sound between two adjacent rooms............ 2
1.3. Transmission of sound from inside to outside................ 4
1.4. Aim of this thesis.......................................... 4
2. Transmission rooms: history, standardization and test
methods.......................................................... 6
2.1. Introduction................................................ 6
2.2. Ristory of transmission suites in Belgium and The
Netherlands................................................. 6
2.3. Requirements for transmission suites........................ 9
2.4. Test procedures............................................. 10
2.4.1. conventional 'pressure' method according to
ISO 140/III.......................................... 10
2.4.2. The intensity method................................. 12
2.4.3. Single-number quantities ............................. 15
3. Factors affecting the resu1 ts of 1aboratory sound insula-·
tion measurements................................................ 17
3.1 Introduction ................................................ 17
3.2. Effects caused by the properties of the transmission
suite....................................................... 17
3.2.1. General .............................................. 17
3.2.2. The niche effect..................................... 19
3.2.3. The effect of equal shape and volume of souree and
receiving room. . . . . . . . . . . . . . . . . . . . . . . . . . . . . . . . . . . . . . . 19
3.2.4. The effect of different edge conditions of the
test object. . . . . . . . . . . . . . . . . . . . . . . . . . . . . . . . . . . . . . . . . . 20
3.2.5. The effect of the measuring direction ................ 22
3.2.6. The effect of the loudspeaker position ............... 23
3.2.7. The effect of diffusers .............................. 23
3.3. The effect of the test method; the Waterhouse effect ........ 23
3.4. statistica! errors: repeatability and reproducibility •....•. 25
3.4.1. Introduction. •.. . .• .. .• .• • . •. • • .. .. . . . .. .. . •• . . . . . .• . 25
3.4.2. Procedure for determining the repeatability and
the reproducibi 1 i ty. . . . . . . . . . . . . • . . . . . . . . . . • . • . . . . . . . 27
3.4.2.1. The statistica! model....................... 27
3.4.2.2. The determination of the repeatability
and the reproducibility ..................•.• 30
3.4.3. survey of precision experiments .....•..•••.••........ 30
4. Investigation in transmission suites in Belgium and The
Netherlands...................................................... 34
4.1. The plan of the investigation............................... 34
4.2. The participating laboratories.............................. 36
4.3. The test objects............................................ 42
4.3.1. The lightweight wall........ ... . .. . • . . . .. . . . .. . . • . . .. 42
4.3.2. The heavy wall....................................... 43
4.3.3. The middleweight wall •.•......•.•.••••.•.••.•.•...... 45
4.4. The tests performed on the lightweight wall ..••.•.•......... 45
4.5. The tests performed on the heavy wall ....•.•.•.••......•..•• 48
4.6. The tests performed on the middleweight wall ...•••..•....... 50
5. Results and discussion........................................... 53
5.1. Introduction........ •. .. . . . . . . . .. . . . . . . .. .• . . . . . . . . . . . . . . . . . 53
5.2. The effects of the properties of a transmission suite
on the results of sound insulation measurements ....•.•...... 53
5. 2 .1. The niche effect. . . • . . . • . . . . . . • • . • . . . . • • • • . . . . . . . . . . . 53
5.2.2. The effect of equal volumes of souree and
receiving room. . . . . . . . . . . . . . . . . . . . . • . . . . . . • • . . . . . . . . . 57
5.2.3. The effect of the measuring direction ................ 57
5.2.4. The effect of different edge conditions of the
test object. . . . . . . . . . . . . . . . . . • • . . . • . . . . . . . . . . . . . . . . . . 60
5.2.5. conclusions of §5.2.................................. 66
5.3. The precision of the conventional test method ...•••......... 70
5. 3 .1. The lightweight wall................................. 10
5.3.1.1. The average sound reduction index m ......•.. 70
5.3.1.2. The repeatability r......................... 70
5.3.1.3. The reproducibility R....................... 14
5.3.2. The heavy wall....................................... 15
5.3.2.1. The average sound reduction index m •........ 15
5.3.2.2. The repeatability r... .. . . . . . • . . •• • . . . . . . • . . 11
5.3.2.3. The reproducibility R....................... 78
5.3.3. The middleweight wall................................ 80
5.3.3.1. The average sound reduction index m ......... 80
5.3. 3. 2. The repeatability r......................... 82
5.3.3.3. The repl·oducibility R....................... 83
5.3.4. Conclusions of §5.3.................................. 86
5.4. Comparison of the resu1ts of conventional measurements
with the results of intensity measurements •...•••••.•••..••• 89
5.4.1. The tests performed on the heavy wall .....•...••••... 90
5.4.1.1. Tests performed with the wall connected
to the souree room.......................... 90
5.4.1.2. Tests performed with the wall connected
to the receiving room. • • • • . • . • • . . . . . . . . . . . . • 91
5.4.1.3. The effect of the measuring direction on
the results of intensity measurements •.••... 92
5.4.2. The tests performed on the middleweight wall •.•.•.••• 97
5.4.2.1. comparison of the resu1ts of pressure
and intensity measurements ..............•••• 91
5.4.2.2. The Waterhouse correction .•..•...........•.• 103
5.4.3. conclusions of §5.4 ...••••.•.•...••.•..•.•.••...•.... 103
5.5. Comparison of the precision of the conventional method
with the precision of the intensity method .....•...•..•••... 104
5.5.1. The average sound reduction index •••••.•••.•••.•...• 104
5.5.2. The repeatability r ••........••••.•.................. 106
5.5.3. The reproducibility R ................................ 113
5.5.4. Conclusions of §5.5 .•..••....•.•..........•....•••••. 114
Literature •.•.•••.•••••••••••......•..•••••.••.......••••••.•....... 116
summary. • . • • • • • • • • . . • . . . • . . • . • • • • • . • . . • • • . • • . • • • • • • • • • . . . . . . . • . • • . . . 121
Samenvatting. . • . • . • . • • • . • • . . . . • . . . . • • . • . . • . . . • . . • . • . . • . . . . . . . . . • • • . . 130
Curriculum vitae.................................................... 133
CHAPTER 1 • GENERAL INTRODUeTION
The model SOURCE-Pl\TH-RECEl~ is orten used tor descrihing the propaga
tion of sound in existing and new situations.
Although every situation can be described using this model, in practice it
suffices to distinguish three cases:
1. transmission of sound from outside to inside;
2. transmission of sound between two adjacent rooms;
3. transmission of sound Erom inside to outside.
The distinction is based on the character of the sound field near souree
and receiver.
1.1. Transmission of sound from outside to inside
outside, where the noise is caused by traffic, railways or aeroplanes,
propagation takes place in a free field. lnside, in the receiving room,
in general the sound field is assumed to be diffuse. The facade of the
building is the separation between outside and inside. The sound pressure
level in front of the facade can be determined from the emission of the
souree and the distanee between the souree and the facade {refs.l.l en
1.2). Theemission of the souree can be calculated from theoretical
models developed for different souree types.
corrections can be made for the influence of harriers, air and ground ab
sorption, meteorological conditions and the geometry of the situation.
The sound pressure level inside, in a certain frequency band, can be cal
culated according to regulations (refs.l.3. 1.4 and 1.5) from eq.(l.l):
{ 1.1)
where: L2 the sound pressure level inside in dB re 20 ~Pa
L2m = the sound pressure level outside at a distance of 2 m from
the facade, in dB re 20 ~Pa
G the sound reduction of the facade in the frequency band con
cerned, in dB
T2
the reverberation time in the receiving room in s
-1-
Tn a reference reverberation time: Tn = 0.5 s for dwellings:
Tn ~ 0.8 s for rooms in other buildings
(To avoid indices, every quantity is considered in the frequency band con
cerned.)
The sound reduction G of the facade can be determined from eq.(l.2}:
where: R
c r
(1.2)
the laboratory sound reduction index of the facade in the fre
quency band concerned (dB)
a correction term for the reflection of sound against the
facade, depending on the surface structure of the facade (dB) 3 the volume of the receiving room (m ), and
the total area of the facade with the highest level of inci
dent sound, seen from inside (m2).
The sound reduction index R of the facade can be calculated from eq.(l.3):
R -10 lg (E (S /S) 10(-Rj/lO) + K) j
2 the area of element j (m )
(1.3)
the laboratory sound reduction index of element j (dB)
a term indicating the transmission of sound through slits and
cracks.
1.2. Transmission of sound between two adjacent rooms
The sound is produced in one room, the souree room, by human actlvities
or machines and transmitted to another room in the same building, the re
ceiving room. In general, the sound field in both rooms is assumed to be
diffuse.
The sound pressure level in the receiving room in a certain frequency band
is the sum of the contributtons of all possible paths of sound transmis-
-2-
sion from the souree room to the receiving room:
direct transmission through the partition (wall or floor);
- flanking transmission: transfer of sound and vibrational energy along
the flanking structures;
- sound leaks;
indirect transmission of sound, not being direct or flanking transmis
sion.
The contributton of the direct and each flanking path to the total sound
pressure level in the receiving room, in a certain frequency band, can be
determined from eq.(l.4) (ref.l.6):
{1.4)
the sound pressure level in the souree room in dB re 20
~Pa
L2
= the total sound pressure level in the receiving room in dB
re 20 ~Pa; L2 = E L2ij
L2ij the sound pressure level in the receiving room in dB re
20 ~a as a result of transport of sound energy along path
ij: structure i in the souree room, structure j in the re
ceiving room
the respective sound reduction indices of structures i
and j (dB)
Dvij the reduction in vibration level going from structure i to
structure j, caused by reEleetion at the junction of both
structures (dB)
the areas of structures i and j respectively (m2
}
the total amount of absorption in the receiving room
{m2).
Also in the case of indirect sound transmission the sound reduction index
of building elements like suspended ceilings. roofs, air terminal devices,
etc. plays an important role.
3-
1.3. Transmission of sound from inside to outside
In a room, the souree room, sound is produced by human actlvities or ma
chines, e.g. by a concert or a process in a factory. The sound is trans
mltted through all surfaces of the room.
Theoretica! models (refs.l.7, 1.8 and 1.9) have been developed to calcu
late the sound pressure level in a certain frequency band outside at a
certain distance to the souree room (eq.1.5):
L -R-C •lOlgs•oi(~)-0 -EO 1 d geo i (1.5)
where: L2
(r) = the sound pressure level outside as a result of radlation
of sound from a certain surface, at a distance r from that
surface, in dB re 20 ~Pa
L1
the sound pressure level inside near the surface concer
ned, in dB re 20 ~Pa
R the laboratory sound reduction index of the surface con
sidered, in dB
Cd a correction for the character of the sound field and the
absorption of the surface at the inslde, in dB
s the area of the surface, in m 2
Dgeo = the reduction caused by spherical expansion of the sound
(dB)
DI(~) = the reductlon caused by spherical expansion of the sound,
in dB
~ = the angle of the direction of radlation
Eo1 = the reductlon caused by ground and air absorption, bar
rlers and meteorological influences, in dB
1.4. Alm of this thesis
As seen in the practical cases mentioned above, the sound reduction index
of the partition between two 'rooms' is an important step in noise abate
ment. The sound reduction index of individual buildingelementscan be
predicted from theory, complemented by empirical formulae: good results
-4-
have been obtained especially for glazing and single--leaf constructions.
Another way to obtain the sound reduction index of a building element is
to make use of laboratory measurements. Firstly, because complex construc-·
tions cannot be modelled accurately and secondly, because in practice
there is a need for an acoustical qualification of elements by means of
carrying out measurements under well defined conditions.
As will be seen in § 2.3 an acoustical laboratory for measuring the sound
reduction index consists of at least two rooms, the transmission rooms,
between which a building element is mounted. The combination of the two
transmission rooms is called a transmission suite.
Of course errors of a statistica! nature occur during laboratory measure
ments. However, it has been shown by different research--workers in the FRG
and scandinavia that results of sound insulation measurements are not in
dependent of the laboratory chosen. The sound reduction index of a build
ing element, as a result of measurements in one laboratory, can differ
considerably from the results of measurements in another laboratory.
This thesis contains the results of an investigation after the influences
of laboratorles on the measured sound reduction index of building ele
ments. The investigation bas been carried out in the period Erom 1982 to
1985 in 8 laboratories, of which 2 are in Belgium and 6 in The Nether
lands. It bas been sponsored by the Kinistry of Housing, Physical Planning
and Environment.
In Chapter 2 a short hlstorical review of transmission suites in Belgium
and The Netherlands will be foliowed by the requirements for transmission
suites and the standardized measuring method. Also a second measuring me
thod in which the intensity technique is used, is introduced in this chap
ter.
The factors which can affect the sound reduction index, measured in the
laboratory, are dealt with in Chapter 3, including the statistica! model
for determining the repeatability and the reproducibility of the test me
thods.
Chapter 4 outlines the organization of the investigation, specifying in
detail the test objects and the participating laboratories.
Chapter 5 presents the results of the investigation.
-5-
CHJ\PTER 2. TRANSlUSSION ROCKS: HIS'.OORY, STANDARDIZATION AND TEST METHOOS
2.1. Introduetion
In acoustical laboratories, transmission rooms are used to qualify build
ing elements.
The definition of the söund reduction index R of a building element is
given by eq.(2.1):
(2.1)
the sound power, incident on the building element in watts
the sound power, transmitted through the element in watts.
To determine the sound reduction index from measurements, the building
element is mounted in a test opening between two rooms, the transmission
rooms. The whole of the transmission rooms and the test opening between
them is called the transmission suite. The transmission suite should be
constructed in a special way so that transport of sound energy from one
room to the other is possible only through the test object, i.e. the
building element. For that purpose a number of requirements for transmis
ston suites are given in an international standard. other international
standards specify test procedures. The past 25 years have shown a certain
development in standardization. Besides, new measuring techniques have
been introduced.
2.2. History of transmission suites in Belgium and The Netherlands
The first attempts to investigate systematically the sound insulation of
building constructions on a laboratory scale date from the thirties.
At Delft, in the Laboratory of Applied Physics àt the Mijnbouwplein, the
so called 'kistenmethode' (box method) was used before World War 11.
-6-
We cite ref.2.1:
"A sample of the test object with an area of about 1 m2
is
constructed. Two wooden boxes with double walls and thus a
high sound insulation, are clamped on both sides of this sam
ple. on one side a 'source box', containing a loudspeaker: on
the other side a 'receiving box', in which the microphone of
the sound level meter. By employing felt at the edges of the
boxes, there are no sound leaks so that sound can only be
transmitted from the 'source box' to the 'receiving box'
through the sample. By means of a sine generator and an ampli
fier the loudspeaker produces a pure tone, the frequency of
which is increased in 200 Hz steps from 200 Hz to 2000 Hz.
Somatimes warble tones are used. By measuring the sound
levels in the souree box and the receiving box the sound
insulation at that frequency is obtained:
where: iL sound insulation in dB
Ll sound level in the souree box in dB
L2 sound level in the receiving box in dB
(2.2)
B correction term, accounting for the absorption of
the receiving box (: 4dB).
End of quotation.
Before long it was seen that, for a better understanding of the matter,
sound insulation measurements in situations, practice alike, were needed.
ln fact, mèasurements according to the 'kistenmethode' were very unrelia
ble.
so, in 1946 plans were made to create a building, consistlog of several
rooms, in which it was possible to place different types of w~lls and
floors between the rooms. This building, the so-called 'proefhuisje' (test
rig) of the 'Geluidcommissie TNO' (Acoustics Committee TNO), has been
erected in 1948 in the attic of the old Laboratory of Applied Physics
(refs. 2.2 and 2.3). In it were 4 small rooms, two besideeach other and 3
two on top of the former two, with a volume of 15.6 m each. The walls
-1-
were made of bricks with a thickness of 110 mm. The floor of the lower two
rooms was the existing concrete floor with a thickness of 250 mm. Tbe se
paration between the lower and the upper rooms was a cassette floor, made
of concrete, with a thickness of 100 mm. on top of the upper rooms there
was a concrete floor with a thickness of 100 mm (construction data from
ref.2.4).
In this 'proefhuisje' two walls and two floors could be tested within a
short period of time. This test rig allowed test objects with larger areas
than the boxes. Besides, essential changes were introduced in the test me
thods: broad band noise was used instead of warble tones and by using band
pass filters the desired quantities could be determined as a function of
frequency. Indeed, this laboratory proved a better approximation of prac
tice than the 'kistenmethode'.
From the design of these first 'laboratories' we see, that at that time
the important part, played by the wavelength in propagation of sound in
building constructions, was not realised. It is not surprising, since only
in 1942 Cremer (ref.2.5) demonstrated that bending waves in a building
construction can have a strong influence on its sound insulation. The wa
velengths of those bending waves can be calculated from the bending stiff
ness. They are responsible for radlation of sound from a vibrating con
struction and hence for the sound insulation of it, at least in a certain
frequency range.
Not until the late fortles ereroer's ideas were used in experiments in The
Nether lands.
In the same pertod of time, in 1941, deliberations were started between
England, Denmark, France and The Netherlands about unification and later
on about standardization of test methods. Among other things, this led to
the first edition of ISO 140 (ref.2.6): 'Field and laboratory measurements
of airborne and impact sound transmission'.
As a consequence of this standardization the results of sound insulation
measurements in different countries and institutes became comparable.
The first 'real' transmission suites also date from this time. The volumes
of the transmission rooms are larger than those of the 'proefhuisje', at 3
least 50 m but often more. souree and receiving rooms were separated
-8-
structurally. Their walls and floors often consist of heavy homogeneous
constructions. Hence, sound is only transmitted from the souree room to
the receiving room through the test object mounted in a test opening be
tween both rooms.
In 1962 the Acoustics Laboratory of the Faculty of Applied Physics at
Delft university of Technology was built under the supervision of prof.dr.
C.W.Kosten. lts four transmission rooms have also been used ever since by
the Institute of Applied Physlcs TNO.
In 1967 Leuven University (KUL-Belgium) got its acoustics laboratory, in
which four transmission rooms are present; it was an important step for
ward for the known Laboratory of Acoustics and Heat Conduction, led by
prof.dr.H.Myncke and dr.A.COps (ref.2.7).
Not long after that, in 1968, the Institute of Health Engineering TNO (IG
TNO, born from the 'Geluidcommissie TNO', later called the TNO Environmen
tal Research Institute) built its six transmission rooms with J.van den
Rijk in control.
Transmission suites were also built by private firms: in 1972 Peutz & As
socié's and in 1915 van Dorsser b.v., both acoustic consulting firms, got
their transmission suites in Nijmegen and The Hague respectively.
In 1978 the scientific centre for Building Technology (Wetenschappelijk
en Technisch Centrum voor het Bouwbedrijf WTCB, or 'Centre Scientifique
et Technique de la construction' CSTC) put their transmission suites into
use in Limelette near Brussels.
Youngest member of the family is the Acoustics Labaratory of the Faculty
of Architecture and Building Technology at Eindhoven University of Techn~~
logy. lts three transmission rooms were completed in 1981 (ref.2.8}.
The construction of the different laboratorles will be discussed in chap-~
ter 4.
2.3. Requirements for transmission suites >
The first, internationally agreed, requirements for transmission suites
are given in ISO R/140-1960 (ref.2.6}. The developments in acoustics and
the need for further standardization led to a revision of this document
in 1978. This resulted in ISO 140-1978, parts 1 to IX (refs.2.9 to 2.17).
-9-
Table 2.1. summarizes the requirements of ISO R/140-1960 and ISO 140/I-
1978 as to laboratorles meant for airborne sound insulation measurements.
~part from these international standards, almost every country has its
own, somewhat adapted, requirements, derived from the ISO documents.
I 4.4. Test procedures
2.4. conventional 'pressure' metbod accordinq to ISO 140/III-1978 (ref.
2.11)
The definition of the sound reduction index R has already been given by
eq.(2.1):
(2.1)
If the sound fields in the souree room and the receiving room are diffuse
and if the sound is transmitted only through the specimen, the sound re
duction index for diffuse incidence may be evaluated from:
{2.3)
the average sound pressure level in the souree room in dB re
20 ).lPa
L2 the average sound pressure level in the receiving room in dB
re 20 ).lPa
s the area of the test specimen which is normally equal to the
area of the free test opening, and
the equivalent absorption area in the receiving room
in m2
The sound generated in the souree room should be steady and have a conti
nuous spectrum in the frequency range considered.
The loudspeaker enelosure should be placed to give a sound field as dif
fuse as possible and at such a distance from the test specimen that the
direct radlation upon it is not dominant.
-10-
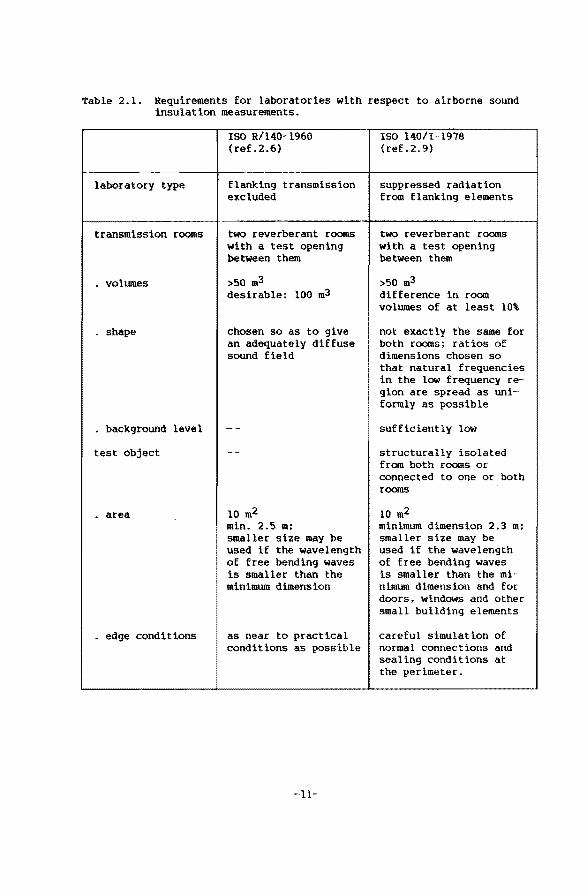
Table 2.1. Requirements for laboratorles with respect to airbornesound insulation measurements.
laboratory type
transmission rooms
• volumes
• shape
• background level
test object
• area
• edge conditions
ISO R/140-1960 (ref.2.6)
flanking transmission excluded
two reverberant rooms with a test opening between them
>50 m3 desirable: 100 m3
chosen so as to give an adequately diffuse sound field
10 m2 min. 2.5 m: smaller size may be used if the wavelength oE free bending waves is smaller than the minimum dimension
as near to practical conditions as possible
-11-
ISO 140/I-1978 (ref. 2. 9)
suppressed radlation from flanking elements
two reverberant rooms with a test opening between them
>50 m3 diEferenee in room volumes of at least 10\
not exactly the same for both rooms; ratios of dimensions chosen so that natural frequencies in the low frequency region are spread as uniformly as possible
sufficiently low
structurally isolated from both rooms or connected to one or both rooms
10 m2 minimum dimension 2.3 m; smaller size may be used if the wavelength of free bending waves is smaller than the minimum dimension and for doors, windows and other small building elements
careful simulation of normal connections and sealing conditions at the perimeter.
The average sound pressure level may be obtained by using a number of fix
ed microphone positions or a continuously moving microphone with an inte
gration of the squared rms sound pressure.
The sound pressure levels should be measured using third-octave band fil
ters, of which the centre frequencies in hertz should be at least: 100,
125, 160, 200, 250, 315, 400. 500, 630, .800, 1000, 1250, 1600, 2000, 2500
and 3150.
The correction term in eq.(2.3) containing the equivalent absorption area
may preferably be evaluated from the reverberation time measured using Sa
bine's formula:
A 0.163 x (VIT)
where: A = the equivalent absorption area, in m2
V the receiving room volume, in m3
T the reverberation time, in seconds.
2.4.2. The intensity metbod
{2.4)
The power Wi of the incident sound (eq.{2.1)) is the product of the in
tensity li of the incident sound and the area s of the test object:
(2.5)
The intensity of the incident sound can be calculated under the assumption
of a diffuse sound field from:
2 Ii = p /(4pc) (2.6)
2 where: p the average squared rms sound pressure in the souree room
in Pa 3
p the density of air in kg/m
c the speed of sound in air in mis
-12-
The intensity level of the incident sound is related to the averaged sound
pressure level by:
where: t.li the intensity level of the incident sound in dB re
10{-l2) watts/m2
{2. 'I)
the averaged sound pressure level in the souree room in dB
re 20 J.LPa
lUso, the transmitted acoustic power w". for a homogeneaus test object
can be calculated from:
w .....
I . S .....
(2.8)
where: I". "' the intensity of· the sound transmitted through the test
object in watts/m2
S the area of the test object in m2
The transmitted acoustic intensity is measured by a two·microphone probe
directly behind the test object. The axis through the two microphones is
perpendicular to the surface of the object. The measured intensity is the
component of the intensity in the direction of the axis and is given by:
where: p(t)
v{ t)
T (1/'1:) •
0J p{t) . v(t) dt (2.9)
the instantaneous pressure in Pa
the instantaneous partiele velocity in the direction of the
axis in m/s
T the averaging time in seconds
The sound pressure p{t) in eq.(2.9) is obtained from the sound pressurns
pA(t) and p8(t), measured by the two microphones A and B:
p( t) (2.10)
-13·
and tbe partiele velocity v(t) is determined by tbe pressure gradient be
tween the two microphones:
3 where: p = the density of air in kg/m .
fix = the distance between the micropbones in m
(2.11)
The metbod involving eqs.(2.9), (2.10) and (2.11) is known as tbe direct
metbod for determining tbe sound intensity (refs.2.18 and 2.19}.
Tbe acoustic intensity can also be obtained by transformation to tbe fre
quency domain by using a two-channel FFT analyser (ref.2.20 and 2.21):
(2.12)
where: Im(SAB(~)) = tbe imaginary part of the cross-spectrum of tbe
two microphone signals pA(t) and p8
(t)
~ ; tbe angular frequency, 2n times tbe frequency
The metbod involving eq.(2.12) is called tbe indirect metbod todetermine
the sound intensity (refs.2.18 and 2.20 to 2.22).
Tbe sound reduction index Ri then follows from:
(2.13)
where: L1
= the average sound pressure level in tbe souree room in dB
re 20 J,l.Pa
the level of the transmitted acoustic intensity in
watts/m2 measured according to tbe direct or tbe indirect
metbod directly bebind the object
(Ri is used bere instead of R to distinguish the resu1ts of the intensity
metbod Erom those oE the pressure method.)
-14-
The sound field in the souree room is generated in the same way as in the
case of conventional measurements. The receiving room is in fact not ne
cessary for the intensity measurements. one wants to avoid sound being re
jected from the boundaries of the receiving room at the probe. Therefore,
a free field situation is perfect. In a normal transmission suite the re-·
ceiving room is for this purpose made almost anechoic by bringing in a
large amount of absorption material.
In literature the reactivity, or reactivity index RI, is often used as a
measure for the reaction of the receiving room. It is defined by:
where:
RI L - L p I
L and L are the sound pressure level and the intensity level p I
respectively, measured in the receiving room directly behind the
test object.
For a free field, RI ~ OdB
The transmitted intensity is measured at many fixed positions directly be
hind the object or by scanning the specimen with the probe.
As usual, the results,are presented in third-octave bands.
2.4.3. Sinqle-number guantities
To characterize the acoustical performance of a building element the fre
quency--dependent values of airborne sound insulation can be converted into
a single number. These single number quantities are intended for simplify
ing the formulation of acoustical requirements in building codes.
Different single-number quantities for the sound reduction index are used.
We will use some of them in this thesis:
1. Rw: the weighted sound reduction index:
It is determined by camparing the measured sound reduction index
in third-octave bands with the reEerenee curve from lSO 111/1 (ref.
2.23). The method of compar:l.son is given in the same document.
2. RA: the sound reduction index in dB(A):
With respect to the reEerenee spectrum of standard outdoor noise
(more or less the spectrum of traff:l.c noise} (ref.l.3) RA is
calculated from:
15-
where: R1
(2.15)
the sound reduction index in the ith octave band: the
centre frequencies of the octave bands considered are
125, 250, 500, 1000 and 2000 Hz
e1
a correction term fqr weighing the sound reduction
index in octave band i to the reEerenee spectrum: the
values of e1
are --14, 10, ·6, -5 and -'7dB respectiv
ely for the octave bands considered
The sound reduction index Ri (ref.2.24) is calculated from:
where: Rij
{2.16)
the sound reduction index in the third-octave band
j, belonging to octave band i
3. Rm: the averaged sound reduction index in the frequency range
l00-3150Hz:
R m
where: Rk
16 (1/16) l: Rk
k=1 (2.1'1)
the sound reduction index in the kth third-octave
band
Rw is used in all laboratories, especially in the FRG. lts value is de
termined by the values of R in the mld- and high frequencies.
In France and The Netherlands RA is used besides Rw' especially Eor
characterizing glazing, although the reference spectra of both countries
diEEer slightly. The value of RA is often determined by the values of R
at the low and midfrequencies.
Therefore the value of R is lower than the value of R for the same A w
object. The value of Rm is lying between the values of RA and Rw.
16-
CHAPTim 3. FP.C'OORS AFFECTING THE RESULTS OF LABORP.TORY SOUND INSULATION
MEASUREMENTS
3.1. Introduetion
The sound reduction index of a building element as defined by eq.(2.l) is
of course determined by some properties of the element itself. The most
important are: 2
the surface mass in kg/m
the bending stiffness, and as a derived quantity:
the critical frequency fc
- the internal loss factor
the element type: single, laminated or double-leaved.
Many investigations nave been dedicated to the 1nfluence of these proper
ties on the sound reduction index. Therefore it is no subject of this the·
sis. Instead we will pay attention to the uncertainties that occur in la
boratory measurements of the sound reduction index.
The results of measurements of the sound reduction index of a building
element which is mounted between two transmission rooms, are influenced
by:
1. the properties of the transmission suite;
2. the test method used;
3. statistica! errors.
This chapter summarizes the factors affecting the results of laboratory
measurements, as observed by other investigators.
3.2. Effects caused by the properties of the transmission suite
3.2.1. General
The volume of the souree room and the receiving room should be at least 3
50 m • The main reason for that is to guarantee a certain degree of dif-
fusivity of the sound field in both rooms, even at the lowest frequency of
-11-
interest, 100Hz. Very often the rooms have bigger volumes: in The Nether
lands the values lie between 50 and 120m3
.
Besides, we have to take into account another ISO requirement: the area 2
of the test object should be about 10 m . For the bigger rooms (100 3
m ) this requirement implies that the test object can be smaller than
the wall between the two rooms. In that case the rest of the wall between
the rooms should have a very high sound insulation.
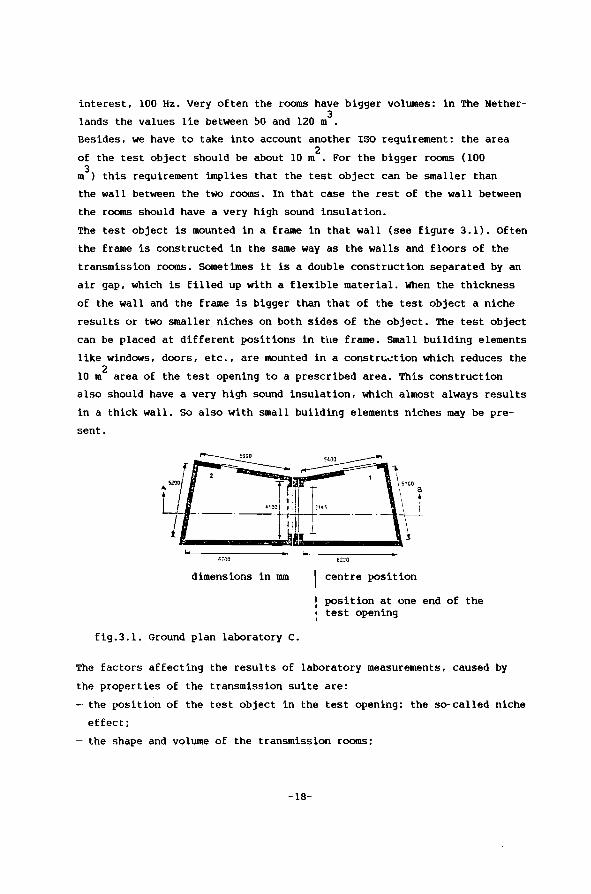
The test object is mounted in a frame in that wall (see figure 3.1). Often
the frame is constructed in the same way as the walls and floors of the
transmission rooms. Sometimes it is a double construction separated by an
air gap, which is filled up with a flexible material. When the thickness
of the wall and the frame is bigger than that of the test object a niche
results or two smaller niches on both sides of the object. The test object
can be placed at different positions in ti1e frame. Small building elements
like windows, doors, etc., are mounted in a constr~~tion which reduces the
10 m2
area of the test opening to a prescribed area. This construction
also should have a very high sound insulation, which almost always results
in a thick wall. so also with small building elements niches may be pre
sent.
dimensions in mm
fig.3.1. Ground plan laboratory c.
centre position
position at one end of the test opening
The factors affecting the results of laboratory measurements, caused by
the properties of the transmission suite are:
- the position of the test object in the test opening: the so-called niche
effect;
- the shape and volume of the transmission rooms;
-18-
- the edge conditions of the test object;
- the measuring direction:
- the loudspeaker position:
- diffusing elements.
The factors have a rather frequency-dependent influence on the results.
In the next paragraphes these effects will be explained.
3.2.2. The niche effect
Different workers have demonstrated the influence of the position of the
test object within a deep test opening on the measured sound reduction in··
dex (refs.3.1 to 3.6).
When an object is placed in the centre of a deep test opening we get two
equal niches, as to depthand area, on both sides of the object. This sym
metry is disturbed when the specimen is placed away from the centre of the
test opening. For frequencies below the critica! frequency of the test ob
ject the centre position yields the lowest sound reduction index, while
the position at one end of the test opening produces the highest values.
This niche effect can be observed especially with lightweight construc
tions having a high critical frequency. That is why many investigations
concerning the niche effect have been carried out on glazing. The diffe
rences in sound reduction index because of the niche effect may be up to
lOdB. This effect is not fully explained by theory. Possible explanations
are pointing in the direction of a strong coupling of resonant modes in
the niches on both sides of the test object.
3.2.3. The effect of egual shape and volume of souree and receivinq room
As can be seen from theoretica! models and experiments of many workers
(refs.3.2 and 3.9 to 3.11) the measured sound reduction index depends on
the shape and the volume of the souree room and the receiving room. When
the volumes of souree and receiving room are equal, which almost always
means that the rooms have the same shape, this will yield the lowest va·
lues of the measured sound reduction index. If there is a difference in
volume of at least 10\ then the measured results are higher. This effect
is not depending on frequency.
-19-
The following explanation might be given:
In the souree room a large number of room modes are excited by the loud
speaker. Some modes are coupled strongly with the bending wave modes of
the test object. In turn these bending waves excite specific modes in the
receiving room. If the receiving room is (exactly) identical with the
souree room, the modes of both rooms coincide. This results in a strong
coupling of some specific modes in the souree room with the same modes in
the receiving room via the modes of the test object. The consequence of
this is a reduced sound reduction index.
The differences in the measured sound reduction index due to this effect
are seldom more'than 3dB.
According to Kihlman (ref.3.9) it can only be observed in the absence of
flanking transmission.
3.2.4. The effect of different edqe conditions of the test object
In most laboratorles the test specimen is always connected to only one
transmission room. The character of this conneetion affects the vibratio
nal behaviour of the object.
This may lead to two effects (ref.3.2):
1. For frequencies below the critical frequency the radlation of sound
from a vibrating object with finite dimensions depends on the ,boundary
conditions: more sound is radiated from a clamped test object than from
a simply supported object. As a result of this the sound reduction in-
dex is higher for a simply supported object than it is for a clamped
object.
2. For frequencies above the critical frequency edge losses occur in two
ways: power flow from the vibrating object to the adjoining structures
and dissipation by friction at the edges of the object. Both types of
edge losses depend on the boundary conditions.
Ad.l. For frequencies below the critlcal frequency sound radlation is not
possible for an lnfinite plate because of acoustic short circuit.
For a finite plate this short circuit does not occur at the edges,
so radlation of sound is possible even at frequencies below the cri
tical frequency. Only a strip of the plate near the perimeter radia-
-20-
tes sound so the boundary conditions are very important. Theory and
experiments have shown that a clamped panel radiates more sound than
a simply supported panel. Therefore a flexible conneetion between
the test object and the adjoining structures increases its sound re
duction index for frequencies below the critical frequency.
Por frequencies above the critical frequency vibrating panels are
able to radlate sound from the entire surface. For frequencies above
the critical frequency these boundary conditions -clamped or simply
supported- are of no importance, unless edge losses occur.
Ad.2. The total loss factor of a vibrating panel, indicating which Erac
tion of the vibrational energy is lost, is the sum of internat los
ses and edge losses (also called edge damping). These edge losses
are very important for the sound reduction index, especially when
the internal loss factor is low, i.e. for metal panels and glazing.
The sound reduction index is increased by increasing edge losses for
frequencies above the critical frequency. one part of edge losses,
the power flow to the adjoining structures depends on the coupling
between the test object and the adjoining structures. This coupling
can be expressed in terms of a sudden change in impedance. For a
rigid conneetion between the test specimen and the adjoining struc
tures this sudden change in impedance depends firstly on the ratio
of tbe surface masses of the object and the adjoining structures and
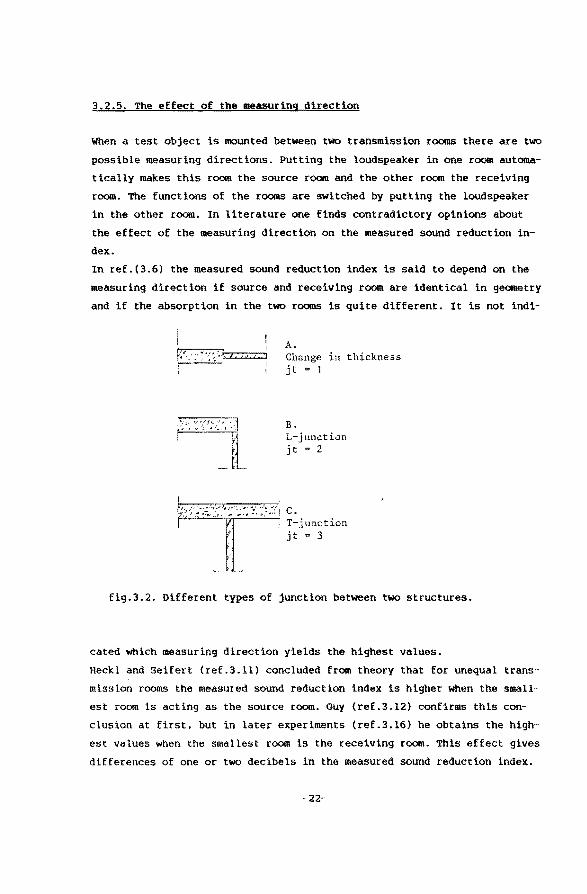
secondly on the shape of the junction (fig.3.2): change in thickness
(junction type 1) or a L- or T-junction (junction types 2 and 3)
(ref.3.7). A flexible conneetion reduces the power flow to the ad
joining structures.
Host transmission suites are constructed of heavy structures. As a
consequence, the flow of power to the adjoining structures will be
higher for rigidly mounted heavy objects than it is for lightweight
objects. For lightweight constructions the sound reduction index may
be increased for frequencies above the critical frequency by intro
ducing friction at the edges.
Both effects can lead to diEferences in the measured values of the sound
reduction index of up to 4dB.
-21-
3.2.5. The effect of the measurinq direction
When a test object is mounted between two transmission rooms there are two
possible measuring directions. Putting the loudspeaker in one room automa
tically makes this room the souree room and the other room the receiving
room. The functions of the rooms are switched by putting the loudspeaker
in the other room. In literature one finds contradictory opinions about
the effect of the measuring direction on the measured sound reduction in
dex.
In ref.(3.6) the measured sound reduction index is said todependon the
measuring direction if souree and receiving room are identical in geometry
and if the absorption in the two rooms is quite different. It is not indi-
I ,)
A. Change in thickness j t 1
B. L-junction jt = 2
fig.3.2. Different types of junction between two structures.
cated which measuring direction yields the highest values.
Heckl and Seifert (ref.3.ll) concluded from theory that for unequal trans
mission rooms the measured sound reduction index is higher when the small
est room is acting as the souree room. Guy (ref.3.12) confirms this con
clusion at first, but in later experiments (ref.3.16) he obtains the high
est values when the smallest room is the receiving room. This effect gives
diEferences of one or two decibels in the measured sound reduction index.
-22-
3.2.6. Tbe effect of the loudspeaker position
The position of the loudspeaker in the souree room determines which modes
are being excited and to What extent. Since each mode is coupled in its
own way with the modes of the test object the loudspeaker position will
influence the measured sound reduction index. This is confirmed by experi
mentsof different workers (ref.3.6). Bspecially for double-leaf construc
tions the effect of the loudspeaker position is pronounced. One oE the
characteristic properties of this type of construction is the mass-spring
resonance determined by the surface masses of the two leaves and the
stiffness of the air gap between them. The loudspeaker position affects
the measured sound reduction index in the region of this resonance fre
quency.
3.2.1. The effect of diffusers
If necessary diffusing elements should be installed in the rooms to obtain
a diffuse sound field.
In symmetrical situations, i.e. for symmetrical niches and equal volumes
of souree and receiving room, the measured sound reduction index increases
by brtnging in diffusing elements in one of the rooms. This means that the
niche effect or the effect of equal rooms will be dimtnisbed (refs.3.2 and
3.10}. This may be explained by the disturbance of the symmetry by the
diffusers. In that way the strong coupling between the modes of souree
room, object and receiving room is decreased.
3.3. The effect of the test method; the Waterhouse effect
As seen in chapter 2 (eq.2.12} it is possible to measure directly the
sound intensity. This intensity technique is used mainly for determining
the sound power of noise sources, but in recent years it is used more and
more for determining the sound reduction index of partitions. Bspecially
Crocker c.s. (refs.3.11 and 3.18) and Cops c.s. (refs.3.19 to 3.22) have
carried out many sound insulation measurements using the intensity techni
que.
In their experiments and in those of other workers much attention is paid
to the comparison of the results of the conventional metbod on the one
hand and the results of the intensity metbod on the other hand.
Almost every experiment dealing with this comparison shows that:
1 for frequencies below 400 or 500 Hz the intensity metbod yields
lower values than the conventional method:
ii- for frequencies above 1000 Hz the results from intensity measure
ments are higher than the results obtained with the conventional
method.
The diEferences between the results of the two test methods may be up to
5 dB. Till now these effects have all been found from measurements on
lightweight constructions with a high critica! frequency. From measure
ments carried out on glazing Cops (ref.3.20} found that the sound reduc
tion index at the critical frequency is about 2 dB higher when measured
by means of the intensity technique. Halliwell and Warnock (ref.3.23) sup
pose that the so-called Waterhouse-effect is partly responsible for the
diEferenee between the results of the intensity metbod and the conventio
nal method.
Waterhouse (ref.3.24) and others (ref.3.36) have shown that in a room the
energy density near surfaces and corners is higher than in the centre of
the room. Therefore an estimation of the total sound power brought into
the room Erom a measurement of the sound pressure level averaged over the
'centre volume' of the room, is too low. (The 'centre volume' of the room
is the volume enclosed by imaginary surfaces each being 1 m in front of
the real surfaces.)
When carrying out sound power measurements according to ISO 3741 (ref.
3.25) the measured sound pressure level must be corrected for this error.
This correction, the so-called Waterhouse correction. is given by:
L ~ L + 10 lg (1 + (S k/8V)) p p (3.1)
where: L p
s k
~ the measured sound pressure level in the centre volume of
the room in dB re 20 ~Pa
the total area of the surfaces of the room in m2
the wavelength at the centre frequency of the f.requency
band concerned in m
-24-
V the room volume in m3
L = the corrected sound pressure level in dB p
The Waterhouse correction is no part of the standard test procedure for
sound insulation measurements. As seen in chapter 2 (eq.2.3) in this stan
dard procedure the transmitted sound power is estimated by measuring the
sound pressure level in the centre volume of the receiving room, corrected
for the amount of sound absorption in the room. When the transmitted sound
power is measured with the intensity technique in the immediate vicinity
of the test object this may result in different values. These diEferences
may be explained partly by the Waterhouse correction.
If the Waterhouse correction should be applied to conventional sound insu
lation measurements it should be applied to the sound pressure level in
the receiving room. This means that at low frequencies the sound reduction
index is somewhat reduced.
Returning to the beginning of 3.3. the diEferences between the results of
conventional and intensity measurements for frequencies below 400 Hz (i)
are also reduced. In literature an explanation for the remaining diEferen
ces in the frequency region below 400 Hz (i) is not given. The diEferences
between the results of both test methods for frequencies above 1000 Hz
(ii) are not explained either.
3.4. Statistical errors; repeatability and reproducibility
3.4.1. Introduetion
Tests, performed on presumably 'identical materials' in presumably 'iden
tical circumstances' do not, in general, yield identical test results.
This is attributed to unavoidable random errors inherent in every test
procedure: apart from these random errors there are other factors that may
influence the outcome of a test. They may (apart Erom the inhomogeneity of
samples) originate from, for example:
a. the operator;
b. the instruments and equipment used:
c. the calibration of the equipment:
d. the environment (temperature, humidity, air pollution, etc.).
-25-
Hence, many different measures of variability are conceivable according
to the circumstances under which the tests have been performed. Two ex
treme measures of variability, termed repeatability and reproducibility
have been found sufficient to deal with most practical cases.
Repeatability refers to tests performed at short intervals in one labora
tory by one operator, using the same equipment each time. These conditions
are called repeatability conditions. Onder these conditions factors a to d
are considered as constants and do not contribute to the variability. Then
variability is determined only by remaining random errors. A quantative
definition of the repeatability r is given by tso 3534 (ref.3.26):
The repeatability r is the value below which the absolute diEferenee
between two single test results obtained with the same method on iden
tical test material, under the same conditions (same operator, same ap
paratus, same laboratory, and a short interval of time) may be expected
to lie with a specified probability: in the absence of other indica
tions, the probability is 95%.
Reproducibility refers to tests performed in different laboratories, which
implies different operators and different equipment. The factors a to d
vary under these reproducibility conditions: they contribute to the varia
bility of test results. The ISo-document 3534 also gives a quantative de
finition of the reproducibility R:
The reproducibility R is the value below which the absolute diEferenee
between two single test results obtained with the same metbod on iden
tical test material, under different conditions (different operators,
different apparatus, different laboratorles and/or different time) may
be expected to lie with a specified probability: again in the absence
of other indications a probability of 95% is used.
As tobuilding acoustics ISO 140/tl (ref.2.10) deals with the statement of
precision requirements concerning sound insulation measurements. Precision
is a general term for the closeness of agreement between replicate test
results. Thus the repeatability r and the reproducibility R describe the
precision of a given test method under two different circumstances of re
plication. A series of interlaboratory trials organized with the specific
purpose of determining the repeatability r and the reproducibility R is
-26-
called a precision experUnent. lSO 140/II states minimum values Eor the
precision required when carrying out tests according to ISO 140. This
means that requirements for the repeatability r are given in this docu
ment. Also a method for a standard check of the repeatability is presen·
ted.
Besides, in the second working draftof ISO 140/II (ref.3.2?) requirements
for the reproducibility and a method to check reproducibility are given.
The seventh working draft (ref.3.28) of ISO 140/Il states requirements Eor
r and R concerning the single-number quantities. The requirements Eor r
and R are based on precision experiments carried out in few laboratorles
on Eew types of test objects in England, the FRG and the united States.
The procedure for determining the repeatability and the reproducibility
is described in ISO 5725 (ref.3.29).
3.4.2. Procedure for determininq the repeatability and the reproducibility
The Iso-document 5125 is primarily intended for the determination of the
repeatability r and the reproducibility R of the results of standardized
test methods used in different laboratories.
The test methods used in this thesis have been introduced in chapter 2:
- the standard test method according to ISO 140/Ill (ref.2.11);
- the intensity method.
The second method has not been standardized yet by any ISO procedure.
For laboratory measurements the sound reduction index R has to be deter
mined as a function of frequency, i.e. in third-octave bands. This means
that for laboratory sound insulation measurements the repeatability r as
well as the reproducibility R is a function of frequency.
In the description of the statistica! model in the next paragraph however
for the sake of clearness we will not use an index indicating frequency
dependence.
3.4.2.1. The statistica! model:
In ISO 5125 (ref.3.29) a statistica! model for estimating the precision of
a test method is introduced. In this model it is assumed that every single
test result y is the sum of three components:
y a m + B + e (3.2)
-21-
where: m the average
B a term representing the deviation from m described to the spe
cific laboratory, and
e = a random error occurring in every test
Suppose that p laboratories are taking part in a precision experiment and
that in the ith laboratory ni single test results are obtained under re
peatability conditions. Then m can be calculated from:
m
where: Yi the
ni the
yik the
p l:
i=1
average test n. yik );1
n. k=1 1
result in the ith laboratory
number of single test results in the ith
kth test result in the ith laboratory
(3.3)
laboratory
The term e represents a random error occurring in every single test re
sult. The distribution of this variable is assumed to be approximately
normaL
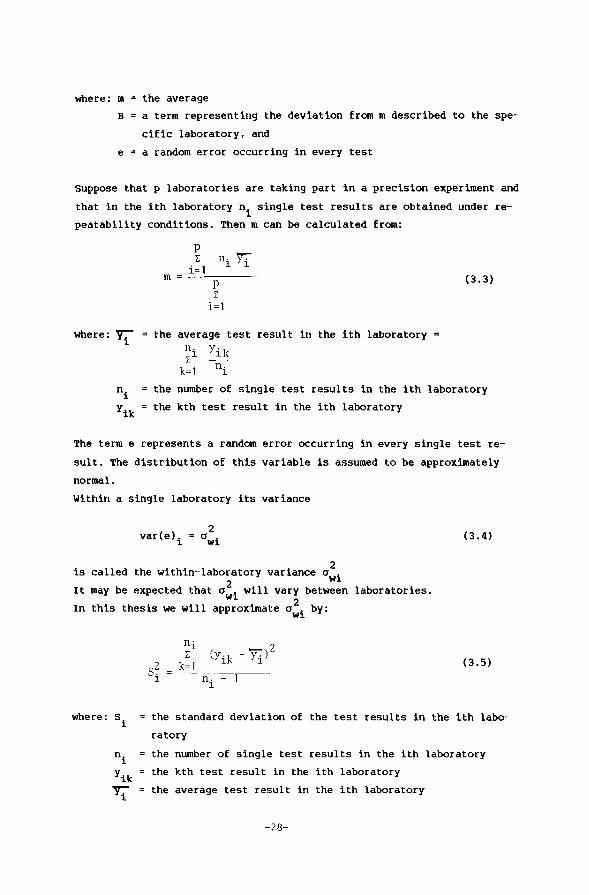
Within a single laboratory its varianee
2 var(e)i = awi (3.4)
2 is called the within-laboratory varianee awi
2 It may be expected that a i will vary between laboratories. w 2
In this thesis we will approximate awi by:
s? 1
n· 1 l:
k=1 (y.k - 'y.)2
1 1 (3.5)
where: si the standard deviation of the test results in the ith labo-
ratory
ni the number of single test results in the ith laboratory
yik the kth test result in the ith laboratory
ljl the average test result in the ith laboratory
-28-
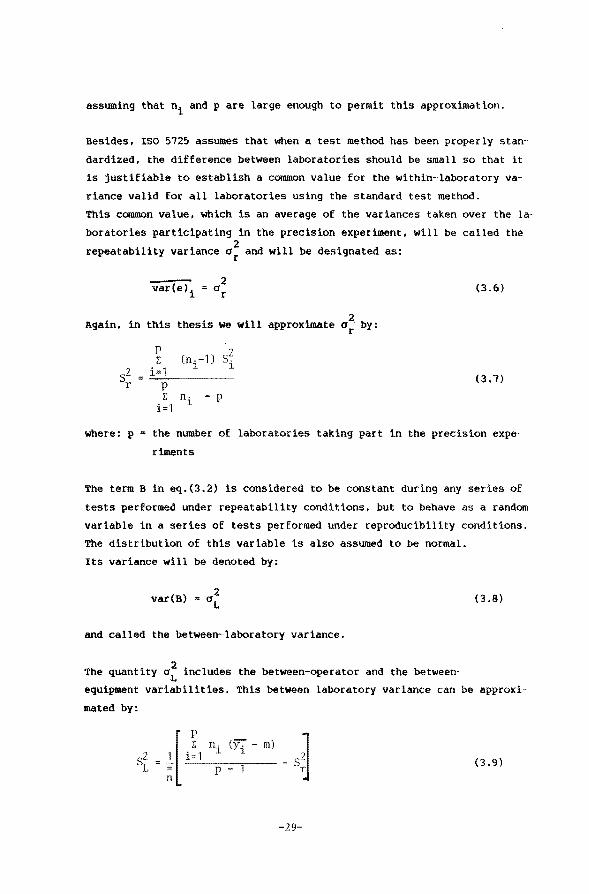
assuming that ni and p are large enough to permit this approximation.
Besides, ISO 5?25 assumes that when a test metbod has been properly stan
dardized, the difference between laboratorles should be small so that it
is justifiable to establish a common value for the within-laboratory va
riance valid for all laboratorles using the standard test method.
This common value, which is an average of the variances taken over the la
boratories participating in the precision experiment, will be called the
repeatabiiity varianee a2
and will be designated as: r
2 Again, in this thesis we will approximate ar by:
n. - p i=1 1
(3.6}
(3.?}
where: p the number of laboratorles taking part in the precision expe
riments
The term B in eq.(3.2) is considered to be constant during any series of
tests performed under repeatability conditions, but to behave as a random
variabie in a series of tests performed under reproducibility conditions.
The distributton of this variabie is also assumed to be normal.
lts varianee will be denoted by:
var(B) {3.8)
and called the between-laboratory variance.
2 The quantity aL includes the between-operator and the between-
equipment variabilities. This between laboratory varianee can be approxi
mated by:
. ~[ ,!, - m) ~ sZ - sz (3.9) L r
-29-
p 2
] 1 [ p
l: ni fi = E i=1
lP-TJ i=1 p {3.10} n-
l: l
i=1
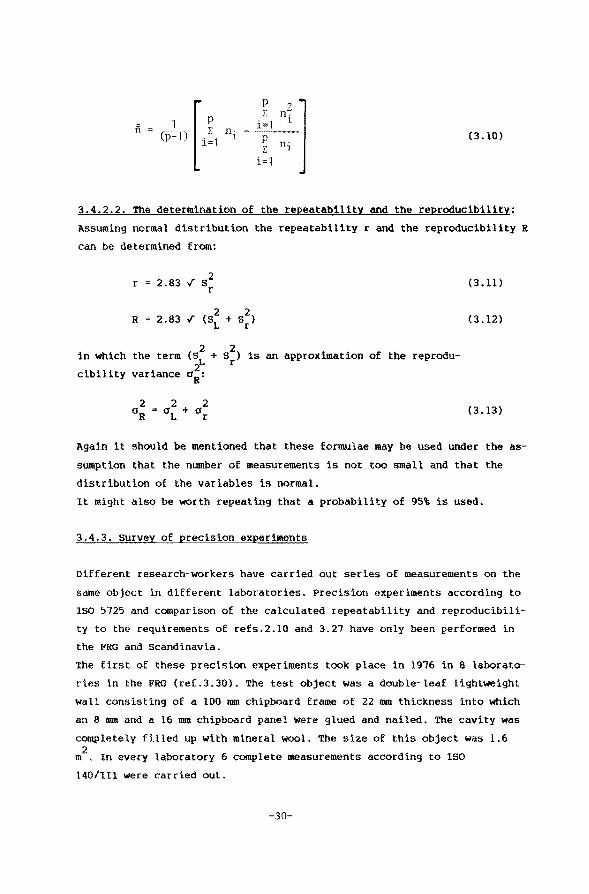
3.4.2.2. The determination of the repeatability and the reproducibility:
Assuming normal distribution the repeatability r and the reproducibility R
can be determined Erom:
in which
cibility
R 2.83 v (S~ + S~)
2 the.term (~ +
var~ance aR:
s2) is an approximation of the reprodu
r
(3.11)
(3.12)
(3.13)
Again it should be mentioned that these formulae may be used under the as
sumption that the number of measurements is not too small and that the
distributton of the variables is normal.
lt might also be worth repeating that a probability of 95\ is used.
3.4.3. Survey of precision experiments
Different research-workers have carried out series of measurements on the
same object in different laboratories. Precision experiments according to
lSO 5725 and comparison of the calculated repeatability and reproducibili
ty to the requirements of refs.2.10 and 3.27 have only been performed in
the FRG and Scandinavia.
The first of these precision experiments took place in 1916 in 8 laborato
ries in the FRG (ref.3.30). The test object was a double-leaf lightweight
wall consisting of a 100 mm chipboard frame of 22 mm thickness into which
an 8 mm and a 16 mm chipboard panel were glued and nailed. The cavity was
completely filled up with mineral wool. The size of this object was 1.6 2 m . In every laboratory 6 complete measurements according to ISO
140/111 were carried out.
-30-
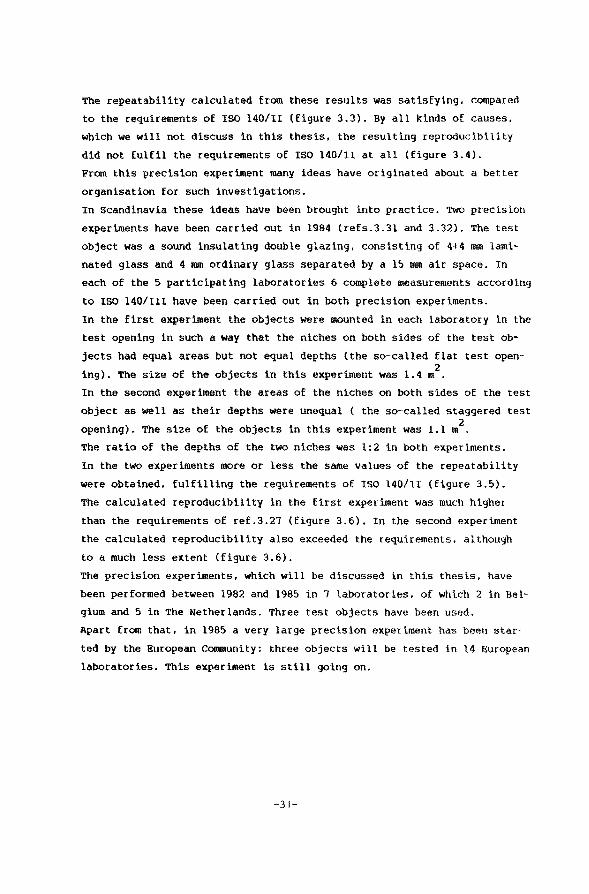
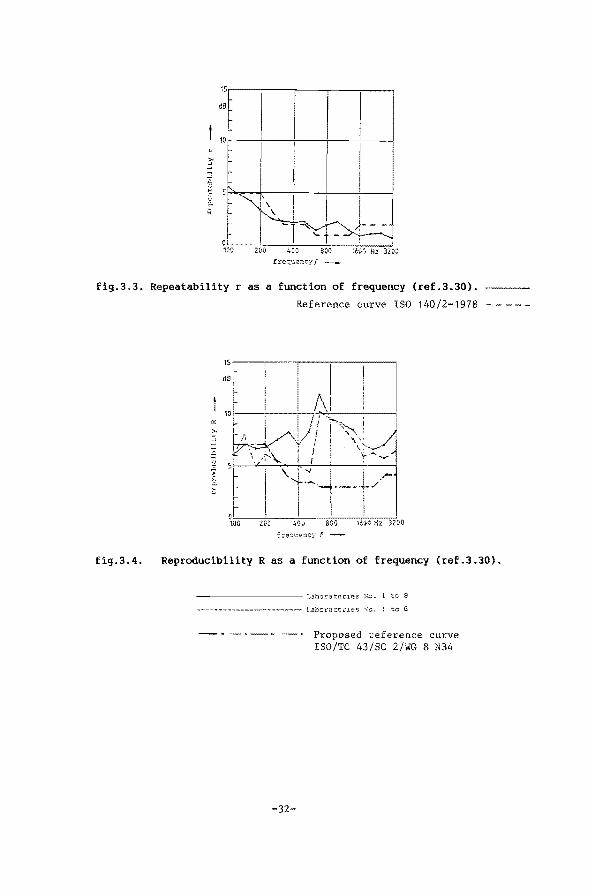
The repeatability calculated from these results was satisfyirtg, compared
to the requirements of ISO 140/II (figure 3.3). By all kinds of causes,
which we will not discuss in this thesis, the resulting reproducibility
did not fulfil the requirements of ISO 140/11 at all (figure 3.4).
From this precision experiment many ideas have originated about a better
organisation for such investigations.
In Scandinavia these ideas have been brought into practice. Two precision
experiments have been carried out in 1984 (refs.3.31 and 3.32). The test
object was a sound insulating double glazing, consisting of 4~4 mm lami
nated glass and 4 mm ordinary glass separated by a 15 mm air space. In
each of the 5 participating laboratorles 6 complete measurements according
to ISO 140/III have been carried out in both precision experiments.
In the first experiment the objects were mounted in each laboratory in the
test opening in such a way that the niches on both sides of the test ob
jects had equal areas but not equal depths (the so-called flat test open-2 ing). The size of the objectsin this experiment was 1.4 m .
In the second experiment the areas of the niches on both sides of the test
object as well as their deptbs were unequal ( the so-ccalled staggered test 2 opening). The size of the objects in this experiment was 1.1 m
The ratio of the deptbs of the two niches was 1:2 in both experiments.
In the two experiments more or less the same values of the repeatability
were obtained, fulfilling the requirements of ISO 140111 (figure 3.5).
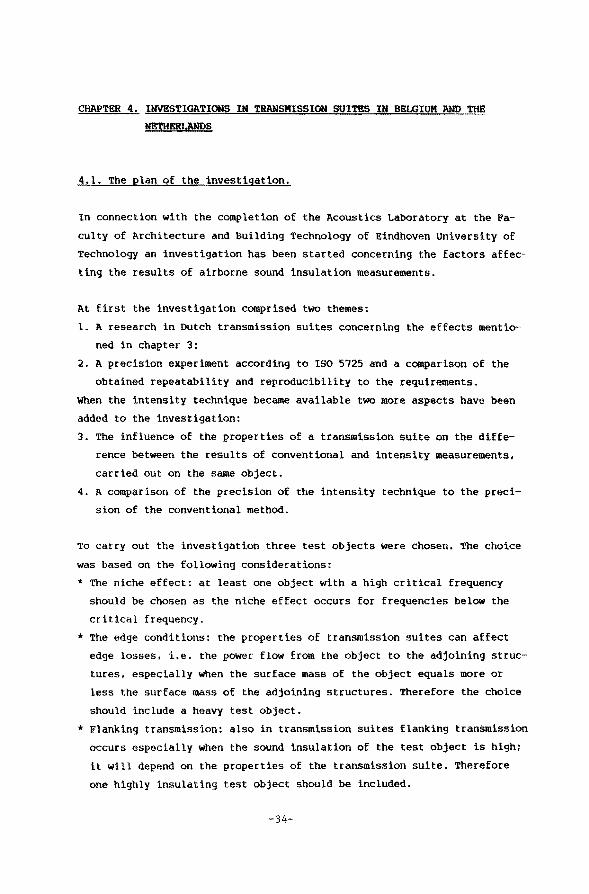
The calculated reproducibility in the first experiment was much higher
than the requirements of ref.3.2'7 (figure 3.6). In the second experiment
the calculated reproducibility also exceeded the requirements, although
toa much lessextent (figure 3.6).
The precision experiments, which will be discussed in this thesis, have
been performed between 1982 and 1985 in 7 laboratories, of which 2 in Bel
gium and 5 in The Netherlands. Three test objects have been used.
Apart from that, in 1985 a very large precision experiment has been star
ted by the European Community: three objects will be tested in 14 European
laboratories. This experiment is still going on.
-31-
éB ! I ) I
I f I !
~ I I f::>
I
t 10
-;:: J
~ 5
~~ I I j ~ I - 1,~t )---~
0' . I \ I
1co zcu 400 aoo 1600 Hz no~ freq:..;enc:tf -
f1g.3.3. Repeatability ras a function of frequency (ref.3.30).
fig.3.4.
Reference curve ISO 140/2-1978
15 ':---,---.,----,.---,----,
1 dl I ~ 10 . I I '
"' r- I , 1
"' !- η -· ' /'\V! ~ I I i ~ \ /;"-\._ I
: 'f 1 '1. :-4---v· J . I ! loc zeo 400 soo 16;}il Kz 32VO
Reproducibility R as a function of frequency {ref.3.30}.
--------I..;;Ooratorles 1 te 8
----------------------~~ Lab::::rat:C;:l-eS 1 to 6
-32-
Proposed :;:eference curve ISO/TC 43/SC 2/WG 8 N34
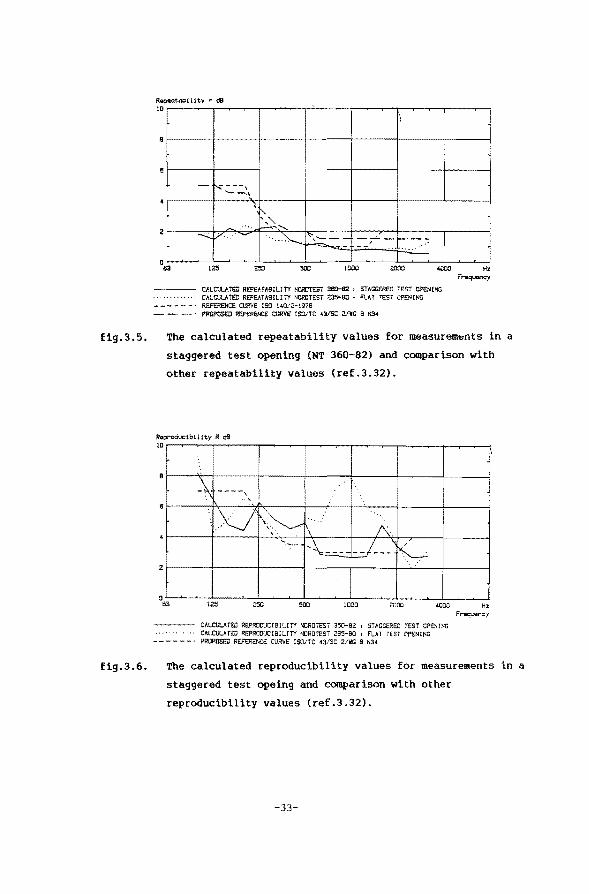
fig.3.5.
fig.3.6.
8~----~~-----+------~------+-------~----~------~
5~-----+------~----~------~------+------+------~
CALctJLI.TEü REPE.'ITABILITY NORIJTEST 360-82 t SïAGGEP.Eû TESï OPENfNG · · · · • · · • • · •• · CALC'JLATEC RE.t:~EATI'.BILITY NORDTEST 2...-'lS-80 t FLAT TEST ill'ENtNG ------ · REFERaa: C\II!'IE ISO 14012-l978
PRlll'Ostll R!i:FE<ENtE CURVo lSO/TC 43/SC 2/YG e N34
The calculated repeatability values for measuremtnts in a
staggered test opening (NT 360-82) and comparison with
other repeatability values (ref.3.32).
\~.~--~7~~~~~~~~~~--~L_~~--lOL00~~~-2LL'00~--~-~LOO~~~_jHz Fn;~~ncy
------- CALCULATED REPROCUC!SlL!TY NCROTESi 360-82 t Si;..Gt;EREO TEST OPE.'HNG CALC'ULATEiJ RE.PROOUCIBZlrTY NOROTEST 235-80 t FLAT TEST OPEtHNG PROPOSEO REFERENCE CURVE tSOITC 43/SC 2/'iG 9 N34
The calculated reproducibility values for measurements in a
staggered test opeing and comparison with other
reproducibility values (ref.3.32).
-33-
CHAPTER 4. INVESTIGATIONS IN TRANSMISSION SUITES IN BELGIUM AND THE
NETHERLANDS
4.1. The plan of the investiqation.
In conneetion with the completion of the Acoustics Labaratory at the Fa
culty of ~rchitecture and Building Technology of Eindhoven University of
Technology an investigation has been started concerning the factors affec
ting the results of airborne sound insulation measurements.
At first the investigation comprised two themes:
1. A research in Dutch transmission suites concernlog the effects mentio
ned in chapter 3;
2. A precision experiment according to ISO 5725 and a comparison of the
obtained repeatability and reproducibility to the requirements.
When the intensity technique became available two more aspects have been
added to the investigation:
3. The influence of the properties of a transmission suite on the diffe
rence between the results of conventional and intensity measurements,
carried out on the same object.
4. A comparison of the precision of the intensity technique to the preci
sion of the conventional method.
To carry out the investigation three test objects were chosen. The choice
was based on the following considerations:
* The niche effect: at least one object with a high critica! frequency
should be chosen as the niche effect occurs for frequencies below the
critica! frequency.
* The edge conditions: the properties of transmission suites can affect
edge losses, i.e. the power flow Erom the object to the adjoining struc
tures, especially when the surface mass of the object equals more or
less the surface mass of the adjoining structures. Therefore the choice
should include a heavy test object.
* Flanking transmission: also in transmission suites flanking transmission
occurs especially when the sound insulation of the test object is high:
it will depend on the properties of the transmission suite. Therefore
one highly insulating test object should be included.
-34-
* The level of m: in laboratory practice of sound insulation measurements
the range of levels of m encountered is very wide, so the repeatability
r and the reproducibility R should be studied for different values of m.
* The organization: in precision experiments each participating laboratory
has to make tests on identical objects. This can be realized in two
ways:
i. by circulating one object along each participating laboratory, the
so-called 'round robin';
ii. by constructing as many objects as there are participating laborato
ries and testing these objects more or less simultaneously.
These considerations resulted in the choice of the following test objects:
- a lightweight single wall made of wood and chipboard with a surface mass 2 of approximately 35 kg/m ;
- a heavy single wall made of sand lime blocks with a surface mass of ap-2
proximately 450 kg/m :
- a 'middleweight' single wall made of sand lime blocks with a mass per 2 unit area of approximately 225 kg/m
The investigation consisted three of three parts:
1: The experiments on the lightweight wall, including the investigation
concerning the niche effect.
2: The experiments on the heavy wall. including some intensity measure
ments.
3: The experiments on the middleweight wall, including the precision expe·
riment of the intensity method.
Part 1 has been completed in 1983, part 2 in 1984 and part 3 in 198~.
In each part of the investigation a precision experiment according to tso
5725 has been carried out. The test method used was the standardized
'pressure' method of tso 140/III, meaning that each laboratory has to per
form a number of tests on each object under repeatability conditions.
The number of tests in each laboratory is based or1 AnnexBof ref.2.10,
which states that:
"considering the frequency-dependency of the quantities measured in
building acoustics (comparable to the levels of the test property ac
cording to ISO 5725 clause 2.5) from a statistica! point of view there
should be at least 5 partleipants (p>5) but it is preferabie to exceed
this number in order to reduce the number of replicate measurements
-35-
required. The number of laboratorles p and the number of test results
in each laboratory n1
should be so chosen that:
However for each leaboratory at least five results are needed."
ISO 5725 states that:
"if the range of m is very wide then the use of 6 levels may be desi
rable. The number of laboratorles should to some extent depend on the
number of levels. It is recommended that p should never be less than 8
and if only a single level is of interest, p should preferabl~ be
higher, say 15 or more.
Regarding the value of n1
, the recommended figure is 2 except where
it is customary to make a large number of replicates."
4.2. The participatinq laboratorles
The laboratorles that have taken part in the investigation are:
A. The Institute of Applied Physics TNO at Delft.
B. The TNO Environmental Research Institute at Delft (abbreviated in Dutch
IMG-TNO).
c. The Acoustics Laboratory of the Faculty of Architecture and Building
Technology at Eindhoven University of Technology.
D. Private Consultants in Acoustics Peuts & Associé's at Nijmegen.
E. Private consultants in Acoustics van Dorsser B.V. at The Hague.
F. Laboratory on Acoustics and Heat Conduction of the Katholieke Universi
teit Leuven (Belgium).
G. scientific centre for Building Technology (WTCB or CSTC) at Limelette
near Brussels (Belgium).
H. United companies Bredero (VBB) at Maarssenbroek.
Part 1 of the investigation has been carried out in the laboratorles A to
F and H, whereas parts 2 and 3 have taken place in the laboratorles A to
G and laboratorles A and c to G respectively. The plans and vertical sec
tions of each laboratory are given in figure 4.1. Table 4.1 presents the
essential data of the transmission robms of each laboratory (from ref.
4.1).
-36-
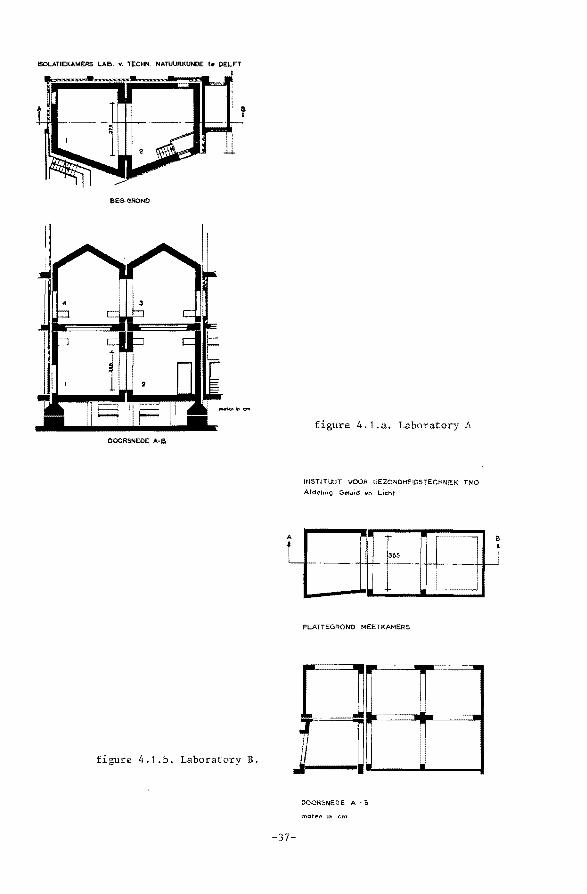
ISOLATIEKAMEAS LAe. ~. TECHN. NATUt.JRKUNOE te DEL.F'T
I
BEG-GROND
DOORSNEe<: A·&
figure 4.1.b. Labaratory B.
figure 4.1.a. Labaratory A
INSTlTWT VOOR GEZONOHEIDSTECHNIEK TNO
Afd(l'!mg Geluid @n Licht
PLATTEGROND MEETKAMERS
[] [j
•...
J
···----I
:. .i
DOORSNEDE A-B
mot~n rn em
-37-
B
J
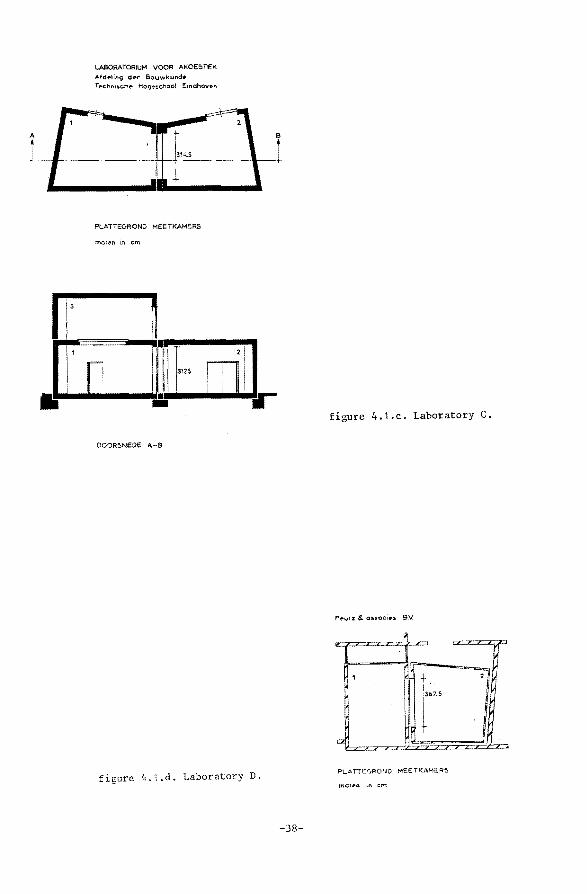
LABORATORIUM VOOR AKOESTEK
Afde-ling d~,. Bouwkuf'lde> T~chn1t.Ch~ Hog~;;>school E1ndhov.-"
PLATTEvROND MEETKAMERS
mol't>n in cm
DOORSNEDE A-B
figure 4.1.d. Laberatory D.
-38-
figure 4.1.c. Laberatory C.
~~
1 ~r~ ,
I. r;,. 21
cz I PLATTEGRONO MEETKAMERS
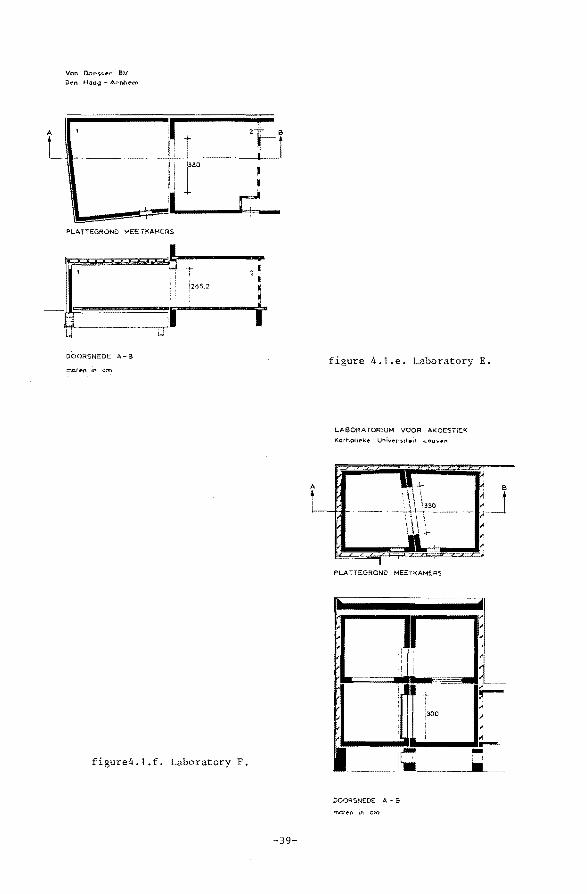
Voo Dorssf'r B:V Den Hoog Arnhe-m
PLATTEGROND MEETKAMER~
LJ
DOORSNEDE A-S
t i265.2 l
!
figure4.1.f. Labaratory F.
I I
• t
-39-
"
figure 4.1.e. Labaratory E.
L.ABORATORlUM VOOR AKOESTIEK
Kcrhoi1E"k~ Unîv~r$.tt~it LitU'Io'ill'n
l \\\ \ 1330
~ \' \\ 1\+-
PLATTEORONO MEËTKAMER5
DOORSNEDE A - B
mateon 11'1 cm
I n ... A1 I
: ! I i
1 I !I
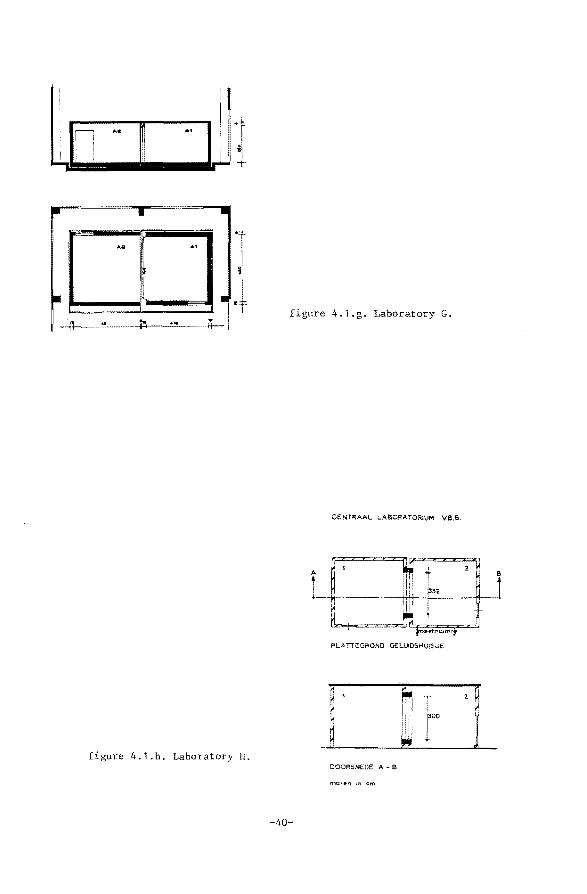
i\ I. I •t figure 4.1.g. Laboratory G.
CENTRAAL LASORATORIUM IIB.B.
PLATTEGROND GELU!DSHUlS.JE
n H ,
~ J l
figure 4.1.h, Laboratory H. DOORSNEDE A B
more-n 1n cm
-40-
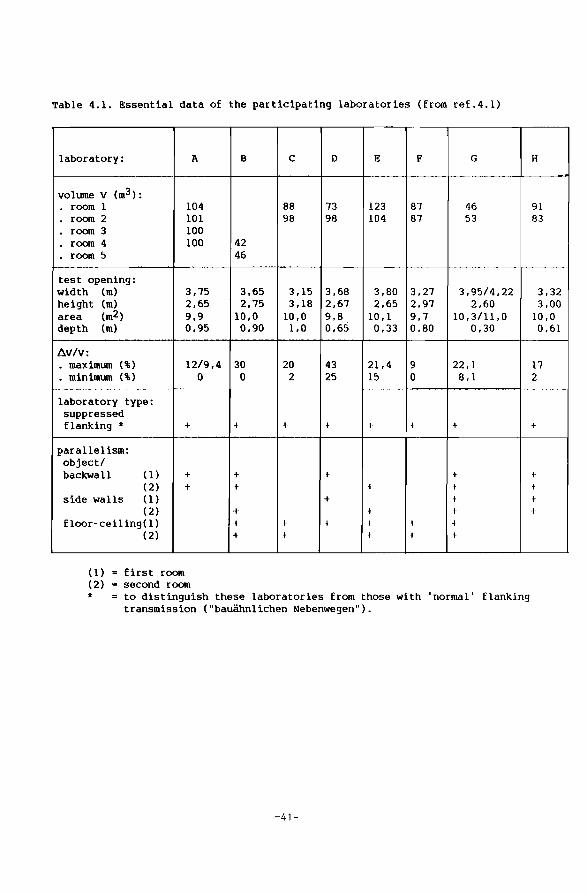
Table 4.1. Essential data of the participating laboratories (from ref.4.1)
laboratory: A
volume V (m3): room 1 104 room 2 lOl room 3 100 room 4 100 room 5
test opening: width (m) 3,75 height (m) 2,65 area (m2) 9,9 depth (m) 0,95
ó.VIv: maximum (\) 12/9,4
. minimum (\) 0
laboratory type: suppressed nanking * +
parallelism: object/ backwall (1) +
(2) + side walls (1)
(2) floor-ceil ing(l)
(2)
(1) first room (2) second room
B
42 46
3,65 2,75
10,0 0,90
30 0
+
+ +
+ + +
c D E F G
88 73 123 87 46 98 98 104 87 53
3,15 3,68 3,80 3,27 3,95/4,22 3,18 2,67 2,65 2,97 2,60
10,0 9,8 10,1 9,7 10,3/11.0 1.0 0,65 0,33 0,80 0,30
20 43 21.4 9 22,1 2 25 15 0 8,1
+ t I t +
t t l t
+ + t t
t l I + + t t + t
* to distinguish these laboratories from those with 'normal' flanki.ng transmission ("bauähnlichen Nebenwegen").
-41-
H
91 83
3,32 3,00
10,0 0,61
17 2
+
t
t t ~
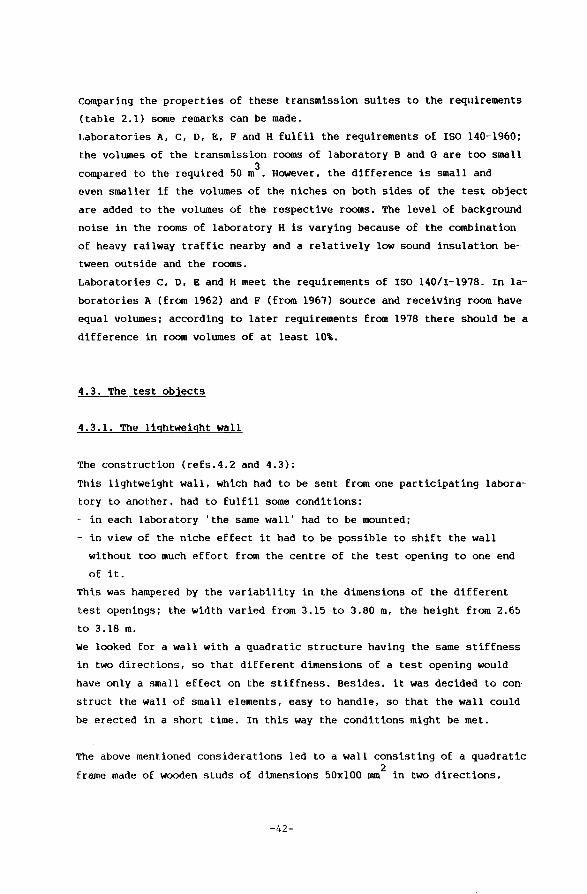
comparing the properties of these transmission suites to the requirements
(table 2.1) some remarkscan be made.
Laboratories A, c, D, E, F and H fulfil the requirements of ISO 140-1960;
the volumes of the transmission rooms of laboratory B and G are too small 3
compared to the required 50 m . However, the diEferenee is small and
even smaller if the volumes of the niches on both sides of the test object
are added to the volumes of the respective rooms. The level of background
noise in the rooms of laboratory H is varying because of the combination
of heavy railway traffic nearby and a relatively low sound insulation be-
tween outside and the rooms.
Laboratorles c, D, E and H meet the requirements of ISO 140/I-1978. In la
boratories A (Erom 1962) and F (from 1967) souree and receiving room have
equal volumes; according to later requirements Erom 1978 there should be a
diEferenee in room volumes of at least 10\.
4.3. The test obiects
4.3.1. The liqhtweiqht wall
The construction (refs.4.2 and 4.3):
This lightweight wall, which had to be sent Erom one participating labora
tory to another, had to fulfil some conditions:
in each laboratory 'the same wall' had to be mounted;
in view of the niche effect it had to be possible to shift the wall
without too much effort Erom the centre of the test opening to one end
of it.
This was hampered by the variability in the dimensions of the different
test openings; the width varied Erom 3.15 to 3.80 m, the height Erom 2.65
to 3.18 m.
we looked for a wall with a quadratic structure having the same stiffness
in two directions, so that different dimensions of a test opening would
have only a small effect on the stiffness. Besides, it was decided to con
struct the wall of small elements, easy to handle, so that the wall could
be erected in a short time. In this way the conditions might be met.
The above mentioned considerations led to a wall consisting of a quadratic
frame made of wooden studs of dimensions 50xl00 mm2
in two directions,
-42-
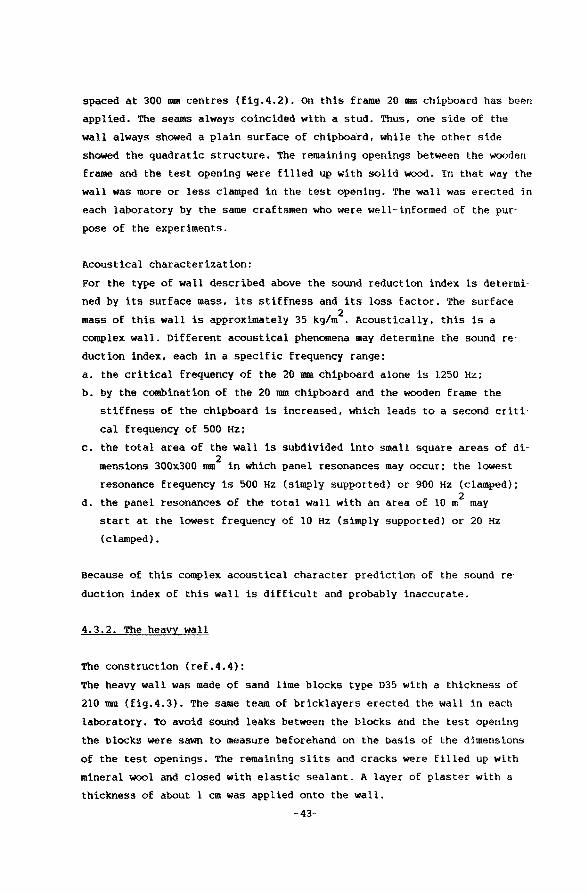
spaeed at 300 mm eentres (fig.4.2). on this frame 20 mm chipboard has been
applied. The seams always coincided with a stud. Thus, one side of the
wall always showed a plain surface of chipboard, while the other side
showed the quadratic structure. The remaining openings between the wooden
frame and the test opening were filled up with solid wood. In that way the
wa11 was more or less clamped in the test opening. The wall was erected in
each laboratory by the same eraEtsmen who were well-informed of the pur
pose of the experiments.
Acoustical characterization:
For the type of wall described above the sound reduction index is determi-
ned by its surface mass, its stiffness and its loss factor. The surface
mass of this wall is approximately 35 kglm2. Acoustically, this is a
complex wall. Different acoustical phenomena may determine the sound re
duction index, each in a specific frequency range:
a. the critical frequency of the 20 mm chipboard alone is 1250 Hz;
b. by the combination of the 20 mm chipboard and the wooden frame the
stiffness of the chipboard is increased, which leads to a second criti·
cal frequency of 500 Hz;
c. the total area of the wall is subdivided into small square areas of di
mensions 300x300 mm2 in which panel resonances may occur; the lowest
resonance frequency is 500 Hz (simply supported} or 900 Hz (clamped};
d. the panel resonances of the total wall with an area of 10 m2 may
start at the lowest frequency of 10 Hz (simply supported) or 20 Hz
(clamped).
Because of this complex acoustical character prediction of the sound re
duetion index of this wall is difficult and probab1y inaccurate.
4.3.2. The heavy wall
The construction (ref.4.4}:
The heavy wall was made of sand lime blocks type D35 with a thickness of
210 mm (fig.4.3). The same team of bricklayers erected the wall in each
laboratory. To avoid sound leaks between the blocks and the test opening
the blocks were sawn to maasure befarehand on the basis of the dimensions
of the test openings. The remaining slits and cracks were Eilled up with
mineral wool and closed with elastic sealant. A layer of plaster with a
thickness of about 1 cm was applied onto the wall.
-43-
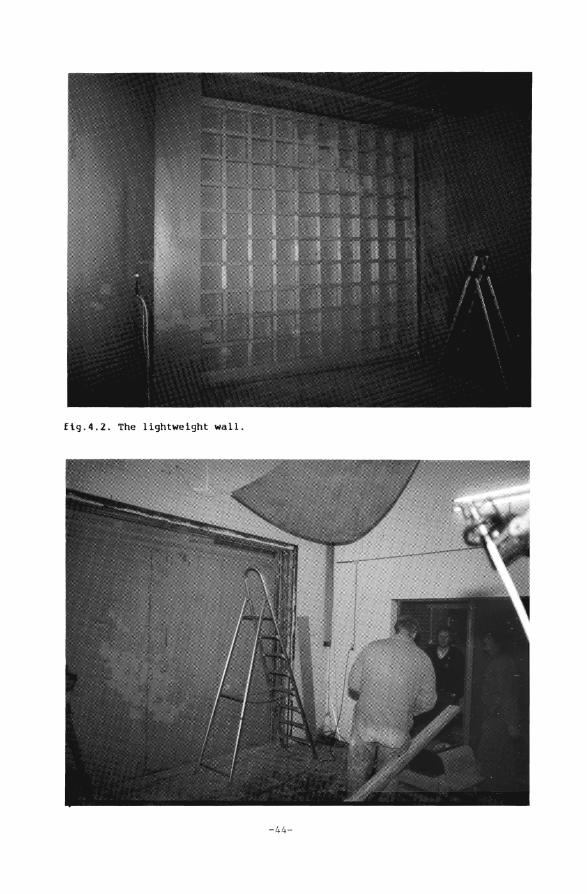
ftg.4.2. The lightweight wall.
- 44 -
Acoustical characterization:
The mass per unit area of this single homogeneous wall is 450 kg/m2 lts
critica! frequency is lying between 90 and 130 Hz, depending on the value
of the speed of longitudinal waves used for the calculation of the crlti
cal frequency. The lowest resonance frequency has been calculated ass1m1ing
a square with dimensions of 3.15 m. lts value is 62Hz (simply supported)
or 115Hz (clamped).
4.3.3. The 'middleweight' wal!
The construction (ref.4.5):
The middleweight wall was made of sand lime blocks type B33 with a thick
ness of 102 mm. Again, the same team of bricklayers built the wall in each
laboratory. To avoid sound leaks the same procedure was followed as with
the heavy wall. This wall too was plastered on one side in the same thick-
ness.
Acoustical characterization:
The mass per unit area of this wall is approximately 225 kg/m2 lts cri
tical frequency is lying between 195 and 270Hz, depending on the speed of
longitudinal waves used in the calculation. The lowest resonance frequency
of this wall with an area of 10m2
assuming a square, is 30 Hz (simply
supported) or 53Hz (clamped).
4.4. The tests performed on.the lightweight wall
For the precision experiment described in ref.4.3 the lightweight wall
has been mounted in the centre of the test opening as prescribed by ISO
140/III (ref.2.ll).
The participating laboratorles were requested to perform 8 complete tests
according to ISO 140/IIl under repeatability conditions. Some vartations
in the position of the loudspeaker and the absorption or diffusivity of
the rooms were allowed. Unfortunately, it turned out that these tnstruc·
tions had not been understood clearly. Firstly, some laboratorles had per
formed more tests because they considered one test to be the average of
two measurements in opposite directions. Secondly, some laboratorles had
not determined the reverberation time in the receiving room for every tP.st
anew. To cope with these troubles we decided to consider a test result to
-45-
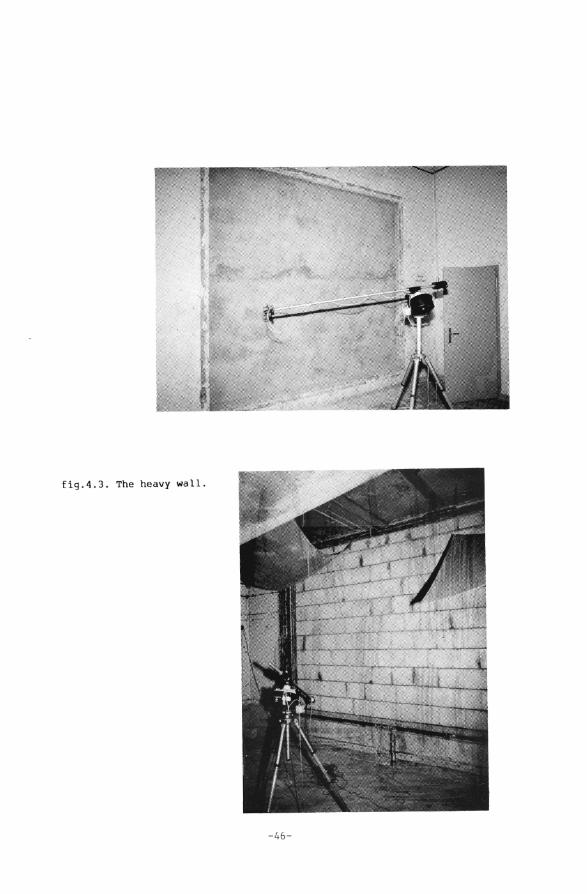
Eig.4.3 . The heavy wall.
- 46 -
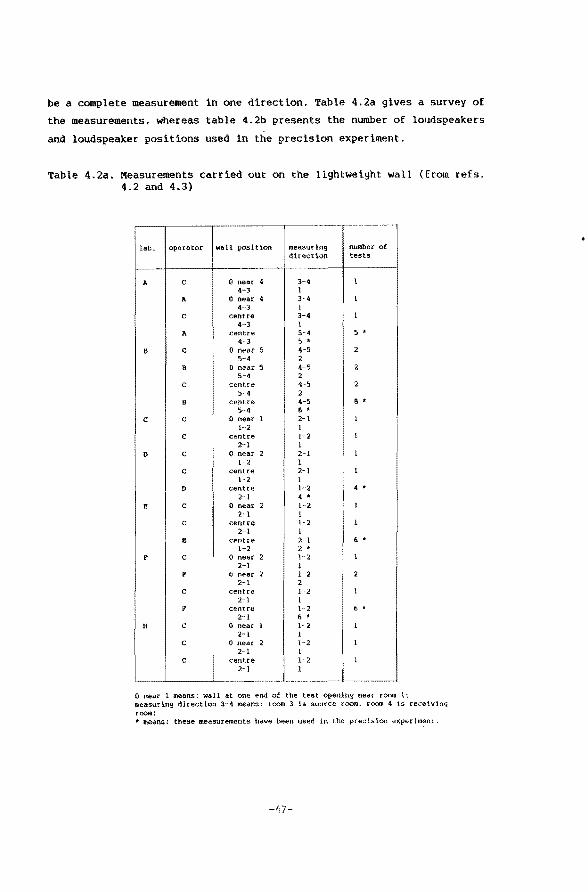
be a complete maasurement in one direction. Table 4.2a gives a survey of
the measurements, whereas table 4.2b presents the number of loudspeakers
and loudspeaker positions used in the precision experiment.
Table 4.2a. Measurements carried out on the lightweight wall (Erom refs. 4.2 and 4.3)
la.b. operator woll p<>sHion measurlng number ot.: direction tests
A c 0 near 4 3-4 l 4-3 1
A 0 near 4 3-4 l 4-3 l
c cent re 3-4 1 4-3 1
A cent re 3-4 5 • 4-J 5 •
B c 0 near 5 4-5 2 5-4 2
B 0 near 5 4-5 2 5-4 2
c centr-e 4--5 2 >-4 2
8 cent re 4-5 8 • 5-4 8 •
c c 0 m~ar l 2-1 1 1-2 I
c cent re 1· 2 1 2-1 1
D c 0 near 2 2·1 1 1-2 1
c cent re 2-1 l l-2 1
D cent re 1-2 4 • 2-1 4 •
E c 0 neat 2 1·2 1 2·1 1
c cent re 1·2 1 2-1 1
E cent re 2·\ 6 • 1-2 2 *
F c 0 near 2 1-2 1 2-1 1
F 0 near 2 1-2 2 2-1 2
c cent re l-2 1 2-1 l
F cent re l 2 6 * 2-1 6 •
H c 0 near 1 1- 2 l 2-1 I
c 0 near 2 1-2 1 2-1 I
c cent re 1-2 I
I 2-1 1
0 near 1 means: wall at one end of the test opening oear room l; \lleasuring direction 3~4 m.eans: room 3 is souree room. room 4 is cecetving rOO«t; • me<ms: these measurements have been used in the precision experiment.
-47-
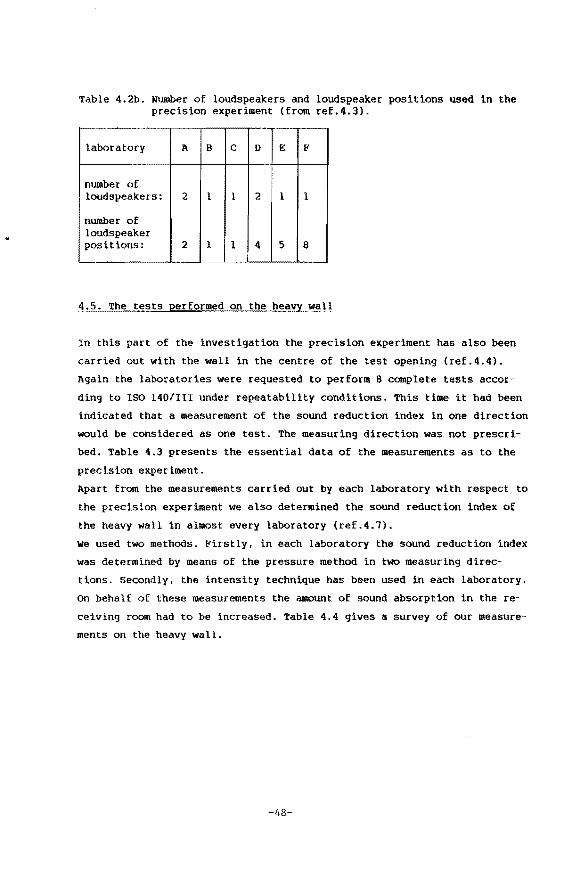
Table 4.2b. Number of loudspeakers and loudspeaker positions used in the precision experiment (from ref.4.3).
laboratory A B c D E F
number of loudspeakers: 2 1 1 2 1 1
number of loudspeaker positions: 2 1 1 4 5 8
4.5. The tests performed on the heavy wall
In this part of the investi9ation the precision experiment has also been
carried out with the wall in the centre of the test openin9 (ref.4.4).
A9ain the laboratorles were requested to perform 8 complete tests accor
din9 to ISO 140/III under repeatabi1ity conditions. This time it had been
indicated that a maasurement of the sound reduction index in one direction
would be considered as one test. The measurin9 direction was not prescri
bed. Table 4.3 presents the essentia1 data of the measurements as to the
precision experiment.
Apart from the measurements carried out by each laboratory with respect to
the precision experiment we also determined the sound reduction index of
the heavy wall in almost every laboratory (ref.4.7).
we used two methods. Firstly, in each laboratory the sound reduction index
was determined by means of the pressure method in two measurin9 direc
tions. Secondly, the intensity technique has been used in each laboratory.
on behalf of these measurements the amount of sound absorption in the re
ceivln9 room had to be lncreased. Table 4.4 9ives a survey of our measure
ments on the heavy wall.
-48-
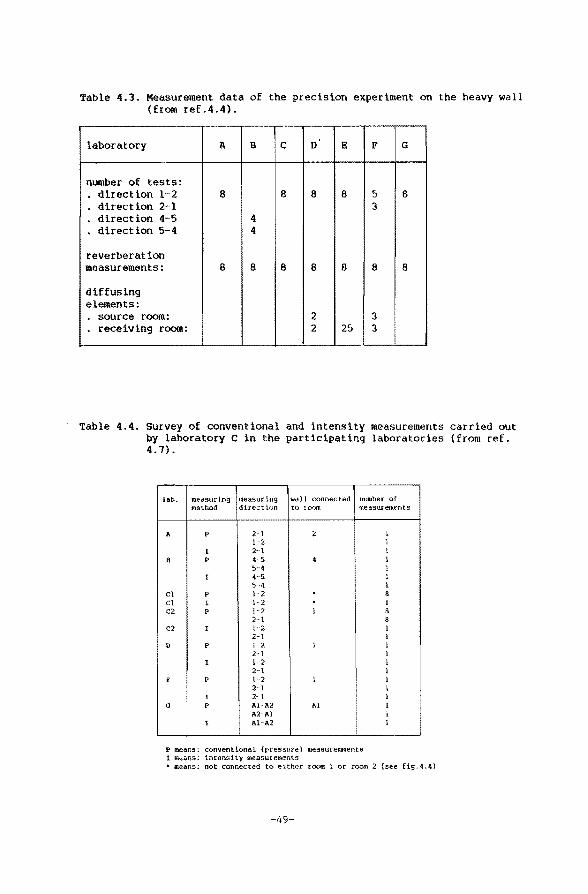
Table 4.3. Measurement data of the precision experiment on the heavy wall (from ref.4.4).
laboratory A B c 0 E F G
number of tests: direction 1-2 8 8 8 8 5 8 direction 2-1 3 direction 4-5 4
. direction 5-4 4
reverberation measurements: 8 8 8 8 8 8 8
diffusing elements: . souree room: 2 3 . receiving room: 2 25 3
Table 4.4. Survey of conventional and intensi.ty measurements carried out by laboratory C in the participating laboratories (from ref. 4.7).
lab. measurtng tneasuring Wd 11 conneet ed nwnber of method direct ion to toom rGeasucelûents
A p 2-1 • 1 1-2 l
I 2--1 i B p 4-5 4 I
5-4 l I 4-5 I
5-4 l Cl p 1 2 * 8 Cl I l-2 . l C2 p l-2 l 8
2-1 8 C2 I 1- 2 I
2-1 l l) p j- 2 l l
2--l l I l--2 l
2-l l ~ p \- 2 1 l
2- l 1 1 2- l l
G p Al--A2 Al l A2-Al
•
l I Al-A2 l
p means: conventional {pressure) measurements 1 mt';ans: intensity measutements * means; not connected to eUher room 1 or room 2 (se-e fig.4.4}
-49-
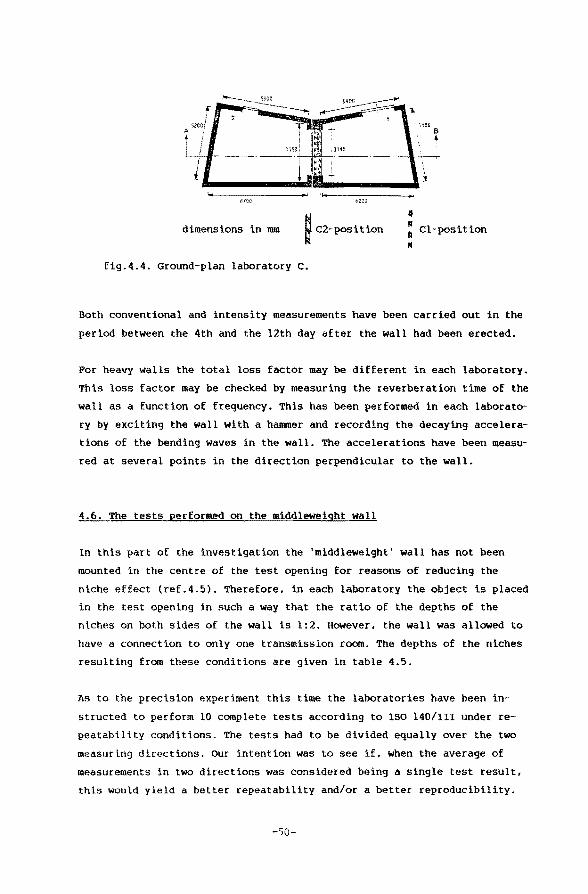
·,
\ .......... .adm ............ ~
dimensions in mm ~ C2-position
fig.4.4. Ground-plan laboratory c.
11
: Cl-position 111
Both conventional and intensity measurements have been carried out in the
period between the 4th and the 12th day after the wall had been erected.
For heavy walls the total loss factor may be different in each laboratory.
This loss factor may be checked by measuring the reverberation time of the
wall as a function of frequency. This has been performed in each laborato
ry by exciting the wall with a hammer and recording the decaying accelera
tions of the bending waves in the wall. The accelerations have been measu
red at several points in the direction perpendicular to the wall.
4.6. The tests performed on the middleweight wall
In this part of the investigation the 'middleweight' wall has not been
mounted in the centre of the test opening for reasons of reducing the
niche effect (ref.4.5). Therefore. in each laboratory the object is placed
in the test opening in such a way that the ratio of the depths of the
niches on both sides of the wall is 1:2. However, the wall was allowed to
have a conneetion to only one transmission room. The depths of the niches
resulting from these conditions are given in table 4.5.
As to the precision experiment this time the laboratorles have been in
structed to perferm 10 complete tests according to ISO 140/III under re
peatability conditions. The tests had to be divided equally over the two
measurtng dil:ections. Our intention was to see if, when the average of
measurements in two directloos was considered being a single test result,
this would yield a better repeatability and/or a better reproducibility.
-50-
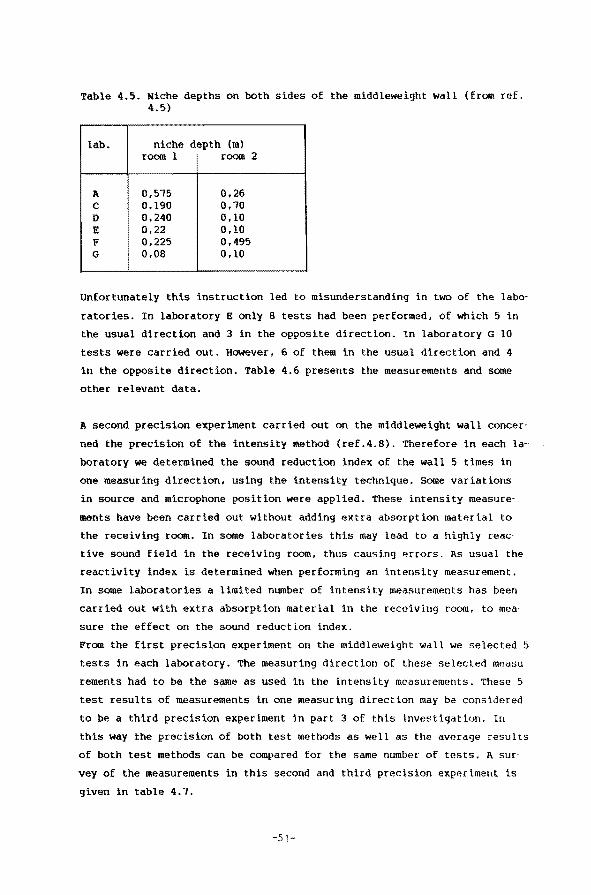
Table 4.5. Niche deptbs on both sides of the middleweight wall (from ref. 4.5)
lab. niche depth (m) room 1 room 2
A 0,5?5 0,26 c 0.190 0,?0 D 0,240 0,10 E 0,22 0,10 F 0,225 0,495 G 0,06 0,10
Unfortunately this instructien led to misunderstanding in two of the labo
ratories. In laboratory E only 8 tests had been performed, of Which 5 in
the usual direction and 3 in the opposite direction. In laboratory G 10
tests were carried out. However, 6 of them in the usual direction and 4
in the opposite direction. Table 4.6 presents the measurements and some
other relevant data.
A second precision experiment carried out on the middleweight wall concer
ned the precision of the intensity metbod {ref.4.8). Therefore in each la~
boratory we determined the sound reduction index of the wall 5 times in
one measuring direction, using the intensity technique. Some variations
in souree and microphone position were applied. These intensity measure
ments have been carried out without adding extra absorption material to
the receiving room. In some laboratorles this may lead to a highly reac
tive sound field in the receiving room, thus causing errors. As usual the
reactivity index is determined when performing an intensity measurement.
In some laboratorles a limited number of intensity measurements has been
carried out with extra absorption material in the receiving room, to mea
sure the effect on the sound reduction index.
From the first precision experiment on the middleweight wall we selected 5
tests in each laboratory. The measuring direct ion of these selected measu
rements had to be the same as used in the intenslty measureroents. These 5
test results of roeasurements in one measur!.ng direction may be considered
to be a third precision experiment in part 3 of this investigation. In
this way the precision of both test methods as well as the average results
of both test methods can be compared for the same number of tests. l\ sur
vey of the measurements in this second and third precision experiment is
given in table 4.?.
-51
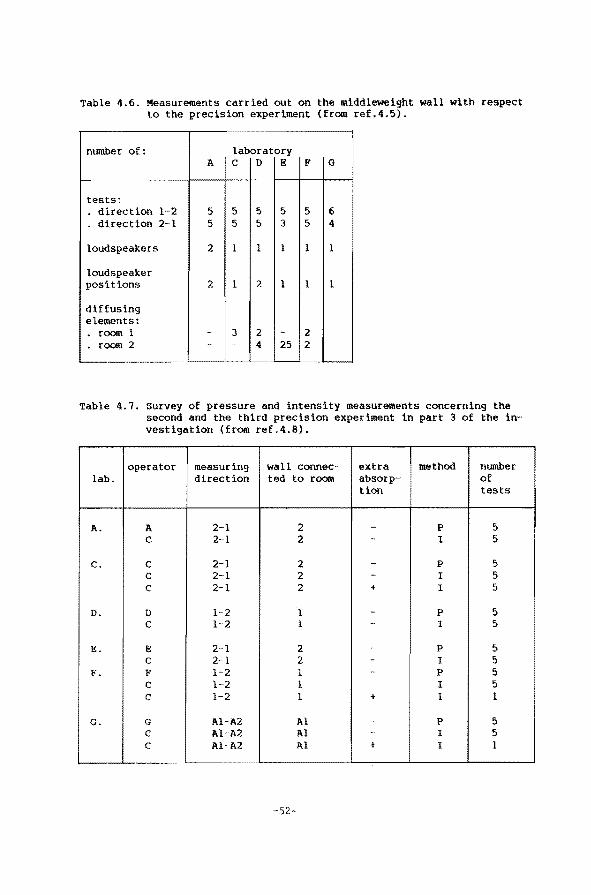
Table 4.6. Measurements carried out on the midd1eweight wa11 with respect to the precision experiment (from ref.4.5).
nUinber of: laboratory A c D E F G
tests: direction 1-2 5 5 5 5 5 6
. direction 2-1 5 5 5 3 5 4
loudspeakers 2 l 1 l 1 1
loudspeaker positions 2 1 2 1 1 1
diffusing elements: . room l - 3 2 - 2
room 2 - 4 25 2
Table 4.7. survey of pressure and intensity measurements concerning the second and the third precision experiment in part 3 of the investigation (from ref.4.8).
operator measuring wa 11 connec- extra method nUlliber lab. direction ted to room absorp- of
tion tests
A. A 2-1 2 - p 5 c 2-1 2 - I 5
c. c 2-1 2 - p 5 c 2-1 2 - I 5 c 2-1 2 + I 5
D. D 1-2 1 - p 5 c 1-2 1 - 1 5
E. E 2-l 2 - p 5 c 2--l 2 - I 5
!' ... l" 1-2 1 - p 5 c 1--2 1 - I 5 c l-2 1 t I 1
o. G Al-A2 Al - p 5 c Al-A2 !\l - I 5 c Al-A2 !\l t I 1
-52-
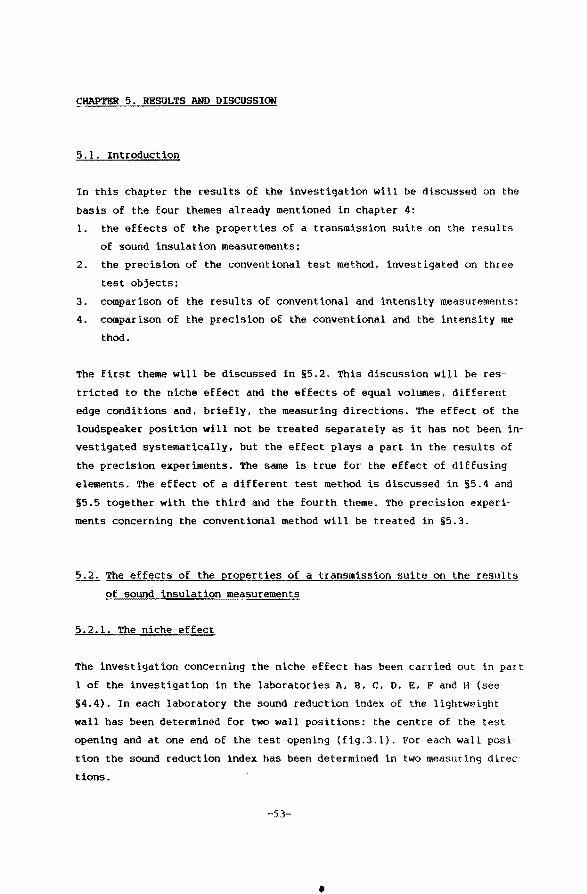
CHAPTBR 5. RESULTS AND DISCUSSION
5.1. Introduetion
In this chapter the results of the investigation will be discussed on the
basis of the four themes already mentioned in chapter 4:
1. the effects of the properties of a transmission suite on the results
of sound insulation measurements:
2. the precision of the conventional test method, investigated on three
test objects:
3. comparison of the results of conventional and intensity measurements;
4. comparison of the precision of the conventional and the intensity me
thod.
The first theme will be discussed in §5.2. This discussion will be res
tricted to the niche effect and the effects of equal volumes, different
edge conditions and, briefly, the measuring directions. The effect of the
loudspeaker position will not be treated separately as it has not been in
vestigated systematically, but the effect plays a part in the results of
the precision experiments. The same is true for the effect of diffusing
elements. The effect of a different test method is discussed in §5.4 and
§5.5 together with the third and the fourth theme. The precision experi
ments concerning the conventional method will be treated in §5.3.
5.2. The effects of the properties of a transmission suite on the results
of sound insulation measurements
5.2.1. The niche effect
The investigation concerning the niche effect has been carried out in part
1 of the investigation in the laboratorles A, B. c. D, E, F and H (see
§4.4). In each laboratory the sound reduction index of the lightweight
wall has been determined for two wall positions: the centre oE the test
opening and at one end of the test opening (fig.3.1). For each wall posi~
tion the sound reduction index has been determined in two measurinq direc~
tions.
-53-
•
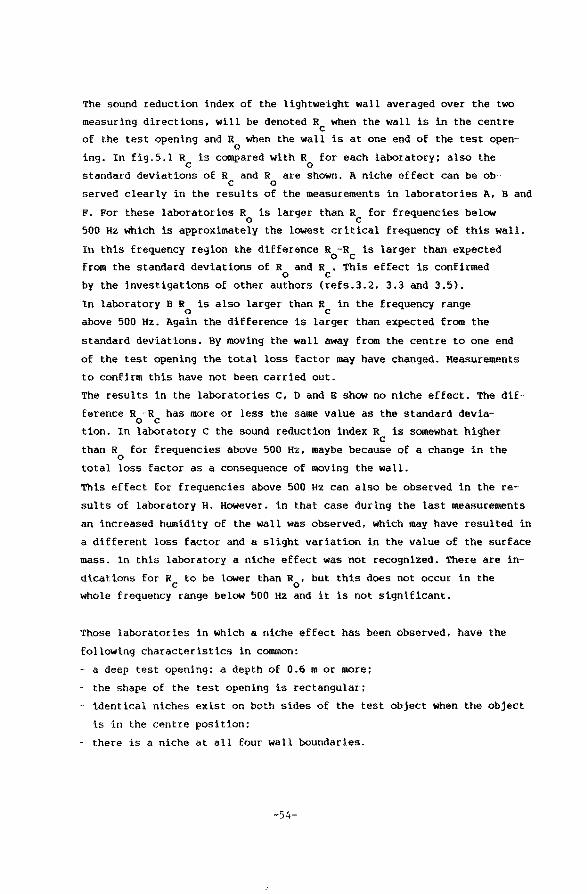
The sound reduction index of the lightweight wall averaged over the two
measuring directions, will be denoted Re when the wall is in the centre
of the test opening and R when the wall is at one end of the test open-o
ing. In fig.5.1 Re is compared with R0
for each laboratory: also the
standard deviations of R and R are shown. A niche effect can be ob-· c 0
served clearly in the results of the measurements in laboratorles A, B and
F. For these laboratorles R0
is larger than Re for frequencies below
500 Hz which is approximately the lowest critica! frequency of this wall.
In this frequency region the diEferenee R0
-Rc is larger than expected
Erom the standard deviations of R and R . This effect is confirmed 0 c
by the investigations of other authors (refs.3.2, 3.3 and 3.5).
In laboratory B R0
is also larger than Re in the frequency range
above 500 Hz. Again the diEferenee is larger than expected Erom the
standard deviations. By moving the wall away Erom the centre to one end
of the test opening the total loss factor may have changed. Measurements
to confirm this have not been carried out.
The results in the laboratorles C, D and B show no niche effect. The diE
ferenee R -R has more or less the same value as the standard devia-o c tion. In laboratory C the sound reduction index Re is somewhat higher
than R0
for frequencies above 500 Hz, maybe because of a change in the
total loss factor as a consequence of moving the wall.
This effect for frequencies above 500 Hz can also be observed in the re
sults of laboratory H. However, in that case during the last measurements
an increased humid1ty of the wall was observed, which may have resulted in
a different loss factor and a slight varlation in the value of the surface
mass. In this laboratory a niche effect was not recognized. There are in
dications for R to be lower than R , but this does not occur in the c 0 whole frequency range below 500 Hz and it is not significant.
Those laboratorles in which a niche effect has been observed, have the
following characteristics in common:
- a deep test opening: a depth of 0.6 m or more;
the shape of the test opening is rectangular;
identical niches exist on both sides of the test object when the object
is in the centre position;
- there is a niche at all four wall boundaries.
-54-
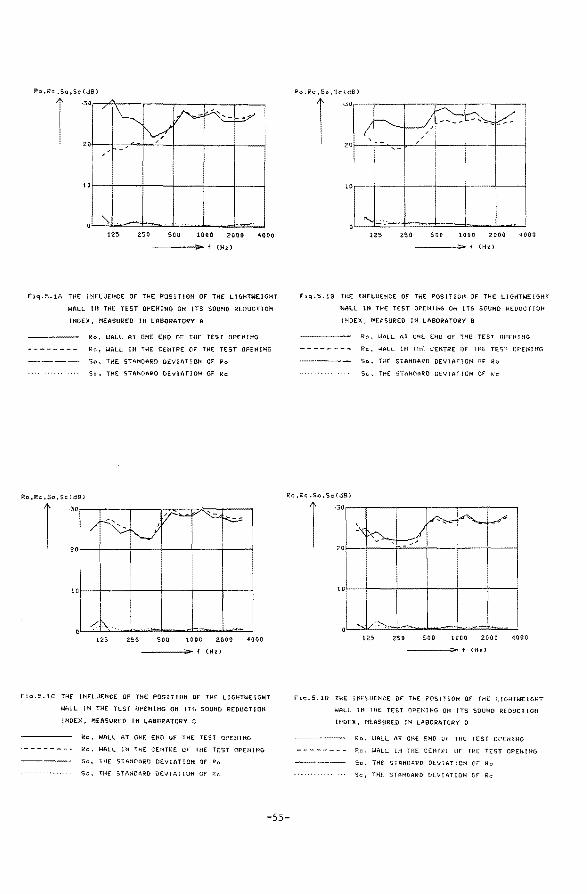
Ro.Rc,$o,ScC:I8)
1 ·3 0 7 r=: ~ ~
~ . '
0 -/
/ -/
0
0 '->.
125 250 500 10(10 2000 4000
----.;;r..f CHz)
tiq.5.1A THt iN:FLUEHCE OF THE POSlHOH OF THE' LI&HTWEJGHT
WALL IH THE TEST OPEHIHG OH lTS SOUHO REDUCTIOH
ltiOEX, NEASOREO In LABORATORY A
Ro, WALL Al" OHE EHO OF THE TESr OPEHJH'O
-------- Re, WAL I,.._ Ui iHË CE:HTP.'E OF' THE TEST OPEH IHG
--·-·- So, THE STANDARO OEVIAT!OH OF ~o
Sc • THE STAN!)AJOIO tiEVIATJOK OF Re
Ro,R:ç,So Sc<dB)
1 30
20
10
125 250 soo 1000 2000 4000
-----f (Hü
F'lG.5.1C THE lHF'LU(NCE OF' THE POSJTIOH OF THE LIGHTWEIGl-IT
WALL lH THE TEST l)Pt::HlHG OH [TS SOUHO REOUCTION
INDEX • MEAS\JRED lH LABORATORY C
Ro, WAlL AT OHE EHD Of THE TEST OPEHJHG
"------ • Re. WALL 1 ti !HE Cf.HTRE OF TH[ TEST C!PEHHtG
--·-·-- So, !HE STANOHRO DEVti\TIOH OF" Ro
Sc, TH( STAHOARO DE.VIATIOH Qt Re
Ro,Rc,So,Sc\dB)
1 tor--+----,-----~---+----4---~
125 zsn 500 1000 20{)(1 4000
----.;.. f (Hz-)
F'1q.S.!B THt tNFLU(HC( tJt THE POSlTlOH OF TH[: LJGHTWE!GHT
WALL lfi THE TEST OPEH1HG OH lTS SC•UHO REDUCTfOH
IHDEX, MEASUREO IH LABDRATORY B
Ro, WALL Ai ONE i::HO OF THE TE: ST OPOUHG
Re, II.IA.ll ltt THt: CEHTRE OF THE TEST GPI!:tHHG
'"-·-·----·- So, nu: SiAHOARO OEVJAflOH OF Ro
Sc. IHE STAHQARO DEVIAT!CH OF' Re
Ro ,ii:c .so,ScfdB>
1 ·30
20
125 250 soo 1000 2:000 4000
----.;;;.. f (Ht)
Ft.q.5.10 ThE lHFlUEHCE Of" TH( POSIT!OH Of fHE UGHTWEIGHT
WALL !H THE TEST OPEHING OH !TS SOUND R(DUCTIOH
tHDt:X, MEASU~LO lH LABORATDRY 0
Ro, WALL AT Ot-OE EHO OF' THE TEST OPEHIHC>
- Re:, WALL iH THE GEtHRE Of fHE TEST OPUHHO
---·-·-- So. THE STAHDAR() DEVlATfOK Of Ro
3<.:, THE 3Tt\HDARD VEV I AT1 OH ûf Re
-55-
i<o,Rc,So,Sc(dB) Ro,Rc,So.ScüHD
125 250 500 10{)0 2000 4000 125 250 500 1000 200\J 4000
----..;... f <Hz) ----..;o.. f <Hz>
Fiq.S.1E THE IHFLUE.:HCE OF TH€: POS1TIOH OF TH( LIGHTWE!OHT Fiq.5~1f THE HlflUEHCE OF THF. POSlTIOH OF THE LlGiHWEtûHT
WALL IN TtiE TEST OPEHIHG OH lTS SOUHD Rf.:DUCTlOti
tNDEX, MEASURtO IH LABOR:ATORY E
Ra. WALL AT OH( EHD Of THE TEST OPEHlNG
Re, WALL IH THE CEHTRE OF HU: TEST OPEHIHG
-·--·-·- So, THE STAHOARO DEVlAl'IOH Of ~o
Sc, THE STAHOARO D(V1AfiOH OF Fi'c
Ro,Rc.so.Sc{dBJ
WALL Ui TH( TEST OPEHIHG OM ITS SOUHO REOUCTlOH
!NOEX. MEASUREO EH LABORATDRY F
Ro, WALL AT GHE EHO OF THE TEST Of>EHiHG
--------- Re, WALL lh THt: CEtHRE OF' THE TEST OPfHiHG
·-·-·--- So. THE STAMCiARO OEVIATIOH Of Ro
Sc, THE STAHOI'IRO DEVIATJOH IJF Re
!0~-+----+----+----+----+--~
12S 250 son 1000 2000 4000
------ f (H%)
Ft<::j.5.1C THE IHtLUEHCE OF THE POSITIOH OF THE LlGHTWEJGHT
WALL lH THE TEST OPEHIHG OH tTS SOIJH!)' REDUCTtO~
IHDEX, MEASURED lH LABDRATORY H
Ro • WALL AT OHE EHO<AT ROOM 1l OF THE TEST OPEtHHV
Re. WALL tH THE CEHTRE OF THE TESl OPEHiHÇj
Ro. WALL Af THE OTHER END OF THE HST OPEHfMG
Sa, TM( STAHOARO DEVtATJOH Of' Ro\WflLl ~[AR ROOM 1)
Sc, THE STAHDARO OEVIATIOH OF' Re
THE STAHOARO DEVlAT10H Of Ro\WALL HEAR ROOM 2)
-56-
5.2.2. The effect of equal volumes of souree and receivinq room
In only two laboratorles the volumes of souree and receiving room are
equal i.e. laboratorles 1\ and F, although they have a different type of
symmetry.
To see if an effect of equal volumes is relevant measurements with rooms ;I
with unequal volumes should be carried out, for instanee by dimtnishing
the volume of one room with at least 10%. This has not been done in this
investigation.
1\nother way to disturb the perfect symmetry in laboratorles 1\ and F is to
move the object within the test opening. 1\s seen in §5.2.1 this may result
in a different sound reduction index which may be attributed to the niche
effect.
The effect of equal volumes can be demonstrated in scale models in which
niches can be avoided and the volumes can be made exactly equal. Michelsen
(ref.3.5) showed the effect by means of such scale models. Figure 5.2 pre
sents some results of our 1:4 scale model experiments showingalso clearly
a similar effect. The sound reduction index is increased when the perfect
symmetry is disturbed by reducing the volume of one of the rooms.
5.2.3. The effect of the measurinq direction
Theoretically (ref.3.11) the sound reduction index of an object mounted
between two transmission rooms with different volumes should be higher
when the small room is acting as the souree room.
The laboratorles B, C, 0, E, G and H have rooms with different volumes.
In all parts of the investigation sound insulation measurements have been
carried out in two measuring directions. The number of replicate measure·
ments for the two measuring directions is small for the lightweiglit wall
and the heavy wall (see tables 4.2a and 4.3). More tests have been perfor·
med on the middleweight wall for both measuring directions: in each labo··
ratory the sound reduction index of the middleweight wall has been deter··
mined 5 times for each direction. If there extsts an effect of the measu·
ring direction then this might be observed in the results of the measure·
ments on the middleweight wall. Table 5.1 presents the differences be
tween the average sound reduction index in one direction and the average
sound reduction index in the opposite direction as a function of frequen·
cy. The average has been taken over 5 single tests.
-57-
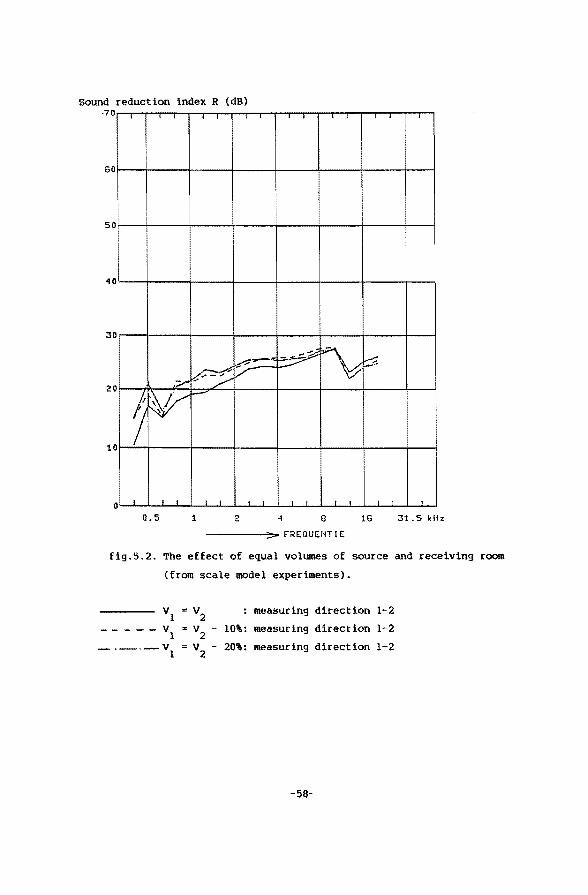
sound reduction index R (dB) ·70
I 60
50
4 0
0
1
k:';-·~ .~-" =~ ~ ~ r // v
0 p ~ r--
i ~· 0
0 0.5 1 4 8 16 31.5 kHz
------,.. FREQUEIH 1 E
fig.5.2. The effect of equal volumes of souree and receiving room
(from scale model experiments).
vl "' v2 measuring direction 1-2
--- vl =V 2
- 10\: measuring direction 1-2
-V 1
=V 2
20\: measuring direction 1-2
-58-
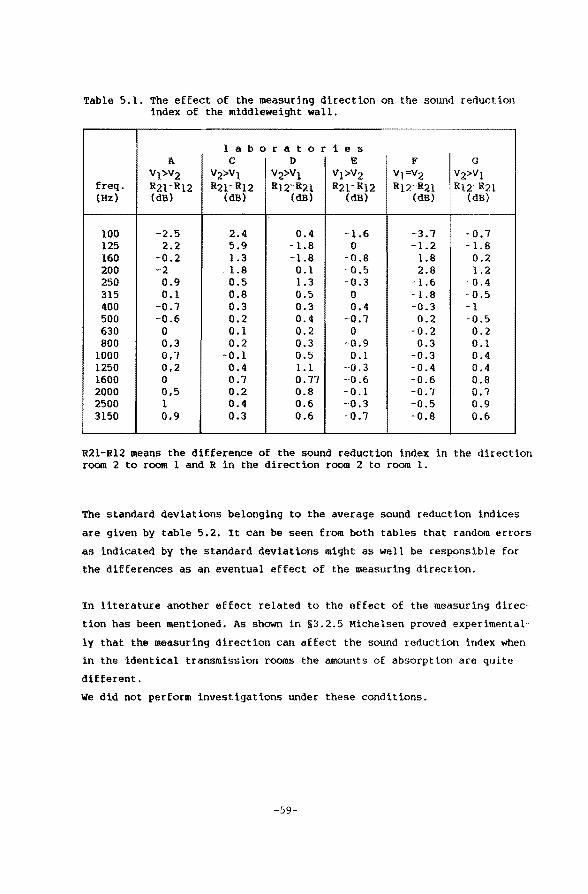
Table 5.1. The effect of the measuring direction on the sound reduction index of the middleweight wall.
1 a b o r a t o r i e s A c D E F G
V1>V2 V2>V1 V2>Vl Vl>V2 V1=V2 Vz>Vl freq. R21-R12 R21-R12 RJ2-R21 R21-R12 Rt7.-R21 R12·R21 (Hz) (dB) (dB) (dB) (dB) (dB) (dB)
100 -2.5 2.4 0.4 -1.6 -3.7 . 0 •. , 125 2.2 5.9 -1.8 0 -1.2 1.8 160 -0.2 1.3 -1.8 -0.8 1.8 0.2 200 -2 1.8 0.1 -0.5 2.8 1.2 250 0.9 0.5 1.3 -0.3 -1.6 . 0. 4 315 0.1 0.8 0.5 0 -1.8 0.5 400 -0.1 0.3 0.3 0.4 -0.3 - 1 500 -0.6 0.2 0.4 -0.1 0.2 -0.5 630 0 0.1 0.2 0 -0.2 0.2 800 0,3 0.2 0.3 --0.9 -0.3 0.1
1000 0,1 -0.1 0.5 0.1 -0.3 0.4 1250 0,2 0.4 1.1 -·0. 3 -0.4 0.4 1600 0 0.1 0.11 -0.6 -0.6 0.8 2000 0,5 0.2 0.8 0.1 -0.1 0.1 2500 1 0.4 0.6 -0.3 -0.5 0.9 3150 0,9 0.3 0.6 . 0.1 -0.8 0.6
R21-Rl2 means the diEferenee of the sound reduction index in the direction room 2 to room 1 and R in the direction room 2 to room 1.
The standard deviations be1onging to the average sound reduction indices
are given by tab1e 5.2. It can be seen from both tables that random errors
as indicated by the standard deviations might as we11 be responsible for
the diEferences as an eventual effect of the measuring direction.
In literature another effect related to the effect of the measuring direc·
tion has been mentioned. As shown in §3.2.5 Michelsen proved experimental
ly that the measuring direction can affect the sound reduction index when
in the identica1 transmission rooms the amounts of absorption are quite
different.
We did not perform investigations under these conditions.
-59-
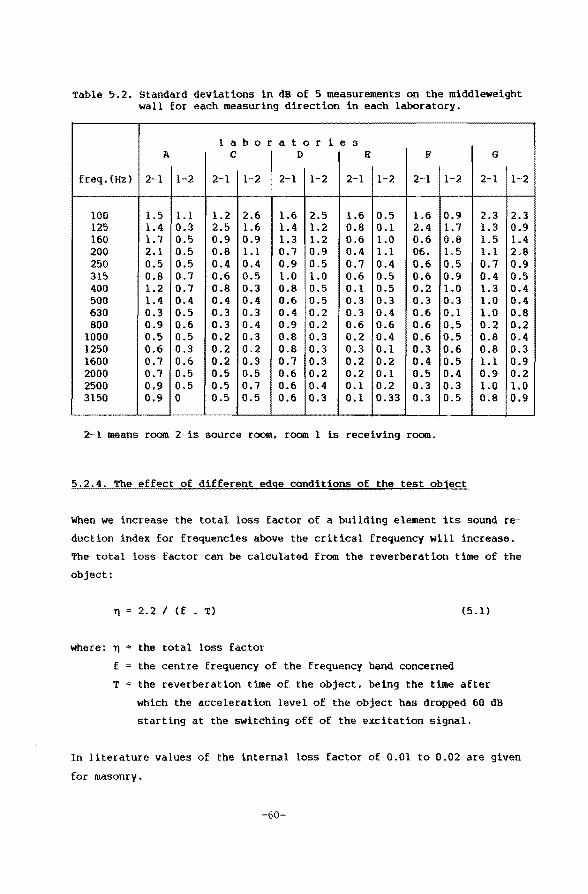
Table 5.2. Standard deviations in dB of 5 measurements on the middleweight wall for each measuring direction in each laboratory.
1 a b o r a t 0 r i e s A c D E F G
freq. (Hz) 2~ 1 1-2 2-1 1-2 2-1 1-2 2-1 1-2 2-1 1-2 2-1 1-2
100 1.5 1.1 1.2 2.6 1.6 2.5 1.6 0.5 1.6 0. 2.3 2.3 125 1.4 0.3 2.5 1.6 1.4 1.2 0.8 0.1 2.4 1. 1.3 0.9 160 1.7 0.5 0.9 0.9 1.3 1.2 0.6 1.0 0.6 0. 1.5 1.4 200 2.1 0.5 0.8 1.1 0.7 0.9 0.4 1.1 06. 1. 1.1 2.8 250 0.5 0.5 0.4 0.4 0.9 0.5 0.7 0.4 0.6 0. 0.7 0.9 315 0.8 0.7 0.6 0.5 1.0 1.0 0.6 0.5 0.6 0. 0.4 0.5 400 1.2 0.7 0.8 0.3 0.8 0.5 0.1 0.5 0.2 1. 1.3 0.4 500 1.4 0.4 0.4 0.4 0.6 0.5 0.3 0.3 0.3 0. 1.0 0.4 630 0.3 0.5 0.3 0.3 0.4 0.2 0.3 0.4 0.6 0. 1.0 0.8 800 0.9 0.6 0.3 0.4 0.9 0.2 0.6 0.6 0.6 0.5 0.2 0.2
1000 0.5 0.5 0.2 0.3 0.8 0.3 0.2 0.4 0.6 0.5 0.8 0.4 1250 0.6 0.3 0.2 0.2 0.8 0.3 0.3 0.1 0.3 0.6 0.8 0.3 1600 0.7 0.6 0.2 0.3 0.1 o. 0.2 0.2 0.4 0.5 1.1 0.9 2000 0.1 0.5 0.5 0.5 0.6 0. 0.2 0.1 0.5 0.4 0.9 0.2 2500 0.9 0.5 0.5 0.1 0.6 0. 0.1 0.2 0.3 0.3 1.0 1.0 3150 0.9 0 0.5 0.5 0.6 0. 0.1 0.33 0.3 0.5 0.8 0.9
2-1 means room 2 is souree room, room 1 is receiving room.
5.2.4. The effect of different edqe conditlans of the test object
When we increase the total loss factor of a building element its sound re
duction index for frequencies above the critical frequency will increase.
The tota1 1oss factor can be ca1culated from the reverberation time of the
object:
~ 2.2 I (f • T) (5.1)
where: ~ the total loss factor
f the centre frequency of the frequency band concerned
T the reverberation time of the object, being the time after
which the acceleration level of the object has dropped 60 dB
starting at the switching off of the excitation signal.
In literature va1ues of the internal loss factor of 0.01 to 0.02 are given
for masonry.
-60-
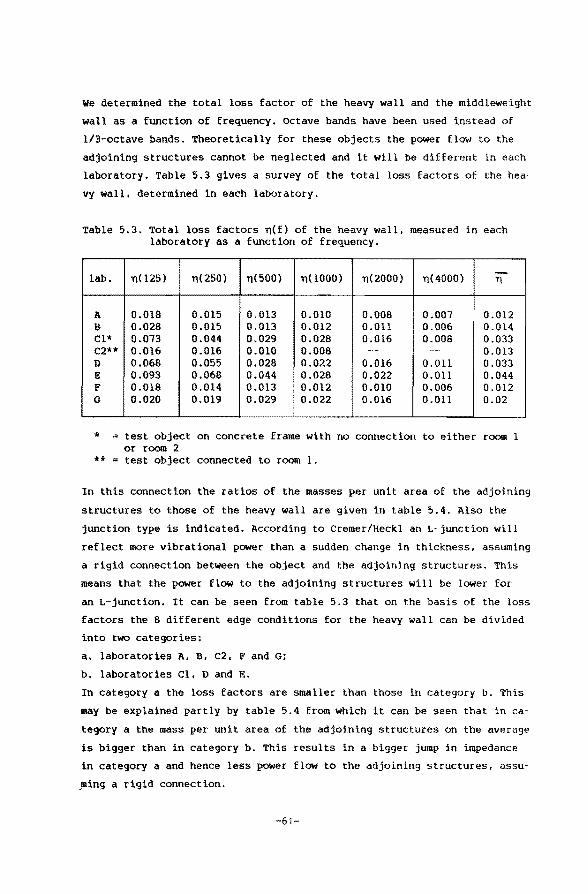
We determined the total loss factor of the heavy wall and the middleweight
wall as a function of Erequency. Octave bands have been used instead of
1/3-octave bands. Theoretically for these objects the power flow to the
adjoining structures cannot be neglected and it wi11 be different in each
laboratory. Table 5.3 gives a survey of the total 1oss factors of the hea·
vy wa1l. determined in each laboratory.
Table 5.3. Total loss factors n(f) of the heavy wall, measured in each laboratory as a function of frequency.
lab. n025) n(250) n(500) n(lOOO) n(2000) n(4ooo> -T]
A 0.018 0.015 0.013 0.010 0.008 0.007 0.012 B 0.028 0.015 0.013 0.012 0.011 0.006 0.014 Cl* 0.073 0.044 0.029 0.028 0.016 0.008 0.033 C2** 0.016 0.016 0.010 0.008 -- -- 0.013 D 0.068 0.055 0.028 0.022 0.016 0.011 0.033 E 0.093 0.068 0.044 0.028 0.022 O.Oll 0.044 F 0.018 0.014 0.013 0.012 0.010 0.006 0.012 G 0.020 0.019 0.029 0.022 0.016 0.011 0.02
* = test object on concrete frame with no conneetion to either room 1 or room 2
** = test object connected toroom 1.
In this conneetion the ratios of the masses per unit area of the adjoining
structures to those of the heavy wall are given in table 5.4. Also the
junction type is indicated. According to Cremer/Heckl an L·junction will
reflect more vibrational power than a sudden change in thickness, assuming
a rigid conneetion between the object and the adjoining structures. This
means that the power flow to the adjoining structures will be lower for
an L-junction. lt can be seen from table 5.3 that on the basis of the loss
factors the 8 different edge conditions for the heavy wall can be divided
into two categories:
a. laboratorles A, B, c2. F and G:
b. laboratorles Cl, D and E.
In category a the loss factors are smaller than those in category b. This
may be explained partly by table 5.4 Erom which it can be seen that in ca
tegory a the mass per unit area of the adjoining structures on the average
is bigger than in category b. This results in a bigger jump in impedance
in category a and hence less power flow to the adjoining structures, assu·
,ming a rigid connection.
-61
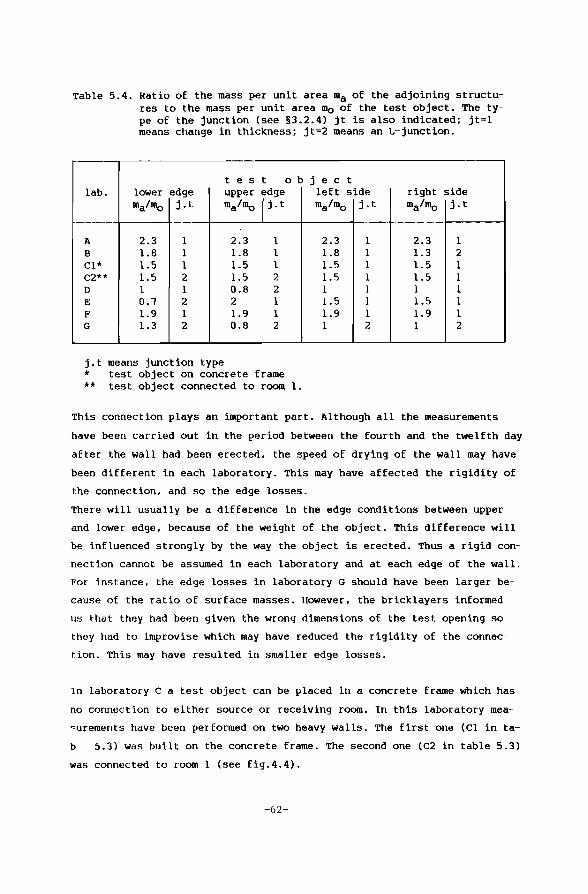
Table 5.4. Ratio of the mass per unit area ma of the adjoining structures to the mass per unit area mo of the test object. The type of the junction (see §3.2.4) jt is also indicated; jt;l means change in thickness: jt=2 means an L-junction.
t e s t 0 b j e c t lab. lower edge up per edge ·left side right si de
ma/mo j.t ma/mo j.t malmo j.t ma/mo j.t
A 2.3 1 2.3 1 2.3 1 2.3 1 B 1.8 1 1.8 1 1.8 l 1.3 2 Cl* 1.5 1 1.5 1 1.5 1 1.5 1 C2** 1.5 2 1.5 2 1.5 l 1.5 1 D l 1 0.8 2 l 1 1 1 E 0.1 2 2 1 1.5 1 1.5 1 F 1.9 1 1.9 1 1.9 1 1.9 1 G 1.3 2 0.8 2 1 2 1 2
j.t means junction type * test object on concrete frame ** test object connected to room 1.
This conneetion plays an important part. Although all the measurements
have been carried out in the period between the fourth and the twelfth day
after the wall had been erected, the speed of drying of the wall may have
been different in each laboratory. This may have affected the rigidity of
the connection. and so the edge losses.
There wi11 usually be a diEferenee in the edge conditions between upper
and lower edge, because of the weight of the object. This difference will
be influenced strongly by the way the object is erected. Thus a rigid con
neetion cannot be assumed in each laboratory and at each edge of the wall.
For instance, the edge losses in laboratory G should have been larger be
cause of the ratio of surface masses. However, the bricklayers informed
us that they had been given the wrong dimensions of the test opening so
they had to improvise which may have reduced the rigidity of the connec
tion. This may have resulted in smaller edge losses.
In laboratory c a test object can be placed in a concrete frame which has
no conneetion to either souree or receiving room. In this laboratory mea
~urements have been performed on two heavy walls. The first one (Cl in ta
b 5.3) was built on the concrete frame. The second one (C2 in table 5.3)
was connected to room 1 (see fig.4.4).
-62-
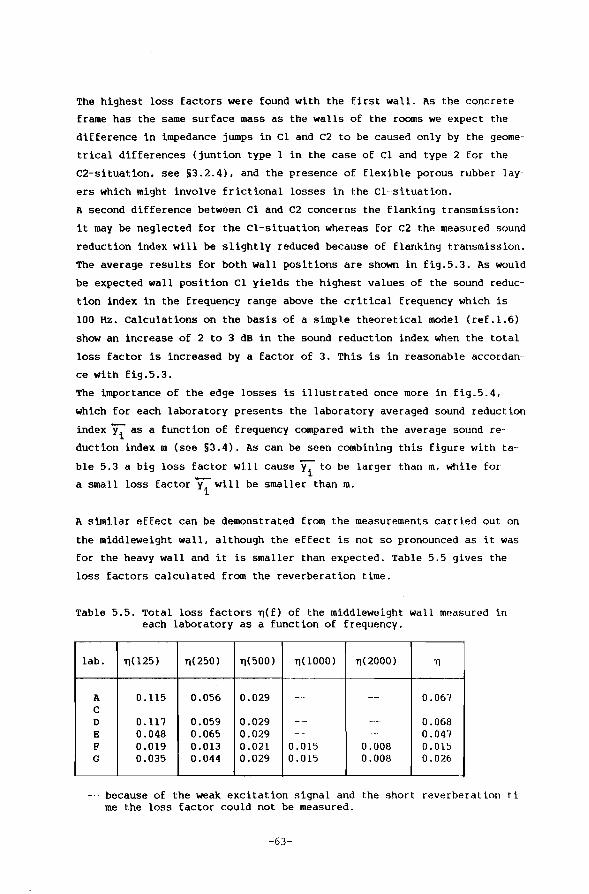
The highest loss factors were found with the first wall. As the concrete
frame has the same surface mass as the walls of the rooms we expect the
diEferenee in impedance jumps in Cl and C2 to be caused only by the geome~
trical diEferences (juntion type 1 in the case of Cl and type 2 Eor the
C2-situation, see §3.2.4), and the presence of flexible porous rubber lay
ers which might involve frictional losses in the Cl-situation.
A second diEferenee between Cl and C2 concerns the flanking transmission:
it may be neglected for the Cl-situation whereas for C2 the measured sound
reduction index will be slightly reduced because of flanking transmission.
The average results for both wall positions are shown in fig.5.3. As would
be expected wall position Cl yields the highest values of the sound reduc
tion index in the frequency range above the critical frequency which is
100 Hz. calculations on the basis of a simpl.e theoretical model (ref.l.6)
show an increase of 2 to 3 dB in the sound reduction index when the total
loss factor is increased by a factor of 3. Th is is in reasonab le accordan-·
ce with fig.5.3.
The importance of the edge losses is illustrated once more in fig.5.4,
which for each laboratory presents the laboratory averaged sound reduction
index yi as a function of frequency compared with the average sound re
duction index m (see §3.4). As can beseen combining this figure with ta
ble 5.3 a big loss factor will cause yi to be larger than m, while for
a small loss factor Y;:" will be smaller than m.
A similar effect can be demonstrated from the measurements carri.ed out on
the middleweight wall, although the effect is not so pronounced as it was
for the heavy wall and it is smaller than expected. Table 5.5 gives the
loss factors calculated from the reverberation time.
Table 5.5. Total loss factors TJ(f) of the middleweight wall measured in each laboratory as a function of frequency.
lab.
A c D E F G
T)(l25) T)(250) T)(500) TJ(lOOO) T)(2000) TJ
0.115 0.056 0.029 -- -- 0.06-/
0.117 0.059 0.029 -- -·- 0.068 0.048 0.065 0.029 -- -- 0.047 0.019 0.013 0.021 0.015 0.008 0.015 0.035 0.044 0.029 0.015 0.008 0.026
because of the weak excitation signa1 and the short reverberation ti me the loss factor cou1d not be measured.
-63-
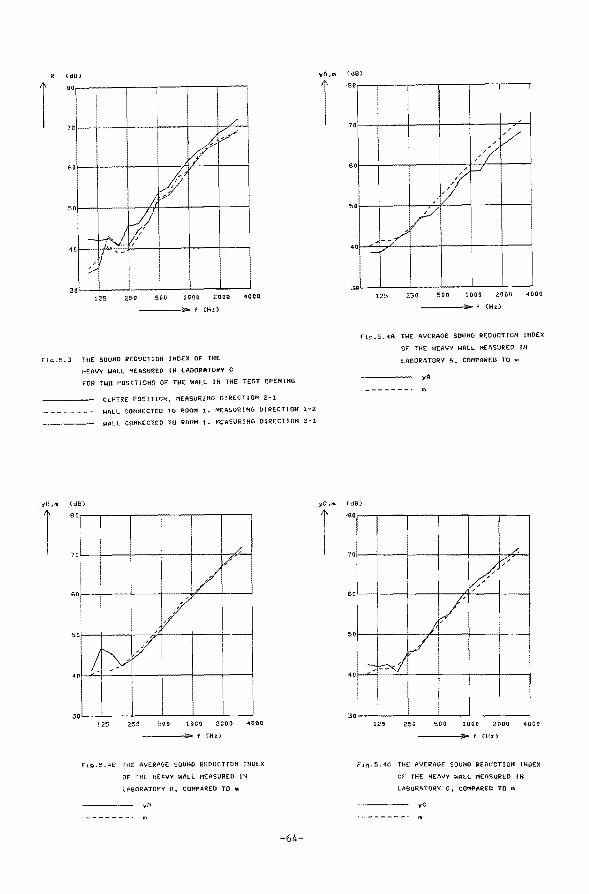
1 <dBJ
8 0
0
0
0
0
3 0
I
• /
11 v.f rv·"' //
vP /, f."/
-rtJ. ~ li,' 1/ '~
;; I
125 250 500 1000 2000 4000
----?>of (Hz)
Fiq.5.3 THE SOUHO REOUCT10H JHOEX OF THE
HEAVY WALL MEASURED 1 H LABORATORV C
yB,m
1
FOR TWO POStTJOHS OF TKE WAtt lH THE TEST OPEI'HMG
CENiRE P05!Tl0N, MEASURlNG OIRECTtOH 2·1
WALL CO}tHECTED TO ROOM 1, MEASURUtO OlRECTlON 1-2
WALL CONHECTE:O TOROOM 1. MEASURlHG DIRECTJON 2~1
(dB)
.ao
70
60
50
125 250 soo 100\i 2000 41HHf
----?>- f (Hzl
fq~.5.4B Tt4E AVERAGE SOUttO REDUCTtOti fHDEX
Of THE HËAVY WAll MEASUREO i H
LABORAIORV 8 • COMPAREO TO m
y8
-64-
yA,m
I (dB)
·80
70
GO
50
40
3ol-~-----L-----L----J-----L---~ 125 250 500 1GOO 2000 4000
----?>of <Hz>
Fig~S. 4A THE AVERAGE SOUHO REOUCTIOH IHOEX
OF THE HEAVV WAll MEASURED lH
LABORATORV A. COMPAREO TO m
yA
yC ,m (dB}
125 250 500 1000 2000 ~000
----..;..1 (Hzl
Fiq.S.4C THE AVERAGE SOUHI) REDUCTIOH IHOEX
OF THE HEAVY WAll MEASUR(O lH
LABORATORV C ~ COMPARED TD m
yC
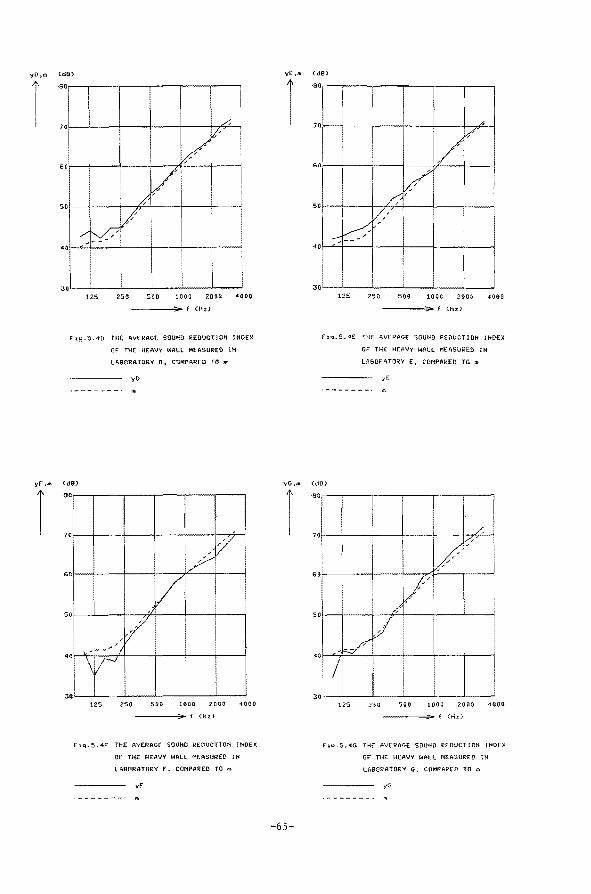
yO,m
yf ,m
r
(dB)
.g
5
0
0 ~
I
I I "' I / • y:i
I
• / 0 /
•
0 125 250 5€!0 1000 2000 4000
----.;;,..1 Ohl
Ft~. 5. 40 THE AVERAVE SOUHO REOUCTJ(nt lHOEX
OF THE HEAVY WAll MEASUREll lH
lABORATQRY 0, COMPAREO TO m
yO
0
0 '
I ~. / ;/ 0 i/
I /1 I 0 /
! ,,V I
I
---- I o: r 3 0 I I
125 250 soo 1000 2000 1000
----.;;.o.f (Hz)
F1q.5.4F THE AVERAGE SOUND REOUCTlOti UiDEX
OF Tl-iE HEAVY WALL 1'1EASUREO IH
lABORATORY F 1 COMPARED TO m
yF
-65-
(dB)
-ao,--,-----r-----r----~---,----,
3QL-~----~-----L---~----L---~
125 250 500 1000 :200û 40!JO
----.;;.o.f (Hz)
tlq.$, 4E iHE .A;VERAGE SOUHO Rt:ûUCTJOH lHOt:X
OF THE HEAVY WAll P'!EASURED J H
LABDRATORY E, COMPAREO TO m
(d8)
-80
I /-I
I V ~
0
V'~
70
0 . / i _y I
0 •• I I
I
3 o'
/I ~
125 2.50 500 1000 2000 4000
-----;;o.f CHz)
f\q.S.-tG TH( AVERAGE SOUf'iO REDUCTlO!i [HDEX
OF THE HEAVY WAll f'I[ASUREO tH
LABORATO~V G, COMPAREO TO tn
yG
For each laboratory the average sound reduction index yi is compared with the average sound reduction index m in fig.5.5. The correlation bet
ween the value of the loss factor and the test results is not as satisfac
tory as for the heavy wall. In laboratory A the average sound reduction
index yt i.s lying 2 dB below the values of m for frequencies above 200
Hz, the critica! frequency, although a big loss factor was measured. For
the other laboratorles the diEferences between~and mare smaller than
expected from the loss factors.
5.2.5. Conclusions of §5.2
The results of airborne sound insulation measurements in laboratorles in
Belgium and The Netherlands may be affected by the properties of the labo
ratories. The biggest effects are:
1. the niche effect;
2. the effect of different edge conditions.
ad.l. For the lightweight wall used in the investigation the measured
sound reduction index depends to a high extent on the position of
the wall in the test opening. This effect was demonstrated in the
frequency region below 500 Hz, the lowest critica! frequency of the
wall. In this frequency region the lowest values of the sound reduc
tion index are obtained when the wall is placed in the centre posi
tion. By moving the wall away from the centre position to one end of
the test opening variations on the sound reduction index up to 10 dB
have been measured.
ad.2. As mentioned before, different edge conditions cause different edge
losses. For both the heavy wall and the middleweight wall different
edge losses, i.e. flow of vibrational energy Erom the test object to
the adjoining structures, could be expected theoretically from one
laboratory to another. We measured diEferences in the sound reduc
tion indices as big as 4 dB for frequencies at and above the criti
cal frequency of the objects. A correlation has been found between
the measured values of the loss factors and the sound reduction in
dices in accordance with theory.
-66-
To reduce these effects, some recommendations are given:
* The position of the test object should be prescribed in international
standards: more precisely, the ratio of the depths of the niches on both
sides of the wall should differ from 1. For glazing, this ratio has al
ready been standardized to a value of l :2. The higher the critical fre
quency of the test object, the more important this standardization is.
* Both shape and mass of the test opening should be standardized in future
requirements in order to normalize the edge losses, i.e. the ener~ flow
from the test object to the adjoining structures. For new transmission
suites the effect of different edge conditions should be reduced in this
way. For existing transmission suites it might be considered to correct
the test results for instanee normalize them to a standard loss factor.
-67-
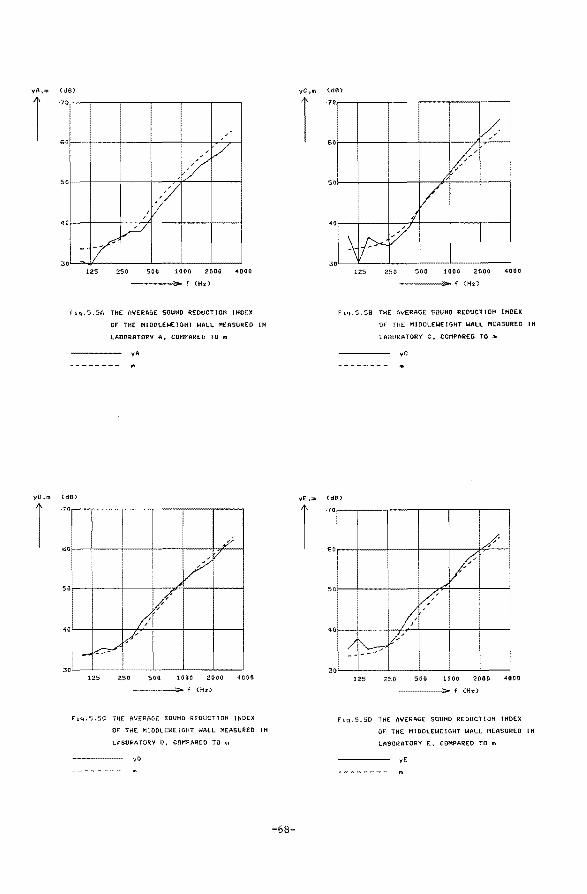
yA,m (dG)
·7 0
I '
5
/ ó
V //
0
"V 0 vu I -171
0 125 250 500 1(JOO 2000 40<10
-----f CH2l
f1q.S.SA THE AVERAGE SOUMO REOUCTJOH IHOEX
OF THE MtOOLEWE!GHT WALL MËA$URED [H
lABDf~ATORV A • COMPAREO TO m
yA
yO,m CdS)
·70
60 /
VI 50
V <O /
.,/'
-~ o'
125 250 500 1000 2000 4000-
----.;;...f <Hz)
Flq.5.5C THE AVERA&Ë SOUHO RE:OUCTION HWEX
OF THE MlDOLE:WEIGHT WALL MEASUiêEO IH
LABORATORV 0 • COMPARtO tO m
vD
-68-
yC.m
1 (d9)
·70
60
50
40
125 250 SQO 1000 2000 4000
----..;.o.f tH2l
Fi.q.5.58 THE AVERAVE SOUHO REOUCTiOH INDEX
OF THE MJDOLEWElGHT WALL MEASURED lH
LABDRATORY C ~ COMPAREO TO "*
yC
yE ,m <dB)
125 256 500 1000 2000 40(10
-----'>f (Hz)
Ftq.5.SD THE: AVERAGE SOUHD REOUCTIOH IHOEJ<
OF THE MIOOLEWLIGHT WALL MEASUREO lH
LASORA10RV E. COMPAREO TO m
yE
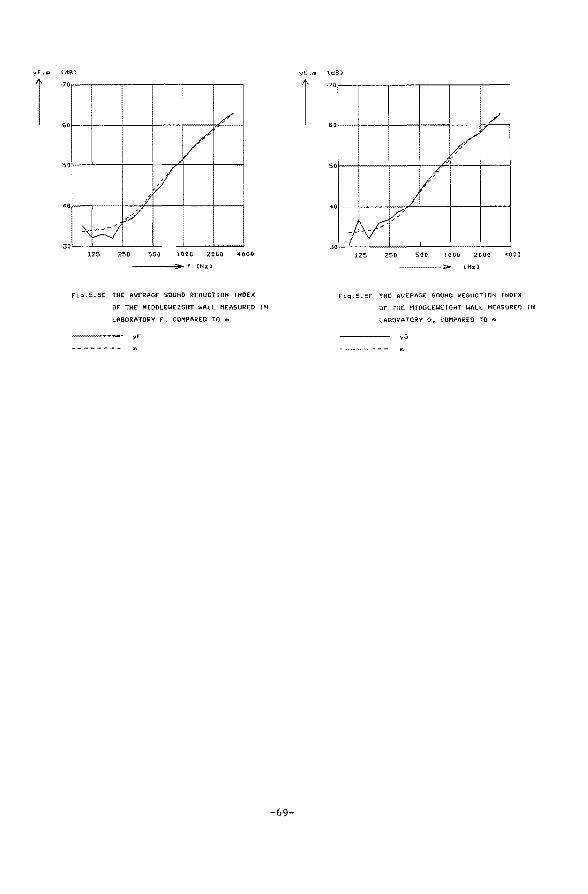
yF ,m (dB:l
·70....---,---,---,----,---
!25 250 500 1000 2000 4000
----..;;p.f (Hz)
ftq.S.SE THE AVERAGE SOUHD REOUCiiOH ltfDEX
Of THE MtOOLEWElGHT "WALL MtASUREO Hl
LABDRATORY F, COMPARED TO m
yF
yG,.m
-69-
(dBl
·7 0
I / 0 G
/i 5 0 "
/ 0 I
?
i -;V 0 3
125 250 500 1000 2000 4000
(Hz)
f1q.S.SF' THE AVERAGE SOOHO ii!EOUCTtOH !HOEX
Of TH( M100LEWEIGHT WALL MEASUREO lH
LABORATORV V • COMPAR:EO TO m
vv
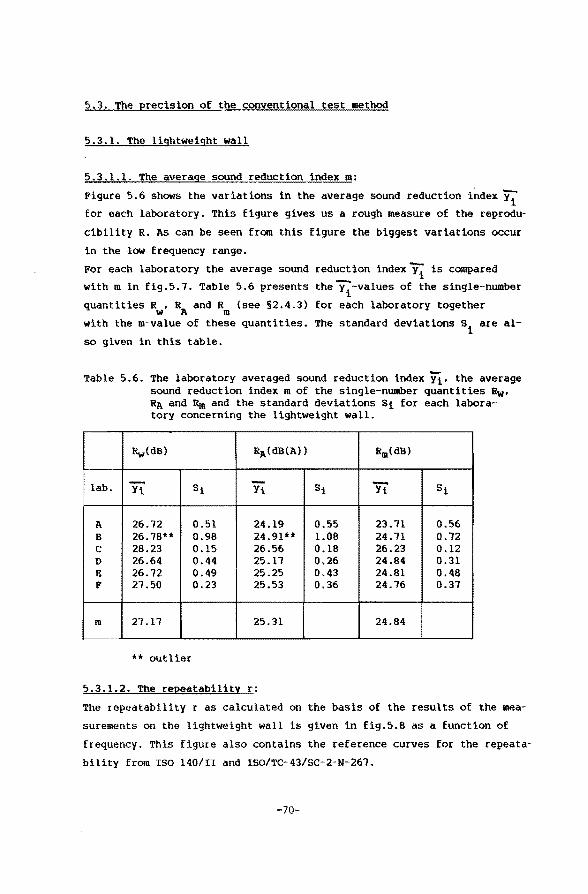
5.3. The precision of the conventional test method
5.3.1. The lightweight wall
5.3.1.1. The average sound reduction index m:
Figure 5.6 shows the variations in the average sound reduction index yt for each laboratory. This figure gives us a rough measure of the reprodu
cibility R. As can be seen from this figure the biggest variations occur
in the low frequency range.
For each laboratory the average sound
with min fig.5.7. Table 5.6 presents
quantities R , R and R (see §2.4.3) w A m
reduct ion index Y:t is compared
the~-values of the single-number
for each laboratory together
with the m~value of these quantities. The standard deviations si are al-
so given in this table.
Table 5.6. The laboratory averaged sound reduction index Yl• the average sound reduction index m of the single-number quantities Rw• RA and Rm and the standard deviations Si for each laboratory concerning the 1ightweight wal1.
Rw{dB) RA {dB(A)) Rro(dB)
lab. - - St -Yi si Yi Yi St
A 26.12 0.51 24.19 0.55 23.11 0.56 B 26.18** 0.98 24.91** 1.08 24.11 0.12 c 28.23 0.15 26.56 0.18 26.23 0.12 D 26.64 0.44 25.11 0.26 24.84 0.31 E 26.12 0.49 25.25 0.43 24.81 0.46 F 21.50 0.23 25.53 0.36 24.76 0.37
m 21.11 25.31 24.64
** outlier
5.3.1.2. The repeatability r:
The repeatability r as calculated on the basis of the results of the mea
surements on the lightweight wall is given in fig.5.6 as a function of
frequency. This figure also contains the reference curves for the repeata
bility Erom ISO 140/II and lSO/TC-43/SC-2-N-261.
-70-
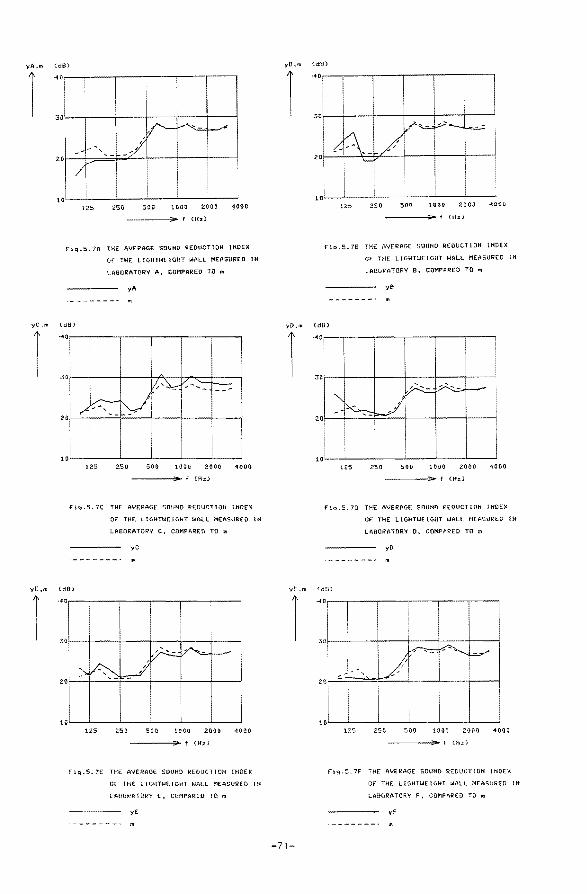
yA,m CdB)
1
yC,m
1
yE,m
1
125 250 500 1{i00 2000 4000
-----""'" f (Hz)
Fiq.5. 7A THE AVERAGE SOUND fi:Et>OCTJOH IHOEX
(dB)
125
Of THE LlOHTWE1CiHT WALL MEASUREO IN
LABDRATORY A, COMPARED fO m
yA
250 500 1001J 2000: ~000.
----- f (H;t)
Flq.S. 7C THE AVERAGE SOUND ~EDUCT JOH UiDEX
(d9) ,.,
30
ZIJ i
125
Of THE L tGHTWE tGHT WAll M(ASUREO lli
LABORATORV C, COMPAREO TO 11t
yC
250 500 1000 2000 4000
____ _,... f <Hzl
flq.5.1E THE AVCRAGE SOUHD REOUC110N IHOEX
Of THE L iGHTt<IEIGHT WALL MEASUREO Ui
LABORATDRY E, COMPARED TO m
yE
y8 ,m (d9)
1
1
yf .m
-71
125 250 500 UlOO 2000 40CO
----.;..f {Hz)
Fiq.5.78 TH( AVERAGE SOU«O REOUCT10-H IHOEX
OF THE LtGHT!i!E!GHT WALL 1'1EASUREO !N.
LABQj;>ATO:RY B ~ COMPARf:D TO m
y9
(dB)
<40,----.---,----.-----.---r-----,
10~1 -~--L--~--~---L-~ 125 250 '500 liHiO 2000 4000
----.;..f (Hz)
f"1q.5. 70 THE AVERAGE SOUND REOUCTIOH lHOE)(
Of THE L H1HTWE lGHT WALL M(ASURED U+
LABORATORY O. COMPARED TO m
yO
~dB}
·40,---.,--------~--~--~
125 250 500 1000 2000 4000
----.;..f (Hzl
rt~.5. 7F THE AVERAGE SOUHO R:t:DUCT!OH lHOEX
Of TH( llGHTWElGHT WAll MEASUREO [lt
LAeORATORV F • COMPAl?ED TO m
yf
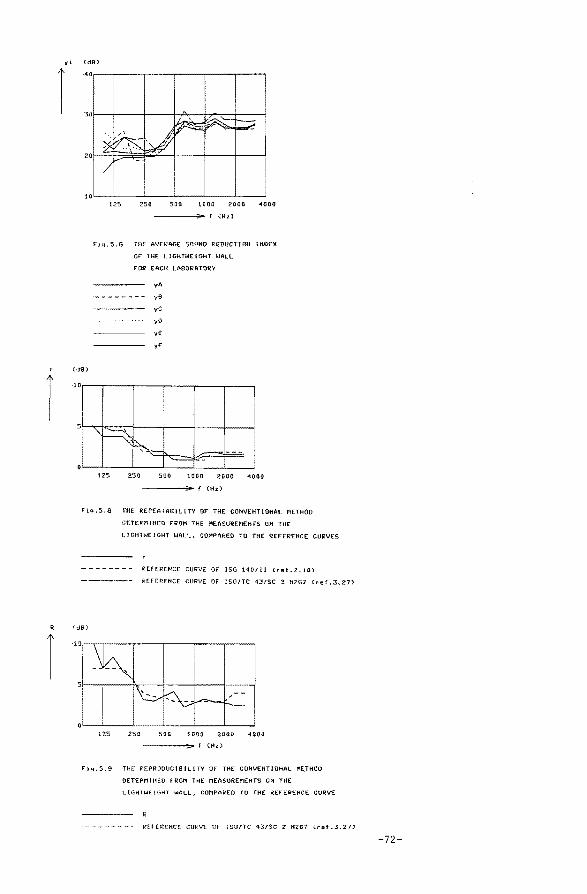
r !dB)
·40,-------~,---~~--~----~----~
toL-~----~----~--~----J_--~
(d9}
125 250 500 1000 2000 4000
-------- f (Hz)
fiH.S.S THE AVERAGE SOUHO REDUCTlOH HiOEX
OF THE llGHTW'EIGHT WALL
FOR EACH LABDRATORY
yA
y9
-·-·~-·- vC
250
yO
yE
yF
500 1000 2000 4000
-------- f (Hz)
F'l.q.S.S fHE REPEATABILITY Of THE CONVEHTIOHAL METHOD
OETERMlHE:D fROM YHE MEASUREMEHTS OH THE
Ll GHTWEl GHT WALL. COMPAREO TO THE REFEREHCE CURVES
RErf::REHCE CURVE OF ISO 140111 {ref.2.1G}
-·-·-·-·- REFER:'ENCE CURVE OF ISO/TC 43/SC 2 H267 Cr~f. 3. 27)
(dB}
125 2.50 500 100fJ 2:000 4000
--------> f CH, l
Flq.5.9 THE PEPROOUCtBILITY OF THE" COHVEHTIOHAL -ME,THOO
OETERM1HtD FROM THE MEASUREMEHTS OH TH(
L tGHTW( l GHT WALL, COMPAREO YO THE RE:fEREHCE CURVE
REH::kEHCE CURVE üf ISO/TC 43/SC 2 HZ67 {ref .3.27)
-72-
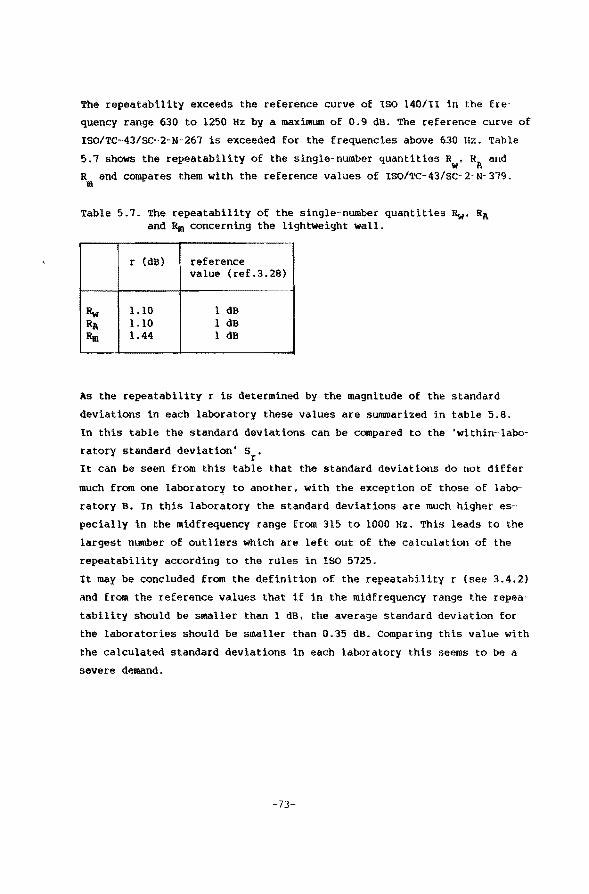
The repeatability exceeds the reEerenee curve of lSO 140/11 in the fre
quency range 630 to 1250 Hz by a maximum of 0.9 dB. The reEerenee curve of
ISO/TC-43/sc-2-N-261 is exceeded for the frequencies above 630 Hz. Table
5.7 shows the repeatability of the single-number quantities Rw' RA and
R and compares them with the reference values of ISO/TC-43/SC-2-N-319. m
Table 5.7. The repeatability of the single-number quantities Rw• RA and Rm concerning the lightweight wall.
r (dB) reference value (ref.3.28)
Rw 1.10 1 dB RA 1.10 1 dB Rm 1.44 1 dB
As the repeatability r is determined by the magnitude of the standard
deviations in each laboratory these values are summarized in table 5.8.
In this table the standard deviations can be compared to the 'within-labo
ratory standard deviation' Sr.
It can be seen from this table that the standard deviations do not differ
much from one laboratory to another, with the exception of those of labor
ratory B. In this laboratory the standard deviations are much higher es-
pecially in the midfrequency range from 315 to 1000 Hz. This leads to the
largest number of Outliers which are left out of the calculation of the
repeatability according to the rules in ISO 5125.
It may be concluded Erom the definition of the repeatability r (see 3.4.2)
and from the reference values that if in the midfrequency range the repea
tability should be smaller than 1 dB, the average standard deviation for
the laboratorles should be smaller than 0.35 dB. Comparing this value with
the calculated standard deviations in each laboratory this seems to be a
severe demand.
-73-
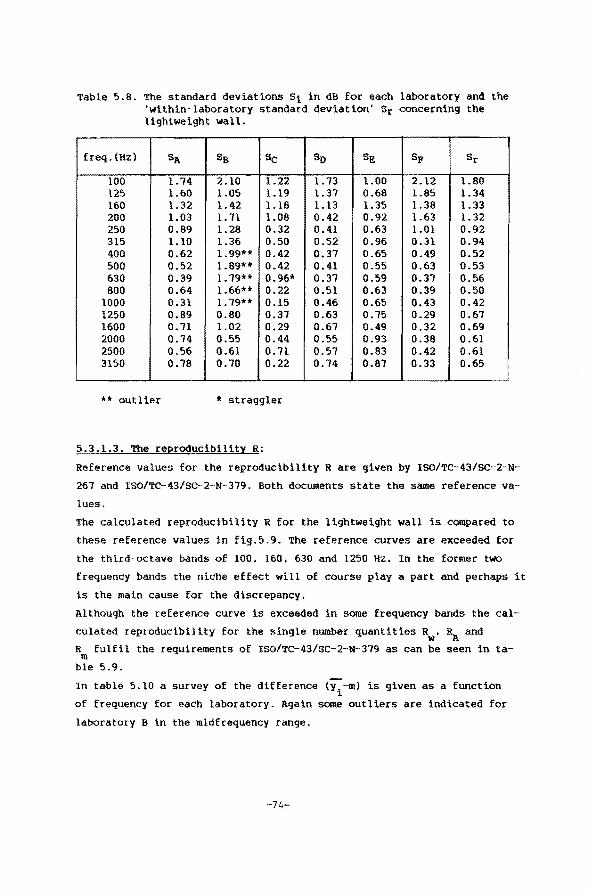
Table 5.8. The standard deviations St in dB for each 1aboratory and the 'within-laboratory standard deviation' Sr concerning the lightweight wall.
Ereq. (Hz) SA ss Sc so Sg SF Sr
100 1.14 2.10 1.22 l. 13 1.00 2.12 1.80 125 1.60 1.05 1.19 1.31 0.68 1.85 1.34 160 1.32 1.42 1.18 1.13 1.35 1.38 1.33 200 1.03 1.11 1.08 0.42 0.92 1.63 1.32 250 0.89 1.28 0.32 0.41 0.63 1.01 0.92 315 1.10 1.36 0.50 0.52 0.96 0.31 0.94 400 0.62 1.99** 0.42 0.31 0.65 0.49 0.52 500 0.52 1.89** 0.42 0.41 0.55 0.63 0.53 630 0.39 l. 19** 0.96* 0.37 0.59 0.37 0.56 800 0.64 1.66** 0.22 0.51 0.63 0.39 0.50
1000 0.31 1. 79* * 0.15 0.46 0.65 0.43 0.42 1250 0.89 0.80 0.37 0.63 0.75 0.29 0.67 1600 0.11 1.02 0.29 0.67 0.49 0.32 0.69 2000 0.14 0.55 0.44 0.55 0.93 0.38 0.61 2500 0.56 0.61 0.11 0.51 0.83 0.42 0.61 3150 0.78 0.70 0.22 0.14 0.87 0.33 0.65
** outlier * straggler
5.3.1.3. The reproducibi1itY R:
ReEerenee values for the reproducibility R are given by ISO/TC-43/SC-2-N-
267 and ISO/TC-43/SC-2-N-379. Both documents state the same reEerenee va
lues.
The calcu1ated reproducibi1ity R for the lightweight wa11 is compared to
these reEerenee values in fig.5.9. The reference curves are exceeded Eor
the third-octave bands of 100, 160, 630 and 1250 Hz. In the former two
frequency bands the niche effect wi11 of course play a part and perhaps it
is the main cause for the discrepancy.
Although the reEerenee curve is exceeded in some frequency bands the ca1-
culated reproducibility for the single-number quantities Rw' RA and
R fulfil the requirements of ISO/TC-43/sc-2-N-379 as can be seen in ta-m
ble 5.9.
In table 5.10 a survey of the diEferenee {y1
--m) is given as a function
of frequency for each laboratory. Again some outliers are indicated for
laboratory B in the midfrequency range.
-74-
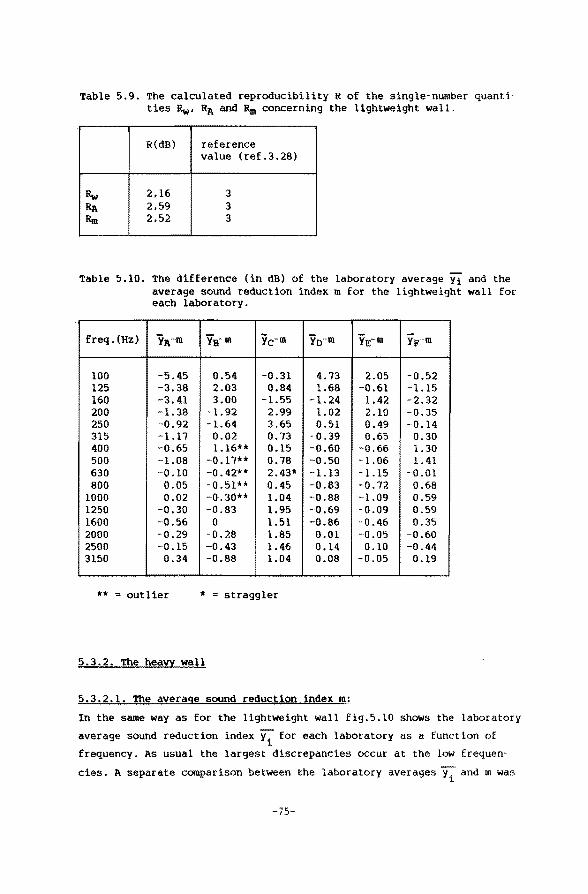
Table 5.9. The calculated reproducibility R of the single-number quanti ties Rw• RA and Rm concerning the lightweight wall.
R{dB) reference va1ue {ref.3.28)
Rw 2,16 3 RA 2,59 3 Rm 2,52 3
Table 5.10. The difference {in dB) of the laboratory average Yi and the average sound reduction index m for the lightweight wall for each 1aboratory.
freq. (Hz) Yc-m 'Yo-m YE-m YF-m
100 -5.45 0.54 -0.31 4.73 2.05 -0.52 125 -3.38 2.03 0.84 1.68 -0.61 -1.15 160 -3.41 3.00 -1.55 1.24 1.42 -2.32 200 -1.38 -1.92 2.99 1.02 2.10 -0.35 250 -0.92 -1.64 3.65 0.51 0.49 -0.14 315 -1.17 0.02 0.73 -0.39 0.65 0.30 400 -0.65 1.16** 0.15 -0.60 -0.66 1.30 500 -1.08 -0.17** 0.78 -0.50 1.06 1.41 630 -0.10 -0.42** 2.43* -1.13 -1.15 -0.01 800 0.05 -0.51H 0.45 -0.83 -·0.72 0.68
1000 0.02 -0.30** 1.04 -0.88 1.09 0.59 1250 -0.30 -0.83 1.95 -0.69 0.09 0.59 1600 -0.56 0 1.51 -0.86 -0.46 0.35 2000 -0.29 -0./.8 1.85 0.01 -0.05 -0.60 2500 -0.15 -0.43 1.46 0.14 0.10 -0.44 3150 0.34 -0.88 1.04 0.08 -0.05 0.19
** "' outlier * = straggler
5.3.2. The heavy wa1l
5.3.2.1. The average sound reductiOQ index m:
In the same way as for the lightweight wa11 fig.5.10 shows the laboratory
average sound reduction index yi for each laboratory as a function of
frequency. As usual the largest discrepancies occur at the low frequen·
cies. A separate comparison between the laboratory averages and m was
-75-
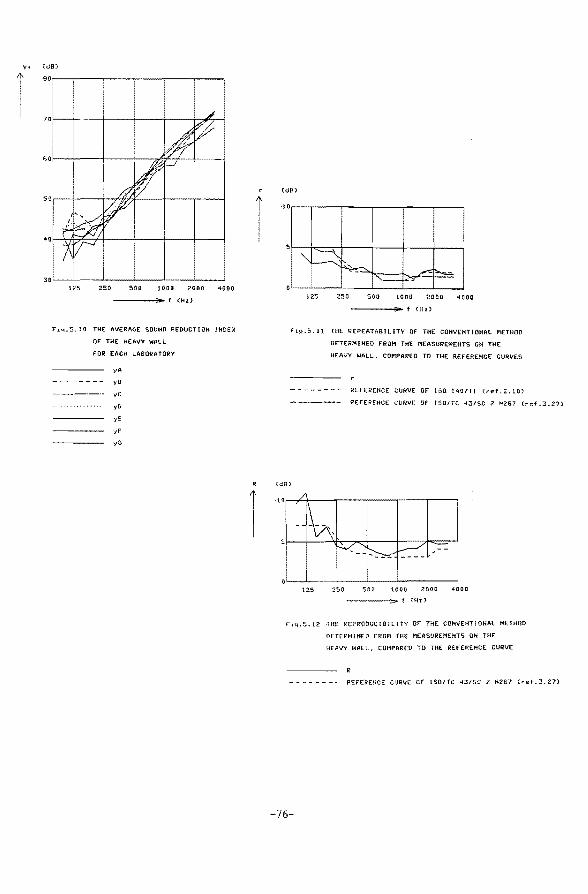
Y•
I (d9)
BO
60
so
40
125 250 1000 2000 4000
----..;.. f (Hz)
f'J.q.5.10 THE AVERAGE SOUHO P.EDUCTIOH IHOEX
OF TJiE HEAVY WALL
FOR EACH LABORAiORV
yA
-~~----- yS
--·-·-·- vC
y()
yE
yF
y(j
I
1
(dB>
·10
125 250 500 1000 20011 4DOO
----..;.. f (Hz)
Fiq.S.U THE REPEATASit ITV Of THE COHVEHT!OHAl METHOO
OETtRMitfEO FROM THE MEASUREMEttTS OH THE
HEAVY WALL • COMPAREO TO THE REH:REHCE CURVES
i<Ef(KENCE CURVE OF ISO 140/li (ref.Z.UD
-·---·- REFERENCE CURVE OF ISO/TC 43/SC 2 H267 (r~f.3.27)
(d9)
·I o.--,.L;\-----,----,---..,---,----,
125 250 500 1000 2000 4000
----- f (f")
Fiq.S.12 ·THE REPROOUCtBtliTY OF THE COHVEHTtQNAl METHOO
OETERMtNED FROM rtHt MEASUREMEHTS OH nu: HEAVY WAlL, COMPAREO TO THE REFEREHCE CURVE
REFEREHCE CURVE Of' ISO/TC 43/SC 2 fi267 (ref.3.27)
-76-
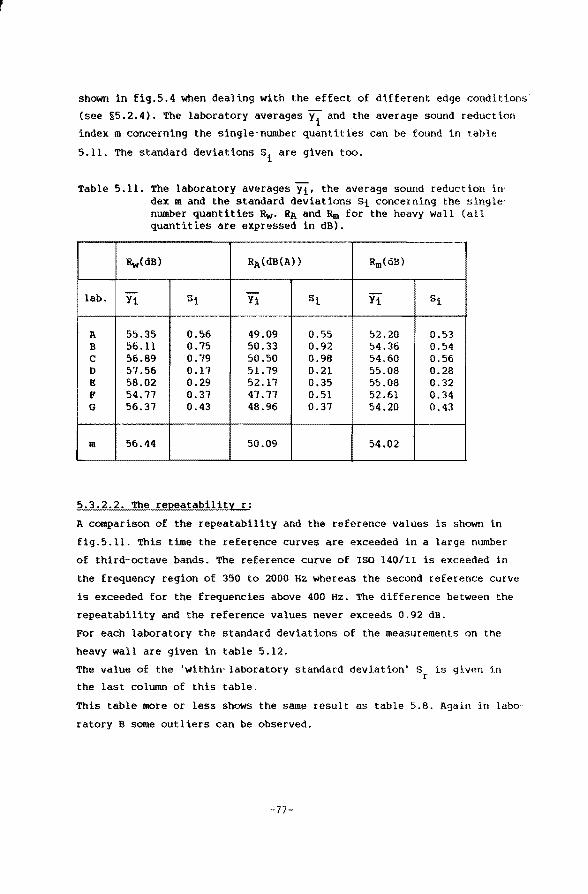
shown in fig.5.4 when dealing with the effect of different edge conditions
(see §5.2.4). The laboratory averages yi and the average sound reduction
index m concerning the single-numbet· quantities can be found in table
5.11. The standard deviations Si are given too.
Table 5.11. The laboratory averages Yi• the average sound reduction in· dex m and the standard deviations Si concerning the single· number quantities Rw· RA and Rm for the heavy wall {all quantities are expressed in dB).
Rw(dB) RA (dB(A)) Rm(dB)
lab. - si - si Yi Yi Yi si
A 55.35 0.56 49.09 0.55 52.20 0.53 B 56.11 0.75 50.33 0.92 54.36 0.54 c 56.89 0.79 50.50 0.98 54.60 0.56 D 57.56 0.17 51.79 0.21 55.08 0.28 E 58.02 0.29 52.17 0.35 55.08 0.32 F 54.77 0.37 47.77 0.51 52.61 0.34 G 56.37 0.43 48.96 0.37 54.20 0.43
m 56.44 50.09 54.02
5.3.2.2. The repeatability r:
A comparison of the repeatabi1ity and the reference values is shown in
fig.S.ll. This time the reference curves are exceeded in a large number
of third-octave bands. The reference curve of lSO 140/11 is exceeded in
the frequency region of 350 to 2000 Hz whereas the second reEerenee curve
is exceeded for the frequencies above 400 Hz. The diEferenee between the
repeatability and the reference va1ues never exceeds 0.92 dB.
For each laboratory the standard deviations of the measurements on the
heavy wall are given in table 5.12.
The value of the 'within-laboratory standard deviation' Sr is qlven in
the last column of this table.
This table more or less shows the saml:! result as table 5.8. Again in labo·
ratory B some outliers can be observed.
-77-
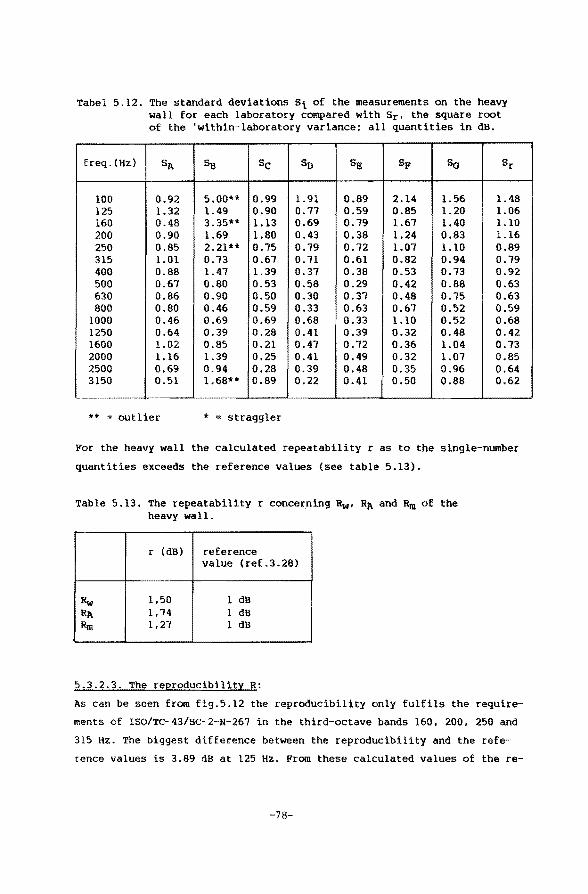
Tabel 5.12. The standard deviations St of the measurements on the heavy wall for each 1aboratory compared with Sr, the square root of the 'within-1aboratory variance: all quantities in dB.
Ereq. (Hz} SA SB se sn SE SF % Sr
100 0.92 5.00** 0.99 1.9l 0.89 2.14 1.56 1.48 125 1.32 1.49 0.90 O.T7 0.59 0.85 1.20 1.06 160 0.48 3.35** 1.13 0.69 0.19 1.61 1.40 1.10 200 0.90 1.69 1.80 0.43 0.38 1.24 0.83 1.16 250 0.85 2.21** 0.15 0.19 0.12 1.01 1.10 0.89 315 1.01 0.13 0.61 0.11 0.61 0.82 0.94 0.19 400 0.88 1.41 1.39 0.31 0.38 0.53 0.13 0.92 500 0.61 0.80 0.53 0.58 0.29 0.42 0.88 0.63 630 0.86 0.90 0.50 0.30 0.31 0.48 0.15 0.63 800 0.80 0.46 0.59 0.33 0.63 0.61 0.52 0.59
1000 0.46 0.69 0.69 0.68 0.33 1.10 0.52 0.68 1250 0.64 0.39 0.28 0.41 0.39 0.32 0.48 0.42 1600 1.02 0.85 0.21 0.41 0.12 0.36 1.04 0.13 2000 1.16 1.39 0.25 0.41 0.49 0.32 1.01 0.85 2500 0.69 0.94 0.28 0.39 0.48 0.35 0.96 0.64 3150 0.51 1.68** 0.89 0.22 0.41 0.50 0.88 0.62
** outlier * = straggler
For the heavy wall the calculated repeatability r as to the single-number
quantities exceeds the reEerenee values (see table 5.13).
Tab1e 5.13. The repeatability r concerning Rw• RA and Rm of the heavy wall.
r (dB) reEerenee value (ref. 3. 28}
Rw 1.50 1 dB RA 1.14 1 dB Rm 1,27 1 dB
5.3.2.3. The reproducibility R:
As can beseen from fig.5.12 the reproducibility only fulfils the require
ments of ISO/TC-43/sc-2-N-261 in the third-octave bands 160, 200, 250 and
315 Hz. The biggest difference between the reproducibility and the refe-
rence va1ues is 3.89 dB at 125 Hz. From these calculated va1ues of the re-
-78-
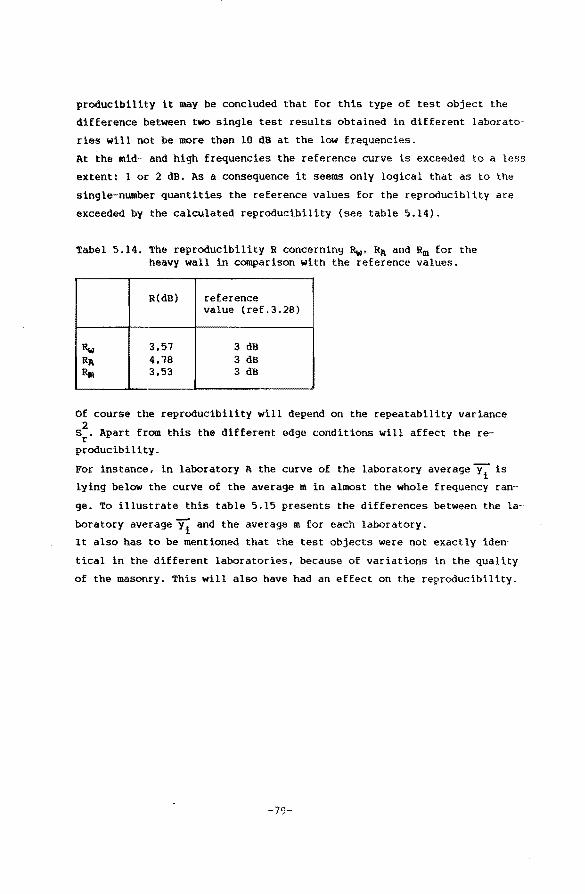
producibility it may be concluded that Eor this type of test object the
diEferenee between two single test results obtained in different laborato-~
ries will not be more than 10 dB at the low frequencies.
At the mid- and high frequencies the reEerenee curve is exceeded to a less
extent: 1 or 2 dB. As a consequence it seems only logical that as to the
single-number quantities the reEerenee values for the reproduciblity are
exceeded by the calculated reproducibility (see table 5.14).
Tabel 5.14. The reproducibility R eoncerning Rw• RA and Rm for the heavy wall in comparison with the reEerenee values.
R(dB) reEerenee value (ref.3.28)
Rw 3,51 3 dB RA 4,18 3 dB ~ 3,53 3 dB
Of course the reproducibility will depend on the repeatability varianee 2
Sr. Apart Erom this the different edge conditions will affect the re-
producibility.
For instance, in laboratory A the curve of the laboratory average~ is
lying below the curve of the average m in almest the whole frequency ran
ge. To illustrate this table 5.15 presents the diEferences between the la
boratory average y1 and the average m for each laboratory.
It also has to be mentioned that the test objects were not exactly iden~
tical in the different laboratories, because of variations in the quality
of the masonry. This will also have had an effect on the reproducibility.
-79-
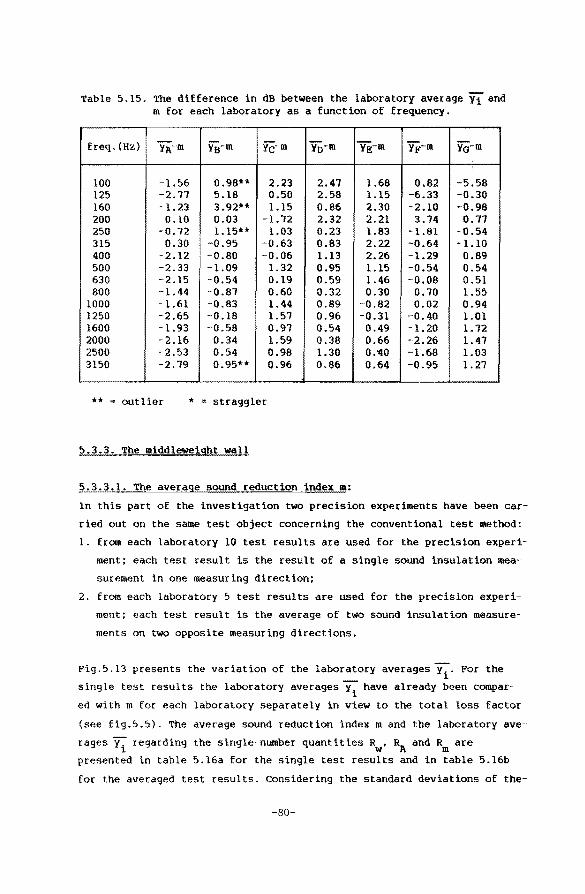
Tab1e 5.15. The diEferenee in dB between the 1aboratory average Y1 and m for each 1aboratory as a function of frequency.
freq. (Hz} YA-m Ya-m Yc-m yl>-m YE-m Ylo·-m YG-m
100 1.56 0.98** 2.23 2.41 1.68 0.82 -5.58 125 -2.11 5.18 0.50 2.58 1.15 -6.33 -0.30 160 1.23 3.92** 1.15 0.86 2.30 -2.10 -0.98 200 0.10 0.03 -1.12 2.32 2.21 3.74 0.71 250 -0.12 1.15** 1.03 0.23 1.83 -1.81 -0.54 315 0.30 -0.95 -0.63 0.83 2.22 -0.64 1.10 400 -2.12 -0.80 -0.06 1.13 2.26 -1.29 0.89 500 -2.33 -1.09 1.32 0.95 1.15 -0.54 0.54 630 -2.15 -0.54 0.19 0.59 1.46 -0.08 0.51 800 -1.44 -0.81 0.60 0.32 0.30 0.10 1.55
1000 -1.61 -0.83 1.44 0.89 -0.82 0.02 0.94 1250 -2.65 -0.18 1.51 0.96 -0.31 -0.40 1.01 1600 -1.93 -0.58 0.91 0.54 0.49 -1.20 1.12 2000 -2.16 0.34 1.59 0.38 0.66 -2.26 1.41 2500 -2.53 0.54 0.98 1.30 0.'40 -1.68 1.03 3150 -2.19 0.95** 0.96 0.86 0.64 -0.95 1.21
** outlier * stragg1er
5.3.3. The midd1eweiqht wa1l
5.3.3.1. The average sound reduction index m:
ln this part of the investigation two precision experiments have been car
ried out on the same test object concerning the conventional test method:
1. Erom each laboratory 10 test results are used for the precision experi
ment: each test result is the result of a single sound insulation maa
surement in one measuring direction;
2. from each laboratory 5 test results are used for the precision experi
ment: each test result is the average of two sound insulation measure
ments on two opposite measuring directions.
Fig.5.13 presents the vatlation of the laboratory averages y1
. For the
single test results the laboratory averages y i have al ready been compar
ed with m for each laboratory separately in view to the total 1oss factor
(see fig.5.5). The average sound reduction indexmand the laboratory ave-
rages regarding the sing1e-number quantities Rw' RA and Rm are
presented in table 5.16a for the single test results and in table 5.16b
for the averaged test results. Considering the standard deviations of the-
-80-
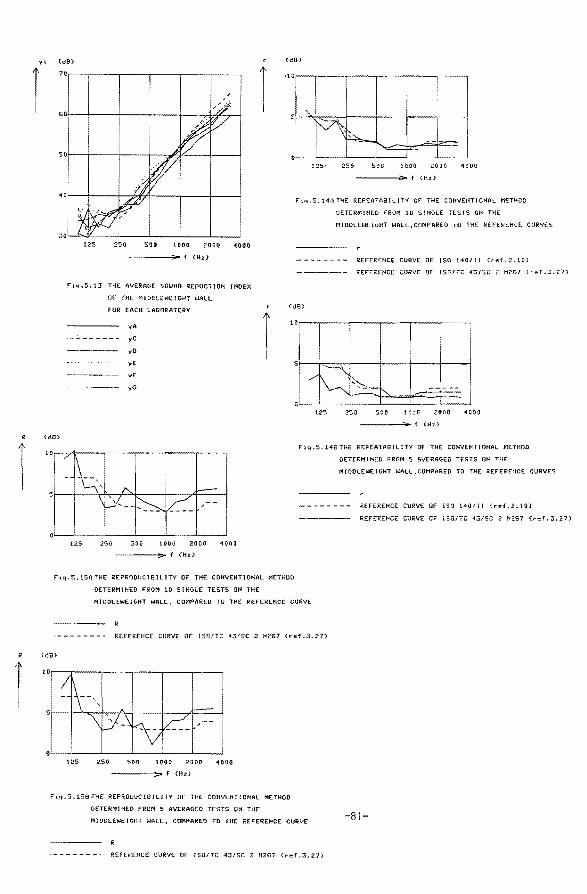
<dB)
125 250 son 1000 2000 <000
-----;;..f (Hz)
F" iq .5. 13 THE AVERAGt SOU HO REDUCT10ti I HOE X
OF THE MiODLEW:EIGHT WALL
rOR EACH LABOPATORY
yA
----- - yC
-·-·--- yO
vE
yF
vv
{dB)
·10r--r---,r----,-,---,-----,---,
125 25{) soo 100.0 2000 4006
----.;.. f CHzl
fiq.5.14ATHE REPE:ATABlli.TV OF THE COHVEHTIOHAL METHOC
DËTERMlHED fRûM 10 S!HOLE TESTS OH THE
Ml OOLEWE!GHT WALL, COMf'ARED 10 THE REfEREHCE CURVES
REFEF:f:HCt CURVE OF lSO 140/I! Cref.2.10)
-·-·-·-·- REFEREHCE CURVE QF ISO! TC 43/SC H2G7 Cref .3. 27)
(dB)
I '1 I . I :Lfhll_tJ 125 250 soo !':.H:i 2000 4000
----.;...f (Hz)
Fiq.5.14EITHE P.F.:F'EATA81LITY Of THE COHVEtHIOHAl .ME.THOO
ûETERt1t HEO FROM 5 AVERAGEO TESTS ON THE
MIODLEWElGHT WALL,COMPAREO TO THE REFEREHCE CURVES
:(EFEJ<:EHCE: CURVE OF ISO 140/ll <ref.2.10)
-·--·-·- RE:FEREtlCE CURVE Of ISû/TC 43/SC 2 M2G7 (ref. 3.21)
o-· -~- ~L-~_j_ __ L_ _ _j_ _ ___,
12.5 250 500 1000 2000 4:000
----- f (.Hz)
Fi~.5.15A;rH( REPROOUClBILITY Of THE COHVEHTIOHAL Mf:THOO
OETERMIHED f'ROM 10 SJHGL( TESTS OH THE
Ml DDLEWEIGHT WALL, COMPARED TO THE REFEREMCE CURVE
REfEREHCE CURVE OF 150/TC 43/SC 2 H267 <re:f.3.27)
(dB)
125 250 500 1000 2000 1000
----~ f <Hzl
Fiq.S.158:rHE REPROOUCtSJLITY Of iHE CO!-NEHTIOHAL METHO()
OETERMJH(O FROM 5 AV(RAûEO TESTS OH THE
MIDDLEWEIGHT WAll, COMPAREO ïO THE REFE:REHCE CURVE
REFEF.EHCE CURVE OF ISO/TC 43/SC 2 H26i (ref .3.:Z7l
-81-
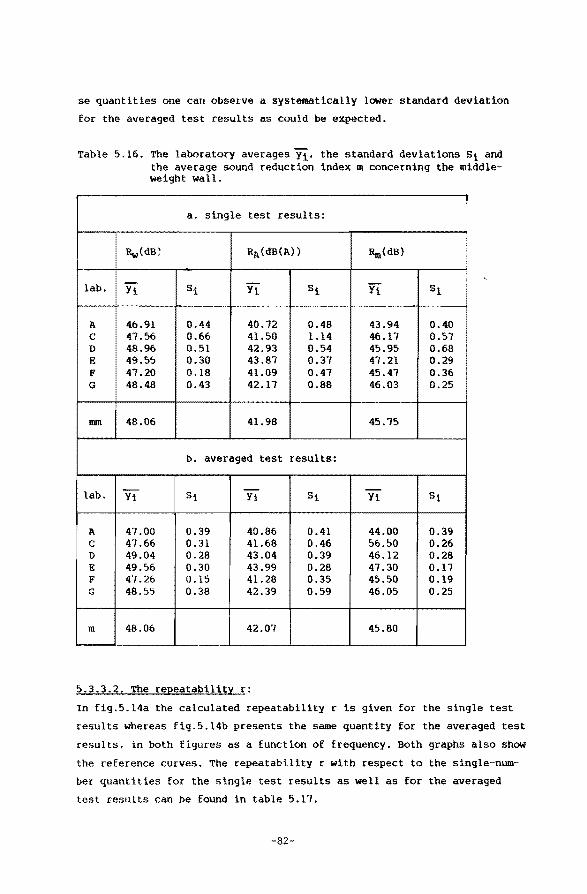
se quantities one can observe a systematically lower standard deviation
for the averaged test results as could be expected.
Table 5.16. The laboratory averages Yi• the standard deviations Si and the average sound reduction index m concerning the middleweight wall.
a. single test results:
Rw(dB) RA(dB(A}) Rm(dB)
lab. -Yi si Yi si Yi si
A 46.91 0.44 40.72 0.48 43.94 0.40 c 47.56 0.66 41.50 1.14 46.17 0.57 D 48.96 0.51 42.93 0.54 45.95 0.68 E 49.55 0.30 43.87 0.37 47.21 0.29 F 47.20 0.18 41.09 0.47 45.47 0.36 G 48.48 0.43 42.17 0.88 46.03 0.25
mm 48.06 41.98 45.15
b. averaged test results:
- - -lab. Yi si Yi St Yi Si
A 47.00 0.39 40.86 0.41 44.00 0.39 c 47.66 0.31 41.68 0.46 56.50 0.26 D 49.04 0.28 43.04 0.39 46.12 0.28 E 49.56 0.30 43.99 0.28 47.30 0.17 F' 47.26 0.15 41.28 0.35 45.50 0.19 G 48.55 0.38 42.39 0.59 46.05 0.25
m 48.06 42.07 45.80
5.3.3.2. The repeatability r:
In fig.5.14a the calculated repeatability r is given for the single test
results whereas fig.5.14b presents the same quantity for the averaged test
results. in both figures as a tunetion of frequency. Both graphs also show
the reference curves. The repeatability r with respect to the single-num
ber quantities for the single test results as well as for the averaged
test results can be found in table 5.17.
-82-
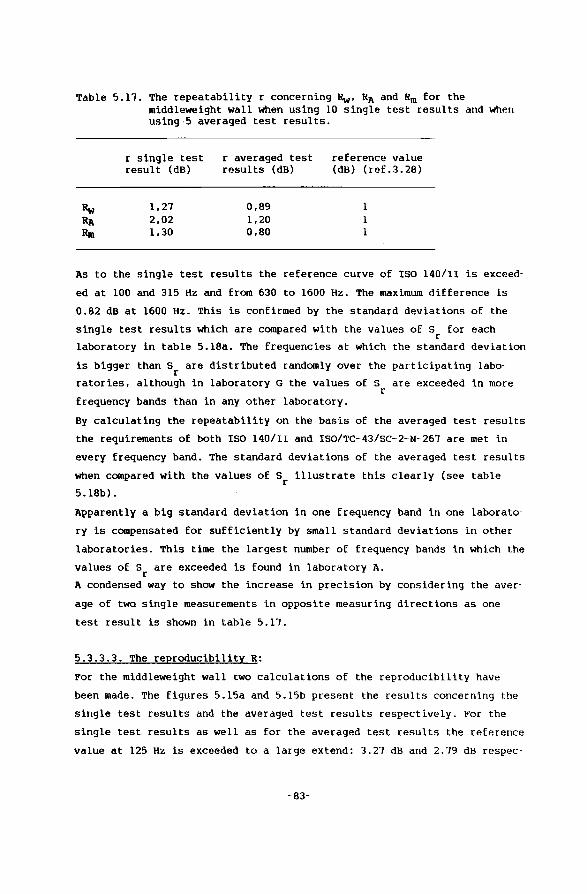
Table 5.11. The repeatability r concerning Rw• RA and Rm for the middleweight wall when using 10 single test results and when using·5 averaged test results.
r single test r averaged test reference value result (dB) results (dB) (dB) (ref. 3 .28)
Rw 1.21 0,89 RA 2,02 1.20 1 Rm 1.30 0,80 1
As to the single test results the reference curve of ISO 140/Il is exceed
ed at 100 and 315 Hz and from 630 to 1600 Hz. The maximum diEferenee is
0.82 dB at 1600 Hz. This is confirmed by the standard deviations of the
single test results which are compared with the values of Sr for each
laboratory in table 5.18a. The frequencies at which the standard deviation
is bigger than Sr are distributed randomly over the participating labo
ratories, although in laboratory G the values of s are exceeded in more r
frequency bands than in any other laboratory.
By calculating the repeatability on the basis of the averaged test results
the requirements of both ISO 140/Il and ISO/TC-43/sc- 2-·N- 261 are met in
every frequency band. The standard deviations of the averaged test results
when compared with the values of Sr illustrate this clearly (see table
5.18b).
Apparently a big standard deviation in one frequency band in one laborato·
ry is compensated for sufficiently by small standard deviations in other
laboratories. This time the largest number of frequency bands in which the
values of Sr are exceeded is found in laboratory A.
A condensed way to show the increase in precision by considering the aver·
age of two single measurements in opposite measuring directions as one
test result is shown in table 5.11.
5.3.3.3. The reproducibility R:
For the middleweight wall two calculations of the reproducibility have
been made. The figures 5.15a and 5.15b present the results concerning the
single test results and the averaged test results respectively. l:''or the
single test results as well as for the averaged test results the reference
value at 125 Hz is exceeded to a large extend: 3.21 dB and 2.79 dB respec-
-83-
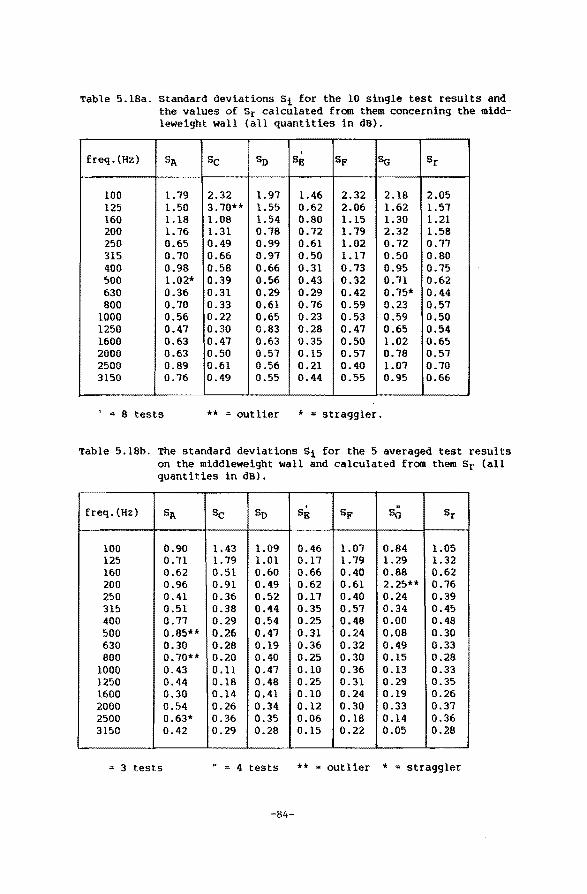
Tab1e 5.18a. standard deviations St for the 10 single test resu1ts and the values of Sr ca1cu1ated from them concerning the middleweight wal1 (all quantities in dB).
freq.(Hz) SA sc so SÊ; SF sa Sr
100 1.79 2.32 1.91 1.46 2.32 2.18 2.05 125 1.50 3. 70** 1.55 0.62 2.06 1.62 1.57 160 1.18 1.08 1.54 0.80 1.15 1.30 1.21 200 1. 76 1.31 0.78 0.72 1. 79 2.32 1.58 250 0.65 0.49 0.99 0.61 1.02 0.72 0.77 315 0.70 0.66 0.97 0.50 1.17 0.50 0.80 400 0.98 0.58 0.66 0.31 0.73 0.95 0.75 500 1.02* 0.39 0.56 0.43 0.32 0. 71 0.62 630 0.36 0.31 0.29 0.29 0.42 0.15* 0.44 800 0.70 0.33 0.61 0.76 0.59 0.23 0.57
1000 0.56 0.22 0.65 0.23 0.53 0.59 0.50 1250 0.41 0.30 0.83 0.28 0.47 0.65 0.54 1600 0.63 0.41 0.63 0.35 0.50 1.02 0.65 2000 0.63 0.50 0.57 0.15 0.57 0.78 0.57 2500 0.89 0.61 0.56 0.21 0.40 1.07 0.70 3150 0.76 0.49 0.55 0.44 0.55 0.95 0.66
' = 8 tests ** = outlier * = stragg1er.
Tab1e 5.18b. The standard deviations St for the 5 averaged test results on the middleweight wa11 and ca1culated from them Sr (all quantities in dB).
freq. (Hz) SA sc so SÈ SF sG Sr
100 0.90 1.43 1.09 0.46 1.01 0.84 1.05 125 0. 71 1. 79 1.01 0.17 1. 79 1.29 1.32 160 0.62 0.51 0.60 0.66 0.40 0.88 0.62 200 0.96 0.91 0.49 0.62 0.61 2.25** 0.76 250 0.41 0.36 0.52 0.17 0.40 0.24 0.39 315 0.51 0.38 0.44 0.35 0.57 0.34 0.45 400 0.77 0.29 0.54 0.25 0.48 0.00 0.48 500 0.85** 0.26 0.41 0.31 0.24 0.08 0.30 630 0.30 0.28 0.19 0.36 0.32 0.49 0.33 800 0. 10** 0.20 0.40 0.25 0.30 0.15 0.28
1000 0.43 0.11 0.41 0.10 0.36 0.13 0.33 1250 0.44 0.18 0.48 0.25 0.31 0.29 0.35 1600 0.30 0.14 0.41 0.10 0.24 0.19 0.26 2000 0.54 0.26 0.34 0.12 0.30 0.33 0.31 2500 0.63* 0.36 0.35 0.06 0.18 0.14 0.36 3150 0.42 0.29 0.28 0.15 0.22 0.05 0.28
3 tests 4 tests ** = outlier * straggler
-84-
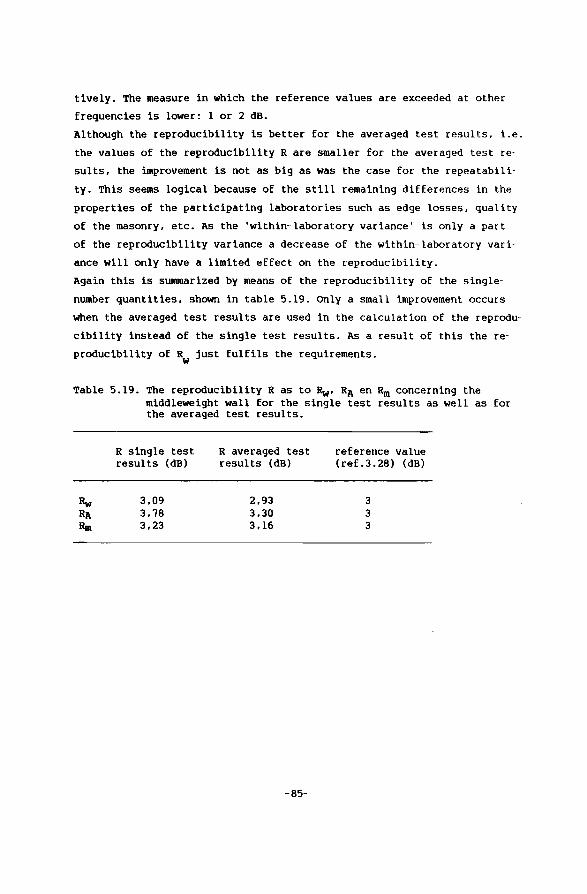
tively. The measure in which the reEerenee values are exceeded at other
frequencies is lower: 1 or 2 dB.
Although the reproducibility is better for the averaged test results, i.e.
the values of the reproducibility R are smaller for the averaged test re
sults, the improvement is not as big as was the case for the repeatabil i
ty. This seems logical because of the still remaining diEferences in the
properties of the participating laboratorles such as edge 1osses, qua1ity
of the masonry, etc. As the 'within-1aboratory variance' is only a part
of the reproducibi1ity varianee a decrease of the within-1aboratory vari
anee wi11 only have a 1imited effect on the reproducibi1ity.
Again this is summarized by means of the reproducibility of the sing1e
number quantities, shown in tab1e 5.19. only a sma11 improvement occurs
when the averaged test results are used in the calculation of the reprodu
cibility instead of the single test resu1ts. As a result of this the re
producibility of Rw just fulfils the requirements.
Table 5.19. The reproducibi1ity Ras to Rw• RA en Rm concerning the middleweight wall for the single test results as well as for the averaged test results.
R single test results (dB)
3,09 3,'78 3,23
R averaged test results (dB)
2,93 3,30 3,16
-85-
reference va1ue (ref.3.28) (dB)
3 3 3
5.3.4. conclusio11s of 5.3.
The investigation concerning the precision of the standardized test method
has been carried out using three test objects of which the sound reduction
index R differs quite explicitely: m
- the lightweight wall R 25 dB m
- the heavy wall R 54 dB m
- the middleweight wall: R 46 dB. m
The repeatability r and the reproducibility R have been determined four
times according to ISO 5125:
- for the lightweight wall on 8 single test results;
- for the heavy wall on 8 single test results;
- for the middleweight wall on 10 single test results;
- for the middleweight wall on 5 averaged test results.
The precision requirements concerning the repeatability are stated in ISO
140/II-1918 as a function of frequency. This standard is under revision
by ISO. The werking drafts also present reference values for the reprodu
cibility R, apart from the requirements for the repeatability. In the se
venth werking draft reference values for single-nuroer quantities are added
for the repeatability als well as for the reproducibilitu.
The reference values are not the same in all documents mentioned above
(see table 5.20). Therefore statements about the repeatability meeting the
requirements should be made in relation to the document used.
~s to the lightweight wall the calculated repeatability fulfils the requi
rements at most frequencies. The frequency region in which the reEerenee
va1ues are exceeded depends on the reference curve chosen:
ISO 140/II-1918 from 630 to 1600 Hz;
- ISO/TC-43/sc-2-N-261: above 630Hz;
- ISO/TC--43/sc- 2--N-- 319: above 1250 Hz.
The repeatabi1ity r concerning the single-number quantities exceeds the
reference values of 1 dB for both Rw' R~ and Rm. The reference va-
lues in the midfrequency range from the same Iso-document are 1.5 dB or
higher. One may wonder whether the ca1culated repeatability r should meet
the requirements for every third-octave band so as to obtain a repeatabi
lity for single-number quantities smaller than 1 dB.
-86-
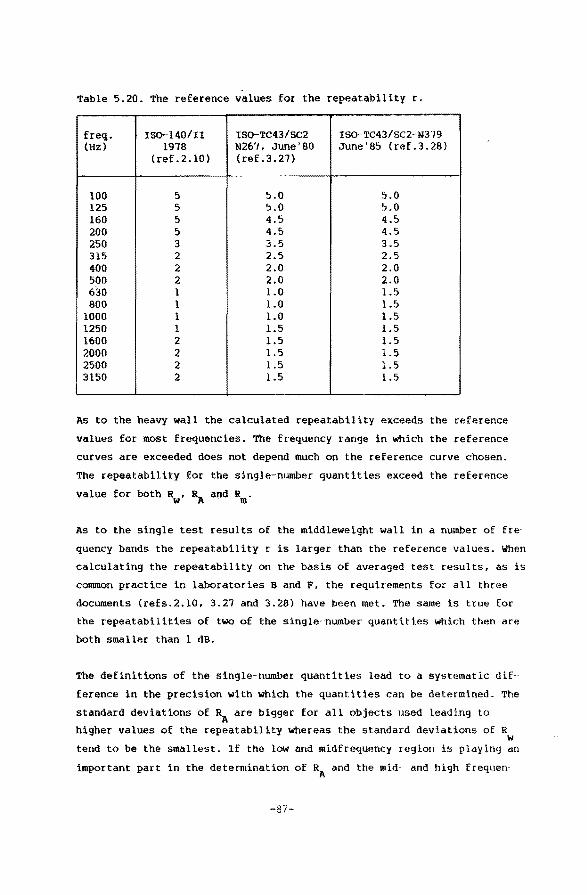
Table 5.20. The reference values for the repeatability r.
freq. ISQ-140/II ISQ-TC43/SC2 ISQ-TC43/SC2-N3.19 (Hz) 1978 N267, June'80 June'85 (ref.3.28}
(ref.2.10) (ref. 3. 27)
100 5 !>.0 5.0 125 5 !:1.0 5.0 160 5 4.5 4.5 200 5 4.5 4.5 250 3 3.5 3.5 315 2 2.5 2.5 400 2 2.0 2.0 500 2 2.0 2.0 630 1 1.0 1.5 800 1 1.0 1.5
1000 1 1.0 1.5 1250 l 1.5 1.5 1600 2 1.5 1.5 2000 2 1.5 1.5 2500 2 1.5 1.5 3150 2 1.5 1.5
As to the heavy wall the calculated repeatability exceeds the reference
values for most frequencies. The frequency range in which the reference
curves are exceeded does not depend much on the reference curve chosen.
The repeatability for the single-number quantities exceed the reference
value for both Rw' RA and Rm.
As to the single test results of the middleweight wall in a number of fre
quency bands the repeatability r is larger than the reEerenee values. When
calculating the repeatability on the basis of averaged test results, as is
common practice in laboratorles B and F, the requirements for all three
documents (refs.2.10, 3.27 and 3.28) have been met. The same is true for
the repeatabilities of two of the single--number quanti.ties which then are
both smaller than 1 dB.
The definitions of the single-number quantities lead to a systematic dif
ference in the precision with which the quantities can be determined. The
standard deviations of RA are bigger for all objects used leading to
higher values of the repeatability whereas the standard deviations of Rw
tend to be the smallest. 1f the low and midfrequency region is playing an
important part in the determination of RI\ and the roid- and high frequen-
-87-
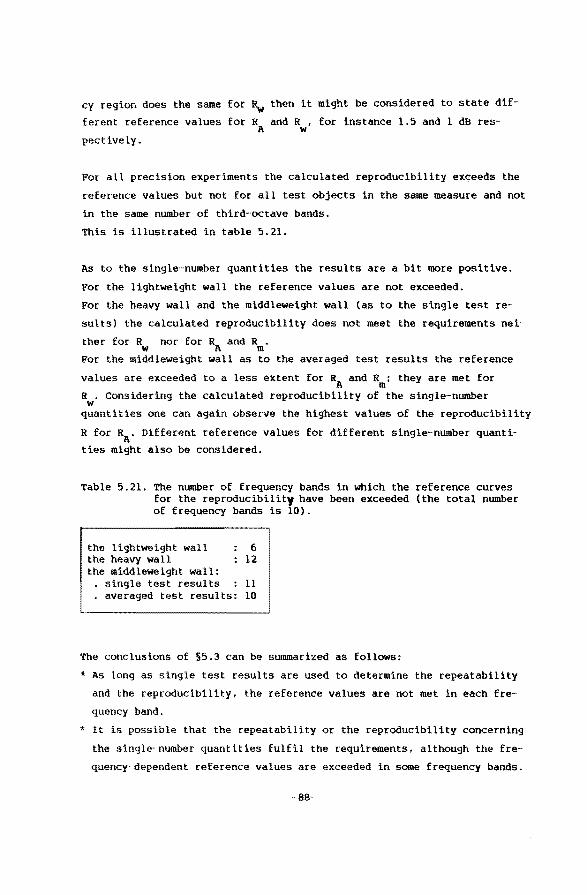
cy region does the same for ~ then it might be considered to state dif
ferent reEerenee values for R and R , for instanee 1.5 and 1 dB res-A w
pectively.
For all precision experiments the calculated reproducibility exçeeds the
reEerenee values but not for all test objects in the same measure and not
in the same number of third-octave bands.
This is illustrated in table 5.21.
As to the single-number quantities the results are a bit more positive.
For the lightweight wall the reEerenee values are not exceeded.
For the heavy wall and the middleweight wall (as to the single test re
sults) the calculated reproducibility does not meet the requirements nei
ther for Rw nor Eor RA and Rm.
For the middleweight wall as to the averaged test results the reEerenee
values are exceeded to a less extent for RA and Rm; they are met for
Rw. Considering the calculated reproducibility of the single-number
quantities one can again observe the highest values of the reproducibility
R for RA. Different reEerenee values for different single-number quanti
ties might also be considered.
Table 5.21. The number of frequency bands in which the reEerenee curves for the reproducibility have been exceeded (the total number of frequency bands is 10).
the lightweight wall 6 the heavy wall 12 the middleweight wall:
single test results 11 . averaged test results: 10
The conclusions of §5.3 can be summarized as follows:
* As long as single test results are used to determine the repeatability
and the reproducibility, the reEerenee values are not met in each fre
quency band.
* It is possible that the repeatability or the reproducibility concerning
the single-number quantities fulfil the requirements, although the fre
quency·dependent reference values are exceeded insome frequency bands.
-88-
* The values of the repeatability and the reproducibility are lowered when
using averaged test results instead of single test results; in this way
the requirements can be met more easily.
Some recommendations may be given:
* To improve the precision of the standardized 'pressure' method of ISO
140/III, the measuring procedure should be prescribed more strictly.
This may preferably lead to the use of averaged test results in test re""
ports.
* Different single-number quantities should have different reference va
lues for the repeatability and the reproducibility.
* Also in view of the precision of the standardized test method the stan
dardization of both the position of the test object in the test opening
and the shape and mass of the test opening should be recommended.
5.4. Comparison of the results of conventional measurements with the re-"
sults of intensity measurements
In the investigations concerning the heavy wall and the middleweight wall
{see §4.5 and §4.6) the sound reduction index of both test objects have
been determlned using the conventlonal 'pressure' method as well as the
lntensity method.
In the tests on the heavy wall two aspects were emphasized:
a comparison of the results of both test methods for each measurlng di··
reet ion;
- the lnfluence of the measuring direction on the results of intensity
measurements.
These aspects have been studled in each participating laboratory at a low
reactivity of the sound field in the receiving room. As shown in table 4.4
only one lntensity maasurement has been carried out for each measuring di··
rection.
In the tests on the middleweight wall different aspects were accentuated
(table 4.7):
- the Waterhouse correction;
- the influence of the reactivity.
-89-
~or these purposes the sound reduction index of the midd1eweight wa11 has
been determined in only one measuring direction i.e. with the wall connec
ted to the souree room. For each test method 5 single tests have been per
formed in every participating 1aboratory.
5.4.1. The tests performed on the heavy.wa11
The diEferenee between the results of pressure and intensity measurements
may depend on the measuring direction.
We wil1 distinguish the two directions by the fol1owing descriptions:
- the object is connected to the souree room;
- the object is connected to the receiving room.
5.4.1.1. Tests performed with the wall connected to the souree room:
The resu1ts of both test methods concerning this measuring direction are
shown in:
- figure 5.16A for laboratory A;
- figure 5.16B for laboratory B;
- figure 5.16F for laboratory C;
- figure 5.161 for laboratory D:
- figure 5.16M for 1aboratory G.
All figures have a few things in common:
- for low frequencies, approximately below 250 Hz, the intensity measure
ments yield the 1owest va1ues of the sound reduction index:
- for frequencies between 250 and 1000 Hz the results of the two test me
thods agree rather well;
- for frequencies above 1000 Hz the intensity technique yields the highest
va lues.
An exception can be observed in the results of laboratory B where the cur
ve of the intensity measurement is lying below the other curve for nearly
every frequency.
For the measuring direction concerned one would expect the results of the
two test methods to agree we1l as in the receiving room the same amount of
sound power is measured with both methods i.e. the sound power radiated
from the test object.
-90-
Besides we found that the reactivity index only exceeds the value of 10 dB
for a few frequencies in a few laboratories:
- in laboratory B at 3150 Hz;
- in laboratory c at 125 Hz.
An extra measurement has been carried out:
- in laboratory c another heavy wall had been built on the concrete frame
(the Cl-situation in §5.2.4).
The results of the measurements as to this wall position are shown in fig.
5.168. The same oommon characteristics as those mentioned above, when the
wall is connected to the souree room, can be observed in this figure.
5.4.1.2. Tests performed with the wall connected to the receiving room:
For this measuring direction the sound reduction index of the heavy wall
has not been determined in each laboratory.
The results of the measurements for the laboratorles concerned can be
found in:
- figure 5.16C for laboratory B:
- figure 5.16G for laboratory C;
- figure 5.16J for laboratory D;
- figure 5. 16L for laboratory F.
Also from the results of these measurements some common characteristics
can be concluded:
- for low frequencies the intensity measurements yield the lowest values
of the sound reduction index; this effect occurs approximately at fre
quencies below 250 Hz although this frequency is varying from one labo
ratory to another; in laboratorles B and c large variations in the sound
reduction index occur at low frequencies:
- for frequencies above approximately 250 Hz the curves resulting from in
tensity measurements are lying above the curves from the pressure mea
surements; diEferences of up to 5 dB can occur:
the reactivity index exceeds the value of 10 dB only for a few frequen
cies:
in laboratory B at 125 and 160 Hz:
in laboratory F at 160 Hz.
Although the number of measurements in this paragraph is very limited we
can conclude that the intensity measurements yield higher values of the
sound reduction index for most frequencies. This may be explained from the
-91-
difference in nature between the two test methods. When using the intensi
ty technique the sound power radiated from the test object is determined
whereas by using the pressure measurements one determines the total sound
power radiated into the receiving room from all its surfaces. This means
that the sound power directly transmitted through the test object is mea
sured by the intensity technique while this power plus the power trans
mitted along flanking paths is determined by the pressure measurements.
For the heavy wall, of which the mass per unit area is about equal to that
of the adjoining structures, the flanking transmission cannot be neglec
ted. This results in higher va1ues of the measured sound reduction index
when the intensity technique is used.
5.4.1.3. The effect of the measuring direction on the results of the in-
tensity measurements:
Intensity measurements in two measuring directions have only been carried
out in laboratorles B, c and D.
The results of these measurements are given in:
- figure 5.16D for laboratory B:
- figure 5.16H for 1aboratory c: - figure 5.16K for 1aboratory D.
These figures show that the lowest values of the measured sound reduction
index are obtained when the object is connected to the souree room. This
occurs for nearly the whole frequency range but is mostly pronounced for
frequencies above 500 Hz. For frequencies below 500 Hz the effect is not
significant. In laboratory B the results of the measurements in the two
directions agree from 250 to 500 Hz while for frequencies below 250 Hz
large variations in both curves occur with on the average higher values
for the direction in which the test object is connected to the receiving
room.
A similar effect can be observed in the results of the measurements in la
boratory c. For frequencies above 250 Hz the direction at which the wall
is connected to the receiving room yields the highest values whereas for
frequencies below 250 Hz the effect is again not significant because of
large variations in both curves.
In §5.4.1.1 and §5.4.1.2 we already mentioned the frequencies at which the
reactivity index concerning these measurements exceeds the value of 10 dB.
-92-
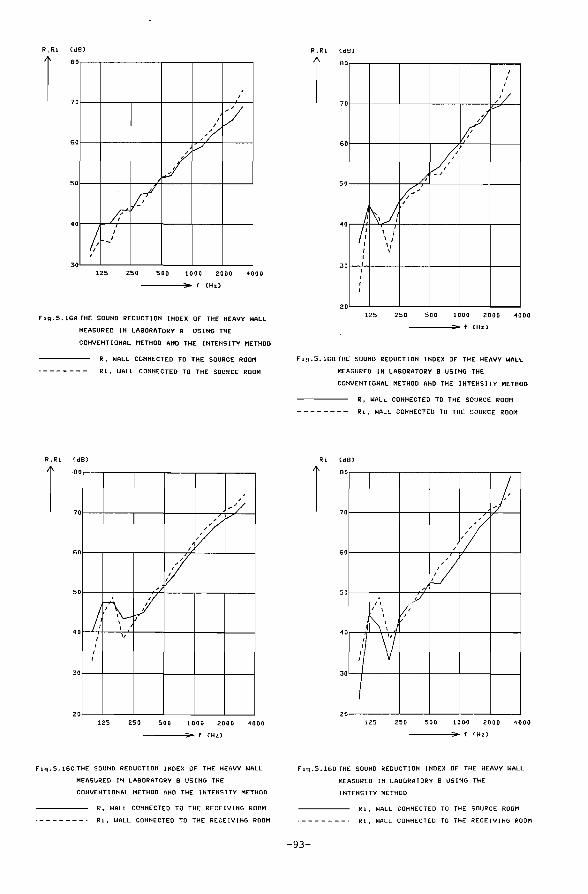
(dB)
·8 0
I 0 v I
,)' 0
V v 6
0
V /(
0
5
! I
-I
3 0 125 250 500 1000 2000 4000
-----f CHz>
Fi!=j.5.16A THE SOUND REOUCTIOH lHOEX Of THE HEAVY WALL
MEASURED lH LABDRATORY A USIHG THE
COHVEHTIOHAL METHOO AHO TH:E IHTEHSITY METHOC
R, WALL COHHECTEO TO THE SOURCE ROOM
-------- R i, WALL CONHECTEO TO THE SOURCE ROOM
R ,Ri CdBJ
·8 0
0
6 0
5 0
0
30
20
--/
,V V
'
/ r\-V I
I I,
I I I
125 250 500 1000 2000 4000
----_"..f CHz)
fi.q. 5. 16C THE SOUHD REDUCTt OH I HOEX OF THE HEAVY WALL
MEASURED IH LABDRATORY B USIHG THE
CDHVEHTIOHAL METHOD AHO THE IHTEHS1TY METHDO
R~ WALL COHHECTEO TO THE RECEIVIHG ROOM
·------- • Rl, WALL COHHECTEO TO TH( RECEIVIHG ROOM
R ,RI. CdBl
·8 0
0
6 0
50
40
3 0
0
I I
I
//
1/ fi V _,
v--I
1.~\} /f
I I I I I 11
I I I
I I I I
125 250 500 1000 2000 4000
-----f <Hz)
Fi!=j.5.168 THE SOUHO REOUCTIOH I HOE X OF THE HEAVY WALL
MEASURED I H LABm~ATORY 8 US I HG THE
COHVEHTIOHAL METHOD AHD THE IHTEHSITY METHOO
R, WALL CotiHECTEO TO THE SOIJRCE ROOM
-------- R i, WALL COHHECTED TO THE SOURCE ROOM
Ri CdBJ
·8 0
70
60
50
0
30
20
j ,-1
-Ll " J/t/ I I
\\ I V } I
125 250 500 100·0 2000 4000
-----f <Hz>
Ftq.5.16D THE SOUND REDUCTIOH IHDEX OF THE HEAVY WALL
MEASUREO IN LABORATDRY 8 USIHG THE
l HTEHS I TV METHOO
R i, WALL COHHECTED TD THE SOURCE ROOM
·-------· Ri., WALL CDiiHECTEO TO THE RECEIVIHG ROOM
-93-
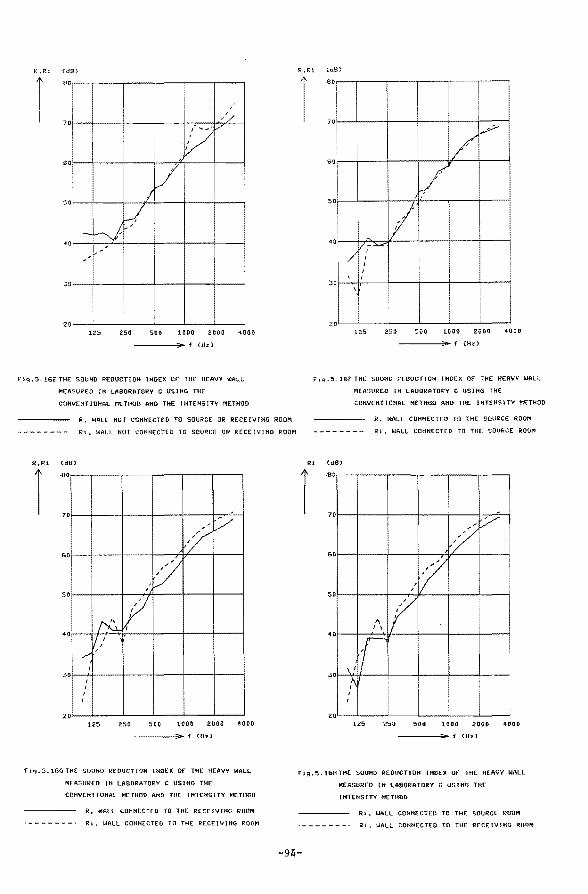
R ,Ri (d9}
-:
I ' i ,'/
70
J~/ so 1
I v: .I 50:
! kl -f-J 40
J ~ '
I ' '
I
I zo 125 250 500 1000 2(10() 4000
----.;oo.f (Hzl
Fiq.S.lSETHE SOUHO PEDUCTtOH JHOEX OF' THE HEAVY WALL
PtEASUREO fH LASO!öl:ArORY C lJSIHG THE
R,R"i
1
COiiVEMT I OHAL MEiHOO AHO THE: I HTEHSJ TY ME.THOO
R~ !<!All HOi CONMECTEO TO SOURCE OR RECE!V!HG ROOM
Ri, WALL HOT COHHECTEO TO SOURCE OR RECE lVItiG FOOM
(dB)
·BOr--,-----r----,----,-----r----,
3or-~-----t-----r----f-----t---~ I I
I I
20~~-----L----L---~----~----125 250 500 1000 2000 ~000
-----7> f CHzl
fiq.S.16GTHE SOUI'iO REOUCTJOH lHOEX OF THE HEAVY WALL
MEASUREO IN lABORATORY C USJHG THE
COHVEHT I OH Al METHOD AHD THE I HTEiiS I TV METHOO
R. WALL COt+HECTtO TO THE REÇEIVfHG ROOM
Ri.. WALL COHHECTEO TO THE RECElVHfG ROOM
R ,Ri tdB}
l !
I 1/ V
0
Vi I
'I ! I
0 ~ "_",
5
/ I
I I I
' I . 0
'
I 0
125 250 500 101JO 2000 4000
-----f <Hz>
Ftq:.5.16t THE SOUHD REDUCTIOH IHOEX OF Tl-IE HEAVY WALL
MEASUREO TH LABORATORY C USIHG THE
COHVEHTIONAL METHOO AHD THE IHTEHSlTY METHOD
Ri (d9)
·9 ()
6 0
5
0
0
0
R • WALL CONHECTED Hl THE SOURCE ROOM
Ri, WALL COHMECTE.D TO THE SOURCE ROOM
,./ ;;/.
I
,:/ I
" lf I\
Jl I"
I
!
' I
125 250 500 1000 2000 4000
----.;;;..f <Hz)
F'i9.S.l6HTH(_ SOUHO REOUCTIOH IHDEX Of TH[ HEAVY WALL
M(ASUREO lH LAS(}RATORV C USU1G THE
1 HTEHS ITY PtETHOO
lH • WALL COHHECTEO TO THE SOURCE ROOJtt
·------- · lH, WAll COHHECTED TO THE RECEIVIHG ROOM
-94-
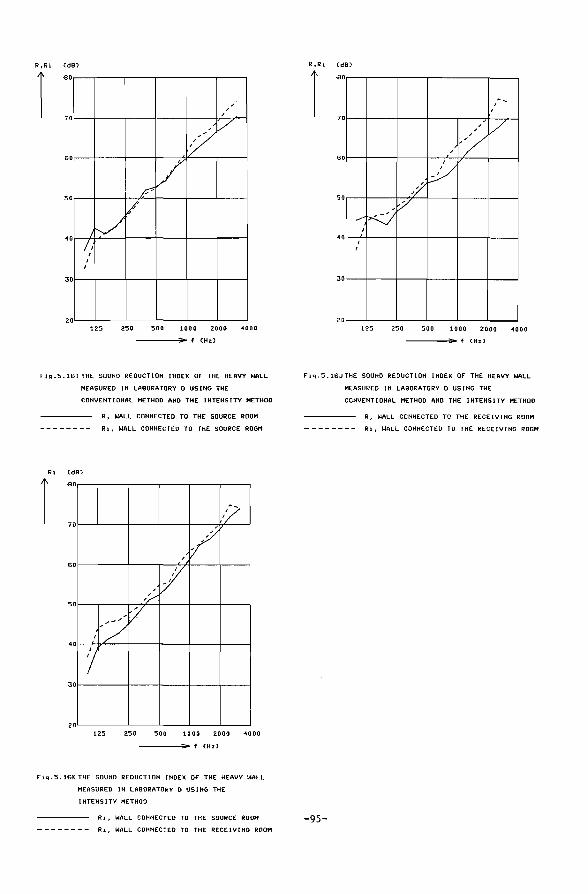
R ,Ri
1 CdBJ
·8 0
0
6 or--
5 0
--
:
' ' '
V V
F /
I ~ 0
1.1 I
I I
3 0
0 125 250 500 1000 2000 "'000
----.;;..f <Hz>
Fi~.S.16I THE SOUND REDUCTIOH IHDEX OF THE HEAVY WALL
MEASUREO lH LABORATDRY 0 USIHG THE
COHVEHT I OHAL METHOC AHO THE I HTEHSI TV 1'1ETHOO
R, WALL COHHECTED TO THE SOURCE ROOM
-------- R 1. WALL COHHECTED TO THE SOURCE ROOM
•• CdBJ
·8 0
0
6 0
0
0
0
0
I?
' V
V ' L_
,-' / 1'/
I
I
125 250 500 1000 2000 4000
----.;;o.f <Hz)
F i~. 5. 16K THE SOU HO REDUCTI OH IHDEX OF THE HEAVY WALL
MEASUREO lH LABORATDRY 0 USIHG THE
I HTEHS I TV METHOO
Rî, WALL COHHECTED TO THE SOURCE ROOM
-------- Ri, WALL COHHECTEO TO THE RECElVIHG ROOM
R ,Ri CdBJ
·8 0
70
60
50
40
30
20
·-I I
' V '
-~/
~;/ w
<.) V .......
I
I I
125 250 500 1000 2000 "'000
----.;;o.f (Hz)
F iq. 5 .16J THE SOUt•iO REDUCTI OH IHDEX OF THE HEAVY WALL
MEASUREO IH LABDRATORY 0 USIHG THE
COHVEHTIOHAL METHOO AHD THE IHTEHSITY METHOO
R, WALL COHHECTED TO THE RECEIVIHG ROOM
-------- R1, WALL COHHECTEO TO THE RECEIVIHG ROOM
-95-
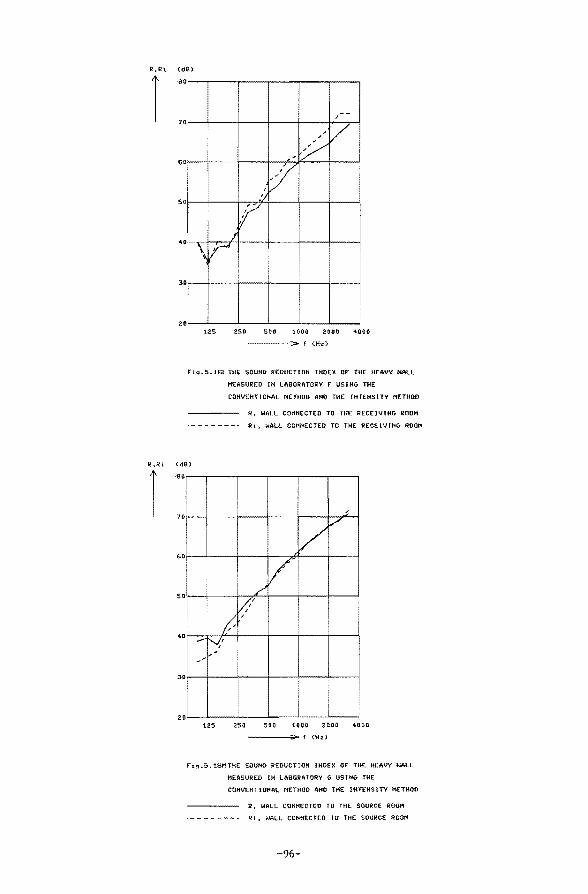
R,Ri
R,Ri
1
OI
--' 0'
/ I ' ' ~/
0'
.'lv 0
V 5
0 I
\ r 0
0
0
oi
6 0
5 0
0
3 0
0
125 250 500 1000 2'000 4000
-----;;..fUt;:)
Flq.5.16l TH( SOUHO REOUCTIOH !HOEX OF' iHE HEAVY WALL
MEASURED IH LABORATOR:V r USIHG fHE
COHVEHT I OHAL METHOO AHO THE I HTENS t TV METHOO
R, WALL COH!1ECTEO TO THE RECElVItfG ROOM
·-------· Ri 1 WALL COHHECTEO TO TH€ RECElVIHG ROOM
' /
V /
/ 1 //J
I /'
--N' ~
~ ~
~
I 125 250 500 1000 2000 4600
-----;;..f (Hz)
Flq.5.16MTHt SOUHO REOUCTIOH lHOEX OF THE HEAVY WALL
MEASUREO lH LABORATORY G USHtG THE
COHVEHTIOHAL METHOO AHO THE !ttTEHSlTY METHOO
R, WALL CONHECTED TO THE SOURCE ROOM
·---- -- w Ri, WALL COHHtCTEO to THE SOURCE ROOM
-96-
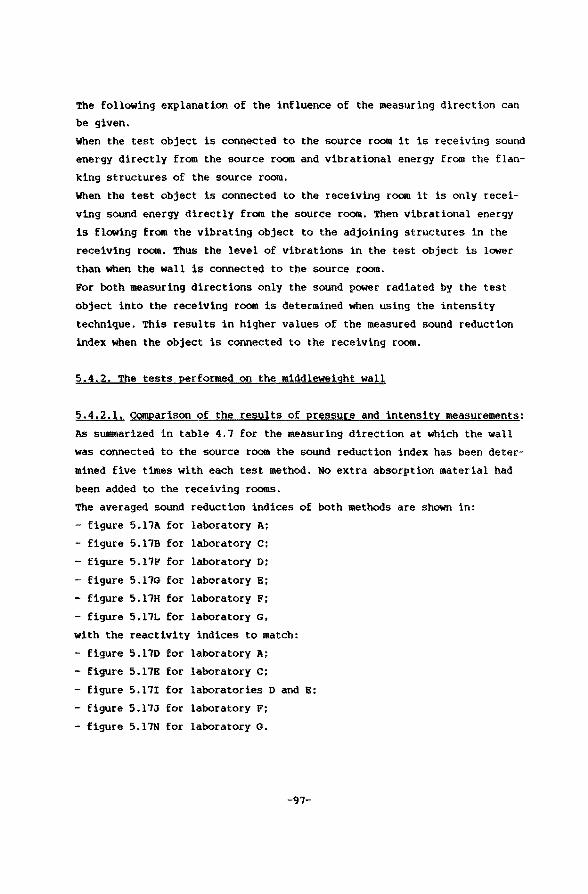
The following explanation of the influence of the measuring direction can
be given.
When the test object is connected to the souree room it is receiving sound
energy directly from the souree room and vibrational energy from the flan
king structures of the souree room.
When the test object is connected to the receiving room it is only reeei
ving sound energy directly from the souree room. Then vibrational energy
is flowing from the vibrating object to the adjoining structures in the
receiving room. Thus the level of vibrations in the test object is lower
than when the wall is connected to the souree room.
For both measuring directions only the sound power radiated by the test
object into the receiving room is determined when using the intensity
technique. This results in higher values of the measured sound reduction
index when the object is connected to the receiving room.
5.4.2. The tests performed on the middleweight wall
5.4.2.1. Comparison of the results of pressure and intensity measurements:
As summarized in table 4.1 for the measuring direction at Which the wall
was connected to the souree room the sound reduction index has been deter
mined five times with each test method. No extra absorption material had
been added to the receiving rooms.
The averaged sound reduction indices of both methods are shown in:
figure 5.11A for laboratory A:
- figure 5.11B for laboratory c: - figure 5.11F for laboratory o: - figure 5.11G for laboratory E;
- figure 5.11H for laboratory F;
- figure 5.11L for laboratory G,
with the reactivity indices to match:
figure 5.110 for laboratory A;
- figure 5.11E for laboratory c:
- figure 5.111 for laboratorles D and E:
- figure 5.11J for laboratory F;
- figure 5.11N for laboratory G.
-91-
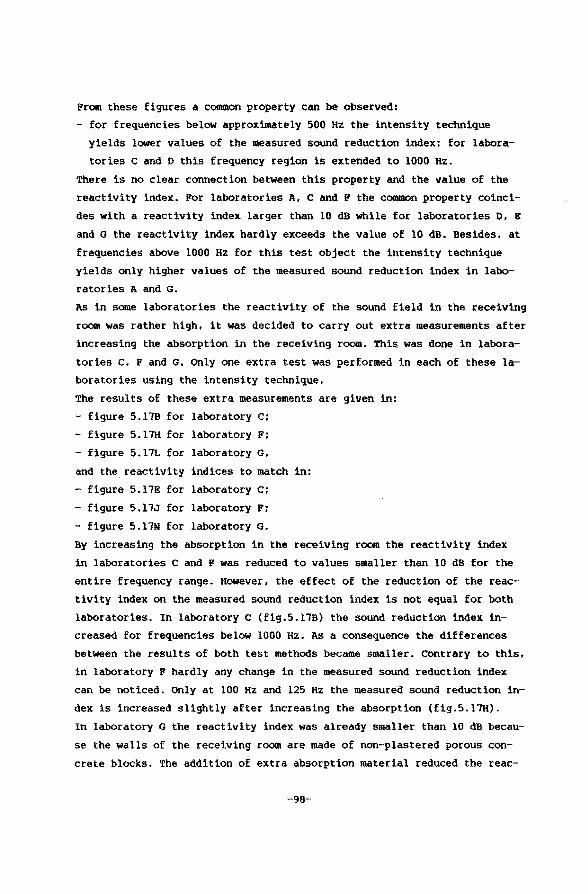
From these figures a common property can be observed:
- for frequencies below approximately 500 Hz the intensity technique
yields lower values of the measured sound reduction index: for labora
torles c and D this frequency region is extended to 1000 Hz.
~bere is no clear conneetion between this property and the value of the
reactivity index. For laboratorles A, c and F the common property coinci
des with a reactivity index larger than 10 dB while for laboratorles D, E
and G the reactivity index hardly exceeds the value of 10 dB. Besides, at
frequencies above 1000 Hz for this test object the intensity technique
yields only higher values of the measured sound reduction index in labo
ratorles A and G.
As in some laboratorles the reactivity of the sound field in the receiving
room was rather high, it was decided to carry out extra measurements after
increasing the absorption in the receiving room. ~is was done in labora
torles c, F and G. Only one extra test was performed in each of these la
boratories using the intensity technique.
~e results of these extra measurements are given in:
- figure 5.17B for laboratory C;
- figure 5.17H for laboratory F:
- figure 5.11L for laboratory G,
and the.reactivity indices to match in:
- figure 5.17E for laboratory c:
- figure 5.17J for laboratory F:
- figure 5.17N for laboratory G.
By increasing the absorption in the receiving room the reactivity index
in laboratorles c and F was reduced to values smaller than 10 dB for the
entire frequency range. However, the effect of the reduction of the reac
tivity index on the measured sound reduction index is not equal for both
laboratories. In laboratory c (fig.5.17B) the sound reduction index in
creased for frequencies below 1000 Hz. As a consequence the differences
between the results of both test methods became smaller. Contrary to this,
in laboratory F hardly any change in the measured sound reduction index
can be noticed. Only at 100 Hz and 125 Hz the measured sound reduction in
dex is increased slightly after increasing the absorption (fig.5.17H).
In laboratory G the reactivity index was already smaller than 10 dB becau
se the walls of the receiving room are made of non-plastered porous con
crete blocks. The addition of extra absorption material reduced the reac-
-98-
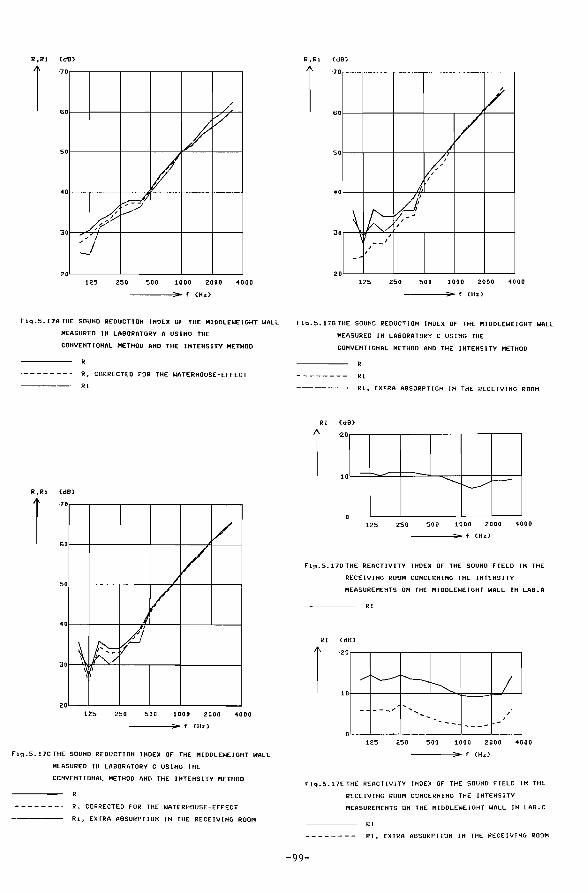
R,Ri
1 (dB)
·7 0
6 0
0
0
3 0
0
/
/_
i/ V
v' ~ ~ /
' i/ -12~ 250 500 1000 2000 4000
-----f (Hz)
Fi~.S.l7ATHE SOUND REDUCTIOH INDEX OF THE MIOOLEWEIGHT WALL
MEASUREO lH LABDRATORY A USIHG THE
COHVEHTIOHAL METHOO AHO THE lttTEHSITY METHOO
·-------- R, CORRECTEO FOR TH[ lalATERHOUSE-EfFECT
---·-· Ri
R,Ri CdB>
1 ·7 0
6 0 V
V 5 0 I
V 0
J
\ lf-5 lfi r 3 0
\I ,,
0 125 250 500 1000 2000 4000
f (Hz)
fi~.5.17CTHE SOUHO REOUCTIDH IHOEX Of THE MIODLEWEIGHT WALL
MEASURED lH LABDRATORY C USIHG THE
COHVEHT I OHAL METHOO AHO THE I HTE HS I TV METHOO
------- • R, CORRECTED FOR THE WATERHOUSE-EFFECT
-·----- Ri, EXTRA ABSDRPTIOH lH THE RECEIVIHG ROOM
R ,Ri CdBl
·7 0
6 0
0
0
3 0
2 0
V l7
,I
V' A
L4' \ I~ ' :Ï,- /
/
/
-- I I
/ -125 250 500 1000 2000 4000
-----f (Hz>
fiq.5.17BTHE SOUND REDUCTIOH IHDEX OF THE MIODLEWEIGHT WALL
MEASURED lH LABDRATORY C USIHG THE
COHVEHTIOHAL METHOD AHD THE IHTEHSITY METHOD
-------- Ri
---·-- Ri, EXTRA ABSORPTION JH THE RECEJVING ROOM
RI CdB>
·2 0
0
0 125 250
........... ~ -
500 1000 2000 4000
-----f CHz>
F1~.5.17DTHE REACTIVITV IHDEX Of THE SOUND FIELD lH THE
RECEIVIHG ROOM CONCERHIHG THE IHTEHSITY
f'IEASUREMEHTS OH THE MIDDLEWEIGHT WALL lH LAB.A
RI
RI CdB>
1 ·20
/ .....____..... I'--~ I 10
- ___ " I
/
125 250 500 1000 2000 4000
-----f (Hz)
Fi~.5.17ETHE REACTIVITV JHOEX OF THE SOUND FIELD lH THE
RECEIVIHG ROOM COHCERHIHG THE IHTEHSITV
MEASUREMEHTS OH THE MIODLEWEIGHT WALL IN LAB.C
RI
RI, EXTRA ABSORPTIOH lH THE REGElVING ROOM
-99-
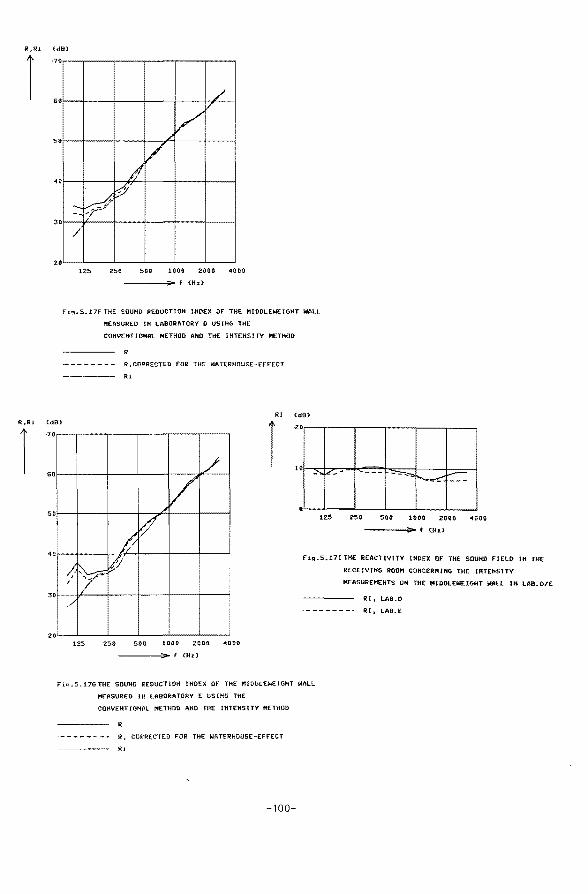
/
20~--L-----L-----L-----L---~L---~
CdB)
·70
so
5 0
125 250 500 1000 2000 4000
---------;;.. f <Hz)
Ftq.5.17FiHE: SOUHD REOUCTlOH UiOEX OF THE MIODLEWEIGHT WAll
f"'E:ASURED lH LAEIORATO~Y 0 USIHG THE
COHVEHT I OtiAL METHOO AMO THE I HTEHS I TV METHOO
-------- R,CDRRECTED fOR THE WATERHOUSE-EFFECT
-·-·------ Rl
RI <dB)
·2 0
/ 0 ::-..;.e-/
/ 0
ç 11
125
---- -~ J...---.;r--250 500 tooo zoon >1ooo
-------;;.. f CHz>
0
! I y f! fi9.S.111 THE REACTIVITV INDEX OF THE SOUHD FIELD lH THE
RECElVtHG ROOM COitCER:HlHG THE UftEH5lTV
MEASUREMEHTS OH THE f!IIODLEWEIGHT WALL lH U\8.0/E
3 0
/
! o'
125 250 500 1000 2000 4000
-------.-;;.. f (Hz:)
Fiq.5.17GTHE SOUliD REDUCTIOM IHDEX OF Tt-tE MIDDlEWEIGHT WALL
Mf.ASURED lH LAIJORATORV E USIHG THE
COH.VEHTIOHAL f'tETHOD AHO THE lHTEHSJTY METHOD
• ·------- • R, CORRECTED FOR THE WATERHOUSE-EfFECT
-----·- Rl
-100-
Rl, LAB.D
RI. LAB.E
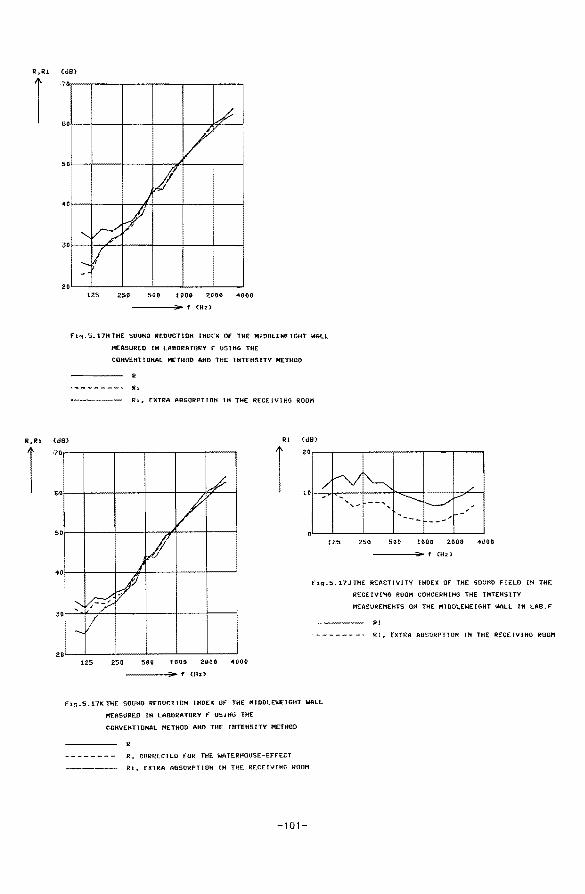
(dB}
·7
5
o
o f
V 0
V o' J
/ 0
0
" ~ -V -
125 250 500 1000 2000 4000
----.;,... f <Hz)
f1q.S.17HTHE SOUMD REOUCTIOH fHDEX Of THE MIODLE.WEIGHT WA-ll
PIEASURED lH tABORATORV F' US[HG THE
COHVEHTIDHAL METHOD AHD THE IHTEHSITV METHOD
R
Rt
.. ,._._, ___ Ri~ EXTRA AEISORPTtOH lH THE RECEIVJHG ROOM
CdBl
·7 0
RI <dB1
·20,----.----.---,----;----r----.
s 0
5 0
0
0
0
/
V I V
/ I
::---0 -... /
I 125 250 500 1000 2000 4000
----~f CHzl
125 250 500 HHJO 2000 1000
----.;...<<Hz)
Fiq.5.17JTHE Rf.:ACTJVITV INDEX OF TH[ SOUHD FIELD IH THE
RECEIVING ROOM COHCERHlHG THE IHTEHS!TY
M(ASUREMEHTS OH THE MIDOl,EWEIGliT WALL Hl LAB.F
RI
R:I. [XrlM ABSORPTtOH IN THE RECE.lVIHG ~OOM
Fi.~.5.17KTHE SOUHO REDUCTIOtt JHDEX Of THE MIDOLEWEIGHT WALL
Mt:ASUREO lH LABORATORV F USitiG THE
COHVEHT!OHAL METHOO AHO THE IHTEHSJTV f'IETHOO
------- R:, CORRECTEO FOR THE WATERHOUSE-EFFECT
----- lH • EXTRA -A6SORPTJOH lH THE ~ECEIVfHG ROOM
-101-
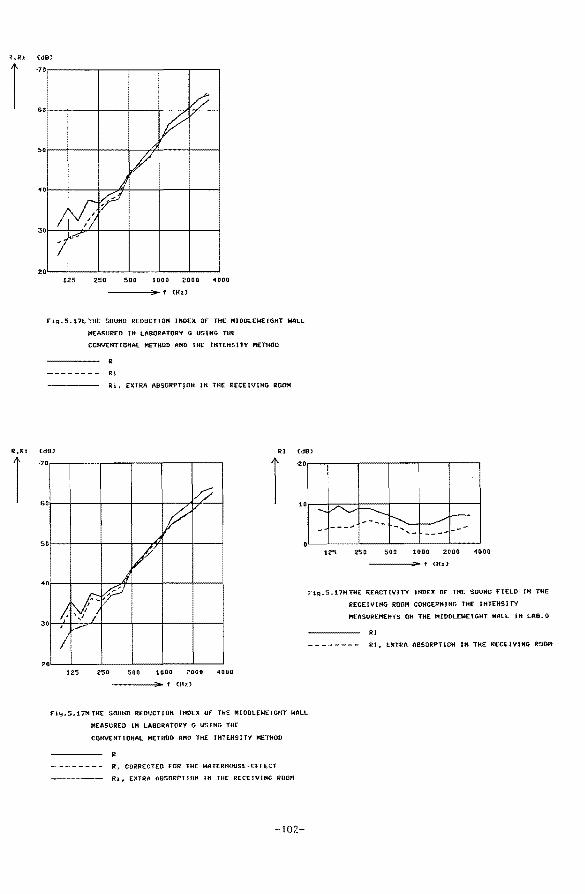
R ,R:i
I
(d9)
60
50
••
0
20
I
~
I~ A
V j
~ lO
I ?
~ ~;
I
125 250 500 1000 2000 4000
-----f (HzJ
f'i!óJ.S.17l.. THE SOUHD REDUCTTON UtOEX OF THE MlD.OLEiaiE!ûKT WALL
IE:ASURED Ut LASORATORY G USlHG THE
COHVEMTIOHAL METHOD AH'D THE lHTEHStTV METHOO
a -------- Ri
Ri, EXTRA ABSORPT~OH JH THE RECElV1HG ROOM
(dB)
·70,--,-----.,.---,----.----.,...----,
RI !dB)
·20
0
0
I 20IL--L--~---L--~--~-~
125 250 500 1000 2000 4001)
----...;.. f (Hz}
--. ~ !---.. ~ ~
f---- .... _ ___ ... - ~
-- ---125 250 500 1000 2000 400-Q
----..;;.. f CH:z>
Ftg.5.;l7HTHE REACTIVITY lHDEX OF THE SOUND ftELO lH THE
RECEJVIHG ROOI'! COHCERIIJHG THE JHTE!ISJTV
MEASUREMEHTS OH THE MlDDLEWEIGHT WALl lN LAS.G
RI
-------- RI~ EXTRA ABSORPTIOH IK THE RECE1Vltro ROOM
fl~~5.17MTHE SGUHD REOUCTIOH UiOEX OF" THt fiiiOOLEWEIGHT WALL
MEASURt:D lH LABORATDRY G US IHG THE
COHVEHTIOHAL METHOO AHO iH.E: IHTEHSITY METHOO
R
·-------- R> CORRECTEO FOR TH[ WATERHOUSE-EFFECT
----- Ri • EXTRA ABSORPTIDH Ui THE REC(lVlHG ROOM
-102-
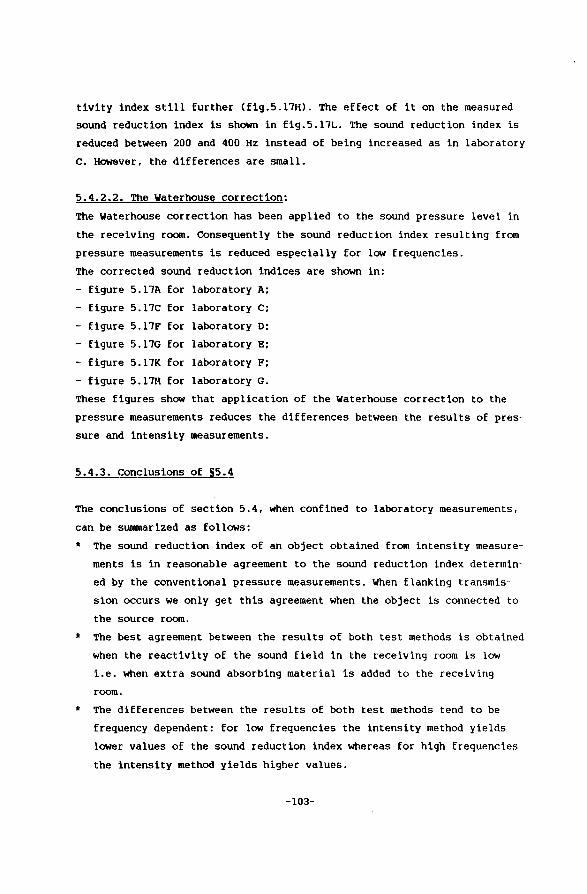
tivity index still further (fig.5.11H). The effect of it on the measured
sound reduction index is shown in fig.5.11L. The sound reduction index is
reduced between 200 and 400 Hz instead of being increased as in laboratory
c. However, the differences are small.
5.4.2.2. The Waterhouse correction:
The Waterhouse correction has been applied to the sound pressure level in
the receiving room. Consequently the sound reduction index resulting from
pressure measurements is reduced especially for low frequencies.
The corrected sound reduction indices are shown in:
- figure 5.11A for laboratory A;
- figure 5.11C for laboratory C;
- figure 5.11F for laboratory D;
- figure 5.11G for laboratory E;
- figure 5.11K for laboratory F;
- figure 5.11M for laboratory G.
These figures show that application of the Waterhouse correction to the
pressure measurements reduces the differences between the results of pres-
sure and intensity measurements.
5.4.3. Conclusions of §5.4
The conclusions of sectien 5.4, when confined to laboratory measurements,
can be summarized as fellows:
* The sound reduction index of an object obtained from intensity measure
ments is in reasonable agreement to the sound reduction index deterlnin
ed by the conventional pressure measurements. When flanking transmis
ston occurs we only get this agreement when the object is connected to
the souree room.
* The best agreement between the results of both test methods is obtained
when the reactivity of the sound field in the receiving room is low
i.e. when extra sound absorbing material is added to the receiving
room.
* The differences between the results of both test methods tend to be
frequency dependent: for low frequencies the intensity method yields
lower values of the sound reduction index whereas for high frequencies
the intensity method yields higher values.
-103-
* The differences between the results of both test methods can be reduced
by applying the waterhouse correction to the results of the convention
al measurements i.e. to the sound pressure level in the receiving room.
* The sound reduction index obtained from intensity measurements depends
on the measuring direction especially when flanking transmission cannot
be neglected. Then lower values are obtained for the direction at which
the object is connected to the souree room.
* The conneetion between the value of the reactivity index and the diffe-
rences between the results of both test methods is not clear yet but
values of the reactivity index larger than 10 dB should be avoided.
From these conclusions we give some recommendations:
* In future measuring procedures concerning the use of intensity measure
ments in laboratory sound insulation measurements, the measuring direc
tion and the character of the sound field in the receiving room should
be prescribed too.
* The Waterhouse correction should be applied to laboratory sound insula
tion measurements: the ISO standards concerning laboratory airborne and
impact sound insulation measurements should be modified.
5.5. Comparison of the precision of the conventional method with the pre
cision of the intensity method
Here we shall deal with a comparison of five tests for each test method
performed on the middleweight wall in one measuring direction i.e. the di
rection at which the wall is connected to the souree room.
5.5.1. The average sound reduction index m
The laboratory average yi obtained from five pressure measurements in
one measuring direction is shown in fig.5.18A for each laboratory.
Fig.5.18B shows the laboratory averages yii obtained from five intensity
measurements. Both figures give an indication of the reproducibility of
the test methods. Apart from the usual rather large variations in the la
boratory averages yi at the low frequencies also an unusual large varla
tion at the midfrequencies and the high frequencies can be observed. At
-104-
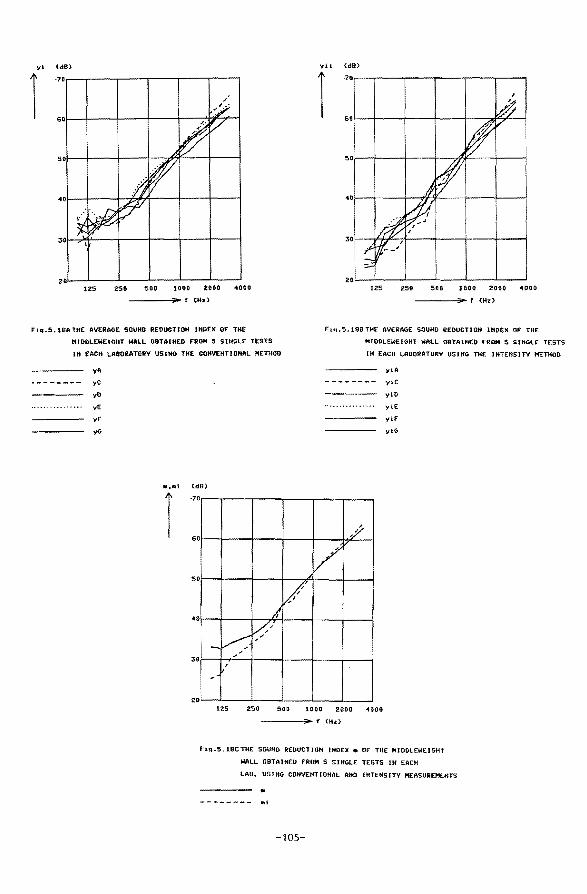
•• <dB) ... <dB)
1 ·7
6
0
' :/ ' 0
IJ V 1
~Or--,---T---,----~-~r----,
0
~ jj
5
0
~ ~ \.:~ r
3 0 \
0 125 250 500 1000 2GGO 4000 125 250 500 1000 2000 olfOOO
----.;;o.f (Hz) ----.;;o.f CH<l
Fl~.5.18ATHE Alll':RAGE SOUND REOUCTIOH IIIDEX OF THE
MIDOLEWEIGHT WALL OSTAIHtD f'ROM 5 SIHGU:: TESTS
lH EACH LABORATORV USIIIG T11E COHYEHTIOIIAL METHOD
Fiq.5~1BBTHE AVERAGE SOUHD REOUCTIOH IHDEX OF THE
,.tlODLE:WElGHT WAl..L 08TAIKEO f"RQM S SIHGt.E TESTS
IK EACH LABORATORV USIHG THE IHTEHSITY fllt:THOD
yA
~------- yC
--·--- yO ......•••• ,,.... yE
yF
yG
.,lni
1
ylA
-------- yiC
--·---- yiO ................ yi.E
y!F
yiG
(dB)
·7 0
6 0 ~f'
V 5 0
l/' o A
i I __..~' J-V>'
125 250 500 1000 2000 4000
----.;;o.f (Hz)
Flg~S.lSCTHE SOUHO REDUCTtOH !HDEX • OF THE JlllOtilEWtJGHT
WALL OBTAtNED FROM S SIHGLE TESTS lH EACH
LAB, USIHG COIIYEHTIOHAL AIID IHTEHSITV MEASUREMEHTS
-------- Mi
-105-
first sight the variations in y1 resulting from both test methods do not differ much.
In fig.5.18C the average sound reduction index m resulting from the pres
sure measurements is compared with the average sound reduction index mi
obtained from intensity measurements. This figure shows the same charac
teristics as those mentioned in §5.4: for frequencies below 500 Hz the in
tensity technique yields lower va1ues of the sound reduction index whereas
for frequencies above 500 Hz the two curves do not differ much.
In the figures 5.19 the laboratory average y11
is compared with m for
each laboratory separately concerning the intensity measurements. These
figures resemble the fig.5.5 where the same presentation is given for the
pressure measurements. The effect of different edge conditions is shown in
about the same way as in fig.5.5 except for the results of the intensity
measurements in laboratory c (fig.5.19B). For this laboratory the diEfe
renee between the laboratory average yi and the average m is 1arger for
the intensity measurements than for the pressure measurements. As discuss
ed in §5.4 this may be caused by a high reactivity of the sound field in
the receiving room.
In table 5.22 the laboratory averages yi and the average sound reduction
index m concerning the sing1e-number quantities Rw' RA and Rm are
given for five single pressure measurements as well as for five single in
tensity measurements. Besides, the standard deviations are given.
5.5.2. The repeatability r
In the figures 5.20A and 5.208 the repeatabilities r calculated on the ba
sis of the results of the pressure and the intensity measurements are c~
pared with the reference curves of ISO 140/II and ISO/TC-43/SC-2-N-267.
The repeatability r concerning the pressure measurements exceeds the reEe
renee curves at 400 and 500 Hz and from 700 to 1600 Hz. In table 5.23a the
standard deviation of the pressure measurements is given as a function of
frequency for each laboratory. It can be compared to the value of Sr'
the square root of the repeatability variance.
The repeatability determined Erom the results of the intensity measure
ments exceeds the reEerenee curves at 100 Hz, 400 Hz. 800 Hz and 1000 Hz
(fig.5.20B). The standard deviations of the results of the intensity mea-
-106-
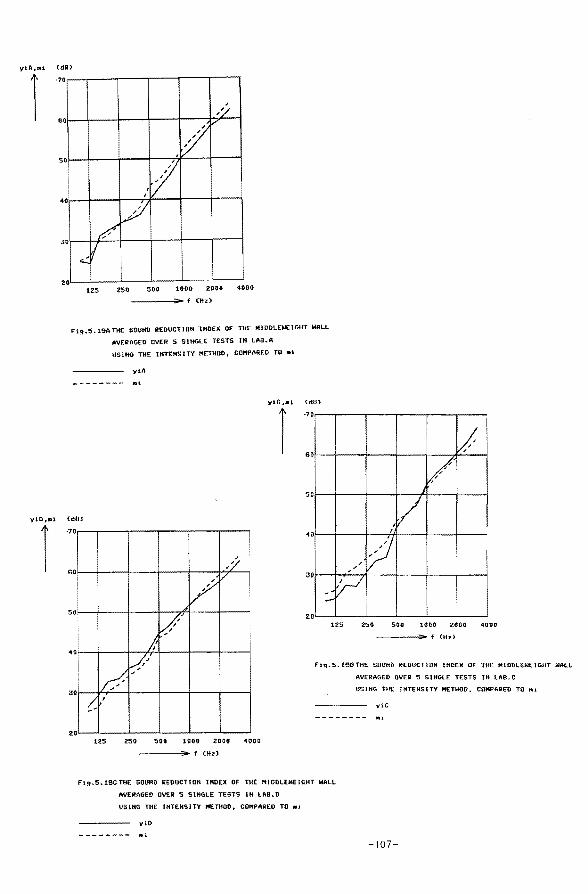
(d9)
·7 0
0
5 0
0
0
0
,;
,/V
"V ? / i
...:: V I
lZS 250 500 1000 2000 4000
------f (ltz)
fi9~5.19ATHE SOUHO REDUCTIOtt -lHDEX OF THE MIDDLEW(JGHT WALL
AVERAGED OVER S SltiGlE TESTS lH LAB .. A
USIHG THE lHTEHSlTY MElltOO, COMPAREO TO •i
ytA
yiC 1 rU. CdBl
·7 0
6 0
5 0
I V /
yiO,aJ. (dBl ,V 1
·70
I ;;• ' I
/V I
60
0 I
;) i
J J
J 0
y-1 :..
/' 50
0 2 125 250 500 10110 201}0 4000
----.;;o-f CHzl
o· i' V/
30
0
,d r;J
(.'
125 250 500 1000 2000 1000
----.;;.. f (Hzl
Fiq~S~ 199 THE SOUNO REDUCTlDH IHDEX OI' THE I"'IDDLEWEIGHT WALL
AVERAGEO OVER 5 S1H:GLE TESTS IH LAB.C
USHiG THE JHTEKSITV "ETHOO. COI"'PAR:EO TO nti
yiC
n,..S.19CTH( SOUHO REOUCTIO!I I!IOEX OF THE I'IIOOLEWE!GHT WALL
AVERAGED OVER '5 SittGLE TESTS lH LAB~D
USIHG THE IMTEHSITY METHOD. COMPARED TO •i
y10
-------- •!.
-107-
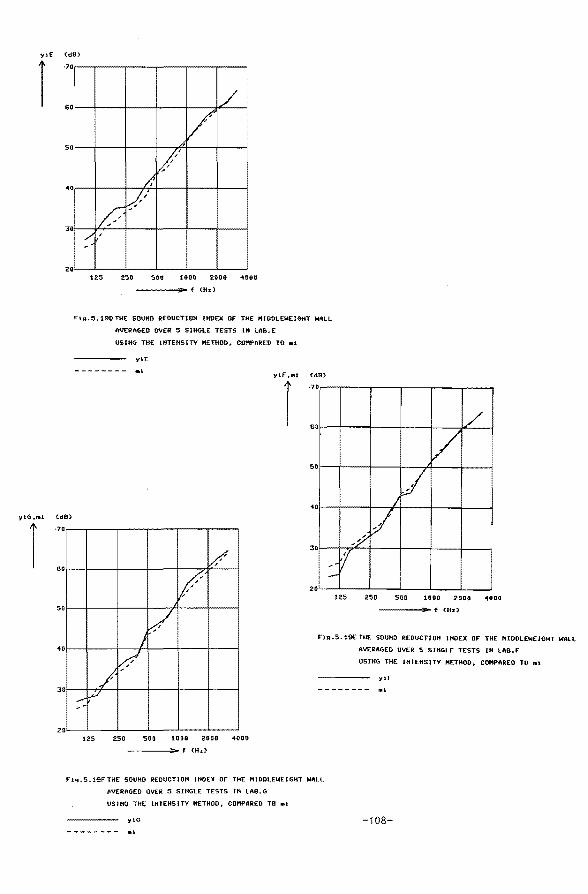
yiE (d8)
·7
s
3
OI
0
Q
Q
Q
/
/ A v,t'
// ll
./' ~
125 250 500 1000 2:000 4000
----.;o.f (Hz)
Fig.5.190THE SOUHD RE.DUCTlOM !HOEX OF THE "lDOt..EWEIG'HT WALL
Avt:RAGED OVER 5 Slt+Gl..E TESTS lH LAB. E
USHiG THE IHiENSITY METHOD. CO,.PAREO TO •1
ylE
-------- •i yiF ~lf'l (dB)
1
125 250 500 1000 2008 4000
----..;;o-f {Hz)
fl~,.S.19€ THE SOUHD REDUCTJOH IHOEX OF THE PIIODLEWEIGHT WAlt
AVERAGEO OVER 5 SIHGLE TESTS lH LAB.F
125 250 soo 1000 2000 4000
F1~.5.19f'TH'( SOUHt) REOUCTIOH IHDEX OF lHE l"tlDOLEWEIGHT WAlL
AVERAGED OVER 5 SIHGLE TESTS 1H LAB.G
USIHG TH( IHTEHSITV "ETHOO. COI"'PAREO TO •l
ylG ....... ______ Jlti
USING THE tHTEHStTV METHOD. COf!tpAREO TO ai
yiF
Ml
-108-
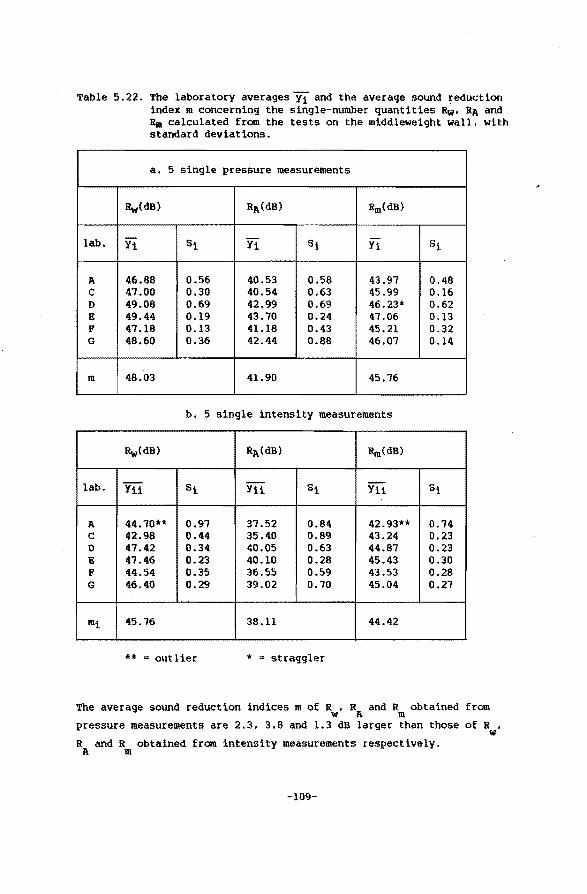
Table 5.22. The laboratory averages Yi and the average sound reduction index m concerning the single-number quantities Rw• RA and Rm calculated from the tests on the middleweight wall, with standard deviations.
a. 5 single pressure measurements
Rw(dB) RA(dB) Rm(dB)
lab. Yi St Yi si Yi St
A 46.88 0.56 40.53 0.58 43.97 0.48 c 47.00 0.30 40.54 0.63 45.99 0.16 D 49.06 0.69 42.99 0.69 46.23* 0.62 E 49.44 0.19 43.70 0.24 47.06 0.13 F 47.16 0.13 41.18 0.43 45.21 0.32 G 48.60 0.36 42.44 0.88 46.07 0.14
m 48.03 41.90 45.76
b. 5 single intensity measurements
RA(dB) Rm(dB)
Yii St Yii si
A 44.70** 0.97 37.52 0.84 42.93** 0.74 c 42.98 0.44 35.40 0.89 43.24 0.23 D 47.42 0.34 .;o.o5 0.63 44.87 0.23 E 47.46 0.23 40.10 0.28 45.43 0.30 F 44.54 0.35 36.55 0.59 43.53 0.28 G 46.40 0.29 39.02 0.70 45.04 0.27
mi 45.76 38.11 44.42
** = outlier * = straggler
The average sound reduction indices m of Rw' RA and R111
obtained from
pressure measurements are 2.3, 3.8 and 1.3 dB larger than those of Rw'
R and R obtained from intensity measurements respectively. A 111
-109-
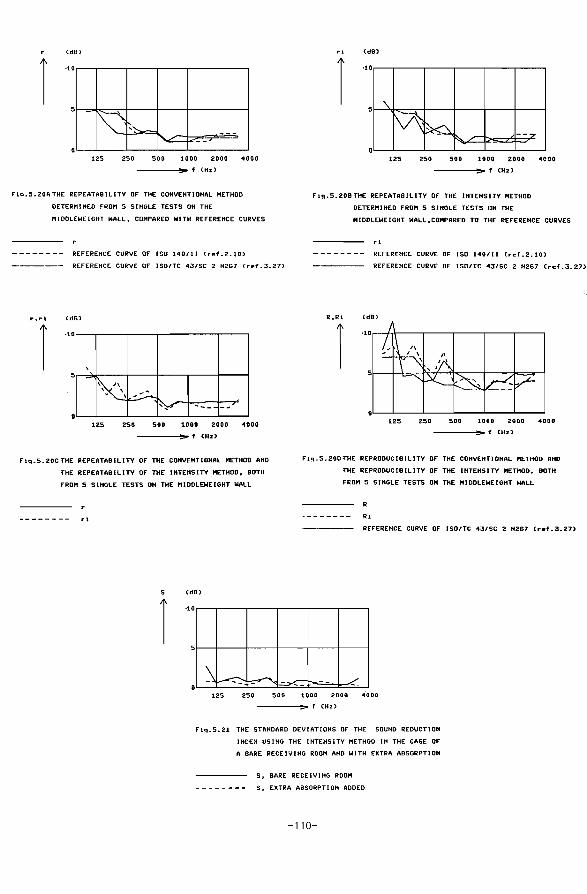
(dB)
0
V -·~ ---"-- ~-0
125 250 500 1000 2000 4000
----~f (Hz)
Fi~.5.20ATHE REPEATABILITV OF THE COHVEHTIOHAL METHOO
DETERM I HEO FROM 5 SI HGLE TESTS OH THE
MIOOLEWEIGHT WALt~ COI"'PARED WITH REFEREHCE CURVES
REFEREHCE CURVE OF ISO 140/11 Cri!!f.2.10l
REFEREHCE CURVE Of ISO/TC 43/SC 2 H267 (ref. 3. 27>
r,ri (dB)
·10
' 5
\(' ' ~:.:... ' ~ , __ --
0 125 250 500 1000 2000 4000
----~f CHz)
fi~.S.20C:rHE REPEATABILITV OF THE COHVEHTIOHAL I"'ETHOD AHD
iHE REPEATABILITY Of THE IHTEHSITV METHOD, BOTH
FROM 5 SIHGLE TESTS OH THE MIDDLEWEIGHT WALL
-------- rl
(dB)
125 250 500
.. (dBJ
·1 0
5 " ~ ~ --?
"" -0
125 250 500 1000 2000 4000
----~f (Hz)
F1~.5.20B=F"HE REPEATABILITY Of THE IHTEHSITY METHOO
DETERMIHED FROM 5 SINGLE TESTS OH THE
R,Ri
MIDDLEWEIGHT WALL,COMPARED TO THE REFEREHCE CURVES
.. REFEREHCE CURVE OF ISO 140/ll (ref.2.10)
REFEREHCE CURVE OF ISO/TC 43/SC 2 H267 Cref.3.27>
CdBJ
125 250 500 1000 2000 4000
----~f CHz)
f1~.5.200:rHE REPRODUCIBILITV OF THE COHVEHTIOHAL METHOO AHD
iHE REPRODUCIBILITV OF THE IHTEHSITY METHOD, BOTH
FROM 5 SIHGLE TESTS OH THE MIDDLEWEIGHT WALL
·------- Rt
·---- REFEREHCE CURVE OF ISO/TC 43/SC 2 H267 Cref. 3. 27)
tooo 2ooo 4ooo ----~f (Hz>
Fiq.5.21 THE STAHOARO OEVIATIOHS OF THE SOUHO REDUCTIOH
1 HDEX US I HG THE 1 HTEHS ITV I'IETHOO I H THE CASE OF
A BARE RECE I \/I HG ROOM AHO W I TH EXTRA ABSORPT I OH
S~ BARE RECEIVIHG ROOPI
-------- 5, EXTRA ABSORPTIOH AOOEO
-110-
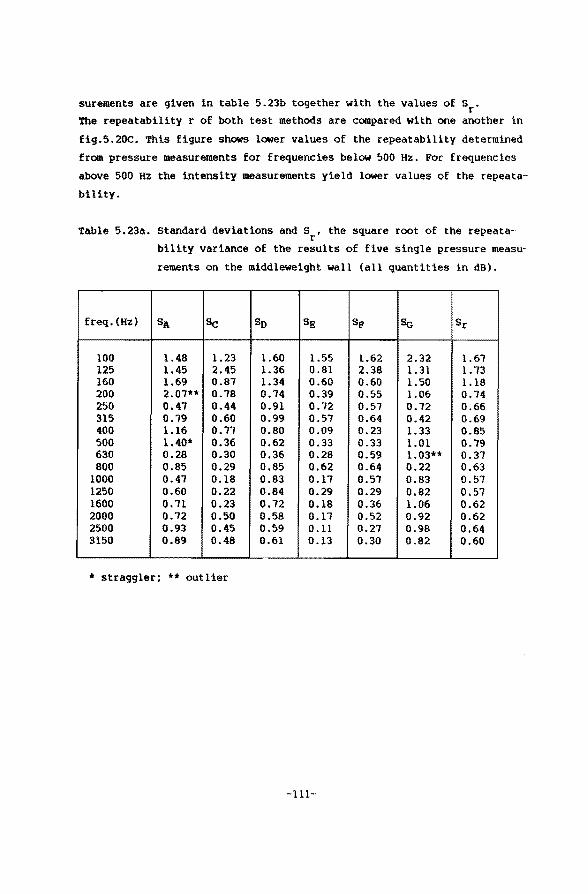
surements are given in table 5.23b together with the values of Sr.
The repeatability r of both test methods are compared with one another in
fig.5.20C. This figure shows lower values of the repeatability determined
from pressure measurements for frequencies below 500 Hz. For frequencies
above 500 Hz the intensity measurements yield lower values of the repeata
bility.
Table 5.23a. Standard deviations and Sr, the square root of the repeata
bility varianee of the results of five single pressure measu
rements on the middleweight wall (all quantities in dB).
freq. (Hz) SI%. se so SE SF % Sr
100 1.48 1.23 1.60 1.55 1.62 2.32 1.61 125 1.45 2.45 1.36 0.81 2.38 1.31 1.73 160 1.69 0.81 1.34 0.60 0.60 1.50 1.18 200 2.01** 0.18 0.14 0.39 0.55 1.06 0.14 250 0.47 0.44 0.91 0.72 0.57 0.72 0.66 315 0.79 0.60 0.99 0.57 0.64 0.42 0.69 400 1.16 0.71 0.80 0.09 0.23 1.33 0.85 500 1.40* 0.36 0.62 0.33 0.33 1.01 0.79 630 0.28 0.30 0.36 0.28 0.59 1.03** 0.31 800 0.85 0.29 0.85 0.62 0.64 0.22 0.63
1000 0.41 0.18 0.83 0.11 0.57 0.83 0.51 1250 0.60 0.22 0.84 0.29 0.29 0.82 0.51 1600 0.71 0.23 0.72 0.18 0.36 1.06 0.62 2000 0.72 0.50 0.58 0.11 0.52 0.92 0.62 2500 0.93 0.45 0.59 0.11 0.21 0.98 0.64 3150 0.89 0.48 0.61 0.13 0.30 0.82 0.60
* stragg1er: ** outlier
-lll-
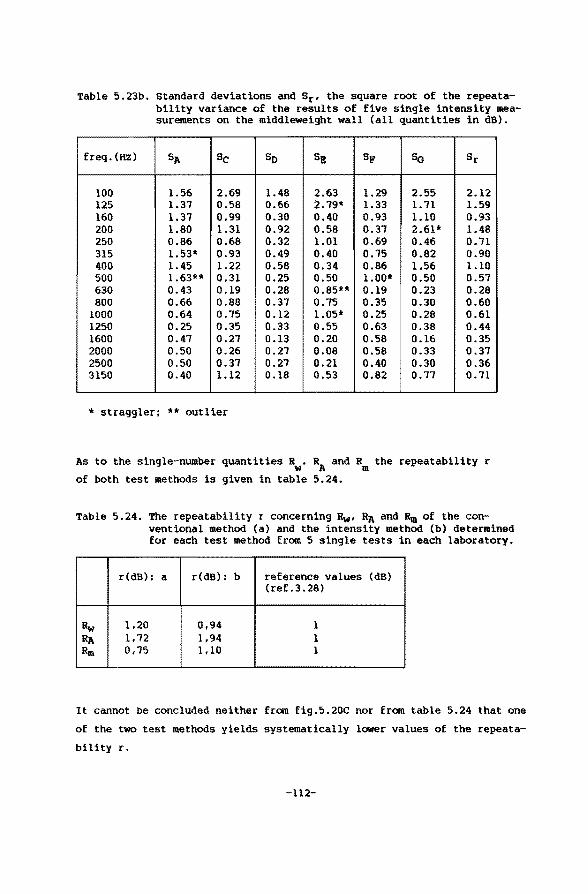
Tab1e 5.23b. standard deviations and Sr• tbe square root of the repeatabi1ity varianee of the results of five single intensity measurements on tbe middleweight wall (all quantities in dB).
freq. (Hz) SA se so Sg I SF sa Sr
100 1.56 2.69 1.48 2.63 1.29 2.55 2.12 125 1.31 0.58 0.66 2.19* 1.33 1.11 1.59 160 1.31 0.99 0.30 0.40 0.93 1.10 0.93 200 1.80 1.31 0.92 0.58 0.31 2.61* 1.48 250 0.86 0.68 0.32 1.01 0.69 0.46 0.11 315 1.53* 0.93 0.49 0.40 0.15 0.82 0.90 400 1.45 1.22 0.58 0.34 0.86 1.56 1.10 500 1.63** 0.31 0.25 0.50 1.00* 0.50 0.51 630 0.43 0.19 0.28 0.85** 0.19 0.23 0.28 800 0.66 0.88 0.31 0.15 0.35 0.30 0.60
1000 0.64 0.15 0.12 1.05* 0.25 0.28 0.61 1250 0.25 0.35 0.33 0.55 0.63 0.38 0.44 1600 0.41 0.21 0.13 0.20 0.58 0.16 0.35 2000 0.50 0.26 0.21 0.08 0.58 0.33 0.31 2500 0.50 0.31 0.21 0.21 0.40 0.30 0.36 3150 0.40 1.12 0.18 0.53 0.82 0.11 o. 71
* straggler: ** outlier
As to the sing1e-number quantities ~· RA and Rm the repeatability r
of both test methods is given in table 5.24.
Tab1e 5.24. The repeatabi11ty r concerning Rw• RA and Rm of the conventiona1 metbod .(a) and tbe intensity metbod (b) determined for each test metbod from 5 single tests in each laboratory.
r(dB): a r(dB): b reference values (dB) ( ref.3. 28)
Rw 1.20 0,94 1 RA 1,12 1,94 1 Rm 0,15 1,10 l
It cannot be conc1uded neither from fig.5.20C nor from tab1e 5.24 tbat one
of the two test methods yie1ds systematica1ly lower values of the repeata
bility r.
-112-
In laboratory c tbe serie of five intensity measurements bas been repeated
after the addition of a large amount of absorption material in the reeei
ving room resulting in lower values of tbe reactivity index (fig.5.17E).
The standard deviations of the results from tbis serie are compared with
tbose of the first serie in fig.5.21. It shows that tbe reduction of tbe
reactivity of tbe sound field in the receiving room does not affect the
standard deviations very much, except perhaps for frequencies below 400
Hz. In this frequency region the reactivity index is lowered beneath 10 dB
as a result of tbe extra absorption material.
5.5.3. The reproducibility R
The reproducibility R concerning the pressure as well as the intensity
measurements is shown in fig.5.20D together with tbe reference curve from
ISO/TC-43/sc-2-N-267. The reference curve is exceeded for most frequen
cies. This is the case for both test methods. The reproducibility concer
ning the pressure measurements only meets the requirements at 160, 200,
250, 315 and 1000 Hz whereas the reproducibility as to tbe intensity mea
surements agree with the reference values only at 160, 1000 and 2500 Hz.
It seems logical tbat tbe reproducibility of the intensity measurements
does not differ much from the reproducibility of the pressure measure
ments. This might be explained as follows.
From the definition of the reproducibility R (eq.3.12) we see tbat it is 2 calculated from tbe repeatability varianee S and the between-labora-
2 r toryvarianee SL. Firstly, the repeatabilities of botb test metbods
have about the same value (fig.5.20C) and from ~q.3.ll so do the repeata
bility varianees of the two methods. Seeondly, the between-laboratory va-·
rianee is determined by tbe properties of the transmission suites and
sbould not depend on the test metbod ehosen.
The peaks of the repeatability r of the intensity measurements at 200 and
400 Hz lead to peaks in the reprodueibility of the intensity measurements
at tbe same frequencies.
We may conelude tbat under tbe eonditions of this investigation tbe inten
sity teehnique does not yield a better reprodueibility. one migbt eonsider
tbe reproducibility of tbe conventional metbod as being sligbtly better.
This is confirmed by the reproducibility eoncerning tbe single-number
quantities as shown in table 5.25.
-113-
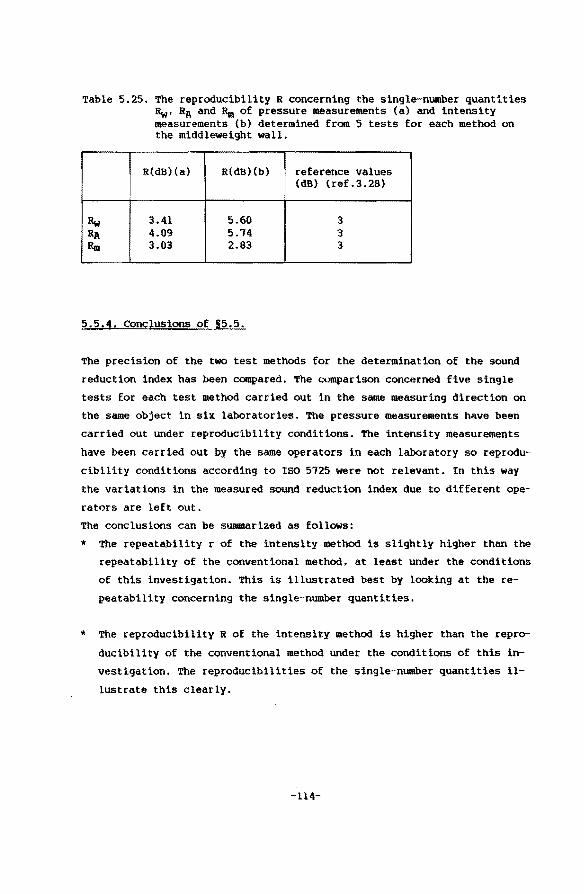
Table 5.25. The reproducibility R concerning the single-number quantities Rw• RA and Rm of pressure measurements (a} and intensity measurements (b} determined from 5 tests for each metbod on the middleweight wall.
R(dB){a) R(dB)(b) reference values (dB) (ref.3.28)
Rw 3.41 5.60 3 RA 4.09 5.14 3 Rm 3.03 2.83 3
5.5.4. Conclusions of S5.5.
The precision of the two test methods for the determination of the sound
reduction index has been compared. The comparison concerned five single
tests for each test method carried out in the same measuring direction on
the same object in six laboratories. The pressure measurements have been
carried out under reproducibility conditions. The intensity measurements
have been carried out by the same operators in each laboratory so reprodu
cibility conditions according to ISO 5125 were not relevant. In this way
the variations in the measured sound reduction index due to different ope
rators are left out.
The conclusions can be summarized as follows:
* The repeatability r of the intensity metbod is slightly higher than the
repeatability of the conventional method, at least under the conditions
of this investigation. This is illustrated best by looking at the re
peatability concerning the single-number quantities.
* The reproducibility R of the intensity metbod is higher than the repro
ducibility of the conventional method under the conditions of this in
vestigation. The reproducibilities of the single-number quantities 11-
lustrate this clearly.
-114-
* The results of the intensity measurements show the same characteristics
as the results of the pressure measurements as to the effects of diffe-,
rent edge conditions, etc.
* The sound reduction index obtained from intensity measurements is
smaller than the sound reduction index obtained from pressure measure
ments. Bspecially When the reactivity index of the sound field in the
receiving room is large, differences of 2 or 3 dB can occur between the
results of the two test methods concerning the single-number quanti
ties.
-115-
LITERATURE
Chapter 1
1.1. Regulations for calculating and measuring traffic noise (in Dutch),
as meant in clause 102 of the Noise Ahatement Law. Government Pub
lisher, The Hague. May 1981.
1.2. Guide for calculating and measuring railway traffic noise (in
Dutch). Publication of the Office of Environmental Control, Section
Acoustics. August 1984.
1.3. Decree for noise control in buildings (in Dutch); execution of ciau
se 3 of the Housing Act. Statute-book, nr.155, 1982.
1.4. Regulations for calculating and measuring noise exposure levels in
buildings (in Dutch). Official Gazette, nr.228, November 1982.
1.5. Gerretsen, E.:
Noise reduction by facades: calculation method (in Dutch). Pu
b1ication of the Interministerlal Committee on Noise Abatement.
WG-HR-05-02, August 1982.
1.6. Gerretsen, E.:
Calculation of airborne and impact sound insulation (in Dutch).
Report nr.001.101/2 of the Institute of Applied Physics, Decem
ber 1982.
1.1. Regulations for calculating and measuring noise levels, concerning
chapter V and clause 13 of the Noise Ahatement Law (in Dutch). Go
vernment Publishers, The Hague, August 1982.
1.8. Guide for measuring and calculating industrial noise (in Dutch). Pu
blication nr.IL-HR-13-01 of the Interministerlal Committee on Noise
Abatement. March 1981.
-116-
1.9. Gerretsen, E.:
Chapter 2
Emission of sound by walls and buildings - a calculation method
(in Dutch). PUblication nr.IL-HR-13-02 of the Interministerlal
committee on Noise Abatement. September 1982.
2.1. Test methods in acoustics (in Dutch). Report nr.l of the Acoustics
Committee TNO, 1946.
2.2. Twenty-five years Institute of Applied Physics TNO 1941-1966 (in
Dutch). TNQ-pub1ication, 1966.
2.3. Bruijn, A.de:
Fifty years of Acoustics in The Netherlands (in Dutch). Jubilee
publication OQ the occasion of the 50th anniversary of the
Acoustics Institution I Dutch Acoustica1 Society: 1934-1984.
Publication nr.73 of the Dutch Acoustical SOCiety. October '84.
2.4. Wi1ligers. L.H.J.:
Private Communication, 1986.
2.5. Cremer, L.:
Theorie der Schalldämmung dünner Winde bei schragem Einfal1.
Akustische Zeitschrift, Drittes Heft 7.Jahrgang, Mai 1942.
2.6. ISO R/140-1960: Field and 1aboratory measurements of airborne and
impact sound transmission. January 1960.
2.7. Myncke, H.:
Structural aspects of the new acoustical test facilities of the
Catholle University at Leuven (in Dutch). Het Ingenieursblad,
nr.21, November 1967.
-117-
2.8. Martin, H.J.:
The design of the acoustical transmission rooms at the Faculty
of Architecture and Building Technology at Eindhoven University
of Technology (in Dutch). Publication nr.63 of the Dutch Acous
tica1 Society. May 1982.
2.9. ISO 140/I-1918: Acoustics - Measurement of sound insulation in buil
dings and of building elements. Part I: Requirements for laborato
rles.
2.10. ISO 140/II-1918: Acoustics Measurement of sound insulation in
bui1dings and of building elements. Part II: Statement of precision
requirements.
2.11. ISO 140/III-1918: Acoustics Measurement of sound insulation in
buildings and of building elements. Part III: Labaratory measure
ments of airborne sound insulation of building elements.
2.12. ISO 140/IV-1918: Acoustics- Measurement of sound insu1ation in
buildings and of building elements. Part IV: Field measurements of
airborne sound insulation between rooms.
2.13. ISO 140/V-1918: Acoustics Maasurement of sound insulatlon in bull
dings and of bullding elements. Part v: Field measurements of air
borne sound insulation of facade elements and facades.
2.14. ISO 140/VI-1918: Acoustics- Measurement of sound insulation in
buildings and of building elements. Part VI: Labaratory measurements
of impact sound insulation of floors.
2.15. ISO 140/VII-1918: Acoustics- Measurement of sound insulation in
buildings and of building elements. Part VII: Field measurements of
impact sound insulation of floors.
-118-
2.16. ISO 140/VIII-1978: Acoustics - Measurement of sound insulation in
buildings and of building elements. Part: VIII: Laberatory measure
ments of the reduction of transmitted impact noise by floor cove
rings on a standard floor.
2.17. ISO 140/IX-1978: Acoustics- Measurement of sound insulation in
buildings and of building elements. Part IX: Laberatory measurements
of the room to room airborne sound insulation of a suspended ceiling
with & plenum above it.
2.18. Gade, s.:
sound Intensity (Part 1: Theory). Brüel & Kjaer Technica! Re
view. nr.3 1982.
2.19. Lambert, J.M., et.al.:
La mésure directe de l'intensite acoustique. CETIM-information,
nr.53 (1977).
2.20. Fahy, F.J.:
Measurement of acoustie intensity using the cross--speetral den
sity of two microphone signa1s. J.Acoust.soc.Am.62, 1etter-to
the-editor. {1977).
2.21. Chung, J.Y.:
cross-Speetral method of measuring acoustic intensity. Research
Pub1ication. General Motors Research Laboratories, GKR-2617,
Warren, MI, USA (1977).
2.22. Chung, J.Y.:
Fundamental aspeets of the cross-speetral method of measuring
acoustic intensity. International congress on recent develop
ments in acoustic intensity measurements. CETlM senlis, Frank
rijk. September/oktober 1981.
2.23. ISO 717/l-1982: Acoustics - Rating of sound insulation in buildings
and of building elements. Part I: Airborne sound insulation in buil
dings and of interlor building e1ements.
-119-
2.24. NEN 20140-3: Measurement of sour~ insulation in buildings and of
building elements. Labaratory measurements of airborne sound insula
tion of building elements (in Dutch). Draft National Standard, First
Issue, November 1984.
2.25. ANSI/ASTM-E-336-11: Standard test metbod for measurement of airborne
sound insulation in buildings.
2.26. ASTM-E-413-13: Standard classification for determination of sound
transmission class.
2.27. DIN 52210/2-1981: Bauakustische Prüfungen. Luft- und Trittschall
dämmung. Prüfstände für Schalldamm-messungen an Bauteilen.
3.1. Gössele, K.:
Uber Prüfstände zur Messung der Luftschalldämmung von Wände und
Decken. Acustica, vol.l5, 1965.
3.2. Kihlman, T.; Nilsson, A.C.:
The effects of some laboratory designs and mounting conditions
on reduction index measurements. Journal of sound and Vibra
tion, 23(3), 349-364, 1912.
3.3. Gilbert, J.C.:
Der Einfluss einer tiefen Nische auf das im Labor gemessene
Schalldämm-mass. DAGA 1981, Berlin.
3.4. Gilbert, J.C.:
The effect of a deep niche on the laboratory measured sound re
duction index. University of California, Berkeley. 1919.
3.5. Michelsen, N.:
The effects of laboratory design on the measured sound reduc
tion index. FASE-congress Dubrovnik, 1979.
-120-
3.6. Kichelsen, N.:
The effects of laboratory design on the measured sound reduc
tion index. Danish Acoustical Laberatory Report. nr.18, 1919.
3.1. Cremer, L.; Heckl, K.:
Körperschal1. Springer-Verlag Berlin/Heidelberg/Heckl, M. New
York. 1967.
3 . 8 • Goydke , H. : Koch, S. : Keche 1, F. P. ; Raabe , G. :
Untersuchungen über Einflüsse auf die Schalldämmmasse von Fen
stern und Scheiben in Prüfstände. Acustica, vol.56, 1984.
3.9. Kihlman, T.:
sound radlation into a rectangular room. Application to airbor
nesound transmission in buildings. Acustica, vo1.18, 1967.
3.10. Nilsson, A.C.:
Reduction index and boundary conditions for a wall between two
rectangular rooms. Part 11: Expertmental results. Acustica,
vol.26, 1972.
3.11. Heckl, K.; Seifert, K.:
Untersuchungen über den Einfluss der Eigenresonanzen der Kess
räume auf die Ergebnisse von Schalldamm-Messungen. Acustica,
vol.8. 1968.
3.12. Bhattacharya, K.: Guy, R.W.:
The influence of the measuring facility on the measured sound
insulation property of a panel. Acustica, vol.26, 1912.
3.13. Guy, R.W.; Kulholland, K.A.:
Some observations on employing a panel' s cill and reveal to en
hance noise reduction. Applied Acoustics, 12, 377, 1979.
3.14. Guy, R.W.:
The transmission of sound through a cavity backed window, sill
and reveal configuration. Acustica, vol.48, 1981.
-121-
3.15. Guy, R.W.; Sauer. P.:
The inf1uence of si1ls anà reveals on sound transmission loss.
Applied Acoustics, 11, 453, 1984.
3.16. Guy, R.W.; De Mey, A.; sauer, P.:
The effect of some pbysical parameters upon tbe 1aboratory mea
surements of sound transmission loss. Applied Acoustics, 18,
81-98, 1985.
3.17. crocker, M.J.; Raju, P.K.; Forssen, B.:
Maasurement of transmission 1oss of panels by tbe direct deter
mination of transmitted acoustic intensity. Noise control En
gineering. July/August, 1981.
3.18. crocker, M.J.; Forssen, B.; Raju, P.K.; Wang, Y.S.:
Application of acoustic intensity measurement for tbe eva1ua
tion of transmission loss of structures International congress
on recent development in acoustic intensity measurements. CE
TIM. Senlis, Fxankrijk. september/October 1981.
3. 19. cops, A. :
Comparative study between tbe acoustic intensity metbod and tbe
conventional two-room method to calcu1ate tbe sound transmis
sion loss of panels and walls. Internoise, Honolulu, USA. 1984.
3.20. Cops, A.; Minten, M.; Myncke, H.:
Influence of the design of souna transmission rooms on the
sound transmission loss of glass. A comparative study between
the new intensity metbod and the conventional two room metbod
(in Dut eh).
Katholieke Universiteit Leuven. Rapport van het laboratorium
voor Akoestiek en Warmtegeleiding (België). March 1985.
-122-
3.21. Hinten, M.:
Comparison of the conventional two-room method and the intensi
ty method for the determination of sound insulation of building
elements (in Dutch). Katholieke Universiteit Leuven (België).
Rapport van het Laboratorium voor Akoestiek en Warmtegel~iding,
1983.
3.22. cuvelier, M.:
Comparison of the conventional two-room method and the intensi
ty method for the determination of the sound insulation of
glass (in Dutch). Katholieke Universiteit Leiven (België). Rap
port van het Laboratorium voor Akoestiek en Warmtegeleiding,
1984.
3.23. Halliwell, R.E.; Warnock, A.C.C.:
Sound transmission loss. Comparison of conventional techniques
with sound intensity techniques. J.Acoust.Soc.Am.11 (6), June
1985.
3.24. Waterhouse, R.V.:
lnterference patterns in reverberant sound fields. J.Acoust.
soc.Am.27 (2), March 1985.
3.25. lSO 3741-1975: Acoustics Determination of sound power levels of
noise sources. Precision methods for broadband sourees in reverbera
tion rooms.
3.26. lSO 3534: statistles vocabulary and symbols.
3.27. ISO/TC-43/sc-2-N-267: Second working draft of ISO 140/II. June 1980.
3.28. ISO/TC-43/SC-2-N-379: seventh working draft of lSO 140/rr June 1985.
3.29. ISO 5725-1981: Precision of test methods. Determination of repeata
bility and reproducibility by interlaboratory tests.
-123-
3.30. Bahlo-Dittmann. K.; Dammig, P.: Eisenberg, A.: Schulze, H.:
Cooperative precision experiment for determining the repeatabi
lity and reproducibility of laboratory measurements of airborne
sound insulation. DIN Dezember 1978. ISO/TC-43/sc-2-N-276.
3.31. Kristensen, B.D.: Rasmussen, B.:
Repeatability and reproducibility of sound insulation measure
ments. Nordtest Project 235-80. Danish Acoustical Institute,
report nr.ll8, 1984.
3.32. Rasmussen, B.:
Measurement of sound reduction index for glazings in a stagge
red test opening. Nordtest Project 360-82. Danish Acoustical
Institute, report nr. 119, 1984.
3.33. Jones, R.E.:
Intercomparisons of laboratory determination of airborne sound
transmission loss. J.Acoust.Soc. Am.66 (1), July 1979.
3.34. Michelsen, N.:
Repeatability of sound insulation measurements. Danish Acousti
cal Laboratory, report nr.36, 1982.
3.35. Taibo, L.; Glasserman de Dayan, H.:
Analysis of variability in laboratory sound insulation determi
nations. Journalof sound and Vibration 91(3), 319-329, 1983.
3.36. Wulfften Palthe, D.W.van:
sound power radiated
and under free field
ary 1979.
Faber, G.; Vries, D.de: ~ by a velocity monople under reverberant
conditions. J.Acoust.Soc.Am. 65(2), Febru-
-124-
Chapter 4
4.1. Martin. H.J.; Luxemburg, L.C.J.van:
Investigation concerning the influence of the properties of a
transmission suite on the results of airborne sound insulation
measurements in 8 laboratories. Part 1: Data of the participa
ting laboratorles (in Dutch). Working group FAGO-TNO-THE, re
port nr.418.234/l, April 1985.
4.2. Martin, H.J.; Luxemburg, L.C.J.van:
Investigation concerning the influence of the properties of a
transmission suite on the results of airborne sound insulation
measurements in 8 laboratories. Part 2: The niche effect (in
Dutch). Working group FAGO-TNO-THE, report nr.418.234/2, April
1985.
4.3. Martin, H.J.: Luxemburg, L.C.J.van:
Investigation concerning the influence of the properties of a
transmission suite on the resu1ts of airborne sound insu1ation
measurements in 8 1aboratories. Part 3: The test on the 1ight
weight wal1 (in Dutch). Working group FAGO-TNO-THE, report nr.
418.234/3, July 1985.
4.4. Martin, H.J.: Luxemburg, L.C.J.van:
Investigation concerning the inf1uence of the properties of a
transmission suite on the results of airborne sound insulation
measurements in 8 laboratories. Part 4: The test on the heavy
wa11 (in Dutch). Working group FAGO-TNO-THE, report nr.418.234
/4, Ju1y 1985.
4.5. Martin. H.J.; Luxemburg, L.C.J.van:
Investigation concerning the inf1uence of the properties of a
transmission suite on the results of airborne sound insulation
measurements in 8 laboratories. Part 5: The test on the middle
weight wall (in Dutch). Working group FAGO-TNO-THE, report nr.
418.234/5, August 1985.
-125-
4.6. Martin, H.J.; Luxemburg, L.C.J.van:
An evaluation of laboratory airborne sound insulation measure
ments. Belgian/Dutch Symposium on Acoustics and Noise Control,
Antwerp, December 1983.
4.1. Martin, H.J.; cornelissen, W.M.J.; vercammen, M.:
Comparison of the pressure metbod and the intensity method for
the determination of airborne sound insulation of a heavy brick
wall, carried out in 6 laboratorles (in Dutch). Eindhoven Uni
versity of Technologye, Group Physical Aspects of the Built En
vironment, report nr.85-09-A, August 1985.
4.8. Martin. H.J.; cornelissen, W.M.J.:
comparison of the pressure method and the intensity method for
the determination of airborne sound insulation of a middle
weight brick wall, carried out in 6 laboratorles {in Dutch).
Eindhoven University of Technologye, Group Physical Aspects of
the Built Environment, report nr. 85-19-A, August 1985.
4.9. Martin, H.J.:
comparison of pressure and intensity measurements during an in
sulation round robin. Lecture congress CIB-WG-51 Building
Acoustics Lissabon, July 1985.
-126-
This thesis describes an experimental investigation on the influence of
the properties of sound transmission rooms on the results of airborne
sound insulation measurements. This investigation took place in six Dutch
and two Belgian laboratories.
The transmission rooms in these laboratorles all differ in size, shape and
construction, as a result of the rather wide margins of the requirements
for these rooms.
It is known from literature that the results of airborne sound insulation
measurements on building elements may depend on the properties of the
transmission rooms. It is important to know these effects and, if possi
ble, to reduce them in view of the acoustical qualification for building
elements and the export trade.
Although test reports from different Dutch and foreign laboratorles appear
in The Netherlands, a comparative investigation has never been carried out
in DUtch laboratories, contrary to West-Germany and scandinavia.
Chapter 1 illustrates the important part played by the sound reduction in
dex of building elements in noise abatement by means of three practical
cases.
In chapter 2 a short hlstorical survey of Dutch transmission rooms (§2.2}
is foliowed by the requirements from ISO 140 forthese rooms (§2.3). These
requirements show rather wide margins for the designing of these rooms.
Two methods for determining the airborne sound insulation of building ele
ments are explained briefly in §2.4; firstly the standardized 'pressure'
method from ISO 140/Iti and secondly the non-standardized 'intensity' me
thod, both applied in the frequency range 100 •..•• 3200 Hz.
This chapter ends by introducing some single-number quantities for the
sound reduction index. These quantities are often used to formulate acous
tical requirements in building codes.
The causes which affect the results of laboratory airborne sound insula
tion measurements are explained in chapter 3. Firstly a short survey of
literature of the effects caused by the properties of the transmission
rooms is given in §3.2. secondly the discrepancy between the results of
the two test methods found by other authors is shown in §3.3.
-121-
Thirdly a metbod to determine the precision of a standard test metbod is
given in §3.4. The statistica! model from ISO 5125 for determining the re
peatability and the reproducibility of a test metbod by inter-laboratory
tests is introduced.
A summary of precision experiments concerning the standardized 'pressure' I
method carried out in West-Germany and Scandinavia concludes this lchapter.
Chapter 4 deals with the organization of the investigation, described in
this thesis. Three test objects were selected. They were used to investi
gate the effects mentioned in §3.2.
Four precision experiments according to ISO 5125 were carried out using
the three objects with respect to the standardized 'pressure' method. The
two test methods were used in each laboratory to determine the sound re
duction index of two test objects. Finally the precisions of the two test
methods were compared from measurements on one test object.
In §4.2 the participating laboratorles are described whereas in §4.3 and
§4.4, §4.5 and §4.6 the test objects and the tests are dealt with respec
tively.
In chapter 5 the results of the investigation are treated.
Two important effects were caused by the properties of the transmission
rooms (§5.2).
Firstly the so-called niche effect may cause differences in the measured
sound reduction index of as much as 10 dB for frequencies below the criti
cal frequency of the test object. It is recommended that the recommenda
tion of ISO for the central position of the object in the test opening
is hanged in order to reduce this effect.
Secondly the different edge conditions met by heavy walls in the different
laboratorles caused diEferences of as much as 4 dB in the measured sound
reduction index for frequencies around and above the critical frequency of
the test object. It is recommended that both shape and mass of the test
opening are standardized.
The results of the precision experiments (§5.3) show that the requirements
for the repeatability and the reproducibility are not met for each fre
quency band when single test results, i.e. the result of one test in one
measuring direction, are used. However, yet it is possible that the re-
-128-
quirements for the repeatability and the reproducibility concernlog the
single-number quantities are fulfilled.
When using averaged test results, i.e. the average result of two tests in
opposite measuring directions, Eor the determination of the repeatability
and the reproducibility, the reEerenee values for the repeatability can be
met in each frequency band. The reproducibility too iR improved in that
case.
It is recommended that, apart from the requirements Eor new sound trans
mission laboratories, the measuring procedure in lSO 140/UI too is stan·
dardized more firmly. A second recommendation concerns the reEerenee va
lues for the repeatability and the reproducibility of the single-number
quantities: different single-number quantities should have different reEe
renee values.
When using the intensity technique instead of the standardized pressure
method considerable discrepancies may occur (§5.4}, depending on Erequen
cy, the measuring direction and the reactivity of the sound field in the
receiving room. A rather good agreement is obtained when the test object
is connected to the souree room and the receiving room has a very small
reverberation time, i.e. made almost anechoic. For low frequencies the
discrepancies between the results of the two test methods are reduced by
applying the so-called waterhouse correction to the results of the pressu
re method.
It is recommended that in future measuring procedures concerning the in
tensity method in laboratory measurements, the measuring direction and the
character of the sound field in the receiving room are prescribed. The
need for the application of the Waterhouse correction in standardl:zed
sound insulation measurements is a second recommendation.
The comparison of the precision of the two test methods in §5.5 shows a
slightly better repeatability and reproducibility for the 'pressure' me
thod. This is illustrated best by the repeatability and the reproducibili
ty of both test methods concernlog the single-number quantities.
129-
samenvatting
Dit proefsenriEt beschrijft een experimenteel onderzoek naar de invloeden
van de eigenschappen van geluidtransmissiekamers op de resultaten van
luchtgeluidisolatiemetingen aan bouwelementen; het onderzoek is uitgevoerd
in zes Nederlandse en twee Belgische laboratoria. De transmissiekamers in
deze laboratoria zijn alle verschillend qua grootte, vorm en constructie,
als gevolg van speelruimte in de voorschriften voor deze meetkamers.
Uit de literatuur blijkt, dat de resultaten van luchtgeluidisolatiemetin
gen aan bouwelementen mede afhangen van de eigenschappen van transmissie
kamers. Het is van belang deze effecten te kennen en zo mogelijk te mini
maliseren met het oog op de toekenning van attesten aan bouwelementen en
in breder verband de export van deze bouwelementen.
Hoewel in Nederland regelmatig meetrapporten van verschillende laboratoria
verschijnen is een vergelijkend onderzoek in Nederlandse laboratoria niet
uitgevoerd, in tegenstelling tot bijvoorbeeld West-Duitsland en Scandina
vië.
In een algemene inleiding, beschreven in hoofdstuk 1, wordt de belangrijke
rol die de luchtgeluidisolatie van bouwelementen in de praktijk van de la
waaibestrijding speelt, verduidelijkt aan de hand van drie gevallen.
Hoofdstuk 2 geeft een kort historisch overzicht ~an de transmissiekamers
in Nederland (§2.2}, gevolgd door de eisen uit ISD-140 die aan deze meet
kamers worden gesteld (§2.3}. Uit deze eisen blijkt de speelruimte voor
het ontwerpen van deze meetkamers. TWee methoden ter bepaling van de
luchtgeluidisolatie van bouwelementen worden kort toegelicht in §2.4, ten
eerste de genormaliseerde 'druk'-methode uit ISO 140/III en ten tweede de
niet-genormaliseerde 'intensiteits'-methode, beide van toepassing in het
frequentiegebied 100 ...•• 3200 Hz.
Dit hoofdstuk besluit met het introduceren van enkele zogenaamde één-ge
tais-grootheden voor de luchtgeluidisolatie. Deze worden veel gebruikt om
akoestische eisen in bouwvoorschriften vast te leggen.
In hoofdstuk 3 wordt uiteengezet waardoor de resultaten van luchtgeluidi
solatiemetingen in net laboratorium kunnen worden beïnvloed.
Op de eerste plaats (§3.2} betreft dit een kort overzicht van de in ( 'i-
-130-
teratuur vermelde invloeden, veroorzaakt door de eigenschappen van de
transmissiekamers.
Op de tweede plaats {§3.3) volgt een korte opsomming van de door anderen
geconstateerde verschillen in de meetresultaten door het gebruik van de
'intensiteits'-methode in plaats van de 'druk'-methode.
Op de derde plaats {§3,4) wordt aangegeven hoe de nauwkeurigheid van een
standaard-meetmethode kan worden bepaald. Het statistische model uit ISO
5725, waarmee uit metingen aan hetzelfde object in verschillende laborato
ria de herhaalbaarheid en de reproduceerbaarbeid van de meetmethode worden
bepaald. wordt geïntroduceerd.
Tot besluit wordt een korte samenvatting gegeven van de in West-Duitsland
en Scandinavië verrichte nauwkeurigheidsonderzoeken betreffende de genor
maliseerde 'druk'-methode.
Hoofdstuk 4 beschrijft de opzet en de organisatie van het onderzoek, ver
richt in Nederlandse en Belgische laboratoria (§4.1). Drie meetobjecten
zijn geselecteerd. Met deze objecten zijn de voornaamste invloeden, ge
noemd in §3.2, onderzocht. Vier nauwkeurigheidsonderzoeken volgens de me
thode uit ISO 5125 zijn uitgevoerd met de genormaliseerde 'druk'-methode.
Tevens zijn vergelijkingen van de resultaten verkregen met de in §2.4 ge
noemde meetmethoden aan twee objecten gemaakt. Tenslotte is de nauwkeurig
heid van de beide meetmethoden onderling vergeleken.
In hoofdstuk 5 worden de resultaten van het onderzoek behandeld. De eigen
schappen van de transmissiekamers in de deelnemende laboratoria leiden tot
twee belangrijke effecten {§5.2). op de eerste plaats kan het zogenaamde
niseffect voor frequenties beneden de grensfrequentie van het meetobject
voor verschillende posities van het object in de meetopening verschillen
tot 10 dB in de gemeten luchtgeluidisolatie veroorzaken. Aanbevolen wordt
dat de voorkeur van ISO 140/III voor de centrale positie van het object in
de meetopening dient te worden gewijzigd in een eenduidig omschreven posi
tie, niet gelijk aan de centrale positie. Op de tweede plaats leiden de
verschillende randcondities die met name zware meetobjecten in verschil
lende laboratoria ondervinden tot verschillen van maximaal 4 dB voor fre
quenties rond en boven de grensfrequentie van het meetobject. Uit dit
laatste volgt de aanbeveling, dat ook de vorm en de omgevende massa van de
meetopening nader dienen te worden genormaliseerd.
-131-
Uit de resultaten van de nauwkeurigheidsonderzoeken (§5.3) blijkt dat, zo
lang een meetresultaat voortkomt uit één meting in één meetrichting, de
herhaalbaarheid en de reproduceerbaarheld niet in elke frequentieband aan
de referentiewaarden voldoen. Het blijkt echter voor te kunnen komen dat
de herhaalbaarheid en/of de reproduceerbaarheid, bepaald voor de één-ge
tals-grootheden, dan wel aan de daarvoor geldende referenti~waarden kunnen
voldoen. Ten aanzien van de herhaalbaarheid wordt wel aan de referentie
waarden voldaan, indien een meetresultaat het gemiddelde is van twee me
tingen in tegengestelde meetrichting. Ook de reproduceerbaarheld wordt
daardoor verbeterd.
Er wordt aanbevolen dat, naast de voorschriften voor de bouw van nieuwe
laboratoria, ook de voorschriften voor de meetprocedure uit ISO 140/III
dienen te worden bijgesteld. Een tweede conclusie is, dat verschillende
één-getals-grootheden verschillende referentiewaarden voor de herhaalDaar
held en de reproduceerbaarbeid dienen te hebben.
Door de intensiteitsmetbode te gebruiken in plaats van de genormaliseerde
drukmethode kunnen aanzienlijke verschillen in de meetresultaten optreden
(§5.4). Deze verschillen zijn afhankelijk van de frequentie, de meetrich
ting en de reactiviteit van het ontvangvertrek. Een redelijke overeenstem
ming tussen de resultaten van beide meetmethoden wordt bereikt wanneer het
meetobject gekoppeld is aan de zendruimte en het ontvangvertrek sterk ge
luidabsorberend is uitgevoerd tijdens de intensiteitsmetingen. Het toepas
sen van de zogenaamde Waterhouse-correctie op de resultaten van de drukme
tingen verkleint de nog resterende verschillen voor de lage frequenties.
Aanbevolen wordt dat in toekomstige meetvoorschriften voor de intensi
teitsmetingen in het laboratorium in elk geval de meetrichting en de in
richting van het ontvangvertrek voorgeschreven dienen te worden. Tevens
wordt aanbevolen dat de Waterhouse-correctie bij 'druk'-metingen moet wor
den toegepast.
Uit de vergelijking van de nauwkeurigheid van de beide meetmethoden, uit
gevoerd aan hetzelfde object onder dezelfde condities (§5.5) blijkt, dat
de genormaliseerde drukmethode een iets hogere nauwkeurigheid bezit dan de
intensiteitsmethode. Dit komt vooral tot uiting in de herhaalbaarheid en
de reproduceerbaarheld van de één-getals-grootheden.
-132-
curriculum vitae Heiko-Jan Kartin
23 januari 1941 Geboren te Winschoten.
1953-1959 Lager onderwijs te Winschoten.
1959-1960 Brugklas VHMO te Winschoten.
1960-1965 Middelbare schoolopleiding aan de Gemeentelijke HBS te
Winschoten.
1965
1965-1912
1969-·1912
25 april 1972
1912-1913
1913-heden
1914-heden
Eindexamen HBS-B.
studie voor natuurkundig ingenieur aan de Technische Hoge
school te Delft.
4e en 5e jaars werk in de onderzoekgroep hkoestiek onder
leiding van Prof.dr.ir.c.w.Kosten en Lector ir.o.w.van
WulfEten Palthe.
Doctoraal examen natuurkundig ingenieur.
Akoestisch adviseur bij het Adviesbureau voor Bouwakoes
tiek te Delft.
Wetenschappelijk medewerker, respectievelijk wetenschappe·
lijk hoofdmedewerker, respectievelijk universitair docent
in de vakgroep Fysische hspecten van de Gebouwde Omgeving
van de Afdeling der Bouwkunde, Technische Hogeschool Eind
hoven; onderwijs en onderzoek op het gebied van de bouwfy
sica.
Docent Geluidleer aan de Post·HTo-cursus Bouwfysica aan de
HTS te 's-Hertogenbosch.
-133-
S'l'BLLINGBN. BlfROiiYlNDB BEJ Hrr PIID§P'SÇHRIET:
"SOUND 'l'RIINSHESSEON ROOHS - A COHPARISON"
1. Bij luchtgeluidisolatiemetingen in het laboratorium dient het meetob
ject niet in het aidden van de meetopening geplaatst te worden: de
norm ISO 140/III dient op dit punt te worden herzien (dit proefschrift
hoofdstuk 5.2).
2. Voor de luchtgeluidisolatie van een bo~lement dient het gemiddelde
resultaat van twee qua bronpositie of meetrichting verschillende me
tingen te worden genaaen (dit proefschrift hoofdstuk 5.3).
3. Wanneer aan een bo~Melement de luchtgeluidisolatie als kwaliteitsken
lllerk wordt toegekend. dient de waarde hiervan uit het oogpunt van be
trouwbaarheid het (rekenkundig) gemiddelde van twee meetresultaten te
zijn (dit proefschrift hoofdstuk 5.3).
4. Het is bij geluidisolatiemetingen aan bo~Melementen noodzakelijk de
zogenaamde Waterhouse-correctie toe te passen {D.w.van wulfften Pal
the, G.Faber en D.de Vries 'sound power radiated by a velocity aono
pole under reverberant and under free field conditiions'. J. Acoust.
soc. ~a. 65(2), February 1979).
5. De bewering, dat het niseffect alléén in het frequentiegebied onder
de grensfrequentie optreedt, is theoretisch zwak gefundeerd (o.a. T.
Kihlman, A.C.Nilsson 'The effects of soae laboratory designs and moun
ting conditions on reduction index aeasur&lllents • , Joumal of sound and
Vibration, 24(3), 1972).
6. Het uitvoeren van nauwkeurigheidsonderzoeken in laboratoria, die k:wa
liteitskenlllerken aan toestellen of materialen toekennen, dient te wor
den gestimuleerd, ook in internationaal verband, 111et het oog op de ex
port van bedoelde toestellen en materialen.
7. Het onderwijs in de materiaalkunde aan aanstaande bouwkundig ingeni
eurs zou zeer gebaat zijn bij meer kennis van de vwo-abituriënten van
de scheikunde (B.W.v.d.Vlugt, Diësrede, Technische Hogeschool Eindho
ven, 1984).
8. Het onderwijs op basisscholen dient zo te lilOrden ingericht, dat voor
komen lliOrdt dat intelligente kinderen lui lilOrden (W.B.Barbe and J.s.
Renzul1i. 'Psychology and education of the gifted', New York, 1981).
9. De vereiste nauwkeurigheid van één cent in de verhouding van de fre
quenties van grond- en boVentonen van vibrafoonstaven is niet voldoen
de onderbouwd (J.L.MOOre, 'Bar percussion instruments', Permus Publi
cations. COlumbus Ohio, 1978).
10. Het terugdringen van het onderwijs in de Romeanse talen leidt tot een
vertainderd inzicht in de schrijfwijze en uitspraak van lliOOrden; dit
kan er bijvoorbeeld toe leiden dat man bij het woord paraaeter gaat
denken aan een apparaat voor het tellen van JOegoslavische .unten.
11. Htt musiceren in ,.een groot orkest levert naast de muzikale beleving
een· aantal vaardigheden op, die overal tepas k<aen, zoals sa~Benspelen,
zuiver spelen, tellen en maathouden.
Blndhoven, 9 september 1986.
Heiko Martin.


![TB Transmission and Pathogenesis 2015nid]/tb...Experimental Airborne Transmission Findings from the Pilot Ward •Effluent air from TB patients’ rooms caused experimental TB infection](https://img.pdfslide.us/doc/110x75/5f13fc32de4217322031a1e3/tb-transmission-and-pathogenesis-2015-nidtb-experimental-airborne-transmission.jpg)