Embed Size (px)
Citation preview

Sorenson Best Paper Award RecipientCROSS-CULTURAL PERSPECTIVES OF SERVICEQUALITY AND RISK IN AIR TRANSPORTATION
Lawrence F. Cunningham and Clifford E. YoungUniversity of Colorado at Denver
andMoonkyu Lee, Yonsei University, Seoul, Korea
Sorenson Best Paper Award RecipientCROSS-CULTURAL PERSPECTIVES OF SERVICEQUALITY AND RISK IN AIR TRANSPORTATION
Lawrence F. Cunningham and Clifford E. YoungUniversity of Colorado at Denver
andMoonkyu Lee, Yonsei University, Seoul, Korea
Journal of Air Transportation Vol. 7, No. 1 – 2002
Lawrence F. Cunningham is a Professor of Marketing in the Graduate School of Business atthe University of Colorado at Denver, where he is regularly recognized for his outstandingresearch. He is the author of numerous case studies, textbook chapters and journal articles inthe field of marketing and transportation. His most recent articles have addressed the issue ofservice quality in the airline industry, service dimensions from a domestic and internationalperspective, and service loyalty. Dr. Cunningham has served as principal investigator on alarge number of major contracts involving service quality and related issues for state andlocal governments. In addition, he is a sought-after guest lecturer on the topic of servicesmarketing for major computer firms across the United States. He has also served as a VisitingProfessor of Marketing at the Fuqua School of Business at Duke University, Bond Universityin Australia and the Helsinki School of Economics.
Clifford E. Young is a Professor of Marketing at the Graduate School of Business, Universityof Colorado at Denver. His research thrust is in the area of marketing research methodology,survey development and research analysis. He has also conducted personal selling seminarsfor business and professional groups. He has experience in selling and sales deploymentanalysis. Dr. Young has published articles in theJournal of Marketing, the Journal ofRetailing, theJournal of Marketing Research, theJournal of Public Policy and Marketing,theJournal of Personal Selling and Sales Management, theAcademy of Management Journaland others. His recent work includes investigation of company performance afterdownsizing.
Moonkyu Lee is an Associate Professor of Marketing at Yonsei University, Seoul, Korea. Hecurrently serves as Director of the Global MBA Program at the Graduate School of BusinessAdministration. Prior to joining Yonsei Business School, he taught at the University ofColorado at Denver as an Assistant Professor of Marketing for 4 years. He also taught at theUniversity of Illinois, the University of Hawaii, and the University of Washington. Hereceived his M.S. and Ph.D. degrees from the University of Illinois at Urbana-Champaign.His research interests include consumer information processing and choice, marketingstrategy and services marketing. Dr. Lee has published in theJournal of Business Research,the Journal of Services Marketing, the Journal of International Marketingand others. Hereceived the Steven J. Shaw Award for the best paper from the Southern MarketingAssociation, the Dean’s Scholar Award from the University of Colorado, and the OutstandingPerformance Award from Yonsei University.
©2002, Aviation Institute, University of Nebraska at Omaha
https://ntrs.nasa.gov/search.jsp?R=20020041936 2018-06-13T16:54:42+00:00Z

ABSTRACT
This study compares U.S. and Korean customers in terms of their perceptions of airlineservice quality based on SERVPERF and industry-based measures, as well as theirperceptions of risks involved in the airline choice. SERVPERF is a set of multi-dimensionalmeasures of customer evaluations of service quality. The results indicate that (a) U.S.passengers are generally more satisfied with their airline service than Korean customers onmost of the SERVPERF dimensions; (b) Koreans are generally more satisfied with thebumping procedures whereas U.S. participants feel more satisfied with the airline’s baggagehandling, operations/safety, and connections; and (c) U.S. participants perceive higher levelsof performance and financial risks whereas Koreans feel greater social risk in choosing anairline. This study also examines the SERVPERF, industry-based measures, and perceivedrisk in predicting customer satisfaction with, and intention to repatronize the airline. Theresults suggest that U.S. customers consider service reliability, in-flight comfort, andconnections as the key factors determining satisfaction with airline service whereas Koreanpassengers generally regard reliability, assurance, and risk factors as predictors ofsatisfaction. The determining factors of customer intention to repatronize the airline arereliability and empathy for U.S., and reliability and overall risk for Korean customers. Thestudy demonstrates the applicability of SERVPERF as a cross-cultural tool and indicates theimportance of perceived risk in cross-cultural studies.
INTRODUCTION
Over the past two decades, the service industries in the U.S. andelsewhere in the world have grown at a phenomenal rate. In 1980, serviceindustries worldwide were valued at $350 billion, accounting for 20percent of all world trade; by 1992, that figure had nearly tripled to $1,000billion. The service sector now accounts for 58 percent of worldwide grossnational product (Bateson & Hoffman, 1999). Consequently, services areattracting increasing attention from academicians and practitioners alike.The proliferation of services not only provides business opportunities, butalso poses high levels of competitive threats for service marketers. In fact,many researchers and marketers have focused their attention on customerevaluations of services in an effort to find ways to improve service quality(see Fisk, Brown, & Bitner, 1993 for a review of the literature).
However, despite the considerable amount of research under the rubricof service quality that has accumulated over the years, few studies to datehave examined customer perceptions of service quality in an internationalor a cross-cultural setting. This issue is of paramount concern tointernational service marketers because the perceived service quality oftenreflects customers’ levels of satisfaction with and intention to repatronizethe services. If service quality perceptions are standardized across cultures,firms may choose to control costs by standardizing operations andmarketing strategies. Assessment of quality in service industries, unliketraditional physical product industries, is not a function of statisticalmeasures of quality including physical defects or managerial judgement.
4 Journal of Air Transportation
Rather, it is a function of customers’expectations and perceptions about theservices (Bateson & Hoffman, 1999; Lovelock, 1984; Parasuraman,Zeithaml, & Berry, 1985).
The purpose of this study was twofold: (a) to examine customerperceptions of services and risk of services provided by commercial airlinecompanies in a cross-cultural setting; and (b) to assess the effectiveness ofexisting measures of service quality and risk in predicting customersatisfaction and intention to repatronize the services. Since airline servicesare used worldwide, they offer an excellent opportunity for this type ofcross-cultural research. This study compares U.S. and Korean customers interms of their service quality perceptions and repatronage intentions. Forthis purpose, the study uses the SERVPERF scale, industry-basedmeasures, and various types of perceived risks. SERVPERF is aninstrument developed by Cronin and Taylor (1992), which is now widelyused in measuring customer evaluations of service quality. In an effort toincorporate the high involvement/high risk nature of airline services, thestudy also examines the predictive ability of perceived risks. Thesemeasures are further explained later.
SERVICE QUALITY MEASUREMENT IN THEAIRLINE INDUSTRY
An overview of the competitive situation of the airline industries in theU.S. and Korea suggests that measurement and management of servicequality is the fundamental issue for the survival and growth of airlinecompanies. This section describes those measures developed in pastliterature, which were used in the present study.
Service Performance Measures
While carriers experimented with service competition, similarexperiments were occurring in the academic world. Parasuraman, Berry, &Zeithaml, 1991; Parasuraman, Zeithaml, & Berry, 1985, 1988) havedeveloped a service quality measure designated SERVQUAL which statesthat the customer’s assessment of overall service quality is determined bythe degree and direction of the gap between their expectations andperceptions of actual performance levels. They have also identified fivedimensions underlying overall service quality: tangibles, reliability,responsiveness, assurance, and empathy. They proposed that perceivedservice quality could be estimated by calculating the difference betweenexpectations and perceptions of actual service performance. Since theSERVQUAL scale was developed, it has been widely used to measureperceived service quality in various service industries such as health care,
Cunningham, Young and Lee 5

financial institutions, and life insurance (e.g., Crompton & Mackay, 1989;Johnson, Dotson, & Dunlap, 1988; Webster, 1989; Woodside, Frey, & Daly,1989).
Initial publications on airline service quality appeared in 1988 (Gourdin,1988). The first direct application of the service quality gap model waspresented in 1991 (Fick & Ritchie, 1991; Gourdin & Kloppenborg, 1991).Fick and Ritchie used the SERVQUAL scale to measure perceived servicequality within several service industries including the airline industry.However, they simply reported the mean scores of consumer expectationand perception of service performance measures, and failed to determinethe relative impact of various SERVQUAL items on overall service qualityand satisfaction. In order to find out the relative importance of individualSERVQUAL items, they could have performed further analysis of theirdata on the basis of multivariate statistical techniques.
The SERVQUAL scale has also been extensively used in Korea tomeasure the quality of services provided by retail stores (Lee & Lee, 1997),telecommunication companies (Oh, 1995), and airline companies (Kim,1997). For instance, Kim used the scale to measure customer evaluations ofairline service quality. She found that reliability, empathy, and tangibleshad the most significant impact on customer perceptions of service quality.The current study extends her research framework and includes measuresthat are specific to the airline industry.
However, the SERVQUAL scale has been criticized in terms of itsvalidity and reliability. It has also been pointed out that including all 44items (22 items of service expectations and a duplicate 22 items of serviceperformance) in one study often makes the survey task too onerous forrespondents (Buttle, 1996). Thus, it has been suggested that the 22 items ofperceptions of service performance would be sufficient in measuringservice quality (Carman, 1990; Vandamme & Leunis, 1993). Cronin andTaylor (1992, 1994) have empirically demonstrated that the measures ofservice performance, or so-called SERVPERF, perform better thanSERVQUAL which includes expectations as well as performance. Theyhave shown that SERVPERF explains more of the variation in the globalmeasure of service quality in all of the four service industries examined:banks, pest control, dry cleaning, and fast food services. Therefore, thisstudy used SERVPERF in measuring the airline service quality (seeAppendix A for the SERVPERF dimensions and measures).
Industry-based Measures
While SERVPERF has proven applicable and useful in measuring theairline service quality, it has certain limitations. One of the limitationsconcerns the generic nature of the scale (Ostrowski, O’Brien, & Gordon,
6 Journal of Air Transportation

1993). Although the scale is so generic that it can be applied in measuringperceived quality of various services, it fails to capture industry-specificdimensions underlying the quality perceptions. Therefore, the current studyincorporates those industry-based measures in determining airline servicequality.
The initial tools of service quality measurement in the airline industrywere really economic-based, pre-deregulatory tools that had beendeveloped by the Civil Aeronautics Board (Douglas & Miller, 1974;Jordan, 1970). Service quality assessments from the perspective of theairline consumer first appeared in the doctoral dissertation work byKearney (1986). It examined service quality from the perspective ofindustry-based economic and marketing measures (see also Kloppenborg& Gourdin, 1992, for these industry-based measures).
Gourdin and Kloppenborg (1991) used an intriguing approach tosampling consumers in addition to industry and government transportationofficials to develop a set of criteria for expected quality. They foundsignificant statistical differences between passengers and management on anumber of essential variables, most of which are industry-based servicequality measures mentioned above.
Several teams of researchers compiled the industry-based measures ofairline service quality and compared them with SERVQUAL in terms oftheir ability to predict customer satisfaction and intention to repatronize(Cunningham & Brand,1989; Lee, Cunningham, & Wadsworth,1993;Young, Cunningham & Lee, 1994a, 1994b; Young, Cunningham, Lee &Wadsworth,1992). They found that SERVQUAL measures were as strongas the industry derived measures in predicting perceived quality and werethe only significant predictors of intention to repatronize. The present studyincludes and uses the industry-based measures that they put together (seeAppendix B for the industry-based dimensions and their measures).
Risk Perceptions
Another factor that pertains to the customer evaluation of the airlineservice quality is perceived risk in selecting an airline. Perceived risk hasbeen widely dealt with in past literature since it accompanies all purchasesto varying degrees and influences buying behavior (Bettman, 1973; Cox,1967; Chaudhuri, 1997; Cunningham, 1967; Dowling & Staelin ,1994;Mitchell, 1999). Past research suggests that consumers generally feel ahigher level of risk when purchasing a service than when buying amanufactured product since services are basically intangible and difficultto test before purchase (Murray, 1991; Zeithaml, 1981). A study bySweeney, Soutar, and Johnson (1999) revealed that perceived risk plays amediating role in the perceived service quality and value for money
Cunningham, Young and Lee 7

relationship in a retail setting.Since most of the travel experiences rely on intangible services, it is
expected that travelers’ perceptions of risk are likely to be high, and suchperceptions would influence their evaluations of the travel services(Moutinho, 1987; Sonmez & Graefe, 1998). Although researchers have notyet examined or measured perceived risk in the context of airline selections,the existing evidence implies its potentially significant influence onevaluations of airline service quality (Roehl & Fesenmaier, 1992).
Another interesting issue that warrants a close investigation is thepotential differences in consumer risk perceptions across cultures. In theproduct domain, a piece of evidence suggests that American and Mexicanconsumers differ in terms of the level of perceived risk involved in makingpurchases; on average, Mexicans perceive a lower level of risk in brandselection, compared to Americans (Hoover, Green, & Saegert, 1978).Another study indicates that Americans and Germans are more risk-aversethan Chinese in reacting to financial investment options (Weber & Hsee,1998). Thus, it is proposed that perceived risk can be used to analyzeconsumer behavior patterns in different cultures (Verhage, Yavas, & Green,1991). Such cross-cultural differences should have strong implications forinternational airlines and are examined in this study.
Past literature suggests that perceived risk is a multi-dimensionalconstruct (Kaplan, Szybillo, & Jacoby, 1974; Roselius, 1971). Therefore, inthis study, overall perceived risk was measured as well as perceptions offive risk dimensions: financial, performance, physical, psychological, andsocial risks (Murray & Schlacter, 1990; Roehl & Fesenmaier, 1992). Thepurpose of including such measures of individual dimensions was toexamine cross-cultural differences on each risk dimension and to determineeach one’s relative impact on overall service quality and intention torepatronize.
RESEARCH METHOD
Questionnaire Design
The survey questionnaire consisted of three sections. Questions in thefirst section asked respondents to evaluate the quality of services providedby the airline company that they had used most recently. Perceived servicequality or overall satisfaction was measured through the question, “Overall,I am very satisfied with the airline,” on a 7-point Likert scale ranging from“strongly disagree” to “strongly agree.” Behavioral intention to repatronizethe airline was measured through the question, “I will definitely use theairline again the next time I fly” on the same scale. Perceived quality ofindividual service aspects was also measured by the SERVPERF items
8 Journal of Air Transportation

using the same 7-point scales. The items of SERVPERF (Cronin & Taylor,1992, 1994) based on the revised version of SERVQUAL (Parasuraman,etal., 1991) were reconstructed to be suitable to measure airline services.
The second section included industry-based measures described earlier.The last section of the questionnaire dealt with behavioral anddemographic characteristics of respondents. Specifically, this sectioninvolved questions on (a) frequency of air travel; (b) perception of riskinvolved in air travel; and (c) demographics (e.g., sex, age, income).
In developing the questionnaire and collecting data, this study followedthe guidelines for conducting international marketing research, asdeveloped and proposed by Douglas and Craig (1983) and Malhotra,Agarwal, and Peterson (1996). To ensure the equivalence of the researchinstrument used in two different countries, this study adapted the specificprocedure suggested in the literature (Brislin, 1970; Brislin, Lonner, &Thorndike, 1973; Triandis, 1976) and used in Calantone, Schmidt, andSong (1996), which involved double translation with de-centering.Specifically, four bilinguals, who were fluent in English and Korean,participated in the process. They earned their undergraduate degrees frommajor U.S. universities and were enrolled in a graduate program at a majorKorean university at the time this study was conducted. Two of themprepared a Korean translation of the English version of the questionnaire.Problems and ambiguities in the process of translation were discussed withone of the authors. Subsequently, this questionnaire was reverse translatedinto English by the other two bilinguals who did not see the originalEnglish version. Then, based on the comparison between the original andthe reverse translated English versions, adjustments were made to theKorean questionnaire. It was believed that the equivalence of the twoversions of the questionnaire, English and Korean, was ensured throughoutthe procedure.
Sampling and Data Collection
Data from both the U.S. and Korea were collected in surveys of businessprofessionals attending evening MBA courses. In the U.S., before the mainstudy was conducted, a pilot test was performed on a small scale in order tomake sure that the questions were read and understood as intended. Thequestionnaire was then administered to a random sample taken from astudent population of an evening MBA program at a major metropolitanuniversity. A total of 105 respondents participated in the survey, yielding105 usable responses. The same procedure was performed in Korea in aneffort to ensure the comparability of data collected in the two differentcountries. A total of 145 respondents participated in the survey, yielding143 usable responses.
Cunningham, Young and Lee 9

Both the Korean and U.S. MBA students were full-time workingprofessionals who, in many cases, traveled as part of their responsibilities.As such, they are broadly representative of typical airline customers. Apilot test showed that most of the students were regular users and many ofthem were heavy users of air travel services.
ANALYSIS AND RESULTS
Sample Characteristics
The data was coded and tabulated in preparation for analysis. Becausethe data was obtained from student samples, descriptive analyses wereperformed to analyze the make-up of the samples. Table 1 shows thedemographic profile of the respondents. The Korean samples tended to be
10 Journal of Air Transportation
Table 1. Sample Characteristics of Respondents
Overall U.S. KoreaVariable (n = 248) (n = 105) (n = 143)
percent
SexMale 69 52 80Female 31 48 20
AgeUnder 30 32 40 2630-39 55 45 63Over 39 13 15 11
Marital StatusSingle 32 37 29Married 62 51 70Other 6 12 1
Ethnic BackgroundWhite 34 83 0Asian 62 8 99Other 4 9 1
IncomeUnder $30K 18 19 18$30K-$40K 20 17 22$40K-$50K 20 18 21$50K-$60K 17 12 19$60K-$70K 10 15 7Over $70K 15 9 13
number
Total Airline Trips (Last Year) 6.49 5.50 7.21Business Trips (Last Year) 4.36 3.32 5.13

more male, younger, more often married, and more homogeneous in termsof race and ethnic background.
Although there were differences between the two samples in terms ofsome demographic characteristics, there were similarities in othercharacteristics. Specifically, the incomes were similar for the two groups.The samples were relatively affluent by U.S. and Korean standards; 54% ofthe U.S. and 60% of the Korean sample had annual incomes greater than$40,000. More importantly, investigation of the respondents’ travelbehavior revealed that individuals in both samples were extensive users ofairline services. On average, the U.S. sample individual made 5.50 airlinetrips (of which, 3.32 were business trips) and the Korean counterpart made7.21 trips (5.13 business trips) in the last 12 months. Based on the results,we believe that the respondents represent a group of people who travel byair sufficiently often to be familiar with airline services. Thus, theseindividuals must have formed opinions and perceptions about airlineservices and quality based on their actual air travel experiences.
Measure Validation
The next step of the analysis dealt with how well the SERVPERFmeasures exhibited reliability when used in an airline services setting in theU.S. and Korea. Individual measures were subjected to reliability analysisin accordance with their predicted dimensions. Based on the analysis usingcoefficient alpha (Cronbach, 1951), all dimensions showed acceptablereliability; the alpha values of all the constructs were either close to orgreater than .7, the threshold Nunnally (1978) recommended for basicresearch (see Appendix A for Cronbach’s alphas of the dimensions).Therefore, index measures of the five dimensions of SERVPERF wereconstructed by taking the mean of the set of measures for that dimension.These indices were used in the regression analysis, which will be explainedlater.
In their previous studies, the authors had no a priori dimensions for theindustry-derived measures. Therefore, the measures were subjected to afactor analysis to investigate underlying dimensions. From the factoranalysis results, five dimensions were identified and described as (a)baggage handling; (b) bumping procedures; (c) operations and safety; (d)in-flight comfort; and (e) connections. The measures were also subjected toreliability analysis using Cronbach’s coefficient alpha. As expected, alldimensions also showed acceptable reliability (see Appendix B). Thus, thesimple mean ratings on the measures were used again in the subsequentregression analysis.
Cunningham, Young and Lee 11

SERVPERF Measures
The U.S. and Korean respondents were asked to evaluate the quality ofservices provided by the airline that they had flown on most recentlyutilizing the overall measures and various SERVPERF scale items. Theresults are summarized in Table 2.
12 Journal of Air Transportation
Table 2. SERVPERF Measures: Results of the t-Tests
Variablea U.S. Korea t-value p-value
mean
OverallI am very satisfied with the airline. 4.94 3.96 6.12 .001I will definitely use the airline again. 5.09 4.48 3.11 .01
TangiblesThe airline has up-to-date equipment. 4.45 4.25 1.22 .23The airline’s physical facilities arevisually appealing. 4.50 4.17 2.03 .04
Employees are well dressed and neat. 5.50 5.13 2.60 .01Physical facilities are kept up. 4.69 4.27 2.83 .01
ReliabilityThe airline keeps promises. 4.32 4.20 .69 .49The airline is sympathetic and reassuring. 4.05 4.23 -1.01 .31The airline is dependable. 4.90 4.51 2.43 .02The airline keeps time. 4.71 4.68 .15 .88The airline keeps its records accurately. 4.85 4.35 3.12 .01
ResponsivenessThe airline tells the customers exactlywhen the services will be performed. 4.43 4.20 1.16 .25
You receive prompt service from the airline. 4.25 4.01 1.32 .19Employees are always willing tohelp customers. 4.36 3.81 2.92 .01
Employees respond to customerrequests promptly. 4.27 3.76 2.63 .01
AssuranceYou can trust employees. 4.84 4.38 3.08 .01You feel safe in your transactionwith employees. 4.89 4.25 3.87 .001
Employees are polite. 5.13 4.56 3.31 .001Employees get adequate support. 4.24 4.21 .20 .84
EmpathyThe airline gives you individual attention. 4.22 3.62 3.17 .01Employees give you personal attention. 4.42 3.40 5.46 .001Employees know what your needs are. 4.49 3.91 3.16 .01The airline has your best interest at heart. 4.38 3.68 3.79 .001The airline has convenient operating hours. 4.39 3.19 6.60 .001
a Measured on a 7-point Likert scale where 1 = “strongly disagree” and 7 = “strongly agree”
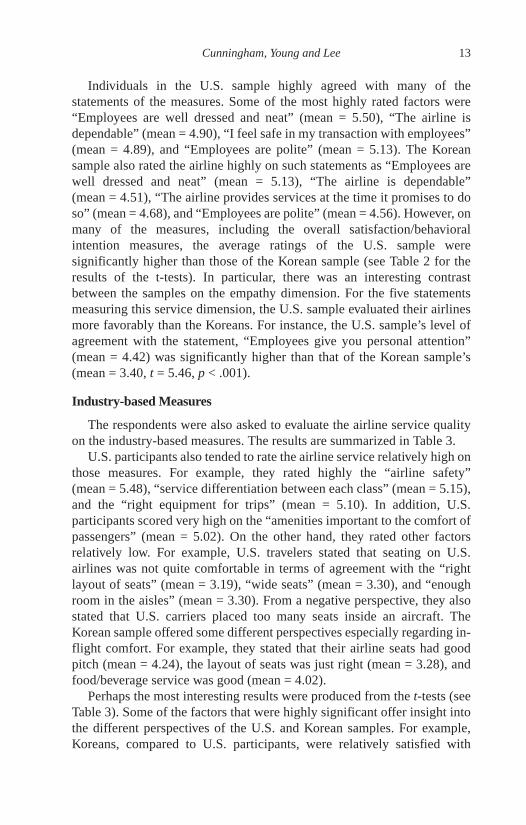
Individuals in the U.S. sample highly agreed with many of thestatements of the measures. Some of the most highly rated factors were“Employees are well dressed and neat” (mean = 5.50), “The airline isdependable” (mean = 4.90), “I feel safe in my transaction with employees”(mean = 4.89), and “Employees are polite” (mean = 5.13). The Koreansample also rated the airline highly on such statements as “Employees arewell dressed and neat” (mean = 5.13), “The airline is dependable”(mean = 4.51), “The airline provides services at the time it promises to doso” (mean = 4.68), and “Employees are polite” (mean = 4.56). However, onmany of the measures, including the overall satisfaction/behavioralintention measures, the average ratings of the U.S. sample weresignificantly higher than those of the Korean sample (see Table 2 for theresults of the t-tests). In particular, there was an interesting contrastbetween the samples on the empathy dimension. For the five statementsmeasuring this service dimension, the U.S. sample evaluated their airlinesmore favorably than the Koreans. For instance, the U.S. sample’s level ofagreement with the statement, “Employees give you personal attention”(mean = 4.42) was significantly higher than that of the Korean sample’s(mean = 3.40,t = 5.46,p < .001).
Industry-based Measures
The respondents were also asked to evaluate the airline service qualityon the industry-based measures. The results are summarized in Table 3.
U.S. participants also tended to rate the airline service relatively high onthose measures. For example, they rated highly the “airline safety”(mean = 5.48), “service differentiation between each class” (mean = 5.15),and the “right equipment for trips” (mean = 5.10). In addition, U.S.participants scored very high on the “amenities important to the comfort ofpassengers” (mean = 5.02). On the other hand, they rated other factorsrelatively low. For example, U.S. travelers stated that seating on U.S.airlines was not quite comfortable in terms of agreement with the “rightlayout of seats” (mean = 3.19), “wide seats” (mean = 3.30), and “enoughroom in the aisles” (mean = 3.30). From a negative perspective, they alsostated that U.S. carriers placed too many seats inside an aircraft. TheKorean sample offered some different perspectives especially regarding in-flight comfort. For example, they stated that their airline seats had goodpitch (mean = 4.24), the layout of seats was just right (mean = 3.28), andfood/beverage service was good (mean = 4.02).
Perhaps the most interesting results were produced from thet-tests (seeTable 3). Some of the factors that were highly significant offer insight intothe different perspectives of the U.S. and Korean samples. For example,Koreans, compared to U.S. participants, were relatively satisfied with
Cunningham, Young and Lee 13
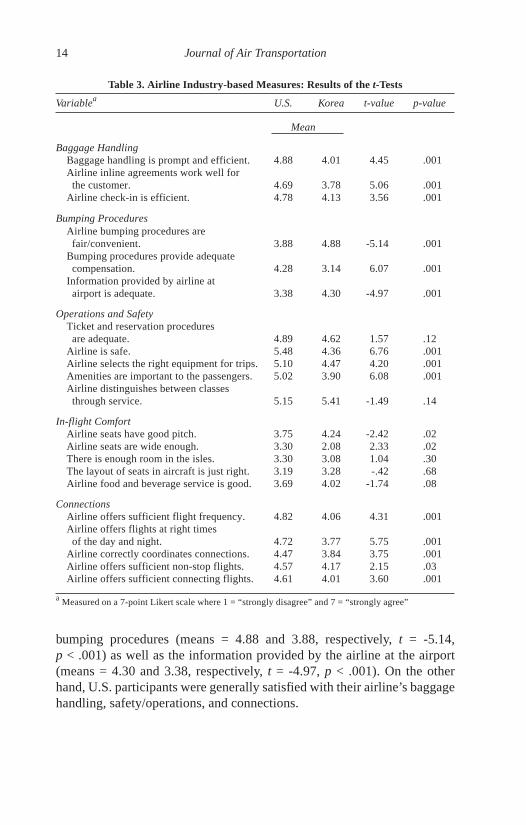
bumping procedures (means = 4.88 and 3.88, respectively,t = -5.14,p < .001) as well as the information provided by the airline at the airport(means = 4.30 and 3.38, respectively,t = -4.97,p < .001). On the otherhand, U.S. participants were generally satisfied with their airline’s baggagehandling, safety/operations, and connections.
14 Journal of Air Transportation
Table 3. Airline Industry-based Measures: Results of thet-Tests
Variablea U.S. Korea t-value p-value
Mean
Baggage HandlingBaggage handling is prompt and efficient. 4.88 4.01 4.45 .001Airline inline agreements work well forthe customer. 4.69 3.78 5.06 .001
Airline check-in is efficient. 4.78 4.13 3.56 .001
Bumping ProceduresAirline bumping procedures arefair/convenient. 3.88 4.88 -5.14 .001
Bumping procedures provide adequatecompensation. 4.28 3.14 6.07 .001
Information provided by airline atairport is adequate. 3.38 4.30 -4.97 .001
Operations and SafetyTicket and reservation proceduresare adequate. 4.89 4.62 1.57 .12
Airline is safe. 5.48 4.36 6.76 .001Airline selects the right equipment for trips. 5.10 4.47 4.20 .001Amenities are important to the passengers. 5.02 3.90 6.08 .001Airline distinguishes between classesthrough service. 5.15 5.41 -1.49 .14
In-flight ComfortAirline seats have good pitch. 3.75 4.24 -2.42 .02Airline seats are wide enough. 3.30 2.08 2.33 .02There is enough room in the isles. 3.30 3.08 1.04 .30The layout of seats in aircraft is just right. 3.19 3.28 -.42 .68Airline food and beverage service is good. 3.69 4.02 -1.74 .08
ConnectionsAirline offers sufficient flight frequency. 4.82 4.06 4.31 .001Airline offers flights at right timesof the day and night. 4.72 3.77 5.75 .001
Airline correctly coordinates connections. 4.47 3.84 3.75 .001Airline offers sufficient non-stop flights. 4.57 4.17 2.15 .03Airline offers sufficient connecting flights. 4.61 4.01 3.60 .001
a Measured on a 7-point Likert scale where 1 = “strongly disagree” and 7 = “strongly agree”

Risk Perceptions
As indicated in Table 4, respondents from both the U.S. and Koreansamples evaluated the overall, financial, performance, physical,psychological, and social risks associated with choosing an airline.
The U.S. respondents indicated that the primary sources of risks inchoosing an airline were performance, financial, and psychological risks.The means for these types of risks were 5.13, 4.28, and 4.11, respectively.Respondents from the U.S. sample did not state that there was much socialrisk involved in choosing an airline. On the other hand, Korean respondentsindicated that the highest sources of risk associated with choosing anairline were psychological, performance, and physical with means of 4.32,4.23, and 4.09, respectively. Both of the samples indicated that there wasminimal social risk in picking an airline (means = 2.34 for the U.S. sampleand 2.79 for the Korean sample).
When the responses of the U.S. sample were compared to those of theKorean sample, there were highly significant differences in performanceand financial risk witht-values of 5.07 and 3.59 and significant levels ofp < .001. There was also a difference in the evaluation of overall risk with at-value of 2.55 and significance ofp< .01. Surprisingly, Koreans, comparedto U.S. participants, stated that there was a greater level of social risk inchoosing an airline (t = -2.34,p < .02). Physical and psychological riskswere not significantly different, although Koreans indicated that there werehigher physical and psychological risks.
Regression Analysis
A set of stepwise regression analyses was performed for each sample todetermine differential effects of SERVPERF, industry-based measures andrisk variables on customer satisfaction with airline services. The results aresummarized in Table 5.
Cunningham, Young and Lee 15
Table 4. Risk Perceptions: Results of thet-Tests
Variablea U.S. Korea t-value p-value
Mean
Overall Risk 4.20 3.75 2.55 .01Financial Risk 4.28 3.57 3.59 .001Performance Risk 5.13 4.23 5.07 .001Physical Risk 3.98 4.09 -.51 .61Psychological Risk 4.11 4.32 -1.00 .32Social Risk 2.34 2.79 -2.34 .02
a Measured on a 7-point Likert scale where 1 = “no risk” and 7 = “high risk”

The overall regression models were highly significant (R2 = .54,F = 33.71,p < .001 for the U.S. sample;R2 = .63,F = 44.52,p < .001 for theKorean sample). In the U.S. sample, service reliability, one of theSERVPERF dimensions, produced a standardized coefficient of .36 and at-value of 4.34, which was significant atp < .001. In the case of the Koreansample, two independent variables, reliability and assurance, weresignificant predictors of customer satisfaction. Reliability produced astandardized coefficient of .56 and at-value of 7.48 which was significantat p < .001. In addition, assurance also proved to be a significant predictorof customer satisfaction, with a standardized coefficient of .18 and at-valueof 2.41 which was significant atp < .05. The results were consistent withmost of the cross-cultural studies that have sought to employ SERVPERFvariables as predictors of customer satisfaction. In fact, the interestingstudies are those that failed to demonstrate that reliability was a significantpredictor. The only key change in this particular result was that assurancealso proved a significant independent variable.
16 Journal of Air Transportation
Table 5. Impact of SERVPERF, Industry Indices, and Risk Factors On CustomerSatisfaction: Results of the Stepwise Regression Analysis
U.S. Korean
Standardized StandardizedVariable Coefficient t-value Coefficient t-value
SERVPERF MeasureTangibles — — — —Reliability .36 4.34*** .56 7.48***Responsiveness — — — —Assurance — — .18 2.41*Empathy — — — —
Industry-based MeasureBaggage Handling — — — —Bumping Procedure — — — —Operations and Safety — — — —In-flight Comfort .22 2.65** — —Connections .37 4.54*** — —
Perceived RiskOverall Risk — — — —Financial Risk — — — —Performance Risk — — -.14 -1.83Physical Risk — — .21 3.45***Psychological Risk — — -.15 -2.08*Social Risk — — — —
R2 = .54,F = 33.71*** R2 = .63,F = 44.52***
*p < .05, ** p < .01, *** p < .001

The regression analysis for the U.S. sample also indicated that airlineconnection was a significant independent variable. The standardizedcoefficient produced by connections was .37 and thet-value was 4.54which was significant atp < .001. In addition, in-flight comfort wassignificant with a coefficient of .22 and thet-value was 2.65 which wassignificant atp < .01. However, the Korean model for customer satisfactiondemonstrated some characteristics which were substantially different thanthose in the model produced by the U.S. sample. Specifically, in the Koreanmodel, customer satisfaction was successfully predicted by three riskvariables. These variables were performance risk (ß = -.14, t = -1.83,p < .07), physical risk (ß = .21, t = 3.45,p < .001), and psychological risk(ß = -.15, t = -2.08,p < .05). Perhaps the most intriguing finding was thatphysical risk had a positive coefficient on customer satisfaction, holdingreliability and performance risk constant. Indeed, although physical riskwas negatively associated with satisfaction on the bivariate correlationmatrix, when reliability was entered into the model, the coefficient forphysical risk became positive. When performance risk was added to themodel, the coefficient for physical became positive and significant.
The current study seems to suggest some interesting culturalconnections between satisfaction and physical risk. In particular, the resultsseem to suggest that Korean travelers, when measured from a post hocperspective, connect their levels of satisfaction with those of physical risk.Thus, the researchers might have measured on a post hoc basis theadrenaline rush that people experience when they successfully survivestressful situations with moderate physical risk. In the U.S., this feeling islikened to the exhilaration one feels at the end of a roller coaster ride.
Another set of regression analyses also sought to predict intention torepatronize using SERVPERF, industry-based measures and risk variables.Table 6 shows the results of the analyses.
Again, both models were highly significant (R2 = .36, F = 25.20,p < .001 for the U.S. sample;R2 = .37,F = 39.22,p < .001 for the Koreansample). The U.S. sample produced a model with two significantindependent variables, service reliability and empathy. Reliabilityproduced a standardized coefficient of .42 and at-value of 4.12, which wassignificant atp < .001 while empathy produced a standardized coefficientof .26 and at-value of 2.55, significant atp < .05. The Korean sample alsofeatured two significant independent variables. One variable was reliabilitywith a standardized coefficient of .56 and at-value of 8.00 withp < .001.Overall risk was also significant as an independent variable producing a–.15 standardized coefficient and at-value of –2.15, significant atp < .05.
Cunningham, Young and Lee 17

CONCLUSIONS
The results of the study indicate that U.S. passengers are generally moresatisfied with their airline service than Korean customers on most of theSERVPERF dimensions. However, the industry-based measures producemany interesting contrasts between the two groups of customers.Specifically, Koreans are generally more satisfied with the bumpingprocedures, whereas U.S. participants feel happier with the airline’sbaggage handling, safety/operations, and connections.
An interesting and important finding is the different levels of perceivedrisk. The results of the study suggest that U.S. participants perceive higherlevels of performance and financial risks, whereas Koreans feel greatersocial risk in choosing an airline. From a risk perspective, these findingsimply that U.S. participants generally evaluate airline alternatives based onservice performance and costs whereas Koreans select an airline that theythink would be acceptable to other people they know. In other words,Koreans may be more susceptible to social influences in their choice of an
18 Journal of Air Transportation
Table 6. Impact of SERVPERF, Industry Indices, and Risk Factors On Intention toRepatronize: Results of the Stepwise Regression Analysis
U.S. Korean
Standardized StandardizedVariable Coefficient t-value Coefficient t-value
SERVPERF MeasureTangibles — — — —Reliability .42 4.12*** .56 8.00***Responsiveness — — — —Assurance — — — —Empathy .26 2.55* — —
Industry-based MeasureBaggage Handling — — — —Bumping Procedure — — — —Operations and Safety — — — —In-flight Comfort — — — —Connections — — — —
Perceived RiskOverall Risk — — -.15 -2.15*Financial Risk — — — —Performance Risk — — — —Physical Risk — — — —Psychological Risk — — — —Social Risk — — — —
R2 = .36,F = 25.20*** R2 = .37,F = 39.22***
*p < .05, ** p < .01, *** p < .001

airline. Therefore, international airlines serving Korean passengers shouldformulate promotional strategies that encourage word-of-mouthcommunications among potential customers. Finally, U.S. participantsgenerally seem to feel a higher level of overall risk when choosing anairline. Airlines targeting U.S. passengers should use risk-reducingstrategies in the airline choice. For instance, companies can emphasizevalue for the money to reduce financial risk and service quality to alleviateperformance risk.
The results from the regression analyses offer significant insight forinternational airlines. First, the results indicate that U.S. customers think ofservice reliability and connections as the key factors determining the airlineservice quality. Fortunately, the airlines serving U.S. travelers are evaluatedfavorably on these two dimensions. On the other hand, Korean passengersgenerally consider reliability and assurance as the most important factorsand other industry-based service items as less important. However, theyperceive the airlines they fly with less favorably on these SERVPERFdimensions than U.S. customers. Thus, the international airlines targetingKorean passengers should focus efforts on improving such core services.
Secondly, as described above, Koreans generally seem to perceive alower level of risks in selecting an airline. However, when they evaluatetheir satisfaction with an airline, their perception of risks becomesimportant. The results indicate that the higher the perception ofperformance and psychological risk, the less favorable their satisfactionlevels. This reaction might be caused by cognitive dissonance or feeling ofregret, that is, a thought that they made a poor choice of an airline. Theairline could probably reduce the negative impact of perceived risk byproviding the core services consumers want (i.e., reliability and assurance)and confirming that travelers made the right choice.
Finally, the study results point out several key variables that determinecustomer intention to repatronize the airline. Those variables are reliabilityand empathy for participants, and reliability and overall risk for Koreancustomers. International airlines serving U.S. or Korean passengers shouldfocus on these variables in order to develop and maintain long-termrelationships with customers.
Implications
The results of this study have methodological and managerialimplications. The study demonstrates that the SERVPERF scale isapplicable and usable in cross-cultural studies. The scale worked well whenapplied to Korean customers and seems to offer some predictive ability forsatisfaction and repatronization of services. This conclusion can besupported by prior research in other cultures as well as by other studies
Cunningham, Young and Lee 19
conducted in the Korean environment. Further, this study also demonstratesthe validity of service reliability as a key predictor in both satisfaction andrepatronization. This finding is consistent with prior research dealing withairline service quality (e.g., Young,et al., 1994a, 1994b).
The results of this study, considered in totality, suggest thatimplementing a simple-minded service standardization across differentcountries for cost reduction can be risky in the international airlineindustry. Consumers view the same service differently and evaluate itsmerits and faults differently. Although airlines cannot ignore costconstraints, they should make an effort to recognize cultural perceptions oftheir service and to customize services to the differing needs ofinternational passengers.
Future Research Directions
In earlier studies conducted in the U.S., Lee,et al., (1993), and Young,etal., (1992) and Young, et al., (1994a, 1994b) found that the best predictionof airline satisfaction and repatronization occurred when SERVPERFdimensions were combined with industry measures of service quality.While industry measures did not prove to be particularly significant orpredict satisfaction and repatronization in the Korean environment, there isreason to believe that industry measures are useful in predicting thesedependent variables in cultures other than in the U.S. While the findings inthis study are limited to the airline industry, there is the possibility thatindustry measures would prove extremely helpful in other serviceindustries as well as in other cultures. Future research needs to investigatethese possibilities.
Perhaps the most important finding of the study is the role of perceivedrisk in predicting satisfaction and repatronization. In specific, types ofperceived risk seemed to play important roles in the selection of services.Further, based on the results of this study, one might hypothesize thatperceived risk varies a great deal from culture to culture as a factor inpredicting satisfaction and repatronization. The current study also seems tosuggest some interesting cultural connections between satisfaction andphysical risk as noted in the results section. The positive relationshipbetween physical risk and satisfaction after holding reliability and personalrisk constant is one that deserves further study. Is there a true roller coastereffect as stated earlier? If this hypothesis is indeed valid, the findingssuggest that there is an opportunity in certain cultures to developstandardized services which successfully reduce psychological andperformance risk, while at the same time, providing users with someperceived exposure to moderate physical risk.
20 Journal of Air Transportation

REFERENCES
Bateson, J. E. G. and Hoffman, K. D. (1999),Managing Services Marketing, 4th ed., FortWorth, TX: The Dryden Press.
Bettman, J. R. (1973), “Perceived Risk and Its Components: A Model and Empirical Test,”Journal of Marketing Research, 10, 184–189.
Brislin, R. W. (1970), “Back Translation for Cross-Cultural Research,”Journal of Cross-Cultural Psychology, 1, 185–216.
Brislin, R. W., Lonner, W. J., and Thorndike, R. (1973),Cross-Cultural Research Methods,New York: Wiley.
Buttle, F. (1996), “SERVQUAL: Review, Critique, Research Agenda,”European Journal ofMarketing, 30, 1, 8–32.
Calantone, R. J., Schmidt, J. B., and Song, X. M. (1996), “Controllable Factors of NewProduct Success: A Cross-National Comparison,”Marketing Science, 15, 4, 341–358.
Carmen, J. M. (1990), “Consumer Perceptions of Service Quality: An Assessment of theSERVQUAL Dimension,”Journal of Retailing, 66 (Spring), 33–55.
Chaudhuri, A. (1997), “Consumption Emotion and Perceived Risk: A Macro-AnalyticApproach,”Journal of Business Research, 39, 81–92.
Cox, D. F. (1967),Risk-taking and Information Handling in Consumer Behavior, Boston,MA: Harvard University.
Crompton, J. L. and Mackay, K. J. (1989), “Users’ Perceptions of the Relative Importance ofService Quality Dimensions in Selected Public Recreation Programs,”Leisure sciences,11, 367–375.
Cronbach, L. J. (1951), “Coefficient Alpha and the Internal Structure of Tests,”Psychometrika, 16 (September), 297–334.
Cronin, J. J., Jr., and Taylor, S. A. (1992), “Measuring Service Quality: A Reexamination andExtension,”Journal of Marketing, 56 (July), 55–68.
Cronin, J. J., Jr., and Taylor, S. A. (1994), “SERVPERF versus SERVQUAL: ReconcilingPerformance-Based and Perceptions-Minus-Expectations Measurement of ServiceQuality,” Journal of Marketing, 58 (January), 125–131.
Cunningham, L. F. and Brand, R. (1989), “Air Travel Consumer Report,”TransportationQuarterly, 43 (4), 591–607.
Cunningham, S. M. (1967), “Major Dimensions of Perceived Risk,” in Donald F. Cox (ed.),Risk-taking and Information Handling in Consumer Behavior, Boston, MA: HarvardUniversity, 82–108.
Douglas, G. W. and Miller III, J. C. (1974),Economic Regulation of Domestic Air Transport:Theory and Policy, Washington, D.C.: The Brookings Institution.
Douglas, S. and Craig, C. S. (1983),International Marketing Research, Englewood Cliffs,NJ: Prentice-Hall.
Dowling, G. R. and Staelin, R. (1994), “A Model of Perceived Risk and Intended Risk-Handling Activity,” Journal of Consumer Research, 21 (June), 119–134.
Cunningham, Young and Lee 21

Fick, G. R. and Ritchie, J. R. B. (1991), “Measuring Service Quality in the Travel andTourism Industry,”Journal of Travel Research, Fall, 2–9.
Fisk, R. P., Brown, S. W., and Bitner, M. J. (1993), “Tracking the Evolution of the ServicesMarketing Literature,”Journal of Retailing, 69, 1 (Spring), 61–103.
Gourdin, K. N. (1988), “Bringing Quality Back to Commercial Air Travel,”TransportationJournal, 27 (3).
Gourdin, K. N., and Kloppenborg, T. J. (1991), “Identifying Service Gaps in Commercial AirTravel: The First Step Toward Quality Improvement,”Transportation Journal, 31 (1),22-30.
Hoover, R. J., Green, R. T., and Saegert, J. (1978), “A Cross-National Study of PerceivedRisk,” Journal of Marketing, 42, 3 (July), 102–108.
Johnson, L. L., Dotson, M. J., and Dunlap, B. J. (1988), “Service Quality Determinants andEffectiveness in the Real Estate Brokerage Industry,”The Journal of Real EstateResearch, 3, 21–36.
Jordan, W. A. (1970),Airline Regulation in America: Effects and Imperfections, Baltimore:The Johns Hopkins Press.
Kaplan, L., Szybillo, G. J., and Jacoby, J. (1974), “Components of Perceived Risk in ProductPurchase: A Cross-Validation,”Journal of Applied Psychology, 59, 287-291.
Kearney, T. J. (1986),Quality of Service Under Airline Deregulation, Doctoral Dissertation,The Indiana University at Bloomington, IL.
Kim, H. (1997), “Measuring the Service Encounter Quality Based on the Gap Analysis: TheCase of the Airline Service,” Master’s thesis (in Korean), Graduate School of BusinessAdministration, Yonsei University, Korea.
Kloppenborg, T. J. and Gourdin, K. N. (1992), “Up in the Air About Quality,”QualityProgress, February, 31–35.
Lee, M. and Lee, I. (1997), “Developing Service Marketing Strategies for Different Types ofRetail Stores,”Journal of Distribution Channels(in Korean), 2, 1, 9–4.
Lee, M., Young, C., Cunningham, L. and Wadsworth, L. (1993), “Perspectives RegardingService Quality Measurement in the Airline Industry,”Proceedings of the Thirty-FifthAnnual Meeting, Arlington, VA: Transportation Research Forum, 193–201.
Lovelock, C. H. (1984),Services Marketing, Englewood Cliffs, NJ: Prentice Hall, Inc.
Malhotra, N. K., Agarwal, J., and Peterson, M. (1996), “Methodological Issues in Cross-Cultural Marketing Research,”International Marketing Review, 13, 5, 7–43.
Mitchell, V. (1999), “Consumer Perceived Risk: Conceptualizations and Models,”EuropeanJournal of Marketing, 33, 1/2, 163–195.
Moutinho, L. (1987), “Consumer Behavior in Tourism,”European Journal of Marketing, 21,10, 5–44.
Murray, K. B. (1991), “A Test of Services Marketing Theory: Consumer InformationAcquisition Activities,”Journal of Marketing, 55 (January), 10–25.
22 Journal of Air Transportation

Murray, K. B., and Schlacter, J. L. (1990), “The Impact of Services versus Goods onConsumers’ Assessment of Perceived Risk and Variability,”Journal of the Academy ofMarketing Science, 18, 51–65.
Nunnally, J.C. (1978),Psychometric Theory, New York: McGraw-Hill.
Oh, S. (1995), “Customer Evaluations of Telecommunication Service Quality,” FacultyWorking Paper (in Korean), Yonsei University, Korea.
Ostrowski, P. L., O’Brien, T. V., and Gordon, G. L. (1993), “Service Quality and CustomerLoyalty in the Commercial Airline Industry,”Journal of Travel Research, Fall, 16-24.
Parasuraman, A., Berry, L. L., and Zeithaml, V. A., (1991), “Refinement and Reassessment ofthe SERVPERF Scale,”Journal of Retailing, 67 (Winter), 420–450.
Parasuraman, A., Zeithaml, V. A., and Berry, L. L. (1985), “A Conceptual Model of ServiceQuality and Its Implications for Future Research,”Journal of Marketing, 49 (Fall),41–50.
Parasuraman, A., Zeithaml, V. A., and Berry, L. L. (1988), “SERVPERF: A Multiple-ItemScale for Measuring Consumer Perceptions of Service Quality,”Journal of Retailing, 64(Spring), 28–31.
Roehl, W. S. and Fesenmaier, D. R. (1992), “Risk Perceptions and Pleasure Travel: AnExploratory Analysis,”Journal of Travel Research, 30, 4 (Spring), 17–28.
Roselius, T. (1971), “Consumer Rankings of Risk Reduction Methods,”Journal ofMarketing, 35, 56–61.
Sonmez, S. F. and Graefe, A. R. (1998), “Determining Future Travel Behavior from PastTravel Experience and Perceptions of Risk and Safety,”Journal of Travel Research, 37(November), 171–177.
Sweeney, J. C., Soutar, G.N., and Johnson, L. W. (1999), “The Role of Perceived Risk in theQuality-Value Relationship: A Study in a Retail Environment,”Journal of Retailing, 75,1 (Spring), 77–105.
Triandis, H. C. (1976), “Methodological Problems of Comparative Research”, Special Issue,International Journal of Psychology, 11, 3.
Vandamme R. and Leunis, J. (1993), “Development of a Multiple Item Scale for MeasuringHospital Service Quality,”International Journal of Service Industry Management, 4, 3,30–49.
Verhage, B. J., Yavas, U., and Green, R. T. (1991), “Perceived Risk: A Cross-culturalPhenomenon?”International Journal of Research in Marketing, 7, 4, 297–303.
Weber, E. U. and Hsee, C. (1998), “Cross-cultural Differences in Risk Perception, But Cross-cultural Similarities in Attitude Toward Perceived Risk,”Management Science, 44, 9(September), 1205–1217.
Webster, C. (1989), “Can Consumers be Segmented on the Basis of Their Service QualityPerceptions?”The Journal of Service Marketing, 3, 35–53.
Woodside, A. G., Frey, L. L., and Daly, R. T. (1989), “Linking Service Quality, CustomerSatisfaction, and Behavioral Intention,”Journal of Health Care Marketing, 9(December), 5–17.
Cunningham, Young and Lee 23

Young, C. E., Cunningham, L. F. and Lee, M. (1994a), “Assessing the Effectiveness of the AirTravel Consumer Report From a Customer’s Perspective.”Journal of TransportationManagement, 5,1 (Spring), 1994. 47–76.
Young, C. E., Cunningham, L. F. and Lee, M. (1994b), “Assessing Service Quality as anEffective Management Tool: The Case of the Airline Industry,”Journal of MarketingTheory and Practice, Spring, 1994, 1–21.
Young, C. E., Cunningham, L. F., Lee, M., and Evan Douglas (1992), “Measuring AirlineService Quality: Preliminary Findings,”Proceedings of the International Forum onAirline Quality, Washington, D.C., March 6, 1992.
Zeithaml, V. A. (1981), “How Consumer Evaluation Processes Differ Between Goods andServices,” inMarketing of Services, J. H. Donnelly and W. R. George (ed.), Chicago, IL:American Marketing Association, 186–190.
The authors wish to express their appreciation to the Graduate School of Business and theInstitute for International Business at the University of Colorado at Denver for financialsupport and to Ms. Nancy Reed at the Graduate School of Business at the University ofColorado at Denver for editorial assistance.
24 Journal of Air Transportation

APPENDIX ASERVPERF Dimensions and Measures
Tangibles. Physical facilities, equipment, appearance of personnel(alphas = .62, .76)a
1. XYZ has up-to-date equipment.2. XYZ’s physical facilities are visually appealing.3. XYZ’s employees are well dressed and appear neat.4. The appearance of the physical facilities of XYZ is in keeping
with the type of services provided.
Reliability. Ability to perform service dependably and accurately(alpha = 82, .73)
5. When XYZ promises to do something by a certain time, it does so.6. When you have problems, XYZ is sympathetic and reassuring.7. XYZ is dependable.8. XYZ provides its services at the time it promises to do so.9. XYZ keeps its records accurately.
Responsiveness.Willingness to help customers and provide prompt service(alphas = .73, .68)
10. XYZ does not tell customers exactly when services will beperformed. (-)b
11. You do not receive prompt service from XYZ. (-)12. Employees of XYZ are not always willing to help customers. (-)13. Employees of XYZ are too busy to respond to customer requests
promptly. (-)
Assurance.Knowledge and courtesy, ability to inspire trust and confidence(alphas = .69, .81)
14. You can trust employees of XYZ15. You feel safe in your transactions with XYZ’s employees.16. Employees of XYZ are polite.17. Employees get adequate support from XYZ to do their jobs well.
Empathy.Caring, individualized attention (alphas = .82, .80)18. XYZ does not give you individual attention. (-)19. Employees of XYZ do not give you personal attention. (-)20. Employees of XYZ do not know what your needs are. (-)21. XYZ does not have your best interest at heart. (-)22. XYZ does not have operating hours convenient to all their
customers. (-)
a Cronbach’s alphas for the U.S. and Korean samples, respectively.b (-) indicates that the measure is reverse scored.
Cunningham, Young and Lee 25

APPENDIX BAirline Industry-based Dimensions and Their Measures
Baggage Handling(alphas = .68, .71)a
1. Airline baggage handing is prompt and efficient.2. Airline interline agreements work well for the consumer.3. Airline check-in is efficient.
Bumping Procedures(alphas = .70, .67)4. Airline bumping procedures are unfair/inconvenient. (-)5. Airline bumping procedures provide inadequate compensation for
the trouble caused to the consumer. (-)6. Information provided by airline at airport is inadequate. (-)
Operations and Safety(alphas = .70, .67)7. Ticket and reservations procedures prior to arrival at the airport
are adequate.8. Airline is safe.9. Airline selects the right equipment for trips.
10. Amenities provided by airline are important to the comfort ofpassengers.
11. Airline distinguishes between each class through service
In-flight Comfort(alphas = .82, .80)12. Airline seats have good pitch.13. Airline seats are wide enough.14. There is enough room in the aisles.15. The layout of seats in aircraft is just right.16. Airline food and beverage service is good.
Connections(alphas = .86, .81)17. Airline offers sufficient flight frequency.18. Airline offers flights at right times of the day and night.19. Airline correctly coordinates connections.20. Airline offers sufficient non-stop flights.21. Airline offers sufficient connecting flights.
a Cronbach’s alphas for the U.S. and Korean samples, respectively.b (-) indicates that the measure is reverse scored.
26 Journal of Air Transportation