Embed Size (px)
Citation preview

S O P H E O N 2 0 1 1
A N N U A L R E P O R T
Where innovation means business™

Sopheon is an international provider of software and services.
Sopheon’s solutions structure, align and manage
innovation processes to help organizations generate
more revenues and profits from new products.

Summary Results and Trends ................................. 5
Statement from the Chairman and Chief Executive Officer ........................................... 6
Financial and Operating Review ............................ 8
Product and Market Overview ............................11
Directors and Advisors .........................................16
Report on Directors’ Remuneration .................17
Directors’ Report ...................................................21
Statement of Directors’ Responsibilities ...........23
Auditors’ Report .....................................................24
Consolidated Income Statements .......................26
Consolidated and Company Balance Sheets .........................................................27
Consolidated and Company Cash Flow Statements ...........................................28
Consolidated and Company Statements of Changes in Equity ..............................................29
Notes to the Financial Statements .....................30

Sopheon is an international provider of software and services.Sopheon's end-to-end solutions structure, manage, and align
enterprise innovation management processes to improve the business impact of product innovation.

Num
ber
of C
usto
mer
s
200
180
160
140
120
100
80
60
40
20
0
2002 2003 2004 2005 2006 2007 2008 2009 20112010
In 2011, we grew our customer base to 185 licensees.
Summary Results and Trends
We have grown our business by an annualized average of 25% since the launch of Accolade. In 2011, we saw a total of 54 license orders, of which 40 were extensions. Revenue from existing customers rose from 74% to 88% of total.
2002 2003 2004 2005 2006 2007
Recurring Revenues Extensions
2008 20112009
GB
P £
’000
12000
10000
8000
6000
4000
2000
0
45
40
35
30
25
20
15
10
5
0
Uni
ts
2010
After a tough 2009, growth was strong in 2010. In 2011, we saw continued high activity from existing customers but a slower pace of investment from new customers, resulting in a flat performance. We have reorganized to improve focus on both areas. Looking ahead, our sales pipeline remains very active and includes a number of substantial opportunities – including some from accounts that signed initial business in 2011 – and which we expect to bear fruit in 2012.
2011 2010 2009 2008 2007
Revenue £'000 10,276 10,537 8,260 9,304 6,332 EBITDA £'000 1,491 1,510 (195) 1,120 113 Profit before tax £'000 104 171 (1,494) 44 (443)Earnings per share pence 0.07 0.10 (1.03) 0.02 (0.32) Pre financing cashflow £'000 151 1,320 (1,276) 896 (551) Net Assets £'000 3,082 3,008 2,685 4,268 3,310 Gross Cash £'000 2,941 3,358 1,624 2,586 2,053 Working capital £'000 3,289 4,145 2,001 3,068 2,140 Long term liabilities £'000 (1,663) (2,290) (1,222) (1,105) (1,195)
Working capital is calculated as net current assets after adding back deferred income.

Performance
The past year was one of mixed results for Sopheon. We feel very positive about the advances we have made within our business over time. In 2011, however, these changes did not produce the expected financial growth. Revenues totaled £10.3m, broadly similar to the £10.5m generated in 2010. In fact, if adjustments are made for the effect of exchange rate movements, revenues in 2011 were the same as in 2010. EBITDA of £1.5m was also the same as 2010. Thanks to strict control of costs, and enhanced conversion of development costs into product, we achieved these results despite the expansion of staff in sales, services and development. For the second year in a row, we are also pleased to report a positive bottom line profit after tax of £104,000 (2010: £152,000).
Total license transactions including extension orders were 54 in 2011 (2010: 58). We experienced good growth in services and maintenance revenues, but license income represented only 29 percent of our total income, compared to 37 percent in 2010. Some of this shift in apportionment is explained by new customers making smaller initial investments, and then extending implementation across multiple years. The rest is largely due to higher-than-expected levels of customer extension activity compared to new client acquisition.
From a geographical standpoint, the relative contributions of the US and European markets remained broadly steady at 64 percent and 36 percent respectively. Performance of newer product lines improved in 2011 driven partly by our continued investment in development. Our innovation planning solution, Accolade® Vision Strategist™, and our new-product ideation offering, Accolade Idea Lab™, contributed 11 percent and 5 percent of total revenues, compared to 9 percent and 3 percent respectively in 2010. Income from the sale of our core innovation process support solution, Accolade Process Manager™, accounted for the remainder of the total.
At the date of this report, full-year 2012 revenue visibility incorporating booked revenue, contracted services business and the run rate of recurring contracts stands at more than £6.0m, compared to £5.2m at the same time last year. Revenue visibility is more fully defined in Note 4.
Strategy and Product
We have previously stated that Sopheon’s growth strategies for 2012 and beyond center on three key objectives:
• Increase our rate of growth by deploying vertical-specific marketing strategies. Our revised marketing approach comprises a vertical-specific, integrated mix of tactics ranging from digital advertising campaigns and web-based events to conferences, direct mail and social media programs. Target sectors include consumer packaged goods, and aerospace and defense.
• Broaden the use of our solutions within existing accounts. We have introduced a range of new products
and services over the past two years, supporting them with account management and marketing programs directed exclusively into our customer base. Most recently, we reorganized our sales teams to segregate and sharpen the focus between generating additional revenue from existing customers and adding new accounts.
• Expand direct and indirect distribution channels to acquire new accounts. During 2011, we widened sales coverage geographically with new hires on the US West Coast and in Germany. We also continued to build our relationships with consulting partners. In some cases, the initiative includes development and commercialization of joint offerings. Universally, these partnerships are calculated to leverage complementary skills and reciprocal account introductions to generate new customers.
6 STATEMENT FROM THE CHAIRMAN AND CHIEF EXECUTIVE OFFICER
S T A T E M E N T F R O M T h E C h A I R M A N
A N D C h I E F E x E C U T I V E O F F I C E R
Accolade® is a registered trademark of Sopheon plc.Vision StrategistTM, Process Manager™ and Idea Lab™ are trademarks of Sopheon plc.

During 2011, we invested in all three of these objectives. We made progress in some areas. Where we found progress lagging, we made adjustments. We look for the payoff from these efforts to be reflected in our 2012 results. On the product front, 2011 was a milestone year for Sopheon. First, we completed a full refresh of the technology platform upon which our core software offerings are built, and as a result, these are now wholly based on the current Microsoft® software framework, “.net”. This achievement is the culmination of a multi-year effort that was conducted in tandem with the continued creation and commercialization of new product features and functionality. During 2011, we also introduced a new agile development methodology which will allow us to systematically introduce multiple product releases during the course of a year, rather than larger releases separated by long intervals of time. The combination of the platform change and switch in methodology provides a mix of important advantages. Principal among them is that we will be able to build products faster and do a better job of ensuring that they are in step with real customer needs. In 2012, these changes give us a springboard for the introduction of a number of new functional releases that we expect will advance the value of our solutions in a range of markets.
Sopheon remains unique in offering an all-in-one software system that encompasses support for strategic innovation planning, ideation, product development process execution, and portfolio management across the entire product lifecycle. The strength of our market position has been validated by analysts. Our decision to sustain internal product development investment despite the recent, ongoing economic uncertainty is serving us well in the present and will continue to fortify our business performance and potential in the days ahead.
People
Sopheon is differentiated in the market by its reputation for deep domain expertise in innovation management. That know-how is embodied in our people, whose best-practice understanding and experience have been developed through many years of helping top businesses achieve innovation success. We are very proud of the commitment that our people have shown in lifting Sopheon to a position of leadership in this area and in building on that standing throughout the recent economic turbulence.
Sopheon continues to grow and develop our people. We are selective about whom we add to the team. And when someone joins, our actions reflect that we understand the importance of transferring as rapidly as possible what we have learned over time. We recently kicked off an initiative to package key aspects of our unique experience and knowledge into formal on-boarding and certification training. In 2012, as this initiative is rolled out, our goal is to reduce the ramp-up time for new employees. This, in turn, will improve our ability to scale our organization as the company continues to grow, without jeopardizing critical standards for high levels of customer satisfaction. In 2011, also with the goal of better positioning Sopheon for growth, we reported having taken steps to restructure and strengthen Sopheon’s executive management team. Our commercial operations are now organized on a regional basis, with teams in North America and Europe, led by Mike Ducatelli and Jim Conroy respectively. Jim is a new appointment who brings an extensive track record of sales leadership success to our European business. he earlier held similar positions at Agentrics, Demantra, and Cap Gemini.
The Sopheon plc board is made up of three executive directors, augmented by three non-executive directors who bring a wealth of knowledge and experience to our business. Details about each board member can be found on the inside back cover of this report.
Outlook
Buoyed by strong 2010 results, we expected another year of financial progress in 2011. Instead, we essentially matched the prior year performance. The principal reason was a fall in license revenues. We attribute this drop-off in part to strong demand from our client base for extension business, which absorbed the attention of our sales team and diverted energy from winning new clients. We have since reorganized our sales resources to ensure a more focused attention to both areas. We believe this will be reflected in improved license performance in 2012, building on our service and maintenance income streams, which are now each at run-rates of around £1m a quarter. Accordingly, we remain positive about the growth outlook for the business.
We entered 2011 looking to take advantage of an improving business climate. This included controlled expansion of staff levels in key areas. As previously reported, we also took action in late 2010 to improve our working capital position to provide the group with flexibility to react to any new, viable market opportunities that arose. This strategy has enabled continued investment where it is judged necessary to near- and mid-term business performance. Accordingly, we are maintaining staffing levels and in fact making further controlled investments in sales and services resources to stimulate and support future growth. Notwithstanding this stance, we are fully conscious of the need to remain vigilant in matching costs to revenue expectations, not least due to the continued uncertainty in the global economy.
Looking ahead, our sales pipeline remains very active and includes a number of substantial opportunities from both new and existing customers – including some accounts that signed initial business in 2011 – and which we expect to bear fruit in 2012.
Barry Mence Andy MichudaExecutive Chairman Chief Executive Officer
21 March 2012
7STATEMENT FROM THE CHAIRMAN AND CHIEF EXECUTIVE OFFICER
Microsoft® is a registered trademark of the Microsoft Corporation in the United States and/or in other countries.

F I N A N C I A L A N D O P E R A T I N G R E V I E W
Trading Performance
Sopheon’s consolidated turnover in 2011 was £10.3m, compared to £10.5m in 2010 and £8.3m in 2009. Although the average Euro rate remained broadly constant relative to Sterling during 2011, there was a fall in the US Dollar rate which negatively impacted revenues by £200,000. Adjusting for this movement in currency value, revenues were flat year-on-year. Furthermore, the split of total revenues between North American and European territories also remained broadly constant year-on-year.
Total license transactions including extension orders were 54 in 2011 compared to 58 in 2010, a reduction of 7 percent. Accolade Vision Strategist contributed approximately 11 percent of total revenues during 2011 compared to 9 percent in 2010. Our Idea Lab solution contributed 5 percent of revenues compared to 3 percent the year before. historically, our performance in the fourth quarter has tended to be very strong and provided a substantial boost to overall annual revenues. In 2011, although the third quarter showed substantial growth over the third quarter of 2010, in the final quarter we did not match our record revenues of £3.5m in the fourth quarter of 2010.
Business Mix
The annualized average growth of the business since the launch of Accolade is 25 percent, but as noted above, the year-on-year performance between 2010 and 2011 was flat. Within this overall picture, maintenance and services revenues delivered increases of 11 percent and 13 percent respectively; however, license revenues fell 25 percent. We believe the pause in license revenue is, in part, symptomatic of the sensitivity of our results to individual sales events. Compounding this issue, we are seeing an evolution of buying patterns whereby customers are increasingly likely to demand extended validation phases, pilot projects and phased license orders as opposed to making substantial one-off orders as in the past. A number of new 2011 customer transactions followed this pattern. The fact that new-account sales are taking more time contributed in 2011 to a greater proportion of revenues being recorded from existing customers. Approximately 79 percent of the value of non-recurring orders in 2011 was derived from our existing customers, compared to 62 percent the year before. We recognize the importance to long-term growth prospects of bringing on new customers. As noted earlier, we believe most of the customer investment cycles started in 2011 will come to fruition in 2012. As was also noted earlier, the strength of demand from our customer base has absorbed much attention from our sales teams, and we have accordingly taken action to reorganize and improve the focus on winning new customers, without compromising our existing customer relationships. The continued growth in add-on business from existing customers underlines both the inherent value of our solutions, and the extended business opportunity for Sopheon from each new customer we sign.
Similar to prior years certain customers reorganized and rationalized in reaction to the economic conditions, resulting in termination of some maintenance contracts. The base of recurring business is now £3.9m compared to similar levels coming into 2011 and £3.7m coming into 2010. The majority of this income is represented by maintenance services, but also includes hosting services and license rentals. Overall, in 2011 our business delivered a 29:38:33 ratio of licenses, maintenance, and services respectively compared to 37:34:29 in the previous year.
Overall gross margins have fallen slightly to 73 percent (2010: 75 percent) which can be largely attributed to the relative increase in service compared to license revenues and the associated higher costs. Within this overall picture, we did incur approximately £0.3m of third-party software costs (2010: £0.2m). As we have noted in prior annual reports, we anticipated that license margins will be affected by decisions to embed, rather than build, certain third-party components or methods of working into our software. This is expected to continue going forward. In the services area, higher revenues resulted in a rise in the overall cost of service resources. however, salary costs remained fairly constant as we continued to extend capacity through subcontractors. We expect this balance to shift back towards permanent resources in 2012 and have already made key additional hires in this area. This should have a beneficial impact on services margins.
Research and Development Expenditure
having sustained investment in product development during the course of 2009, we made some reductions coming into 2010. Budgets for development were held through 2010, and then gradually released in the final quarter of the year and early 2011. These expanded development resources have resulted in higher total expenditures in research and development year-over-year. however, as in 2009, these resources were more focused on specific product releases
8 FINANCIAL AND OPERATING REVIEW

which enhanced the level of investment in capitalized development costs. Accordingly, headline research and development expenditures reported in the income statement fell to £2.2m, compared to £2.4m in 2010. This apparent reduction of £0.2m (2010: £0.2m increase) is attributable to the net impact of capitalization, amortization and impairment charges associated with research and development. The amount of 2011 research and development expenditure that met the criteria of IAS38 for capitalization was £1.1m (2010: £0.7m).
Sopheon is committed to product leadership, with excellence in research and development a core competency of the group. Since 2001 Sopheon’s reported research and development costs each year have been at least 20 percent of revenues reported in that year. For 2011, this metric was 21 percent (2010: 23 percent).
Operating Costs
Of relevance to all aspects of the income statement is the fact that the strong performance in 2010 led to a maximum bonus award being made to all members of the group who were on the corporate bonus scheme. This covered the majority of the group’s executives and employees, with the principal exception of the sales teams, for whom incentives are tied to individual or territory results. The costs of the bonus were allocated to the relevant categories of the income statement. Due to raised targets, bonuses are not payable for 2011; this reduction almost completely offset the higher costs arising from staff increases and greater use of subcontractor resources.
Detailed comments regarding professional services and research and development costs are noted above. headline sales and marketing costs have fallen from £3.6m in 2010 to £3.5m in 2011. As with professional services and research and development, actual fixed costs rose year-on-year but this was offset by lower commissions and bonus costs, as well as a lower amortization and impairment charges for the intangible customer assets acquired with Alignent in 2007.
headline administration costs have fallen by £0.1m. Much of the fall can be attributed to reductions in bonus cost. Unlike operational areas, this was not offset by higher staffing as we maintained constant resources in these areas year-over-year. Underlying administration costs and resourcing have remained broadly constant, as they have since 2007. Within this total there have been a number of movements. For example, rent and insurance costs are down, whereas professional fees and information technology costs have risen. Such costs will continue to be managed tightly as the group expands operational resources.
Results
The combined effect of the revenue and cost performance discussed above has resulted in Sopheon’s EBITDA (Earnings before Interest, Tax, Depreciation and Amortization) performance for 2011 staying constant at £1.5m, the same as for 2010.
In common with other businesses in our sector, the board believes EBITDA provides a useful indicator of the operating performance of our business by removing the effect on earnings of tax, capital spend and financing. EBITDA is further defined and reconciled to the profit before tax in Note 4 of the financial statements. Our calculation of EBITDA is stated after charging (i) share-based payments of £40,000 (2010: £81,000); (ii) impairment charges of acquired intangible assets of £65,000 (2010: £180,000); and (iii) exchange gains of £55,000 (2010: £7,000) but excludes depreciation and amortization charges for the year of £1.0m (2010: £1.1m) and net finance costs of £0.4m (2010: £0.3m).
Including the effect of interest, depreciation and amortization, the group reported a profit before tax for the year of £104,000 (2010: £171,000). No tax has been provided, compared to £19,000 in 2010 representing US Alternative Minimum Tax chargeable on US profits. The profit per ordinary share was 0.07p (2010: 0.10p).
Financing and Balance Sheet
Consolidated net assets at the end of the year stood at £3.1m (2010: £3.0m). Cash and cash equivalents at 31 December 2011 amounted to £2.9m (2010: £3.4m). Approximately £1.8m was held in US Dollars, £0.9m in Euros and £0.2m in Sterling.
Intangible assets stood at £3.7m (2010: £3.6m) at the end of the year. This includes (i) £2.7m being the net book value of capitalized research and development (2010: £2.4m) and (ii) an additional £1.0m (2009: £1.2m) being the net book value of Alignent intangible assets acquired in 2007. The carrying value of the Alignent intangibles has been impacted by both amortization and impairment charges. Further details are set forth in Note 14.
9FINANCIAL AND OPERATING REVIEW

In June 2007, the group entered into a $3.5m, 48-month mezzanine term loan with BlueCrest Capital Finance (“BlueCrest”), in connection with its acquisition of Alignent Software Inc. This term loan was repayable in equal monthly installments through to July 2011. In December 2010 the group signed an agreement with BlueCrest to refresh the mezzanine term loan back up to $3.5m, for a new 39-month term, repayable in equal monthly installments of $90,000 plus interest through March 2014. The loan bears interest at 13 percent per annum. No warrants were issued to BlueCrest in connection with the transaction.
In addition to the term loan, for a number of years the group has had access to a revolving line of credit with BlueCrest, secured against the trade receivables of Sopheon’s North American business and with a maximum draw capacity of $1.25m. The facility is periodically renewable and the next renewal date is 31 May 2012.
In October 2009, the company issued £850,000 of convertible unsecured loan stock (the “Loan Stock”) to a group of investors including key members of the board and senior management team. The Loan Stock has a conversion price of 7.75p per share, and matures on 31 January 2013.
Sopheon’s equity line of credit facility with GEM Global Yield Fund Limited ("GEM") was due to expire on 23 December 2011. During the year, GEM agreed to implement a further two year extension at no cost to Sopheon, through to 23 December 2013. The facility has been used to raise working capital once, in March 2004, leaving approximately 90 percent of the original €10m facility available under the extended agreement. Drawings under the GEM equity line of credit are subject to conditions relating inter alia to trading volumes in Sopheon shares.
The principal risks and uncertainties facing the group are further described in the Directors’ Report on pages 21 to 22.
1 0 FINANCIAL AND OPERATING REVIEW

1 1PRODUCT AND MARKET OVERVIEW
Sopheon’s Accolade solution is the first software system in the industry to provide end-to-end support for innovation management, including enablement of strategic innovation planning, ideation, product portfolio management, and innovation process execution.
P R O D U C T A N D M A R K E T O V E R V I E W
Manufacturers throughout the world are scrambling to respond to unstable economic conditions, increased material costs and price-sensitive markets. Success depends upon agility, in particular a capacity to make fast, informed adjustments to strategic plans and continually reorder operating priorities to align with external change.
Innovation is increasingly viewed as the principal remaining lever for improving business value. But such opportunities do not come without risk. In their pursuit of innovation success, executives are literally betting the future of their organizations on decisions about where to invest limited resources. Poor decisions on innovation investments can generally be traced to one of four factors:
1) Failure to anticipate the impact of short-term decisions on long-term strategy. Operational decisions are often made without a clear understanding of their probable impact on long-term strategies, or how those decisions might be affected by shifts in market dynamics and product and technology investments.
2) Lack of transparency. Decision makers can’t get a clear picture of where their innovation resources are being spent, or on investment options.
3) Inability to judge what is valuable (and what is not). Organizations often lack market-driven processes for determining the potential business value of investment alternatives. As a result, spending decisions are based on little more than gut feel.
4) Inability to bring innovation to market with speed. Today, global and local market conditions fluctuate at unprecedented rates. Windows of business opportunity can close as fast as they open. Companies that are unable to quickly conceive, develop and commercialize innovative products to fulfill emerging needs are at a serious competitive disadvantage.
Sopheon is recognized as a global leader in the provision of solutions for innovation management. Our software and services deliver comprehensive support for the system of cross-functional decision-making that determines, aligns and manages innovation activity. This capacity, which defines innovation management, helps ensure that executives make the right decisions about where to spend their innovation resources. Ultimately, Sopheon’s solutions enable companies to increase profits and revenues from innovation investments.

Sopheon’s Solutions
Sopheon’s Accolade solution is the first software system in the industry to provide end-to-end support for innovation management, including enablement of strategic innovation planning, ideation, product portfolio management, and innovation process execution. Accolade’s Vision Strategist component automates the strategic roadmapping process, allowing users to visualize and forecast the future of products, markets and technologies. Accolade Idea Lab helps organizations generate, select and develop winning product and service ideas. Accolade Process Manager automates the product innovation process and provides strategic decision support for the management of product portfolios.
Sopheon’s software helps to demystify research and development by providing dynamic, real-time visibility to planning and project information and aligning innovation efforts across the organization. It allows executives and cross-functional teams to more effectively assess the business opportunities and risks associated with product innovation initiatives, the short-term cost implications of such initiatives, and their likely impact on long-term strategies and objectives for revenue and profit growth.
Through their use of Sopheon’s software, organizations are able to:
1) Improve strategic agility and “uncertainty planning." Our solutions support agility in strategic planning by rapidly moving decision-relevant information both vertically and horizontally inside the organization. The easy flow of data permits senior executives to know and react quickly when project details change or external events suddenly demand adjustments or refinements. The software also makes it possible for senior leadership, planning and product development teams to understand the dependencies among existing initiatives and anticipate how near-term decisions are likely to affect long-term strategies and performance goals.
2) Make faster, better-informed portfolio decisions. Strong portfolio management helps organizations optimize limited resources. Sopheon’s software makes it possible for users to see in real time where innovation resources are invested. The solutions’ dashboards consolidate, aggregate and present metrics so that information can be monitored at a glance. Innovation plans and projects can be stored in one place so that access is quick and easy.
3) Identify, prioritize and act on the most promising innovation opportunities. Users of Sopheon’s software can objectively separate winning innovation opportunities from losers early in the development cycle, helping to keep investments concentrated on high-value opportunities. Unique knowledge management capabilities and “smart” technology enable brainstorming and discovery, contributing to a steady flow of innovative ideas. Features such as scorecards, tailored idea-selection criteria, resource reports and information-gathering, and presentation templates grounded in best practices strengthen process management and minimize innovation risk.
4) Keep daily operational activities aligned with organizational strategies for growth. An estimated 65 percent of companies struggle to keep product portfolios and operational and project activity aligned with corporate strategic plans. One common result is that the execution of new product initiatives is inefficient and even conflicted, crippling the organization’s ability to respond to new market opportunities. Sopheon’s solutions create a seamless, automated process and decision framework that continually reconciles strategic product planning and operational execution. The impact is to dramatically reduce the time it takes to bring new products to market.
“It really doesn’t matter what sector a business operates in, Sopheon’s solutions provide an opportunity for much greater product development efficiency and accuracy.” — Martin Butler Research
Business Solution AuditApril 2011
The Market
Sopheon’s solutions belong to a major class of software applications that concentrate on supporting product lifecycle management (PLM). The purpose of this applications group is to help companies develop and execute their product strategies.
The PLM market is made of multiple submarkets. Some of these submarkets, such as product data management (PDM), are mature. Others are new and emerging. One of the emerging submarkets is called “Product Portfolio Management” (PPM). The analysts view Sopheon as a specialty vendor in PPM. Software solutions in most areas of product lifecycle management concentrate on the engineering or technical challenges involved in managing a product while it is under development. Sopheon’s solutions are designed to instead address the business challenges that can impede the achievement of profitable innovation, including the management of innovation risk and reward.
1 2 PRODUCT AND MARKET OVERVIEW

1 3PRODUCT AND MARKET OVERVIEW
Analysts have labeled Accolade as best-of-breed among solutions in the product portfolio management subclass. They consider PPM to be a strategically critical applications area. Their research findings indicate that adoption of PPM methodologies enables users to more objectively assess product innovation investment options and increase the number of products that achieve commercial success. Forrester, the prominent IT research and analyst firm, has identified Sopheon as one of the clear market-share leaders among specialty providers of project and portfolio management tools for product development. Uk-based Martin Butler Research published an audit in April of 2011 on Sopheon’s complete line of solutions. The analysis credited Sopheon with excellent product development process management capabilities, deep domain experience, and a broad range of support services.
“[Gartner] client feedback suggests that most manufacturers still prefer the [product portfolio management] capabilities of specialty vendors over offerings made by the large PLM vendors or ERP vendors. If a manufacturer is focused on tools and techniques to valuate opportunities and products in a portfolio, [or] more focused on managing the product development process for multiple activities in a portfolio, specialty vendors still have an advantage.” — Gartner
“Hype Cycle for Manufacturing Product Life Cycle and Operations Management, 2011”
July 2011
Growth Strategy
For Sopheon, as for many of our customers, 2011 was a year that challenged us to prudently apply our operational resources across a mix of potential areas for business development. Through these efforts we achieved strong growth in our existing account base. This success was fundamental to our strategies because a healthy customer population provides a critical foundation for continued revenue expansion as markets rebound from recent economic turbulence. however, this predominate focus on servicing existing customers came with a price. It diverted attention and resources away from generating new business. The result was a drop-off in our acquisition of new accounts. What’s more, the new customers we won in 2011 exhibited a tendency to buy licenses over time, instead of as in the past, purchasing sufficient volumes up front to satisfy their mid- and long-term needs. This is a further example of the frugality that characterizes today’s business practices. We have taken action to invest in additional resources that will be focused on the acquisition of new customers in 2012. We expect to begin realizing a return on these investments during the next 18 months.
Client Base
As the size of our customer population continues to expand, so too do Sopheon’s opportunities for growth. In 2011, 79 percent of Sopheon’s revenues came from new orders out of the installed base. This income can be credited in part to our decision, despite the economic downturn, to maintain historic investment levels in product development and to focus commercial resources on deepening our relationships with existing accounts. The enhancements to our solutions resulting from these investments played a direct role in encouraging current customers to take further advantage of Accolade’s value, generally in one of three scenarios:
1) Enterprise expansion of Accolade use. Existing customers continued to extend their initial deployments of our software, adding licenses to enable product innovation in more business units or other areas of the enterprise.
2) Support for advanced levels of innovation management. Sopheon has tight, extended partnerships with a growing group of customers who are strategically committed to raising the maturity of their innovation-management systems to world-class levels. The majority of these accounts invested in additional, more advanced software modules and engaged Sopheon to provide guidance services.
Product Portfolio ManagementStrategic Innovation Planning and Process Execution
PDM/Formula ManagementCAD Diagrams, Change Orders, ROMs
ERP/CRMSales, Supply Chain, Mfg Costs, Sales Forecasts
The Business Layer of PLM
The Transactional Layer of PLM
The Technical Layer of PLM
Business analysts have placed Sopheon’s Accolade system in a subclass of product lifecycle management applications referred to as product portfolio management solutions.
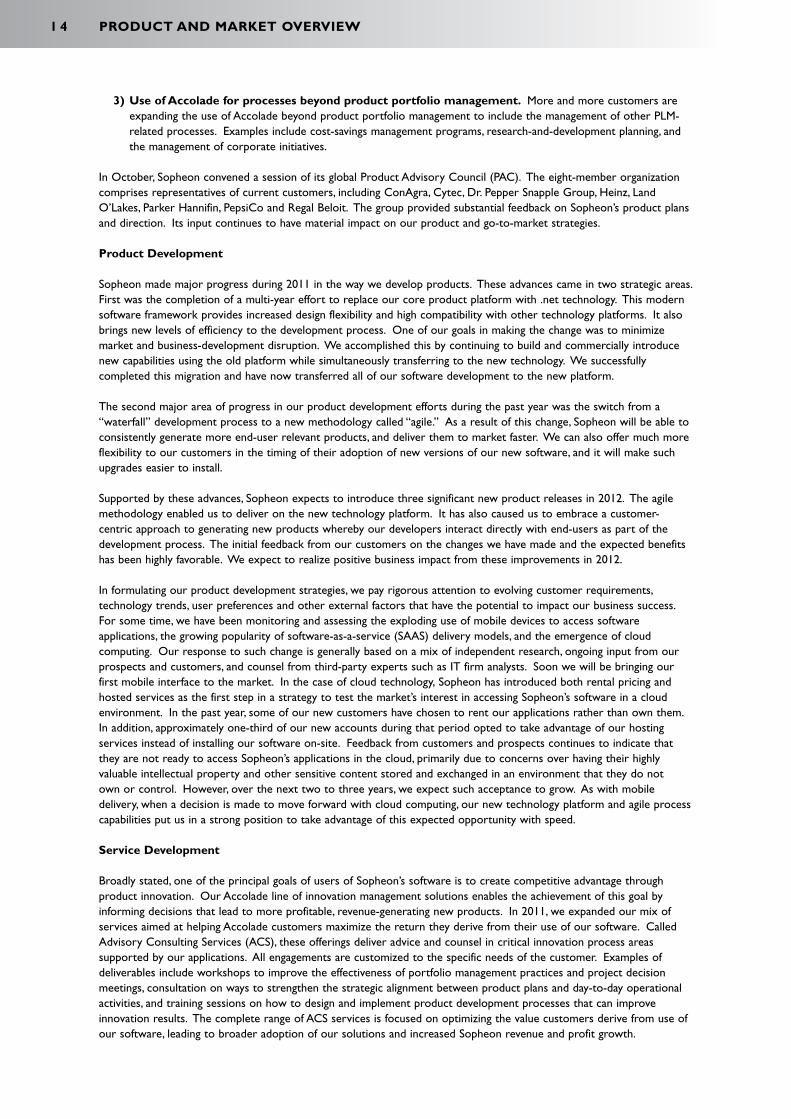
3) Use of Accolade for processes beyond product portfolio management. More and more customers are expanding the use of Accolade beyond product portfolio management to include the management of other PLM-related processes. Examples include cost-savings management programs, research-and-development planning, and the management of corporate initiatives.
In October, Sopheon convened a session of its global Product Advisory Council (PAC). The eight-member organization comprises representatives of current customers, including ConAgra, Cytec, Dr. Pepper Snapple Group, heinz, Land O’Lakes, Parker hannifin, PepsiCo and Regal Beloit. The group provided substantial feedback on Sopheon’s product plans and direction. Its input continues to have material impact on our product and go-to-market strategies.
Product Development
Sopheon made major progress during 2011 in the way we develop products. These advances came in two strategic areas. First was the completion of a multi-year effort to replace our core product platform with .net technology. This modern software framework provides increased design flexibility and high compatibility with other technology platforms. It also brings new levels of efficiency to the development process. One of our goals in making the change was to minimize market and business-development disruption. We accomplished this by continuing to build and commercially introduce new capabilities using the old platform while simultaneously transferring to the new technology. We successfully completed this migration and have now transferred all of our software development to the new platform.
The second major area of progress in our product development efforts during the past year was the switch from a “waterfall” development process to a new methodology called “agile.” As a result of this change, Sopheon will be able to consistently generate more end-user relevant products, and deliver them to market faster. We can also offer much more flexibility to our customers in the timing of their adoption of new versions of our new software, and it will make such upgrades easier to install.
Supported by these advances, Sopheon expects to introduce three significant new product releases in 2012. The agile methodology enabled us to deliver on the new technology platform. It has also caused us to embrace a customer-centric approach to generating new products whereby our developers interact directly with end-users as part of the development process. The initial feedback from our customers on the changes we have made and the expected benefits has been highly favorable. We expect to realize positive business impact from these improvements in 2012.
In formulating our product development strategies, we pay rigorous attention to evolving customer requirements, technology trends, user preferences and other external factors that have the potential to impact our business success. For some time, we have been monitoring and assessing the exploding use of mobile devices to access software applications, the growing popularity of software-as-a-service (SAAS) delivery models, and the emergence of cloud computing. Our response to such change is generally based on a mix of independent research, ongoing input from our prospects and customers, and counsel from third-party experts such as IT firm analysts. Soon we will be bringing our first mobile interface to the market. In the case of cloud technology, Sopheon has introduced both rental pricing and hosted services as the first step in a strategy to test the market’s interest in accessing Sopheon’s software in a cloud environment. In the past year, some of our new customers have chosen to rent our applications rather than own them. In addition, approximately one-third of our new accounts during that period opted to take advantage of our hosting services instead of installing our software on-site. Feedback from customers and prospects continues to indicate that they are not ready to access Sopheon’s applications in the cloud, primarily due to concerns over having their highly valuable intellectual property and other sensitive content stored and exchanged in an environment that they do not own or control. however, over the next two to three years, we expect such acceptance to grow. As with mobile delivery, when a decision is made to move forward with cloud computing, our new technology platform and agile process capabilities put us in a strong position to take advantage of this expected opportunity with speed.
Service Development
Broadly stated, one of the principal goals of users of Sopheon’s software is to create competitive advantage through product innovation. Our Accolade line of innovation management solutions enables the achievement of this goal by informing decisions that lead to more profitable, revenue-generating new products. In 2011, we expanded our mix of services aimed at helping Accolade customers maximize the return they derive from their use of our software. Called Advisory Consulting Services (ACS), these offerings deliver advice and counsel in critical innovation process areas supported by our applications. All engagements are customized to the specific needs of the customer. Examples of deliverables include workshops to improve the effectiveness of portfolio management practices and project decision meetings, consultation on ways to strengthen the strategic alignment between product plans and day-to-day operational activities, and training sessions on how to design and implement product development processes that can improve innovation results. The complete range of ACS services is focused on optimizing the value customers derive from use of our software, leading to broader adoption of our solutions and increased Sopheon revenue and profit growth.
1 4 PRODUCT AND MARKET OVERVIEW

1 5PRODUCT AND MARKET OVERVIEW
Core Markets
Sopheon’s marketing and business development efforts in 2011 continued to focus primarily on manufacturers of chemicals, paper, consumer goods and federal, aerospace and defense (FA&D) products and programs. More than half of our customer base is comprised of companies from these markets, a circumstance that has accelerated our development of industry-specific domain expertise. The resulting best-practice knowledge and proprietary tools and techniques are often a decisive advantage as we compete for additional business in these verticals. We recently received additional validation of our growing prominence in consumer goods markets. For the second consecutive year, Sopheon was named one of the top 10 suppliers of new product development and introduction solutions to manufacturers in the sector based on a survey of senior-executive readers of Consumer Goods Technology magazine. The company was further recognized by the industry for its sponsorship of a widely cited research study on the challenges facing consumer goods manufacturers in their pursuit of successful product innovation.
Sixty-four percent of the senior executives participating in a 2011 Sopheon/CGT study of innovation practices in the consumer goods industry identified portfolio management challenges as one of the issues impeding their product innovation success.
Although Sopheon remains committed to expanding its business within the federal, aerospace and defense sector, 2011 was a challenging year in these markets. Many government programs were put on hold due to budget constraints. We are expecting this sector to recover in 2012.
Partnerships
Reseller Partners
As we have indicated, one of the keys to increasing our rate of growth is to gain more business through third-party resellers. We previously reported having established affiliate or reseller relationships with organizations in Germany, France, the United kingdom, Australia, New Zealand and korea. During 2011, resellers generated 6 percent of Sopheon’s total revenues, matching their percent contribution in 2010. The fact that their level of contribution didn’t change was indicative of a difficult year when many prospective buyers remained preoccupied with the effects of continued economic turbulence. But the performance of our reseller network also reflected our struggles in scaling this program for growth. During 2011, we introduced resellers to a number of new tools and a broad range of new product capabilities. Overall, we remain very pleased with the strength of their commitment to advancing their efforts on our behalf. In February of this year, many of our reseller partners again invested in joining us for our global sales conference to learn about our newest product and service capabilities.
Consulting Partners
In 2011, we maintained our relationships with a core group of consulting services organizations, including Arthur D. Little, Deloitte, kalypso, and Stage-Gate® International. Following through on earlier-announced plans, we are developing relationships with additional partners. Of note in this area is some joint project activity with Accenture. We recently extended our partner association with Microsoft, qualifying for Gold competency as an independent solution vendor. The Gold designation places Sopheon in the top one percent of members of Microsoft’s partner network.
We continue to experience regular contact from consulting firms exploring Sopheon’s interest in partnership opportunities. As the depressed economy eroded demand for enterprise resource-planning (ERP) deployments, the consulting organizations whose services are designed to support such large-scale implementations saw business decline. Many seeking new business opportunities were attracted by the growth trends and long-term promise of the innovation management market. Sopheon is now working with a number of these firms whose services complement our software applications and can help us bring more value to our customers. We anticipate expanding our ecosystem of consulting partners throughout the coming year. Our Advisory Consulting Services team is playing an important role in the education and training of these new partners as we work jointly on commercial projects. One of our goals in 2012 is to formalize two of these relationships where the affiliation includes the partner’s creation of a center-of-excellence practice supporting Sopheon’s Accolade offering.
Stage-Gate® is a registered trademark of the Product Development Institute, Inc.

D I R E C T O R S A N D A D V I S O R S
Directors Barry k. Mence Executive Chairman Andrew L. Michuda Chief Executive Officer Arif karimjee ACA Finance Director Stuart A. Silcock FCA Non-executive Director Bernard P. F. Al Non-executive Director Daniel Metzger Non-executive Director
Secretary Arif karimjee
Registered Office Surrey Technology Centre 40 Occam Road, Surrey Research Park Guildford, Surrey GU2 7YG
Registered Name and Number Sopheon plc. Registered in England and Wales No. 3217859
Auditors BDO LLP 55 Baker Street London W1U 7EU
Principal Bankers and Financiers Silicon Valley Bank Lloyds TSB Bank plc. 3003 Tasman Drive 77 high Street Santa Clara, CA 95054 Southend-on-Sea United States Essex SS1 1hT
BlueCrest Capital Finance, LLC 225 West Washington, Suite 200 Chicago, IL 60606 United States
Solicitors and Attorneys Squire Sanders Briggs and Morgan 7 Devonshire Square 2200 IDS Center, 80 South Eighth Street Cutlers Gardens Minneapolis, MN 55402 London EC2M 4Yh United States
Loyens & Loeff Fred Roeskestraat 100 1076 ED Amsterdam The Netherlands
AIM Nominated Adviser and Broker finnCap Limited 60 New Broad Street London EC2M 1JJ
Euronext Paying Agent kempen & Co. Beethovenstraat 300 1077 WZ Amsterdam The Netherlands
Registrars Capita Registrars Northern house Woodsome Park Fenay Bridge huddersfield hD8 0LA
1 6 DIRECTORS AND ADVISORS

1 7REPORT ON DIRECTORS’ REMUNERATION
R E P O R T O N D I R E C T O R S ’ R E M U N E R A T I O N
The remuneration committee of Sopheon plc is responsible for oversight of the contract terms, remuneration and other benefits for executive directors, including performance-related bonus schemes. The committee comprises two non-executive directors, B.P.F. Al, as chairman, and S.A. Silcock, together with B.k. Mence, other than in respect of his own remuneration. The committee makes recommendations to the board, within agreed parameters, on an overall remuneration package for executive directors and other senior executives in order to attract, retain and motivate high quality individuals capable of achieving the group’s objectives. The package for each director consists of a basic salary, benefits and pension contributions, together with performance-related bonuses and share options on a case-by-case basis. Consideration is given to pay and employment policies elsewhere in the group, especially when considering annual salary increases. During 2011, the board granted a 3 percent pay increase to executive directors as of 1 March 2011. This was consistent with the pay increase granted to the majority of the group’s employees. From time to time, the remuneration committee may take advice from appropriate remuneration consultants or to consult benchmarking data.
Contracts
The service contract between the company and Mr. Michuda is terminable on up to three months’ notice, with an additional twelve months’ salary in lieu of notice due by the company in the event of termination without cause. Service contracts between the company and the other executive directors are terminable on six to nine months’ notice.
Fees for Non-executive Directors
The fees for non-executive directors are determined by the board. The non-executive directors are not involved in anydiscussions or decisions about their own remuneration.
Directors’ Remuneration
Set out below is a summary of the fees and emoluments received by all directors during the year, translated where applicable into Sterling at the average rate for the period. Mr. Mence’s remuneration is largely fee-based and therefore subject to fluctuations from period to period. Mr. Michuda’s remuneration is payable in US Dollars, the average exchange rate for which changes year on year. Benefits primarily comprise healthcare insurance and similar expenses. Details of directors’ interests in shares and options are set out in the Directors’ Report.
Pay and Fees Bonus Benefits Total Total 2011 2011 2011 2011 2010 £ £ £ £ £Executive Directors
B.k. Mence 132,080 - 9,736 141,816 190,964 A.L. Michuda 156,269 - 7,738 164,007 245,400 A. karimjee 107,868 - 2,282 110,150 145,495
Non-executive Directors S.A. Silcock 18,000 - - 18,000 18,000 B.P.F. Al 18,000 - - 18,000 18,000 D. Metzger 18,000 - - 18,000 18,000
_______ _______ _______ _______ _______ 450,217 - 19,756 469,973 635,859 _______ _______ _______ _______ _______ _______ _______ _______ _______ _______

The remuneration committee establishes the objectives that must be met for each financial year if a cash bonus is to be paid. With the principal exception of members of Sopheon’s sales teams, for whom incentives are tied to individual or territory results, the committee concluded that the cash incentive should be tied to the financial performance of the group as a whole, and in 2010 and 2011, these objectives were set with regard to EBITDA performance. For 2011, these objectives were set such that incentive started to accrue from EBITDA of £1,500,000, after providing for the costs of the bonus itself. These measures were applied to all members of the executive board and management committee of the group, as well as the majority of the group’s employees.
In addition to the amounts disclosed above, pension contributions are made to individual directors’ personal pension schemes. During 2011, contributions of £4,875, £3,201 and £4,800 (2010 - £4,875, £3,139 and £4,848) were paid respectively to the pension schemes of B.k. Mence, A.L. Michuda and A. karimjee.
Performance Graph
The following graph shows the company’s share price performance on AIM since January 2006, compared with the performance of the FTSE AIM All Share index, which has been selected for this comparison as it is a broad-based index which the directors believe most closely reflects the performance of companies with similar characteristics as the company’s.
1 8 REPORT ON DIRECTORS’ REMUNERATION
2006 2007 2008 2009 2010 2011 2012
30
25
20
15
10
5
0
Pri
ce (
p)/v
alue
SPE 5P ORD AXX (rebased to SPE)

Directors’ Interests
The interests of the directors, who held office at the end of the year, in the share capital of the company (all beneficially held except those marked with an asterisk(*), which are held as trustee), were as follows: 8% Convertible Loan Share Options Ordinary Shares Stock 2013
At 31 December 2011 2010 2011 2010 2011 2010
B.k. Mence 462,500 485,000 14,430,535 14,423,847 £200,000 £200,000A.L. Michuda 3,932,932 4,002,624 155,188 155,188 £20,000 £20,000A. karimjee 1,137,500 1,150,000 87,667 87,667 £12,000 £12,000S.A. Silcock - - 950,000 950,000 £100,000 £100,000S.A. Silcock* - - 76,639 76,639 - -B.P.F. Al - 25,000 650,000 650,000 £40,000 £40,000D. Metzger - - 100,000 100,000 - -
Of the 14,430,535 ordinary shares mentioned above B.k. Mence beneficially owns and is the registered holder of 10,129,715 ordinary shares. A further 2,300,820 ordinary shares are held by Inkberrow Limited, a company in which B.k. Mence is the majority shareholder and in which S.A. Silcock is a minority shareholder. In addition B.k. Mence is, or his wife or children are, potential beneficiaries under trusts holding an aggregate of 2,000,000 ordinary shares.
The following table provides summary information for each of the directors who held office during the year and who held options to subscribe for Sopheon ordinary shares. All options were granted without monetary consideration.
Date of Exercise At 31 Granted Expired At 31 Grant Price December During During December 2010 Year Year 2011 B.k. Mence (1) 2 May 2001 77.5p 22,500 - (22,500) -B.k. Mence (1) 30 April 2002 14.75p 100,000 - - 100,000B.k. Mence (5) 15 April 2005 25.25p 62,500 - - 62,500B.k. Mence (7) 3 May 2006 22p 100,000 - - 100,000B.k. Mence (8) 29 June 2007 19p 100,000 - - 100,000B.k. Mence (9) 1 April 2008 13.25p 100,000 - - 100,000A.L. Michuda (2) 1 January 2001 160p 5,030 - (5,030) -A.L. Michuda (3) 2 May 2001 77.5p 54,662 - (54,662) -A.L. Michuda (3) 30 April 2002 14.75p 487,932 - - 487,932A.L. Michuda (3)(4) 5 November 2003 16.25p 2,225,000 - - 2,225,000A.L. Michuda (5) 15 April 2005 25.25p 150,000 - - 150,000A.L. Michuda (7) 3 May 2006 22p 100,000 - - 100,000A.L. Michuda (8) 29 June 2007 19p 250,000 - - 250,000A.L. Michuda (5)(9) 1 April 2008 13.25p 250,000 - - 250,000A.L. Michuda (5) 27 June 2008 14p 230,000 - - 230,000A.L. Michuda (5) 27 June 2010 7.5p 250,000 - - 250,000A. karimjee (1) 2 May 2001 77.5p 12,500 - (12,500) -A. karimjee (1) 30 April 2002 14.75p 150,000 - - 150,000A. karimjee (4)(6) 5 November 2003 16.25p 300,000 - - 300,000A. karimjee (5) 15 April 2005 25.25p 62,500 - - 62,500A. karimjee (7) 3 May 2006 22p 100,000 - - 100,000A. karimjee (8) 29 June 2007 19p 100,000 - - 100,000A. karimjee (5)(9) 1 April 2008 13.25p 175,000 - - 175,000A. karimjee (5) 27 June 2008 14p 100,000 - - 100,000A. karimjee (5) 27 June 2010 7.5p 150,000 - - 150,000B.P.F. Al (1) 2 May 2001 77.5p 25,000 - (25,000) -
None of the directors exercised any share options during the year.
1 9REPORT ON DIRECTORS’ REMUNERATION

2 0 REPORT ON DIRECTORS’ REMUNERATION
(1) Exercisable between the third and tenth anniversary of the date of grant.(2) One-fourth of these options becomes exercisable on each of the first four anniversaries of the date of grant and they
expire on the tenth anniversary of the date of grant.(3) One-third of these options are exercisable from the date of grant, one-third from the first anniversary of the date of
grant and one-third from the second anniversary.(4) Vesting of a proportion of these options was subject to performance conditions relating to the achievement of positive
EBITDA in two successive quarters. The conditions were met.(5) One-third of these options are exercisable from the first anniversary of the date of grant, one-third from the second
anniversary, and the remainder from the third anniversary.(6) 93,846 of these options are exercisable between the third and tenth anniversary of the date of grant and 206,154 options
are exercisable as to one-third immediately and one-third on each of the first and second anniversaries of the date of grant.
(7) Vesting of one-half of these options was subject to performance conditions based on the achievement of certain financial objectives in 2006. The conditions were met.
(8) Vesting of one-half of these options was subject to performance conditions based on the achievement of certain financial objectives in 2007. The conditions were met.
(9) Vesting of one-half of these options was subject to performance conditions based on the achievement of certain financial objectives in 2008. The conditions were met.
The mid-market price of Sopheon ordinary shares at 31 December 2011 was 5.5p. During the financial year the mid-market price of Sopheon ordinary shares ranged from 5.25p to 10.5p.
Save as disclosed above, no director (or member of his family) or connected persons has any interest, beneficial or non-beneficial, in the share capital of the company.
Auditable Part of the Remuneration Report
In their audit opinion on page 24, BDO LLP refer to their audit of the disclosures required by the Companies Act 2006.These comprise the following disclosures in this report:
• Thetableonpage17showingtotalemolumentsreceivedbydirectorsduringtheyearended31December2011;
• Thetextonpage18showingtotalpensioncontributionsmadeonbehalfofthedirectorsduringtheyearended31December 2011;
• Theshareoptionstablefortheyearended31December2011onpage19.
Approved by the board on 21 March 2012 and signed on its behalf by:
A. karimjee Director

D I R E C T O R S ’ R E P O R T
The group’s principal activities during the year continued to focus on the provision of software and services that improve the return on investment of product development, within the rapidly emerging product lifecycle management (PLM) market. A review of the development of the business during the year is given in the Statement from the Chairman and Chief Executive Officer on page 6 and the subsequent Financial and Operating Review. This also includes reference to the group’s future prospects. An overview of the group’s products and markets incorporating advances in research and development is provided on page 11. The group’s result for the year ended 31 December 2011 is a profit after tax of £104,000 (2010: profit after tax of £152,000). The directors do not intend to declare a dividend.
Corporate Governance
The Sopheon board is committed to high standards of corporate governance and aims to follow appropriate governance practice, although as a company incorporated in the Uk and listed on AIM and Euronext, the company is not subject to the requirements of the Uk Combined Code or the Netherlands Tabaksblat Committee. The board currently comprises three executive directors and three independent non-executive directors, and the roles and responsibilities of Chairman and CEO are segregated. Periodically the directors review the composition of the board, and consider whether additional skills are required linked to the company’s objectives at the time. Initial appointment of a new director is made by the board and then put to shareholders for ratification in general meeting. Subsequently, each director is put forward for re-election to the shareholders every three years. Biographies of the directors appear on the inside back cover of this annual report, and demonstrate a range of experience and caliber to bring the right level of independent judgment to the board.
The board is responsible for the group’s system of internal control and for reviewing its effectiveness. Such a system can only provide reasonable, but not absolute, assurance against material misstatement or loss. The board believes that the group has internal control systems in place appropriate to the size and nature of its business. The board is satisfied that the scale of the group’s activities do not warrant the establishment of an internal audit function. The board is also responsible for identifying the major business risks faced by the group and for determining the appropriate course of action to manage those risks. Formal meetings are held quarterly to review strategy, management and performance of the group, with additional meetings between those dates convened as necessary. During 2011, all directors attended all meetings either in person or by conference call. The audit committee, which comprises all of the non-executive directors and is chaired by Stuart Silcock, considers and determines actions in respect of any control or financial reporting issues they have identified or that are raised by the auditors. The board has a formal schedule of matters specifically reserved to it for decision. Details of the constitution of the remuneration committee are provided in the Report on Directors’ Remuneration on page 17.
Principal Risk Areas
As with any business at its stage of development, Sopheon faces a number of risks and uncertainties. The board monitors these risks on a regular basis. The key areas of risk identified by the board are summarized below.
Sopheon’s markets continue to be at a relatively early stage of development and it is possible that Sopheon's products may not sell in the quantities or at the prices required to achieve sustained profitability. The broad market for Sopheon’s software products continues to emerge and evolve. Sopheon has sought to focus its resources on the sub-segments that it believes offer the best short-term opportunity for growth, and on developing functionality which its research indicates customers in those segments require. however, determining the potential size, growth rate and needs of a particular market segment remains challenging. This risk has become particularly relevant in view of the economic turmoil that has affected the global economy. Sopheon continues to monitor market needs carefully and has formalized processes for soliciting input to product strategy from analysts and customers.
Sopheon's prospects of achieving sustained profitability are dependent on meeting sales targets. Sopheon has in past years experienced, substantial net losses due, in part, to its investment in product development and marketing but also due to the fact that the timing and size of individual sales, can have a substantial impact on performance in a given period. Sopheon’s ability to continue to finance its activities through to the point that its operations become cash generative on a sustained basis is dependent on the group maintaining sales growth alongside its investment strategy, or in the absence of such growth, its ability to secure funding through the company's facilities or other sources. Sopheon management carefully monitors short- and medium-term financing requirements and has regularly raised additional funding resources to meet requirements. Details of the resources available to Sopheon and the reasons why management consider that the company is able to continue as a going concern are set out in Note 2 to the financial statements.
Some of Sopheon’s competitors and potential competitors have greater financial resources than Sopheon. Sopheon remains a relatively small organization by global standards. Its resources are dwarfed by those of many larger companies that are capable of developing competitive solutions, and it is difficult to overcome the marketing engine of a large global firm. Sopheon seeks to compete effectively with such companies by keeping its market communications focused, clear and consistent with its product and market strategy, and working to deliver first class quality of execution so that referenceability of the customer base is maximized.
2 1DIRECTORS’ REPORT

Sopheon is dependent upon skilled personnel, the loss of whom could have a material impact. While service agreements have been entered into with key executives, retention of key members of staff cannot be guaranteed and departure of such employees could be damaging in the short term. In addition the competition for qualified employees continues to be difficult and retaining key employees has become accordingly more challenging and expensive. As a relatively small business, Sopheon is more exposed to this risk than some of its larger competitors. Sopheon management checks staff remuneration against recognized benchmarks and other industry sources, and seeks to maintain pay at competitive levels appropriate to its business.
Sopheon will require relationships with partners who are able to market and implement its products. historically, Sopheon has devoted substantial resources to the direct marketing of its products, and its strategy to enter into strategic alliances and other collaborative relationships to widen the customer base and create a broad sales and implementation channel for its products is not yet mature. The successful implementation of this strategy is crucial to Sopheon’s prospects and its ability to scale effectively. however, Sopheon cannot be sure that it will select the right partners, or that the partners it does select will devote adequate resources to promoting, selling and becoming familiar with Sopheon's products. Over the years Sopheon has built up a network of both resellers and consulting partners; however, this has yet to mature and the revenues delivered through these relationships remain a relatively small part of the total.
Sopheon could be subject to claims for damages for errors in its products and services. Sopheon may be exposed to claims for damages from customers in the event that there are errors in its software products or should support and maintenance service level agreements fail to meet agreed criteria. Sopheon has sought to protect itself from such risks through its development methodologies, its contract terms and insurance policies, and is not aware of any such claims at this time.
Share Option Schemes
Details of options granted are shown in Note 28 to the financial statements.
Supplier Payment Policy and Practice
It is the company’s policy that payments to suppliers are made in accordance with those terms and conditions agreed between the company and its suppliers, provided that all trading terms and conditions have been complied with. At 31 December 2011 the company had approximately 21 days’ purchases outstanding (2010: 31 days).
Charitable and Political Donations
The group has made no charitable or political donations during the year.
Auditors
All of the current directors have taken all the steps that they ought to have taken to make themselves aware of any information needed by the company’s auditors for the purposes of their audit and to ensure that the auditors are aware of that information. The directors are not aware of any relevant audit information of which the auditors are unaware. A resolution to reappoint BDO LLP as auditors will be put to the members at the Annual General Meeting.
Financial Instruments
Details of the group’s financial instruments and its policies with regard to financial risk management are given in Note 23 to the financial statements.
Substantial Shareholdings
The directors are aware of the following persons who as at 21 March 2012 were interested directly or indirectly in three per cent or more of the company’s issued ordinary shares:
No. of % Issued Ordinary Shares Ordinary SharesNameB.k. Mence (director) 14,430,535 9.9Norman Nominees Limited 11,691,260 8.0
B.k. Mence’s interest represents direct beneficial holdings as well as those of his family.
Approved by the board on 21 March 2012 and signed on its behalf by:
A. karimjee Director
2 2 DIRECTORS' REPORT

2 3STATEMENT OF DIRECTORS’ RESPONSIBILITIES
S T A T E M E N T O F D I R E C T O R S ’ R E S P O N S I B I L I T I E S
I N R E S P E C T O F T h E F I N A N C I A L S T A T E M E N T S
Company law requires the directors to prepare financial statements for each financial year. Under that law the directors have elected to prepare the group and company financial statements in accordance with International Financial Reporting Standards (IFRSs) as adopted by the European Union. Under company law the directors must not approve the financial statements unless they are satisfied that they give a true and fair view of the state of affairs of the group and company and of the profit or loss of the group for that period. The directors are also required to prepare financial statements in accordance with the rules of the London Stock Exchange for companies trading securities on the Alternative Investment Market and the rules of the Euronext Amsterdam Stock Exchange.
The annual report is the responsibility of, and has been approved by, the directors. The directors confirm to the best of their knowledge that:
• Thefinancialstatements,preparedinaccordancewithInternationalFinancialReportingStandardsasendorsedbythe European Union and Article 4 of the IAS regulation, give a true and fair view of the assets, liabilities, financial position and profit or loss of the issuer and the undertakings included in the consolidation taken as a whole; and
• Theannualreportincludesafairreviewofthedevelopmentandperformanceofthebusinessandthepositionofthe issuer and the undertakings included in the consolidation taken as a whole, together with a description of the principal risks and uncertainties that they face.
In preparing these financial statements, the directors are required to:
• Selectsuitableaccountingpoliciesandthenapplythemconsistently;
• Makejudgmentsandaccountingestimatesthatarereasonableandprudent;
• StatewhethertheyhavebeenpreparedinaccordancewithIFRSsasadoptedbytheEuropeanUnion,subjecttoany material departures disclosed and explained in the financial statements; and
• Preparethefinancialstatementsonthegoingconcernbasisunlessitisinappropriatetopresumethatthecompanywill continue in business.
The directors are responsible for keeping adequate accounting records that are sufficient to show and explain the company’s transactions and disclose with reasonable accuracy at any time the financial position of the company and enable them to ensure that the financial statements comply with the requirements of the Companies Act 2006. They are also responsible for safeguarding the assets of the company and hence for taking reasonable steps for the prevention and detection of fraud and other irregularities.
Website Publication
The directors are responsible for ensuring the annual report is made available on a website. Annual reports are published on the company's website in accordance with legislation in the United kingdom governing the preparation and dissemination of financial statements, which may vary from legislation in other jurisdictions. The maintenance and integrity of the company's website is the responsibility of the directors. The directors' responsibility also extends to the ongoing integrity of the annual reports contained therein.

I N D E P E N D E N T A U D I T O R S ’ R E P O R T T O T h E
M E M B E R S O F S O P h E O N P L C
We have audited the financial statements of Sopheon plc for the year ended 31 December 2011 which comprise the consolidated income statement, the consolidated statement of comprehensive income, the consolidated and company balance sheets, the consolidated and company cash flow statements, the consolidated and company statements of changes in equity, and the related notes. The financial reporting framework that has been applied in their preparation is applicable law and International Financial Reporting Standards (IFRSs) as adopted by the European Union and, as regards the parent company financial statements, as applied in accordance with the provisions of the Companies Act 2006.
This report is made solely to the company’s members, as a body, in accordance with Chapter 3 of Part 16 of the Companies Act 2006. Our audit work has been undertaken so that we might state to the company’s members those matters we are required to state to them in an auditor’s report and for no other purpose. To the fullest extent permitted by law, we do not accept or assume responsibility to anyone other than the company and the company’s members as a body, for our audit work, for this report, or for the opinions we have formed.
Respective Responsibilities of Directors and Auditors
As explained more fully in the statement of directors’ responsibilities, the directors are responsible for the preparation of the financial statements and for being satisfied that they give a true and fair view. Our responsibility is to audit the financial statements in accordance with applicable law and International Standards on Auditing (Uk and Ireland). Those standards require us to comply with the Auditing Practices Board’s (APB’s) Ethical Standards for Auditors.
Scope of the Audit of the Financial Statements
A description of the scope of an audit of financial statements is provided on the APB’s website at www.frc.org.uk/apb/scope/private.cfm
Opinion on Financial Statements
In our opinion:
• Thefinancialstatementsgiveatrueandfairviewofthestateofthegroup’sandtheparentcompany’saffairsasat31 December 2011 and of the group’s profit for the year then ended;
• ThegroupfinancialstatementshavebeenproperlypreparedinaccordancewithIFRSsasadoptedbytheEuropean Union;
• TheparentcompanyfinancialstatementshavebeenproperlypreparedinaccordancewithIFRSsasadoptedbythe European Union; and
• ThefinancialstatementshavebeenpreparedinaccordancewiththerequirementsoftheCompaniesAct2006.
Emphasis of Matter – Going Concern
In forming our opinion on the financial statements, which is not modified, we have considered the adequacy of the disclosures made in Note 2 to the financial statements concerning the group’s ability to continue as a going concern. As in prior years, these disclosures identify certain factors that indicate the existence of material uncertainties which may cast significant doubt about the group’s ability to continue as a going concern. As discussed in Note 2, the appropriateness of the going concern basis remains reliant on the group achieving an adequate level of sales in order to maintain sufficient working capital to support its activities, and the possibility of having to repay in cash £850,000 of convertible loan stock on 31 January 2013, or if this objective is not met, being able to raise sufficient additional finance. The financial statements do not include the adjustments that would result if the group were unable to continue as a going concern.
2 4 INDEPENDENT AUDITORS’ REPORT TO THE MEMBERS OF SOPHEON PLC

Opinion on Other Matters Prescribed by the Companies Act 2006
In our opinion:
• ThepartoftheDirectors’Remunerationreporttobeauditedhasbeenproperlypreparedinaccordancewiththe Companies Act 2006; and
• TheinformationgivenintheDirectors’Reportforthefinancialyearforwhichthefinancialstatementsarepreparedis consistent with the financial statements.
Matters on Which We are Required to Report by Exception
We have nothing to report in respect of the following matters where the Companies Act 2006 requires us to report to you if, in our opinion:
• Adequateaccountingrecordshavenotbeenkeptbytheparentcompany,orreturnsadequateforouraudithavenot been received from branches not visited by us; or
• Theparentcompanyfinancialstatementsarenotinagreementwiththeaccountingrecordsandreturns;or
• Certaindisclosuresofdirectors’remunerationspecifiedbylawarenotmade;or
• Wehavenotreceivedalltheinformationandexplanationswerequireforouraudit.
Iain henderson (Senior Statutory Auditor)For and on behalf of BDO LLP, Statutory Auditor55 Baker StreetLondon W1U 7EUUnited kingdom
21 March 2012
BDO LLP is a limited liability partnership registered in England and Wales (with registered number OC305127).
2 5INDEPENDENT AUDITORS’ REPORT TO THE MEMBERS OF SOPHEON PLC

C O N S O L I D A T E D I N C O M E S T A T E M E N T
F O R T h E Y E A R E N D E D 3 1 D E C E M B E R 2 0 1 1 Notes 2011 2010 £’000 £’000 Revenue 3 10,276 10,537 Cost of sales (2,731) (2,603) _______ _______
Gross profit 7,545 7,934
Sales and marketing expense (3,533) (3,593) Research and development expense (2,173) (2,417) Administrative expense (1,377) (1,488) _______ _______
Operating profit 462 436 Finance income 8 8 6Finance expense 9 (366) (271) _______ _______
Profit before tax 104 171 Income tax expense 10 - (19) _______ _______
Profit for the year 104 152 _______ _______Earnings per shareBasic and fully diluted (pence) 12 0.07p 0.10p _______ _______ _______ _______
C O N S O L I D A T E D S T A T E M E N T O F C O M P R E h E N S I V E
I N C O M E F O R T h E Y E A R E N D E D 3 1 D E C E M B E R 2 0 1 1 2011 2010 £’000 £’000 Profit for the year 104 152 Other comprehensive incomeExchange differences on translation of foreign operations (58) 39 _______ _______ Total comprehensive income for the year 46 191 _______ _______ _______ _______
2 6 FINANCIAL STATEMENTS

C O N S O L I D A T E D A N D C O M P A N Y B A L A N C E S h E E T S
A T 3 1 D E C E M B E R 2 0 1 1
Group Company Notes 2011 2010 2011 2010 £’000 £’000 £’000 £’000Assets
Non-current Assets
Property, plant and equipment 13 166 141 - -Intangible assets 14 3,748 3,633 - -Investments in subsidiaries 15 - - 6,119 6,119Other receivable 16 12 12 - - –––––––– –––––––– –––––––– ––––––––Total non-current assets 3,926 3,786 6,119 6,119 –––––––– –––––––– –––––––– ––––––––Current Assets
Trade and other receivables 17 3,265 4,119 - 9Cash and cash equivalents 18 2,941 3,358 703 734 –––––––– –––––––– –––––––– ––––––––Total current assets 6,206 7,477 703 743 –––––––– –––––––– –––––––– ––––––––Total assets 10,132 11,263 6,822 6,862
Liabilities
Current Liabilities
Trade and other payables 19 1,467 2,346 301 435Borrowings 20 1,448 982 - -Obligations under finance leases 21 2 4 - -Deferred revenue 2,470 2,633 - - –––––––– –––––––– –––––––– ––––––––Total current liabilities 5,387 5,965 301 435 –––––––– –––––––– –––––––– ––––––––Non-current Liabilities
Borrowings 20 1,663 2,290 823 799 –––––––– –––––––– –––––––– ––––––––Total non-current liabilities 1,663 2,290 823 799 –––––––– –––––––– –––––––– –––––––– Total liabilities 7,050 8,255 1,124 1,234 –––––––– –––––––– –––––––– ––––––––Net assets 3,082 3,008 5,698 5,628 –––––––– –––––––– –––––––– –––––––– –––––––– –––––––– –––––––– ––––––––Equity
Share capital 24 7,279 7,279 7,279 7,279Capital reserves 25 55,803 73,719 55,803 65,954Translation reserve 362 420 - -Retained losses (60,362) (78,410) (57,384) (67,605) –––––––– –––––––– –––––––– ––––––––Total equity 3,082 3,008 5,698 5,628 –––––––– –––––––– –––––––– –––––––– –––––––– –––––––– –––––––– ––––––––
Approved by the board and authorized for issue on 21 March 2012.
Barry k. Mence Arif karimjeeDirector Director
2 7FINANCIAL STATEMENTS

C O N S O L I D A T E D A N D C O M P A N Y C A S h F L O W
S T A T E M E N T S F O R T h E Y E A R E N D E D
3 1 D E C E M B E R 2 0 1 1
Group Company Notes 2011 2010 2011 2010 £’000 £’000 £’000 £’000Operating Activities
Profit for the year 104 152 42 (477)
Adjustments for:Finance income (8) (6) (1) (5)Finance costs 366 271 83 65Depreciation of property, plant and equipment 101 106 - -Amortization and impairment of intangible assets 994 1,148 - -Share-based payment expense 39 81 39 81Intra-group charges - - (250) (280)Provisions against intra-group loans - - (270) 125 –––––––– –––––––– –––––––– ––––––––Operating cash flows before movements in working capital 1,596 1,752 (357) (491) Decrease/(increase) in receivables 855 (1,146) (2) (24)(Decrease)/increase in payables (1,123) 1,457 (134) 88 –––––––– –––––––– –––––––– ––––––––Net cash generated from/(used in) operating activities 1,328 2,063 (493) (427) –––––––– –––––––– –––––––– ––––––––
Investing Activities
Finance income 8 6 1 5Purchases of property, plant and equipment (125) (92) - -Development costs capitalized (1,060) (657) - -Intra-group loans - - (803) (1,742)Repayment of intra-group loans - - 1,323 1,945 –––––––– –––––––– –––––––– ––––––––
Net cash from/(used in) investing activities (1,177) (743) 521 208 –––––––– –––––––– –––––––– ––––––––
Financing Activities
Proceeds from borrowings - 2,152 - -Repayment of borrowings (673) (1,014) - -Increase/(decrease) in lines of credit 442 (465) - -Interest paid (342) (271) (59) (65) –––––––– –––––––– –––––––– ––––––––Net cash from financing activities (573) 402 (59) (65) –––––––– –––––––– –––––––– ––––––––Net (decrease)/increase in cash and cash equivalents (422) 1,722 (31) (284) Cash and cash equivalents at the beginning of the year 3,358 1,624 734 1,018Effect of foreign exchange rate changes 5 12 - - –––––––– –––––––– –––––––– ––––––––Cash and cash equivalents at the end of the year 18 2,941 3,358 703 734 –––––––– –––––––– –––––––– –––––––– –––––––– –––––––– –––––––– ––––––––
2 8 FINANCIAL STATEMENTS

C O N S O L I D A T E D A N D C O M P A N Y S T A T E M E N T S O F
C h A N G E S I N E Q U I T Y F O R T h E Y E A R E N D E D
3 1 D E C E M B E R 2 0 1 1
Group Share Capital Translation Retained Capital Reserves Reserve Losses Total £’000 £’000 £’000 £’000 £’000
At 1 January 2010 7,279 73,633 381 (78,608) 2,685Profit for the year - - - 152 152Exchange differences on translation of foreign operations - - 39 - 39 –––––––– –––––––– –––––––– –––––––– ––––––––Total comprehensive income for the year - - 39 152 191 –––––––– –––––––– –––––––– –––––––– ––––––––Recognition of share-based payments - 81 - - 81Lapsing and expiry of share options - (46) - 46 -Reclassification of embedded derivative as equity - 51 - - 51 –––––––– –––––––– –––––––– –––––––– ––––––––At 1 January 2011 7,279 73,719 420 (78,410) 3,008Profit for the year - - - 104 104Exchange differences on translation of foreign operations - - (58) - (58) –––––––– –––––––– –––––––– –––––––– ––––––––Total comprehensive income for the year - - (58) 104 46 –––––––– –––––––– –––––––– –––––––– ––––––––Recognition of share-based payments - 39 - - 39Purchase of shares by Esot (Note 25) - (11) - - (11)Transfer of merger reserve to profit and loss reserve (see Note 25) - (17,944) - 17,944 - –––––––– –––––––– –––––––– –––––––– ––––––––At 31 December 2011 7,279 55,803 362 (60,362) 3,082 –––––––– –––––––– –––––––– –––––––– –––––––– –––––––– –––––––– –––––––– –––––––– ––––––––
The translation reserve represents accumulated differences on the translation of assets and liabilities of foreign operations. Retained losses represent accumulated trading losses, including amortization and impairment charges in respect of goodwill and intangible assets arising from past acquisitions. Details and description of the capital reserves are set out in Note 25.
Company Share Capital Retained Capital Reserves Losses Total £’000 £’000 £’000 £’000
At 1 January 2010 7,279 65,868 (67,174) 5,973Loss and total comprehensive income for the year - - (477) (477)Recognition of share-based payments - 81 - 81Lapsing and expiry of share options - (46) 46 -Reclassification of embedded derivative as equity - 51 - 51 –––––––– –––––––– –––––––– ––––––––At 31 December 2010 7,279 65,954 (67,605) 5,628Profit and total comprehensive income for the year - - 42 42Recognition of share-based payments - 39 - 39Purchase of shares by Esot (Note 25) - (11) - (11)Transfer of merger reserve to profit and loss reserve (see Note 25) - (10,179) 10,179 - –––––––– –––––––– –––––––– ––––––––At 31 December 2011 7,279 55,803 (57,384) 5,698 –––––––– –––––––– –––––––– –––––––– –––––––– –––––––– –––––––– ––––––––
2 9FINANCIAL STATEMENTS

1 . G E N E R A L I N F O R M AT I O N
Sopheon plc ("the company") is a public limited company incorporated in England and Wales. The address of its registered office and principal place of business is set out on page 16. The principal activities of the company and its subsidiaries are described in Note 3. The financial statements have been prepared in Pounds Sterling and rounded to the nearest thousand.
2 . S I G N I F I C A N T A C C O U N T I N G P O L I C I E S
The financial statements have been prepared in accordance with International Financial Reporting Standards and Interpretations issued by the International Accounting Standards Board as adopted by the European Union and those parts of the Companies Act 2006 which apply to companies preparing their financial statements under IFRS. The principal accounting policies are set out below. The policies have been applied consistently to all the years presented.
A number of new standards, amendments and interpretations to existing standards have been adopted by the group, but have not been listed, since they have no material impact on the financial statements.
The following new standards, amendments and interpretations to existing standards have been published that are mandatory for the group's accounting periods beginning on or after 2 January 2011 and which the group has decided not to adopt early. The directors are still assessing the impact of these revisions.
• IFRS 9 Financial Instruments (Replacement of IAS 39) (Effective for periods beginning on or after 1 January 2013). This revision is yet to be endorsed by the EU. This standard will eventually replace IAS 39 in its entirety.
• Disclosures – Transfers of Financial Assets (Amendments to IFRS 7) (Effective for periods beginning on or after 1 July 2011). This revision is yet to be endorsed by the EU. This amendment requires the disclosure of information in respect of all transferred financial assets that are not derecognized and for any continuing involvement in a transferred asset existing at the reporting date, irrespective of when the related transfer transaction occurred. It will affect inter alia companies with debt factoring arrangements.
• Presentation of Items of Other Comprehensive Income (Amendments to IAS 1) (Effective for periods beginning on or after 1 July 2012). This revision is yet to be endorsed by the EU. This amendment requires the grouping together of items within Other Comprehensive Income that may be reclassified to the profit or loss section of the income statement.
• IFRS 10 Consolidated Financial Statements (Replacement of IAS 27) (Effective for periods beginning on or after 1 January 2013). This standard is yet to be endorsed by the EU. This standard establishes principles for the presentation and preparation of consolidated financial statements.
• IFRS 12 Disclosures of Interests in Other Entities (Effective for periods beginning on or before 1 January 2013). This standard is yet to be endorsed by the EU. This standard sets out disclosure requirements for all forms of interests in other entities, including subsidiaries, joint arrangements, associates and unconsolidated structured entities.
• IFRS 13 Fair Value Measurement (Effective for periods beginning on or before 1 January 2013). This standard is yet to be endorsed by the EU. This standard sets out a framework for measuring fair value and requires disclosures about fair value measurements.
None of the other new standards, amendments or interpretations in issue is expected to have a material effect on the group or company financial statements.
Going Concern
The financial statements have been prepared on a going concern basis. In reaching their assessment, the directors have considered a period extending at least 12 months from the date of approval of these financial statements. This assessment has included consideration of the forecast performance of the business for the foreseeable future, the cash and financing facilities available to the group, and the repayment terms in respect of the group’s borrowings, including the potential of having to repay convertible loan stock in January 2013.
During 2011, the group achieved revenues of £10.3m and a profit before tax of £104,000. This represents a flat performance compared to the previous year. The performance in 2010 was a substantial improvement over 2009. Coming into 2012, the group’s sales pipeline remains very active, and accordingly, the directors remain positive about the prospects for the business.
3 0 NOTES TO THE FINANCIAL STATEMENTS

In December 2010, the group renegotiated its loan note from BlueCrest Capital Finance (“BlueCrest”) for a new principal value of $3.5m, which brought in new working capital of approximately $2.7m. The principal is repayable in equal monthly instalments of $90,000, plus interest, through March 2014. The group also has access to a revolving line of credit with BlueCrest which is secured against the trade receivables of Sopheon’s North American business. This facility is periodically renewable, and the current term is to 31 May 2012. The facility limit is $1,250,000. At 31 December 2011, $1,200,000 (£776,000) was drawn against this revolving facility. In addition, during 2009 the group had secured a convertible loan for £850,000, which is repayable or convertible by 31 January 2013. Notwithstanding the group’s stable funding and trading position, the time-to-close and the order value of individual sales continues to vary considerably. When combined with the relatively low-volume and high-value nature of the group’s business, these are factors which constrain the ability to accurately predict revenue performance. In addition, to meet its strategic objectives, the group has expanded its staff levels. If sales fall short of expectations, there is a risk that the group’s facilities may prove insufficient to cover both operating activities and the repayment of its debt facilities, which latter point could be due to the regular repayment of the BlueCrest term loan, the possibility of non-renewal of the BlueCrest revolving line of credit, or the possibility of having to repay in cash £850,000 of convertible loan stock on 31 January 2013. In such circumstances, the group would be obliged to seek additional funding. The directors have concluded that the circumstances set forth above represent material uncertainties, which may cast significant doubt upon the group’s ability to continue as a going concern, however they believe that taken as a whole, the factors described above enable the group to continue as a going concern for the foreseeable future. The financial statements do not include the adjustments that would be required if the company or group were unable to continue as a going concern.
Basis of Consolidation
The consolidated financial statements incorporate the financial statements of the company and entities controlled by the company ("subsidiaries"). Control is achieved where the company has the power to govern the financial and operating policies of an entity and to obtain benefits from its activities. All intra-group transactions, balances, income and expenses are eliminated on consolidation.
Business Combinations
The acquisition of subsidiaries is accounted for within the consolidated financial statements using the purchase method, as set out within IFRS 3 Business Combinations for acquisitions made on or before 1 January 2010. The cost of the acquisition is measured at the aggregate of the fair values at the date of exchange, of assets given, liabilities incurred or assumed, and equity instruments issued by the group in exchange for control of the entity being acquired, together with any costs directly attributable to the business combination. The results of the acquired entities are included in the consolidated income statement from the date on which effective control is obtained. The identifiable assets, liabilities and contingent liabilities of the entity being acquired that meet the conditions for recognition are recognized at their fair values of the date of acquisition.
Identifiable intangible assets are capitalized at fair value as at the date of acquisition. The useful lives of these intangible assets are assessed and amortization is charged on a straight-line basis, with the expense taken to the income statement within sales and marketing expense (in respect of customer relationships) and research and development expense (in respect of IPR and technology). Intangible assets are tested for impairment when a trigger event occurs. Useful lives are also examined on an annual basis and adjustments, where applicable, are made on a prospective basis.
Goodwill
Goodwill arising on the acquisition of a subsidiary represents the excess of the cost of acquisition over the group’s interest in the net fair value of the identifiable assets, liabilities and contingent liabilities of the subsidiary at the date of acquisition. Goodwill is initially recognized at cost and is subsequently measured at cost less any accumulated impairment losses.
For the purposes of impairment testing, goodwill is allocated to those cash-generating units of the group expected to benefit from the synergies of the business combination. Cash-generating units to which goodwill has been allocated are tested for impairment annually, or more frequently when there is an indication that the unit may be impaired. If the recoverable amount of the cash-generating unit is less than the carrying value of the unit, the impairment loss is allocated firstly to reduce the carrying cost of any goodwill allocated to the unit and then to any other assets of the unit pro rata to the carrying value of each asset of the unit. An impairment loss recognized for goodwill is not reversed in a subsequent period.
3 1NOTES TO THE FINANCIAL STATEMENTS

Revenue Recognition
Revenue is measured at the fair value of the consideration received or receivable and represents amounts receivable for goods and services provided in the normal course of business, net of discounts and sales-related taxes.
Sales of software products are recognized on delivery, provided that no significant obligations remain owing to the customer in connection with such product sale. Such significant obligations could include giving a customer a right to return the software product without any preconditions, or if the group has failed to deliver an element of the software product by the balance sheet date. Revenues relating to maintenance and post-contract support agreements are deferred and recognized over the period of the agreements.
Revenues from implementation and consultancy services are recognized as the services are performed, or in the case of fixed price or milestone-based projects, on a percentage basis as the work is completed and any relevant milestones are met, using latest estimates to determine the expected duration and cost of the project.
Leases
Assets held under finance leases are recognized as assets of the group at their fair value at the inception of the lease or, if lower, at the net present value of the minimum lease payments. The corresponding liability to the lessor is included in the balance sheet as a finance lease obligation. Lease payments are apportioned between finance charges and reduction of the lease obligation so as to achieve a constant rate of interest on the remaining balance of the liability. Finance charges are charged to the income statement.
Rentals payable under operating leases are charged to the income statement on a straight-line basis over the term of the relevant lease.
Interest on Borrowings
All interest on borrowings is recognized in the income statement in the period in which it is incurred.
Retirement Benefit Costs
Payments to defined contribution retirement benefit plans are charged as an expense as they fall due. The group does not operate any defined benefit retirement benefit plans.
Foreign Currencies
The individual financial statements of each group entity are presented in the currency of the primary economic environment in which the entity operates (its functional currency). In preparing the financial statements of the individual entities, transactions in currencies other than the entity’s functional currency (foreign currencies) are recorded at rates approximating to the transaction rates. At each balance sheet date, monetary items denominated in foreign currencies are retranslated at the rates prevailing on the balance sheet date. Exchange differences arising on the settlement of monetary items, and on the retranslation of monetary items, are included in the income statement for the period.
For the purpose of presenting consolidated financial statements, the assets and liabilities of the group’s foreign operations are expressed in Sterling using exchange rates prevailing on the balance sheet date. Income and expense items (including comparatives) are translated at the average exchange rates for the period. Exchange differences arising (including exchange differences on intra-group loans where there is no intention that these should be settled) are classified as equity and transferred to the group’s translation reserve. Such translation differences are recognized in the income statement in the period in which the foreign operation is disposed of.
On disposal of a foreign operation the cumulative exchange differences recognized in the foreign exchange reserve relating to that operation up to the date of disposal are transferred to the income statement as part of the profit or loss on disposal.
3 2 NOTES TO THE FINANCIAL STATEMENTS

Deferred Tax
Deferred tax is recognized on differences between the carrying amounts of assets and liabilities in the financial statements and the corresponding tax bases used in the computation of taxable profit, and is accounted for using the balance sheet liability method. Deferred tax liabilities are generally recognized for all taxable temporary differences, but deferred tax assets are recognized only to the extent that it is probable that taxable profits will be available against which deductible temporary differences can be utilized.
Deferred tax is calculated at tax rates that have been enacted or substantively enacted at the balance sheet date, and that are expected to apply in the period when the liability is settled or the asset realized. Deferred tax is charged or credited to profit or loss, except when it relates to items charged or credited directly to equity, in which case the deferred tax is also dealt with in equity.
Property, Plant and Equipment
Computer equipment and fixtures and fittings are stated at cost less accumulated depreciation and any accumulated impairment losses. Depreciation is charged so as to write off the costs of assets over their estimated useful lives, using the straight-line method.
Assets held under finance leases are depreciated over their expected useful lives on the same basis as owned assets, or, when shorter, over the term of the relevant lease.
The gain or loss arising on the disposal or retirement of an item of property, plant and equipment is determined as the difference between the sale proceeds and the carrying amount of the asset and is recognized in the income statement.
The following rates are used for the depreciation of property, plant and equipment:
Computer equipment 20-33 percent on a straight-line basisFurniture and fittings 20-25 percent on a straight-line basis
Investments
Investments in subsidiaries within the company balance sheet are stated at cost less impairment. Impairment tests are undertaken whenever events or changes in circumstances indicate that their carrying amount may not be recoverable. Where the carrying value of an investment exceeds its recoverable amount, the investment is written down accordingly.
Externally Acquired Intangible Assets
Externally acquired intangible assets are initially recognized at their fair values at the date of acquisition and are subsequently amortized on a straight-line basis over their useful economic lives. The amortization expense in respect of externally acquired technology and intellectual property (“IPR”) is included in research and development costs in the income statement, and the amortization expense in respect of externally acquired customer relationships is included in sales and marketing expense.
Internally Generated Intangible Assets (Research and Development Expenditure)
Development expenditure on internally developed software products is capitalized if it can be demonstrated that:•itistechnicallyfeasibletodeveloptheproduct;•adequateresourcesareavailabletocompletethedevelopment;•thereisanintentiontocompleteandselltheproduct;•thegroupisabletoselltheproduct;•salesoftheproductwillgeneratefutureeconomicbenefits;and•expenditureontheproductcanbemeasuredreliably.
Capitalized development costs are amortized over the period over which the group expects to benefit from selling the product developed. This has been estimated to be four years from the date of code-finalization of the applicable software release. The amortization expense in respect of internally generated intangible assets is included in research and development costs.
3 3NOTES TO THE FINANCIAL STATEMENTS

Development costs not satisfying the above criteria and expenditure on the research phase of internal projects are recognized in the income statement as incurred.
Impairment of Tangible and Intangible Assets (Excluding Goodwill)
At each balance sheet date, the group reviews the carrying amounts of its tangible and intangible assets to determine whether there is any indication that those assets have suffered an impairment loss. If any such indication exists, the recoverable amount of the asset is estimated in order to determine the extent of the impairment loss (if any). Where it is not possible to estimate the recoverable amount of an individual asset, the group estimates the recoverable amount of the cash-generating unit to which the asset belongs.
Recoverable amount is the higher of the fair value less costs to sell and value in use. In assessing the value in use, the estimated future cash flows are discounted to their net present value using a pre-tax discount rate that reflects current market assessments of the time value of money and the risks specific to the asset.
If the recoverable amount of an asset or cash-generating unit is estimated to be less than its carrying amount, the carrying amount of the asset or cash-generating unit is reduced to its recoverable amount. An impairment loss is recognized immediately in the administrative expenses line item in the income statement.
Where an impairment loss subsequently reverses, the carrying value of the asset or cash-generating unit is increased to the revised recoverable amount, but so that the increased carrying amount does not exceed the carrying amount which would have been determined had no impairment loss been recognized in prior years. A reversal of an impairment loss is recognized immediately in profit or loss.
Financial Instruments
1. Financial Assets
The group’s financial assets fall into the category of loans and receivables. The group does not have any financial assets in the categories of fair value through profit and loss or available for sale. The group has not classified any of its financial assets as held to maturity.
Unless otherwise indicated, the carrying values of the group’s financial assets are a reasonable approximation of their fair values.
Loans and Receivables
These assets are non-derivative financial assets with fixed or determinable payments that are not quoted in an active market. They arise principally through the provision of goods and services (e.g., trade receivables) but also include cash and cash equivalents and other types of contractual monetary asset. They are initially recognized at fair value plus transaction costs that are directly attributable to the acquisition or issue and subsequently carried at amortized cost using the effective interest rate method, less provision for impairment. The effect of discounting on these financial instruments is not considered material.
Impairment provisions are recognized when there is objective evidence (such as significant financial difficulties, default or significant delay in payment on the part of the counter-party) that the group will be unable to collect all the amounts due under the terms of the receivable, the amount of such provision being the difference between the net carrying amount and the present value of the future expected cash flows associated with the receivable. For trade receivables, such provisions are recorded in a separate allowance account with the loss being recognized within administrative expenses in the income statement. On confirmation that the trade receivable will not be collectable, the gross carrying value of the asset is written off against the associated provision.
3 4 NOTES TO THE FINANCIAL STATEMENTS

2. Financial Liabilities
The group classifies its financial liabilities in the category of financial liabilities at fair value through profit or loss and those measured at amortized cost.
Financial Liabilities at Fair Value through Profit or Loss
The group does not have any liabilities held for trading nor has it designated any financial liabilities as being at fair value through profit or loss.
Financial Liabilities Measured at Amortized Cost
Financial liabilities measured at amortized cost include:
• Tradepayablesandothershort-datedmonetaryliabilities,whichareinitiallyrecognizedatfairvalueandsubsequentlycarried at amortized cost using the effective interest rate method.
• Bankandotherborrowings(includingthehostdebtelementoftheconvertibleloannotedabove),whichareinitiallyrecognized at fair value net of any transaction costs directly attributable to the acquisition of the instrument. Such interest-bearing liabilities are subsequently measured at amortized cost using the effective interest rate method, which ensures that the interest expense over the period to repayment is at a constant rate on the balance of the liability carried in the balance sheet. Interest expense in this context includes initial transaction costs and premiums payable on redemption, as well as any interest payable while the liability is outstanding.
Unless otherwise indicated, the carrying values of the group’s financial liabilities measured at amortized cost represent a reasonable approximation of their fair values.
3. Share Capital
Financial instruments issued by the group are treated as equity only to the extent that they do not meet the definition of a financial liability. The group’s ordinary shares are classified as equity. For the purpose of the disclosures given in Note 23(f) the group considers its capital to comprise its ordinary share capital, share premium and other capital reserves less its accumulated retained loss.
Share-based Payments
The group issues equity-settled share-based payments to certain employees. Equity-settled share-based payments are measured at fair value (excluding the effect of non-market-based vesting conditions) at the date of grant. The fair value determined at the date of grant is expensed on a straight-line basis over the vesting period, based on the group’s estimate of the shares that will eventually vest and adjusted for the effect of non-market-based vesting conditions.
Fair value is measured by the binomial option-pricing model. The expected life used in the model had been adjusted, based on management’s best estimate, for the effects of non-transferability, exercise restrictions and behavioral considerations.
As set out in Note 24, the group has also issued warrants to certain financing institutions which are also treated as equity-settled share-based payments.
Significant Accounting Estimates and Judgments
Management is required to make judgments, estimates and assumptions about the carrying amounts of assets and liabilities that are not readily apparent from other sources. The estimates and associated assumptions are based on historical experience and other factors that are considered to be relevant. Estimates and judgments adopted for property plant and equipment, externally acquired intangible assets and internally generated intangible assets are dealt with in the accounting policy notes set forth above that relate to these areas. Actual results may differ from these estimates, and accordingly they are reviewed on an ongoing basis. Revisions to accounting estimates are recognized in the period in which the estimate is revised if the revision affects only that period, or in the period of the revision and future periods if the revision affects both current and future periods.
3 5NOTES TO THE FINANCIAL STATEMENTS

3 . S E G M E N TA L A N A LY S I S
All of the group’s revenue in respect of the years ended 31 December 2011 and 2010 is derived from the design, development and marketing of software products with associated implementation and consultancy services, as more particularly described in the Directors’ Report. For management purposes, the group is organized geographically across two principal operating segments, which can be expressed geographically. The first segment is North America, and the second Europe, Middle East and Africa (EMEA). Information relating to these two segments is given below.
The information in the following table relating to external revenues includes analysis both by location of customer and by location of operations. The information relating to other items provides analysis by location of operations only. Inter-segment revenues are priced on an arm’s length basis.
Year ended 31 December 2011 North America EMEA Total £’000 £’000 £’000
Income StatementExternal revenues – by location of customers 6,565 3,711 10,276External revenues – by location of operations 7,189 3,087 10,276 Operating profit before interest and tax (139) 601 462 Finance income - 8 8Finance expense (281) (85) (366) Profit before tax (420) 524 104 Income tax expense - - - Depreciation, amortization and impairment charges (1,090) (5) (1,095) EBITDA 884 607 1,491 –––––––– –––––––– ––––––––Balance Sheet Fixed asset additions 100 25 125Capitalization of internally generated development costs 1,060 - 1,060Total assets 7,701 2,431 10,132 Total liabilities (4,924) (2,126) (7,050) –––––––– –––––––– –––––––– –––––––– –––––––– ––––––––
Year ended 31 December 2010 North America EMEA Total £’000 £’000 £’000Income StatementExternal revenues – by location of customers 7,085 3,452 10,537External revenues – by location of operations 7,380 3,157 10,537Operating profit before interest and tax 73 363 436Finance income - 6 6Finance expense (204) (67) (271)Profit before tax (131) 302 171Income tax expense (19) - (19)Depreciation, amortization and impairment charges (1,248) (6) (1,254)EBITDA 1,141 369 1,510 –––––––– –––––––– ––––––––Balance Sheet Fixed asset additions 89 3 92Capitalization of internally generated development costs 657 - 657Total assets 8,955 2,308 11,263Total liabilities (5,741) (2,514) (8,255) –––––––– –––––––– –––––––– –––––––– –––––––– ––––––––
One customer, served by both segments, accounted for approximately 10 percent of the group’s revenues in 2011. One customer, served by both segments, accounted for approximately 10 percent or more of the group’s sales in 2010.
External revenues in 2011 exclude inter-segment revenues which amounted to £793,000 (2010: £572,000) for North America and £192,000 (£383,000) for EMEA.
Revenues attributable to customers in the Uk in 2011 amounted to £1,092,000 (2010: £772,000). The segmental analysis above has been presented using information that is readily available to management.
3 6 NOTES TO THE FINANCIAL STATEMENTS

4 . E B I T D A A N D R E V E N U E V I S I B I L I T Y
EBITDA
The directors consider that EBITDA, which is defined as earnings/(loss) before interest, tax, depreciation and amortization, is an important measure, since it is widely used by the investment community. It is calculated as follows:
2011 2010 £’000 £’000
Profit/(loss)for the year after tax 104 152 Interest payable 366 271Interest receivable (8) (6)Amortization of intangible assets 928 968Depreciation of property, plant and equipment 101 106Income tax expense - 19 –––––––– ––––––––EBITDA 1,491 1,510 –––––––– –––––––– –––––––– ––––––––Revenue Visibility
Another performance indicator used by the group and referred to in narrative descriptions of the group’s performance is revenue visibility. At any point in time it comprises revenue expected from (i) closed license orders, including those which are contracted but conditional on acceptance decisions scheduled later in the year; (ii) contracted services business delivered or expected to be delivered in the year; and (iii) recurring maintenance, hosting and rental streams. The visibility calculation does not include revenues from new sales opportunities expected to close during the remainder of the year.
5 . P R O F I T F O R T H E Y E A R
The profit for the year has been arrived at after charging/(crediting):
2011 2010 £’000 £’000Continuing Operations Net foreign exchange (gains) (55) (7)Research and development costs (excluding amortization) 1,363 1,449Amortization of intangible assets 928 968Impairment of intangible assets 66 180Depreciation of property, plant and equipment 101 106Operating lease rentals – land and buildings 328 348Operating lease rentals – other 80 82 –––––––– –––––––– –––––––– ––––––––
Net foreign exchange losses or gains arise on the translation of certain cash and trade balances held in Euros and US Dollars and are accordingly included in administration expense.
6 . A U D I TO R S ’ R E M U N E R AT I O N
During the year the group obtained the following services from its auditors and associated firms. Fees for the audit of subsidiaries pursuant to legislation are not segregated from those for the group and are included in the amounts disclosed.
2011 2010 £’000 £’000
Audit of the financial statements of the group 50 50Review of interim financial information 10 10Audit of US pension plan 5 5Tax services 35 3 –––––––– –––––––– –––––––– ––––––––
3 7NOTES TO THE FINANCIAL STATEMENTS

7 . S TA F F C O S T S 2011 2010 £’000 £’000 Wages and salaries 5,662 5,942Social security costs 453 393Pension contributions 123 103Employee benefits expense 509 404 ––––––– ––––––– 6,747 6,842 –––––––– –––––––– –––––––– ––––––––
Included within the above are staff costs capitalized as development expenditure amounting to £1,060,000 (2010: £657,000). Included within wages and salaries are bonus and sales commission costs amounting to £311,000 (2010: £1,138,000).
The average monthly number of employees during the year was made up as follows: 2011 2010 Number Number Development and operations 61 56Sales and management 31 28 ––––––– ––––––– 92 84 –––––––– –––––––– –––––––– ––––––––
The above staff costs and the numbers of employees during the year include the executive directors. The remuneration of all directors were as follows: 2011 2010 £’000 £’000 Fees and emoluments 470 636Pension contributions 13 13 –––––––– –––––––– 483 649 –––––––– –––––––– –––––––– ––––––––
No director exercised share options during the year (2010: None). Pension contributions are to personal defined contribution schemes and have been made for three directors (2010: three) who served during the year.
Full details of directors’ remuneration are disclosed in the Report on Directors’ Remuneration on page 17.
8 . F I N A N C E I N C O M E 2011 2010 £’000 £’000Income on financial assets measured at amortized cost Interest income on bank deposits 8 6 –––––––– –––––––– –––––––– ––––––––
9 . F I N A N C E E X P E N S E 2011 2010 £’000 £’000 Interest expense on financial liabilities measured at amortized cost Interest on borrowings (366) (271) –––––––– –––––––– –––––––– ––––––––
3 8 NOTES TO THE FINANCIAL STATEMENTS

1 0 . I N C O M E TA X E X P E N S E 2011 2010 £’000 £’000
Income tax expense for the year – current tax - (19) –––––––– –––––––– –––––––– ––––––––
The charge for the year can be reconciled to the accounting profit as follows: 2011 2010 £’000 £’000 Profit before tax 104 152 –––––––– –––––––– –––––––– –––––––– Tax (charge) at the Uk corporation tax rate of 26.5% (2010: 28%) (28) (43)Adjustment for differing rates of corporate taxation in overseas jurisdictions (22) (39)Tax effect of expenses that are not deductible in determining taxable losses (98) (175)Temporary differences arising from the capitalization and amortization of internally generated development costs 79 (15)Utilization of prior year losses 69 263 –––––––– ––––––––Income tax expense for the year - (19) –––––––– –––––––– –––––––– ––––––––
The tax charge in 2010 represents US Alternative Minimum Tax (“AMT”) which is payable notwithstanding the availability of tax losses from prior years. For AMT purposes, the use of prior year tax losses to offset current taxable profits is restricted to 90 percent of current year profits, with AMT chargeable at a rate of 20 percent on the remaining 10 percent.
There is no tax arising on other comprehensive income.
The group has an unrecognized deferred tax asset arising from its unrelieved trading losses, which has not been recognized owing to uncertainty as to the level and timing of taxable profits in the future. The unrecognized deferred tax asset is made up as follows: 2011 2010 £’000 £’000
Shortfall of tax depreciation compared to book depreciation 165 165 Effect of timing differences arising from capitalization of internally generated development costs (1,100) (965)Unrelieved trading losses 14,457 20,498 –––––––– ––––––––Unrecognized deferred tax asset 13,522 19,698 –––––––– –––––––– –––––––– ––––––––
At 31 December 2011, tax losses estimated at £45m were available to carry forward by the Sopheon group, arising from historic losses incurred. These losses represent a potential deferred tax asset of £14.5m, based on the tax rates currently applicable in the relevant tax jurisdictions.
Of these tax losses, an aggregate amount of £12m (representing £4.2m of the potential deferred tax asset) represents pre-acquisition tax losses of Sopheon Corporation (Minnesota) and Alignent Software, Inc. The future utilization of these losses may be restricted under Section 382 of the US Internal Revenue Code, whereby the ability to utilize net operating losses arising prior to a change of ownership is limited to a percentage of the entity value of the corporation at the date of change of ownership.
3 9NOTES TO THE FINANCIAL STATEMENTS

1 1 . P R O F I T D E A LT W I T H I N T H E F I N A N C I A L S TAT E M E N T S O F T H E
PA R E N T C O M PA N Y
The profit dealt with in the financial statements of the parent company for the year ended 31 December 2011was £42,000 (2010: loss of £477,000). Advantage has been taken of Section 408 of the Companies Act 2006 not to present an income statement for the parent company.
1 2 . E A R N I N G S P E R S H A R E
2011 2010 £’000 £’000 Profit after tax 104 152 –––––––– –––––––– –––––––– –––––––– ’000s ’000sWeighted average number of ordinary shares for the purpose of basic earnings per share 145,579 145,579 –––––––– –––––––– –––––––– –––––––– The profit attributable to ordinary shareholders and the weighted average number of ordinary shares for the purpose of calculating the diluted earnings per ordinary share are the same as those used for calculating the basic earnings/(loss) per ordinary share in both 2011 and 2010. This is (i) because the exercise of conversion rights attaching to the convertible loan stock (details of which are set out in Note 20), would have the effect in each year of increasing earnings per ordinary share (by virtue of the saving of loan stock interest, which would otherwise be payable, and of interest receivable on subscription proceeds), and are therefore not dilutive; and (ii) because the warrants to subscribe for 502,790 ordinary shares and the 13,193,054 share options to subscribe for ordinary shares, (details of which are set out in Notes 24 and 28) either have a strike price above the average market price for the year, or have an immaterial impact.
4 0 NOTES TO THE FINANCIAL STATEMENTS

1 3 . P R O P E R T Y, P L A N T A N D E Q U I P M E N T Group Computer Furniture Equipment & Fittings Total £’000 £’000 £’000CostAt 1 January 2010 2,166 428 2,594Additions 86 6 92Exchange differences 8 - 8 –––––––– –––––––– ––––––––At 1 January 2011 2,260 434 2,694Additions 97 28 125Exchange differences 10 3 13Amounts written off (1,559) (279) (1,838) –––––––– –––––––– ––––––––At 31 December 2011 808 186 994 –––––––– –––––––– ––––––––Accumulated DepreciationAt 1 January 2010 2,026 417 2,443Depreciation charge for the year 99 7 106Exchange differences 4 - 4 –––––––– –––––––– ––––––––At 1 January 2011 2,129 424 2,553Depreciation charge for the year 95 6 101Exchange differences 9 3 12Amounts written off (1,559) (279) (1,838) –––––––– –––––––– ––––––––At 31 December 2011 674 154 828 –––––––– –––––––– ––––––––Carrying Amount At 31 December 2011 134 32 166 –––––––– –––––––– –––––––– –––––––– –––––––– –––––––– At 31 December 2010 131 10 141 –––––––– –––––––– –––––––– –––––––– –––––––– ––––––––
The net carrying amount of property, plant and equipment includes £2,000 (2010: £4,000) in respect of assets held under finance leases.
CompanyThe company has no property, plant and equipment.
4 1NOTES TO THE FINANCIAL STATEMENTS

1 4 . I N TA N G I B L E A S S E T S Development Technology Customer Goodwill Total Costs and IPR Relationships (Internally Generated) £’000 £’000 £’000 £’000 £’000CostAt 1 January 2010 5,484 863 1,619 609 8,575Additions (internally generated) 657 - - - 657Exchange differences 166 28 51 18 263 –––––––– –––––––– –––––––– –––––––– ––––––––At 1 January 2011 6,307 891 1,670 627 9,495Additions (internally generated) 1,060 - - - 1,060Exchange differences 121 11 21 8 161 –––––––– –––––––– –––––––– –––––––– ––––––––At 31 December 2011 7,488 902 1,691 635 10,716 –––––––– –––––––– –––––––– –––––––– ––––––––AmortizationAt 1 January 2010 3,094 466 478 - 4,038Charge for the year 710 96 162 - 968Exchange differences 90 13 12 - 115 –––––––– –––––––– –––––––– –––––––– ––––––––At 1 January 2011 3,894 575 652 - 5,121Charge for the year 764 46 118 - 928Exchange differences 78 10 13 - 101 –––––––– –––––––– –––––––– –––––––– ––––––––At 31 December 2011 4,736 631 783 - 6,150 –––––––– –––––––– –––––––– –––––––– ––––––––Accumulated Impairment LossesAt 1 January 2010 - 259 285 - 544Impairment losses in year - - 180 - 180Exchange differences - 9 8 - 17 –––––––– –––––––– –––––––– –––––––– ––––––––At 1 January 2011 - 268 473 - 741Impairment losses in year - - 66 - 66Exchange differences - 3 8 - 11 –––––––– –––––––– –––––––– –––––––– ––––––––At 31 December 2011 - 271 547 - 818 –––––––– –––––––– –––––––– –––––––– ––––––––Carrying AmountAt 31 December 2011 2,752 - 361 635 3,748 –––––––– –––––––– –––––––– –––––––– –––––––– –––––––– –––––––– –––––––– –––––––– ––––––––At 31 December 2010 2,413 48 545 627 3,633 –––––––– –––––––– –––––––– –––––––– –––––––– –––––––– –––––––– –––––––– –––––––– ––––––––
The amortization period for the internally generated development costs relating to the group’s software products is four years. The amortization periods for (a) technology & IPR and (b) customer relationships, arising from the acquisition of Alignent Software, Inc. in June 2007, are four years and eight years respectively. Goodwill is not amortized. The residual goodwill arising on the acquisition of Alignent is attributable to the enhanced market position of each of the group’s operating segments, due to the completeness of the solution that Sopheon can offer the market, in addition to the ability to penetrate wholly new markets such as aerospace and defense for the overall product set. The recoverable amount of the goodwill can be underpinned on a value in use basis by the expected performance of each of the group’s operating segments.
The valuation used for this purpose is based on cash-flow projections for the next two years, then extrapolated using a pre-tax discount rate of 14.6 percent and an annual growth assumption of 20 percent for four years, and thereafter for an indefinite period at a growth assumption of 3 percent. Sensitivity analysis performed on these projections demonstrates significant valuation headroom above the carrying value of goodwill even if the growth rate for the four year period is reduced to 5 percent. The annualized average growth of the business since the launch of the group’s core Accolade solution is approximately 25 percent.
The initial valuation of the intangible assets acquired with Alignent relating to technology and IPR, and to customer relationships, used an income-based approach. During 2010 and 2011, the recurring income from the acquired Alignent customer base reduced, due to a mix of factors including the conversion of certain rental licenses to perpetual, changes in rental levels, and cancellations. The overall reduction exceeded the rate of attrition of such recurring income estimated in the original valuation exercise, leading to impairments in the carrying value of the acquired Alignent customer relationships of £66,000 (2010: £180,000).
4 2 NOTES TO THE FINANCIAL STATEMENTS

All other assumptions of the original valuation have been retained in the impairment review. The valuation exercise, and the recoverable amount of the intangible assets and goodwill, are based on value in use with a pre-tax discount rate of 14.6 percent. The remaining amortization period for the acquired Alignent customer relationships is 3.5 years.
CompanyThe company has no intangible assets.
1 5 . I N V E S T M E N T I N S U B S I D I A R I E S
At 31 December 2010 and at 31 December 2011 Company £’000
Cost 41,560Less: Amounts provided 35,441 ––––––––Carrying amount 6,119 –––––––– ––––––––
Details of the company’s subsidiaries at 31 December 2011 are set out below. Companies marked with an asterisk(*) are held via Sopheon Uk Ltd and those with an obelus(†) are held via Orbital Software holdings plc. The common stock of Alignent Software, Inc. is held by Sopheon Corporation, Delaware, USA.
Name of Company Nature of Ownership Proportion of Nature of BusinessPlace of Incorporation Interest Voting Rights Held Sopheon Corporation Common Stock 100 percent Software sales and services Minnesota, USA Sopheon Corporation Common Stock 100 percent Software development and Delaware, USA sales Alignent Software, Inc. Common Stock 100 percent Software sales and servicesCalifornia, USA Sopheon NV Ordinary Shares 100 percent Software sales and servicesThe Netherlands Sopheon Uk Ltd. Ordinary Shares 100 percent Software sales and servicesUnited kingdom Orbital Software holdings plc. Ordinary Shares 100 percent holding companyUnited kingdom Orbital Software Inc.† Common Stock 100 percent DormantDelaware, USA Sopheon Edinburgh Ltd.† Ordinary Shares 100 percent DormantUnited kingdom Orbital Software Europe Ltd.† Ordinary Shares 100 percent DormantUnited kingdom Network Managers (Uk) Ltd.* Ordinary Shares 100 percent DormantUnited kingdom
AppliedNet Ltd.* Ordinary Shares 100 percent DormantUnited kingdom Future Tense Ltd.* Ordinary Shares 100 percent DormantUnited kingdom Polydoc Ltd. Ordinary Shares 100 percent DormantUnited kingdom Applied Network Technology Ltd.* Ordinary Shares 100 percent Employee Share OwnershipUnited kingdom Trust
1 6 . OT H E R R E C E I VA B L E Group Company
2011 2010 2011 2010 £’000 £’000 £’000 £’000 Other receivable 12 12 - - –––––––– –––––––– –––––––– –––––––– –––––––– –––––––– –––––––– ––––––––
The other receivable represents a deposit paid in respect of a property leased by the group.
4 3NOTES TO THE FINANCIAL STATEMENTS

1 7 . T R A D E A N D OT H E R R E C E I VA B L E S
Group Company
2011 2010 2011 2010 £’000 £’000 £’000 £’000
Trade receivables 3,103 3,870 - -Other receivables 5 5 - - –––––––– –––––––– –––––––– ––––––––Total receivables 3,108 3,875 - -Prepayments 145 232 - 9Accrued income 12 12 - - –––––––– –––––––– –––––––– –––––––– 3,265 4,119 - 9 –––––––– –––––––– –––––––– –––––––– –––––––– –––––––– –––––––– –––––––– Trade and other receivables are stated net of allowances totaling £30,000 (2010: £28,000) for estimated irrecoverable amounts. The directors consider that the carrying amount of trade and other receivables approximates to their fair value. A full provision has been made against amounts totaling £40,191,000 (2010: £40,460,000) owed to the company by subsidiary undertakings, which are due after more than one year and are subordinated to the claims of all other creditors.
1 8 . C A S H A N D S H O R T- T E R M B A N K D E P O S I T S Group Company 2011 2010 2011 2010 £’000 £’000 £’000 £’000 Cash at bank 1,824 2,129 133 76Short-term bank deposits 1,117 1,229 570 658 –––––––– –––––––– –––––––– –––––––– 2,941 3,358 703 734 –––––––– –––––––– –––––––– –––––––– –––––––– –––––––– –––––––– –––––––– Cash and short-term bank deposits comprise cash held by the group, bank current accounts and short-term bank deposit accounts with maturities of three months or less and bearing interest at variable rates. The carrying amount of these assets represents a reasonable approximation to their fair value. Included in cash at bank of the group is an amount of £23,000 (2010: £23,000) held by the group’s employee share ownership trust.
1 9 . T R A D E A N D OT H E R PAYA B L E S Group Company
2011 2010 2011 2010 £’000 £’000 £’000 £’000 Trade payables 344 444 24 29Other payables 114 91 103 141Tax and social security costs 221 208 - -Accruals 788 1,603 174 265 –––––––– –––––––– –––––––– –––––––– 1,467 2,346 301 435 –––––––– –––––––– –––––––– –––––––– –––––––– –––––––– –––––––– –––––––– Trade payables principally comprise amounts outstanding for trade purchases and ongoing costs. The directors consider that the carrying amounts of trade and other payables represent a reasonable approximation to their fair values.
4 4 NOTES TO THE FINANCIAL STATEMENTS

2 0 . B O R R O W I N G S
Group Company 2011 2010 2011 2010 £’000 £’000 £’000 £’000 Current Loans and BorrowingsLine of credit 776 319 - -Loan notes (current portion) 672 663 - - –––––––– –––––––– –––––––– ––––––––Total current loans and borrowings 1,448 982 - -
Non-current Loans and BorrowingsLoan notes 840 1,491 -8% convertible loan stock 2013 823 799 823 799 –––––––– –––––––– –––––––– ––––––––Total non-current loans and borrowings 1,663 2,290 823 799 –––––––– –––––––– –––––––– ––––––––Total loans and borrowings 3,111 3,272 823 799 –––––––– –––––––– –––––––– –––––––– –––––––– –––––––– –––––––– –––––––– a) Line of Credit The line of credit is denominated in US Dollars and bears interest at a variable rate currently 10.95 percent. The line of credit is a revolving facility limited to the lesser of $1,250,000 and 75 percent of the eligible trade receivables of the group’s US subsidiaries, which at 31 December 2011 amounted to $3,482,000 (£2,252,000) (2010: $4,968,000 (£3,173,000)). At 31 December 2011, $1,200,000 (£776,000) was drawn down under the line of credit facility (2010: $500,000 (£319,000)). b) Loan Notes The loan notes are denominated in US Dollars and represent mezzanine loan finance provided BlueCrest Capital Finance LLC (“BlueCrest”). The loan notes were issued in June 2007 for an initial principal amount of $3,500,000 repayable in equal installments over the four-year period to July 2011 bearing interest at a fixed rate of 11.03 percent. On 8 December 2010, the group entered into a new mezzanine loan with BlueCrest, for an amount of $3,500,000, equal to the principal amount of the original loan. Part of the proceeds after expenses were applied in repayment of the remaining balance outstanding on the original mezzanine loan, with the balance to provide additional working capital of approximately $2.7m for the group. The new mezzanine loan is repayable in 39 monthly instalments of $90,000, together with interest at a fixed rate of 13 percent per annum, over the period to March 2014. The mezzanine loan and the line of credit, which is also provided by BlueCrest, are secured by a debenture and guarantee provided by Sopheon plc. The company has estimated the risk of this guarantee being called at 5 percent of the carrying value of the loan, and in its financial statements has included a provision for this amount within other payables. The directors consider that the carrying amounts for loan notes, and the line of credit, represent a reasonable approximation of the financial instruments’ fair values.
4 5NOTES TO THE FINANCIAL STATEMENTS

c) 8 Percent Convertible Loan Stock 2013 The convertible loan stock is denominated in Sterling and bears interest at a fixed rate of 8 percent per annum. The loan stock was issued at par in a nominal amount of £850,000 on 1 October 2009 with a maturity date of 30 September 2011. On 8 December 2010, the holders of the loan stock unanimously agreed to extend the maturity date by a further 16 months to 31 January 2013. The original terms provided that the loan stock was convertible into Sopheon ordinary shares at a conversion price of 10p per share, and contained provisions for the amendment of the conversion price in the case of any subsequent equity issues by the company at a price per share lower than the conversion price. The conversion price was amended, in conjunction with the extension of the maturity date, to 7.75p, being the market price for Sopheon shares on 7 December 2010. At the same time, the provisions for future amendment of the conversion price were removed. The loan stock is convertible at any time up to the extended maturity date of 31 January 2013, and any loan stock not converted will be repaid at par on that date. The liability at maturity of the loan stock is £850,000. The carrying value of the liability component of the loan stock at 31 December 2011 was £823,000 based on discounted cash flows using a discount rate of 16.4 percent. Following the removal on 8 December 2010 of the provisions for future amendment of the conversion price, the carrying value of the equity component represented by the conversion rights attaching to the loan stock was reclassified from debt to equity in the financial statements.
2 1 . O B L I G AT I O N S U N D E R F I N A N C E L E A S E S The present value of future lease payments is analyzed as: Group Company 2011 2010 2011 2010 £’000 £’000 £’000 £’000 Current liabilities 2 2 - - Non-current liabilities - 2 - - –––––––– –––––––– –––––––– –––––––– 2 4 - - –––––––– –––––––– –––––––– –––––––– –––––––– –––––––– –––––––– –––––––– The group leases a telephone system with a net carrying value at 31 December 2011 of £2,000 (2010: £4,000). Future lease payments are due as follows:
At 31 December 2011 Minimum Lease Present Payments Interest Value £’000 £’000 £’000 Within one year 2 - 2Due in one to five years - - - –––––––– –––––––– –––––––– 2 - 2 –––––––– –––––––– –––––––– –––––––– –––––––– ––––––––
At 31 December 2010 Minimum Lease Present Payments Interest Value £’000 £’000 £’000 Within one year 2 - 2Due in one to five years 2 - 2 –––––––– –––––––– –––––––– 4 - 4 –––––––– –––––––– –––––––– –––––––– –––––––– ––––––––
4 6 NOTES TO THE FINANCIAL STATEMENTS

2 2 . O P E R AT I N G L E A S E A R R A N G E M E N T S At the balance sheet date the group had outstanding commitments under operating leases in respect of which the total future minimum lease payments were due as follows: Land & Land & Buildings Other Buildings Other 2011 2011 2010 2010 £’000 £’000 £’000 £’000 Due within one year 345 52 334 58Due after one year and within five years 279 18 422 37 –––––––– –––––––– –––––––– –––––––– 624 70 756 95 –––––––– –––––––– –––––––– –––––––– –––––––– –––––––– –––––––– ––––––––
The group leases its office accommodation in the US, Uk and the Netherlands and has operating leases for office equipment and vehicles.
CompanyThe company has no operating leases.
2 3 . F I N A N C I A L I N S T R U M E N T S
Categories of Financial Assets and Liabilities
The following table sets out the categories of financial instruments held by the group. All of the group’s financial assets are in the category of loans and receivables, and all of its financial liabilities are in the category of financial liabilities measured at amortized cost.
1. Financial Assets Group Company Notes 2011 2010 2011 2010 £’000 £’000 £’000 £’000
Current Financial AssetsTrade receivables 17 3,103 3,870 - -Other receivables 17 5 5 - -Accrued income 17 12 12 - -Cash and cash equivalents 18 2,941 3,358 703 734 –––––––– –––––––– –––––––– –––––––– 6,061 7,245 703 734 –––––––– –––––––– –––––––– –––––––– –––––––– –––––––– –––––––– ––––––––Non-current Financial AssetsOther receivable 16 12 12 - - –––––––– –––––––– –––––––– –––––––– –––––––– –––––––– –––––––– ––––––––
The group does not have any financial assets in any other categories.
4 7NOTES TO THE FINANCIAL STATEMENTS
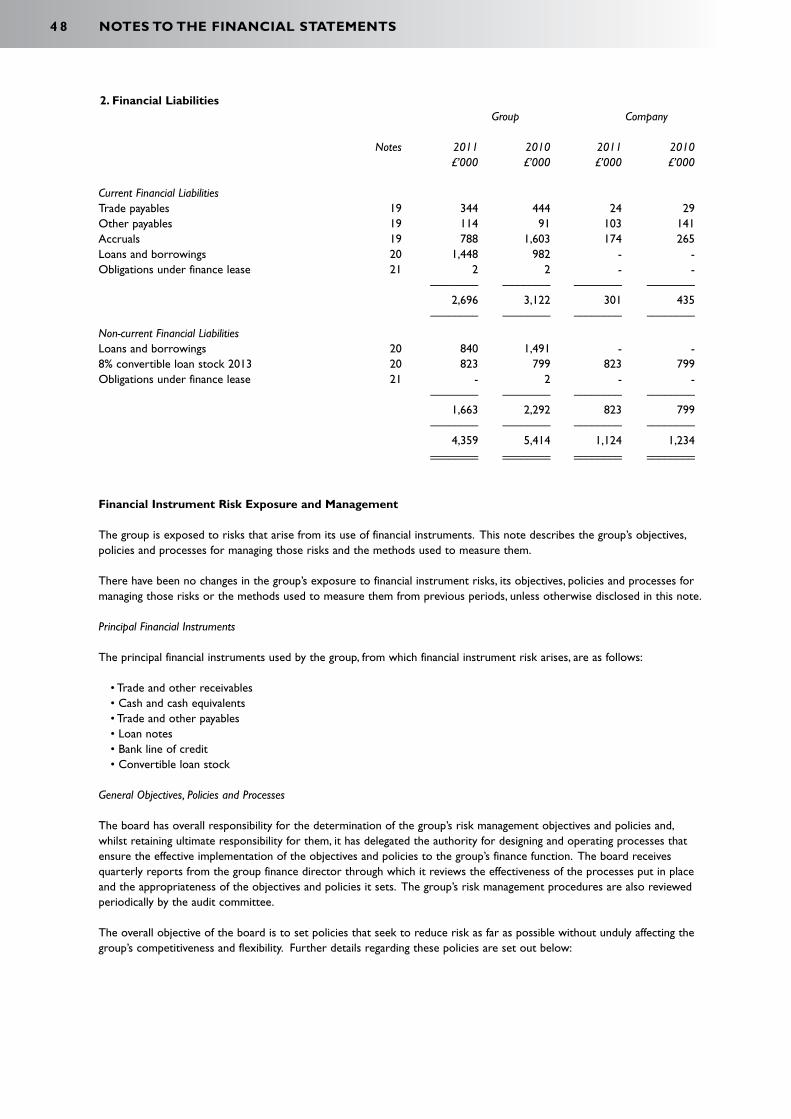
2. Financial Liabilities Group Company Notes 2011 2010 2011 2010 £’000 £’000 £’000 £’000
Current Financial LiabilitiesTrade payables 19 344 444 24 29Other payables 19 114 91 103 141Accruals 19 788 1,603 174 265Loans and borrowings 20 1,448 982 - -Obligations under finance lease 21 2 2 - - –––––––– –––––––– –––––––– –––––––– 2,696 3,122 301 435 –––––––– –––––––– –––––––– ––––––––
Non-current Financial LiabilitiesLoans and borrowings 20 840 1,491 - -8% convertible loan stock 2013 20 823 799 823 799Obligations under finance lease 21 - 2 - - –––––––– –––––––– –––––––– –––––––– 1,663 2,292 823 799 –––––––– –––––––– –––––––– –––––––– 4,359 5,414 1,124 1,234 –––––––– –––––––– –––––––– –––––––– –––––––– –––––––– –––––––– ––––––––
Financial Instrument Risk Exposure and Management
The group is exposed to risks that arise from its use of financial instruments. This note describes the group’s objectives, policies and processes for managing those risks and the methods used to measure them.
There have been no changes in the group’s exposure to financial instrument risks, its objectives, policies and processes for managing those risks or the methods used to measure them from previous periods, unless otherwise disclosed in this note. Principal Financial Instruments
The principal financial instruments used by the group, from which financial instrument risk arises, are as follows:
•Tradeandotherreceivables•Cashandcashequivalents•Tradeandotherpayables•Loannotes•Banklineofcredit•Convertibleloanstock
General Objectives, Policies and Processes
The board has overall responsibility for the determination of the group’s risk management objectives and policies and, whilst retaining ultimate responsibility for them, it has delegated the authority for designing and operating processes that ensure the effective implementation of the objectives and policies to the group’s finance function. The board receives quarterly reports from the group finance director through which it reviews the effectiveness of the processes put in place and the appropriateness of the objectives and policies it sets. The group’s risk management procedures are also reviewed periodically by the audit committee.
The overall objective of the board is to set policies that seek to reduce risk as far as possible without unduly affecting the group’s competitiveness and flexibility. Further details regarding these policies are set out below:
4 8 NOTES TO THE FINANCIAL STATEMENTS
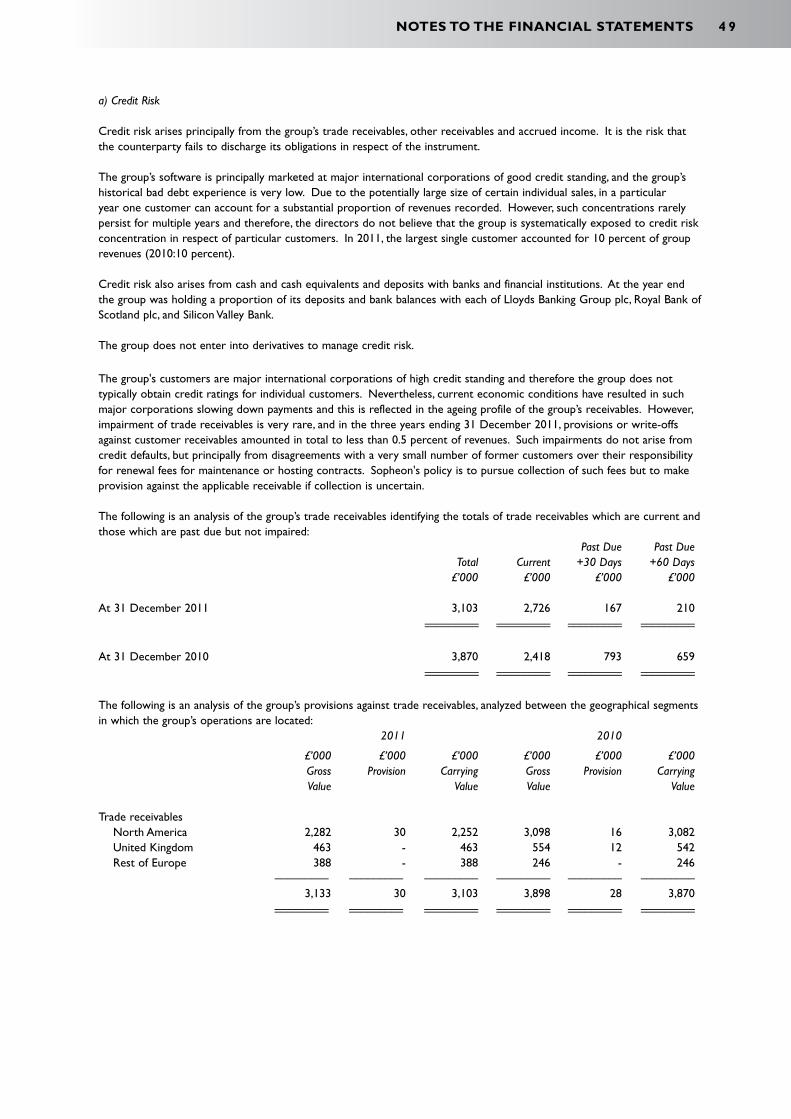
a) Credit Risk
Credit risk arises principally from the group’s trade receivables, other receivables and accrued income. It is the risk that the counterparty fails to discharge its obligations in respect of the instrument.
The group’s software is principally marketed at major international corporations of good credit standing, and the group’s historical bad debt experience is very low. Due to the potentially large size of certain individual sales, in a particular year one customer can account for a substantial proportion of revenues recorded. however, such concentrations rarely persist for multiple years and therefore, the directors do not believe that the group is systematically exposed to credit risk concentration in respect of particular customers. In 2011, the largest single customer accounted for 10 percent of group revenues (2010:10 percent).
Credit risk also arises from cash and cash equivalents and deposits with banks and financial institutions. At the year end the group was holding a proportion of its deposits and bank balances with each of Lloyds Banking Group plc, Royal Bank of Scotland plc, and Silicon Valley Bank.
The group does not enter into derivatives to manage credit risk.
The group's customers are major international corporations of high credit standing and therefore the group does not typically obtain credit ratings for individual customers. Nevertheless, current economic conditions have resulted in such major corporations slowing down payments and this is reflected in the ageing profile of the group’s receivables. however, impairment of trade receivables is very rare, and in the three years ending 31 December 2011, provisions or write-offs against customer receivables amounted in total to less than 0.5 percent of revenues. Such impairments do not arise from credit defaults, but principally from disagreements with a very small number of former customers over their responsibility for renewal fees for maintenance or hosting contracts. Sopheon's policy is to pursue collection of such fees but to make provision against the applicable receivable if collection is uncertain.
The following is an analysis of the group’s trade receivables identifying the totals of trade receivables which are current and those which are past due but not impaired: Past Due Past Due Total Current +30 Days +60 Days £’000 £’000 £’000 £’000
At 31 December 2011 3,103 2,726 167 210 ––––––––– ––––––––– ––––––––– ––––––––– ––––––––– ––––––––– ––––––––– –––––––––
At 31 December 2010 3,870 2,418 793 659 ––––––––– ––––––––– ––––––––– ––––––––– ––––––––– ––––––––– ––––––––– –––––––––
The following is an analysis of the group’s provisions against trade receivables, analyzed between the geographical segments in which the group’s operations are located: 2011 2010
£’000 £’000 £’000 £’000 £’000 £’000 Gross Provision Carrying Gross Provision Carrying Value Value Value Value
Trade receivables North America 2,282 30 2,252 3,098 16 3,082 United kingdom 463 - 463 554 12 542 Rest of Europe 388 - 388 246 - 246 ––––––––– ––––––––– ––––––––– ––––––––– ––––––––– ––––––––– 3,133 30 3,103 3,898 28 3,870 ––––––––– ––––––––– ––––––––– ––––––––– ––––––––– ––––––––– ––––––––– ––––––––– ––––––––– ––––––––– ––––––––– –––––––––
4 9NOTES TO THE FINANCIAL STATEMENTS

The group records impairment losses on its trade receivables separately from the gross amounts receivable. The movements on this allowance during the year are summarized below: 2011 2010 £’000 £’000
Opening balance 28 20Utilization of provisions (28) -New provisions 30 8 ––––––––– –––––––––Closing balance 30 28 ––––––––– ––––––––– ––––––––– –––––––––
The main factors used in assessing the impairment of the group’s trade receivables are the age of the balances and the circumstances of the individual customer. The company provides in full for amounts due from subsidiaries. The company is exposed to credit risk in respect of its cash and cash equivalents, which are held in the form of current account and money market balances with leading Uk, US and European banking institutions. b) Liquidity Risk Liquidity risk arises from the group’s management of working capital, and more particularly its ability to reach a point where its trading is cash generative, together with the finance charges and principal repayments on its debt instruments. It is the risk that the group will encounter difficulties in meeting its financial obligations as they fall due.
The group’s policy is to maintain significant cash balances, short-term bank deposits and facilities with a view to having sufficient cash to meet its liabilities when they become due. The board annually approves budgets including cash flow projections for each of the operating companies within the group and receives regular information as to cash balances held and progress against budget. Attention is particularly drawn to the detailed discussion of the factors which enable the group to continue as a going concern for the foreseeable future in the section headed “Going Concern” in Note 2 to the financial statements.
The following table sets out an analysis of the contractual maturity of the group’s and the company’s financial liabilities that must be settled gross, based on exchange rates prevailing at the relevant balance sheet date.
Group
At 31 December 2011 On Demand or Within Within Within Within Six Months One Year Two Years Five Years Total £’000 £’000 £’000 £’000 £’000
Trade and other payables 1,444 - - 23 1,467Line of credit 776 - - - 776Loan notes 336 336 672 168 1,512Future interest – loan notes 92 70 72 3 237Convertible loan stock - - 850 - 850Future interest – convertible loan stock 34 34 6 - 74Finance lease 1 1 - - 2 ––––––––– ––––––––– ––––––––– ––––––––– –––––––––Total financial liabilities 2,683 441 1,600 194 4,918 ––––––––– ––––––––– ––––––––– ––––––––– ––––––––– ––––––––– ––––––––– ––––––––– ––––––––– –––––––––
5 0 NOTES TO THE FINANCIAL STATEMENTS

At 31 December 2010 On Demand or Within Within Within Within Six Months One Year Two Years Five Years Total £’000 £’000 £’000 £’000 £’000
Trade and other payables 2,346 - - - 2,346Line of credit 319 - - - 319Loan notes 331 331 663 829 2,154Future interest – loan notes 135 114 160 75 484Convertible loan stock - - - 850 850Future interest – convertible loan stock 34 34 68 6 142Finance lease 1 1 2 - 4 ––––––––– ––––––––– ––––––––– ––––––––– –––––––––Total financial liabilities 3,166 480 893 1,760 6,299 ––––––––– ––––––––– ––––––––– ––––––––– ––––––––– ––––––––– ––––––––– ––––––––– ––––––––– –––––––––
Company
At 31 December 2011 On Demand or Within Within Within Within Six Months One Year Two Years Five Years Total £’000 £’000 £’000 £’000 £’000 Trade and other payables 301 - - - 301Convertible loan stock - - 850 - 850Future interest – convertible loan stock 34 34 6 - 74 ––––––––– ––––––––– ––––––––– ––––––––– –––––––––Total financial liabilities 335 34 856 - 1,225 ––––––––– ––––––––– ––––––––– ––––––––– ––––––––– ––––––––– ––––––––– ––––––––– ––––––––– –––––––––
At 31 December 2010 On Demand or Within Within Within Within Six Months One Year Two Years Five Years Total £’000 £’000 £’000 £’000 £’000 Trade and other payables 435 - - - 435Convertible loan stock - - - 850 850Future interest – convertible loan stock 34 34 68 6 142 ––––––––– ––––––––– ––––––––– ––––––––– –––––––––Total financial liabilities 469 34 68 856 1,427 ––––––––– ––––––––– ––––––––– ––––––––– ––––––––– ––––––––– ––––––––– ––––––––– ––––––––– –––––––––
c) Market Risk
Market risk arises from the group’s use of interest-bearing and foreign currency financial instruments. It is the risk that the future cash flows of a financial instrument will fluctuate because of changes in interest rates (interest rate risk) or foreign exchange rates (currency risk).
The group does not have any financial instruments that are publicly traded securities and is not exposed to other price risk associated with changes in the market prices of such securities.
5 1NOTES TO THE FINANCIAL STATEMENTS

d) Interest Rate Risk
The group’s fixed rate interest bearing liabilities comprise loan notes with a carrying value at 31 December 2011 of £1,512,000, which bear a fixed interest rate of 13 percent, and convertible loan stock with a carrying value of £823,000, which bears a fixed interest rate of 8 percent. These liabilities do not give rise to interest rate risk. The group also has a line of credit, on which £776,000 was outstanding at 31 December 2011, and which bears a variable interest rate based on a margin of 1.25 percent above the lender’s Prime Rate. Should this rate vary by 1 percent the annualized effect would be to increase or reduce finance costs by £8,000.
The company’s interest bearing liabilities consist of its convertible loan stock which bears a fixed rate of interest of 8 percent, which does not give rise to interest rate risk.
The group invests its surplus cash in bank deposits denominated in US Dollars, Euros or Sterling, which bear interest based on short-term money market rates, and in doing so exposes itself to fluctuations in money market interest rates. The group’s surplus cash held in the form of bank deposits at 31 December 2011 was £1,117,000. During 2011 interest rates on US Dollar or Sterling money market deposits averaged around 0.5 percent. The annualized effect of a movement of 0.5 percent in the average interest rate received on the group’s bank deposits at the balance sheet date would result in an increase or decrease in the group’s and the company’s interest income of £5,000.
The company’s interest bearing deposits at the balance sheet date were £570,000. The annualized effect of a movement of 0.5 percent in the average interest rate received on the group’s bank deposits at the balance sheet date would result in an increase or decrease the company’s interest income of £3,000.
e) Currency Risk
The following is an analysis of the group’s financial assets and liabilities, analyzed by the currency in which they are denominated:
At 31 December 2011 US Dollars Sterling Euro Total £’000 £’000 £’000 £’000Financial AssetsReceivables and accrued income 2,264 473 394 3,132Cash and cash equivalents 1,777 219 945 2,941 ––––––––– ––––––––– ––––––––– –––––––––Total financial assets 4,041 692 1,339 6,073 ––––––––– ––––––––– ––––––––– ––––––––– ––––––––– ––––––––– ––––––––– –––––––––Financial LiabilitiesTrade and other payables 693 237 316 1,246Borrowings 2,290 823 - 3,113 ––––––––– ––––––––– ––––––––– –––––––––Total financial liabilities 2,983 1,060 316 4,359 ––––––––– ––––––––– ––––––––– ––––––––– ––––––––– ––––––––– ––––––––– –––––––––
At 31 December 2010 US Dollars Sterling Euro Total £’000 £’000 £’000 £’000Financial AssetsReceivables and accrued income 3,094 552 253 3,899Cash and cash equivalents 1,904 773 681 3,358 ––––––––– ––––––––– ––––––––– –––––––––Total financial assets 4,998 1,325 934 7,257 ––––––––– ––––––––– ––––––––– ––––––––– ––––––––– ––––––––– ––––––––– –––––––––Financial LiabilitiesTrade and other payables 1,386 335 417 2,138Borrowings 2,477 799 - 3,276 ––––––––– ––––––––– ––––––––– –––––––––Total financial liabilities 3,863 1,134 417 5,414 ––––––––– ––––––––– ––––––––– ––––––––– ––––––––– ––––––––– ––––––––– –––––––––
The group’s policy is, where possible, to allow group entities to settle liabilities denominated in the functional currency with cash generated from their own operations in that currency. The group also maintains cash and bank deposits in the currencies which are the functional currencies of its operating entities, which are the US Dollar, the Euro and Sterling.
The group is exposed to currency risk in respect of foreign currency denominated bank deposits and bank loans. Taking into account the fact that a large proportion of the group’s income and expenditure arise in US Dollars and, to a lesser extent, in Euros, the group’s policy is not to seek to hedge such currency risk.
5 2 NOTES TO THE FINANCIAL STATEMENTS

Foreign currency risk also arises where individual group entities enter into transactions denominated in currencies other than their functional currency, with fluctuations in exchange rates giving rise to gains or losses in the income statement. Where the foreign currency risk to the group is significant, consideration is given to hedging the risk through the forward currency market and, whilst this would be an economic hedge of the cash-flow risk, the group does not employ hedge accounting.
The following table shows the effects, all other things being equal, of changes to exchange rates on the group’s profit after tax and on the exchange differences on retranslation of the assets and liabilities of foreign operations which is recognized directly in equity. It illustrates the effects if the exchange rates for the US Dollar and the Euro had been higher or lower than those which actually applied during the year and at the year end.
2011 2010 2011 2010 Effect of Increase/ Increase/ Exchange Differences (Decrease) (Decrease on Translation of in Profit in Profit Assets and Liabilities After Tax After Tax of Foreign Operations £’000 £’000 £’000 £’000
Weakening of US Dollar by 10c (10) 18 (118) (212)Strengthening of US Dollar by 10c 3 (23) 134 242Weakening of Euro by 10c - 15 (57) (26)Strengthening of Euro by 10c (26) (18) 67 31 ––––––––– ––––––––– ––––––––– ––––––––– ––––––––– ––––––––– ––––––––– –––––––––
The company holds certain assets, mainly bank deposits, and liabilities denominated in the functional currencies of its principal operating subsidiaries, which are the US Dollar, the Euro and Sterling. The following table shows the effects, all other things being equal, of changes to exchange rates at the year end on the profit after tax of the company. It is based on the company’s assets and liabilities at the relevant balance sheet date.
2011 2010 (Increase)/Decrease in Profit After Tax £’000 £’000
Weakening of US Dollar by 10c (19) (7) Strengthening of US Dollar by 10c 22 8 Weakening of Euro by 10c (22) (25) Strengthening of Euro by 10c 25 29 ––––––––– ––––––––– ––––––––– –––––––––
f) Capital
The group considers its capital to comprise its share capital and share premium and other capital reserves less the accumulated retained losses. The group is not subject to any externally imposed capital requirements. In managing its capital, the group’s primary objective is to support the development of the group’s activities through to the point where they are cash generative on a sustained basis. The group’s capital is all equity capital and is summarized in Note 24.
2 4 . S H A R E C A P I TA L Issued and Fully Paid 2011 2011 2010 2010 Number £’000 Number £’000 Ordinary shares of 5p each 145,579,027 7,279 145,579,027 7,279 ––––––––– ––––––––– ––––––––– ––––––––– ––––––––– ––––––––– ––––––––– –––––––––
The company has one class of ordinary shares, which carry no right to fixed income. At 31 December 2011 the company had outstanding 502,790 warrants to subscribe for ordinary shares at a price of 20p per share, which were issued in June 2007 to BlueCrest Capital Finance LLC in connection with the financing of the acquisition of Alignent Software, Inc.
5 3NOTES TO THE FINANCIAL STATEMENTS
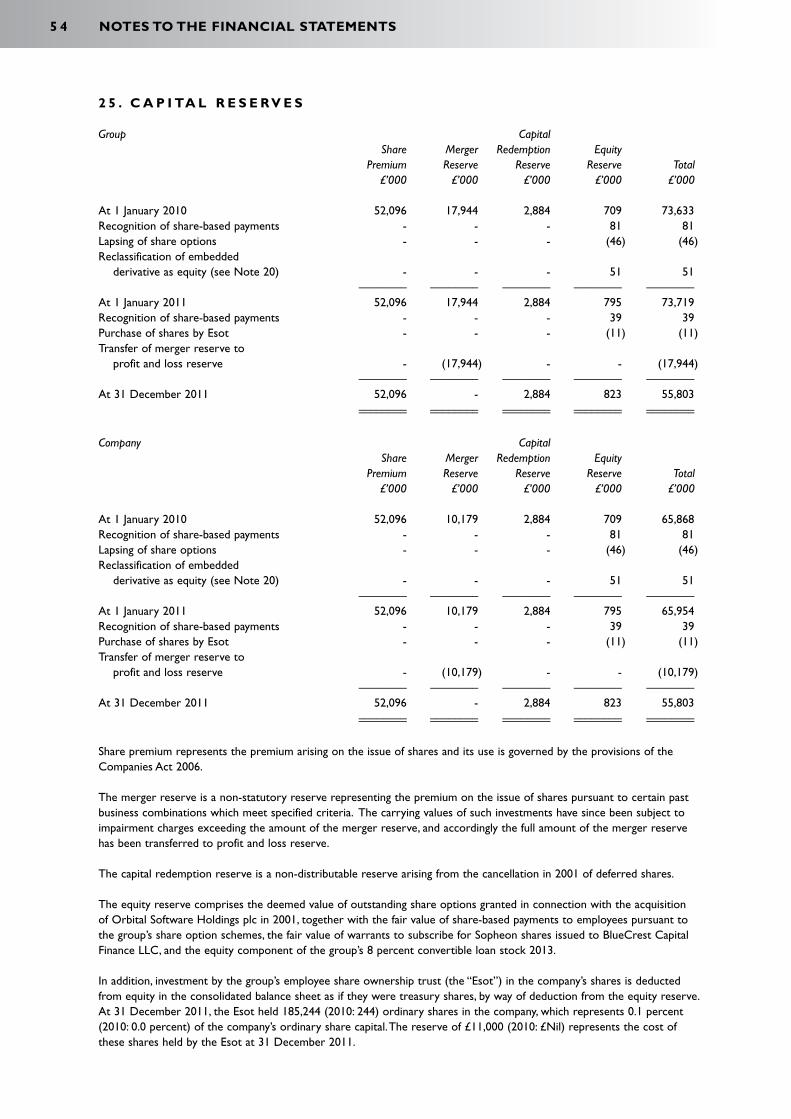
2 5 . C A P I TA L R E S E R V E S Group Capital Share Merger Redemption Equity Premium Reserve Reserve Reserve Total £’000 £’000 £’000 £’000 £’000 At 1 January 2010 52,096 17,944 2,884 709 73,633Recognition of share-based payments - - - 81 81Lapsing of share options - - - (46) (46)Reclassification of embedded derivative as equity (see Note 20) - - - 51 51 –––––––– –––––––– –––––––– –––––––– ––––––––At 1 January 2011 52,096 17,944 2,884 795 73,719Recognition of share-based payments - - - 39 39Purchase of shares by Esot - - - (11) (11)Transfer of merger reserve to profit and loss reserve - (17,944) - - (17,944) –––––––– –––––––– –––––––– –––––––– ––––––––At 31 December 2011 52,096 - 2,884 823 55,803 –––––––– –––––––– –––––––– –––––––– –––––––– –––––––– –––––––– –––––––– –––––––– ––––––––
Company Capital Share Merger Redemption Equity Premium Reserve Reserve Reserve Total £’000 £’000 £’000 £’000 £’000 At 1 January 2010 52,096 10,179 2,884 709 65,868Recognition of share-based payments - - - 81 81Lapsing of share options - - - (46) (46)Reclassification of embedded derivative as equity (see Note 20) - - - 51 51 –––––––– –––––––– –––––––– –––––––– ––––––––At 1 January 2011 52,096 10,179 2,884 795 65,954Recognition of share-based payments - - - 39 39Purchase of shares by Esot - - - (11) (11)Transfer of merger reserve to profit and loss reserve - (10,179) - - (10,179) –––––––– –––––––– –––––––– –––––––– –––––––– At 31 December 2011 52,096 - 2,884 823 55,803 –––––––– –––––––– –––––––– –––––––– –––––––– –––––––– –––––––– –––––––– –––––––– ––––––––
Share premium represents the premium arising on the issue of shares and its use is governed by the provisions of the Companies Act 2006.
The merger reserve is a non-statutory reserve representing the premium on the issue of shares pursuant to certain past business combinations which meet specified criteria. The carrying values of such investments have since been subject to impairment charges exceeding the amount of the merger reserve, and accordingly the full amount of the merger reserve has been transferred to profit and loss reserve.
The capital redemption reserve is a non-distributable reserve arising from the cancellation in 2001 of deferred shares.
The equity reserve comprises the deemed value of outstanding share options granted in connection with the acquisition of Orbital Software holdings plc in 2001, together with the fair value of share-based payments to employees pursuant to the group’s share option schemes, the fair value of warrants to subscribe for Sopheon shares issued to BlueCrest Capital Finance LLC, and the equity component of the group’s 8 percent convertible loan stock 2013.
In addition, investment by the group’s employee share ownership trust (the “Esot”) in the company’s shares is deducted from equity in the consolidated balance sheet as if they were treasury shares, by way of deduction from the equity reserve. At 31 December 2011, the Esot held 185,244 (2010: 244) ordinary shares in the company, which represents 0.1 percent (2010: 0.0 percent) of the company’s ordinary share capital. The reserve of £11,000 (2010: £Nil) represents the cost of these shares held by the Esot at 31 December 2011.
5 4 NOTES TO THE FINANCIAL STATEMENTS
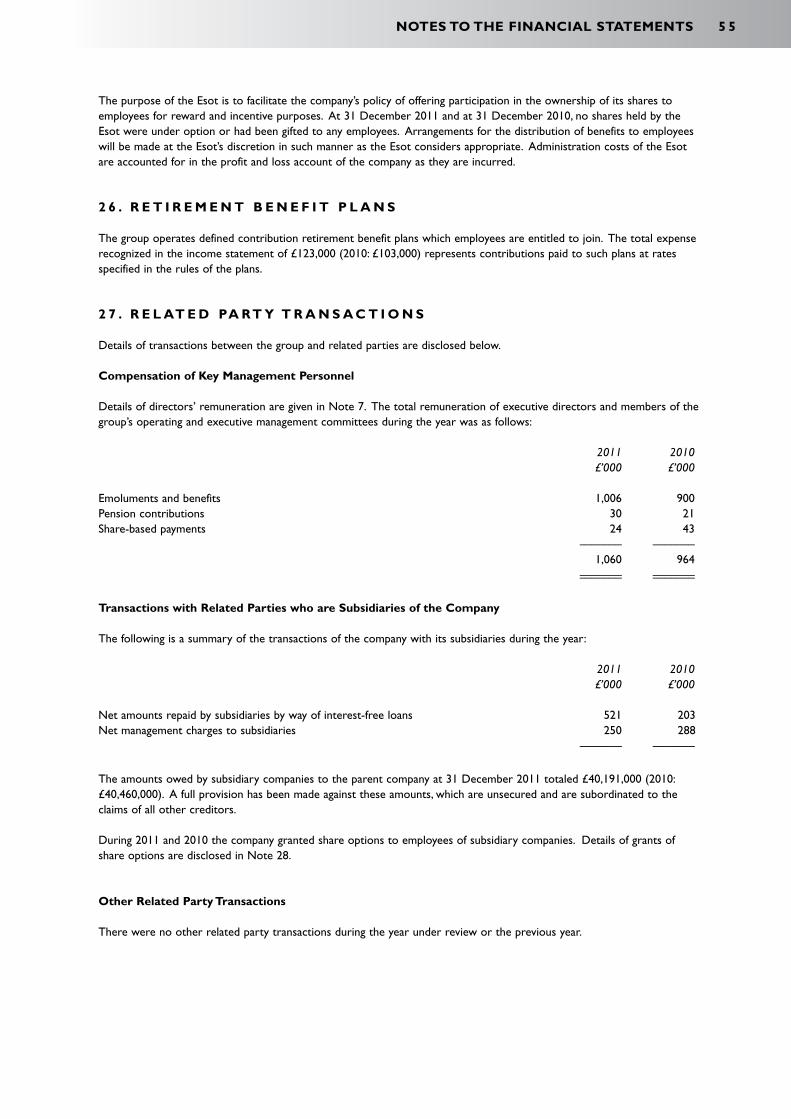
The purpose of the Esot is to facilitate the company’s policy of offering participation in the ownership of its shares to employees for reward and incentive purposes. At 31 December 2011 and at 31 December 2010, no shares held by the Esot were under option or had been gifted to any employees. Arrangements for the distribution of benefits to employees will be made at the Esot’s discretion in such manner as the Esot considers appropriate. Administration costs of the Esot are accounted for in the profit and loss account of the company as they are incurred.
2 6 . R E T I R E M E N T B E N E F I T P L A N S The group operates defined contribution retirement benefit plans which employees are entitled to join. The total expense recognized in the income statement of £123,000 (2010: £103,000) represents contributions paid to such plans at rates specified in the rules of the plans.
2 7 . R E L AT E D PA R T Y T R A N S A C T I O N S
Details of transactions between the group and related parties are disclosed below.
Compensation of Key Management Personnel
Details of directors’ remuneration are given in Note 7. The total remuneration of executive directors and members of the group’s operating and executive management committees during the year was as follows: 2011 2010 £’000 £’000
Emoluments and benefits 1,006 900Pension contributions 30 21Share-based payments 24 43 ––––––– ––––––– 1,060 964 ––––––– ––––––– ––––––– –––––––
Transactions with Related Parties who are Subsidiaries of the Company
The following is a summary of the transactions of the company with its subsidiaries during the year:
2011 2010 £’000 £’000
Net amounts repaid by subsidiaries by way of interest-free loans 521 203Net management charges to subsidiaries 250 288 ––––––– –––––––
The amounts owed by subsidiary companies to the parent company at 31 December 2011 totaled £40,191,000 (2010: £40,460,000). A full provision has been made against these amounts, which are unsecured and are subordinated to the claims of all other creditors. During 2011 and 2010 the company granted share options to employees of subsidiary companies. Details of grants of share options are disclosed in Note 28.
Other Related Party Transactions
There were no other related party transactions during the year under review or the previous year.
5 5NOTES TO THE FINANCIAL STATEMENTS

2 8 . S H A R E - B A S E D PAY M E N T S Equity-settled Share Option Schemes
The group has a number of share option schemes for all employees. Options are exercisable at a price equal to the market price on the date of grant. The normal vesting periods are as set out below.
Vesting
Sopheon plc (USA) stock option plan In three equal tranches between the first and third anniversary of grantSopheon Uk approved share option scheme On third anniversary of grantSopheon Uk unapproved share option scheme Immediate or as per USA planSopheon NV share option scheme Immediate or as per USA plan Details of the share options outstanding during the year are as follows:
Weighted Weighted Number of Average Number of Average Share Exercise Share Exercise Options Price Options Price 2011 2011 2010 2010 £ £
Outstanding at the beginning of the year 12,504,924 0.17 12,141,618 0.22 Granted during the year 880,000 0.09 1,460,000 0.08Lapsed or expired during the year (191,870) 0.63 (1,096,694) 0.61 ––––––––– ––––––––– ––––––––– –––––––––Outstanding at the end of the year 13,193,054 0.16 12,504,924 0.17 ––––––––– ––––––––– ––––––––– ––––––––– ––––––––– ––––––––– ––––––––– –––––––––
Exercisable at the end of the year 10,801,432 0.17 10,338,100 0.18 ––––––––– ––––––––– ––––––––– ––––––––– ––––––––– ––––––––– ––––––––– –––––––––
No share options were exercised during the year (2010: Nil). The options outstanding at the end of the year have a weighted average contractual life of 4.6 years (2010: 5.0 years). During 2011, share options were granted on 26 April 2011 and on 28 September 2011. In both cases the exercise prices of the options granted was 8.75p, and the estimated fair value was 5.2p. During 2010, share options were granted on 27 August 2010. The fair values for options granted are calculated using the binomial option-pricing model. The principal assumptions used were:
Date of Grant September April August 2011 2011 2010
Share price at time of grant 8.75p 8.75p 7.5pExercise price 8.75p 8.75p 7.5pExpected volatility 40% 40% 40%Risk-free rate 5% 5% 5% Expected dividend yield Nil Nil Nil
The expected contractual life of the options used was either five or ten years depending on the particular scheme rules. Expected volatility was determined by reference to the historic volatility of the company’s share price in the period before the date of grant. The group and company recognized total expenses of £39,000 (2010: £81,000) relating to equity-settled share-based payments during the year.
5 6 NOTES TO THE FINANCIAL STATEMENTS

Barry Mence, Executive Chairman. Barry Mence has served as executive chairman and as a director and substantial shareholder of Sopheon since its inception in 1993 when he was one of the founding members. From 1976 to 1990, Mr. Mence was a major shareholder and group managing director of the Rendeck Group of Companies, a software and services group based in the Netherlands.
Andrew Michuda, Executive Director. Andrew Michuda was appointed chief executive officer of Sopheon in September 2000. From 1997 to 2000 he served as chief executive officer and an executive director of Teltech Resource Network Corporation, which was acquired by Sopheon. he earlier held senior leadership positions at Control Data, including general manager of the business that evolved into Decision Data, the world's largest independent computer services provider.
Arif Karimjee, ACA, Executive Director. Arif karimjee has served as chief financial officer of Sopheon since February 2000. Mr. karimjee was previously an auditor and consultant with Ernst & Young in London, Brussels and Reading, from August 1988 until joining Sopheon.
Stuart Silcock, FCA, Non-executive Director. Stuart Silcock has served as a director of Sopheon from its inception in 1993. Since 1982, Mr Silcock has been a principal partner of Lawford & Co, chartered accountants and until 2010 a director of Lawfords Ltd. also chartered accountants. Mr. Silcock was a non-executive director of Brown & Jackson plc. for four years from June 2001 to July 2005 and currently holds a number of other directorships in the United kingdom.
Bernard Al, Non-executive Director. Bernard Al was appointed as director of Sopheon in January 2001. he is a former chief executive officer of Wolters kluwer in the Netherlands and has a background in science and linguistics.
Daniel Metzger, Non-executive Director. Daniel Metzger was until 1998 an executive vice president of Lawson Software, a leading ERP provider, where he was responsible for corporate strategy and marketing. Since then he has held similar roles at Parametric Technologies, where he led the business strategy and marketing around collaborative product development technologies, and at nQuire Software, which was subsequently sold to Siebel.
D I R E C T O R S

Where innovation means business™