Embed Size (px)
Citation preview

DOE/SC-ARM-TR-154
Sonic Detection and Ranging (SODAR) Wind Profiler Instrument Handbook
May 2020
P Muradyan R Coulter

DISCLAIMER
This report was prepared as an account of work sponsored by the U.S. Government. Neither the United States nor any agency thereof, nor any of their employees, makes any warranty, express or implied, or assumes any legal liability or responsibility for the accuracy, completeness, or usefulness of any information, apparatus, product, or process disclosed, or represents that its use would not infringe privately owned rights. Reference herein to any specific commercial product, process, or service by trade name, trademark, manufacturer, or otherwise, does not necessarily constitute or imply its endorsement, recommendation, or favoring by the U.S. Government or any agency thereof. The views and opinions of authors expressed herein do not necessarily state or reflect those of the U.S. Government or any agency thereof.

DOE/SC-ARM-TR-154
Sonic Detection and Ranging (SODAR) Wind Profiler Instrument Handbook P Muradyan R Coulter Both at Argonne National Laboratory May 2020 Work supported by the U.S. Department of Energy, Office of Science, Office of Biological and Environmental Research

P Muradyan and R Coulter, May 2020, DOE/SC-ARM-TR-154
iii
Acronyms and Abbreviations
AMF ARM Mobile Facility ARM Atmospheric Radiation Measurement ATP Acceptance Test Plan BBBS balloon-borne sounding system DQO Data Quality Office FFT fast Fourier transform LST local standard time NCAR National Center for Atmospheric Research netCDF Network Common Data Form NOAA National Oceanic and Atmospheric Administration QC quality control QME quality measurement experiment SNR signal-to-noise ratio SODAR Sonic Detection and Ranging VAP value-added product

P Muradyan and R Coulter, May 2020, DOE/SC-ARM-TR-154
iv
Contents
Acronyms and Abbreviations ...................................................................................................................... iii 1.0 General Overview ................................................................................................................................. 1 2.0 Contacts ................................................................................................................................................ 1
2.1 Mentors ........................................................................................................................................ 1 2.2 Vendor/Instrument Developer ...................................................................................................... 1
3.0 Deployment Locations and History ...................................................................................................... 1 4.0 Near-Real-Time Data Plots .................................................................................................................. 2 5.0 Data Description and Examples ........................................................................................................... 2
5.1 Wind Profile Data......................................................................................................................... 2 5.2 Data File Contents ........................................................................................................................ 4
5.2.1 Primary Variables and Expected Uncertainty ................................................................... 5 5.2.2 Definition of Uncertainty .................................................................................................. 5 5.2.3 Data Quality Flags ............................................................................................................. 5
5.3 Frequently Asked Questions ........................................................................................................ 6 6.0 Data Quality .......................................................................................................................................... 6
6.1 Data Quality Health and Status .................................................................................................... 6 6.2 Data Reviews by Instrument Mentor............................................................................................ 7 6.3 Data Assessments by Site Scientist/DQO .................................................................................... 7 6.4 Value-Added Products and Quality Measurement Experiments .................................................. 7
7.0 Instrument Details................................................................................................................................. 8 7.1 Detailed Description ..................................................................................................................... 8
7.1.1 List of Components ........................................................................................................... 8 7.1.2 System Configuration and Measurement Methods ........................................................... 8 7.1.3 Specifications .................................................................................................................... 9
7.2 Operation and Maintenance ......................................................................................................... 9 7.2.1 User Manual ...................................................................................................................... 9 7.2.2 Routine and Corrective Maintenance Documentation ...................................................... 9 7.2.3 Additional Documentation ................................................................................................ 9
7.3 Glossary ...................................................................................................................................... 12 7.4 Acronyms ................................................................................................................................... 12 7.5 Citable References...................................................................................................................... 13
P Muradyan and R Coulter, May 2020, DOE/SC-ARM-TR-154
v
Figures
1 The time-averaged profiles consist of values calculated over a user-defined period (usually 1 hour for ARM data). ............................................................................................................................... 3
2 A 24-hour period of SODAR wind measurements. ................................................................................ 4 3 Note that the data around 2200 hours local standard time (LST) is obviously strongly affected by
the precipitation (the region of red and magenta extending to all heights between 17 and 10 hours before 18 LST) observed in the SNR profile. ......................................................................................... 6
Tables
1 SODAR deployment history as part of the AMF1 instrumentation suite. .............................................. 2

P Muradyan and R Coulter, May 2020, DOE/SC-ARM-TR-154
1
1.0 General Overview The SODAR (Sonic Detection and Ranging) wind profiler measures wind profiles and backscattered signal strength between (nominally) 15 m and 500 m. It operates by transmitting acoustic energy into the atmosphere and measuring the strength and frequency of backscattered energy. The strength of the backscattered signal is determined by the strength of temperature inhomogeneities with size on the order of 10 cm. Assuming the scattering elements in the atmosphere are moving with the mean wind, the horizontal wind field can be derived. The U.S. Department of Energy Atmospheric Radiation Measurement (ARM) user facility Mobile Facility (AMF) has a SODAR system developed by Scintec, Inc. that transmits a sequence of frequencies to enhance signal determination.
2.0 Contacts
2.1 Mentors
Paytsar Muradyan Environmental Science Division Argonne National Laboratory Phone: (630) 252-1657 Email: [email protected] Richard Coulter Environmental Science Division Argonne National Laboratory Phone: (630) 252-5833 Email: [email protected]
2.2 Vendor/Instrument Developer
Scintec Corporation 197 South 104th Street Louisville, Colorado 80027 Phone: 303-666-7000 Fax: 303-666-8803
3.0 Deployment Locations and History AMF1 deployment history is summarized in Table 1.

P Muradyan and R Coulter, May 2020, DOE/SC-ARM-TR-154
2
Table 1. SODAR deployment history as part of the AMF1 instrumentation suite.
Site ID Location Start Date (MM/DD/YYYY) End Date (MM/DD/YYYY)
PVC Cape Cod, Massachusetts, USA 06/15/2012 06/30/2013
MAO Manacapuru, Amazonas, Brazil 01/01/2014 12/31/2015
ASI Ascension Island, South Atlantic Ocean
04/23/2016 11/01/2017
COR Cordoba, Argentina 09/23/2018 04/30/2019
ANX Andenes, Norway 11/30/2019 05/31/2020
4.0 Near-Real-Time Data Plots Data collected by the SODAR can be viewed in near-real time through the Data Quality Office’s (DQO) Quick Plot Browser.
5.0 Data Description and Examples
5.1 Wind Profile Data
The data produced by this instrument come in two forms: raw spectra and time-averaged profiles, similar to the data produced by the radar wind profiler.
The spectra are the most basic form of data produced by the present version of this instrument. The spectra display the energy content of the scattered signal over the range of Doppler shifts observed from each of pointing directions and in the power level of the wind profiler. There is a single spectrum for each range gate, pointing direction, and power level. The spectrum represents an average of several (e.g., 60) individual spectra obtained over several seconds (e.g., 30).
The time-averaged profiles are calculated from the spectra using the following variables.
• Mean Doppler shift: The first moment of the spectrum, fD, calculated roughly as:
𝑓𝑓𝐷𝐷 = �𝑓𝑓𝑖𝑖𝑆𝑆(𝑓𝑓𝑖𝑖)𝑓𝑓2
𝑖𝑖=𝑓𝑓1
� 𝑆𝑆(𝑓𝑓𝑖𝑖)𝑓𝑓2
𝑖𝑖=𝑓𝑓1
�
(1)
where S(f) is the power at frequency f and f1 and f2 are the maximum and minimum frequencies, chosen about a mid-point frequency associated with the maximum signal power level.
• Doppler width: The width of the spectrum, VD, calculated as:
P Muradyan and R Coulter, May 2020, DOE/SC-ARM-TR-154
3
𝑉𝑉𝐷𝐷 = 2��((𝑓𝑓𝑖𝑖 − 𝑓𝑓𝐷𝐷)2 𝑆𝑆(𝑓𝑓𝑖𝑖))𝑓𝑓2
𝑖𝑖=𝑓𝑓1
� 𝑆𝑆(𝑓𝑓𝑖𝑖)𝑓𝑓2
𝑖𝑖=𝑓𝑓1
�
(2)
• Noise level: This value is derived from the remaining portion of the spectrum, based on the assumption of a Gaussian noise spectrum, such that the variance of the spectral points is equal to the square of their mean value divided by the number of spectral averages. Using this fact, the signal region is separated from the noise region and helps to define f1 and f2 above.
• Signal-to-noise ratio (SNR): This value is calculated from the ratio of S(f) to the noise level determined above.
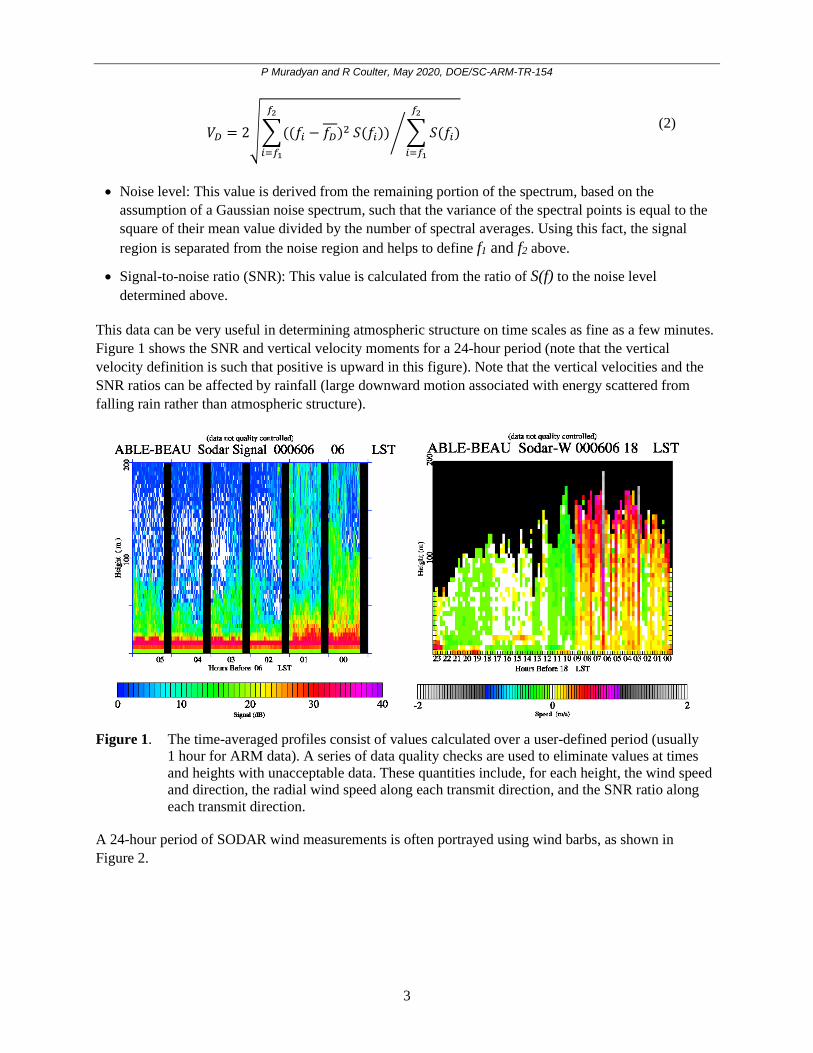
This data can be very useful in determining atmospheric structure on time scales as fine as a few minutes. Figure 1 shows the SNR and vertical velocity moments for a 24-hour period (note that the vertical velocity definition is such that positive is upward in this figure). Note that the vertical velocities and the SNR ratios can be affected by rainfall (large downward motion associated with energy scattered from falling rain rather than atmospheric structure).
Figure 1. The time-averaged profiles consist of values calculated over a user-defined period (usually
1 hour for ARM data). A series of data quality checks are used to eliminate values at times and heights with unacceptable data. These quantities include, for each height, the wind speed and direction, the radial wind speed along each transmit direction, and the SNR ratio along each transmit direction.
A 24-hour period of SODAR wind measurements is often portrayed using wind barbs, as shown in Figure 2.

P Muradyan and R Coulter, May 2020, DOE/SC-ARM-TR-154
4
Figure 2. A 24-hour period of SODAR wind measurements.
5.2 Data File Contents
• Spectral Data
– At each height, beam pointing direction, and power level:
○ Spectral amplitude (at each bin of fast Fourier transform [FFT])
• Average Data
– At each power level
○ At each height:
• Wind speed (m/s)
• Wind direction (degrees relative to true north)
• Vertical wind speed (m/s; positive = upward)
• Vertical wind standard deviation (m/s)
• Average backscatter strength (unitless)
Additional information may be found in the netCDF file header descriptions for SODAR data ordered from the ARM Data Center.

P Muradyan and R Coulter, May 2020, DOE/SC-ARM-TR-154
5
5.2.1 Primary Variables and Expected Uncertainty
The primary quantities measured with the SODAR system are the intensity and Doppler frequency of backscattered radiation. Wind speed is determined from the Doppler frequency of energy scattered from refractive index fluctuations (caused primarily by moisture fluctuations but also, to a lesser extent, by temperature fluctuations) embedded within the atmosphere.
5.2.2 Definition of Uncertainty
The primary observed quantities are Doppler frequency and signal amplitude. Note that the observed quantities above are not the principal measurements of interest to most climate researchers. The derived quantities of most interest to climatologists are the wind speed, wind direction, and the vertical wind speed as a function of height. The accuracies of these quantities, while dependent upon the accuracy of the frequency measurement, are also affected by atmospheric effects and vary considerably according to conditions. The wind speed is derived from measurements from, normally, five SODAR beams. Because the individual components are not collocated in space, horizontal homogeneity is assumed to derive the wind vector at a single height. Furthermore, the data are sampled at equal time intervals along each transmit direction. Thus, the vertical beam is sampled at larger height intervals than are the tilted beams by 1/(sin[elevation angle]). This difference is approximately 3%, which can be significant at large ranges. For example, at a nominal height of 1000 m (tilted beams), the vertical beam information is derived from 1035 m, which could be a significant difference in some situations.
• Nominal accuracy for wind speed: 0.5 m/s
• Nominal accuracy for radial wind components along the pointing direction of the transmitter (e.g., vertical velocity): 0.3 m/s
• Nominal accuracy for wind direction: 3°
The figures above are the result of more than one year of daily and multi-daily comparisons with winds derived from multiple sources at numerous field studies.
5.2.3 Data Quality Flags
No flags are applied during data ingest of the averaged winds. However, the data are examined regularly by the instrument mentor for quality assurance. The primary situations that can create seemingly good, but actually erroneous, data include:
• Precipitation: Both rain and snow are excellent sources of scatter of electromagnetic radiation; thus, they have the potential to considerably increase the effective range for useful data. However, precipitation generally possesses a heterogeneous spatial distribution on the scale of the separation of the transmitted beams that can lead to significant errors in estimates of the true wind speed. Rainfall is more amenable to objective analysis detection because it usually has a large downward velocity in comparison to atmospheric motion. Snow, on the other hand, has quite small terminal velocities. Figure 3 shows these effects.

P Muradyan and R Coulter, May 2020, DOE/SC-ARM-TR-154
6
Figure 3. Note that the data around 2200 hours local standard time (LST) is obviously strongly affected
by the precipitation (the region of red and magenta extending to all heights between 17 and 10 hours before 18 LST) observed in the SNR profile. However, the precipitation around 0600 and 1000 hours is largely discarded by the quality control requirements and the precipitation around 1600 hours has no obvious detrimental effect on the calculated wind profile.
5.3 Frequently Asked Questions
Why don’t the SODAR values of winds and/or temperature agree with values from the balloon-borne sounding system (BBSS)?
• The SODAR provides values averaged over (nominally) 1 hour, while the BBSS obtains only a grab sample at one instant in time at each height.
• The balloon from the BBSS travels with the mean wind. Hence, it is not collocated with measurements from the SODAR.
• The SODAR values are volume averages over (nominally) 10-20 meters in height by 9 degrees horizontally.
6.0 Data Quality
6.1 Data Quality Health and Status
The Data Quality Office website has links to several tools for inspecting and assessing radar wind profiler data quality:
• DQ Explorer

P Muradyan and R Coulter, May 2020, DOE/SC-ARM-TR-154
7
• DQ Plot Browser
• NCVweb: Interactive web-based tool for viewing ARM data.
The tables and graphs shown contain the techniques used by ARM data quality analysts, instrument mentors, and site scientists to monitor and diagnose data quality.
6.2 Data Reviews by Instrument Mentor
• Quality control (QC) frequency: Daily • QC delay: Instantaneous; daily • QC type: Min/max flags, graphical plots, intercomparisons • Inputs: Raw data • Outputs: Summary reports
Data QC procedures for this system include:
• Daily inspection:
Vertical time sections of hourly averaged wind and temperature over a 24-hour period are inspected on a daily basis for system and operation consistency.
6.3 Data Assessments by Site Scientist/DQO
All DQO and most site scientist techniques for data assessment have been incorporated within DQ Explorer.
6.4 Value-Added Products and Quality Measurement Experiments
Many of the scientific needs of the ARM user facility are met through the analysis and processing of existing data products into value-added products or VAPs. Despite extensive instrumentation deployed at the ARM observatories, there will always be quantities of interest that are either impractical or impossible to measure directly or routinely. Physical models using ARM instrument data as inputs are implemented as VAPs and can help fill some of the unmet measurement needs of the facility. Conversely, ARM produces some VAPs, not to fill unmet measurement needs, but to improve the quality of existing measurements. In addition, when more than one measurement is available, ARM also produces “best estimate” VAPs. A special class of VAP, called a quality measurement experiment (QME), does not output geophysical parameters of scientific interest. Rather, a QME adds value to the input datastreams by providing for continuous assessment of the quality of the input data based on internal consistency checks, comparisons between independent similar measurements, or comparisons between measurement with modeled results, etc. For more information see:
• VAPs and QMEs
• Site-wide advective tendencies
• Site-wide divergence calculation.
P Muradyan and R Coulter, May 2020, DOE/SC-ARM-TR-154
8
7.0 Instrument Details
7.1 Detailed Description
7.1.1 List of Components
The SODAR wind profiler is manufactured by Scintec, Inc. It consists of a single-phased antenna array. The antenna is approximately 1.5 m square and is oriented in a horizontal plane so the “in-phase” beam travels vertically.
7.1.2 System Configuration and Measurement Methods
The SODAR operates by transmitting in two different vertical planes and receiving backscattered energy from refractive index fluctuations that are moving with the mean wind. By sampling in the vertical direction and in two tilted planes, the three components of motion can be determined. The system consists of a single-phased array antenna that transmits alternately along five pointing directions: one vertical, two in the north-south vertical plane (one south of vertical, one north of vertical), and two in the east-west vertical plane (one east of vertical, one west of vertical). The non-vertical beams are tilted at about 14 degrees from vertical.
Radial components of motion along each pointing direction are determined sequentially. It takes, nominally, 30−45 seconds (dwell time) to determine the radial components from a single pointing direction. Thus, at the AMF site the system cycles through five beams (south, north, east, west, and vertical) at multiple pulse lengths and frequencies. Then the whole process is repeated. About five minutes elapse before the system returns to the beginning of its sequence. Within an averaging interval, the estimates from each beam-power combination are saved (11−12 in a 1−hour period); these values are examined and compared at the end of the period to determine the averaged radial components of motion.
During a single time period while the system operates in a single pointing direction (dwell time), the data that is produced in the “.a1” and “.a0” files is created. The system transmits pulses at about 1−10 Hz rate into the atmosphere. The backscatter from each transmit pulse is sampled at, for example, a 1 kHz rate. This results in 64 samples every 20 m in range. An FFT is performed (one for each range gate) over each set of 64 samples. This process takes on the order of 1 second. A number (about 30) of these spectra are then averaged together during the dwell time. At the end of the dwell time a single averaged spectrum is produced from each range gate along the designated pointing direction. The spectra themselves are placed in the “.a0” data files.
The spectra are analyzed by the system before moving to the next pointing direction. This analysis produces estimates of the SNR, the noise, the mean velocity (proportional to frequency), and the first moment (spectral width) at each range gate. This is the information that is stored in the “.a1” data files. Both the “.a1” and “.a0” data files thus have information at about <dwell time> intervals; however, the data sequences among pointing directions and output powers.
P Muradyan and R Coulter, May 2020, DOE/SC-ARM-TR-154
9
7.1.3 Specifications
• Frequency: 2000−4500 Hz • Maximum range: 500 m • Range gate: 20−50 m • Pulse length: 20−50 m • # Spectra/ave spectrum: 1−100
7.2 Operation and Maintenance
7.2.1 User Manual
A user manual is available to the mentor for the SODAR, with one copy kept at the AMF.
7.2.2 Routine and Corrective Maintenance Documentation
Routine preventive maintenance procedures (weekly, monthly, yearly) as well as a corrective maintenance procedure are designed by the mentor for the site operators to perform. These include factory-recommended procedures (preventive and corrective) for inspecting the antenna, clutter screen, cables and electronics. ARM operations maintain the corrective maintenance records in an online database.
7.2.3 Additional Documentation
Calibrations and Related Performance Checks
1. What are the factory-recommended calibration procedures?
The only true calibration procedures are carried out during the Acceptance Test Plan (ATP) that is performed immediately before the instruments are put into service. These are/were carried out by Scintec personnel. They include:
a. Output power
b. Center frequency
c. Dynamic range: A signal generator with variable attenuator is used as input to the system to establish a dynamic range of at least 55 dB.
d. System sensitivity: Signal generator is used to establish a minimum detectable level of at least -127 dBm.
2. What are the factory-recommended performance checks?
As detailed in the ATP, these include visual inspection, system power, timing, data transfer, and antenna integrity. Additional performance checks are detailed on page 100 of the system manual supplied by Scintec and include:
a. Control lights
b. Date and time accuracy
P Muradyan and R Coulter, May 2020, DOE/SC-ARM-TR-154
10
c. Data display operating
d. Appropriate antenna rotation
e. Data appearance
f. SNR levels (should be unchanged).
3. What are the mentor calibration procedures? There are none other than comparison of data with other available sources of data. This, however, is more of a QC check.
4. What are the mentor performance checks? These include:
a. Regular noise level checks
b. Regular final amplifier current checks
c. Daily data existence
d. Vertical time sections of winds and temperatures
e. Continuous (daily) maximum-height-attained monitoring
5. How are calibration and related performance checks documented?
a. Where are procedures documented?
ATP, system Operator’s Manual supplied by Scintec, Operators manual specific to the SODAR supplied by the instrument mentor.
b. Have major changes to calibration procedures occurred? NO
c. Are major changes to calibration procedures expected to occur? NO
6. How are the calibration and check procedures initiated (queued)?
a. ___Work Order: When data existence fails, or other problem is identified by the mentor
b. ___Data Inspection: Daily (data existence, maximum height, and comparison with BBSS) and weekly (vertical time sections of wind vectors and virtual temperature contours)
c. ___Instrument Failure: Site Operators checks daily for operation, monthly for physical level and pointing direction, output levels
7. How long does it take to perform calibration and performance check procedures? (List separately.)
a. Basic factory calibration: 1−2 days
b. System operating: 30 minutes/day
c. Data existence and daily checks: 30 minutes/day
d. Data quality: 2 hours/5 days
8. Are any data affected or lost during calibration or performance check procedures?
a. Basic factory calibration: All data lost
b. System operating: None

P Muradyan and R Coulter, May 2020, DOE/SC-ARM-TR-154
11
c. Data existence and daily checks: None
d. Data quality: None
9. What are corrective procedures when calibrations and or performance checks fall behind schedule? None
Maintenance Procedures
1. What are the factory-recommended maintenance procedures: (preventive and corrective)?
a. Clean air filters
b. Remove dust
c. Check cables
d. Inspect antenna, fences, exterior cables, clutter screens, guys, anchors.
2. What are the mentor preventive and corrective maintenance procedures?
a. Regular noise level checks
b. Regular final amplifier current checks
c. Daily data existence
d. Vertical time sections of winds and temperatures
e. Continuous (daily) maximum-height-attained monitoring.
3. How are maintenance procedures documented?
a. Where are procedures documented?
System Operators Manual (pp. 97−100) Operators Manual (p. 7) Site Ops log at site data system.
b. Have major changes to maintenance procedures occurred? NO
c. Are major changes to maintenance procedures expected to occur? NO
4. What is the procedure schedule?
a. Daily: Check operation, verify data existence
b. Weekly: Check data quality
c. Monthly: Check system alignment, cables, output levels, antenna switching
d. Yearly: Repeat ATP
How are the procedures initiated (queued)?
a. ___Scheduled Calendar Event: Automatic change of parameter files for temps
b. ___Work Order: Data nonexistence or apparent malfunction determined by mentor
c. _X_Data Inspection: Regular and automatic procedure of mentor
d. ___Instrument Failure:

P Muradyan and R Coulter, May 2020, DOE/SC-ARM-TR-154
12
e. _X_Other: Site Ops standing operation: daily check of operation, monthly checks of hardware
5. How long does it take to perform maintenance procedure?
a. System operating: 30 minutes/day
b. Data existence and daily checks: 30 minutes/day
c. Data quality: 2 hours/5 days
6. Are any data affected or lost during maintenance procedure? No
7. How are potential effects to data documented? Data Quality Reports
8. What are corrective procedures when maintenance falls behind schedule? None
9. Where is actual maintenance work documented?
a. Site Operators’ corrective maintenance report
b. Instrument mentor’s personal log.
Data Integrity and Quality Inspections
1. What nodes or activities along the data pipeline affect (or can potentially affect) the data stream?
a. ___Controller boxes
b. ___Microprocessors
c. ___Data logger
d. _X_Communication lines/links
e. ___Calibration data files
f. _X_ingest modules
2. Does storage media exist on the instrument system to back up data and store it for delayed data ingest? Please identify media and the maximum period of time that the data can be backed up on the media.
Yes: The hard disk can hold spectra and average files for approximately 365 days.
7.3 Glossary
See the ARM Glossary.
7.4 Acronyms
See the ARM Acronyms.
P Muradyan and R Coulter, May 2020, DOE/SC-ARM-TR-154
13
7.5 Citable References
Symposium on Lower Tropospheric Profiling: Needs and Technologies, Boulder, Colorado 10−13 September 1991. Sponsored by National Oceanic and Atmospheric Administration (NOAA) and National Center for Atmospheric Research (NCAR).
Third International Symposium on Tropospheric Profiling: Needs and Technologies, Max-Planck-Gesellschaft zur Forderung der Wissenschaften, Hamburg, Germany, 30 August−2 September 1994. Sponsored by NOAA/NCAR.