Embed Size (px)
Citation preview
Sonar for environmental monitoring: Configuration of a
multifunctional active acoustics platform applied for marine
renewables
Francisco Francisco1*, Jan Sundberg1
1 Division of Electricity, Uppsala University, Box 534, 751 21 Uppsala – Sweden
* [email protected]; Tel.: +46-184-715-909
Abstract: Marine renewable energy is emerging as one of the fast-growing industry in the last
decades, as modern society pushes for technologies that can convert energy contained from winds,
waves, tides and stream flows. The implementation of renewable energy technologies impose high
demands on both structural and environmental engineering, as the energy converters have to work
under extreme conditions where parameters such as sea-bottom configuration, water transparency
and depth, sea-states and prevailing winds are harsh. Constant monitoring of the marine
environment is crucial in order to keep this sector reliable. Active acoustics is becoming a standard
tool to collect multi-dimensional data from physical, geological and biological properties of the
marine environment. The Div. of Electricity of Uppsala University have been developing an
environmental monitoring platform based on sonar (Sound Navigation And Raging) systems. This
platform aims to monitor the installation, operation and decommissioning of marine renewable
energy converters. The focus will be given the observations of behaviours of marine animals in
vicinity of energy converters but also structural inspection and monitoring of MRETs. This paper
describes how this multifunctional environmental monitoring platform come to existence from the
design to the deployment phase.
Keywords: Active acoustics; Multibeam Sonar; Dual-beam Sonar; Split-beam Sonar, Environmental
monitoring; Offshore renewable energy.
1. Introduction
The global growth is pushing energy technologies to new frontiers. Both renewable and non-
renewable energy sectors are increasingly exploring resources within the marine environment.
Explorations in marine environments take place where the physical conditions may harsh.
Challenging sea-bottom configurations, deep and murky waters, high seas and strong winds are the
common conditions that offshore industry faces today. Environmental data is crucial when planning
and executing marine exploration, and the use of integrated monitoring platforms is becoming
standard procedures in pre and post construction. However, the increase in industrial marine
exploration brings the need to adopt alternative methods and tools that can provide better
environmental data. Today, active acoustics are an essential tool used to gather data of physical,
geological and biological properties of the marine environment. Such systems together with passive
acoustic instruments can provide a multi-dimensional information on the marine environment
surrounding marine renewable energy technologies (MRETs) and other submerged structures. This
served as a motivation to this work, to develop platforms specially based on acoustics that are attuned
to monitor MRETs during the entire project life cycle.
In nature, the propagation of acoustic energy (sound) is used by marine animals to communicate,
navigate and find food [1-2]. Sound is also used by humans as one of the most advanced mean of
underwater remote sensing and subsea operations such as search and rescue, hydrocarbon
exploration, harbours security, structures and diver inspections, operational oceanography and
geophysics, military, among others. Within the marine renewable energy sector, active acoustics
systems may become a key method to monitor MRETs, especially in murky and deep waters where
divers and conventional methods are risky thus expensive. The use of imaging sonar systems with
higher operating frequency and resolution enables engineers and scientists to gather detailed
Preprints (www.preprints.org) | NOT PEER-REVIEWED | Posted: 10 December 2018
© 2018 by the author(s). Distributed under a Creative Commons CC BY license.
Preprints (www.preprints.org) | NOT PEER-REVIEWED | Posted: 10 December 2018 doi:10.20944/preprints201611.0064.v3
© 2018 by the author(s). Distributed under a Creative Commons CC BY license.

2 of 19
2 of 19
information of the underwater marine environment in a similar perspective as is provided by optical
and electromagnetic monitoring devices such as cameras and RADARs (RAdio Detection And
Ranging) [1-2]. Such devices are able to provide both backscatter (acoustic) images as well as
bathymetric maps of the surveyed area.
Sonar (Sound Navigation And Raging) is an echo-ranging technology that uses acoustic energy
to locate and survey objects within a water column [3,4]. Sonar systems are divided in passive or
active types. The passive sonar listen for incoming sounds emitted from any specific object or
background. Active sonar emits pulses of sound and listens for echoes. The basic elements of a sonar
are a transducer, a multichannel receivers, and a display. A transducer converts over a controlled
condition an electrical energy into acoustic energy propagating through the water and vice versa [3,5].
A set of multichannel receiver and a computer controls the excitation of the transducer and reception
of echoes, the amplifications, the data processing, and the display unit. The display unit deliver an
echogram for an echo sounder, or an echo-image (acoustic image) for a high-frequency imaging
sonar. A typical echogram consists of a series of echo records in which each record represents the real
time receiver output signal, visual encoded by intensity or colour [6-8]. Echo-images consist of several
echo records resulting from multiple beams that are spatially distinct, and the echo magnitude on
each beam is generally encoded by intensity or colour as in an echogram [3].
Sonar systems such as a multibeam (MBS), dual-beam (DBS), split-beam (SBS) among other
categories, can provide quantitative information such as size, position, velocity and composition of
targets within the water column. Putting together in a common platform, a MBS, DBS, and SBS can
provide high-resolution environmental data of the space within hydrokinetic sites. Given the huge
potential and energy density contained in marine renewable energy sources, MRETs in near future
may compete with conventional energy systems without causing colossal damages to the
environment [9]. Yet, there are environmental concerns arising from the potential hazard to marine
organisms, which wave energy converter (WECs) and tidal energy converters (TECs) may cause [10-
11]. The use of acoustic instruments for marine remote sensing of hydrokinetic sites is already in use
by few entities within the marine renewable energy sector. E.g. [11,12] used sonar systems to monitor
fish and mammal interaction with tidal turbines and wave energy converters; [11-13] used multi-
beam sonar systems to map seabed within hydrokinetic sites. The FORCE project in the Bay of Fundy
is a good example for highlighting the relevance of using active acoustics for environmental
assessments surveys and continuous monitoring of hydrokinetics sites. In the FORCE project, the test
site was monitored using multibeam sonar, side scan sonar, and deep-towed seismic systems, among
other acoustic water column and seabed profilers [13]. The European Marine Energy Centre LTD
(EMEC) has recently deployed its own integrated monitoring platform (IMP). This platform is on the
seabed and is linked to land via a submarine cable [14] (Trialling Methods for Tracking the Fine Scale
Underwater Movements of Marine Mammals in Areas of Marine Renewable Energy Development Scottish
Marine and Freshwater Science Vol 7 No 14). Apart from these deployed projects, there is the FLOw,
Water column and Benthic ECology 4-D (FLOWBEC-4D), which is an upward looking sonar platform
designed to monitor marine animals within a designated water column [12]. It is self-contained,
portable but with a very limited survey span.
The Div. of Electricity, Uppsala University, is developing a multifunctional environmental
monitoring platform, the UU Environmental monitoring platform (UU platform), illustrated in
Figure 1. This platform is both a seabed lander (Figure 1) as well as suitable for pole-mounting on
boats. So far, this includes an autonomous system comprising MBS, SBS, DBS, and optical camera
systems. The UU platform complements other environmental studies, which used other monitoring
methods such as hydrophones, underwater cameras (e.g. [3]), and quantitative sampling (e.g. [4]).
The vision is to minimize the risks associated with subsea work by means of monitoring the
installation, operation and maintenance of MRETs. The UU platform aims to monitor marine
organisms (with focus on mammals), inspect MRETs and other underwater structures, and perform
seabed inspection among other water column measurements. This paper, describes the building
Preprints (www.preprints.org) | NOT PEER-REVIEWED | Posted: 10 December 2018 Preprints (www.preprints.org) | NOT PEER-REVIEWED | Posted: 10 December 2018 doi:10.20944/preprints201611.0064.v3

3 of 19
3 of 19
process of the UU environmental monitoring platform.
Figure 1. Illustration of the proposed environmental monitoring platform applied for marine
renewable energy technologies. It comprises a tripod anchored to the seabed near an ORET. A
submerged damping buoy is connected to a communication buoy. The DBS may be point
1.2. Overview of sonar technology in use on UU monitoring platform
Sound is an important guiding sense for marine animals such as dolphins, whales, seals, and fish [1-
4, 15]. Depending on the species, marine animals have a broad band of frequencies that cover
frequencies from 0.01 to 200 kHz [1-4, 15]. Therefore, anthropogenic noise with broadband frequencies
from 0.01 kHz up to above 2 GHz may disturb the marine environment. Some of the animals change
their behaviour when the sonar is active, mostly in a way of leaving the surroundings (e.g. [16]).
Death and injury of marine animals can also occurs during military exercises where powerful sonar
systems are deployed. Nevertheless, there are evidences such as [17], that even when sonar systems
are set to operate at higher frequencies, there are leaks of acoustic [17] waves emitted in lower
frequencies. For example [18] investigate three different sonar systems with operating frequencies of
200, 210 and 260 kHz, and found out that all the three sonar emitted secondary peak with frequencies
of 90, 105 and 130 kHz respectively, with considerable source levels that stood above the ambient
noise but below those that can cause physical harm [18]. Thus the UU monitoring platform, uses
sonar systems operating in frequencies above 200 kHz at source level below 100 dB re 1 µPa at 1 m,
making the sonar surveys little harmful to the majority of marine life.
1.2.1 The Multibeam sonar system (MBS)
Camera
ADCP
TRIPOD
Multibeam Sonar
Split-beam Sonar
WEC
15 m
10 m
GSM Modem; Router; Battery packCOMMUNICATION BUOY
Hydrophone
Preprints (www.preprints.org) | NOT PEER-REVIEWED | Posted: 10 December 2018 Preprints (www.preprints.org) | NOT PEER-REVIEWED | Posted: 10 December 2018 doi:10.20944/preprints201611.0064.v3
4 of 19
4 of 19
In a MBS, acoustic energy is emitted and received in multiple angles across-track swath, typically in
a fan shape [16, 19]. Transmitting and receiving elements are arranged in a 2-dimensiconal array.
Generally, each element transmits pulses (signals) individually in a crescent order, and the echo is
received simultaneously by all receivers. However, each echo is processed separately enabling a
number of echo-beams to be formed by combining the outputs of the several arrays of transducing
elements with different phasing functions. This setup effectively steers the beam in several directions
at the same time. Furthermore, these elements are arranged in a spiral configuration so that the beam
pattern fill the field of view (FOV). Higher resolutions are even higher when the beams are aligned
side by side in the same plane [19]. The number of beams can reach up to 1500 unities in angular
sectors up to 180 of FOV. Modern MBS systems can operate in frequencies up to 3 MHz obtaining
range resolution up to 1 cm and angular resolution of about 0.2. The use of several narrow beams
with a minimized transmit pulse (beam spacing) maximizes the effective sampling volume covered
in the entire swath in a single ping.
The limitation of multibeam imaging sonar systems are mainly the range which due to high operating
frequency, is limited to less than 100 m to no more than 10 m when the operating frequency is order
of MHz. Noise is other big disadvantage of MBS systems. Background noise generated by seabed
echoes affects the signal, mainly when the target is located at longer distance than the bottom depth
[20-21]. Bubbles within the swath causes intense noise, mainly in sonar systems operating with very
high frequencies. Data processing of a MBS sonar is complex and time consuming. Constant
correction on pitch and roll are required, and MBS systems generates large volume of data.
1.2.2 The Dual beam sonar system (DBS)
In DSBs, the transducer is composed by two arrays of single frequencies elements, narrow and wide
beam receivers. This configuration allows all the transducer elements to act equally in transmission
producing a single narrower beam. However, the echo is received simultaneously by the two arrays
of narrow and wide beams. The resulting effect is a coaxial beam pattern featuring a core beam within
a relatively broad beam. The beam pattern can be pre-determinate by comparing the two output
signals if a single target is detected [22-23]. This procedure allows the direct measurement of
backscattering cross section by removing the beam pattern. DBS systems only make use of acoustic
intensity or amplitude, taking no account to the phase of the signal. Thus, among the three parameters
of the spherical coordinate system (r,θ,∅), it can only determine two [23,24]. Dual beam sonar systems
operates with frequencies up to 1 MHz, with a beam width up to 60.
1.2.3 The Split beam sonar system (SBS)
The transducer in a split-beam sonar is divided into four quadrants, which transmit acoustic waves
simultaneously, but receive the echoes independently, forming four beams arranged perpendicularly
two by two. SBS systems uses both amplitude and phase of the acoustic signal to determine the
accurate target position in a r,θ,∅ spherical coordinates taking advantage of the interferometer
technique that uses phase differences between adjacent quadrants [25]. This type of sonar can operate
in frequencies up to 1 MHz. In shallow waters, the sonar ping rate can be set very high to provide
multiple reflections from a single target in order to facilitate tracking. Each target detection passes
through a tracking-routine that combines successive pings in the same range cells into a track of the
target path through the beam of the sonar [25,17]. SBS systems are superior comparing to DBS
Preprints (www.preprints.org) | NOT PEER-REVIEWED | Posted: 10 December 2018 Preprints (www.preprints.org) | NOT PEER-REVIEWED | Posted: 10 December 2018 doi:10.20944/preprints201611.0064.v3
5 of 19
5 of 19
systems mainly due to superior SGN (signal to noise ratio) figures and accurate target location.
A summary of specific environmental detection objectives for each sensor is given in Table 1.
Table 1. Environmental detection objectives for each sensor
En
viro
nm
ental d
etection
ob
jective
MBS DBS SBS UWC
biomass - fish biomass - fish biomass - fish biomass - fish
marine mammals marine mammals marine mammals
suspended debris suspended debris
bubbles bubbles bubbles
benthic habitat benthic habitat benthic habitat
underwater structures underwater structures
depth measurements
2. Mechanical design and installation of UU monitoring platform
The platform may be divided into a submerged and a surface unity. The submerged unity includes a
tripod and the surface unity includes a communication buoy (Figure 2). A mooring wire links the
communication buoy on the water surface and a tripod anchored on seabed. The platform also
includes a portable mount system mostly used for surface surveys and calibration tests. This platform
was designed to operate manually, autonomously as well as remotely controlled.
2.1 The submerged unity
The submerged unity comprises a tripod made of aluminium and steel. This unity measures 1.7 m
high, 1.8 m wide, and have gross weight of 250 kg (Figure 2a). Devices so far allocated to the tripod
are one MBS, one DBS, one SBS, two underwater cameras (UWC), one on-board computer and battery
pack. The MBS is used to acquire acoustic images at range up to 100 m. The SBS and DBS are utilised
to detect and track targets at longer range and provide a tri-dimensional information of the target
position. The on-board computer is confined in the same waterproof box containing the batteries
which are attached to the tripod. This computer controls all the devices, stores the data and run the
control routines. The battery pack, housed in a waterproof box, comprises a set of four 130 Ah 12V
deep cycle batteries. These batteries are designed to supply power for the entire system for periods
up to 80h, following a power-efficient plan, and could be charged by a set of solar panels placed on
the communication buoy. Technical specifications of all devices allocated to the platform can be
found in Table 1.
2.2 Portable mount system
Portable mount system consist of a pole mount with an adjustable length of 1-5 m (Figure 2b). The
pole mount is a lightweight pole (approximately 3 kg) made of polyvinyl chloride reinforced with an
aluminium stripe that is attached to a thin baseplate. The thin baseplate supports the sampling
devices and act as a stabilizer. This portable munt system can be easily deployed from a surface
platform.
2.3 Communication buoy
The buoy measures approximately 1 m of diameter, 1.7 of height and weights approximately 500 kg
Preprints (www.preprints.org) | NOT PEER-REVIEWED | Posted: 10 December 2018 Preprints (www.preprints.org) | NOT PEER-REVIEWED | Posted: 10 December 2018 doi:10.20944/preprints201611.0064.v3

6 of 19
6 of 19
(Figure 2c). It will contain a set of solar panels, a modem, a router and a battery pack. This unit will
establish the remote connection between the tripod and the users. It comprises a set of solar panels,
a modem, a router and a battery pack. The buoy establish the remote connection between the tripod
and the users. Data stored on the computer located on the tripod, is transmitted to the buoy by wire,
and then uploaded to the users via wireless connection. Solar panels attached to the communication
buoy charges both set of batteries located on surface and batteries located on the tripod. The buoy
will use its own anchor and then linked to the submerged unity via umbilical cord.
Figure 2. Computer rendering of a UU environmental monitoring platform. (a) An actual and
redesigned concept of the submerged unit, aimed to save construction time and costs. (b) A portable
pole mount used for surface surveys; (c) A communication buoy.
Table 1. Technical specifications of the main sensors so far integrated to the UU platform
Component Specification Component Specification Computer
Clock: 1.0 GHz
RAM: 4GB DDR3
HDD: 2TB (storage memory)
VGA: FULL HD 3D
Input Voltage: 12 VDC
Battery bank 12 V, 7.8 kWh
Multibeam
imaging sonar
(MBS)
Frequency: 0.9 MHz (operational)
Number of Beams: 768
Refresh rate: up to 50 Hz
FOV: 130°x20° (field of view)
Resolution: 0.18° / 2.54 cm
Max. range: 100 m
Input Voltage: 12 – 48 VDC
Power consumption: 13 W
DBS Frequency: 50/200 KHz
No. Beams: 2
FOV: conic, 29°/12°
Maximum range: 762 m
Input Voltage: 10 – 19 VDC
SBS
Frequency: 200 KHz
No. Beams: 4
FOV: conic, 12°
Max. range: 550 m
Input Voltage: 12 – 48 VDC
UWC 1
FOV: Hemispherical, 180°
Sensitivity: 0,05 lux
Max. resolution: 2048x1536 (3MP)
Refresh rate: M-JPEVGA: 22 fps
Video stream: (MxPEG) 30 fps
UWC 2
Lense: 2.8 – 8 mm / F1.2
FOV: 92°-32°
Sensitivity: 0.04 lux
Max. resolution: 2592x1944 (5
MP)
Max. frame rate (M-JPEG): 30 fps
Video stream (MxPEG): H.264
UWC 3
Lense: 2.8 – 11 mm / F17.1
FOV: 170°
Sensitivity: 6 lux
Max. resolution: 3952x2224 (8.8 MP)
Max. frame rate H.264: 240 fps
Video stream MP4 / XAVC S H.264
a b c
Preprints (www.preprints.org) | NOT PEER-REVIEWED | Posted: 10 December 2018 Preprints (www.preprints.org) | NOT PEER-REVIEWED | Posted: 10 December 2018 doi:10.20944/preprints201611.0064.v3

7 of 19
7 of 19
2.4 System-integration plan
The platform can be electronically divided into three sections: the sensors, the power supply and the
communication unity (Figure 3). The sensors includes the already mentioned Multibeam sonar
(MBS), Split-beam sonar (SBD), Dual-beam sonar (DBS), optical cameras (UWC) and in near future a
hydrophone (HYD) to enhance the target classification mostly in the case of marine mammals. This
sensor section also includes a network switch, controllers and an on board computer (PC). The
controller works more as a power trigger which tells when each sensor should turn on/off. The power
supply section consist of a battery bank, DC-AV inverters, and chargers. Devices that run with 12V-
DC are directly connected to the battery bank, and the devices that need 110/220V-AC are connected
to the battery through the inverters. The power chargers recharges the Battery Bank-I belonging to
the submerged unity using power supplied by the Battery Bank-II located in the surface unity, or
using external AC power supply from a land cable. The communication section comprises a Router,
wideband GSM Antenna, a Battery Bank - II, a set of photovoltaic solar panels (PV), and a
multipurpose Plug. The Router and the Antenna serve to establish a link via a wireless high-speed
communication between the platform and the users remotely located. The Battery Bank - II serve to
supply power to the router and antenna, also to recharge the batteries located in the submerged unity.
The PVC recharge the Battery Bank - II. The multipurpose plug contains power and data connectors
that are meant to stablish a direct wire-link between the submerged unity and a user when
maintenance and is needed.
Figure 3. This diagram shows how the different sensors are linked to the power supply and
communication systems. The dashed line represents data link, the full line represents the power
supply.
3. The data acquisition tool
As aforementioned, an on-board computer controls all the devices allocated to the platform. Simple
logic protocols supervises measurements taken by each device. To save memory and power, the
sampling (measurements) occur in bursts. Each device samples in bursts of approximately 90-300 s,
with intervals of 1800-7200 s. The number of samples per burst varies according to the device. A set
of software is put together to process and analyse data. Data from each instrument is treated by its
own algorithm and routine. An example given by Figure 4 describes how the MBS and DBS data is
acquired processed and analysed [26, 27].
The MBS uses the BlueView sonar developing kit (SDK 3.6) and ProViwer4 software for data
MBS
DBS
SBS
UWC
SWITCH
Router
Computer
Instruments
Battery Bank-I
Inverter
Charger
Power supply
Router
Antenna
Battery Bank-II
PV
Plug
Communication
Timer
Preprints (www.preprints.org) | NOT PEER-REVIEWED | Posted: 10 December 2018 Preprints (www.preprints.org) | NOT PEER-REVIEWED | Posted: 10 December 2018 doi:10.20944/preprints201611.0064.v3

8 of 19
8 of 19
acquisition and processing. The data is acquired as a sequence of pings. Each ping comprises 768
beams that form an acoustic image. Each acoustic image contains information of backscatter intensity
of insonified targets, water depth and distance to target, geo and velocity data. The resulting acoustic
images will be analysed using Visual Studio and Matlab, through a routine described in the Figure
4b.
The DBS (and the SBS) provide pre-processed data of acoustic backscatter intensity in relation to
water depth and distance to target, in forms of echograms. Here the acoustic data has already time-
varied-gain (TVG) compensation. Each ping also provides geo and 2-D velocity information of the
targets, water and air temperature data. Echograms are further processed and analysed using Matlab
(Figure 4b). The remaining instruments such as UWC have a rather simple procedure to process and
analyse data.
(a)
(b)
Figure 4. Overview of the data acquisition and processing (DAQ) architecture for detecting, tracking
and classifying underwater targets of interest. The data is acquired by the sonar transducers, then
pre-processed by sonar software. Algorithms (in developing phase) decode and further filter the
acoustic signal. (a) The DBS data is relatively slow to process and analyse. It goes through three sets
of algorithms to come out with a raw echogram. Then the raw echogram is filtered by another set of
algorithms, and then georeferenced. (b) The MBS signal is quickly processed by the SDK/ProViwer
software running on C++ programming environment. The acoustic images are then analysed and
filtered using the same software previously mentioned, and using other image analysing tools such
as Matlab - Image processing Toolbox. [26]
DATA PROCESSING - MATLAB
ROUTINES
FILTERS: NOISE
REDUCTION, TARGET DETECTION
& CLASSIFICATION
FILTERED
ECHOGRAM
OUTPUT DATA
(ACOUSTIC
BACKSCATTER
INTENSITY)
DECODER
(SONAR
VIEWER)
DECODER
(MATLAB)
RAW DATA (AMPLITUDE
ECHOGAM)DBS
GEO DATA
DATA ANALYSIS: C++ & MATLAB
ROUTINES
FILTERS: NOISE REDUCTION, TARGET
TRACKING & CLASSIFICATION
FILTERED
ACOUSTIC
IMAGE
ACOUSTIC IMAGES
(~ 12 fps) /
(GEOREFERENCED)
RAW DATA
(MULTI VARIABLE)
(GEOREFERENCED)
DECODER
(SDK –
BLUEVIEW)
DECODER
(PROVIEWER4 –
BLUEVIEW)
RAW DATA – ACOUSTIC
IMAGES (768 CH TVG)MBS
Preprints (www.preprints.org) | NOT PEER-REVIEWED | Posted: 10 December 2018 Preprints (www.preprints.org) | NOT PEER-REVIEWED | Posted: 10 December 2018 doi:10.20944/preprints201611.0064.v3

9 of 19
9 of 19
4. Deployment strategies
Given the versatility of the monitoring platform, the entire system can be deployed in several
configurations in accordance with the objective of the survey and physical water conditions. For
surveys undertaken on board of a vessel with a down-looking setup the platform can be deployed
using a pole mount attached to a vessel (configuration-A). The same configuration can be achieved
by replacing a vessel by a fixed structure (configuration-B). For up-ward looking surveys, the
platform utilize the tripod that can be either deployed temporary using an umbilical cord from a
vessel (configuration-C) or from a fixed structure (configuration-D). For long-term surveys within
hydrokinetic sites (configuration-E), the platform is deployable in an up-ward looking configuration,
in which the tripod is anchored to the seabed and then linked to the surface buoy through an
umbilical cord and a safety line. This configuration enabling an autonomous operation. This is the
main idea of this project. The above-mentioned deployment strategies are illustrated in Figure 5.
Figure 5. Illustration of different deployment configurations. (a) Pole mount deployed from a vessel
(configuration-A). (b) Pole mount deployed from a fixed structure (configuration-B). (c) Tripod
deployed from a vessel (configuration-C). (d) Tripod deployed from fixed structure (configuration-
D). (e) Full deployment of the entire monitoring platform for long term surveys (configuration-E).
Ds
Vessel
GPSantenna
WL
MBS
DBS/SBS
Pole mount
MBS
DBS
Configuration-A
Ds
fixed structure
Pole mount
WL
Configuration-B
Ds
MBSSBS
Vessel
GPSantenna
Tripod
WL
Configuration-C
Ds
fixed structure
WL
Configuration-D
Communication buoy
Submerged Unity
WL
Configuration-E
Preprints (www.preprints.org) | NOT PEER-REVIEWED | Posted: 10 December 2018 Preprints (www.preprints.org) | NOT PEER-REVIEWED | Posted: 10 December 2018 doi:10.20944/preprints201611.0064.v3

10 of 19
10 of 19
5. The experimental setup
Surveys were conducted both from the surface using the pole mount system (configuration-A and B,
in Figure 5 and Figure7) and from the seabed (up-ward looking) for a long-term survey using
configuration-E. Real-conditions tests were conducted in three different sites that included small
harbours (docks), a hydrokinetic with one installed turbine and a WEC farm of about 10 devices. Site-
selection criteria included finding locations with distinct aquatic characteristics, these consisted of
marine, fluvial-quasi-static and fluvial-highly-dynamic aquatic environments. The marine aquatic
environment corresponds to the Lysekil Wave Power Project site (58º11.85N, 11º22.46E) where a
number of UU WECs have been deployed [29-31]. The fluvial-highly-dynamic aquatic environment
(hydrokinetic site) corresponds to the Söderfors Current Power test site (60°23.26 N, 17°14.90 E),
where a low-rotational speed vertical axis turbine is deployed. The fluvial-quasi-static aquatic
environment corresponds a dock area by the Flottsund Bridge (59.787434°N, 17.662059° E) located
over the section of Fyrisån River that passes through Uppsala. More information of about the Lysekil
Wave Power and Söderfors Project site can be found in [29–31].
There also was a need to address if the platform performance would be affected by bio-physical
conditions such as turbidity, suspended particles, turbulence, stratification among others water
properties. Hypothesis is that water properties vary in time depending on several environmental
factors, and this could affect the quality data acquired by sampling devices such as a MBS, SBS, DBS,
and UWC systems. Therefore, surveys were conducted in every season for a period of 18 months,
covering all variety of weather conditions. Specific and well known targets were sampled, for shape,
size and feature recognition. Sampled targets were the WECs, Söderfors turbine, and foundations
pillars of Flottsund Bridge, hull of mid-size recreational vessels, divers and wild fish (free and
trapped in test fishing nets). These are described in more details in [26,32].
For surface surveys, the outline-survey technique split in two stages was the most used (Fig 6). In the
first stage, the vessel quickly covered the overall site on widely spaced transects (scouting transects)
to detect and locate targets. The vessel travelled at a steady speed (
) of 9 kmh-1. In the second
stage, the vessel returned to each target locations, and performed an intensive and detailed survey at
steady speeds of approximately 6 kmh-1. The MBS and DBS systems were deployed in different drafts
(Ds) that varied from Ds = 0.1 m to Ds = 4.0 m (Fig 6). The MBS transducer head was deployed in
three adjustable pitch angles (MBS) in respect to the water level (WL), these were MBS = 0°, MBS = 45°
and MBS = 90° respectively. The DBS transducer head was always deployed with a constant pitch
angle of DBS = 90°. Both sonar systems were set to sample continuously at maximum ping rates.
For the long-term survey (first deployment), the platform was deployed down onto the seabed at the
Lysekil Wave Power Project site. Only the MBS was in operation, the transducers head was at a pitch
angle of 45° in respect to the base of the platform and pointed to aim two WECs located at distances
within 50 m from the sonar and about 20 m apart. This survey lasted 10 days, the ensemble duration
was set to 960 s integrating 1199 pings, and the ping interval was 2160 s.
Preprints (www.preprints.org) | NOT PEER-REVIEWED | Posted: 10 December 2018 Preprints (www.preprints.org) | NOT PEER-REVIEWED | Posted: 10 December 2018 doi:10.20944/preprints201611.0064.v3

11 of 19
11 of 19
Figure 6. Illustration of two-stage survey tracks adopted to investigate isolated targets such as the UU
WEC and the Söderfors turbine. The full line represents the scouting transepts which were wide and
quickly travelled. The dashed lines represents the intensive and detailed observation of specific
targets upon its location.
Figure 7. A pole mount system used for surface surveys (configuration-A). Here, a platform was
equped with MBS, DBS and a UWC systms on board of vessel.
Intensive transepts
Scouting transepts
Target
Cameras
Multibeam sonar
Split-beam sonar
Dual-beam sonar
Battery box & control electronics
Preprints (www.preprints.org) | NOT PEER-REVIEWED | Posted: 10 December 2018 Preprints (www.preprints.org) | NOT PEER-REVIEWED | Posted: 10 December 2018 doi:10.20944/preprints201611.0064.v3
12 of 19
12 of 19
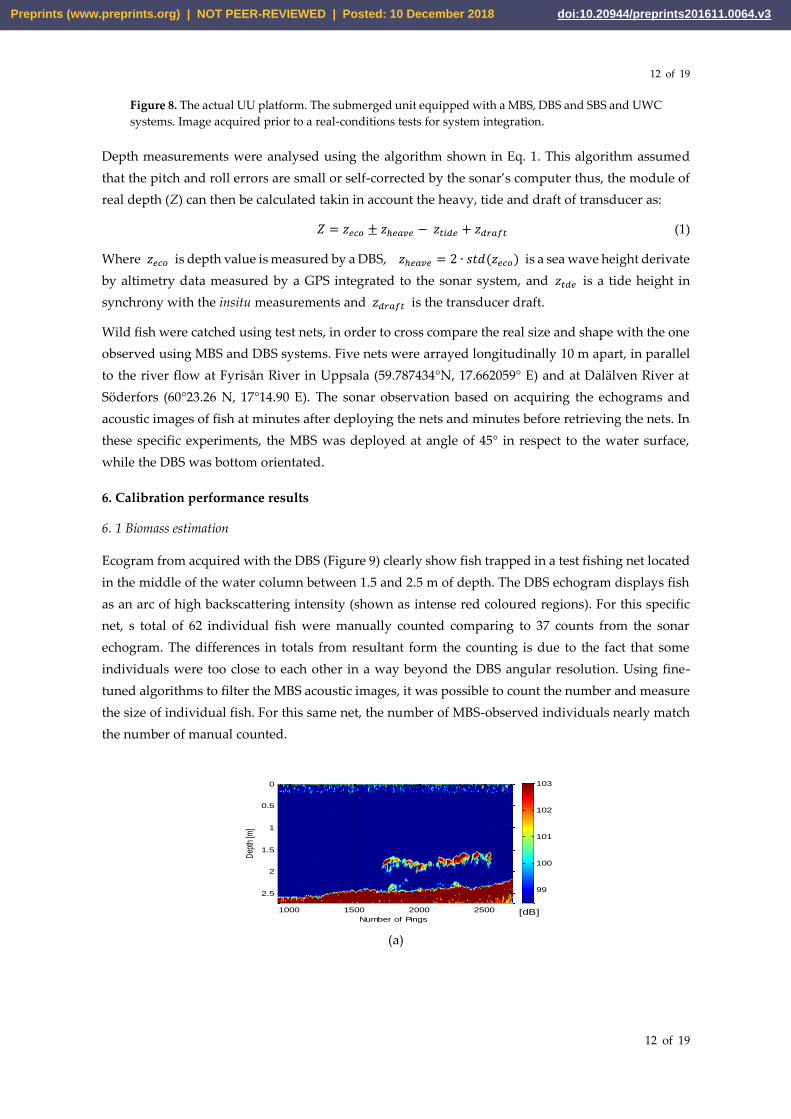
Figure 8. The actual UU platform. The submerged unit equipped with a MBS, DBS and SBS and UWC
systems. Image acquired prior to a real-conditions tests for system integration.
Depth measurements were analysed using the algorithm shown in Eq. 1. This algorithm assumed
that the pitch and roll errors are small or self-corrected by the sonar’s computer thus, the module of
real depth (Z) can then be calculated takin in account the heavy, tide and draft of transducer as:
𝑍 = 𝑐𝑜 ± ℎ 𝑎 − 𝑡𝑖𝑑 + 𝑑𝑟𝑎𝑓𝑡 (1)
Where 𝑐𝑜 is depth value is measured by a DBS, ℎ 𝑎 = 2 ∙ 𝑠𝑡𝑑( 𝑐𝑜) is a sea wave height derivate
by altimetry data measured by a GPS integrated to the sonar system, and 𝑡𝑑 is a tide height in
synchrony with the insitu measurements and 𝑑𝑟𝑎𝑓𝑡 is the transducer draft.
Wild fish were catched using test nets, in order to cross compare the real size and shape with the one
observed using MBS and DBS systems. Five nets were arrayed longitudinally 10 m apart, in parallel
to the river flow at Fyrisån River in Uppsala (59.787434°N, 17.662059° E) and at Dalälven River at
Söderfors (60°23.26 N, 17°14.90 E). The sonar observation based on acquiring the echograms and
acoustic images of fish at minutes after deploying the nets and minutes before retrieving the nets. In
these specific experiments, the MBS was deployed at angle of 45° in respect to the water surface,
while the DBS was bottom orientated.
6. Calibration performance results
6. 1 Biomass estimation
Ecogram from acquired with the DBS (Figure 9) clearly show fish trapped in a test fishing net located
in the middle of the water column between 1.5 and 2.5 m of depth. The DBS echogram displays fish
as an arc of high backscattering intensity (shown as intense red coloured regions). For this specific
net, s total of 62 individual fish were manually counted comparing to 37 counts from the sonar
echogram. The differences in totals from resultant form the counting is due to the fact that some
individuals were too close to each other in a way beyond the DBS angular resolution. Using fine-
tuned algorithms to filter the MBS acoustic images, it was possible to count the number and measure
the size of individual fish. For this same net, the number of MBS-observed individuals nearly match
the number of manual counted.
(a)
Number of Pings
Dep
th [m
]
1000 1500 2000 2500
0
0.5
1
1.5
2
2.5
[dB]
99
100
101
102
103
Preprints (www.preprints.org) | NOT PEER-REVIEWED | Posted: 10 December 2018 Preprints (www.preprints.org) | NOT PEER-REVIEWED | Posted: 10 December 2018 doi:10.20944/preprints201611.0064.v3
13 of 19
13 of 19
(b)
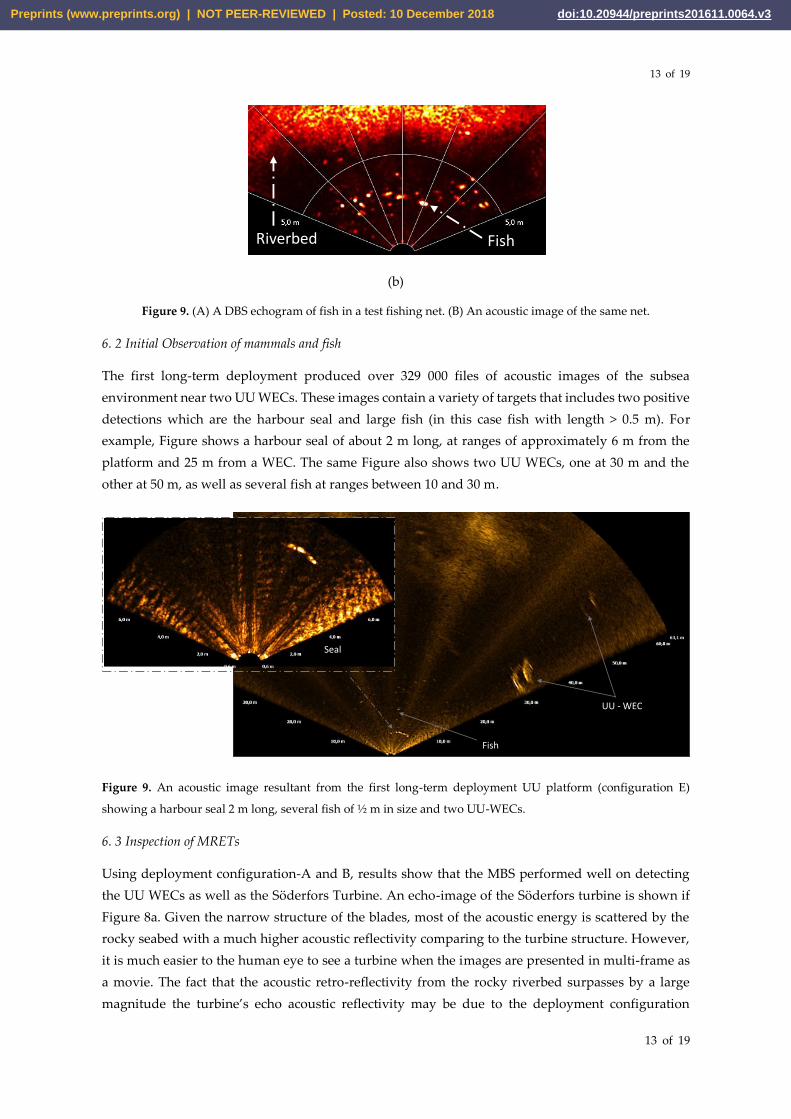
Figure 9. (A) A DBS echogram of fish in a test fishing net. (B) An acoustic image of the same net.
6. 2 Initial Observation of mammals and fish
The first long-term deployment produced over 329 000 files of acoustic images of the subsea
environment near two UU WECs. These images contain a variety of targets that includes two positive
detections which are the harbour seal and large fish (in this case fish with length > 0.5 m). For
example, Figure shows a harbour seal of about 2 m long, at ranges of approximately 6 m from the
platform and 25 m from a WEC. The same Figure also shows two UU WECs, one at 30 m and the
other at 50 m, as well as several fish at ranges between 10 and 30 m.
Figure 9. An acoustic image resultant from the first long-term deployment UU platform (configuration E)
showing a harbour seal 2 m long, several fish of ½ m in size and two UU-WECs.
6. 3 Inspection of MRETs
Using deployment configuration-A and B, results show that the MBS performed well on detecting
the UU WECs as well as the Söderfors Turbine. An echo-image of the Söderfors turbine is shown if
Figure 8a. Given the narrow structure of the blades, most of the acoustic energy is scattered by the
rocky seabed with a much higher acoustic reflectivity comparing to the turbine structure. However,
it is much easier to the human eye to see a turbine when the images are presented in multi-frame as
a movie. The fact that the acoustic retro-reflectivity from the rocky riverbed surpasses by a large
magnitude the turbine’s echo acoustic reflectivity may be due to the deployment configuration
FishRiverbed
UU - WEC
Fish
Seal
Preprints (www.preprints.org) | NOT PEER-REVIEWED | Posted: 10 December 2018 Preprints (www.preprints.org) | NOT PEER-REVIEWED | Posted: 10 December 2018 doi:10.20944/preprints201611.0064.v3

14 of 19
14 of 19
utilized in this case. The object shown on Figure 8a is an acoustic image of a UU WEC and the
surrounding environment. The MBS head was approximately 18 m from the top of the WEC. The
seabed and the WEC’s cylindrical gravity foundation are the most reflective targets. The cylindrical
body of the WEC its self is not the strongest acoustic target. The sound tends to scatter away from the
transducer when it irradiates trough cylindrical and spherical surfaces, contrary occur with flat
surfaces. The dark area behind a WEC represents the range limit of acoustic beams. These power
unities were surveyed in several occasions under different environmental conditions. The survey
referent to this acoustic image was conducted in October 2014. Similar images acquired during June,
July and August 2015 were distorted mostly due to water column stratification. The corresponding
DBS echogram displays the returning acoustic energy reflected by the WEC structure. The MBS
proved able to monitor maintenance work in WECs as Figure 8c shows a diver inspecting the top-
end funnel of a UU WEC deployed at 25 m depth, the diver is head down at approximately 20 m of
depth. The DBS system also detect WECs. An ecogram in Figure 8d shows two UU WECs, the arcs
represents acoustic backscattering from the metal body, depending on the vessel speed, these arcs
can become wide and spread (fast transepts) or dense with a more realistic WEC shape (quasi-static
transept). Echograms form DBS provide with high accuracy a position in terms of depth, of every
element detected, as an example, from the echogram in Figure 8d, was evident that from left to right,
the WECs had 7.5 m and 6 m of height respectively. This feature is relevant to classify targets and to
guide divers, vessels and under
(a) (b)
(c) (d)
Figure 8. Acoustic image captured using a MBS system. (a) A Söderfors turbine, most of the acoustic
energy is scattered by the rocky seabed with a much higher acoustic reflectivity comparing to the
turbine structure; (b) The environment surrounding a UU WEC deployed at depth of 25 m. The seabed
and the WEC gravity foundation are the most reflective targets due to its higher density. The dark
region represents the range limit of acoustic beams; (c) A diver inspecting a UU WEC; (d) A DBS
echogram referent to WECs, the arcs represents acoustic backscattering from the metal body
encapsulating the generators.
A UU turbine Turbine’s acoustic shadow
UU WEC baseplate
A diver
UU WECWEC’s acoustic shadow
UU WEC
Preprints (www.preprints.org) | NOT PEER-REVIEWED | Posted: 10 December 2018 Preprints (www.preprints.org) | NOT PEER-REVIEWED | Posted: 10 December 2018 doi:10.20944/preprints201611.0064.v3
15 of 19
15 of 19
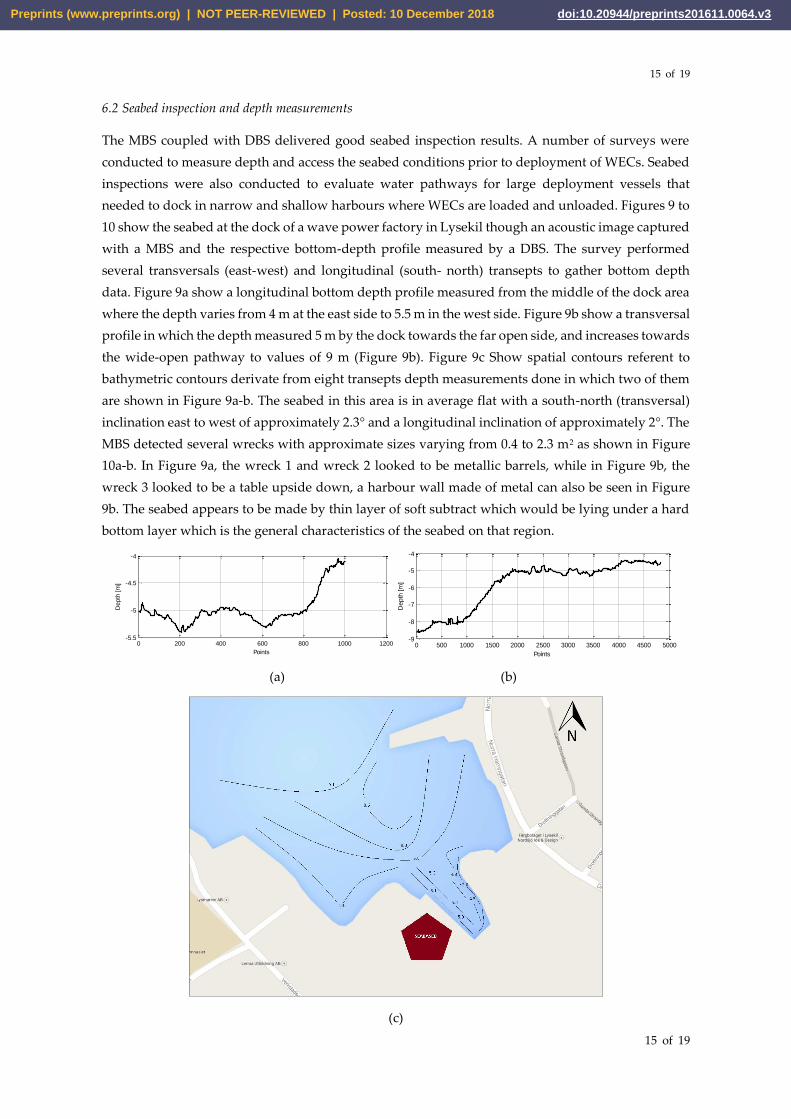
6.2 Seabed inspection and depth measurements
The MBS coupled with DBS delivered good seabed inspection results. A number of surveys were
conducted to measure depth and access the seabed conditions prior to deployment of WECs. Seabed
inspections were also conducted to evaluate water pathways for large deployment vessels that
needed to dock in narrow and shallow harbours where WECs are loaded and unloaded. Figures 9 to
10 show the seabed at the dock of a wave power factory in Lysekil though an acoustic image captured
with a MBS and the respective bottom-depth profile measured by a DBS. The survey performed
several transversals (east-west) and longitudinal (south- north) transepts to gather bottom depth
data. Figure 9a show a longitudinal bottom depth profile measured from the middle of the dock area
where the depth varies from 4 m at the east side to 5.5 m in the west side. Figure 9b show a transversal
profile in which the depth measured 5 m by the dock towards the far open side, and increases towards
the wide-open pathway to values of 9 m (Figure 9b). Figure 9c Show spatial contours referent to
bathymetric contours derivate from eight transepts depth measurements done in which two of them
are shown in Figure 9a-b. The seabed in this area is in average flat with a south-north (transversal)
inclination east to west of approximately 2.3° and a longitudinal inclination of approximately 2°. The
MBS detected several wrecks with approximate sizes varying from 0.4 to 2.3 m2 as shown in Figure
10a-b. In Figure 9a, the wreck 1 and wreck 2 looked to be metallic barrels, while in Figure 9b, the
wreck 3 looked to be a table upside down, a harbour wall made of metal can also be seen in Figure
9b. The seabed appears to be made by thin layer of soft subtract which would be lying under a hard
bottom layer which is the general characteristics of the seabed on that region.
(a) (b)
(c)
11.424 11.424211.4244 11.4246
11.4248 11.425
58.274958.275
58.275158.2752
58.2753-5.5
-5
-4.5
-4
LogitudeLatitude
Depth
[m
]
0 200 400 600 800 1000 1200-5.5
-5
-4.5
-4
Points
Depth
[m
]
11.42211.423
11.42411.425
11.426
58.274558.275
58.275558.276
58.276558.277
-10
-8
-6
-4
LogitudeLatitude
Depth
[m
]
0 500 1000 1500 2000 2500 3000 3500 4000 4500 5000-9
-8
-7
-6
-5
-4
Points
Depth
[m
]
Preprints (www.preprints.org) | NOT PEER-REVIEWED | Posted: 10 December 2018 Preprints (www.preprints.org) | NOT PEER-REVIEWED | Posted: 10 December 2018 doi:10.20944/preprints201611.0064.v3

16 of 19
16 of 19
Figure 9. Results for a seabed inspection of the area by the dock a wave power factory (Seabased
Industry AB) in Lysekil: (a) Measured depth [m] displayed in for an east to west longitudinal transect
on the middle of surveyed area; (b) Measured depth in a south to north transversal transept in which
the depth increases from the dock area towards the far open side; (c) Bird view at 20 m scale, of the
surveyed area including the spatial contours of measured depth.
(a) (b)
Figure 10. Overview of the seabed area by a wave power factory in Lysekil, through an imaging MBS
system. Seabed inspection detected wrecks lying on the bottom. (a) Wreck 1 measured approximately
0.7 x 0.6 m, wreck 2 measured 0.8 x 0.5 m, and were detected in the south side of the dock area. (b)
Wreck 3 measured 1.5 x 1.5 m, and was detected by the middle of the dock area few meters from the
harbour wall that was made of steel with in a c-shape.
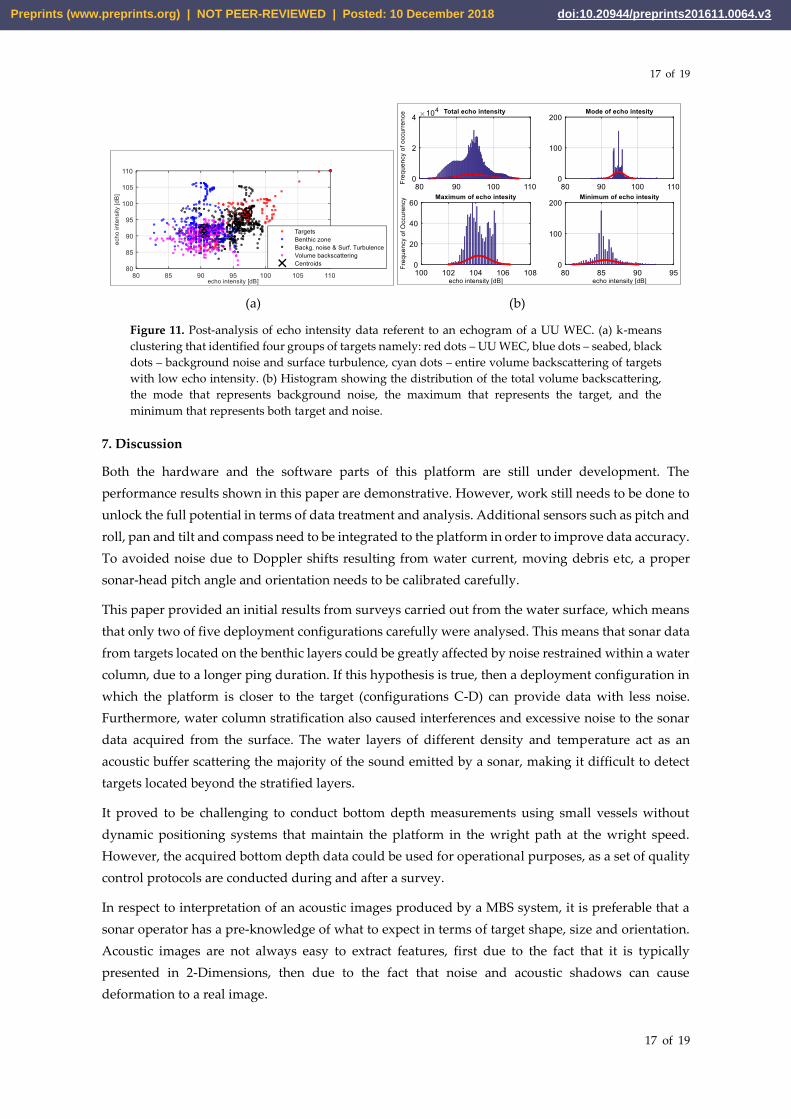
6.3 Echo intensity analysis
Data analysis for target identification and classification can be improved by undertaking supervised
and unsupervised classification of the acoustic backscattering intensity values. By undertaking an
unsupervised classification in a set of acoustic backscattering data collected from a UU WEC (shown
in Figure 8b) using MBS and DBS systems, it was possible to identify at least four clusters of data
(Figure 11a). The first cluster is referent to echoes from the UU WEC (red dots), the second cluster
represents the seabed, the third cluster represents the background noise and the surface turbulence,
and the fourth cluster contains the most frequent echoes of the entire volume backscattering. These
clusters are not exact, but they are representative.
It is also possible to improve target identification and classification by analysing echograms,
histograms and clusters of the same soundings (Figure 11b). This method is useful for accessing the
discrete distribution of acoustic backscattering intensity. Here, histograms were calculated using the
data shown on the echogram of Figure 9d. This information can tell how detected targets of interest,
background noise, benthic zone, and water surface contributes to the entire echo intensity detected
by the sonar. Echo-intensity referent to targets had most frequent values between -98 dB and -102 dB,
the water surface and riverbed had values above -100 dB, suspended sediments and noise had values
between -65 dB and -96 dB. The histogram of mode represents mainly the background noise and a
less the UU WEC. The histogram of minimum represents almost all the low values of echo intensity
within the sampled volume, and the histogram of maximum represents mainly the UU WEC and the
seabed. These findings are ambiguous although this method needs more tuning and the results need
further analysis, however, the potential is of this method is high.
A dock foundation wallwreck 3
wreck 1 wreck 2
Preprints (www.preprints.org) | NOT PEER-REVIEWED | Posted: 10 December 2018 Preprints (www.preprints.org) | NOT PEER-REVIEWED | Posted: 10 December 2018 doi:10.20944/preprints201611.0064.v3
17 of 19
17 of 19
(a) (b)
Figure 11. Post-analysis of echo intensity data referent to an echogram of a UU WEC. (a) k-means
clustering that identified four groups of targets namely: red dots – UU WEC, blue dots – seabed, black
dots – background noise and surface turbulence, cyan dots – entire volume backscattering of targets
with low echo intensity. (b) Histogram showing the distribution of the total volume backscattering,
the mode that represents background noise, the maximum that represents the target, and the
minimum that represents both target and noise.
7. Discussion
Both the hardware and the software parts of this platform are still under development. The
performance results shown in this paper are demonstrative. However, work still needs to be done to
unlock the full potential in terms of data treatment and analysis. Additional sensors such as pitch and
roll, pan and tilt and compass need to be integrated to the platform in order to improve data accuracy.
To avoided noise due to Doppler shifts resulting from water current, moving debris etc, a proper
sonar-head pitch angle and orientation needs to be calibrated carefully.
This paper provided an initial results from surveys carried out from the water surface, which means
that only two of five deployment configurations carefully were analysed. This means that sonar data
from targets located on the benthic layers could be greatly affected by noise restrained within a water
column, due to a longer ping duration. If this hypothesis is true, then a deployment configuration in
which the platform is closer to the target (configurations C-D) can provide data with less noise.
Furthermore, water column stratification also caused interferences and excessive noise to the sonar
data acquired from the surface. The water layers of different density and temperature act as an
acoustic buffer scattering the majority of the sound emitted by a sonar, making it difficult to detect
targets located beyond the stratified layers.
It proved to be challenging to conduct bottom depth measurements using small vessels without
dynamic positioning systems that maintain the platform in the wright path at the wright speed.
However, the acquired bottom depth data could be used for operational purposes, as a set of quality
control protocols are conducted during and after a survey.
In respect to interpretation of an acoustic images produced by a MBS system, it is preferable that a
sonar operator has a pre-knowledge of what to expect in terms of target shape, size and orientation.
Acoustic images are not always easy to extract features, first due to the fact that it is typically
presented in 2-Dimensions, then due to the fact that noise and acoustic shadows can cause
deformation to a real image.
Preprints (www.preprints.org) | NOT PEER-REVIEWED | Posted: 10 December 2018 Preprints (www.preprints.org) | NOT PEER-REVIEWED | Posted: 10 December 2018 doi:10.20944/preprints201611.0064.v3

18 of 19
18 of 19
8. Conclusions
The present work and the calibrations tests described in [26,32] concluded that a selected MBS system
could detect targets as small as 3 cm2 within a range shorter than 100 m or ¾ of this range. The MBS
was also capable of resolving isolated targets located near high reflective objects such metal and
concrete structures, as well as near the bottom and water surface. However, several factors such as
water turbidity, suspended particles, water column stratification, turbulence, and air bubbles can
drastically affect the quality of an acoustic image. The quality of a MBS acoustic image is also
dependent on the deployment configuration and weather conditions. The DBS was able to detect
with high accuracy, any target located at any position within the acoustic swath. However, the DBS
data can be adversely affected by the bulk of suspended particles within the water column.
Contrary to the DBS, which only works at its best when deployed at pitch angles near 90°, the MBS
in most of the cases produced better acoustic images when the transducer head was oriented at pitch
angle of 45°. However, in shallow waters (depth < 10 m) a pitch angle of 90° was more desirable.
When a target was located at depths near the MBS maximum range, a pitch angle of 0° was suitable.
Both MBS and DBS systems performed well on detecting UU WECs, Söderfors turbine, wrecks and
other types of underwater structures located within 100 m from the head of sonar. These two sonar
systems also produced substantial data of seabed inspection that could be used to access local
bathymetry and bottom composition. Advanced post-processing techniques such as supervised and
unsupervised classification methods can greatly increase the understanding of the sonar data.
This work also concludes that sonar data in a form of acoustic images or ecograms or simply altimetry
can provide a range of information such as bathymetry, biomass, structural inspections of
underwater technologies and structures, magnitude and direction of cavitating flows (for example:
[27]), underwater navigation among other relevant information vital for deployment, operation and
maintenance of MRETs.
Acknowledgements
This project has received funding from the European Union‘s Seventh Framework Programme for research,
technological and demonstration under grant agreement no 607656. The authors also acknowledge. The authors
also acknowledge the Carl Trygger & J Gust Richert Foundations.
References
(1) Wahlberg, M.; Westerberg, H. Hearing in fish and their reactions to sounds from offshore wind farms. Mar. Ecol. Prog. Ser.
2005, 288, 295–309.
(2) Rudstam, L. G.; Jech, J. M.; Parker-Stetter, S. L.; Horne, J. K.; Sullivan, P. J.; Mason, D. M. Fisheries Acoustics. Fisheries
Techniques (Chapter 13). Am. Fish. Soc. 2013, 40.
(3) Haikonen, K. Underwater radiated noise from Point Absorbing Wave Energy Converters; 2014.
(4) Langhamer, O.; Haikonen, K.; Sundberg, J. Wave power-Sustainable energy or environmentally costly? A review with
special emphasis on linear wave energy converters. Renew. Sustain. Energy Rev. 2010, 14 (4), 1329–1335.
(5) Jefferson, T. A.; Leatherwood, S.; Webber, M. A.; United Nations Environment Programme.; Food and Agriculture
Organization of the United Nations. Marine mammals of the world; United Nations Environment Programme, 1993.
(6) Caruthers, J. W. Fundamental of Marine Acoustics. 1977, p 165.
(7) Simmonds, J.; MacLennan, D. Fisheries acoustics: Theory and practice: Second edition; 2007.
Preprints (www.preprints.org) | NOT PEER-REVIEWED | Posted: 10 December 2018 Preprints (www.preprints.org) | NOT PEER-REVIEWED | Posted: 10 December 2018 doi:10.20944/preprints201611.0064.v3

19 of 19
19 of 19
(8) Lurton, X. An introduction to underwater acoustics : principles and applications; Springer Verlag, published in association with
Praxis Publishing, 2010.
(9) Hammar, L.; Andersson, S.; Rosenberg, R. Adapting offshore wind power foundations to local environment Adapting offshore
wind power foundations to local environment; 2010.
(10) Hammar, L. Power from the Brave New Ocean: Marine Renewable Energy and Ecological Risks; 2014.
(11) Wilson, B. Batty, R. S., Daunt, F. & Carter, C. Collision risks between marine renewable energy devices and mammals,
fish and diving birds. Water 2007, No. March, 1–110.
(12) Williamson, B. J.; Blondel, P.; Armstrong, E.; Bell, P. S.; Hall, C.; Waggitt, J. J.; Scott, B. E. A Self-Contained Subsea
Platform for Acoustic Monitoring of the Environment Around Marine Renewable Energy Devices-Field Deployments at
Wave and Tidal Energy Sites in Orkney, Scotland. IEEE J. Ocean. Eng. 2016, 41 (1), 67–81.
(13) Environmental Assessment | Fundy Force http://fundyforce.ca/environment/enviromental-assesment/.
(14) Marine Energy : EMEC: European Marine Energy Centre http://www.emec.org.uk/marine-energy/.
(15) Melvin, G. D.; Cochrane, N. A. Multibeam Acoustic Detection of Fish and Water Column Targets at High-Flow Sites.
Estuaries and Coasts 2014, 38, 227–240.
(16) Hovem, J. M. Underwater acoustics: Propagation, devices and systems. J. Electroceramics 2007, 19 (4), 339–347.
(17) Hastie, G. Tracking Marine Mammals Around Marine Renewable Energy Devices Using Active Sonar. 2012, pp 1–99.
(18) Xu, J.; Deng, Z. D.; Carlson, T. J.; Moore, B. Target Strength of Southern Resident Killer Whales (Orcinus orca):
Measurement and Modeling. Mar. Technol. Sci. 2012, 46, 77–84.
(19) Mcgehee, D.; Jaffe, J. S. Three-dimensional swimming behavior of individual zooplankters: observations using the
acoustical imaging system FishTV. ICES J. Mar. Sci. 1996, 53, 363–369.
(20) A. D. Waite. Sonar for Practising Engineers; John Wiley & Sons Ltd, 2002.
(21) Chu, D. Technology evolution and advances in fisheries acoustics. J. Mar. Sci. Technol. 2011, 19 (3), 245–252.
(22) Ehrenberg, J.; Torkelson, T. Application of dual-beam and split-beam target tracking in fisheries acoustics.
(23) Li, F. K.; Goldstein, R. M. Studies of Multibaseline Spaceborne Interferometric Synthetic Aperture Radars. IEEE Trans.
Geosci. Remote Sens. 1990, 28 (1), 88–97.
(24) Traynor, J. J.; Ehrenberg Traynor, J. E.; ie Traynor, J. J.; Ehrenberg, J. E. Fish and standard-sphere target-strength
measurements obtained with a dual-beam and split-beam echo-sounding system. Cons. int. Explor. Mer 1990, 189, 325–335.
(25) Popoli, R. Design and Analysis of Modern Tracking Systems (Artech House Radar Library) e-book.
(26) Francisco, F.; Sundberg, J. Sonar for environmental monitoring. Initial setup of an active acoustic platform. Proc. Int.
Offshore Polar Eng. Conf. 2015, 2015–Janua, 1175–1179.
(27) Francisco, F.; Carpman, N.; Dolguntseva, I.; Sundberg, J. Use of Multibeam and Dual-Beam Sonar Systems to Observe
Cavitating Flow Produced by Ferryboats : In a Marine Renewable Energy Perspective. 2017, 1–15.
(28) Lundin, S.; Forslund, J.; Carpman, N.; Grabbe, M.; Yuen, K.; Apelfröjd, S.; Goude, A.; Leijon, M. The Söderfors Project :
Experimental Hydrokinetic Power Station Deployment and First Results. EWTEC 2013 Proc. 2013.
(29) Waters, R. Energy from Ocean Waves; 2008.
(30) Leijon, M.; Boström, C.; Danielsson, O.; Gustafsson, S.; Haikonen, K.; Langhamer, O.; Strömstedt, E.; Stålberg, M.;
Sundberg, J.; Svensson, O.; et al. Wave energy from the north sea: Experiences from the lysekil research site. Surv. Geophys.
2008, 29 (3), 221–240.
(31) Parwal, A.; Remouit, F.; Hong, Y.; Francisco, F.; Castellucci, V.; Hai, L.; Ulvgård, L.; Li, W.; Lejerskog, E.; Baudoin, A.
Wave Energy Research at Uppsala University and The Lysekil Research Site , Sweden : A Status Update. 2015, 1–10.
(32) Francisco, F. G. A.; Sundberg, J.; Leijon, M. Sonar for Environmental Monitoring: Understanding the Functionality of
Active Acoustics as a Method for Monitoring Marine Renewable Energy Devices.
Preprints (www.preprints.org) | NOT PEER-REVIEWED | Posted: 10 December 2018 Preprints (www.preprints.org) | NOT PEER-REVIEWED | Posted: 10 December 2018 doi:10.20944/preprints201611.0064.v3