Embed Size (px)
Citation preview
Configuration and Optimization of
a Process Monitoring Tool Master of Science Thesis in the Master Degree Program:
Innovative and Sustainable Chemical Engineering.
CELINE ABBALLE
Department of Chemical and Biological Engineering
Division of Chemical Engineering Design
CHALMERS UNIVERSITY OF TECHNOLOGY
Göteborg, Sweden, 2010

MASTER´S THESIS
Configuration and Optimization of a Process
Monitoring ToolMaster´s Thesis within the Innovative and Sustainable
Chemical Engineering program.
CELINE ABBALLE
SUPERVISOR:
Anders Rasmuson
EXAMINER:
Anders Rasmuson
Department of Chemical and Biological EngineeringDivision of Chemical Engineering Design
CHALMERS UNIVERSITY OF TECHNOLOGY
Göteborg, Sweden 2010
Configuration and Optimization of a Process Monitoring Tool Master´s Thesis within the Innovative and Sustainable Chemical Engineering program.
CELINE ABBALLE
© CELINE ABBALLE 2010
Department of Chemical and Biological Engineering
Division of Chemical Engineering Design
Chalmers University of Technology
SE-412 96 Göteborg
Sweden
Telephone: +46(0)31-772 1000
Cover: DSM Seclin - 2008.
Chalmers Reproservice
Göteborg, Sweden 2010
Configuration and Optimization of a Process Monitoring Tool 1
ABSTRACT
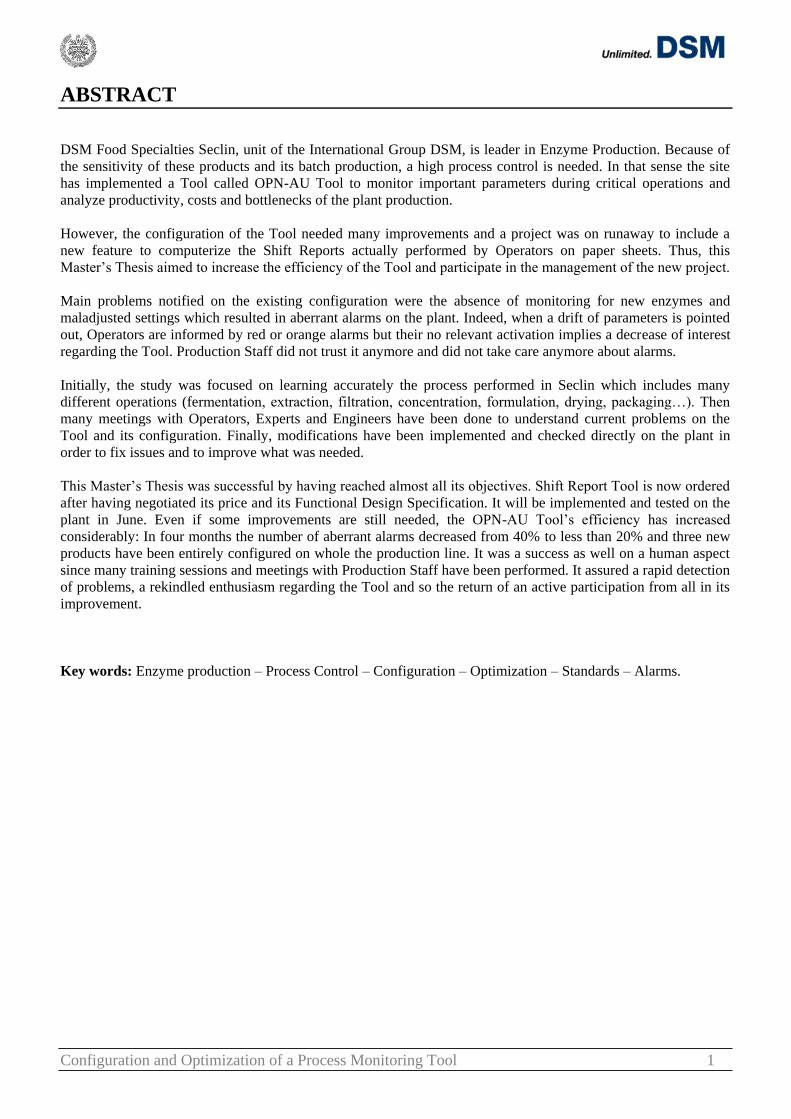
DSM Food Specialties Seclin, unit of the International Group DSM, is leader in Enzyme Production. Because of
the sensitivity of these products and its batch production, a high process control is needed. In that sense the site
has implemented a Tool called OPN-AU Tool to monitor important parameters during critical operations and
analyze productivity, costs and bottlenecks of the plant production.
However, the configuration of the Tool needed many improvements and a project was on runaway to include a
new feature to computerize the Shift Reports actually performed by Operators on paper sheets. Thus, this
Master‟s Thesis aimed to increase the efficiency of the Tool and participate in the management of the new project.
Main problems notified on the existing configuration were the absence of monitoring for new enzymes and
maladjusted settings which resulted in aberrant alarms on the plant. Indeed, when a drift of parameters is pointed
out, Operators are informed by red or orange alarms but their no relevant activation implies a decrease of interest
regarding the Tool. Production Staff did not trust it anymore and did not take care anymore about alarms.
Initially, the study was focused on learning accurately the process performed in Seclin which includes many
different operations (fermentation, extraction, filtration, concentration, formulation, drying, packaging…). Then
many meetings with Operators, Experts and Engineers have been done to understand current problems on the
Tool and its configuration. Finally, modifications have been implemented and checked directly on the plant in
order to fix issues and to improve what was needed.
This Master‟s Thesis was successful by having reached almost all its objectives. Shift Report Tool is now ordered
after having negotiated its price and its Functional Design Specification. It will be implemented and tested on the
plant in June. Even if some improvements are still needed, the OPN-AU Tool‟s efficiency has increased
considerably: In four months the number of aberrant alarms decreased from 40% to less than 20% and three new
products have been entirely configured on whole the production line. It was a success as well on a human aspect
since many training sessions and meetings with Production Staff have been performed. It assured a rapid detection
of problems, a rekindled enthusiasm regarding the Tool and so the return of an active participation from all in its
improvement.
Key words: Enzyme production – Process Control – Configuration – Optimization – Standards – Alarms.
Configuration and Optimization of a Process Monitoring Tool 2
ACKNOWLEDGE
First, I would like to express my gratitude to Mr. Per-Henrik Larsen, Chief Executive Officer, and Mr. Hervé
Denoncin, General Director, for welcoming me in DSM Food Specialties Seclin.
I wish to thank Mr. Fabian Flocard, Drying and Packaging Technical Expert, especially for the confidence he has
expressed to me, his daily coaching and the opportunity he gave me to discover a company which has an
international dimension. It was a real pleasure to work with him and I really appreciated the freedom of action and
decision he let me. I guess his plant will remember my capacity of taking initiatives.
I also thank Ms. Magali Ricarde, Teacher Researcher at ENSGTI in Pau (France), and Mr. Anders Rasmuson,
Teacher Researcher at Chalmers University of Technology in Gothenburg (Sweden), as tutors of this Master‟s
Thesis, for their availability and their advices despite distance which did not help.
I would like to thank as well Mr. Nicolas Legrand, Recovery Expert, Expert Leader, Golf Champion and so
serious opponent of Tiger Woods, for the share of his knowledge especially about DSP sector and fuchsia fashion.
It was a really pleasure to share the office with him and Mr. Fabian Flocard even if it has to be said that some
improvements are needed in the ball launching.
All my gratitude goes to Mr. Francis Maryniak, Fermentation Expert, Mr. Jean-Claude Cardon, Chromatography
Expert, and Mr. Paul Manducher, Production Manager, for their availability, their advices, their support and their
sympathy which let me to work in a good atmosphere.
Finally, I wish to thank all Staff of DSM Food Specialties Seclin, in particular all Operators for the time they
spent answering my questions, their hospitality and their kindness. It let me to evolve in a pleasant way in this
male environment.
Configuration and Optimization of a Process Monitoring Tool 3
NOTE TO READERS
This report, released outside of DSM Food Specialties, has been written in compliance with some confidentiality
clauses. Thus, any information about the plant‟s capacity, names of products and conditions of manufacturing
processes have been given out.
Some Figures are presented on the left side of pages instead of being included in Annexes. It should guarantee a
better understanding by having assigned texts closed to Figures.
This Master‟s Thesis has been performed in France; several documents presented in Annexes are so in French.
I apologize in advance for these unconventional measures.
Configuration and Optimization of a Process Monitoring Tool 4
CONTENT
ABSTRACT................................................................................................................................................ 1
ACKNOWLEDGE ..................................................................................................................................... 2
NOTE TO READERS ................................................................................................................................ 3
INTRODUCTION ...................................................................................................................................... 5
GENERALITIES ........................................................................................................................................ 6
A. General presentation of the company ............................................................................................. 6
1. DSM Group................................................................................................................................. 6
2. DFS Group .................................................................................................................................. 6
3. DFS Seclin .................................................................................................................................. 7
B. Process Description......................................................................................................................... 8
1. Fermentation ............................................................................................................................... 9
2. Extraction and Filtration ........................................................................................................... 10
3. Formulation and Packaging Phase ............................................................................................ 13
4. Quality Aspects ......................................................................................................................... 13
PROCESS MONITORING ...................................................................................................................... 15
A. Generalities ................................................................................................................................... 15
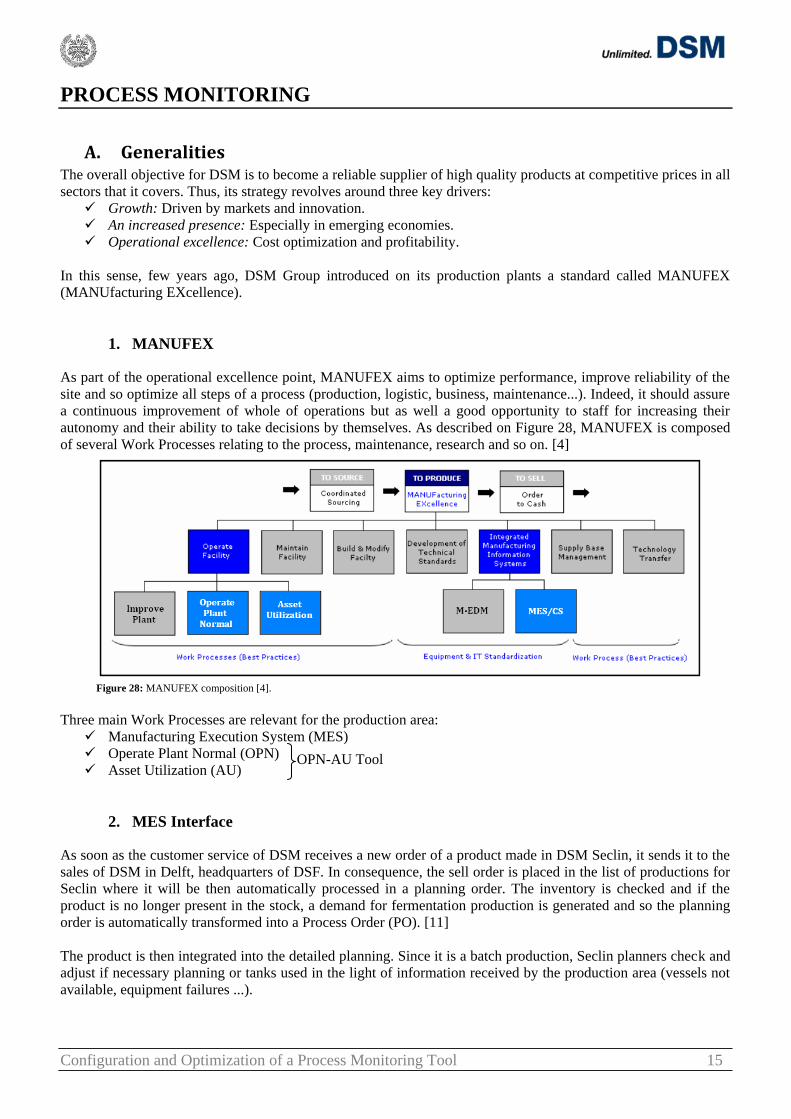
1. MANUFEX ............................................................................................................................... 15
2. MES Interface ........................................................................................................................... 15
3. OPN-AU Tool ........................................................................................................................... 16
B. Process Control ............................................................................................................................. 17
1. OPN Tool .................................................................................................................................. 17
2. AU Tool .................................................................................................................................... 20
3. Utilization and Configuration of OPN-AU Tool ...................................................................... 22
MASTER‟S THESIS‟ STUDY ................................................................................................................ 28
A. Mission Description ...................................................................................................................... 28
1. Initial State ................................................................................................................................ 28
2. Aimed Improvements ............................................................................................................... 28
3. Available Means ....................................................................................................................... 29
B. Performed Improvements ............................................................................................................. 31
1. Example of an Extraction‟s configuration ................................................................................ 31
2. Example of a Formulation‟s configuration ............................................................................... 33
3. Example of a Deviation‟s solving ............................................................................................. 35
C. Results and Communication ......................................................................................................... 35
1. Results on OPN-AU Tool ......................................................................................................... 36
2. Results on the Shift Report Tool............................................................................................... 36
3. Communication ......................................................................................................................... 37
CONCLUSIONS ...................................................................................................................................... 39
NOTATIONS ........................................................................................................................................... 40
REFERENCES ......................................................................................................................................... 41
ANNEXES ................................................................................................................................................ 42

Configuration and Optimization of a Process Monitoring Tool 5
INTRODUCTION
Important actors in Food Industry, Enzyme producers have a booming market for few decades. The Dutch
International Group DSM has a unit leader in this field: DSM Food Specialties.
This Master‟s Thesis was conducted during a period of six months in France in DSM Seclin, a production plant of
this unit. Each year, the site produces around 8.000 tons of enzymes from various micro-organisms. Developed in
Fermentation, they undergo several steps of extraction and concentration before being packed.
DSM understands that the key to success lies in an optimization of operations to get a maximum performance
from his equipment and assure a quality of produced enzymes unmatched. In this context, my internship was
devoted to configuration and optimization of a Tool, OPN-AU Tool, whose goals are the establishment of process
monitoring and the standardization of manufacturing processes. It included as well the management of a new
project, the creation of Shift Report Tool which should allow computerization of teams‟ reports.
The task was therefore to improve the process control, its analysis and to perform project management. It fits
perfectly with the educational goals of a Master‟s Thesis. Indeed, these tasks put the student in a situation of
professional responsibility since they imply learning of scientific, technical and human resources in the
engineering profession and thus prepare his employability.
This report is divided into three main parts. First, focused on generalities, it presents the company and the
description of manufacturing processes of enzymes. Then it details means to control the process on the site,
including the configuration and the use of OPN-AU Tool. Finally, it describes the main concrete actions carried
on during this mission through various examples and their impacts on production.
Configuration and Optimization of a Process Monitoring Tool 6
GENERALITIES
A. General presentation of the company
1. DSM Group
Dutch States Mines (DSM) is an international Dutch group which creates
innovative products and services in Life Sciences and Materials
Sciences, contributing to the quality of life. DSM‟s products are used
globally in a wide range of markets and applications, supporting a
healthier, more sustainable and enjoyable way of life. This company,
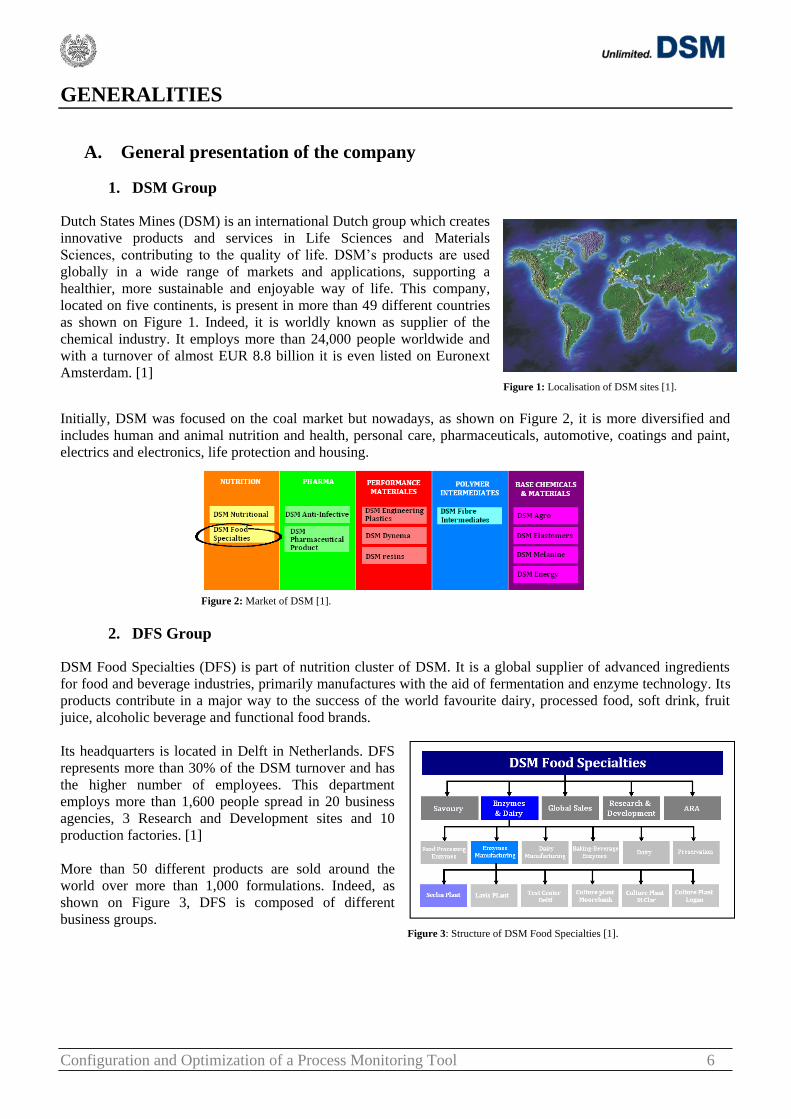
located on five continents, is present in more than 49 different countries
as shown on Figure 1. Indeed, it is worldly known as supplier of the
chemical industry. It employs more than 24,000 people worldwide and
with a turnover of almost EUR 8.8 billion it is even listed on Euronext
Amsterdam. [1] Figure 1: Localisation of DSM sites [1].
Initially, DSM was focused on the coal market but nowadays, as shown on Figure 2, it is more diversified and
includes human and animal nutrition and health, personal care, pharmaceuticals, automotive, coatings and paint,
electrics and electronics, life protection and housing.
Figure 2: Market of DSM [1].
2. DFS Group
DSM Food Specialties (DFS) is part of nutrition cluster of DSM. It is a global supplier of advanced ingredients
for food and beverage industries, primarily manufactures with the aid of fermentation and enzyme technology. Its
products contribute in a major way to the success of the world favourite dairy, processed food, soft drink, fruit
juice, alcoholic beverage and functional food brands.
Its headquarters is located in Delft in Netherlands. DFS
represents more than 30% of the DSM turnover and has
the higher number of employees. This department
employs more than 1,600 people spread in 20 business
agencies, 3 Research and Development sites and 10
production factories. [1]
More than 50 different products are sold around the
world over more than 1,000 formulations. Indeed, as
shown on Figure 3, DFS is composed of different
business groups. Figure 3: Structure of DSM Food Specialties [1].
Configuration and Optimization of a Process Monitoring Tool 7
These various specialties let DFS to have a large market position in several areas:
Dairy
Savoury
Baking
Beverages
Functional Food
Enzymes
With its two manufacturing plants (France-Seclin and Italy-Lavis), DFS Enzymes performed to have a presence
all around the world (Figure 4).
Figure 4: DSM Enzymes, a worldwide presence [1].
3. DFS Seclin
a. History of DFS Seclin
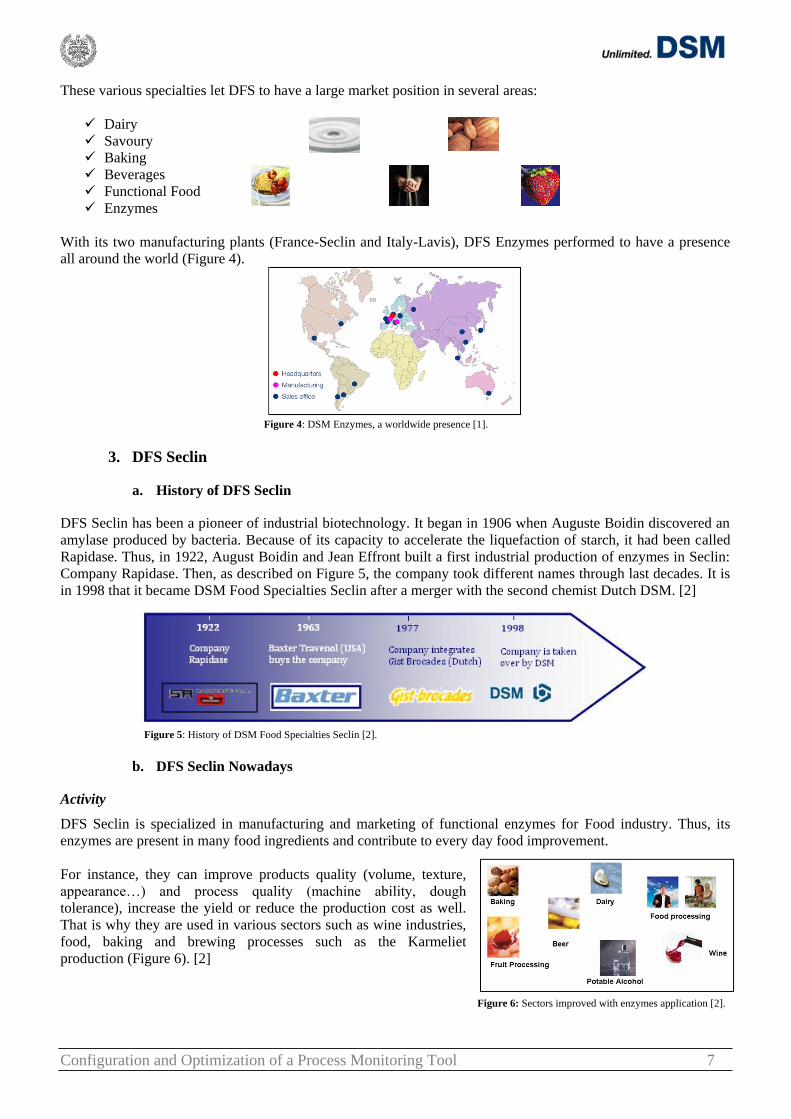
DFS Seclin has been a pioneer of industrial biotechnology. It began in 1906 when Auguste Boidin discovered an
amylase produced by bacteria. Because of its capacity to accelerate the liquefaction of starch, it had been called
Rapidase. Thus, in 1922, August Boidin and Jean Effront built a first industrial production of enzymes in Seclin:
Company Rapidase. Then, as described on Figure 5, the company took different names through last decades. It is
in 1998 that it became DSM Food Specialties Seclin after a merger with the second chemist Dutch DSM. [2]
Figure 5: History of DSM Food Specialties Seclin [2].
b. DFS Seclin Nowadays
Activity
DFS Seclin is specialized in manufacturing and marketing of functional enzymes for Food industry. Thus, its
enzymes are present in many food ingredients and contribute to every day food improvement.
For instance, they can improve products quality (volume, texture,
appearance…) and process quality (machine ability, dough
tolerance), increase the yield or reduce the production cost as well.
That is why they are used in various sectors such as wine industries,
food, baking and brewing processes such as the Karmeliet
production (Figure 6). [2]
Figure 6: Sectors improved with enzymes application [2].
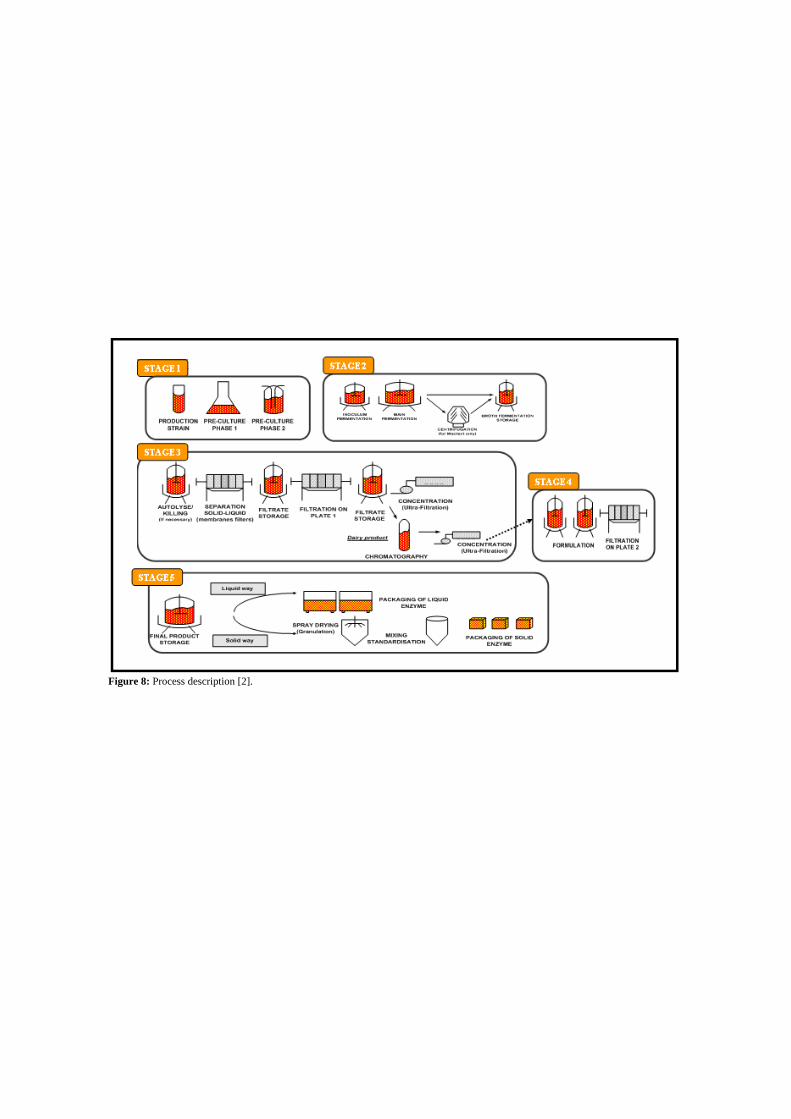
Figure 8: Process description [2].
Configuration and Optimization of a Process Monitoring Tool 8
Structure
This production plant is located in Seclin (France-59) on a site of 2.3 ha for more than 180 employees (Annexe I).
It was certified ISO 9002 by AFAQ in 1993, 1996 and 1999 and certified by the new ISO 9001 in 2003 and 2006
[3]. Moreover, it is currently on a process of AIB Certification.
The Site Director is assisted by the Management Committee (CODIR) which each member is responsible for one
or more services comprising managers, supervisors, technicians and/or operators according to its structure
(Annexe II).
The organization is based on the cooperation of several departments such as production, the engineering
department, quality service, the production support (including Maintenance Services, Environment Unit…), the
business unit and the communication department.
The production department is mainly composed of four areas directed by an Expert, specialist of it:
Fermentation
Down Stream Processing (DSP)
Chromatography
Finishing (Drying and Packaging)
The plant operates as a batch production 7 days 7 and 24 hours a day in “3/8” (i.e.: Organization of work where 3
shifts work 8 hours each to cover 24 hours a day). Thanks to this no-stop production, DSM Seclin manages to
produce more than 7,600 tons a year including 6,200 tons in liquid form and 1,400 tons in solid form [2]. It has
been decided to do a batch production because of the diversity of the products. Around 25 different enzymes are
packaged in 20 types of packaging, marketed under nearly 200 different formulations which represent more than
400 references in the final active packages. It is around 80% of its production which guarantees its presence all
around the world. [4]
B. Process Description
Enzyme is an active protein which makes it possible to transform a complex natural substance into simpler and
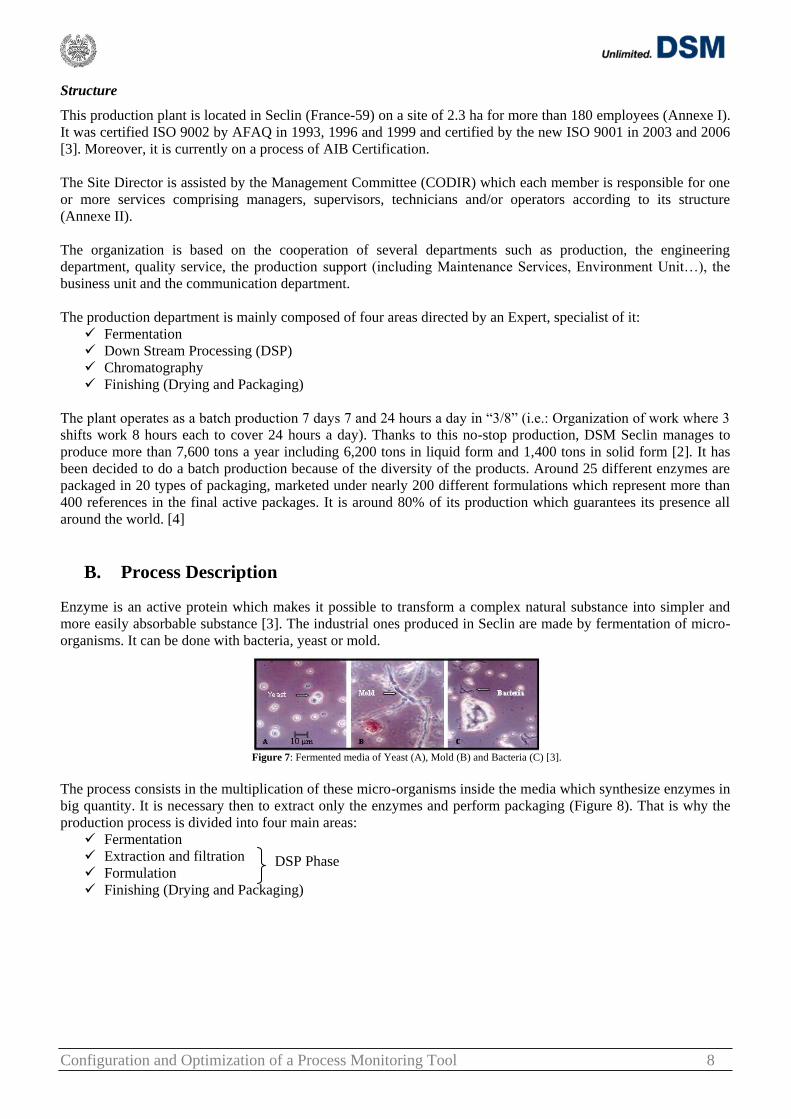
more easily absorbable substance [3]. The industrial ones produced in Seclin are made by fermentation of micro-
organisms. It can be done with bacteria, yeast or mold.
Figure 7: Fermented media of Yeast (A), Mold (B) and Bacteria (C) [3].
The process consists in the multiplication of these micro-organisms inside the media which synthesize enzymes in
big quantity. It is necessary then to extract only the enzymes and perform packaging (Figure 8). That is why the
production process is divided into four main areas:
Fermentation
Extraction and filtration
Formulation
Finishing (Drying and Packaging)
DSP Phase
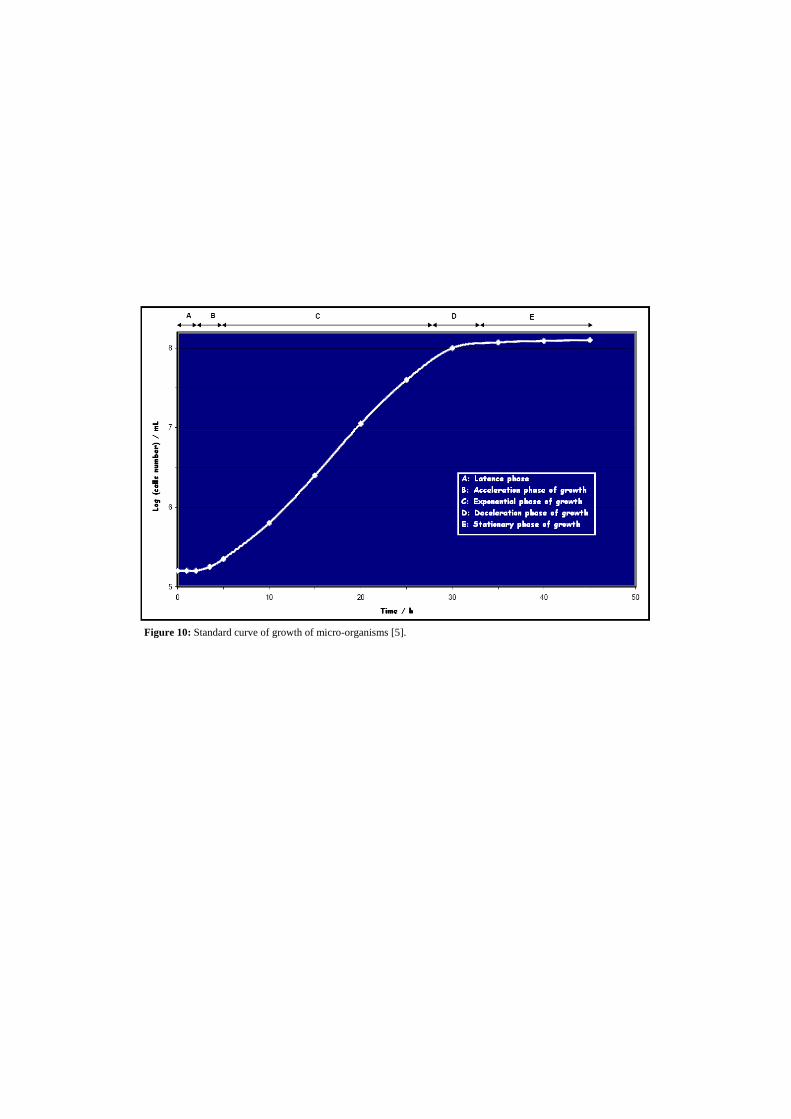
Figure 10: Standard curve of growth of micro-organisms [5].
Configuration and Optimization of a Process Monitoring Tool 9
1. Fermentation
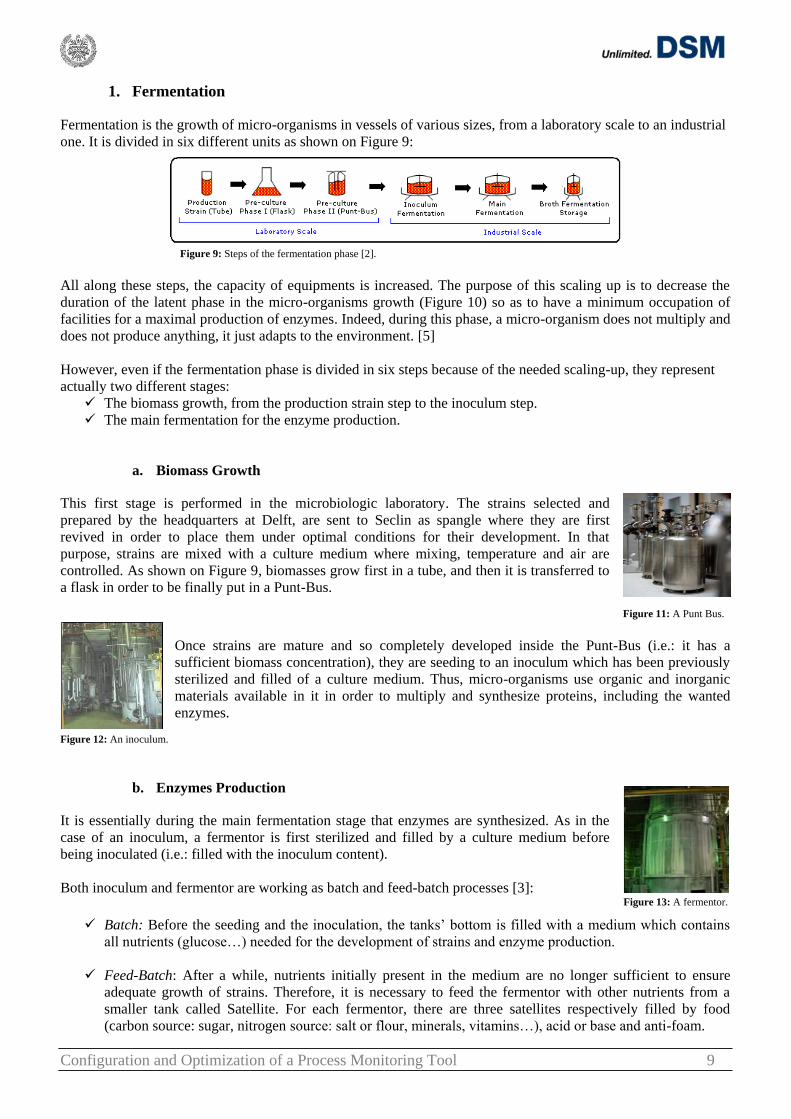
Fermentation is the growth of micro-organisms in vessels of various sizes, from a laboratory scale to an industrial
one. It is divided in six different units as shown on Figure 9:
Figure 9: Steps of the fermentation phase [2].
All along these steps, the capacity of equipments is increased. The purpose of this scaling up is to decrease the
duration of the latent phase in the micro-organisms growth (Figure 10) so as to have a minimum occupation of
facilities for a maximal production of enzymes. Indeed, during this phase, a micro-organism does not multiply and
does not produce anything, it just adapts to the environment. [5]
However, even if the fermentation phase is divided in six steps because of the needed scaling-up, they represent
actually two different stages:
The biomass growth, from the production strain step to the inoculum step.
The main fermentation for the enzyme production.
a. Biomass Growth
This first stage is performed in the microbiologic laboratory. The strains selected and
prepared by the headquarters at Delft, are sent to Seclin as spangle where they are first
revived in order to place them under optimal conditions for their development. In that
purpose, strains are mixed with a culture medium where mixing, temperature and air are
controlled. As shown on Figure 9, biomasses grow first in a tube, and then it is transferred to
a flask in order to be finally put in a Punt-Bus.
Figure 11: A Punt Bus.
Once strains are mature and so completely developed inside the Punt-Bus (i.e.: it has a
sufficient biomass concentration), they are seeding to an inoculum which has been previously
sterilized and filled of a culture medium. Thus, micro-organisms use organic and inorganic
materials available in it in order to multiply and synthesize proteins, including the wanted
enzymes.
Figure 12: An inoculum.
b. Enzymes Production
It is essentially during the main fermentation stage that enzymes are synthesized. As in the
case of an inoculum, a fermentor is first sterilized and filled by a culture medium before
being inoculated (i.e.: filled with the inoculum content).
Both inoculum and fermentor are working as batch and feed-batch processes [3]: Figure 13: A fermentor.
Batch: Before the seeding and the inoculation, the tanks‟ bottom is filled with a medium which contains
all nutrients (glucose…) needed for the development of strains and enzyme production.
Feed-Batch: After a while, nutrients initially present in the medium are no longer sufficient to ensure
adequate growth of strains. Therefore, it is necessary to feed the fermentor with other nutrients from a
smaller tank called Satellite. For each fermentor, there are three satellites respectively filled by food
(carbon source: sugar, nitrogen source: salt or flour, minerals, vitamins…), acid or base and anti-foam.
Configuration and Optimization of a Process Monitoring Tool 10
Because of this addition of products, regularly it is necessary to do some withdrawals sent to other vessels in
respecting sterility of equipments where they will be treated (extraction step). Sterility and purity are really crucial
in this kind of enzymes production for two main reasons:
It involves the development of micro-organisms. A presence of contaminant could imply a phenomenon
of competition and therefore a loss of yield.
Enzymes produced in DSM Seclin are used in Food industry, so the final product has to not contain any
harmful contaminant.
In that purpose and to insure an optimum growth of micro-organisms, enzymes production requires control of the
conditions in the tanks like air, pH, temperature and purity. That is why several parameters are monitored [3]:
Aeration: It supplies the amount of substrate oxygen needed for the micro-organism‟s respiration. The
rate of oxygen consumption is reflected in the OUR (Oxygen Uptake Rate). This measure represents the
amount of oxygen consumed per kilogram of mash per hour. It is expressed in mM / kg / h.
Counter-Pressure (CP): The oxygen supplied by air is not very soluble in water. It is therefore not
available for micro-organisms. To increase the dissolution, CP must be increased (i.e.: higher increase in
oxygen saturation).
Mixing: It also increases the dissolved oxygen by shearing of air bubbles which increases the exchange
surface.
DOC: It represents the amount of oxygen dissolved in water. In this process, when the DOC (Chemical
Demand of Oxygen) is less than 30% of its initial value, it is assume that oxygen becomes limiting.
Temperature: It is maintained at a set point through cooling water (fermentation is exothermic).
pH: It is maintained at a set point that varies depending on the strain. The regulation is done by ammonia,
soda, sulphuric acid or phosphoric acid. Its measurement is made from sterilized and pressurized glass
sensors.
Once fermentation is over, the content is added to vessels where it will be treated and prepared for the filtration
phase.
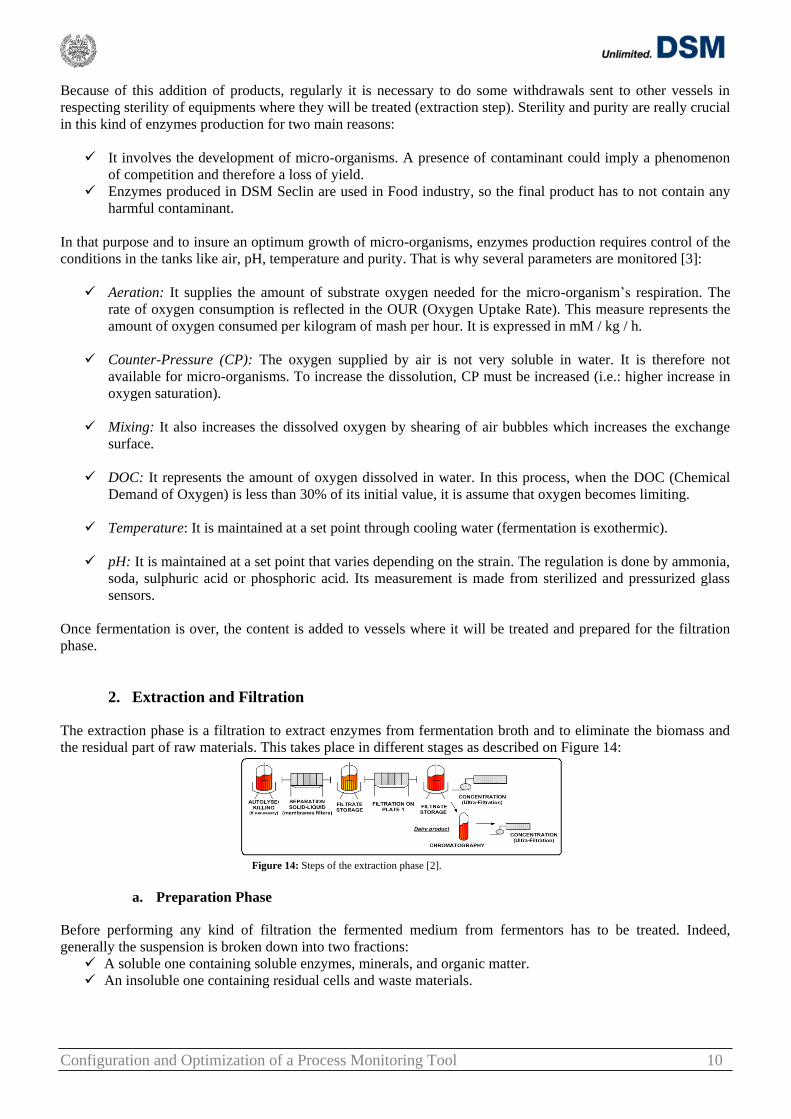
2. Extraction and Filtration
The extraction phase is a filtration to extract enzymes from fermentation broth and to eliminate the biomass and
the residual part of raw materials. This takes place in different stages as described on Figure 14:
Figure 14: Steps of the extraction phase [2].
a. Preparation Phase
Before performing any kind of filtration the fermented medium from fermentors has to be treated. Indeed,
generally the suspension is broken down into two fractions:
A soluble one containing soluble enzymes, minerals, and organic matter.
An insoluble one containing residual cells and waste materials.
Configuration and Optimization of a Process Monitoring Tool 11
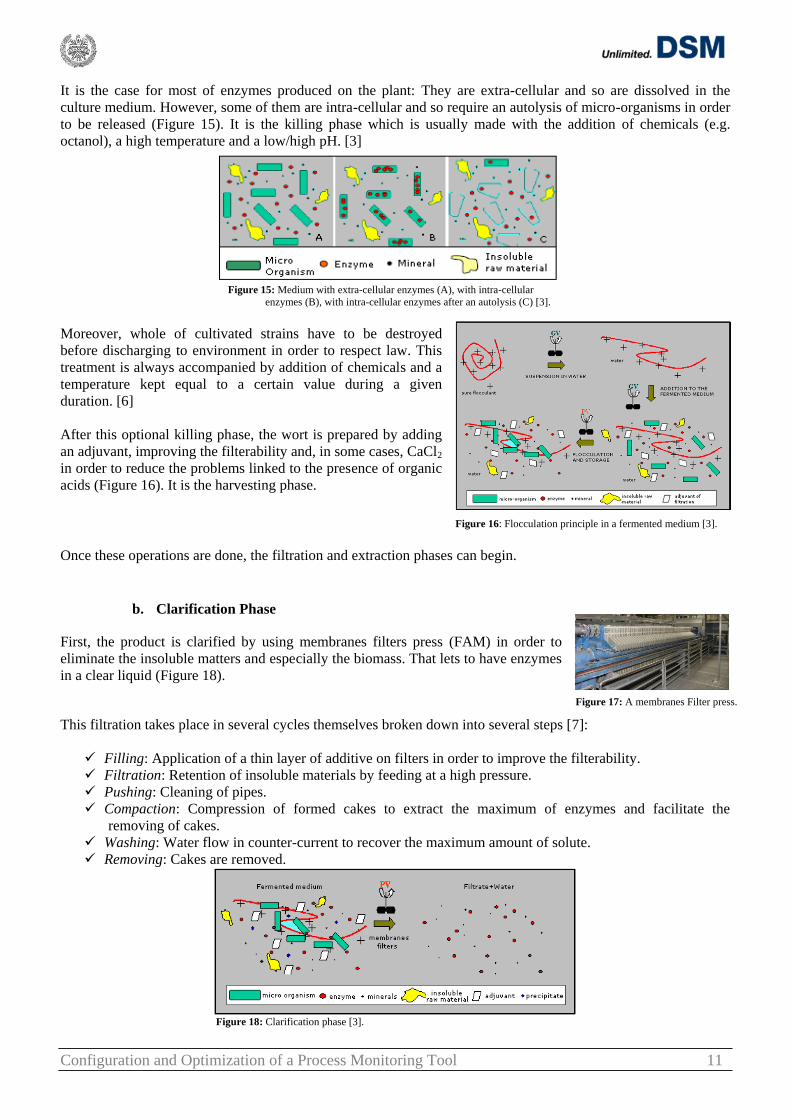
It is the case for most of enzymes produced on the plant: They are extra-cellular and so are dissolved in the
culture medium. However, some of them are intra-cellular and so require an autolysis of micro-organisms in order
to be released (Figure 15). It is the killing phase which is usually made with the addition of chemicals (e.g.
octanol), a high temperature and a low/high pH. [3]
Figure 15: Medium with extra-cellular enzymes (A), with intra-cellular
enzymes (B), with intra-cellular enzymes after an autolysis (C) [3].
Moreover, whole of cultivated strains have to be destroyed
before discharging to environment in order to respect law. This
treatment is always accompanied by addition of chemicals and a
temperature kept equal to a certain value during a given
duration. [6]
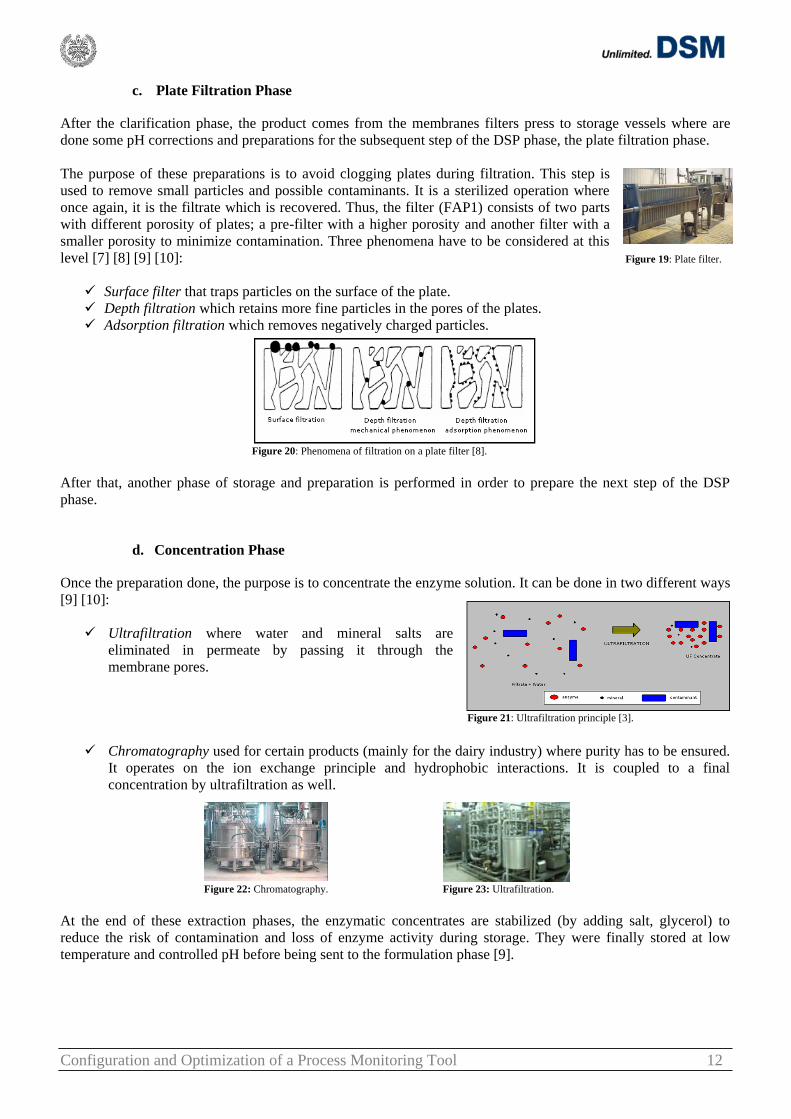
After this optional killing phase, the wort is prepared by adding
an adjuvant, improving the filterability and, in some cases, CaCl2
in order to reduce the problems linked to the presence of organic
acids (Figure 16). It is the harvesting phase.
Figure 16: Flocculation principle in a fermented medium [3].
Once these operations are done, the filtration and extraction phases can begin.
b. Clarification Phase
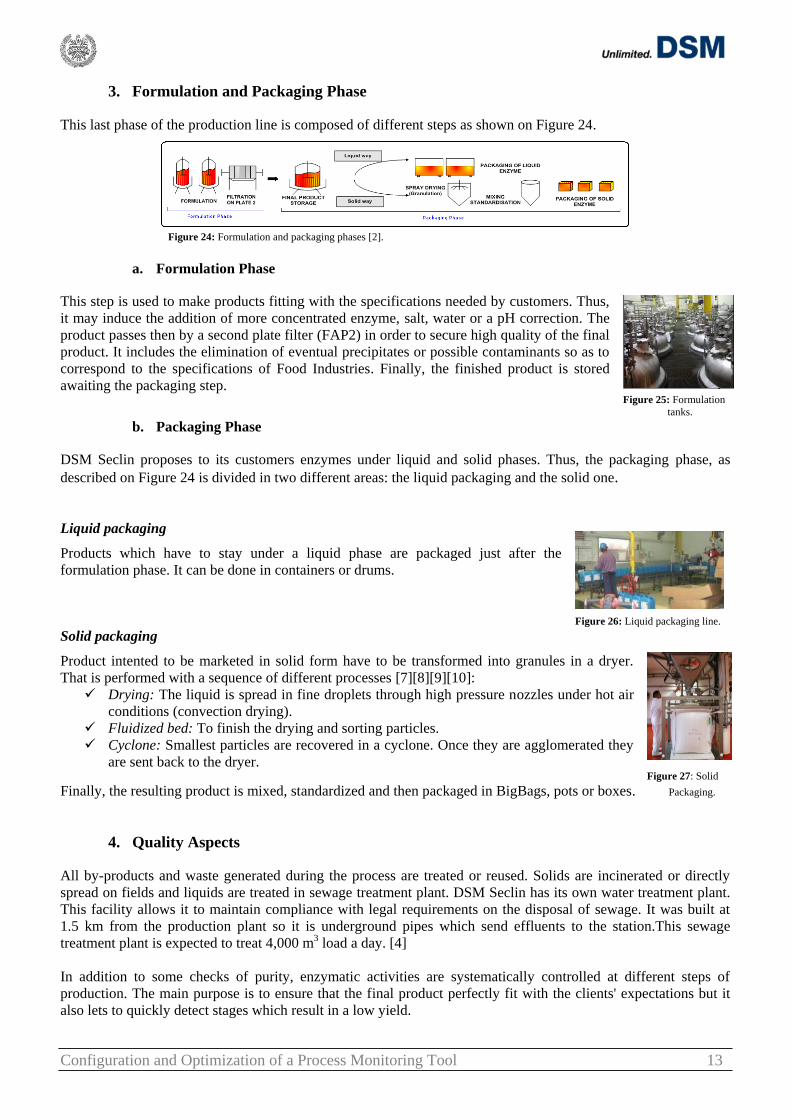
First, the product is clarified by using membranes filters press (FAM) in order to
eliminate the insoluble matters and especially the biomass. That lets to have enzymes
in a clear liquid (Figure 18).
Figure 17: A membranes Filter press.
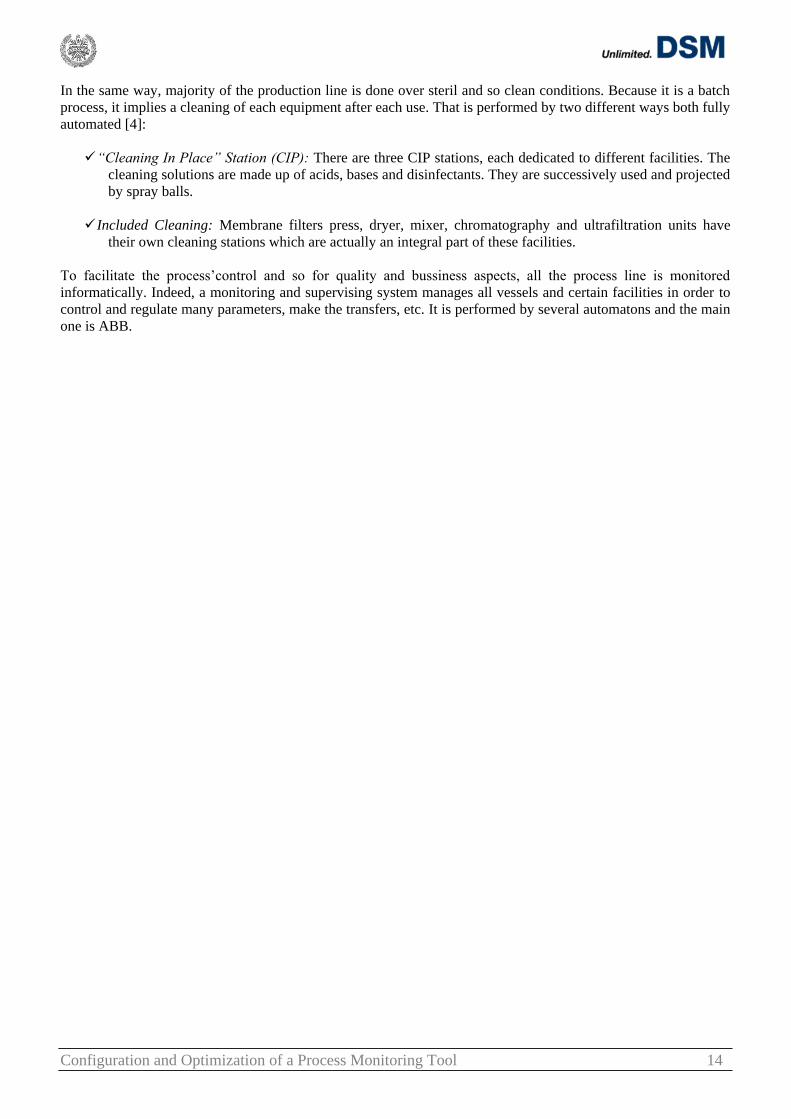
This filtration takes place in several cycles themselves broken down into several steps [7]:
Filling: Application of a thin layer of additive on filters in order to improve the filterability.
Filtration: Retention of insoluble materials by feeding at a high pressure.
Pushing: Cleaning of pipes.
Compaction: Compression of formed cakes to extract the maximum of enzymes and facilitate the
removing of cakes.
Washing: Water flow in counter-current to recover the maximum amount of solute.
Removing: Cakes are removed.
Figure 18: Clarification phase [3].
Configuration and Optimization of a Process Monitoring Tool 12
c. Plate Filtration Phase
After the clarification phase, the product comes from the membranes filters press to storage vessels where are
done some pH corrections and preparations for the subsequent step of the DSP phase, the plate filtration phase.
The purpose of these preparations is to avoid clogging plates during filtration. This step is
used to remove small particles and possible contaminants. It is a sterilized operation where
once again, it is the filtrate which is recovered. Thus, the filter (FAP1) consists of two parts
with different porosity of plates; a pre-filter with a higher porosity and another filter with a
smaller porosity to minimize contamination. Three phenomena have to be considered at this
level [7] [8] [9] [10]: Figure 19: Plate filter.
Surface filter that traps particles on the surface of the plate.
Depth filtration which retains more fine particles in the pores of the plates.
Adsorption filtration which removes negatively charged particles.
Figure 20: Phenomena of filtration on a plate filter [8].
After that, another phase of storage and preparation is performed in order to prepare the next step of the DSP
phase.
d. Concentration Phase
Once the preparation done, the purpose is to concentrate the enzyme solution. It can be done in two different ways
[9] [10]:
Ultrafiltration where water and mineral salts are
eliminated in permeate by passing it through the
membrane pores.
Figure 21: Ultrafiltration principle [3].
Chromatography used for certain products (mainly for the dairy industry) where purity has to be ensured.
It operates on the ion exchange principle and hydrophobic interactions. It is coupled to a final
concentration by ultrafiltration as well.
Figure 22: Chromatography. Figure 23: Ultrafiltration.
At the end of these extraction phases, the enzymatic concentrates are stabilized (by adding salt, glycerol) to
reduce the risk of contamination and loss of enzyme activity during storage. They were finally stored at low
temperature and controlled pH before being sent to the formulation phase [9].
Configuration and Optimization of a Process Monitoring Tool 13
3. Formulation and Packaging Phase
This last phase of the production line is composed of different steps as shown on Figure 24.
Figure 24: Formulation and packaging phases [2].
a. Formulation Phase
This step is used to make products fitting with the specifications needed by customers. Thus,
it may induce the addition of more concentrated enzyme, salt, water or a pH correction. The
product passes then by a second plate filter (FAP2) in order to secure high quality of the final
product. It includes the elimination of eventual precipitates or possible contaminants so as to
correspond to the specifications of Food Industries. Finally, the finished product is stored
awaiting the packaging step. Figure 25: Formulation
tanks.
b. Packaging Phase
DSM Seclin proposes to its customers enzymes under liquid and solid phases. Thus, the packaging phase, as
described on Figure 24 is divided in two different areas: the liquid packaging and the solid one.
Liquid packaging
Products which have to stay under a liquid phase are packaged just after the
formulation phase. It can be done in containers or drums.
Figure 26: Liquid packaging line. Solid packaging
Product intented to be marketed in solid form have to be transformed into granules in a dryer.
That is performed with a sequence of different processes [7][8][9][10]:
Drying: The liquid is spread in fine droplets through high pressure nozzles under hot air
conditions (convection drying).
Fluidized bed: To finish the drying and sorting particles.
Cyclone: Smallest particles are recovered in a cyclone. Once they are agglomerated they
are sent back to the dryer. Figure 27: Solid
Finally, the resulting product is mixed, standardized and then packaged in BigBags, pots or boxes. Packaging.
4. Quality Aspects
All by-products and waste generated during the process are treated or reused. Solids are incinerated or directly
spread on fields and liquids are treated in sewage treatment plant. DSM Seclin has its own water treatment plant.
This facility allows it to maintain compliance with legal requirements on the disposal of sewage. It was built at
1.5 km from the production plant so it is underground pipes which send effluents to the station.This sewage
treatment plant is expected to treat 4,000 m3 load a day. [4]
In addition to some checks of purity, enzymatic activities are systematically controlled at different steps of
production. The main purpose is to ensure that the final product perfectly fit with the clients' expectations but it
also lets to quickly detect stages which result in a low yield.
Configuration and Optimization of a Process Monitoring Tool 14
In the same way, majority of the production line is done over steril and so clean conditions. Because it is a batch
process, it implies a cleaning of each equipment after each use. That is performed by two different ways both fully
automated [4]:
“Cleaning In Place” Station (CIP): There are three CIP stations, each dedicated to different facilities. The
cleaning solutions are made up of acids, bases and disinfectants. They are successively used and projected
by spray balls.
Included Cleaning: Membrane filters press, dryer, mixer, chromatography and ultrafiltration units have
their own cleaning stations which are actually an integral part of these facilities.
To facilitate the process‟control and so for quality and bussiness aspects, all the process line is monitored
informatically. Indeed, a monitoring and supervising system manages all vessels and certain facilities in order to
control and regulate many parameters, make the transfers, etc. It is performed by several automatons and the main
one is ABB.
Configuration and Optimization of a Process Monitoring Tool 15
PROCESS MONITORING
A. Generalities The overall objective for DSM is to become a reliable supplier of high quality products at competitive prices in all
sectors that it covers. Thus, its strategy revolves around three key drivers:
Growth: Driven by markets and innovation.
An increased presence: Especially in emerging economies.
Operational excellence: Cost optimization and profitability.
In this sense, few years ago, DSM Group introduced on its production plants a standard called MANUFEX
(MANUfacturing EXcellence).
1. MANUFEX
As part of the operational excellence point, MANUFEX aims to optimize performance, improve reliability of the
site and so optimize all steps of a process (production, logistic, business, maintenance...). Indeed, it should assure
a continuous improvement of whole of operations but as well a good opportunity to staff for increasing their
autonomy and their ability to take decisions by themselves. As described on Figure 28, MANUFEX is composed
of several Work Processes relating to the process, maintenance, research and so on. [4]
Figure 28: MANUFEX composition [4].
Three main Work Processes are relevant for the production area:
Manufacturing Execution System (MES)
Operate Plant Normal (OPN)
Asset Utilization (AU)
2. MES Interface
As soon as the customer service of DSM receives a new order of a product made in DSM Seclin, it sends it to the
sales of DSM in Delft, headquarters of DSF. In consequence, the sell order is placed in the list of productions for
Seclin where it will be then automatically processed in a planning order. The inventory is checked and if the
product is no longer present in the stock, a demand for fermentation production is generated and so the planning
order is automatically transformed into a Process Order (PO). [11]
The product is then integrated into the detailed planning. Since it is a batch production, Seclin planners check and
adjust if necessary planning or tanks used in the light of information received by the production area (vessels not
available, equipment failures ...).
OPN-AU Tool
Configuration and Optimization of a Process Monitoring Tool 16
Few days before starting fermentation, production administration initiates the preparation of raw materials needed
for manufacturing and releases the order of preparation which will be sent to MES. Thus the inspection plan for
this product is created: the control laboratory may enter data on current production as soon as the tests are
available. [11]
In consequence, the process order is visible to Operators of each workshop of the factory. Whenever it is
stipulated in the “Code 4” (i.e. procedures that operators have to followed during the production), Operators have
to activate on MES a Process Order (PO) on the equipment they used. It can be comparable to having folders for
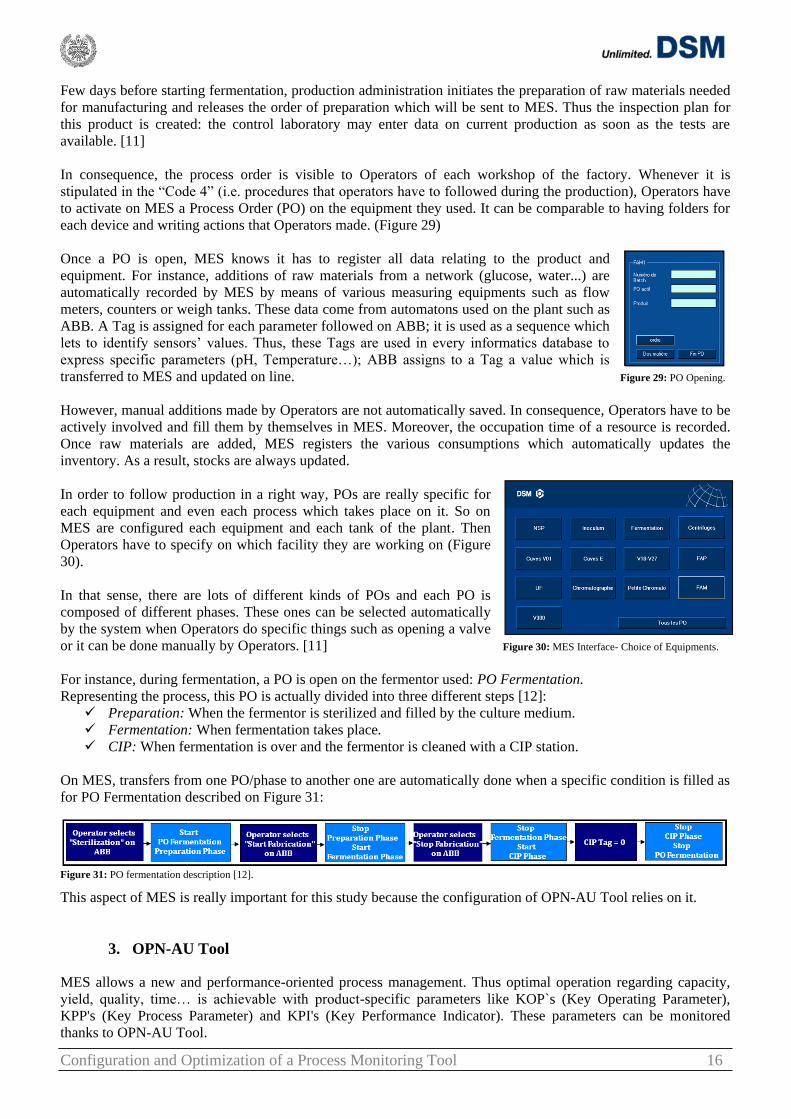
each device and writing actions that Operators made. (Figure 29)
Once a PO is open, MES knows it has to register all data relating to the product and
equipment. For instance, additions of raw materials from a network (glucose, water...) are
automatically recorded by MES by means of various measuring equipments such as flow
meters, counters or weigh tanks. These data come from automatons used on the plant such as
ABB. A Tag is assigned for each parameter followed on ABB; it is used as a sequence which
lets to identify sensors‟ values. Thus, these Tags are used in every informatics database to
express specific parameters (pH, Temperature…); ABB assigns to a Tag a value which is
transferred to MES and updated on line. Figure 29: PO Opening.
However, manual additions made by Operators are not automatically saved. In consequence, Operators have to be
actively involved and fill them by themselves in MES. Moreover, the occupation time of a resource is recorded.
Once raw materials are added, MES registers the various consumptions which automatically updates the
inventory. As a result, stocks are always updated.
In order to follow production in a right way, POs are really specific for
each equipment and even each process which takes place on it. So on
MES are configured each equipment and each tank of the plant. Then
Operators have to specify on which facility they are working on (Figure
30).
In that sense, there are lots of different kinds of POs and each PO is
composed of different phases. These ones can be selected automatically
by the system when Operators do specific things such as opening a valve
or it can be done manually by Operators. [11] Figure 30: MES Interface- Choice of Equipments.
For instance, during fermentation, a PO is open on the fermentor used: PO Fermentation.
Representing the process, this PO is actually divided into three different steps [12]:
Preparation: When the fermentor is sterilized and filled by the culture medium.
Fermentation: When fermentation takes place.
CIP: When fermentation is over and the fermentor is cleaned with a CIP station.
On MES, transfers from one PO/phase to another one are automatically done when a specific condition is filled as
for PO Fermentation described on Figure 31:
Figure 31: PO fermentation description [12].
This aspect of MES is really important for this study because the configuration of OPN-AU Tool relies on it.
3. OPN-AU Tool
MES allows a new and performance-oriented process management. Thus optimal operation regarding capacity,
yield, quality, time… is achievable with product-specific parameters like KOP`s (Key Operating Parameter),
KPP's (Key Process Parameter) and KPI's (Key Performance Indicator). These parameters can be monitored
thanks to OPN-AU Tool.
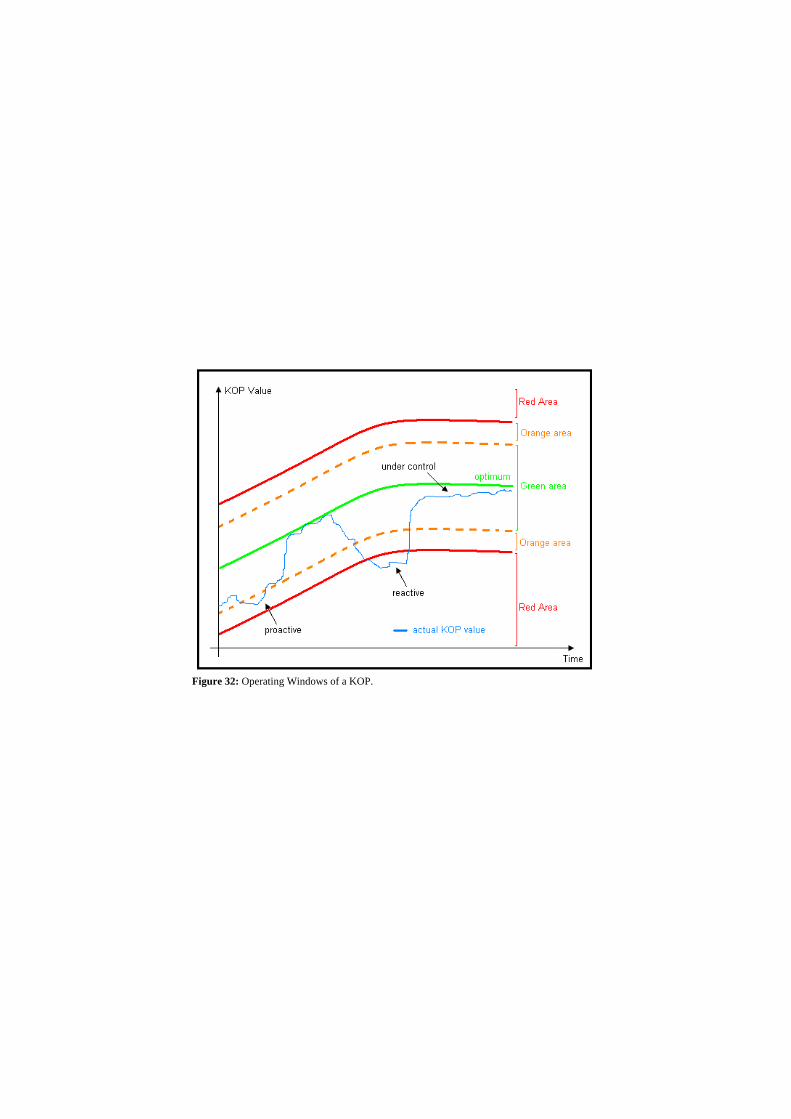
Figure 32: Operating Windows of a KOP.
Configuration and Optimization of a Process Monitoring Tool 17
For the moment, it is composed of two tools:
OPN (Operate Plant Normal): This part of MANUFEX program aims to formalize the
establishment of a process systematic and standardized monitoring and so an optimization of
production steps. This check is done through parameters (Temperature, pH…) followed in real time
which lets to evaluate the production performance. So it lets to identify gaps and excesses in
production operations, to diagnose the cause of the latter and to determine appropriate corrective
actions.
AU (Asset Utilization): Its prior goal is the online comparison of the present performance of the
production with the possibilities of the line and its resources. Hence it is possible to clearly
determine the potential of optimization regarding capacity, plant utilisation and yield. AU Tool is
ready to identify cost drivers and performance killers via the definition of performance targets.
A project is underway in order to add another tool to OPN-AU Tool. It will be called Shift Report Tool and will
be used by operators to do their Shift reports on computers instead of doing it manually on a paper sheet. Several
fields will be directly filled from MES and OPN database which should let to save time, to decrease the number of
human mistakes and so to optimize the productivity of the plant. In consequence, in few months OPN-AU Tool
will become OPN-AU-Shift Tool.
These Tools will be more detailed in the following parts but one can already said that the strength of OPN-AU
Tool is its adaptation to the complexity of the plant including a large flexibility, a batch processing and a very
wide range of products. That goes in the sense of the MANUFEX program‟s purpose: Becoming leaders in
Enzyme production. [4]
B. Process Control
1. OPN Tool
a. Generalities
OPN Tool is used in order to monitor accurately batches. In concrete terms, for each step of each production Key
Operating Parameters (KOP) are defined. These parameters are the ones considered as the most important, most
representative and influential on the performance of a specific operation and quality of final products. Selected in
small numbers, they can be more easily accessible and able to bring greater attention to follow-up. [13]
For instance, at DSM Seclin, pH and temperature are systematically defined as KOPs for all stages of production
because of the enzymes sensibility. However, some others are added depending of the performed operation. The
KOPs listing is decided for all facilities and all different products by Experts and Members of the Scientific
Production Staff (SPS).
Then, as described on Figure 32, each KOP is associated with Operating Windows (OW) which let to compare the
actual value of a KOP to:
An optimum.
A green area where the operation is under control.
An orange area where the operation is experiencing a drift and requires some precautions.
A red area where the operation has a significant drift and requires immediate corrective actions.
The purpose of these OWs is to have a visual tool to quickly detect a problem and be reactive or proactive when a
KOP drift occurs. [13]
When a drift of production happens, some procedures are put in place on OPN Tool to guide Operators who have
to rectify it. These are called corrective action trees and can be considered as a capitalization and a standardization
of best practices to implement when some discrepancies occur on KOPs‟ values.
OPN
Configuration and Optimization of a Process Monitoring Tool 18
These corrective action trees are classified into two categories [13]:
Preventive measures: Implemented when KOP goes into the orange area, they can overcome a
number of checkpoints that may be the source of the noticed gap.
Corrective actions: Implemented when KOP goes into the red area, they limit impacts of a serious
abuse of the manufacturing process.
Annexe III shows an example of a corrective action tree when temperature is higher than what it should be during
the fermentation Phase.
In consequence, as soon as a KOP drift is noticed, an action can be taken by Operators without wasting time by
directly calling Shift Leaders or Experts. It assures a high process control and a fast reaction capacity.
b. Advantages
OPN Tool improves the process control in different ways. Indeed, it lets to:
Insure a more efficient production. Get a better products‟ quality. Standardize procedures to control production‟s steps.
Thus, it generates benefits both on a human and a technical aspects.
Human aspect
OPN Tool is a good way to empower Operators. It limits the number of elements to monitor so Users can be more
reactive; they can anticipate problems and try to fix them by themselves thanks to the corrective action trees. Thus
they have a higher force decision making and a wider field of action. They have more control on their operations
and they can actively participate in problem solving and share their ideas to assure a continuous improvement.
[14]
In consequence, more than implying a better monitoring of the production line, OPN-AU Tool lets Production
Staff to take initiatives and so feel more concerned by the running of the production.
Technical aspect
An optimization of the production can be performed thanks to OPN Tool because it lets to do an overall
assessment of each operation and so to analyze and define steps which present problems or abnormal low results.
This feature is called: Scoring.
When Experts and SPS members defined with Administrator the KOPs listing for an Enzyme A on given
equipment, they confer a weight factor to each KOP proportional to its weight of its importance along the process.
Let‟s take the example of Enzyme A through the inoculum phase process where KOPs are pH, temperature and
feed rate. The product is more sensitive to temperature than to pH and feed rate. So the weight factor assigned to
temperature is higher than the ones set for other KOPs (Table 1).
Table 1: Weight factors of KOPs on a inoculum for Enzyme A.
KOP Weight factor
pH 10
Feed Rate 10
Temperature 20
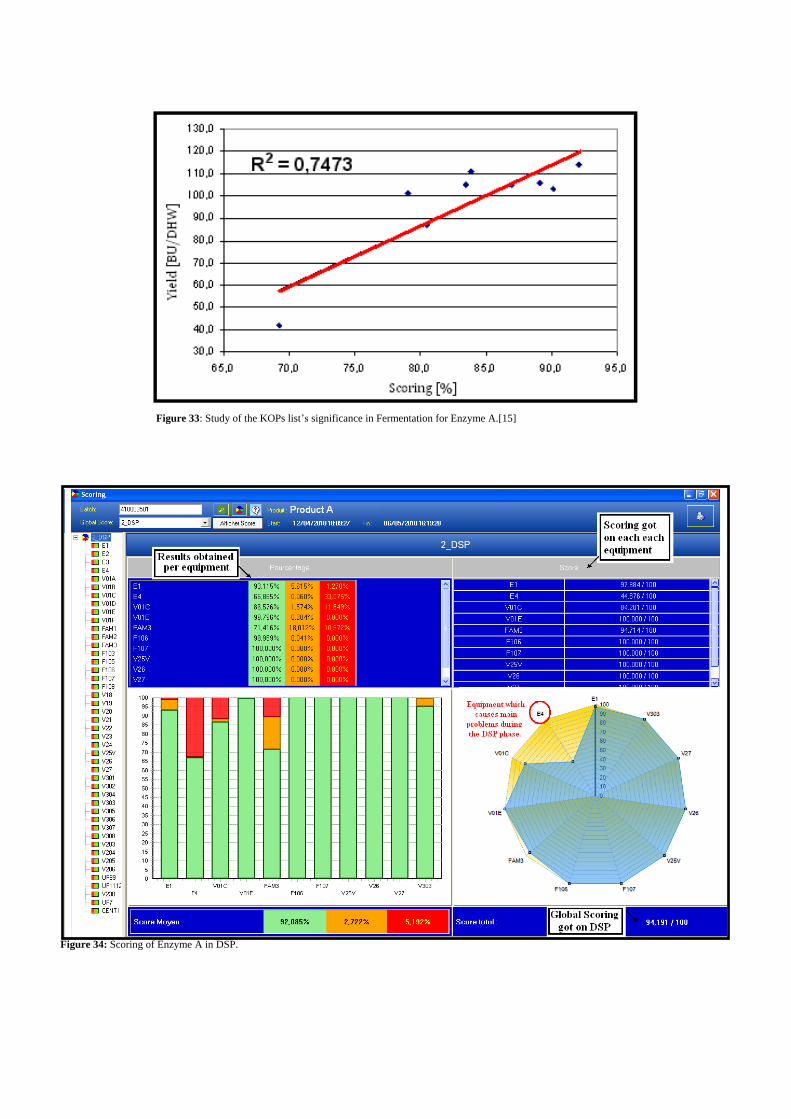
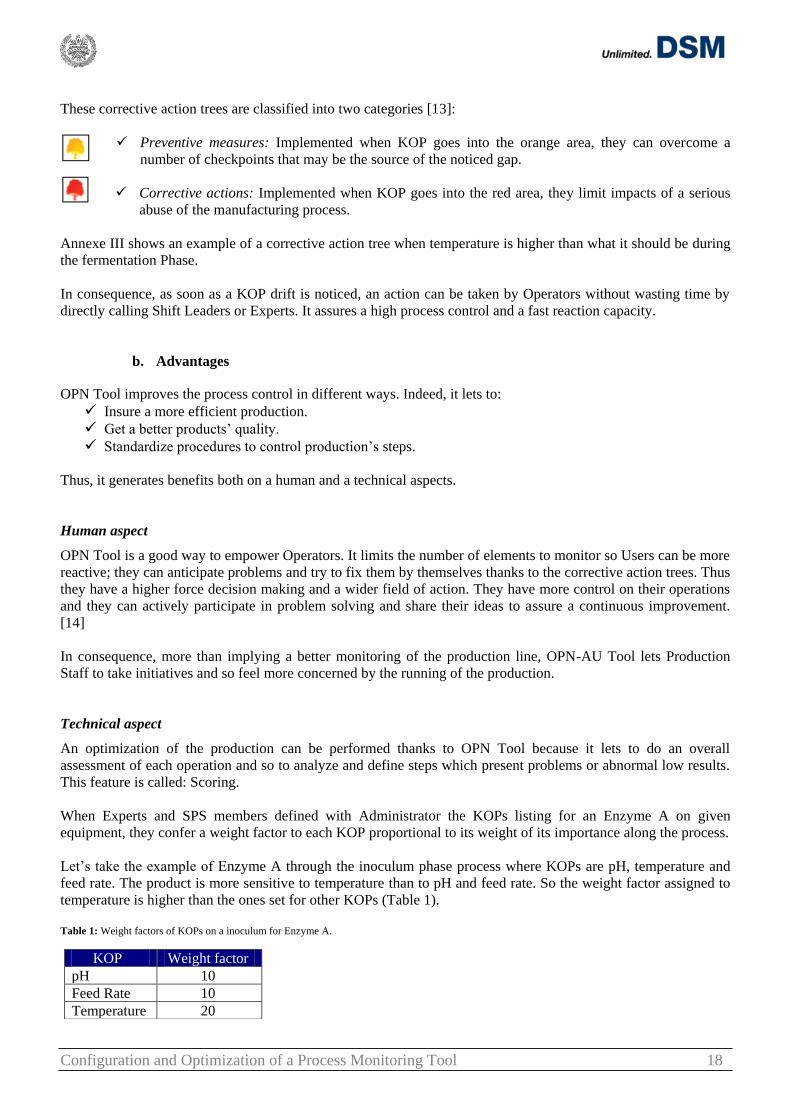
Figure 33: Study of the KOPs list‟s significance in Fermentation for Enzyme A.[15]
Figure 34: Scoring of Enzyme A in DSP.
Configuration and Optimization of a Process Monitoring Tool 19
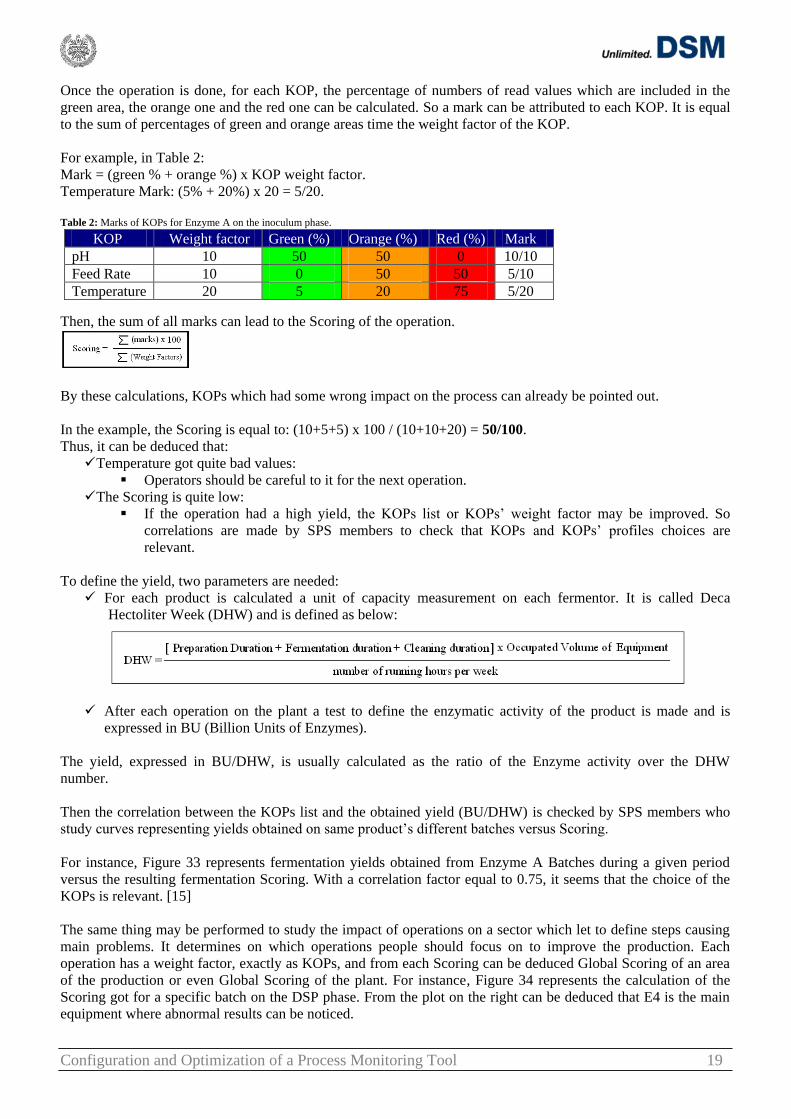
Once the operation is done, for each KOP, the percentage of numbers of read values which are included in the
green area, the orange one and the red one can be calculated. So a mark can be attributed to each KOP. It is equal
to the sum of percentages of green and orange areas time the weight factor of the KOP.
For example, in Table 2:
Mark = (green % + orange %) x KOP weight factor.
Temperature Mark: (5% + 20%) x 20 = 5/20.
Table 2: Marks of KOPs for Enzyme A on the inoculum phase.
Then, the sum of all marks can lead to the Scoring of the operation.
By these calculations, KOPs which had some wrong impact on the process can already be pointed out.
In the example, the Scoring is equal to: (10+5+5) x 100 / (10+10+20) = 50/100.
Thus, it can be deduced that:
Temperature got quite bad values:
Operators should be careful to it for the next operation.
The Scoring is quite low:
If the operation had a high yield, the KOPs list or KOPs‟ weight factor may be improved. So
correlations are made by SPS members to check that KOPs and KOPs‟ profiles choices are
relevant.
To define the yield, two parameters are needed:
For each product is calculated a unit of capacity measurement on each fermentor. It is called Deca
Hectoliter Week (DHW) and is defined as below:
After each operation on the plant a test to define the enzymatic activity of the product is made and is
expressed in BU (Billion Units of Enzymes).
The yield, expressed in BU/DHW, is usually calculated as the ratio of the Enzyme activity over the DHW
number.
Then the correlation between the KOPs list and the obtained yield (BU/DHW) is checked by SPS members who
study curves representing yields obtained on same product‟s different batches versus Scoring.
For instance, Figure 33 represents fermentation yields obtained from Enzyme A Batches during a given period
versus the resulting fermentation Scoring. With a correlation factor equal to 0.75, it seems that the choice of the
KOPs is relevant. [15]
The same thing may be performed to study the impact of operations on a sector which let to define steps causing
main problems. It determines on which operations people should focus on to improve the production. Each
operation has a weight factor, exactly as KOPs, and from each Scoring can be deduced Global Scoring of an area
of the production or even Global Scoring of the plant. For instance, Figure 34 represents the calculation of the
Scoring got for a specific batch on the DSP phase. From the plot on the right can be deduced that E4 is the main
equipment where abnormal results can be noticed.
KOP Weight factor Green (%) Orange (%) Red (%) Mark
pH 10 50 50 0 10/10
Feed Rate 10 0 50 50 5/10
Temperature 20 5 20 75 5/20
Configuration and Optimization of a Process Monitoring Tool 20
In consequence, more than a monitoring Tool, OPN lets Operators to be more independent and autonomous and
can result in a real improvement of the production thanks to the Scoring studies. OPN Tool allows Managers and
Operational Experts to have an analysis tool more efficient to identify weaknesses and failing facilities that imply
abnormal low results. Thus, they can more easily point out elements which optimize the production control and so
determine rapidly the relevant research areas. In one word, this Tool makes possible to quickly define the limiting
steps of production which can be improved.
2. AU Tool
a. Generalities
AU Tool aims to determine the maximum production capacity that the plant can obtain and compare it to each
specific performance actually achieved.
Three different studies can be performed on AU Tool to calculate Opportunity Gaps (OGAP) between real
measurements obtained on the plant and standards defined by Business Units or Experts[13]:
AU Time
AU Result
AU Occupation
AU Time
Such as parameters defined as KOPs on OPN Tool, are defined standards which can be considered as Key
Performance Indicators (KPI):
Delay KPI: It determines the delay between the actual start of an operation and the moment when it should
have started according to the planning.
Duration KPI: It compares standard duration of the operation with the real time that has been needed.
They are configured exactly in the same way than KOPs on OPN Tool (per product and per equipment). As
shown in Table 3, these two KPIs (expressed in minutes), are then multiplied by the cost of one minute of the
equipment‟s occupation in order to define OGAPs. Thus, AU Time is a good way to see the cost of possible
delays on different operations and so the potential bottlenecks of the production line. [13]
Table 3: AU Time example.
AU Result
This function of AU Tool aims to study possible OGAPs regarding yields of each operation on the plant. In
concrete terms, the actual yield is compared with the Maximum Proven Capability (MPC). This parameter is a
standard defined as the third best yield already obtained during the operation. So its value is really variable. [13]
Table 4: Study of a yield.
The Gap is then transformed in a DHW Gab by multiplying it with the DHW number related to the enzyme and
equipment used. Finally, as done in the AU Time, it is multiplied with the cost of 1 DHW and it gets the OGAP.
Equipment-Product Scheduled Start Real Start 1 min Cost OGAP Delay
Inoculum-Enzyme A 8:00 am 9:00 am 50 €/min 300 €
Equipment-Product Standard Duration Real Duration 1 min Cost OGAP Duration
Inoculum-Enzyme A 100 h 150 h 50 €/min 150 k€
Equipment-Product Yield MPC Gap
Inoculum-Enzyme A 75 BU/DHW 80 BU/DHW (80-75)x80/100 = 4 %
Configuration and Optimization of a Process Monitoring Tool 21
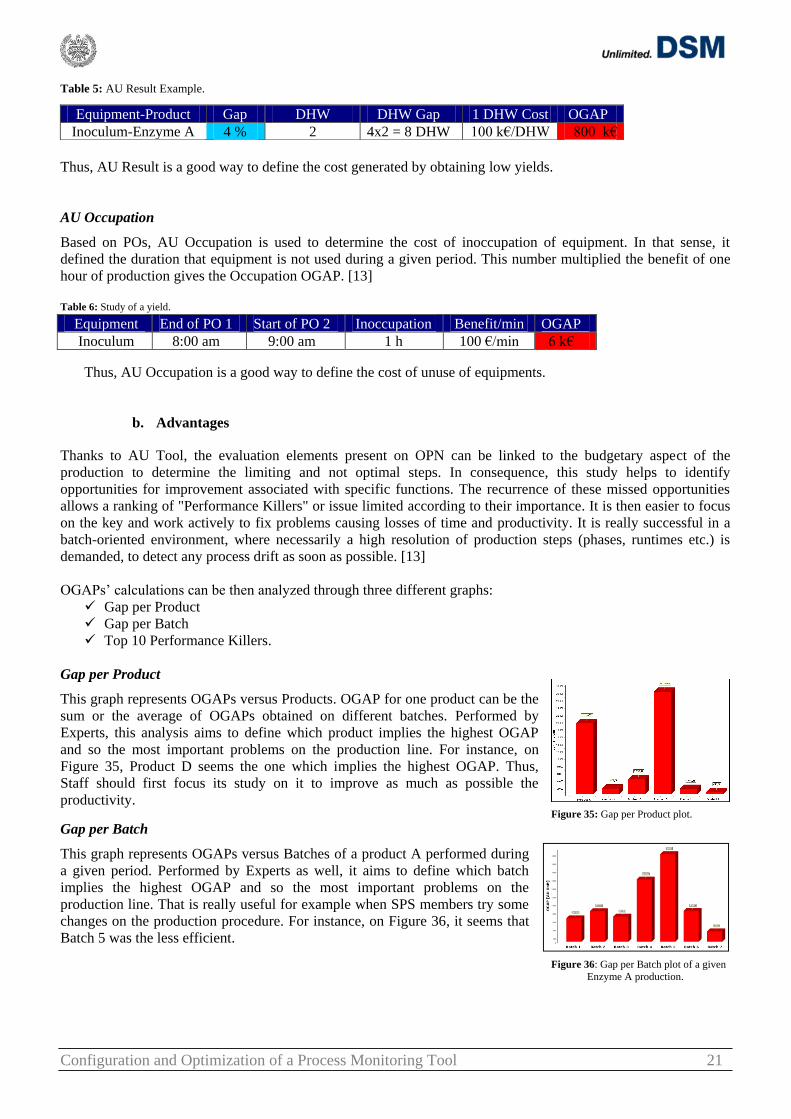
Table 5: AU Result Example.
Thus, AU Result is a good way to define the cost generated by obtaining low yields.
AU Occupation
Based on POs, AU Occupation is used to determine the cost of inoccupation of equipment. In that sense, it
defined the duration that equipment is not used during a given period. This number multiplied the benefit of one
hour of production gives the Occupation OGAP. [13]
Table 6: Study of a yield.
Thus, AU Occupation is a good way to define the cost of unuse of equipments.
b. Advantages
Thanks to AU Tool, the evaluation elements present on OPN can be linked to the budgetary aspect of the
production to determine the limiting and not optimal steps. In consequence, this study helps to identify
opportunities for improvement associated with specific functions. The recurrence of these missed opportunities
allows a ranking of "Performance Killers" or issue limited according to their importance. It is then easier to focus
on the key and work actively to fix problems causing losses of time and productivity. It is really successful in a
batch-oriented environment, where necessarily a high resolution of production steps (phases, runtimes etc.) is
demanded, to detect any process drift as soon as possible. [13]
OGAPs‟ calculations can be then analyzed through three different graphs:
Gap per Product
Gap per Batch
Top 10 Performance Killers.
Gap per Product
This graph represents OGAPs versus Products. OGAP for one product can be the
sum or the average of OGAPs obtained on different batches. Performed by
Experts, this analysis aims to define which product implies the highest OGAP
and so the most important problems on the production line. For instance, on
Figure 35, Product D seems the one which implies the highest OGAP. Thus,
Staff should first focus its study on it to improve as much as possible the
productivity. Figure 35: Gap per Product plot.
Gap per Batch
This graph represents OGAPs versus Batches of a product A performed during
a given period. Performed by Experts as well, it aims to define which batch
implies the highest OGAP and so the most important problems on the
production line. That is really useful for example when SPS members try some
changes on the production procedure. For instance, on Figure 36, it seems that
Batch 5 was the less efficient.
Figure 36: Gap per Batch plot of a given
Enzyme A production.
Equipment-Product Gap DHW DHW Gap 1 DHW Cost OGAP
Inoculum-Enzyme A 4 % 2 4x2 = 8 DHW 100 k€/DHW 800 k€
Equipment End of PO 1 Start of PO 2 Inoccupation Benefit/min OGAP
Inoculum 8:00 am 9:00 am 1 h 100 €/min 6 k€
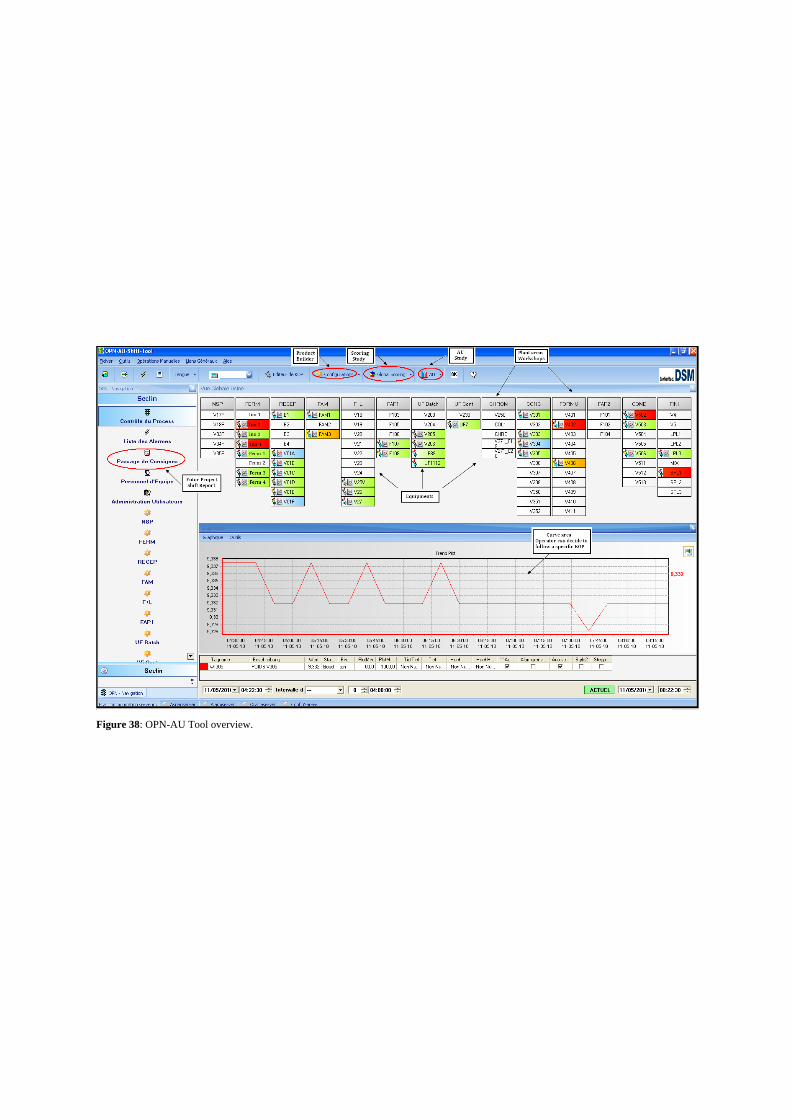
Figure 38: OPN-AU Tool overview.
Configuration and Optimization of a Process Monitoring Tool 22
TOP 10 Performance Killers
Some standards are defined according to OGAPs‟ values got from AU Time, AU Result or AU Occupation Tools:
0 € < OGAP < 7.000 €: Ok.
7.000 € < OGAP < 10.000 €: Acceptable.
10.000 € < OGAP: Critical.
When it is critical, Users (either Operators or Experts) have to explain why a so high OGAP has been obtained. In
that purpose, they have to associate to the OGAP attributions defined on MANUFEX Program. There are four
levels of MANUFEX attributions. The first level is composed of:
Business: No demand
Extern: Independent of DSM (delay of the raw material supplier)
Maintenance: Due to equipments
Operation: Due to operations of production.
Then attributions from the following levels are used to go more in details. For instance, an OGAP could be
explained by:
Level 1: Maintenance
Level 2: Equipment Breakdown
Level 3: Vessel A
Once these attributions are defined, a graph OGAPs versus MANUFEX
Attributions can be plotted. In this way, performance killers are defined on the
production line. For instance, on Figure 37, efforts should be focused on
Maintenance until this Attribution looses its status of Performance Killer number
one. That can be done as well with Attributions Level 2 or 3 in order to find
equipments which meet problems on the line. This method is a real continuous
improvement one. Figure 37: TOP 10 Performance Killers Level 1.
Thus, AU Tool is useful in order to determine main problems on the production line and even its bottlenecks. That
lets to oriented research area and Experts‟ studies in a way to obtain a higher productivity with costs as low as
possible.
3. Utilization and Configuration of OPN-AU Tool
OPN-AU Tool is a really powerful Tool which can allow real improvements in terms of productivity, control and
reactivity. In that sense, it has to be ease for use and fast to configure.
a. Utilization
In order to assure a fast detection of problems, the OPN-AU Tool main window represents the overview of all the
plant. The main screen is divided into various workshops representing each area and each workshop consists of
equipments, modelled by small boxes (rectangles), which belong to the area (Figure 38).
Basic knowledge
Initially, all boxes are white. As soon as a product/equipment combination is activated by opening a PO on MES,
they become colourful and the tracking of defined KOPs starts. (The colour code will be explained further in the
report). All Seclin plan can so be monitored in an easy way.
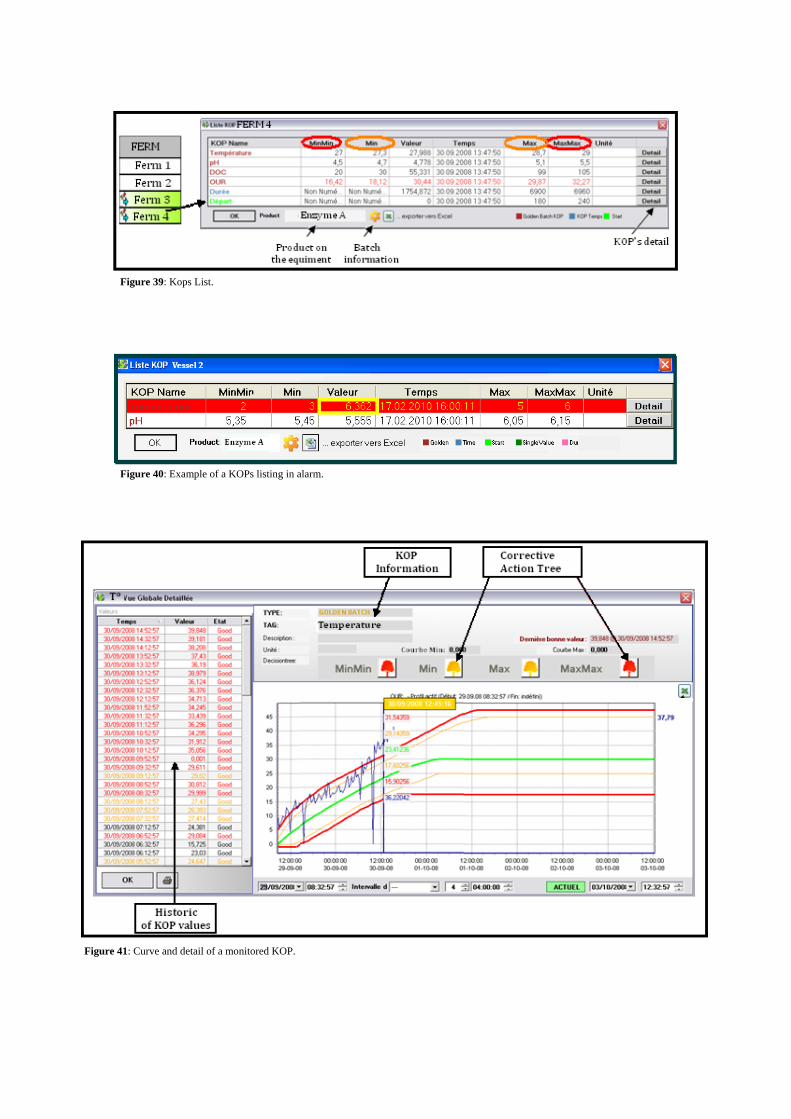
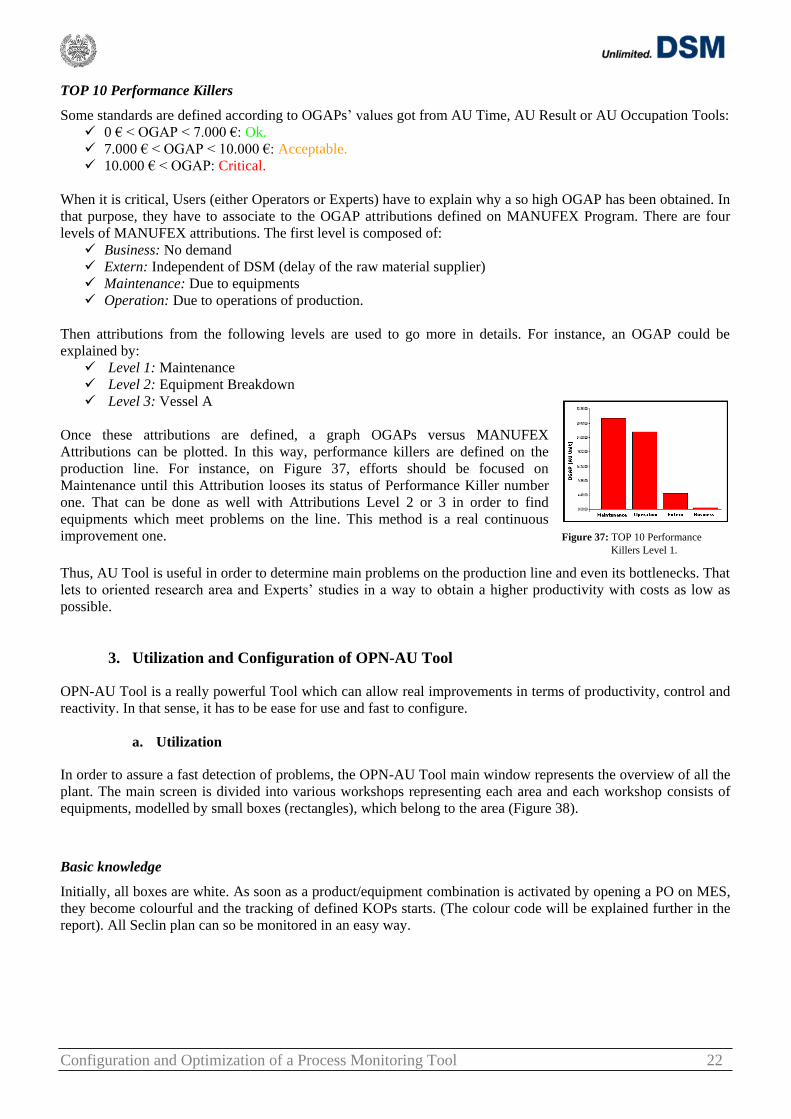
Figure 39: Kops List.
Figure 40: Example of a KOPs listing in alarm.
Figure 41: Curve and detail of a monitored KOP.
Configuration and Optimization of a Process Monitoring Tool 23
The equipments‟ boxes have got many features and the most important one is by clicking on the box, the
monitored KOPs list appears. It lets Operators to get lots of information about the operation which is running
(Figure 39):
Product currently on the equipment is precised on the bottom.
Information about the operation such as batch Number, Product and activated PO /Phase, is available by
clicking on the yellow wheel.
A colour code is made to specify the kind of KOP monitored:
Brown: Process parameters (temperature, pH...) called Golden KOP – OPN Tool
Blue: Duration called Time KOP– AU Tool
Green: Start Delay called Start KOP– AU Tool
The current values of KOPs and current KOPs profiles‟ values (red and orange border areas) are
displayed:
MinMin = Low red border area
Min = Low orange border area
Valeur = Current KOP value
Max = High orange border area
MaxMax = High red border area
An access to the KOP curve is possible by clicking on “Detail”. It gives access as well to corrective
action trees if needed.
Reaction and correction
When a PO is activated on equipment, the corresponding box on OPN-AU Tool window becomes colourful by
respecting a special code:
Green: All KOPs are in their green area.
Orange: At least one KOP is in its orange area.
Red: At least one KOP is in its red area.
When an equipment box becomes orange or red, it is blinking and it is considered as an alarm. When
Operator notice an alarm, they have to follow a specific procedure:
1. Click on the concerned equipment‟s box. The KOPs list appears and the line of the wrong KOP is
blinking in orange/red (Figure 40).
2. Click on the “Detail” button of the KOP which has a critical state. Its curve, its values and its
corresponding corrective action trees appear (Figure 41).
3. Analyze the problem on the KOP curve.
4. Read the assigned corrective decision tree (Annexe III) which guides Operators to solve the problem.
5. Fix the problem.
6. Confirm the alarm.
Once an alarm is confirmed, the box does not blink anymore, but it keeps its orange/red value until the KOP
comes back to the green area.
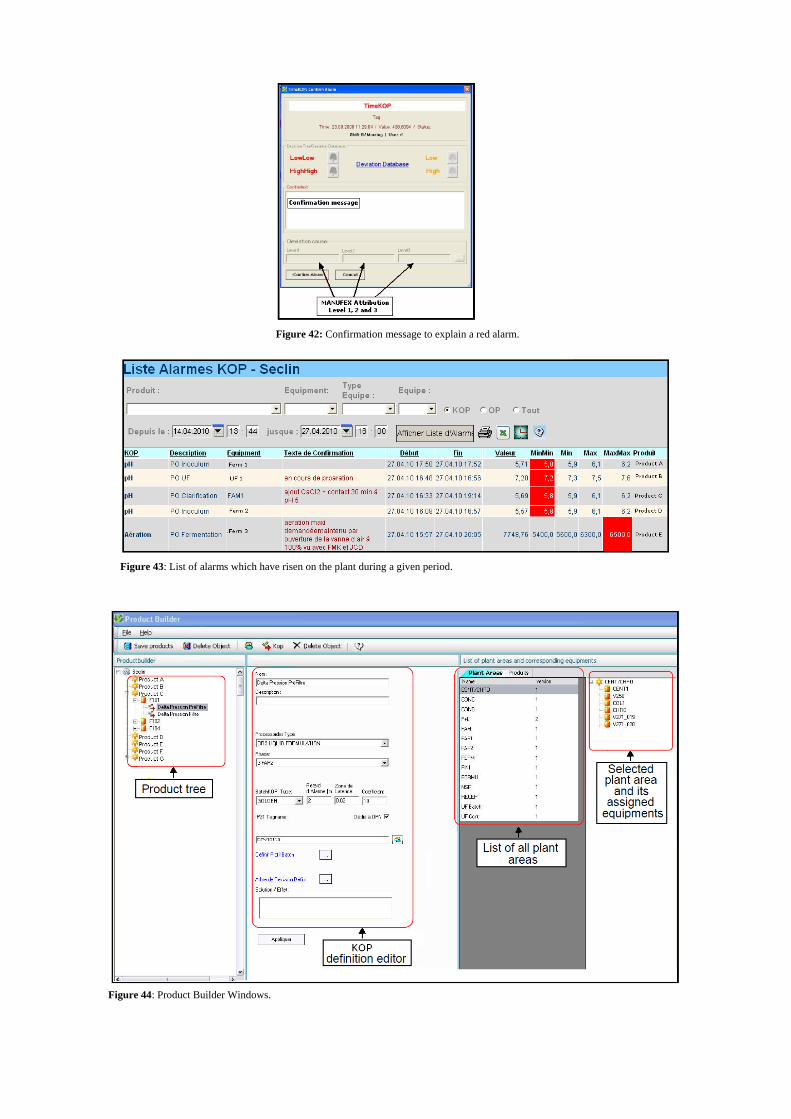
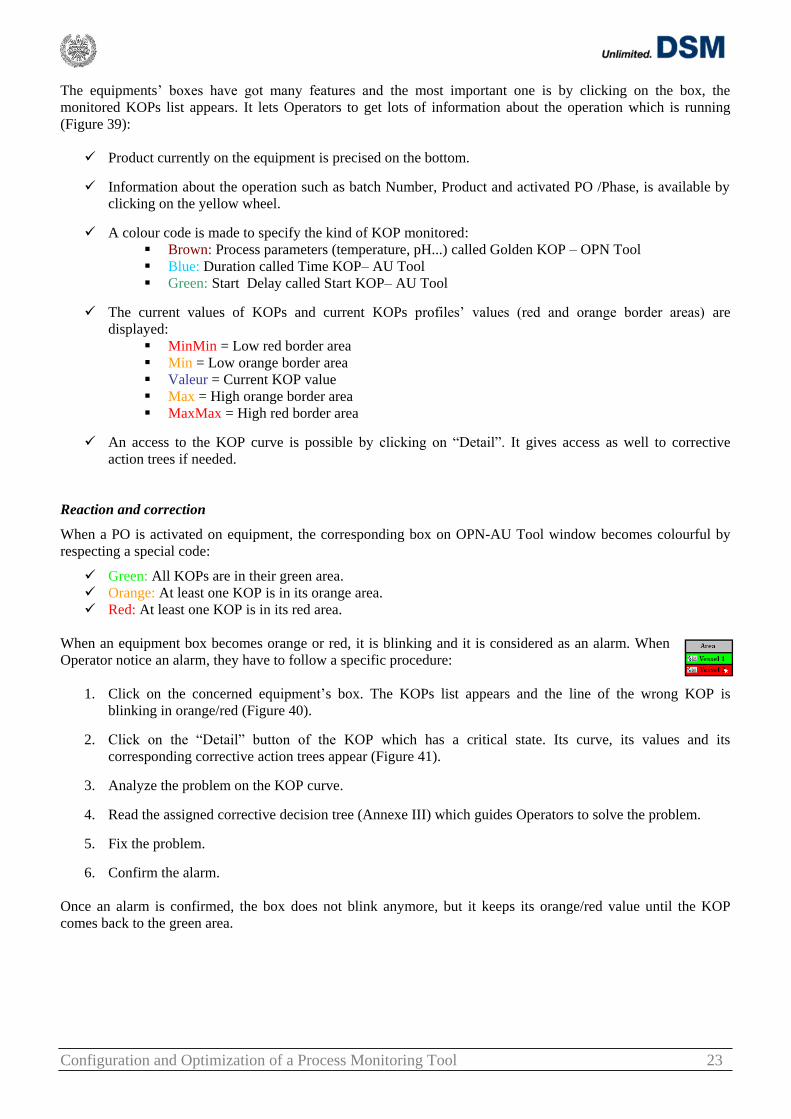
Figure 42: Confirmation message to explain a red alarm.
Figure 43: List of alarms which have risen on the plant during a given period.
Figure 44: Product Builder Windows.
Configuration and Optimization of a Process Monitoring Tool 24
Two different ways are possible to confirm an alarm depending on its colour:
Orange alarms: Operators have to double click on the KOP line in the KOPs list.
Red alarms: Operators have to double click on the KOP line in the KOPs list and fill a confirmation
message to explain the alarm and the reaction he had to fix the problem. Moreover he has to assign
MANUFEX Attributions to this issue (Figure 42) if it is a KOP relevant for AU Tool.
When red alarms are confirmed, they are stored in an alarms listing and MANUFEX Attributions will be used in
the AU Tool (Figure 43). It sums up all information about alarms which happened during a given period (KOP,
value, Product, Equipment, Confirmation message). It is useful afterwards for pointing out problems which have
to be fixed for next batches.
Thus, OPN-AU Tool is really visual and its use results in an easy monitoring of significant parameters on the
production line. However, it is possible only under the condition of a good configuration of KOPs.
b. Configuration
Configuration is mainly performed on a part of the Tool called Product Builder. Only users defined as
Administrator can have access to it. Since KOPs in Seclin are product-equipment dependent, it is needed to define
KOPs for each product/equipment combination. That is why it is important Product Builder enables
Administrators to do this task in a convenient way.
Figure 44 represents Product Builder, divided into four different parts [14]:
Product Tree: It is composed of the list of products made in DSM Seclin. It has to be noticed that a same
enzyme, on two different steps of the production is considered as two different products (e.g. “Enzyme A
Inoculum” and “Enzyme A Fermentation” are not the same product in Product Builder). This area allows
assigning equipments and KOPs to products.
KOP definition Editor: It lets to define KOPs and their profiles.
List of all plant areas: It contains all areas of the Seclin plant. It was defined during the creation of the
OPN-AU Tool but it can still be modified via Plant area Builder in OPN Tool.
List of equipments assigned to the selected plant area: It shows equipments included in each plant area. It
can be modified via the MES Database related to equipments.
Product Tree
The products list automatically comes from a MES Database and is updated every six hours. To configure KOPs,
first, equipments where the product can go through, have to be assigned in Product Tree to the right Product.
To add a new equipment to a product, it has to be selected in its plant area and has to be
dragged and dropped from the equipment list to the product. Then the equipment appears
under the product.(Figure 45)
Figure 45: Equipment
assignment.
Once the equipment is added, its weight factor used in the Global Scoring
study is set in the Editor part (Figure 46).
Figure 46: Equipment Editor.
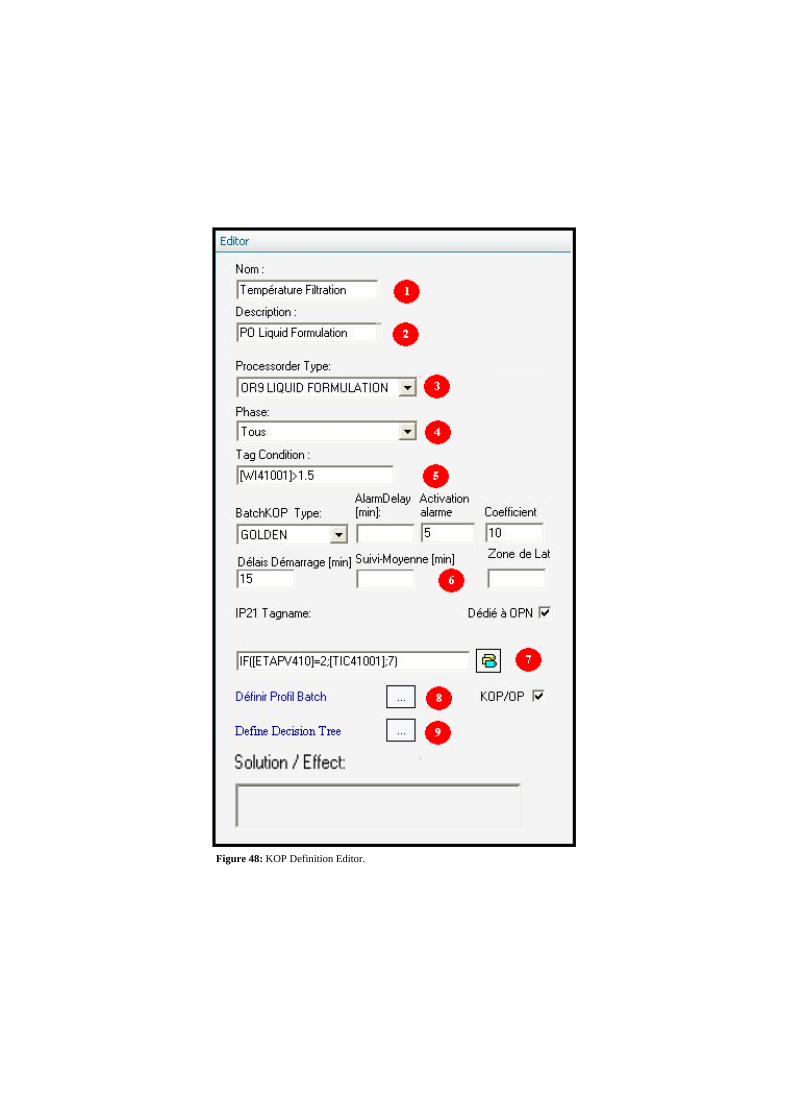
Figure 48: KOP Definition Editor.
Configuration and Optimization of a Process Monitoring Tool 25
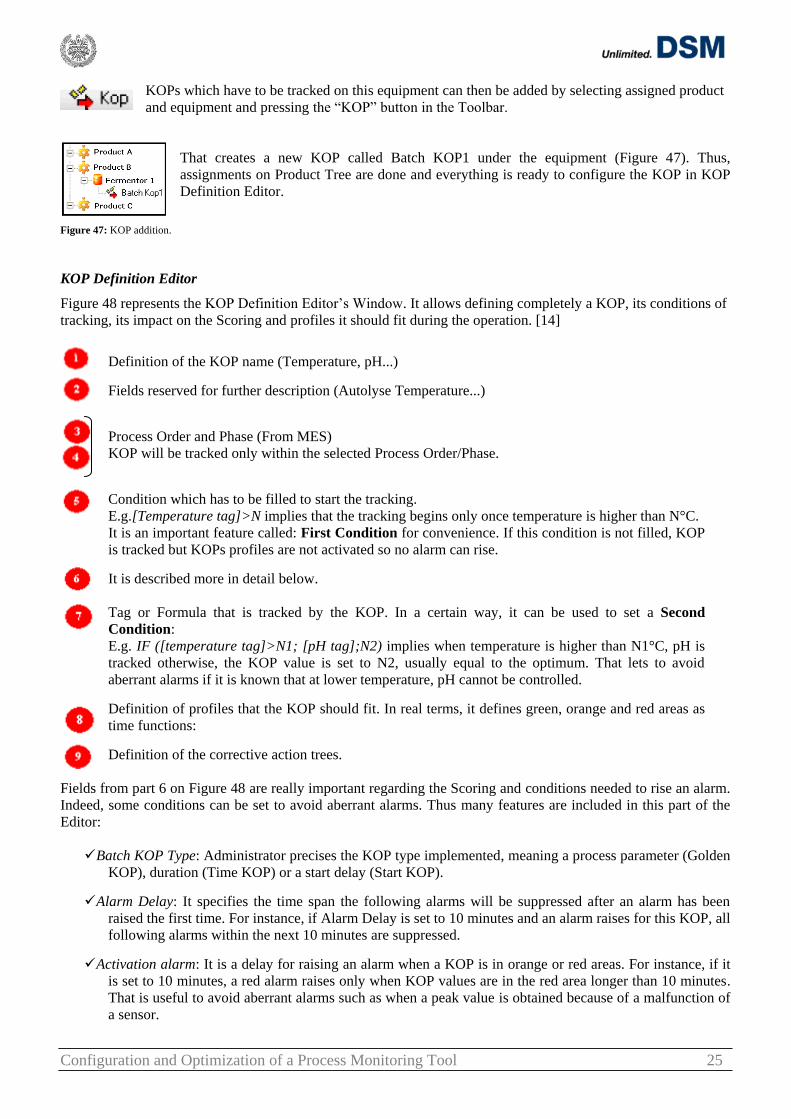
KOPs which have to be tracked on this equipment can then be added by selecting assigned product
and equipment and pressing the “KOP” button in the Toolbar.
That creates a new KOP called Batch KOP1 under the equipment (Figure 47). Thus,
assignments on Product Tree are done and everything is ready to configure the KOP in KOP
Definition Editor.
Figure 47: KOP addition.
KOP Definition Editor
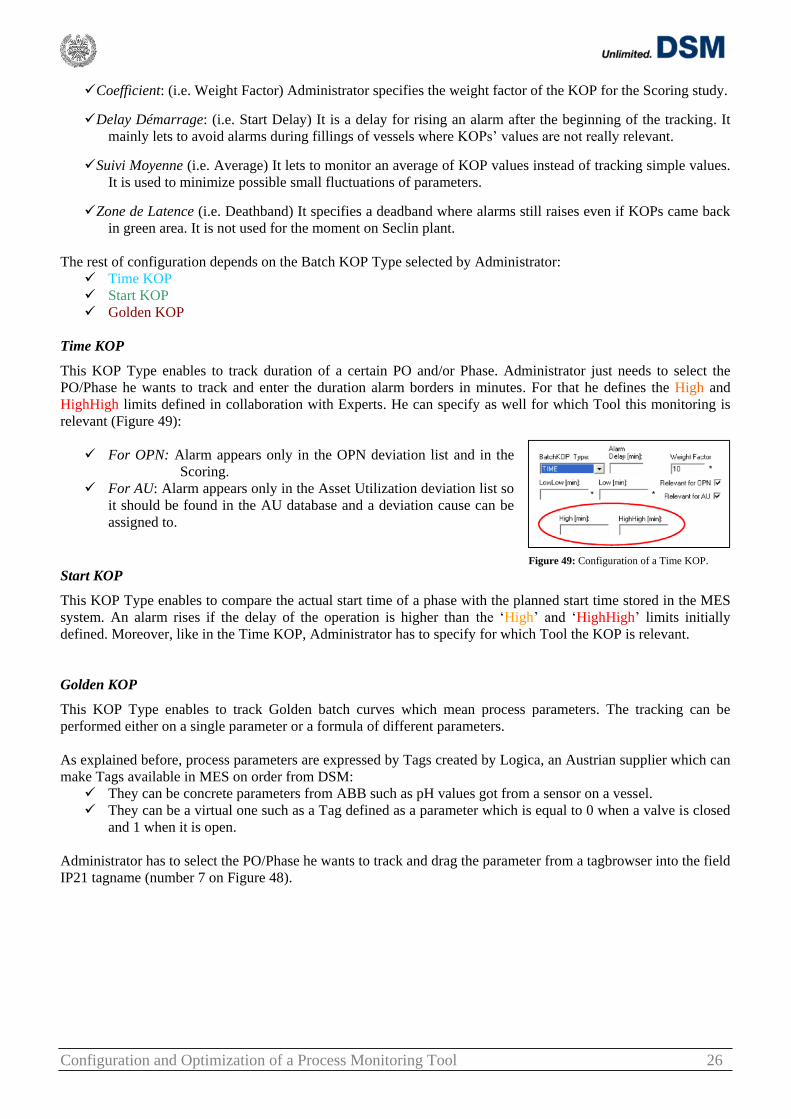
Figure 48 represents the KOP Definition Editor‟s Window. It allows defining completely a KOP, its conditions of
tracking, its impact on the Scoring and profiles it should fit during the operation. [14]
Definition of the KOP name (Temperature, pH...)
Fields reserved for further description (Autolyse Temperature...)
Process Order and Phase (From MES)
KOP will be tracked only within the selected Process Order/Phase.
Condition which has to be filled to start the tracking.
E.g.[Temperature tag]>N implies that the tracking begins only once temperature is higher than N°C.
It is an important feature called: First Condition for convenience. If this condition is not filled, KOP
is tracked but KOPs profiles are not activated so no alarm can rise.
It is described more in detail below.
Tag or Formula that is tracked by the KOP. In a certain way, it can be used to set a Second
Condition:
E.g. IF ([temperature tag]>N1; [pH tag];N2) implies when temperature is higher than N1°C, pH is
tracked otherwise, the KOP value is set to N2, usually equal to the optimum. That lets to avoid
aberrant alarms if it is known that at lower temperature, pH cannot be controlled.
Definition of profiles that the KOP should fit. In real terms, it defines green, orange and red areas as
time functions:
Definition of the corrective action trees.
Fields from part 6 on Figure 48 are really important regarding the Scoring and conditions needed to rise an alarm.
Indeed, some conditions can be set to avoid aberrant alarms. Thus many features are included in this part of the
Editor:
Batch KOP Type: Administrator precises the KOP type implemented, meaning a process parameter (Golden
KOP), duration (Time KOP) or a start delay (Start KOP).
Alarm Delay: It specifies the time span the following alarms will be suppressed after an alarm has been
raised the first time. For instance, if Alarm Delay is set to 10 minutes and an alarm raises for this KOP, all
following alarms within the next 10 minutes are suppressed.
Activation alarm: It is a delay for raising an alarm when a KOP is in orange or red areas. For instance, if it
is set to 10 minutes, a red alarm raises only when KOP values are in the red area longer than 10 minutes.
That is useful to avoid aberrant alarms such as when a peak value is obtained because of a malfunction of
a sensor.
Configuration and Optimization of a Process Monitoring Tool 26
Coefficient: (i.e. Weight Factor) Administrator specifies the weight factor of the KOP for the Scoring study.
Delay Démarrage: (i.e. Start Delay) It is a delay for rising an alarm after the beginning of the tracking. It
mainly lets to avoid alarms during fillings of vessels where KOPs‟ values are not really relevant.
Suivi Moyenne (i.e. Average) It lets to monitor an average of KOP values instead of tracking simple values.
It is used to minimize possible small fluctuations of parameters.
Zone de Latence (i.e. Deathband) It specifies a deadband where alarms still raises even if KOPs came back
in green area. It is not used for the moment on Seclin plant.
The rest of configuration depends on the Batch KOP Type selected by Administrator:
Time KOP
Start KOP
Golden KOP
Time KOP
This KOP Type enables to track duration of a certain PO and/or Phase. Administrator just needs to select the
PO/Phase he wants to track and enter the duration alarm borders in minutes. For that he defines the High and
HighHigh limits defined in collaboration with Experts. He can specify as well for which Tool this monitoring is
relevant (Figure 49):
For OPN: Alarm appears only in the OPN deviation list and in the
Scoring.
For AU: Alarm appears only in the Asset Utilization deviation list so
it should be found in the AU database and a deviation cause can be
assigned to.
Figure 49: Configuration of a Time KOP.
Start KOP
This KOP Type enables to compare the actual start time of a phase with the planned start time stored in the MES
system. An alarm rises if the delay of the operation is higher than the „High‟ and „HighHigh‟ limits initially
defined. Moreover, like in the Time KOP, Administrator has to specify for which Tool the KOP is relevant.
Golden KOP
This KOP Type enables to track Golden batch curves which mean process parameters. The tracking can be
performed either on a single parameter or a formula of different parameters.
As explained before, process parameters are expressed by Tags created by Logica, an Austrian supplier which can
make Tags available in MES on order from DSM:
They can be concrete parameters from ABB such as pH values got from a sensor on a vessel.
They can be a virtual one such as a Tag defined as a parameter which is equal to 0 when a valve is closed
and 1 when it is open.
Administrator has to select the PO/Phase he wants to track and drag the parameter from a tagbrowser into the field
IP21 tagname (number 7 on Figure 48).
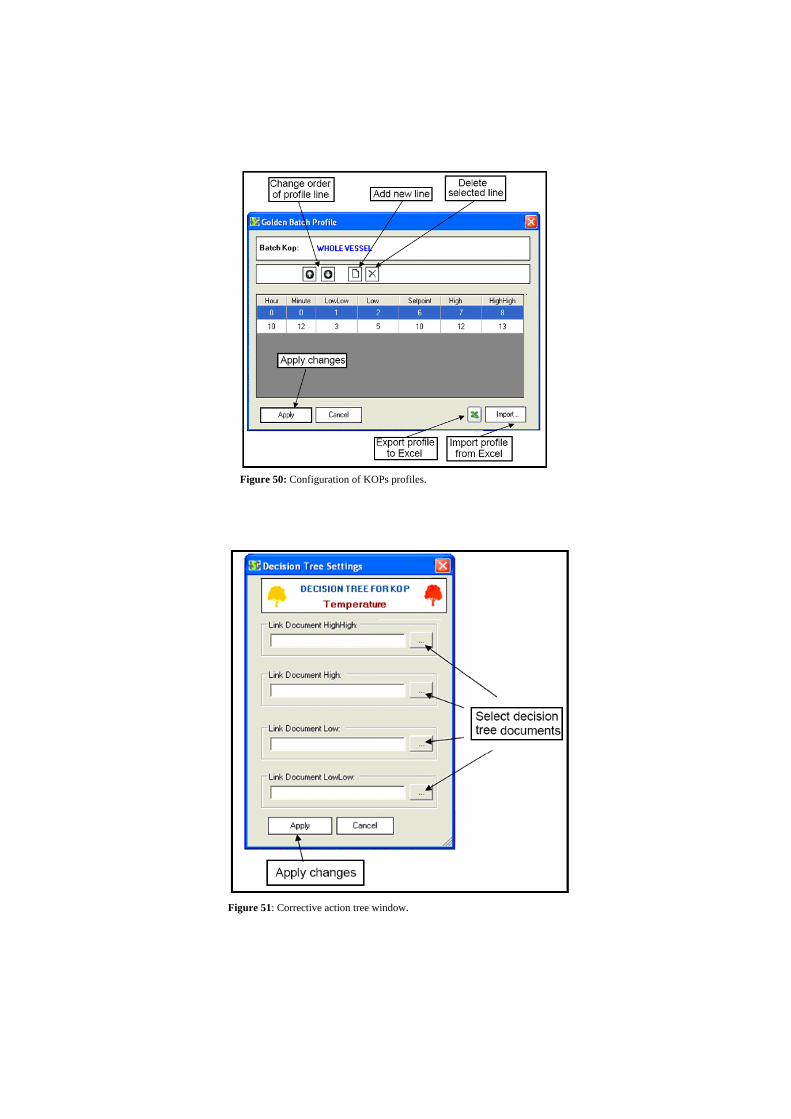
Figure 50: Configuration of KOPs profiles.
Figure 51: Corrective action tree window.
Configuration and Optimization of a Process Monitoring Tool 27
Two other significant fields have to be filled:
Definition of Batch profiles: It is done by clicking on ”Define profile” button (number 8 on Figure 48).
Administrator is then navigated to the profile definition window (Figure 50). In real terms, he defines
values of green, orange and red border areas versus time. It is possible to import profiles from Excel. It
allows a real saving of time because curves can be studied on Excel and then exported directly to OPN-
AU Tool. Some rules have to be respected during this setting:
At least two lines for each profile have to be defined (a starting line at hour 0 and a end line of
the profile)
Of course, values should be set such as LowLow ≤ Low ≤ Optimum ≤ High≤ HighHigh.
Definition of corrective action trees: It is done by clicking on ”Decision Tree” button from KOP
definition Editor (number 9 on Figure 48). Actually they are downloaded from Excel files previously
made by Administrator.(Figure 51). So it lets to add a link to the Tree stored on the network.
Thus, Administrator is able to define quite precisely what Production Staff want to monitor and the way that they
want alarms to be raised. It allows to have an efficient Tool for controlling the production. However, a perfect
configuration is needed to assure a good monitoring and benefits from it.
Configuration and Optimization of a Process Monitoring Tool 28
MASTER’S THESIS’ STUDY
With OPN-AU Tool, DSM Seclin has a powerful tool, unique in the group, to monitor its production line. It is
now a reference on a worldly scale. It has recently even been awarded within the group by a DSM Award for
Excellence (DFS Exceptional Achievement Award) in June 2009. However; some improvements are still needed.
Indeed, because of the diversity of products made on the plant, its configuration is not finished yet and Operators,
Experts and SPS members have noticed some problems in what is already done. That resulted in many aberrant
alarms which have generated a loss of reliability regarding the Tool. So Operators were less careful to alarms
thinking that they were mainly not relevant. In consequence, the company decided to hire a student in order to
increase the OPN-AU‟s efficiency and so improve the process monitoring.
A. Mission Description 1. Initial State
A batch production implies process conditions depending on products. KOPs are so product and equipment
dependent which results in a need of an accurate configuration of OPN-AU Tool. But it is quite time consuming
and quite difficult to adapt monitoring to each product and each operation.
These difficulties have been pointed out by the noticed delay of the company in configuration of their new
products and the absence of improvement on what is already implemented. Indeed, at the start of this study, OPN-
AU Tool presented two main problems:
A lack of configuration: Several new products‟ productions cannot be monitored because they are not
configured on the Tool.
A maladjusted configuration: Lots of aberrant alarms have been notified by Operators during the
production. For instance, pH sensor is not covered yet by the liquid in a vessel but PO is already
activated; so the tracking begins and the no-relevant pH value generates an alarm. In addition, some
KOPs profiles do not fit with what it is really going on.
On January 2010, almost 40% of red alarms were considered as aberrant.
Thus, even if OPN-AU Tool has been recognized as a real powerful Tool, continuous improvements have to be
performed to guarantee a real efficient monitoring of the production line (OPN) and relevant studies regarding the
productivity (AU).
2. Aimed Improvements
This Master‟s Thesis aims to improve the efficiency of OPN-AU Tool in various fields:
Configuration of new products
Optimization of initial configurations
Project Management
a. OPN-AU Tool: Configuration of new products
In three years, in collaboration with its headquarters, DSM Seclin found new strains and so new Enzymes to
produce. These innovative productions have to be monitored as well for each step of the production line. In
consequence, this Master‟s Thesis includes configuration of new products on all the plant.
Configuration and Optimization of a Process Monitoring Tool 29
b. OPN-AU Tool: Optimization of initial configurations
Being a recent Tool, OPN-AU Tool has been configured quite quickly in order to cover as much operations as
possible. This implementation has resulted in definition of simplified KOPs profiles in certain areas especially in
DSP and Formulation. Indeed, Fermentation has been configured for almost all products in a really relevant way;
however, KOPs profiles of some other steps have been reduced to the final desired values of the KOPs. No
evolution of parameters in time has been implemented. In consequence, many alarms used to rise during
operations because KOPs profiles are not adapted to the evolution of parameters. Even if some modifications are
needed in all areas, this Master‟s Thesis mainly focused on optimization of the Extraction and Formulation
monitoring which includes more than 250 products and 45 equipments.
c. Shift Report Tool: Project Management
Shift Report Tool, one of the future projects of DSM Seclin, should be included in OPN-AU Tool. It will let
Operators to do their shift reports on computers whereas currently they do it on paper sheets. It will so allow
Users to save time thanks to its auto-filled fields from MES, ABB and OPN. It will also let to avoid mistakes,
oblivion, and so to assure a better communication between teams.
Shift Report Tool has been imagined by DSM Seclin but as OPN-AU Tool, it will be made by ISG. A User
Requirement Specification (URS) was already made and ISG gave a first offer regarding the order. As part of this
Master‟s Thesis, the price has to be discussed and then project management has to be performed. It especially
includes a participation in the writing of the Functional Design Specification (FDS), a validation of the Tool and
the training of Staff once it will be implemented on the plant. It validation will be performed through different
ways. First a Factory Acceptance Test (FAT) will be done at the Supplier place to do some tests on the Tool.
Then, a Site Acceptance Test (SAT) will let to test the Tool directly on the plant. Finally a continuous
optimization will be assured during six months in order to guarantee its efficiency.
Thus, concerning both production and research areas and giving opportunities to practise project management,
this Master‟s Thesis represented an overall of what can be performed by an engineer. It implied a really good
knowledge of processes performed on the plant and also active participation of Production Staff.
3. Available Means
Because of their plurality, targets of the Master‟s Thesis force to know almost everything about DSM Seclin
Plant. Several informatics Tools and experience of Production Staff have been really helpful to go in that sense
and to assure a good understanding of what is going on the production line.
The first three weeks of this Study began with a learning of the production procedures, on each workshop of the
Seclin plant. That was indispensable in order to configure new products all along the production line for instance.
It has been performed by following Operators during their work period and observing precisely how they do their
job. This training was completed by meetings with all Experts who could explain, more on a scientific point of
view, the different aspects of operations.
Once, the production line, the operation conditions, the management system and the way to configure the OPN-
AU Tool were understood, the real work could begin. It has been done in collaboration with the SPS members and
Experts and thanks to the use of different informatics Tools. Indeed, many means were available.
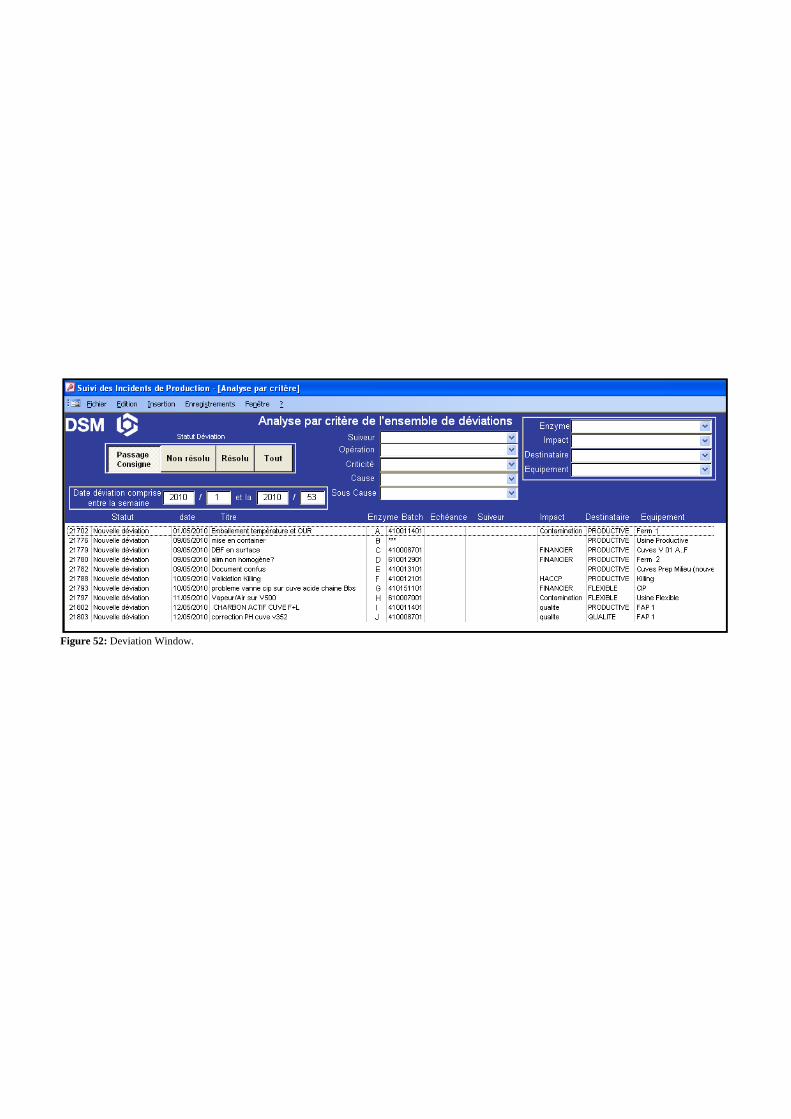
Figure 52: Deviation Window.
Configuration and Optimization of a Process Monitoring Tool 30
a. OPN-AU Tool: Configuration of new products
Configuration of a new product implies the study of each step of the production plant. It was mainly done with
SPS members. Each one is responsible of specific products. During meetings it was decided which KOPs should
be monitored on each operation and which profiles they should fit. The main difficulty on this case is the absence
of knowledge. By definition, because they are new products, no data is available to rely on and to take right
decisions. In that sense, after a first configuration, some changes could be needed after having analyzed different
batches.
b. OPN-AU Tool: Optimization of initial configurations
By including various measures, optimization of initial configuration has been performed on different ways. It
regroups three main actions:
Continuous configuration adaptation.
Continuous issues‟ solving.
Complete modification of maladjusted configurations.
Continuous configuration adaptation
After each batch production, SPS members and Experts have to analyze results, yield and KOP curves obtained
during the operations. In that purpose, they calculate different OGAPs on AU, define different Scorings on OPN,
and study some correlations between KOPs choice and obtained yield. They can deduce from that if the KOPs
listings are relevant. Moreover, by observing KOPs curves, they can notice if initial KOPs profiles are adapted.
According to their results they planned a meeting in order to talk about all possible improvements in Product
Builder.
Continuous issues’ solving
Each morning, production Experts, maintenance Leader, Planning Builders and the production Manager have a
meeting to talk about problems which happened the previous day in the plant. These issues are described in a
Database called “Deviation” (Figure 52). As soon as a problem occurs, Operators write a deviation describing it,
its causes, its consequences and how they tried to fix it. Each deviation is then commented at the meeting and
assigned to a manager who is responsible of the problem‟s solving.
When OPN-AU Tool‟s Users notice problems regarding the Tool such as a maladjusted configuration, deviation
is treated by analyzing the issue, comparing with procedures and making needed changes in configuration. An
example of this kind of measure will be presented further in the report.
In the same way, several optimizations of the Tool have been performed by consulting the KOP alarms‟ listing
(Figure 43). Operators have to write a confirmation message in order to validate red alarms. Through this
procedure, they sometimes point out problems of configuration so it can be a good source of information for
modifying some maladjusted configurations. It was as well completed by meeting each operator every morning
before the Deviation meeting to talk with them about problems they might have noticed or alarms which were
blinking.
Complete modification of maladjusted configurations
As said before, OPN-AU Tool is quite recent and to assure an operational Tool, some of its configurations have
been done rapidly, simplifying KOPs profiles which are now source of aberrant alarms. That includes mainly two
operations:
In Extraction: The killing/harvesting phase of the product before sending it to membrane filters press.
In Formulation: The formulation phase, regrouping the preparation of the product to get the final one and
its last filtration through the second plate filters (FAP2).
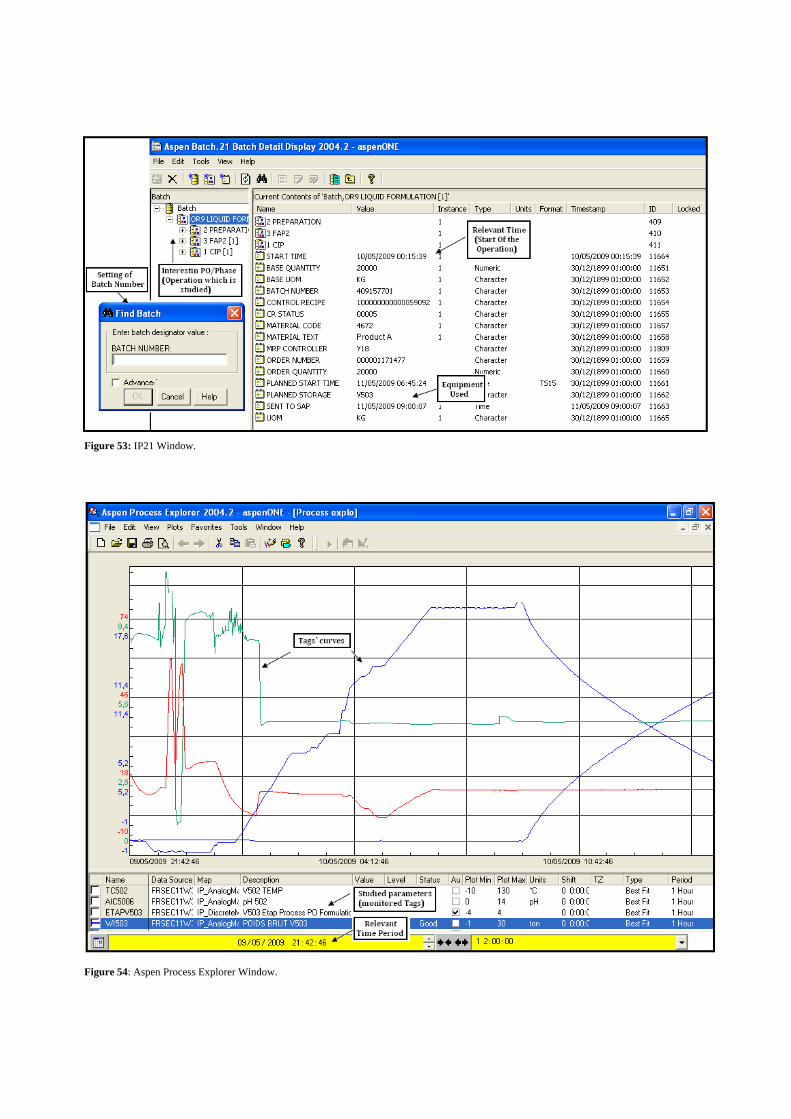
Figure 53: IP21 Window.
Figure 54: Aspen Process Explorer Window.
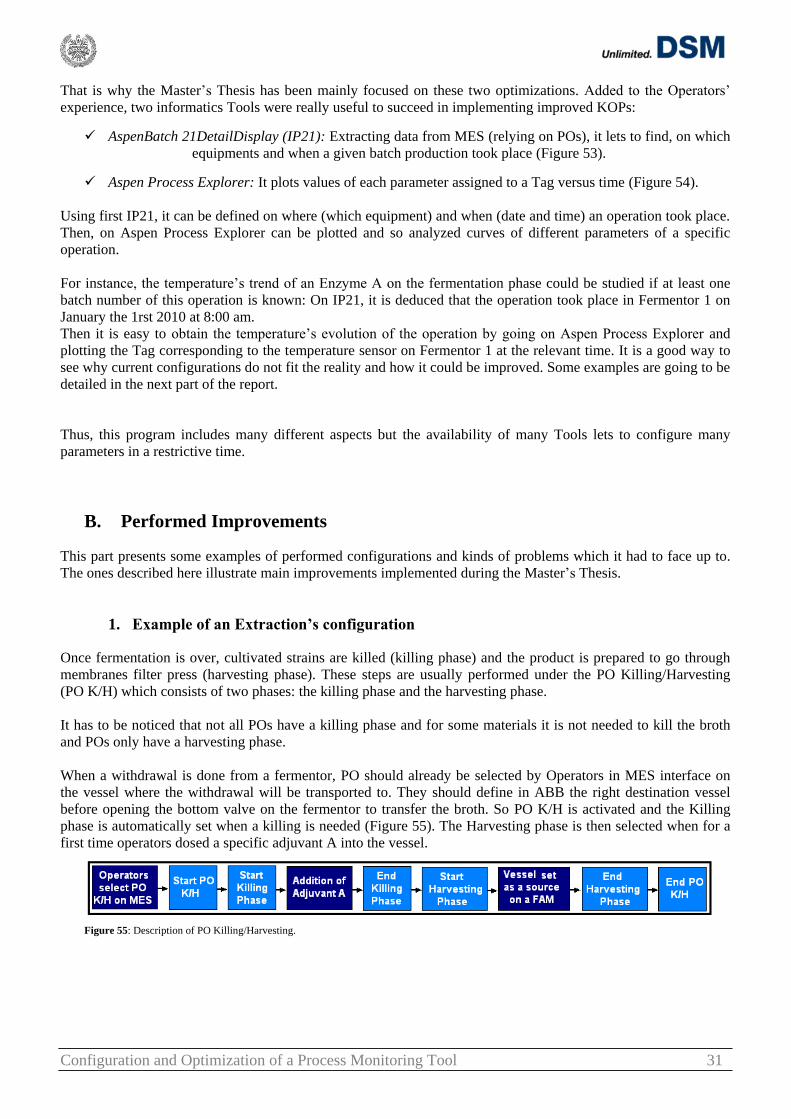
Configuration and Optimization of a Process Monitoring Tool 31
That is why the Master‟s Thesis has been mainly focused on these two optimizations. Added to the Operators‟
experience, two informatics Tools were really useful to succeed in implementing improved KOPs:
AspenBatch 21DetailDisplay (IP21): Extracting data from MES (relying on POs), it lets to find, on which
equipments and when a given batch production took place (Figure 53).
Aspen Process Explorer: It plots values of each parameter assigned to a Tag versus time (Figure 54).
Using first IP21, it can be defined on where (which equipment) and when (date and time) an operation took place.
Then, on Aspen Process Explorer can be plotted and so analyzed curves of different parameters of a specific
operation.
For instance, the temperature‟s trend of an Enzyme A on the fermentation phase could be studied if at least one
batch number of this operation is known: On IP21, it is deduced that the operation took place in Fermentor 1 on
January the 1rst 2010 at 8:00 am.
Then it is easy to obtain the temperature‟s evolution of the operation by going on Aspen Process Explorer and
plotting the Tag corresponding to the temperature sensor on Fermentor 1 at the relevant time. It is a good way to
see why current configurations do not fit the reality and how it could be improved. Some examples are going to be
detailed in the next part of the report.
Thus, this program includes many different aspects but the availability of many Tools lets to configure many
parameters in a restrictive time.
B. Performed Improvements
This part presents some examples of performed configurations and kinds of problems which it had to face up to.
The ones described here illustrate main improvements implemented during the Master‟s Thesis.
1. Example of an Extraction’s configuration
Once fermentation is over, cultivated strains are killed (killing phase) and the product is prepared to go through
membranes filter press (harvesting phase). These steps are usually performed under the PO Killing/Harvesting
(PO K/H) which consists of two phases: the killing phase and the harvesting phase.
It has to be noticed that not all POs have a killing phase and for some materials it is not needed to kill the broth
and POs only have a harvesting phase.
When a withdrawal is done from a fermentor, PO should already be selected by Operators in MES interface on
the vessel where the withdrawal will be transported to. They should define in ABB the right destination vessel
before opening the bottom valve on the fermentor to transfer the broth. So PO K/H is activated and the Killing
phase is automatically set when a killing is needed (Figure 55). The Harvesting phase is then selected when for a
first time operators dosed a specific adjuvant A into the vessel.
Figure 55: Description of PO Killing/Harvesting.
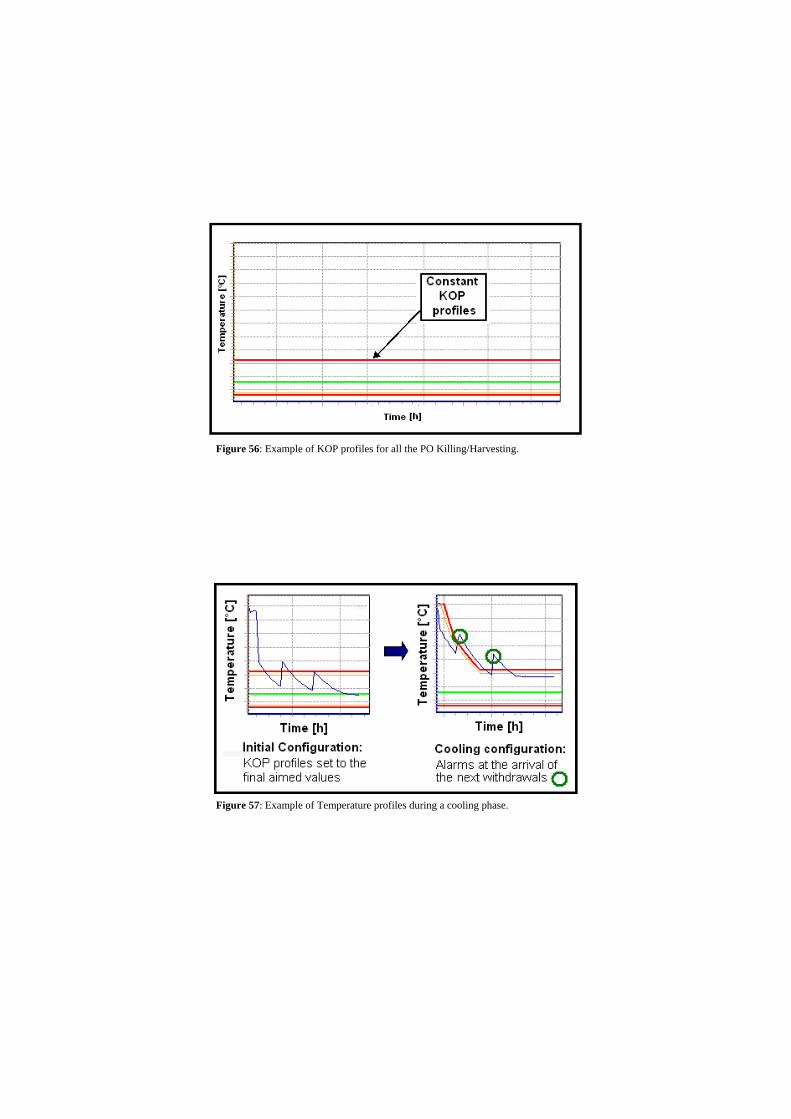
Figure 56: Example of KOP profiles for all the PO Killing/Harvesting.
Figure 57: Example of Temperature profiles during a cooling phase.
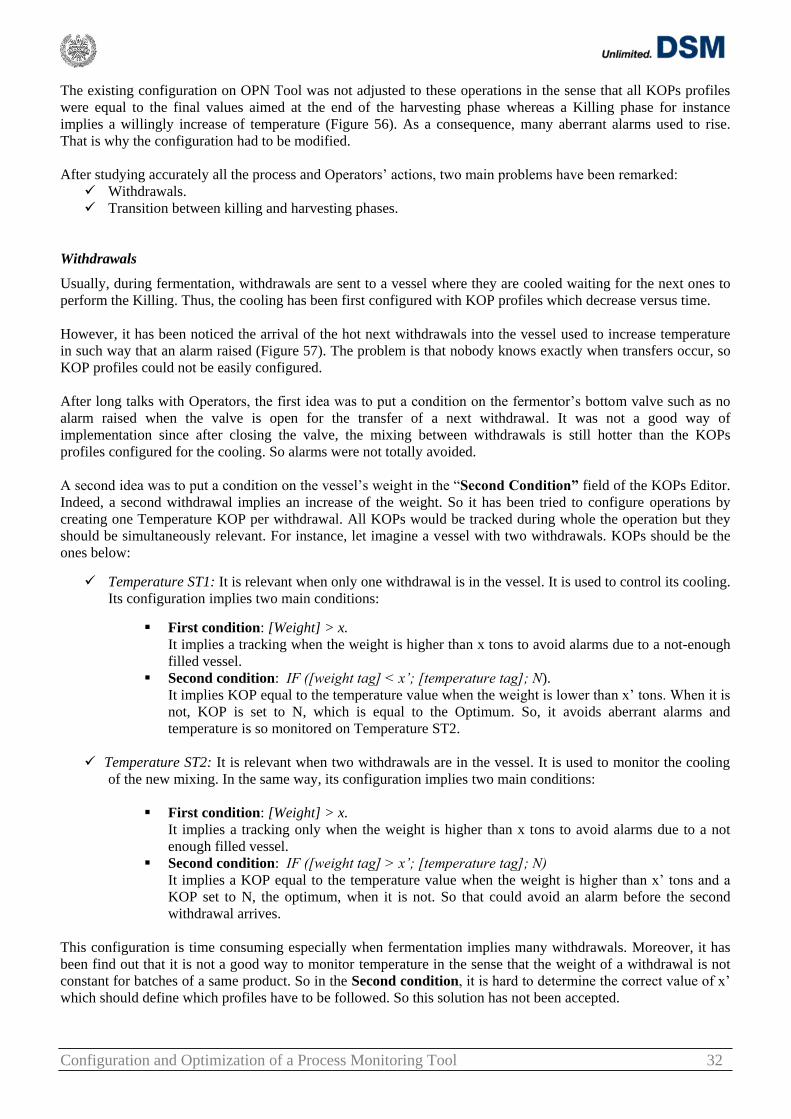
Configuration and Optimization of a Process Monitoring Tool 32
The existing configuration on OPN Tool was not adjusted to these operations in the sense that all KOPs profiles
were equal to the final values aimed at the end of the harvesting phase whereas a Killing phase for instance
implies a willingly increase of temperature (Figure 56). As a consequence, many aberrant alarms used to rise.
That is why the configuration had to be modified.
After studying accurately all the process and Operators‟ actions, two main problems have been remarked:
Withdrawals.
Transition between killing and harvesting phases.
Withdrawals
Usually, during fermentation, withdrawals are sent to a vessel where they are cooled waiting for the next ones to
perform the Killing. Thus, the cooling has been first configured with KOP profiles which decrease versus time.
However, it has been noticed the arrival of the hot next withdrawals into the vessel used to increase temperature
in such way that an alarm raised (Figure 57). The problem is that nobody knows exactly when transfers occur, so
KOP profiles could not be easily configured.
After long talks with Operators, the first idea was to put a condition on the fermentor‟s bottom valve such as no
alarm raised when the valve is open for the transfer of a next withdrawal. It was not a good way of
implementation since after closing the valve, the mixing between withdrawals is still hotter than the KOPs
profiles configured for the cooling. So alarms were not totally avoided.
A second idea was to put a condition on the vessel‟s weight in the “Second Condition” field of the KOPs Editor.
Indeed, a second withdrawal implies an increase of the weight. So it has been tried to configure operations by
creating one Temperature KOP per withdrawal. All KOPs would be tracked during whole the operation but they
should be simultaneously relevant. For instance, let imagine a vessel with two withdrawals. KOPs should be the
ones below:
Temperature ST1: It is relevant when only one withdrawal is in the vessel. It is used to control its cooling.
Its configuration implies two main conditions:
First condition: [Weight] > x.
It implies a tracking when the weight is higher than x tons to avoid alarms due to a not-enough
filled vessel.
Second condition: IF ([weight tag] < x’; [temperature tag]; N).
It implies KOP equal to the temperature value when the weight is lower than x‟ tons. When it is
not, KOP is set to N, which is equal to the Optimum. So, it avoids aberrant alarms and
temperature is so monitored on Temperature ST2.
Temperature ST2: It is relevant when two withdrawals are in the vessel. It is used to monitor the cooling
of the new mixing. In the same way, its configuration implies two main conditions:
First condition: [Weight] > x.
It implies a tracking only when the weight is higher than x tons to avoid alarms due to a not
enough filled vessel.
Second condition: IF ([weight tag] > x’; [temperature tag]; N)
It implies a KOP equal to the temperature value when the weight is higher than x‟ tons and a
KOP set to N, the optimum, when it is not. So that could avoid an alarm before the second
withdrawal arrives.
This configuration is time consuming especially when fermentation implies many withdrawals. Moreover, it has
been find out that it is not a good way to monitor temperature in the sense that the weight of a withdrawal is not
constant for batches of a same product. So in the Second condition, it is hard to determine the correct value of x‟
which should define which profiles have to be followed. So this solution has not been accepted.
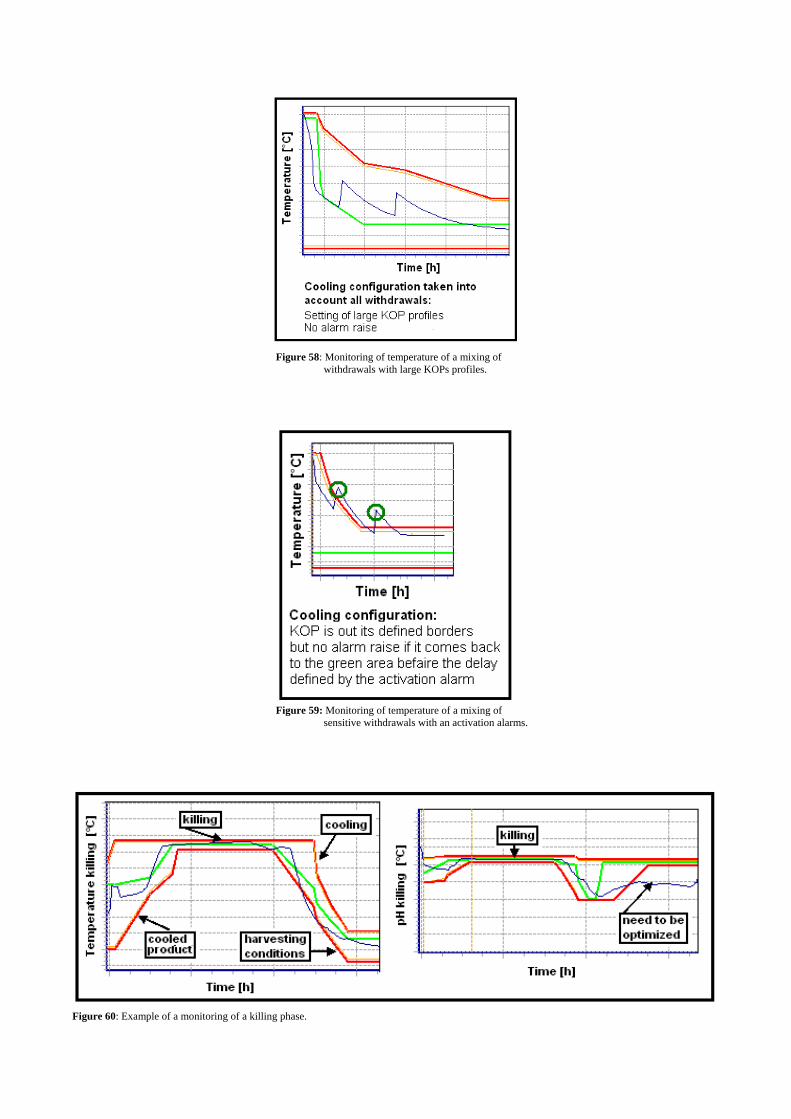
Figure 58: Monitoring of temperature of a mixing of
withdrawals with large KOPs profiles.
Figure 59: Monitoring of temperature of a mixing of
sensitive withdrawals with an activation alarms.
Figure 60: Example of a monitoring of a killing phase.
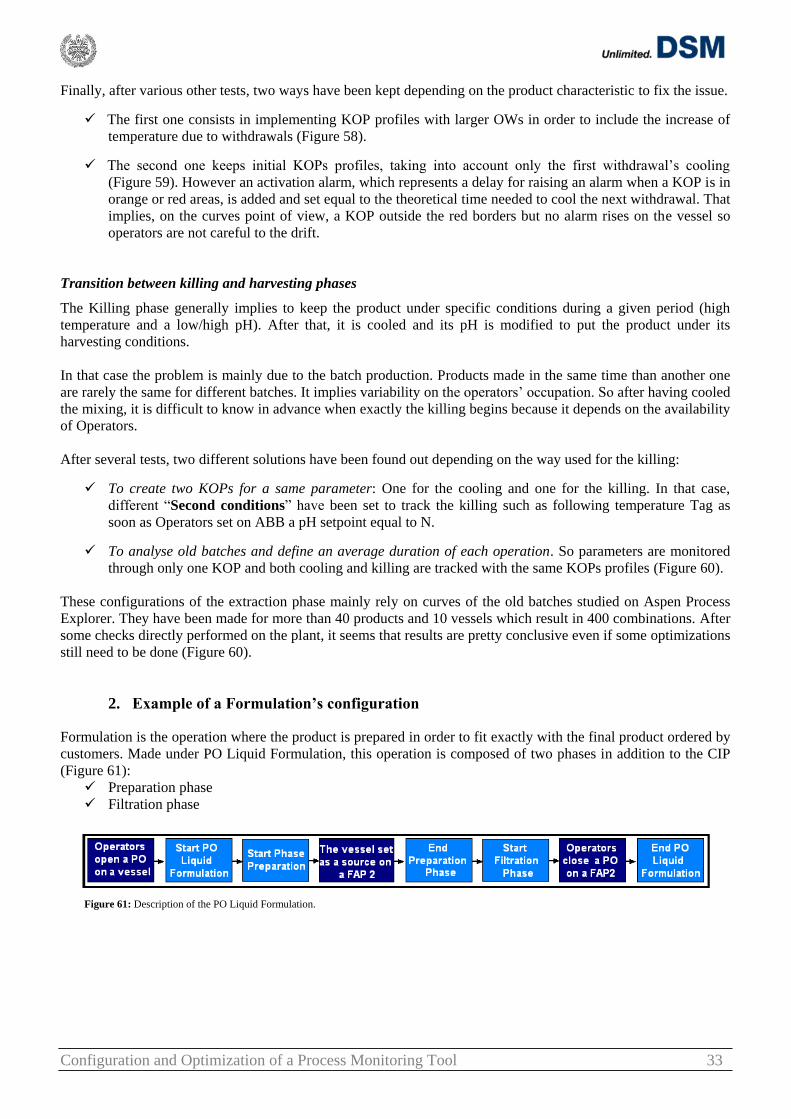
Configuration and Optimization of a Process Monitoring Tool 33
Finally, after various other tests, two ways have been kept depending on the product characteristic to fix the issue.
The first one consists in implementing KOP profiles with larger OWs in order to include the increase of
temperature due to withdrawals (Figure 58).
The second one keeps initial KOPs profiles, taking into account only the first withdrawal‟s cooling
(Figure 59). However an activation alarm, which represents a delay for raising an alarm when a KOP is in
orange or red areas, is added and set equal to the theoretical time needed to cool the next withdrawal. That
implies, on the curves point of view, a KOP outside the red borders but no alarm rises on the vessel so
operators are not careful to the drift.
Transition between killing and harvesting phases
The Killing phase generally implies to keep the product under specific conditions during a given period (high
temperature and a low/high pH). After that, it is cooled and its pH is modified to put the product under its
harvesting conditions.
In that case the problem is mainly due to the batch production. Products made in the same time than another one
are rarely the same for different batches. It implies variability on the operators‟ occupation. So after having cooled
the mixing, it is difficult to know in advance when exactly the killing begins because it depends on the availability
of Operators.
After several tests, two different solutions have been found out depending on the way used for the killing:
To create two KOPs for a same parameter: One for the cooling and one for the killing. In that case,
different “Second conditions” have been set to track the killing such as following temperature Tag as
soon as Operators set on ABB a pH setpoint equal to N.
To analyse old batches and define an average duration of each operation. So parameters are monitored
through only one KOP and both cooling and killing are tracked with the same KOPs profiles (Figure 60).
These configurations of the extraction phase mainly rely on curves of the old batches studied on Aspen Process
Explorer. They have been made for more than 40 products and 10 vessels which result in 400 combinations. After
some checks directly performed on the plant, it seems that results are pretty conclusive even if some optimizations
still need to be done (Figure 60).
2. Example of a Formulation’s configuration
Formulation is the operation where the product is prepared in order to fit exactly with the final product ordered by
customers. Made under PO Liquid Formulation, this operation is composed of two phases in addition to the CIP
(Figure 61):
Preparation phase
Filtration phase
Figure 61: Description of the PO Liquid Formulation.
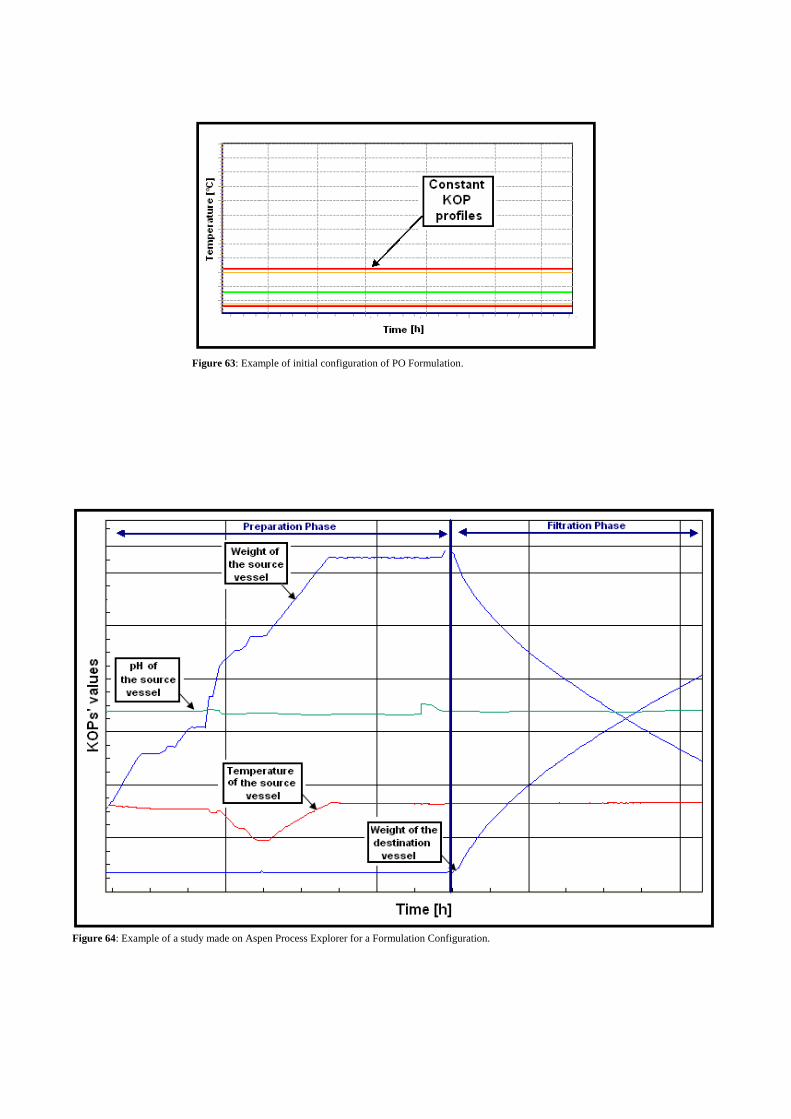
Figure 63: Example of initial configuration of PO Formulation.
Figure 64: Example of a study made on Aspen Process Explorer for a Formulation Configuration.
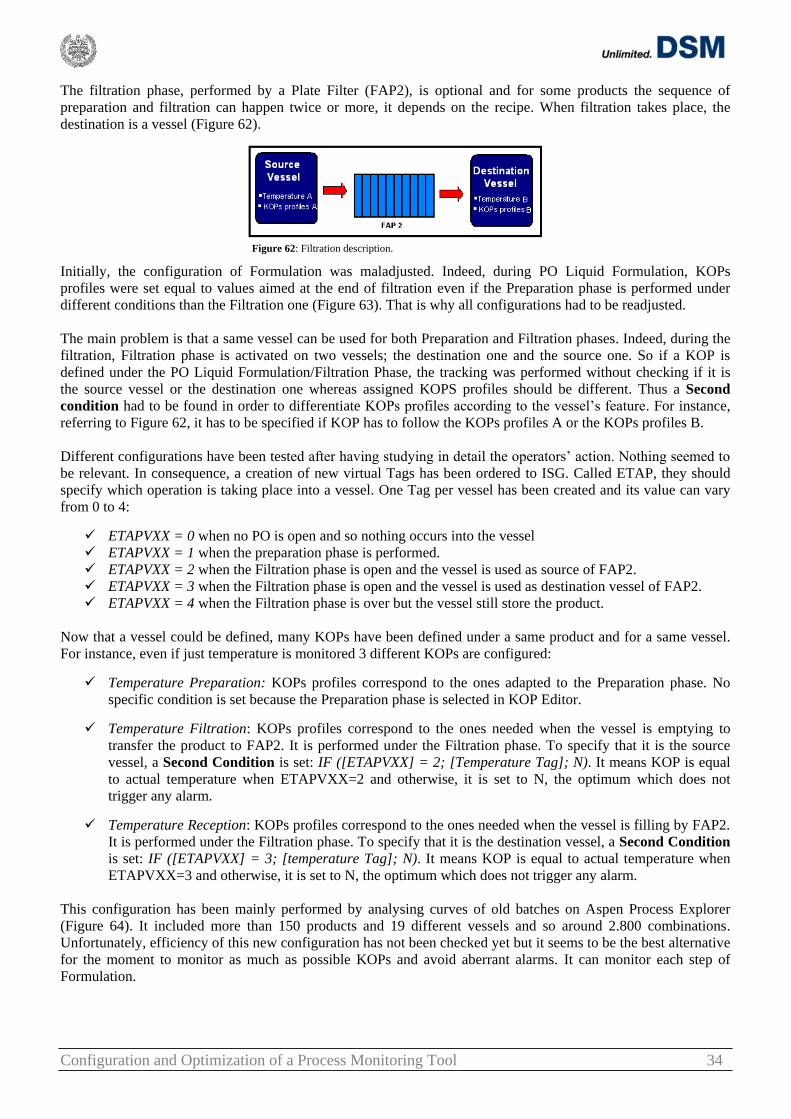
Configuration and Optimization of a Process Monitoring Tool 34
The filtration phase, performed by a Plate Filter (FAP2), is optional and for some products the sequence of
preparation and filtration can happen twice or more, it depends on the recipe. When filtration takes place, the
destination is a vessel (Figure 62).
Figure 62: Filtration description.
Initially, the configuration of Formulation was maladjusted. Indeed, during PO Liquid Formulation, KOPs
profiles were set equal to values aimed at the end of filtration even if the Preparation phase is performed under
different conditions than the Filtration one (Figure 63). That is why all configurations had to be readjusted.
The main problem is that a same vessel can be used for both Preparation and Filtration phases. Indeed, during the
filtration, Filtration phase is activated on two vessels; the destination one and the source one. So if a KOP is
defined under the PO Liquid Formulation/Filtration Phase, the tracking was performed without checking if it is
the source vessel or the destination one whereas assigned KOPS profiles should be different. Thus a Second
condition had to be found in order to differentiate KOPs profiles according to the vessel‟s feature. For instance,
referring to Figure 62, it has to be specified if KOP has to follow the KOPs profiles A or the KOPs profiles B.
Different configurations have been tested after having studying in detail the operators‟ action. Nothing seemed to
be relevant. In consequence, a creation of new virtual Tags has been ordered to ISG. Called ETAP, they should
specify which operation is taking place into a vessel. One Tag per vessel has been created and its value can vary
from 0 to 4:
ETAPVXX = 0 when no PO is open and so nothing occurs into the vessel
ETAPVXX = 1 when the preparation phase is performed.
ETAPVXX = 2 when the Filtration phase is open and the vessel is used as source of FAP2.
ETAPVXX = 3 when the Filtration phase is open and the vessel is used as destination vessel of FAP2.
ETAPVXX = 4 when the Filtration phase is over but the vessel still store the product.
Now that a vessel could be defined, many KOPs have been defined under a same product and for a same vessel.
For instance, even if just temperature is monitored 3 different KOPs are configured:
Temperature Preparation: KOPs profiles correspond to the ones adapted to the Preparation phase. No
specific condition is set because the Preparation phase is selected in KOP Editor.
Temperature Filtration: KOPs profiles correspond to the ones needed when the vessel is emptying to
transfer the product to FAP2. It is performed under the Filtration phase. To specify that it is the source
vessel, a Second Condition is set: IF ([ETAPVXX] = 2; [Temperature Tag]; N). It means KOP is equal
to actual temperature when ETAPVXX=2 and otherwise, it is set to N, the optimum which does not
trigger any alarm.
Temperature Reception: KOPs profiles correspond to the ones needed when the vessel is filling by FAP2.
It is performed under the Filtration phase. To specify that it is the destination vessel, a Second Condition
is set: IF ([ETAPVXX] = 3; [temperature Tag]; N). It means KOP is equal to actual temperature when
ETAPVXX=3 and otherwise, it is set to N, the optimum which does not trigger any alarm.
This configuration has been mainly performed by analysing curves of old batches on Aspen Process Explorer
(Figure 64). It included more than 150 products and 19 different vessels and so around 2.800 combinations.
Unfortunately, efficiency of this new configuration has not been checked yet but it seems to be the best alternative
for the moment to monitor as much as possible KOPs and avoid aberrant alarms. It can monitor each step of
Formulation.
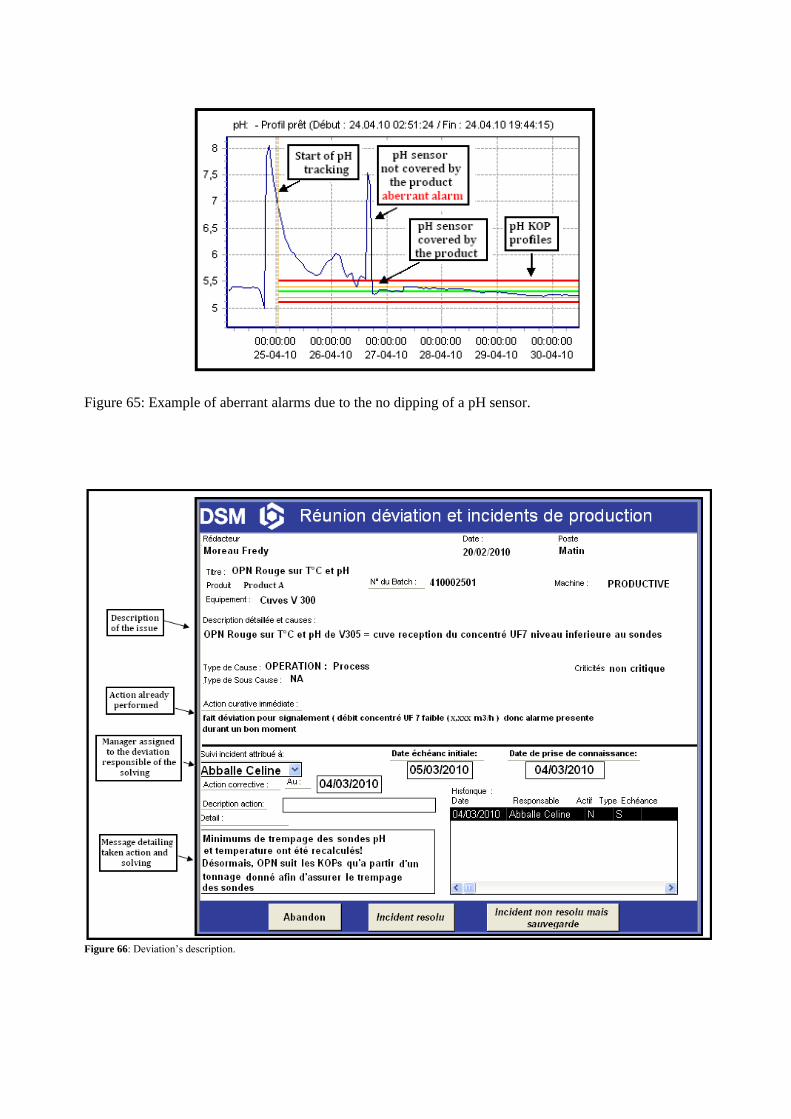
Figure 65: Example of aberrant alarms due to the no dipping of a pH sensor.
Figure 66: Deviation‟s description.
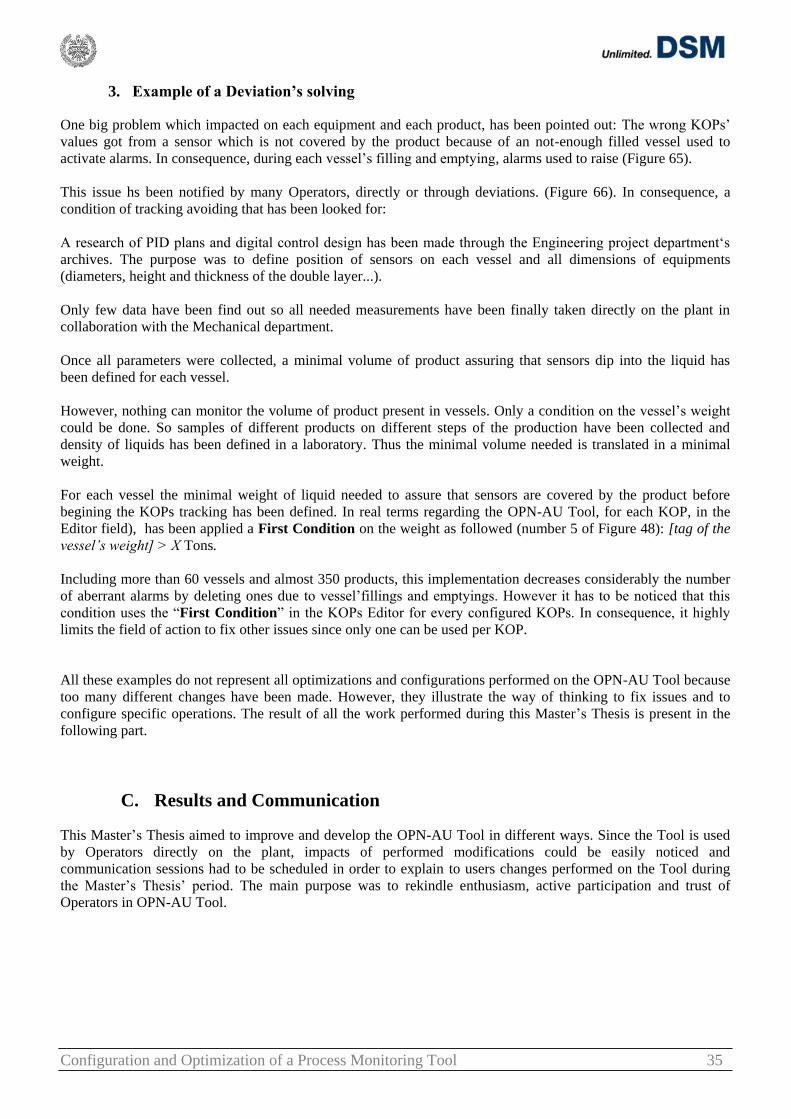
Configuration and Optimization of a Process Monitoring Tool 35
3. Example of a Deviation’s solving
One big problem which impacted on each equipment and each product, has been pointed out: The wrong KOPs‟
values got from a sensor which is not covered by the product because of an not-enough filled vessel used to
activate alarms. In consequence, during each vessel‟s filling and emptying, alarms used to raise (Figure 65).
This issue hs been notified by many Operators, directly or through deviations. (Figure 66). In consequence, a
condition of tracking avoiding that has been looked for:
A research of PID plans and digital control design has been made through the Engineering project department„s
archives. The purpose was to define position of sensors on each vessel and all dimensions of equipments
(diameters, height and thickness of the double layer...).
Only few data have been find out so all needed measurements have been finally taken directly on the plant in
collaboration with the Mechanical department.
Once all parameters were collected, a minimal volume of product assuring that sensors dip into the liquid has
been defined for each vessel.
However, nothing can monitor the volume of product present in vessels. Only a condition on the vessel‟s weight
could be done. So samples of different products on different steps of the production have been collected and
density of liquids has been defined in a laboratory. Thus the minimal volume needed is translated in a minimal
weight.
For each vessel the minimal weight of liquid needed to assure that sensors are covered by the product before
begining the KOPs tracking has been defined. In real terms regarding the OPN-AU Tool, for each KOP, in the
Editor field), has been applied a First Condition on the weight as followed (number 5 of Figure 48): [tag of the
vessel’s weight] > X Tons.
Including more than 60 vessels and almost 350 products, this implementation decreases considerably the number
of aberrant alarms by deleting ones due to vessel‟fillings and emptyings. However it has to be noticed that this
condition uses the “First Condition” in the KOPs Editor for every configured KOPs. In consequence, it highly
limits the field of action to fix other issues since only one can be used per KOP.
All these examples do not represent all optimizations and configurations performed on the OPN-AU Tool because
too many different changes have been made. However, they illustrate the way of thinking to fix issues and to
configure specific operations. The result of all the work performed during this Master‟s Thesis is present in the
following part.
C. Results and Communication
This Master‟s Thesis aimed to improve and develop the OPN-AU Tool in different ways. Since the Tool is used
by Operators directly on the plant, impacts of performed modifications could be easily noticed and
communication sessions had to be scheduled in order to explain to users changes performed on the Tool during
the Master‟s Thesis‟ period. The main purpose was to rekindle enthusiasm, active participation and trust of
Operators in OPN-AU Tool.
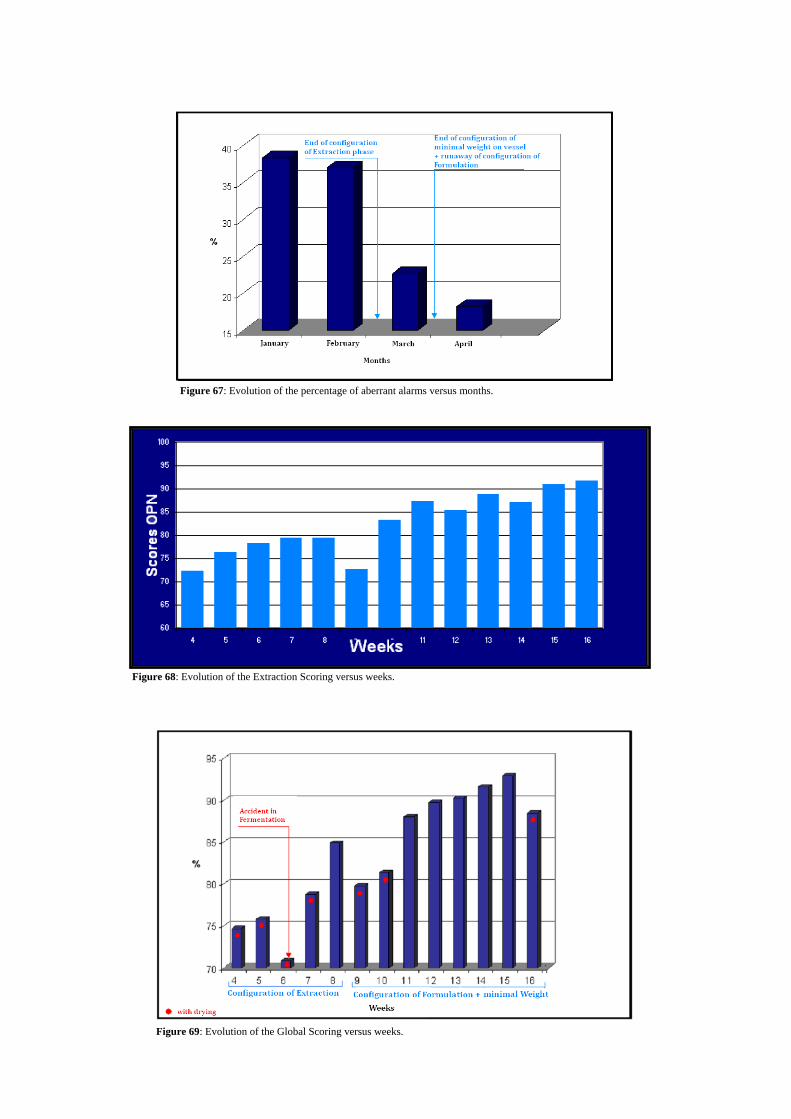
Figure 67: Evolution of the percentage of aberrant alarms versus months.
Figure 68: Evolution of the Extraction Scoring versus weeks.
Figure 69: Evolution of the Global Scoring versus weeks.
Configuration and Optimization of a Process Monitoring Tool 36
1. Results on OPN-AU Tool
a. AU Tool Improvments
On AU Tool, two main implementations have been performed:
All borders defined for Start KOPs and Time KOPs in Fermentation have been updated in order to be
adapted to changes on the process line decided by SPS members such as a longer Fermentation.
New Start KOPs and Time KOPs have been implemented in DSP, mainly on the Ultrafiltration and
Chromatography steps in order to let Experts to analyze delays noticed during such operations.
b. OPN Tool Improvments
Too many different changes have been performed on OPN Tool to be able to list done improvements. However, it
can be noticed that:
Around 50 deviations have been assigned to OPN Tool and more than 75% of them have been fixed at the
writing of the report.
Three new products have been totally implemented on each step of the production line.
Configurations of Extraction and Formulation Phases have been totally readjusted which include more
than 200 products and 45 equipments and so around 20.000 configurations of KOPs.
Impacts of these implementations can be analyzed through different calculations:
Percentage of aberrant alarms: From the beginning of the Master‟s Thesis, twice a day percentage of the
alarms which are aberrant have been calculated. Its trend along months illustrates impacts of new
implementations (Figure 67). It can be seen a high decrease of the number of aberrant alarms from almost
40% to less than 20% in four months. That lets to conclude that performed implementations have real
benefits on OPN Tool‟s efficiency. However, the Tool still needs improvements.
Evolution of the Scoring got on the Extraction area: Many configurations have been adjusted in the
Extraction area. Evolution of its average scoring got on operations made per week can illustrate efficiency
of KOPs profiles‟ definition. Depending on alarms, the Scoring translates problems got during operations
but it lets to see as well if KOPs profiles are adapted to the process. On Figure 68, it can be seen a real
improvement versus weeks on this step which lets to conclude that performed configurations are quite
good.
Evolution of the Global Scoring: In the same way, evolution of the Global Scoring got on DSM plant
versus week can translate the efficiency of implementations. A global improvement is noticed with an
increase of the Global Scoring from 76.6 % to 92.9 % in less than four months (Figure 69). On Figure 69,
some Scoring values did not include results got on drying phase because of a problem which happened on
MES and obstructed the monitoring.
Thus, for both OPN and AU Tools, results are really positive and imply a higher efficiency of the OPN-AU Tool
and so a better process control. However, improvements are still possible and configuration of Formulation still
has to be analyzed.
2. Results on the Shift Report Tool
Regarding Shift Report Tool, first, by talking and negotiating with ISG, the price of its implementation has been
reduced from 48,000€ to 26,000€. In consequence, the offer has been presented to the Site Director, the Leader
Expert and the Production Manager in order to have their agreement to perform it.
Configuration and Optimization of a Process Monitoring Tool 37
Shift Report Tool has been finally ordered and its Functional Design Specification has been written in
collaboration with ISG. It contains description of each feature and each characteristic of the Tool. It has to be
done in a careful way because the Austrian company relies on it to create the Tool. Then it has been validated by
several managers of the plant.
Its creation is runaway and the Tool should be finished at the end of June. Once it will be completely performed,
the validation period will begin in collaboration with ISG. It will be followed by its implementation on DSM
Seclin plant. Finally a training period during around three weeks will be needed to explain to Operators how to
use it.
3. Communication
Many modifications have been performed on OPN-AU Tool. Communication to Operators was so indispensable
to assure a good use of a Tool and increase their motivations, their belonging to the Tool and so their active
participation in its improvement. It implies two main measures:
Reminding
Motivation and Information
a. Remindings
Because of the initial high number of aberrant alarms, operators did not really take care anymore to alarms. It was
illustrated by the absence of alarms‟ confirmation and so low Scorings. After having performed improvements, it
was necessary to let operators claim the Tool again and remind them what they have to do regarding it.
Two examples can be explained:
Too many times Operators did not confirm alarms and did not inform about problems noticed on the
Tool‟s configuration. Thus information campaign was indispensable to remind them how they have to use
the Tool and they have to react when an alarm rises. It has been made by speaking with them and by
writing a procedure published in each control room of the plant (Annexe IV).
At the beginning of their work period, Operators check pH of vessels by collecting a sample and defining
its pH value in laboratory. If the result is different than pH indicated by the vessel‟s sensors, they have to
adjust sensors manually. Unfortunately they often do not do it. It results in wrong pH values got from
sensors and so wrong Tag value. It implies of course wrong KOP values and so aberrant alarms. That is
why, it was needed to explain and/or remind operators that it is important to do it. It has been done by
speaking with them and writing a small procedure available in each DSP control room (Annexe V).
b. Motivation and Information
In order to assure a right utilization of OPN-AU Tool, it was important to motivate Operators. It has been mainly
performed by showing them the Tool‟s efficiency, rewarding them and informing them about new
implementations.
In that sense the Scoring got on each operation performed the previous week was calculated every Mondays. Thus
Global Scoring and the average Scorings got on Fermentation, Extraction and Drying of the previous week was
deduced. These results have been then published in each control room. Figures are completed by some remarks in
order to reward Operators, specify where there was a problem and analyze trends. (Annexe VI).
Moreover, an informative session is planned for the end of the Master‟s Thesis to describe improvements and new
configurations performed on their Tool, OPN-AU Tool. It will be the occasion as well to introduce in few words
Shift Report Tool and remind them some features of OPN Tool that they do not handle with. (Annexe VII).
Configuration and Optimization of a Process Monitoring Tool 38
Communication to Operators is almost the most important task of this Master‟s Thesis in the sense that they are
the main actors of the monitoring. Despite OPN-AU Tool is a really powerful and even if its configuration was
perfect, without a good use of it, it could not be efficient. Everything relies on Operators. That is why it is
important that they use it in a good way and they are motivated to help in its improvement.
Configuration and Optimization of a Process Monitoring Tool 39
CONCLUSIONS
Aiming to the improvement of OPN-AU Tool, the Master‟s Thesis has met the objectives set.
After having collected the needed information, many problems on initial configurations have been solved, the new
products‟ monitoring have been implemented, the Staff training has been improved and a following up of
implementation of the performed changes has been performed. Thus, the Tool which monitors the entire
production line is more efficient and is generally better used by the production staff. In addition, Shift Report
Tool project has seen a good progress since it is currently ordered and in state of realization.
However improvements are still needed on OPN-AU Tool and Shift Report Tool still has to be implemented on
the site. Furthermore, the process control depends not only on the Tools. It must be seen in a wider environment
and especially on the willingness on production Staff, to move things in the right direction. A tool is effective
only if one makes proper use. This should therefore be included in a global trend where the human dimension is
very important.
From a personal standpoint, this internship allowed me to discover new facets of the engineering profession as
designing tools, training of Staff and some managerial aspects related to the implementation of new practices
within Production Staff. It gave me the opportunities to work on many process equipments and so increase my
knowledge in process engineering.
This mission has also helped me to develop my sense of teamwork by operating in various sectors, to let myself to
use a powerful tool and also to improve my project management through Shift Report Tool.
The only problem was actually writing this report because it is very difficult to describe the construction and
operation of a computer application. The best solution remains a real use.
Thus, this Master‟s Thesis is a complete success in terms of training and performance. It is rare in an internship to
be given such responsibilities and such freedom of action and decision.
To conclude, optimization phase of OPN-AU Tool is on tracking. However, we must continue these efforts by
showing the importance and usefulness of the tool. The interest here is not to lose the general rekindled
enthusiasm.
Prospects are now to finish implementation of Shift Report Tool and perhaps consider other applications which
may be included in OPN-AU Tool such as the monitoring of actual breaks observed on operations.
Configuration and Optimization of a Process Monitoring Tool 40
NOTATIONS
3/8: Organization of work where 3 shifts work 8
hours each to cover 24 hours a day.
ABB: Monitoring and digital control automaton use
on the plant.
AU: Asset Utilization - Work Process of MANUFEX
to study productivity‟s performance.
BU: Billion of Units (Enzyme Unit).
CIP: Cleaning In Place.
CODIR: Management Committee (Comité de
Direction).
CP: Counter Pressure.
Déviations: Database to collect incidents or
problems noticed on the plant.
DFS: DSM Food Specialties.
DHW: Deca Hectoliter Week.
DOC: Measurement of the dissolved oxygen.
DSP: Down Stream Processing- It includes
extraction, Filtration, concentration and
Formulation Phases.
DSM: Dutch States Mines.
Enzyme: Active protein which makes it possible to
transform a complex natural substance into
simpler and more easily absorbable substance
Expert: Technical and Process Responsible of a
production sector.
FAM: Membranes Filters press.
FAP: Plates Filter.
FAT: Factory Acceptance Test.
FDS: Functional Design Specification.
Green area: Area of OW where process is under
control.
IP21: AspenBatch21 Detail Display.
ISG: Austrian supplier of DSM.
KOP: Key Operating Parameter – Important
parameter which has to be monitored on
production.
KPI: Key Performance Indicator.
KPP: Key Process Parameter.
Logica: Austrian Supplier of DSM.
MANUFEX: MANUfacturing Excellence.
MES: Manufacturing Execution System.
MPC: Maximum Proved Opportunity.
OGAP: Opportunity GAP.
OPN: Operate Plant Normal – Work Process of
MANUFEX to perform the process
control.
Orange area: Area of OW where process knows a
notable drift.
OUR: Oxygen Uptake Rate.
OW: Operational Windows – Curves of KOPs
Profiles to define green orange and red
areas.
PO: Process Order.
PO K/H: Process Order Killing/Harvesting.
Red area: Area of OW where process knows a
critical drift.
SAT: Site Acceptance Test.
SPS: Scientific Production Staff.
URS: User Requirement Specification.
Work Process: Unit of MANUFEX program.
Configuration and Optimization of a Process Monitoring Tool 41
REFERENCES
[1]: DSM Business Group – Our Strategy – Presentation – DSM – 2008.
[2]: DSM Food Specialties Seclin – Welcome to DSM Seclin – DSM – 2008.
[3]: DSM Food Specialties – Usine productive - Formation 2001 – DSM – 2001.
[4]: Fabian Flocard – Mise en place d‟Operate Plant Normal – Rapport de stage – Polytech‟Lille – 2007.
[5]: Marie-Pierre Guinchard – Notions de Biologie et Microbiologie – ENSGTI – 2007.
[6]: Cédrik Lallard – La sécurité est mon amie, il faut l‟aimer aussi – PLON – 2008.
[7]: Jean-Jacques Bimbenet, Albert Duquenoy and Gilles Trystram – Génie des procédés alimentaires -
Des bases aux applications – DUNOD – 2002.
[8]: Seaders J.D and Henley E.S. – Separation Process Principles – 2nd Edition – Wiley – 2006.
[9]: Anders Rasmuson – Lectures of Advanced Chemical Engineering and Process Analytical Technology
– KBT110 – Chalmers University of Technology – 2009.
[10]: Mathieu Mory – Séparation Mécanique – Cours de 2ème année – ENSGTI – 2007.
[11]: DFS Sunrise – iMES - Manuel Utilisateur – DSM – 2007.
[12]: DSM Sunrise – DFS Sunrise Seclin Project - MES - SAP Integration – Version 0.01 – DSM – 2007.
[13]: Fabian Flocard and Xavier Driesen – Operate Plant Normal - Asset Utilization - Manuel de
Formation – Programme MANUFEX – DSM – 2008.
[14]: ISG IT & Automation – OPN-AU Product Builder – ISG. – 2007.
[15]: Fabian Flocard – Bilan Test Correlation – DSM – 2008.
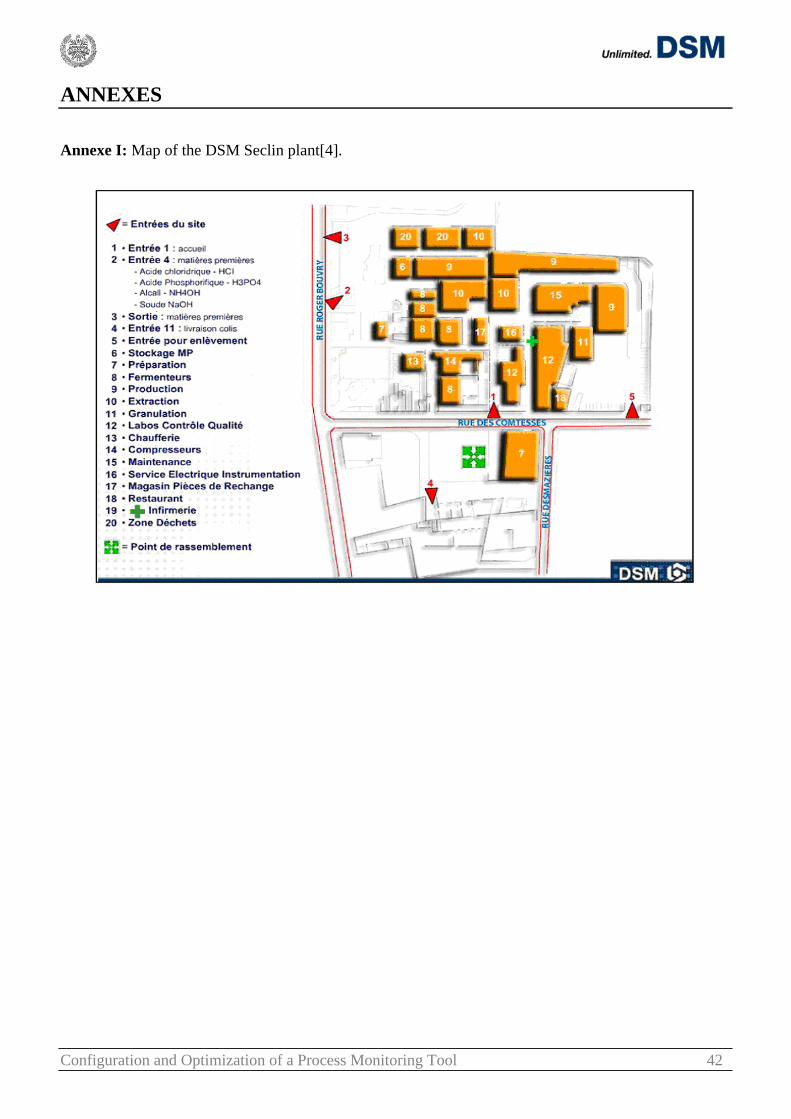
Configuration and Optimization of a Process Monitoring Tool 42
ANNEXES
Annexe I: Map of the DSM Seclin plant[4].
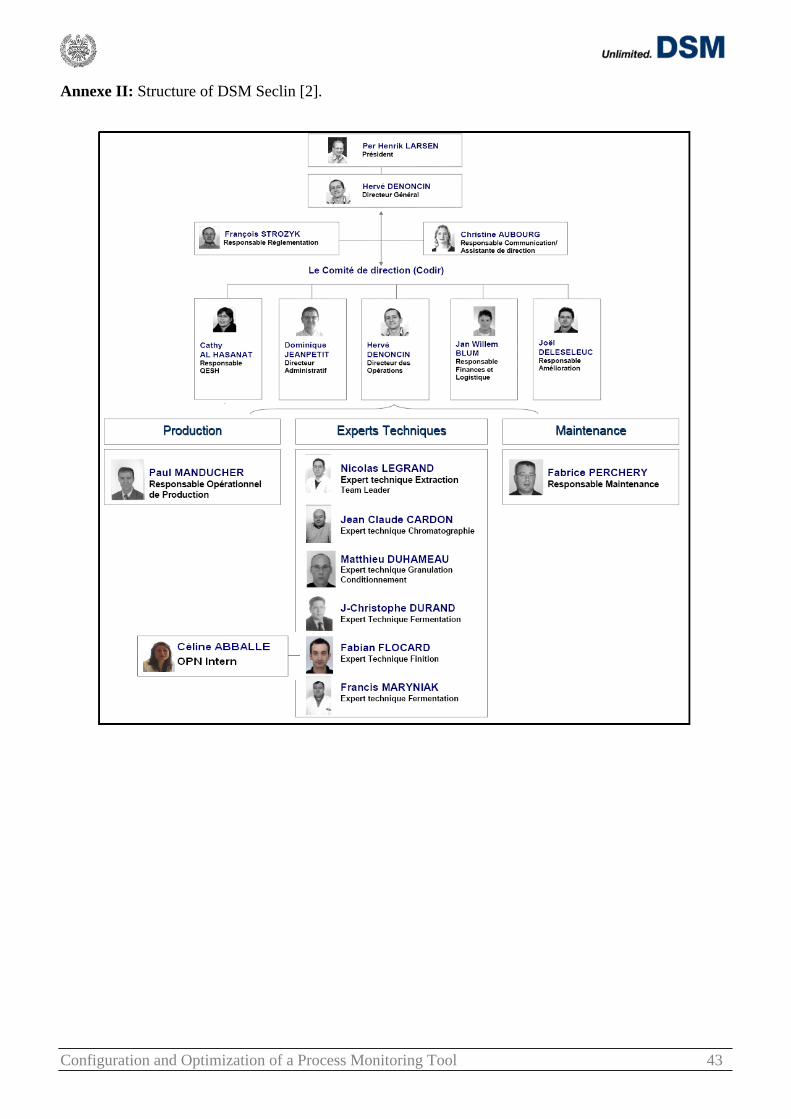
Configuration and Optimization of a Process Monitoring Tool 43
Annexe II: Structure of DSM Seclin [2].
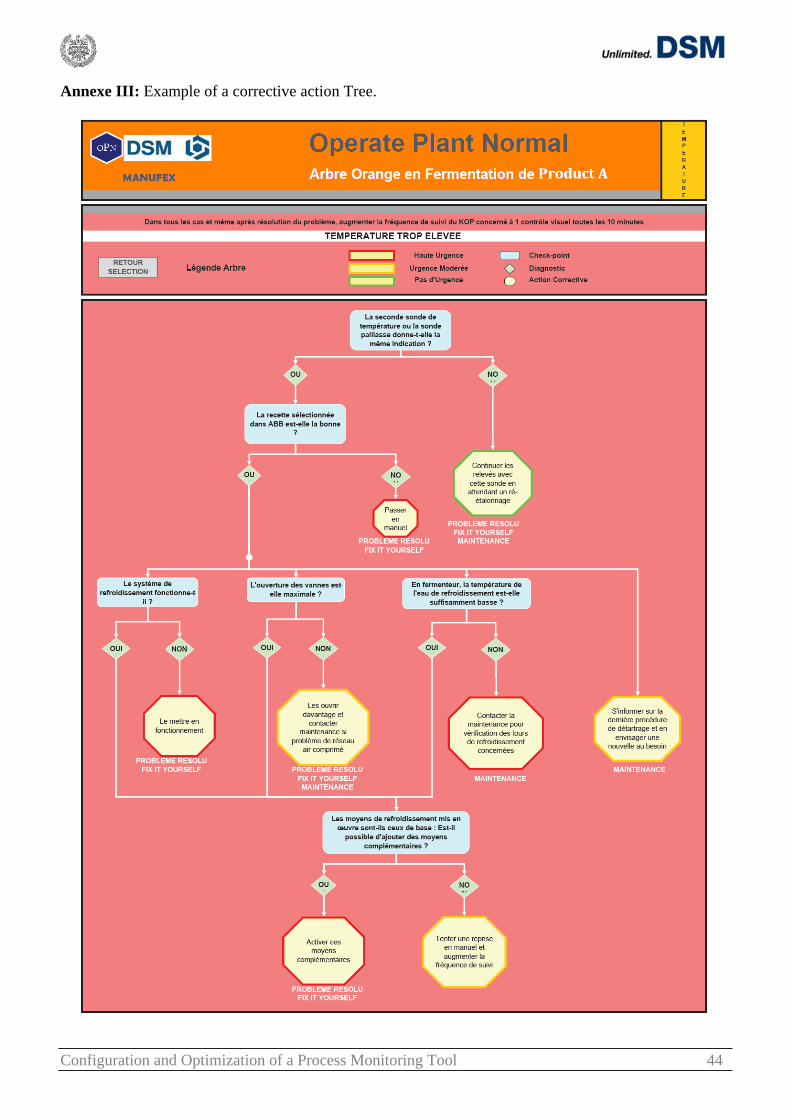
Configuration and Optimization of a Process Monitoring Tool 44
Annexe III: Example of a corrective action Tree.
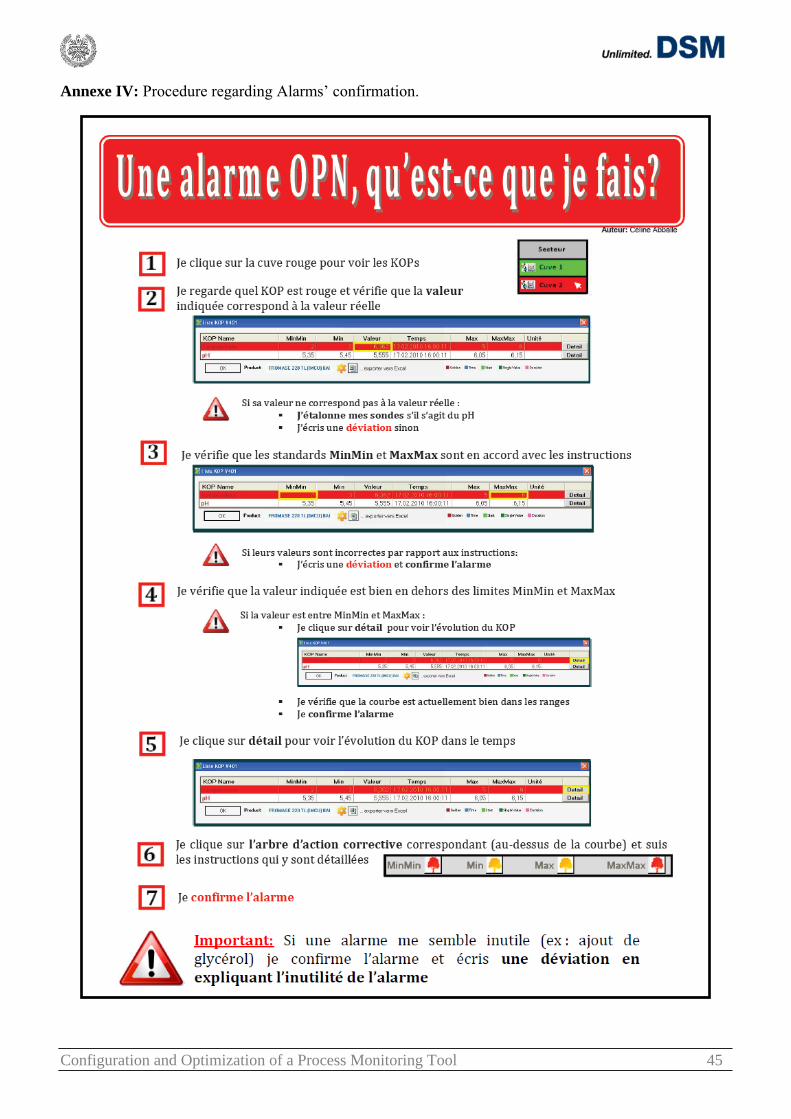
Configuration and Optimization of a Process Monitoring Tool 45
Annexe IV: Procedure regarding Alarms‟ confirmation.
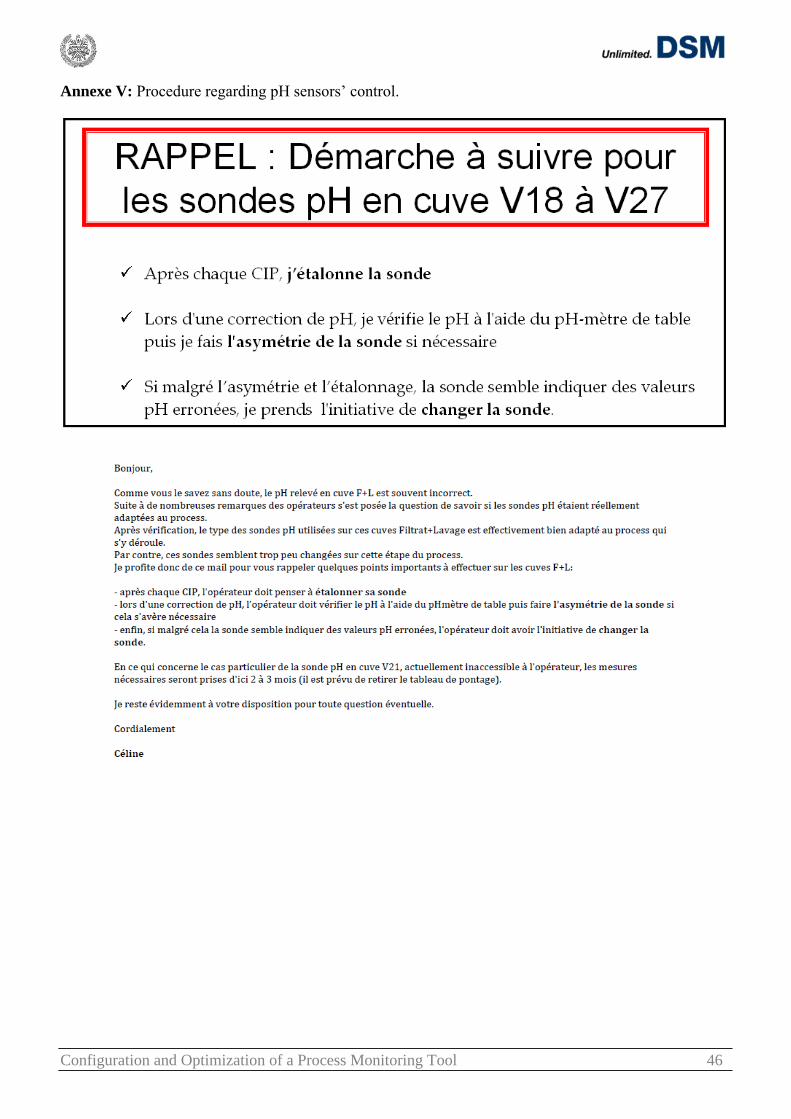
Configuration and Optimization of a Process Monitoring Tool 46
Annexe V: Procedure regarding pH sensors‟ control.
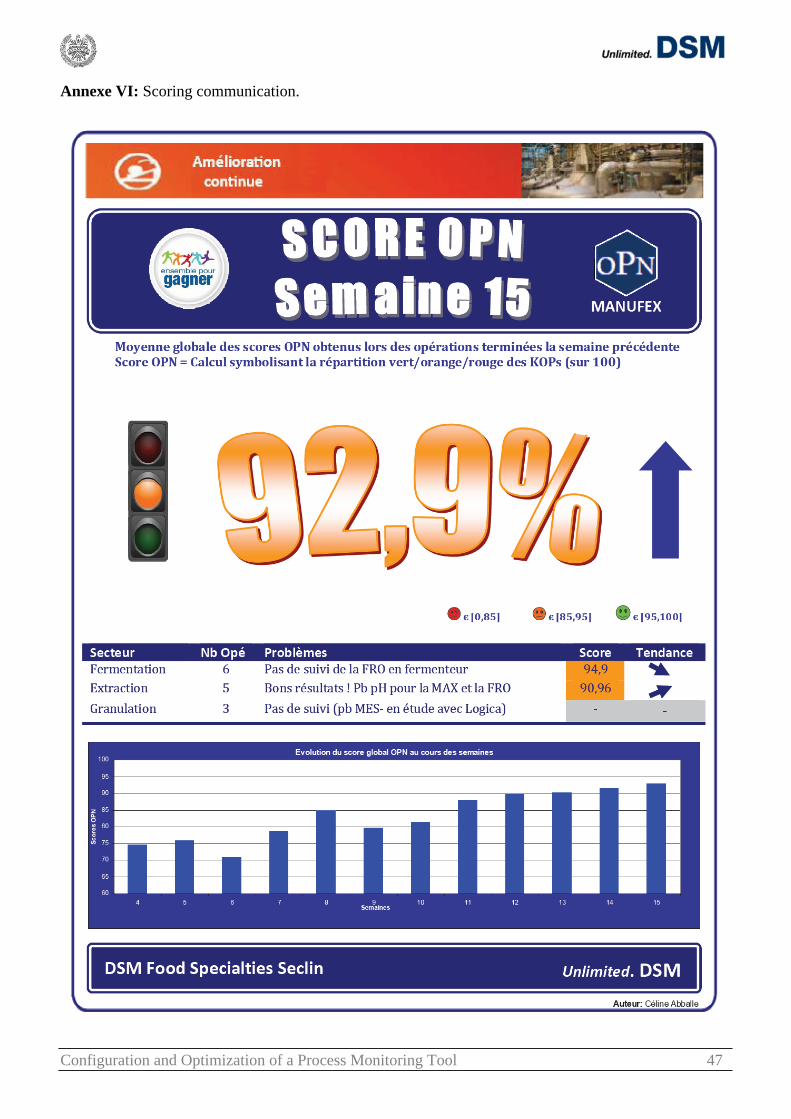
Configuration and Optimization of a Process Monitoring Tool 47
Annexe VI: Scoring communication.
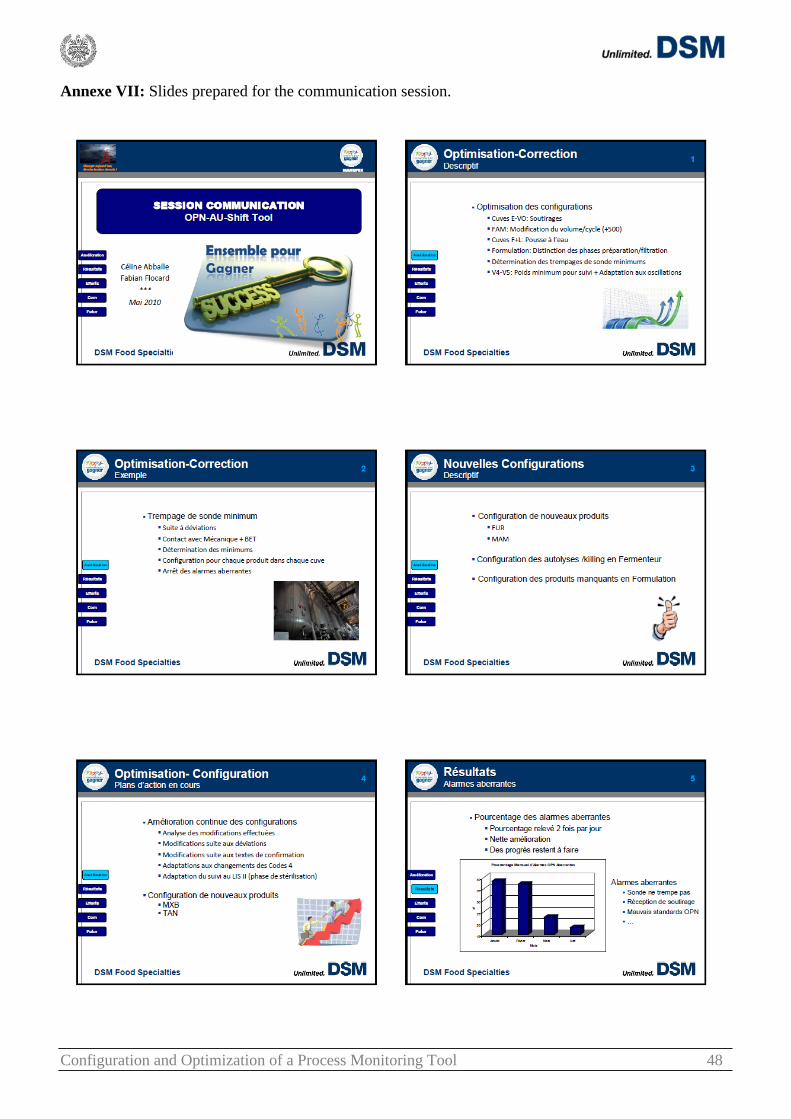
Configuration and Optimization of a Process Monitoring Tool 48
Annexe VII: Slides prepared for the communication session.
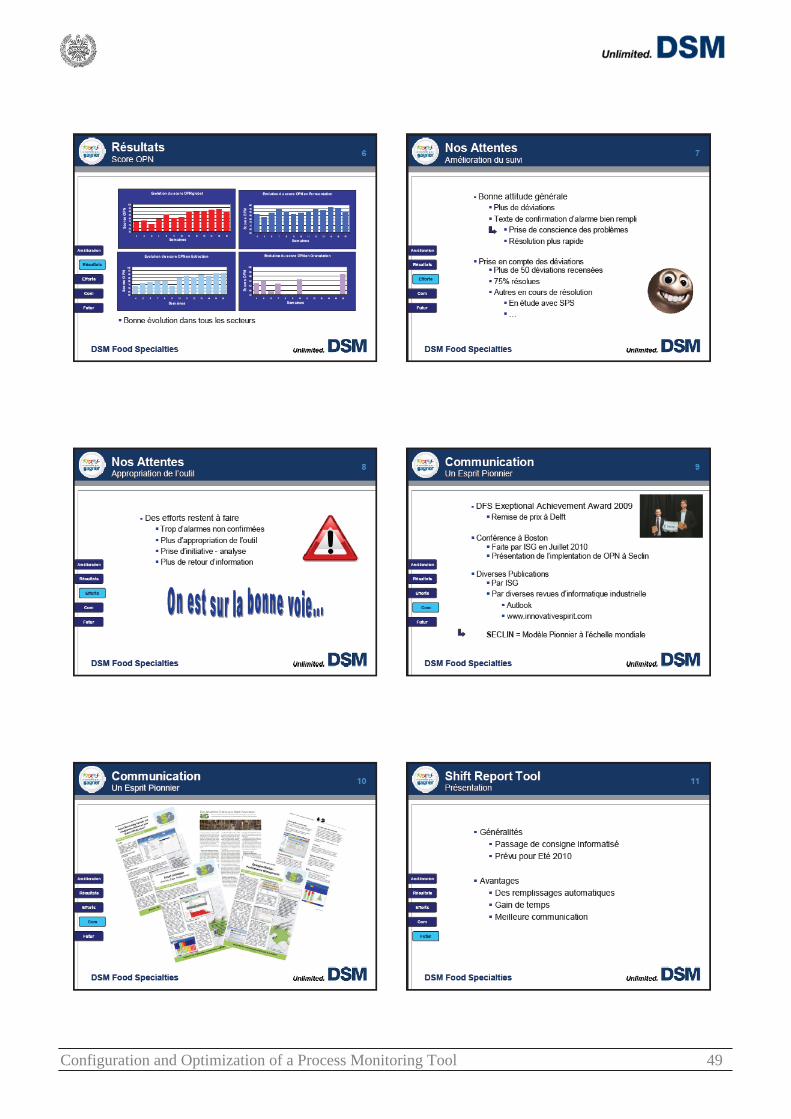
Configuration and Optimization of a Process Monitoring Tool 49
Configuration and Optimization of a Process Monitoring Tool 50
![Message Source Configuration: Monitoring Values. [vpo_mgr_src_monitor] 2 Message Source Configuration: Monitoring Values Section Overview Monitor Configuration](https://img.pdfslide.us/doc/110x75/56649d6e5503460f94a4f476/message-source-configuration-monitoring-values-vpomgrsrcmonitor-2-message.jpg)