Embed Size (px)
Citation preview

AAWE 9TH ANNUAL CONFERENCE, MENDOZA, MAY 26-31, 2015
SOMMELIERS, RESTAURANTS AND WINE PRICE MARKUP
Florine Livat & Hervé Remaud
Kedge Business School
Corresponding author: [email protected]
OUTLINE
Introduction
Literature
Model and data
Results
Conclusion
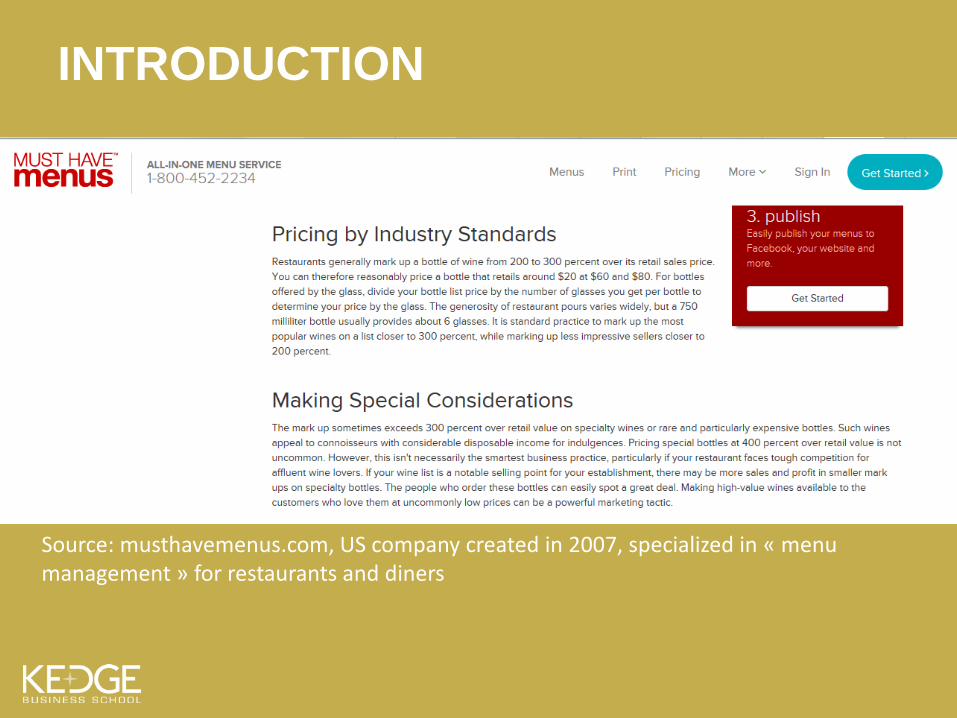
INTRODUCTION
Source: musthavemenus.com, US company created in 2007, specialized in « menu management » for restaurants and diners
INTRODUCTION
Markup: Added by firms to the marginal cost of production
under monopolistic competition
In case of market power
Pricing decision-making process
Wine price markup in restaurants
INTRODUCTION Potential margin with wine determine buying decisions
on the restaurant side (Preszler and Schmidt, 2009)
Consumers satisfaction with wine in restaurants depends partly on wine prices (Choi and Silkes, 2010)
► What are the determinants of wine price markup size in the case of restaurants?

LITERATURE Differentiation allows firm to charge a markup
Markup size measure the competitive pressure (Ponivar
and Tajnikar, 2012)
Mark-up size determinants Firm-specific factors, connected with market power and firm’s
strategies (Schmalensee, 1989 ; Martin, 2001) Industry-specific factors (Sutton, 2001): concentration, entry
barriers, product differentiation, technology in the industry, demand dynamics
Environmental and institutionnal factors (Dunn, 2002): antitrust policy, role of unions, economic trends (Motta, 2004)

LITERATURE Wine list as a way to differentiate restaurants (Berenguer
et al., 2008 ; Gil et al., 2009)
Wine lists as a merchandising tool (Yang and Lynn, 2009)
Restaurant revenue and profitability management Contribution to restaurant performance and success (perceived
quality, customer loyalty, customer satisfaction, etc. see Sirieix et al., 2011 for a review)
Wine as a relevant item to manage restaurant profitability (Thompson, 2010)
Restaurants: a proportionally smaller markup is applied to higher priced wines (Amspacher, 2011)
LITERATURE A « good » wine list
Wine-food pairing recommendations (Dodd, 1997, Wansink et al., 2006)
Wine list order (Corsi et al., 2010) Refreshed on a regular basis (Saura et al., 2008 ; Contri et al.,
2009) Included in the food menu, not including $ in the price format,
including mentions of wine from a specific set of wineries, including a « Reserve » category (Yang and Lynn, 2009)
Wine list design (see Sirieix et al., 2011 for a review) Restaurant’s style Relationship with the wine supplier Ability to maximize profit Etc.
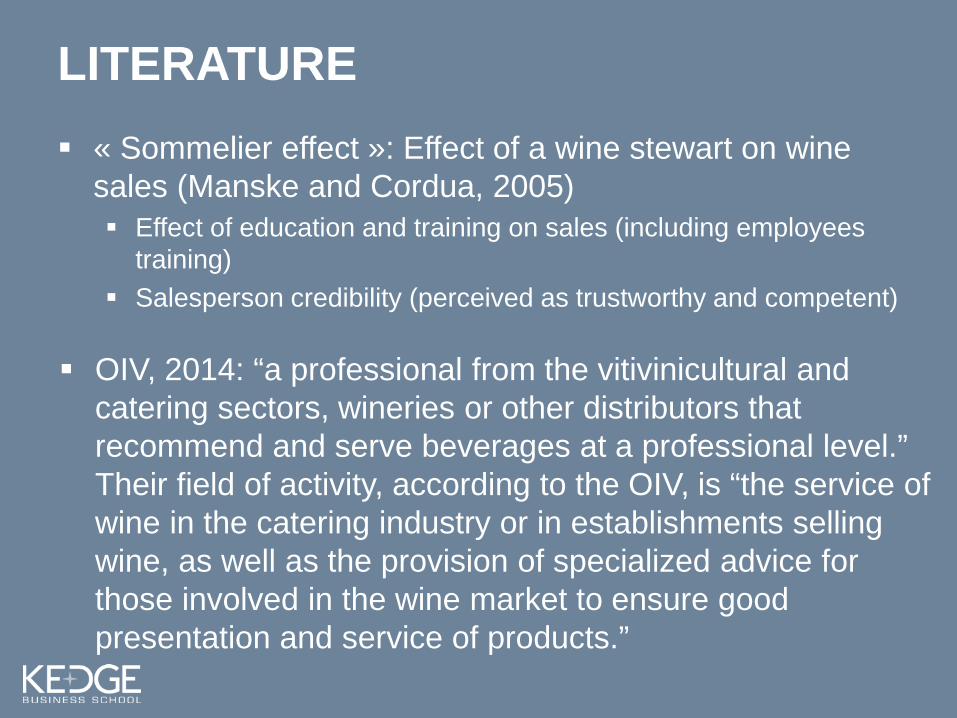
LITERATURE « Sommelier effect »: Effect of a wine stewart on wine
sales (Manske and Cordua, 2005) Effect of education and training on sales (including employees
training) Salesperson credibility (perceived as trustworthy and competent)
OIV, 2014: “a professional from the vitivinicultural and
catering sectors, wineries or other distributors that recommend and serve beverages at a professional level.” Their field of activity, according to the OIV, is “the service of wine in the catering industry or in establishments selling wine, as well as the provision of specialized advice for those involved in the wine market to ensure good presentation and service of products.”
MODEL AND DATA
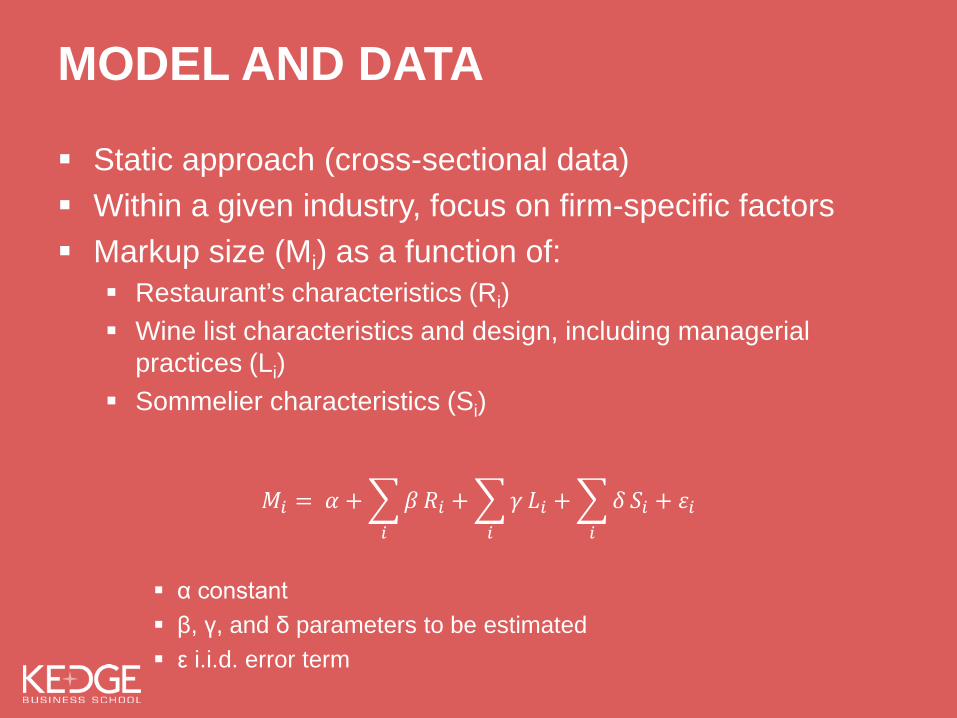
Static approach (cross-sectional data) Within a given industry, focus on firm-specific factors Markup size (Mi) as a function of:
Restaurant’s characteristics (Ri) Wine list characteristics and design, including managerial
practices (Li) Sommelier characteristics (Si)
α constant β, γ, and δ parameters to be estimated ε i.i.d. error term
𝑀𝑖 = 𝛼 + �𝛽𝑖
𝑅𝑖 + �𝛾𝑖
𝐿𝑖 + �𝛿𝑖
𝑆𝑖 + 𝜀𝑖

MODEL AND DATA
Survey conducted online worldwide in February - May 2014
Recruitment process: invitation sent to (Sommeliers International Association - ASI) presidents who forwarded the invitation + web link to their members + MWs
More than 800 sommeliers got connected, most of them
members of the ASI
267 questionnaires fully completed
MODEL AND DATA

Level of wine price markup per price range The restaurant The wine list design and management Sommelier profile and function
MODEL AND DATA
0
20
40
60
80
100
120
140
160
180
200
Wines bought < 5€
Wines bought 6 to 10€
Wines bought 11 to 15€
Wines bought 16 to 20€
Wines bought 21 to 30€
Wines bought 31 to 50€
Wines bought > 50€
199
179 168
159
138
125
111
133
114 106
100 89
84 83
%
Price range per bottle
Average Markup per bottle (in %)
Mark-up
Std. Dev.
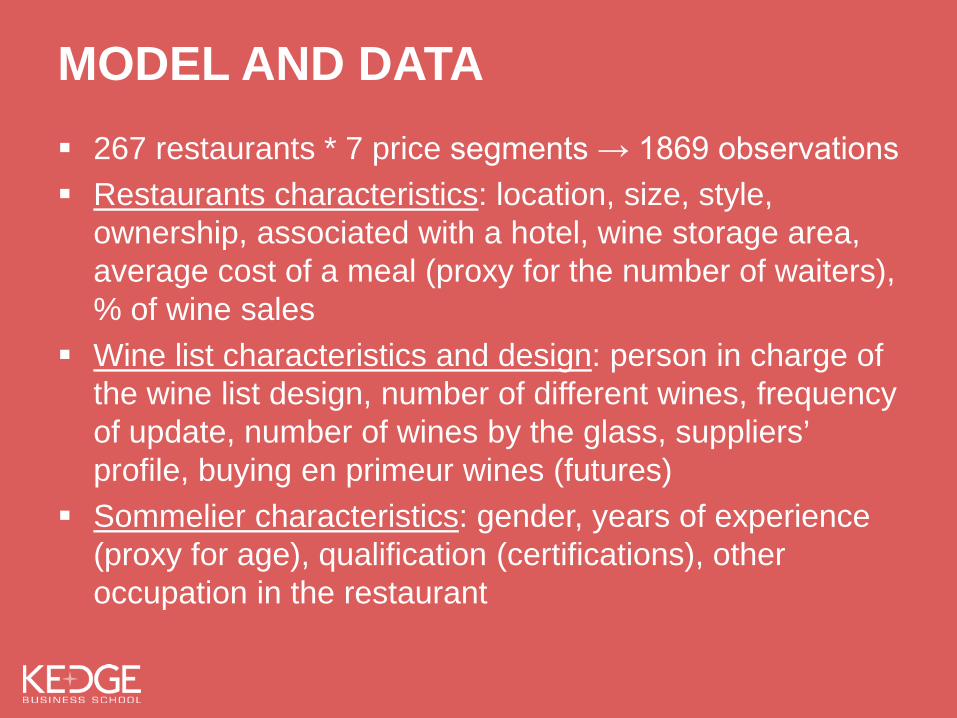
MODEL AND DATA 267 restaurants * 7 price segments → 1869 observations Restaurants characteristics: location, size, style,
ownership, associated with a hotel, wine storage area, average cost of a meal (proxy for the number of waiters), % of wine sales
Wine list characteristics and design: person in charge of the wine list design, number of different wines, frequency of update, number of wines by the glass, suppliers’ profile, buying en primeur wines (futures)
Sommelier characteristics: gender, years of experience (proxy for age), qualification (certifications), other occupation in the restaurant
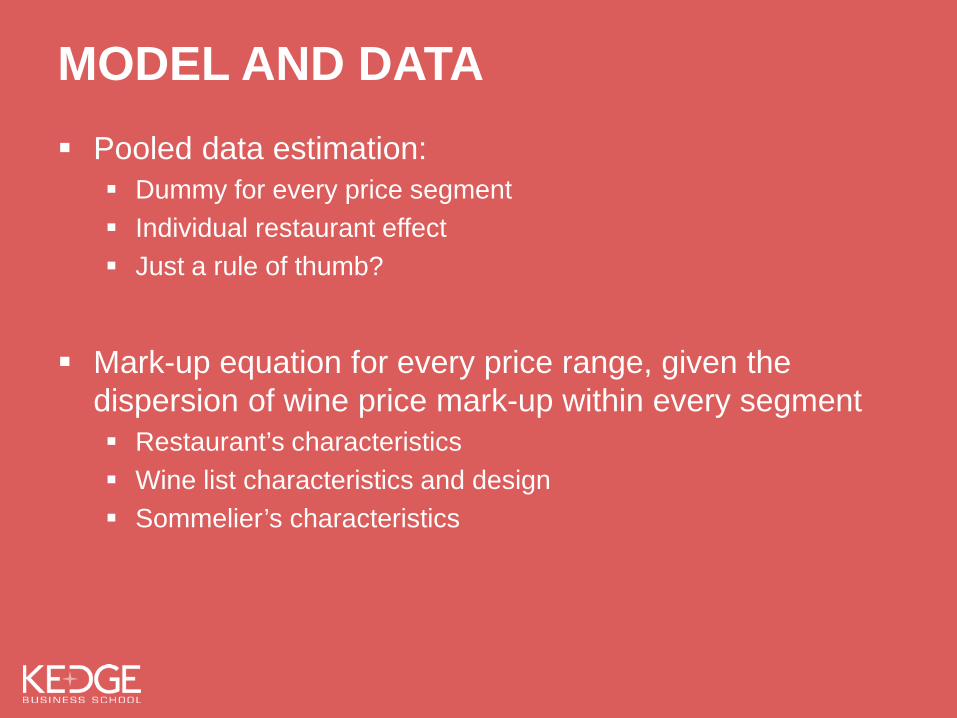
MODEL AND DATA Pooled data estimation:
Dummy for every price segment Individual restaurant effect Just a rule of thumb?
Mark-up equation for every price range, given the
dispersion of wine price mark-up within every segment Restaurant’s characteristics Wine list characteristics and design Sommelier’s characteristics

RESULTS Mark-up size equation (cross-sectionnal regression, pooled data, individual restaurant effect) Price range Coef. t-stat Wine purchased less than 5 euros per bottle 87.4382*** 20.01 Wine purchased between 6 and 10 euros per bottle 67.57303*** 15.46 Wine purchased between 11 and 15 euros per bottle 56.75281*** 12.99 Wine purchased between 16 and 20 euros per bottle 47.46816*** 10.86 Wine purchased between 21 and 30 euros per bottle 26.59925*** 6.09 Wine purchased between 31 and 50 euros per bottle 13.40824*** 3.07 Wine purchased more than 50 euros per bottle Ref. Intercept 111.8202*** 36.19 Within R² 0.2750 Between R² 0.0100 Overall R²° 0.0726 ° No unanimous agreement on which R² to report in a panel. Wooldridge (2010) suggest to report the three measures. *** significantly different from zero at 1%.
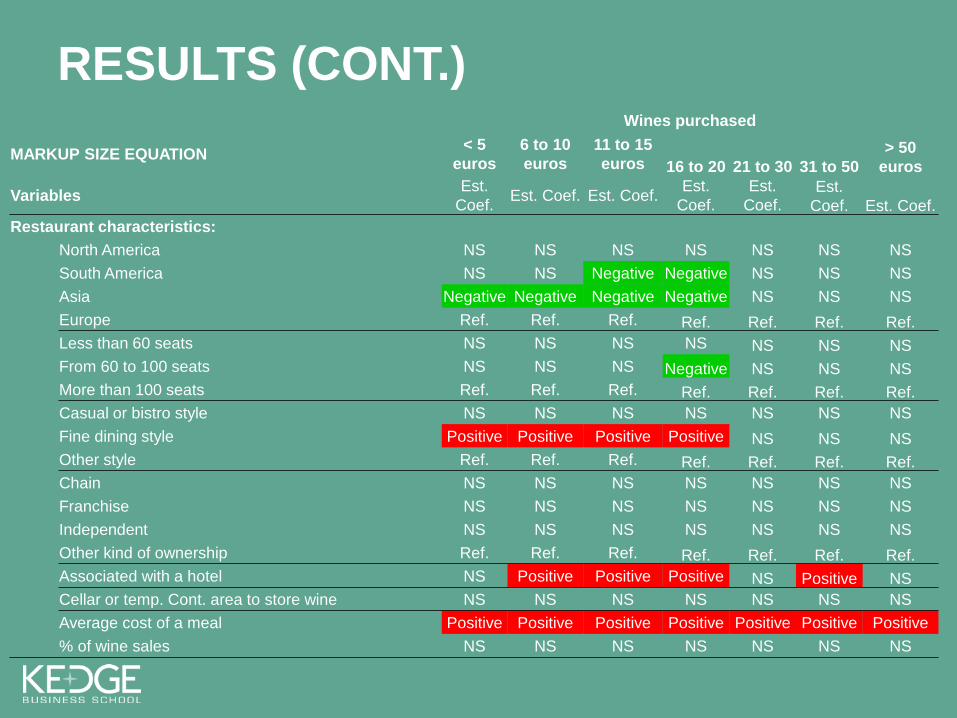
RESULTS (CONT.) Wines purchased
MARKUP SIZE EQUATION < 5 euros
6 to 10 euros
11 to 15 euros 16 to 20 21 to 30 31 to 50
> 50 euros
Variables Est. Coef. Est. Coef. Est. Coef. Est.
Coef. Est.
Coef. Est.
Coef. Est. Coef. Restaurant characteristics:
North America NS NS NS NS NS NS NS South America NS NS Negative Negative NS NS NS Asia Negative Negative Negative Negative NS NS NS Europe Ref. Ref. Ref. Ref. Ref. Ref. Ref. Less than 60 seats NS NS NS NS NS NS NS From 60 to 100 seats NS NS NS Negative NS NS NS More than 100 seats Ref. Ref. Ref. Ref. Ref. Ref. Ref. Casual or bistro style NS NS NS NS NS NS NS Fine dining style Positive Positive Positive Positive NS NS NS Other style Ref. Ref. Ref. Ref. Ref. Ref. Ref. Chain NS NS NS NS NS NS NS Franchise NS NS NS NS NS NS NS Independent NS NS NS NS NS NS NS Other kind of ownership Ref. Ref. Ref. Ref. Ref. Ref. Ref. Associated with a hotel NS Positive Positive Positive NS Positive NS Cellar or temp. Cont. area to store wine NS NS NS NS NS NS NS Average cost of a meal Positive Positive Positive Positive Positive Positive Positive
% of wine sales NS NS NS NS NS NS NS

RESULTS (CONT.) Wines purchased
< 5 euros
6 to 10 euros
11 to 15 euros 16 to 20 21 to 30 31 to 50
> 50 euros
Variables Est. Coef. Est. Coef. Est. Coef. Est.
Coef. Est.
Coef. Est.
Coef. Est. Coef. Wine list characteristics:
Number of different wines NS NS NS NS NS NS NS Number of wines offered by the glass NS NS NS NS NS NS NS Monthly update NS NS NS NS NS NS NS Every 3 months update NS NS NS NS NS NS NS Every 6 month update NS NS NS NS NS NS NS Less frequent update Ref. Ref. Ref. Ref. Ref. Ref. Ref. Buy en primeur wines NS NS NS NS NS NS NS % of wines purchased directly from the wine estate NS NS NS NS NS NS NS % of wines purchased from an agent NS NS NS NS NS NS NS % of wines purchased from a merchant or distributor NS NS NS NS NS NS NS % of wines purchased from an importer NS NS NS NS NS NS NS Sommelier in charge of wine list design NS NS NS NS NS NS NS Food & beverage managers in charge of wine list design Negative Negative Negative Negative Negative Negative Negative
Chef in charge of wine list design NS NS NS NS NS NS NS Owner in charge of wine list design Positive Positive NS NS NS NS NS Other person in charge of the wine list Ref. Ref. Ref. Ref. Ref. Ref. Ref.

RESULTS (CONT.) Wines purchased
MARKUP SIZE EQUATION Less
than 5 euros
6 to 10 euros
11 to 15 euros 16 to 20 21 to 30 31 to 50
More than 50 euros
Variables Est. Coef. Est. Coef. Est. Coef. Est.
Coef. Est.
Coef. Est.
Coef. Est. Coef. Sommelier characteristics:
Gender (male=1) NS NS NS NS NS NS NS More than 10 years of experience as sommelier NS NS NS NS NS Negative Negative Sommelier certification NS NS NS NS NS NS NS WSET level, 1, 2 or 3 NS NS NS NS NS NS NS WSET level 4 NS NS NS NS NS NS NS Title at sommelier competition NS NS NS NS NS NS NS Other qualification NS NS NS NS NS NS NS Only sommelier NS NS NS NS NS NS NS Also waiter NS NS NS NS NS NS NS Also wine director NS NS NS NS NS NS NS Also food & beverage manager NS NS NS NS NS NS NS Also restaurant manager NS NS NS NS NS NS NS
Also other function Ref. Ref. Ref. Ref. Ref. Ref. Ref. Intercept Positive Positive Positive Positive Positive Positive Positive
Number of observations 267 267 267 267 267 267 267 R² 0.2275 0.2438 0.2770 0.2461 0.2647 0.2365 0.1744 *, **, *** significantly different from zero at, respectively, 10, 5 and 1%.
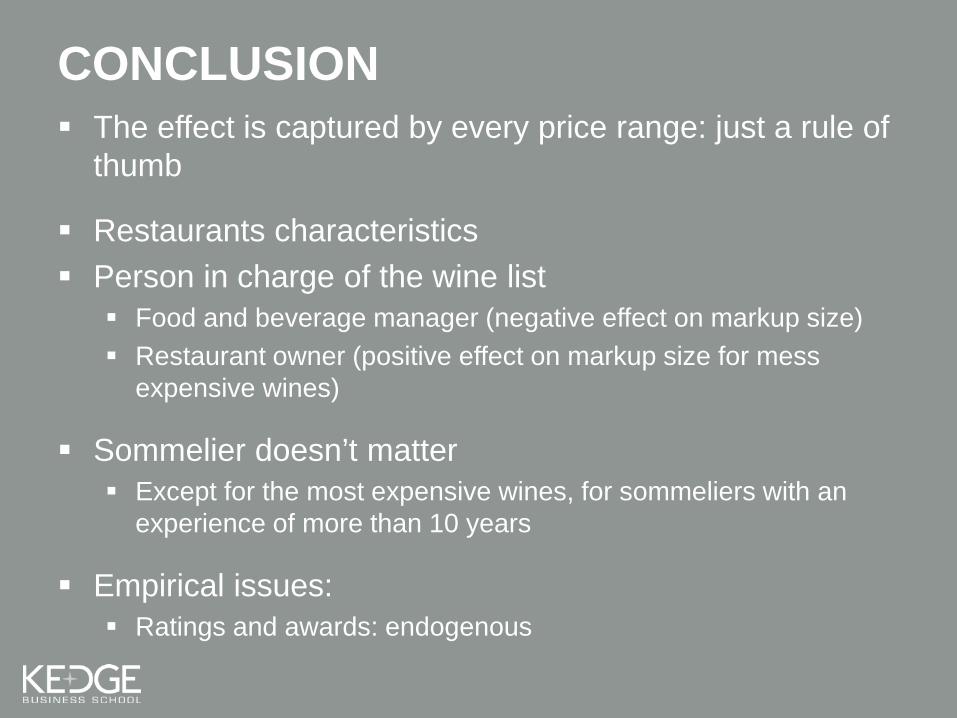
CONCLUSION The effect is captured by every price range: just a rule of
thumb
Restaurants characteristics Person in charge of the wine list
Food and beverage manager (negative effect on markup size) Restaurant owner (positive effect on markup size for mess
expensive wines)
Sommelier doesn’t matter Except for the most expensive wines, for sommeliers with an
experience of more than 10 years
Empirical issues: Ratings and awards: endogenous
SOMMELIERS, RESTAURANTS AND WINE PRICE MARKUP
Florine Livat & Hervé Remaud Kedge Business School
Corresponding author: [email protected]
Thank you for your attention QUESTIONS & ANSWERS