Embed Size (px)
Citation preview
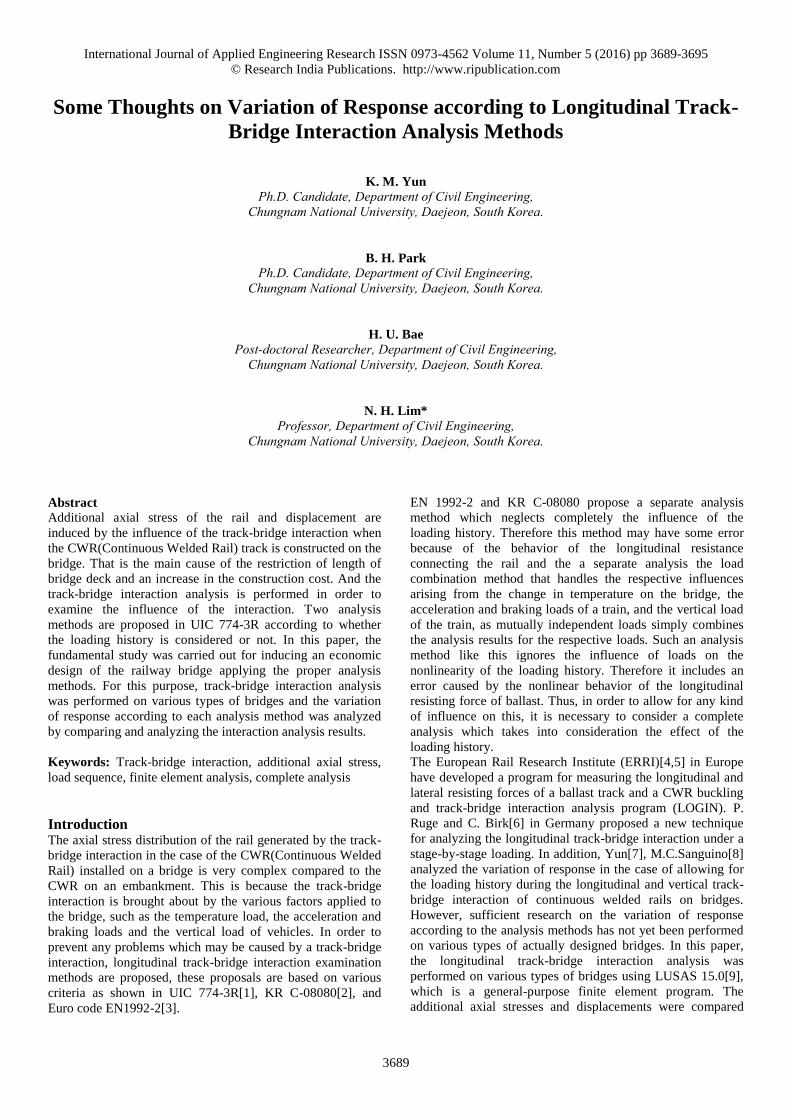
International Journal of Applied Engineering Research ISSN 0973-4562 Volume 11, Number 5 (2016) pp 3689-3695
© Research India Publications. http://www.ripublication.com
3689
Some Thoughts on Variation of Response according to Longitudinal Track-
Bridge Interaction Analysis Methods
K. M. Yun
Ph.D. Candidate, Department of Civil Engineering, Chungnam National University, Daejeon, South Korea.
B. H. Park
Ph.D. Candidate, Department of Civil Engineering, Chungnam National University, Daejeon, South Korea.
H. U. Bae
Post-doctoral Researcher, Department of Civil Engineering, Chungnam National University, Daejeon, South Korea.
N. H. Lim* Professor, Department of Civil Engineering,
Chungnam National University, Daejeon, South Korea.
Abstract
Additional axial stress of the rail and displacement are
induced by the influence of the track-bridge interaction when
the CWR(Continuous Welded Rail) track is constructed on the
bridge. That is the main cause of the restriction of length of
bridge deck and an increase in the construction cost. And the
track-bridge interaction analysis is performed in order to
examine the influence of the interaction. Two analysis
methods are proposed in UIC 774-3R according to whether
the loading history is considered or not. In this paper, the
fundamental study was carried out for inducing an economic
design of the railway bridge applying the proper analysis
methods. For this purpose, track-bridge interaction analysis
was performed on various types of bridges and the variation
of response according to each analysis method was analyzed
by comparing and analyzing the interaction analysis results.
Keywords: Track-bridge interaction, additional axial stress,
load sequence, finite element analysis, complete analysis
Introduction The axial stress distribution of the rail generated by the track-
bridge interaction in the case of the CWR(Continuous Welded
Rail) installed on a bridge is very complex compared to the
CWR on an embankment. This is because the track-bridge
interaction is brought about by the various factors applied to
the bridge, such as the temperature load, the acceleration and
braking loads and the vertical load of vehicles. In order to
prevent any problems which may be caused by a track-bridge
interaction, longitudinal track-bridge interaction examination
methods are proposed, these proposals are based on various
criteria as shown in UIC 774-3R[1], KR C-08080[2], and
Euro code EN1992-2[3].
EN 1992-2 and KR C-08080 propose a separate analysis
method which neglects completely the influence of the
loading history. Therefore this method may have some error
because of the behavior of the longitudinal resistance
connecting the rail and the a separate analysis the load
combination method that handles the respective influences
arising from the change in temperature on the bridge, the
acceleration and braking loads of a train, and the vertical load
of the train, as mutually independent loads simply combines
the analysis results for the respective loads. Such an analysis
method like this ignores the influence of loads on the
nonlinearity of the loading history. Therefore it includes an
error caused by the nonlinear behavior of the longitudinal
resisting force of ballast. Thus, in order to allow for any kind
of influence on this, it is necessary to consider a complete
analysis which takes into consideration the effect of the
loading history.
The European Rail Research Institute (ERRI)[4,5] in Europe
have developed a program for measuring the longitudinal and
lateral resisting forces of a ballast track and a CWR buckling
and track-bridge interaction analysis program (LOGIN). P.
Ruge and C. Birk[6] in Germany proposed a new technique
for analyzing the longitudinal track-bridge interaction under a
stage-by-stage loading. In addition, Yun[7], M.C.Sanguino[8]
analyzed the variation of response in the case of allowing for
the loading history during the longitudinal and vertical track-
bridge interaction of continuous welded rails on bridges.
However, sufficient research on the variation of response
according to the analysis methods has not yet been performed
on various types of actually designed bridges. In this paper,
the longitudinal track-bridge interaction analysis was
performed on various types of bridges using LUSAS 15.0[9],
which is a general-purpose finite element program. The
additional axial stresses and displacements were compared
International Journal of Applied Engineering Research ISSN 0973-4562 Volume 11, Number 5 (2016) pp 3689-3695
© Research India Publications. http://www.ripublication.com
3690
and analyzed according to two different analysis methods:
One is the separate analysis, which individually considers the
loads that generate the longitudinal track-bridge interaction,
and the second is a complete analysis, which considers the
history of the short and long-term loads.
Analysis Methods UIC 774-3R provides two analysis methods according to the
structural design of a bridge and its importance. It suggests
both the separate analysis method and the complete analysis
method in order to select one of the two analysis methods for
the purpose of performing analysis.
Separate analysis The separate analysis method considers the temperature load,
the acceleration/braking loads and the vertical load
independently without taking the load combination into
consideration. And the additional stress of the rail is
calculated as Eq.1
( )
( / ) ( )
R R temperature loadR acceleration braking bending
(1)
where, the value of 1 is used for α, β and γ respectively.
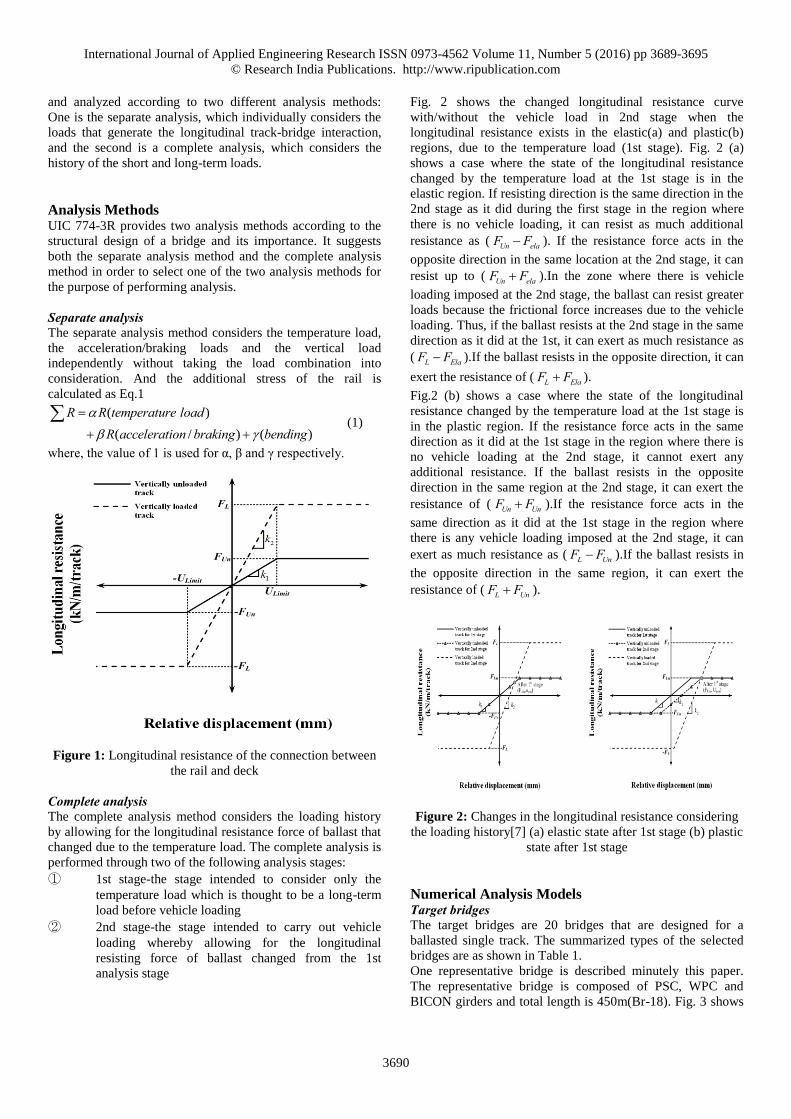
Figure 1: Longitudinal resistance of the connection between
the rail and deck
Complete analysis The complete analysis method considers the loading history
by allowing for the longitudinal resistance force of ballast that
changed due to the temperature load. The complete analysis is
performed through two of the following analysis stages:
① 1st stage-the stage intended to consider only the
temperature load which is thought to be a long-term
load before vehicle loading
② 2nd stage-the stage intended to carry out vehicle
loading whereby allowing for the longitudinal
resisting force of ballast changed from the 1st
analysis stage
Fig. 2 shows the changed longitudinal resistance curve
with/without the vehicle load in 2nd stage when the
longitudinal resistance exists in the elastic(a) and plastic(b)
regions, due to the temperature load (1st stage). Fig. 2 (a)
shows a case where the state of the longitudinal resistance
changed by the temperature load at the 1st stage is in the
elastic region. If resisting direction is the same direction in the
2nd stage as it did during the first stage in the region where
there is no vehicle loading, it can resist as much additional
resistance as ( Un elaF F ). If the resistance force acts in the
opposite direction in the same location at the 2nd stage, it can
resist up to ( Un elaF F ).In the zone where there is vehicle
loading imposed at the 2nd stage, the ballast can resist greater
loads because the frictional force increases due to the vehicle
loading. Thus, if the ballast resists at the 2nd stage in the same
direction as it did at the 1st, it can exert as much resistance as
( L ElaF F ).If the ballast resists in the opposite direction, it can
exert the resistance of ( L ElaF F ).
Fig.2 (b) shows a case where the state of the longitudinal
resistance changed by the temperature load at the 1st stage is
in the plastic region. If the resistance force acts in the same
direction as it did at the 1st stage in the region where there is
no vehicle loading at the 2nd stage, it cannot exert any
additional resistance. If the ballast resists in the opposite
direction in the same region at the 2nd stage, it can exert the
resistance of ( Un UnF F ).If the resistance force acts in the
same direction as it did at the 1st stage in the region where
there is any vehicle loading imposed at the 2nd stage, it can
exert as much resistance as ( L UnF F ).If the ballast resists in
the opposite direction in the same region, it can exert the
resistance of ( L UnF F ).
Figure 2: Changes in the longitudinal resistance considering
the loading history[7] (a) elastic state after 1st stage (b) plastic
state after 1st stage
Numerical Analysis Models Target bridges The target bridges are 20 bridges that are designed for a
ballasted single track. The summarized types of the selected
bridges are as shown in Table 1.
One representative bridge is described minutely this paper.
The representative bridge is composed of PSC, WPC and
BICON girders and total length is 450m(Br-18). Fig. 3 shows
International Journal of Applied Engineering Research ISSN 0973-4562 Volume 11, Number 5 (2016) pp 3689-3695
© Research India Publications. http://www.ripublication.com
3691
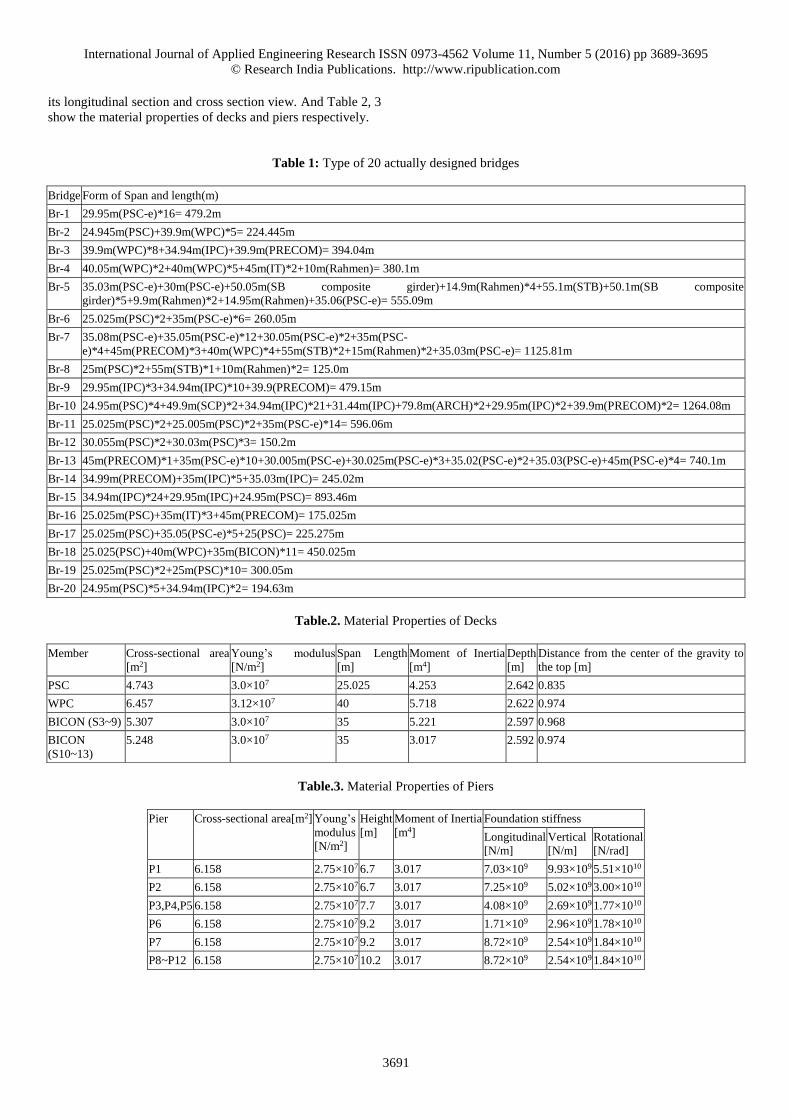
its longitudinal section and cross section view. And Table 2, 3
show the material properties of decks and piers respectively.
Table 1: Type of 20 actually designed bridges
Bridge Form of Span and length(m)
Br-1 29.95m(PSC-e)*16= 479.2m
Br-2 24.945m(PSC)+39.9m(WPC)*5= 224.445m
Br-3 39.9m(WPC)*8+34.94m(IPC)+39.9m(PRECOM)= 394.04m
Br-4 40.05m(WPC)*2+40m(WPC)*5+45m(IT)*2+10m(Rahmen)= 380.1m
Br-5 35.03m(PSC-e)+30m(PSC-e)+50.05m(SB composite girder)+14.9m(Rahmen)*4+55.1m(STB)+50.1m(SB composite
girder)*5+9.9m(Rahmen)*2+14.95m(Rahmen)+35.06(PSC-e)= 555.09m
Br-6 25.025m(PSC)*2+35m(PSC-e)*6= 260.05m
Br-7 35.08m(PSC-e)+35.05m(PSC-e)*12+30.05m(PSC-e)*2+35m(PSC-
e)*4+45m(PRECOM)*3+40m(WPC)*4+55m(STB)*2+15m(Rahmen)*2+35.03m(PSC-e)= 1125.81m
Br-8 25m(PSC)*2+55m(STB)*1+10m(Rahmen)*2= 125.0m
Br-9 29.95m(IPC)*3+34.94m(IPC)*10+39.9(PRECOM)= 479.15m
Br-10 24.95m(PSC)*4+49.9m(SCP)*2+34.94m(IPC)*21+31.44m(IPC)+79.8m(ARCH)*2+29.95m(IPC)*2+39.9m(PRECOM)*2= 1264.08m
Br-11 25.025m(PSC)*2+25.005m(PSC)*2+35m(PSC-e)*14= 596.06m
Br-12 30.055m(PSC)*2+30.03m(PSC)*3= 150.2m
Br-13 45m(PRECOM)*1+35m(PSC-e)*10+30.005m(PSC-e)+30.025m(PSC-e)*3+35.02(PSC-e)*2+35.03(PSC-e)+45m(PSC-e)*4= 740.1m
Br-14 34.99m(PRECOM)+35m(IPC)*5+35.03m(IPC)= 245.02m
Br-15 34.94m(IPC)*24+29.95m(IPC)+24.95m(PSC)= 893.46m
Br-16 25.025m(PSC)+35m(IT)*3+45m(PRECOM)= 175.025m
Br-17 25.025m(PSC)+35.05(PSC-e)*5+25(PSC)= 225.275m
Br-18 25.025(PSC)+40m(WPC)+35m(BICON)*11= 450.025m
Br-19 25.025m(PSC)*2+25m(PSC)*10= 300.05m
Br-20 24.95m(PSC)*5+34.94m(IPC)*2= 194.63m
Table.2. Material Properties of Decks
Member Cross-sectional area
[m2]
Young’s modulus
[N/m2]
Span Length
[m]
Moment of Inertia
[m4]
Depth
[m]
Distance from the center of the gravity to
the top [m]
PSC 4.743 3.0×10⁷ 25.025 4.253 2.642 0.835
WPC 6.457 3.12×10⁷ 40 5.718 2.622 0.974
BICON (S3~9) 5.307 3.0×10⁷ 35 5.221 2.597 0.968
BICON
(S10~13)
5.248 3.0×10⁷ 35 3.017 2.592 0.974
Table.3. Material Properties of Piers
Pier Cross-sectional area[m2] Young’s
modulus
[N/m2]
Height
[m]
Moment of Inertia
[m4]
Foundation stiffness
Longitudinal
[N/m]
Vertical
[N/m]
Rotational
[N/rad]
P1 6.158 2.75×10⁷ 6.7 3.017 7.03×10⁹ 9.93×10⁹ 5.51×10¹⁰
P2 6.158 2.75×10⁷ 6.7 3.017 7.25×10⁹ 5.02×10⁹ 3.00×10¹⁰
P3,P4,P5 6.158 2.75×10⁷ 7.7 3.017 4.08×10⁹ 2.69×10⁹ 1.77×10¹⁰
P6 6.158 2.75×10⁷ 9.2 3.017 1.71×10⁹ 2.96×10⁹ 1.78×10¹⁰
P7 6.158 2.75×10⁷ 9.2 3.017 8.72×10⁹ 2.54×10⁹ 1.84×10¹⁰
P8~P12 6.158 2.75×10⁷ 10.2 3.017 8.72×10⁹ 2.54×10⁹ 1.84×10¹⁰
International Journal of Applied Engineering Research ISSN 0973-4562 Volume 11, Number 5 (2016) pp 3689-3695
© Research India Publications. http://www.ripublication.com
3692
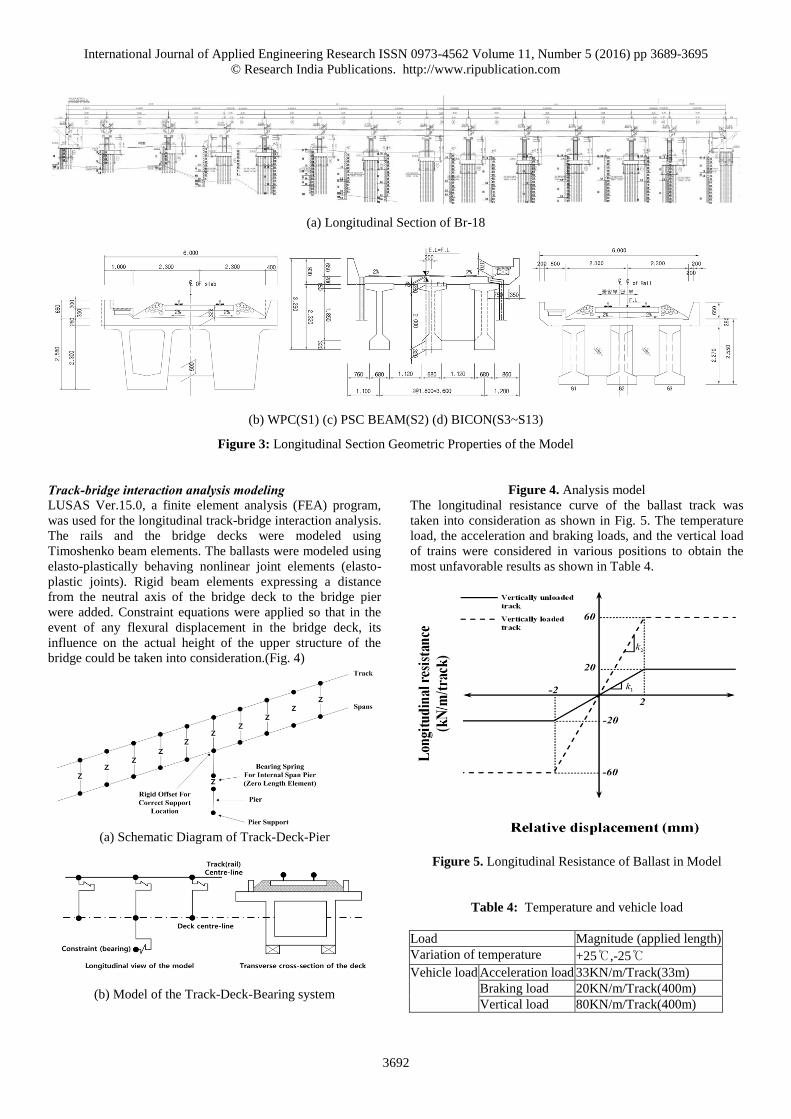
(a) Longitudinal Section of Br-18
(b) WPC(S1) (c) PSC BEAM(S2) (d) BICON(S3~S13)
Figure 3: Longitudinal Section Geometric Properties of the Model
Track-bridge interaction analysis modeling LUSAS Ver.15.0, a finite element analysis (FEA) program,
was used for the longitudinal track-bridge interaction analysis.
The rails and the bridge decks were modeled using
Timoshenko beam elements. The ballasts were modeled using
elasto-plastically behaving nonlinear joint elements (elasto-
plastic joints). Rigid beam elements expressing a distance
from the neutral axis of the bridge deck to the bridge pier
were added. Constraint equations were applied so that in the
event of any flexural displacement in the bridge deck, its
influence on the actual height of the upper structure of the
bridge could be taken into consideration.(Fig. 4)
(a) Schematic Diagram of Track-Deck-Pier
(b) Model of the Track-Deck-Bearing system
Figure 4. Analysis model
The longitudinal resistance curve of the ballast track was
taken into consideration as shown in Fig. 5. The temperature
load, the acceleration and braking loads, and the vertical load
of trains were considered in various positions to obtain the
most unfavorable results as shown in Table 4.
Figure 5. Longitudinal Resistance of Ballast in Model
Table 4: Temperature and vehicle load
Load Magnitude (applied length)
Variation of temperature +25℃,-25℃
Vehicle load Acceleration load 33KN/m/Track(33m)
Braking load 20KN/m/Track(400m)
Vertical load 80KN/m/Track(400m)
International Journal of Applied Engineering Research ISSN 0973-4562 Volume 11, Number 5 (2016) pp 3689-3695
© Research India Publications. http://www.ripublication.com
3693
Track-bridge interaction analysis results according to
analysis
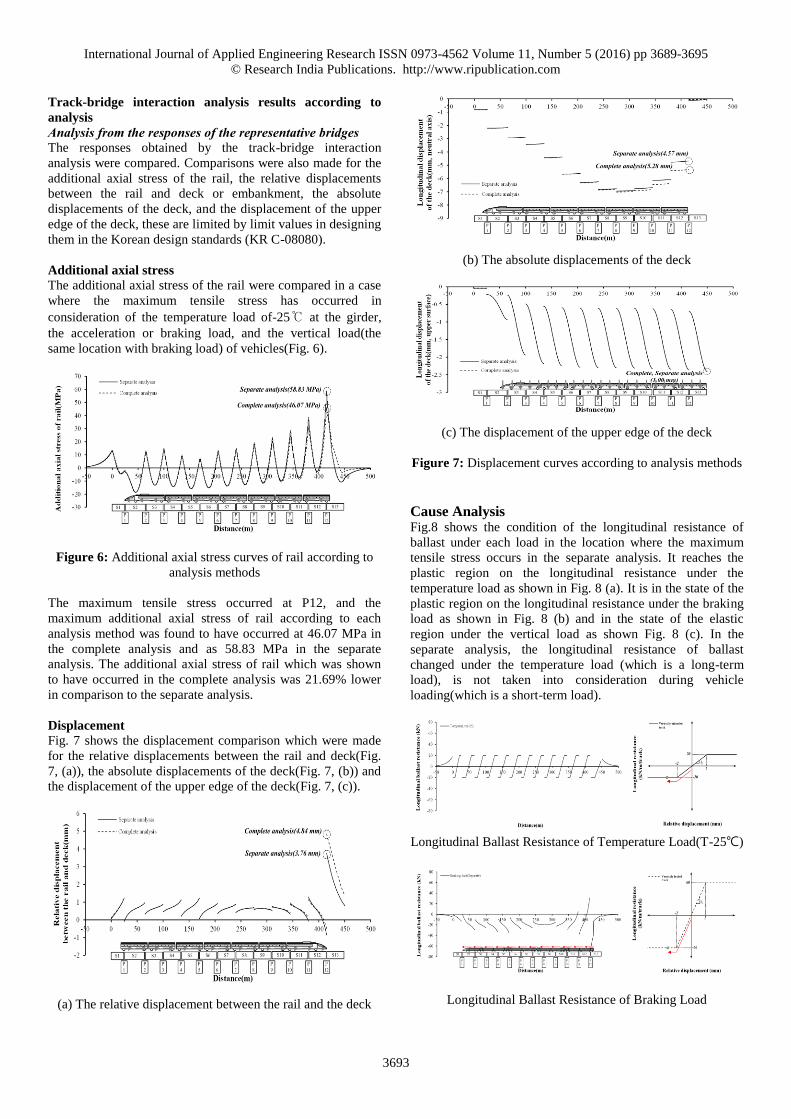
Analysis from the responses of the representative bridges The responses obtained by the track-bridge interaction
analysis were compared. Comparisons were also made for the
additional axial stress of the rail, the relative displacements
between the rail and deck or embankment, the absolute
displacements of the deck, and the displacement of the upper
edge of the deck, these are limited by limit values in designing
them in the Korean design standards (KR C-08080).
Additional axial stress
The additional axial stress of the rail were compared in a case
where the maximum tensile stress has occurred in
consideration of the temperature load of-25℃ at the girder,
the acceleration or braking load, and the vertical load(the
same location with braking load) of vehicles(Fig. 6).
Figure 6: Additional axial stress curves of rail according to
analysis methods
The maximum tensile stress occurred at P12, and the
maximum additional axial stress of rail according to each
analysis method was found to have occurred at 46.07 MPa in
the complete analysis and as 58.83 MPa in the separate
analysis. The additional axial stress of rail which was shown
to have occurred in the complete analysis was 21.69% lower
in comparison to the separate analysis.
Displacement
Fig. 7 shows the displacement comparison which were made
for the relative displacements between the rail and deck(Fig.
7, (a)), the absolute displacements of the deck(Fig. 7, (b)) and
the displacement of the upper edge of the deck(Fig. 7, (c)).
(a) The relative displacement between the rail and the deck
(b) The absolute displacements of the deck
(c) The displacement of the upper edge of the deck
Figure 7: Displacement curves according to analysis methods
Cause Analysis Fig.8 shows the condition of the longitudinal resistance of
ballast under each load in the location where the maximum
tensile stress occurs in the separate analysis. It reaches the
plastic region on the longitudinal resistance under the
temperature load as shown in Fig. 8 (a). It is in the state of the
plastic region on the longitudinal resistance under the braking
load as shown in Fig. 8 (b) and in the state of the elastic
region under the vertical load as shown Fig. 8 (c). In the
separate analysis, the longitudinal resistance of ballast
changed under the temperature load (which is a long-term
load), is not taken into consideration during vehicle
loading(which is a short-term load).
Longitudinal Ballast Resistance of Temperature Load(T-25℃)
Longitudinal Ballast Resistance of Braking Load
International Journal of Applied Engineering Research ISSN 0973-4562 Volume 11, Number 5 (2016) pp 3689-3695
© Research India Publications. http://www.ripublication.com
3694
Longitudinal Ballast Resistance of Vertical Load
Figure 8: Longitudinal Ballast Resistance of Separate
Analysis (Br-18)
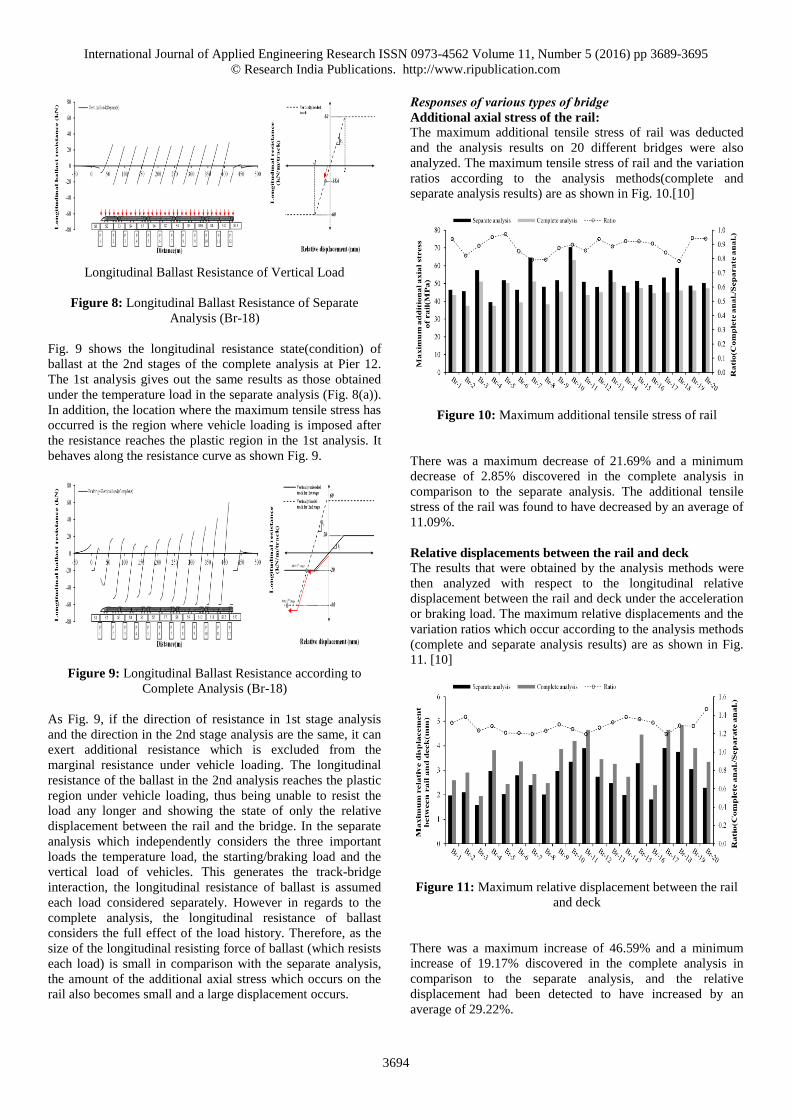
Fig. 9 shows the longitudinal resistance state(condition) of
ballast at the 2nd stages of the complete analysis at Pier 12.
The 1st analysis gives out the same results as those obtained
under the temperature load in the separate analysis (Fig. 8(a)).
In addition, the location where the maximum tensile stress has
occurred is the region where vehicle loading is imposed after
the resistance reaches the plastic region in the 1st analysis. It
behaves along the resistance curve as shown Fig. 9.
Figure 9: Longitudinal Ballast Resistance according to
Complete Analysis (Br-18)
As Fig. 9, if the direction of resistance in 1st stage analysis
and the direction in the 2nd stage analysis are the same, it can
exert additional resistance which is excluded from the
marginal resistance under vehicle loading. The longitudinal
resistance of the ballast in the 2nd analysis reaches the plastic
region under vehicle loading, thus being unable to resist the
load any longer and showing the state of only the relative
displacement between the rail and the bridge. In the separate
analysis which independently considers the three important
loads the temperature load, the starting/braking load and the
vertical load of vehicles. This generates the track-bridge
interaction, the longitudinal resistance of ballast is assumed
each load considered separately. However in regards to the
complete analysis, the longitudinal resistance of ballast
considers the full effect of the load history. Therefore, as the
size of the longitudinal resisting force of ballast (which resists
each load) is small in comparison with the separate analysis,
the amount of the additional axial stress which occurs on the
rail also becomes small and a large displacement occurs.
Responses of various types of bridge Additional axial stress of the rail:
The maximum additional tensile stress of rail was deducted
and the analysis results on 20 different bridges were also
analyzed. The maximum tensile stress of rail and the variation
ratios according to the analysis methods(complete and
separate analysis results) are as shown in Fig. 10.[10]
Figure 10: Maximum additional tensile stress of rail
There was a maximum decrease of 21.69% and a minimum
decrease of 2.85% discovered in the complete analysis in
comparison to the separate analysis. The additional tensile
stress of the rail was found to have decreased by an average of
11.09%.
Relative displacements between the rail and deck
The results that were obtained by the analysis methods were
then analyzed with respect to the longitudinal relative
displacement between the rail and deck under the acceleration
or braking load. The maximum relative displacements and the
variation ratios which occur according to the analysis methods
(complete and separate analysis results) are as shown in Fig.
11. [10]
Figure 11: Maximum relative displacement between the rail
and deck
There was a maximum increase of 46.59% and a minimum
increase of 19.17% discovered in the complete analysis in
comparison to the separate analysis, and the relative
displacement had been detected to have increased by an
average of 29.22%.
International Journal of Applied Engineering Research ISSN 0973-4562 Volume 11, Number 5 (2016) pp 3689-3695
© Research India Publications. http://www.ripublication.com
3695
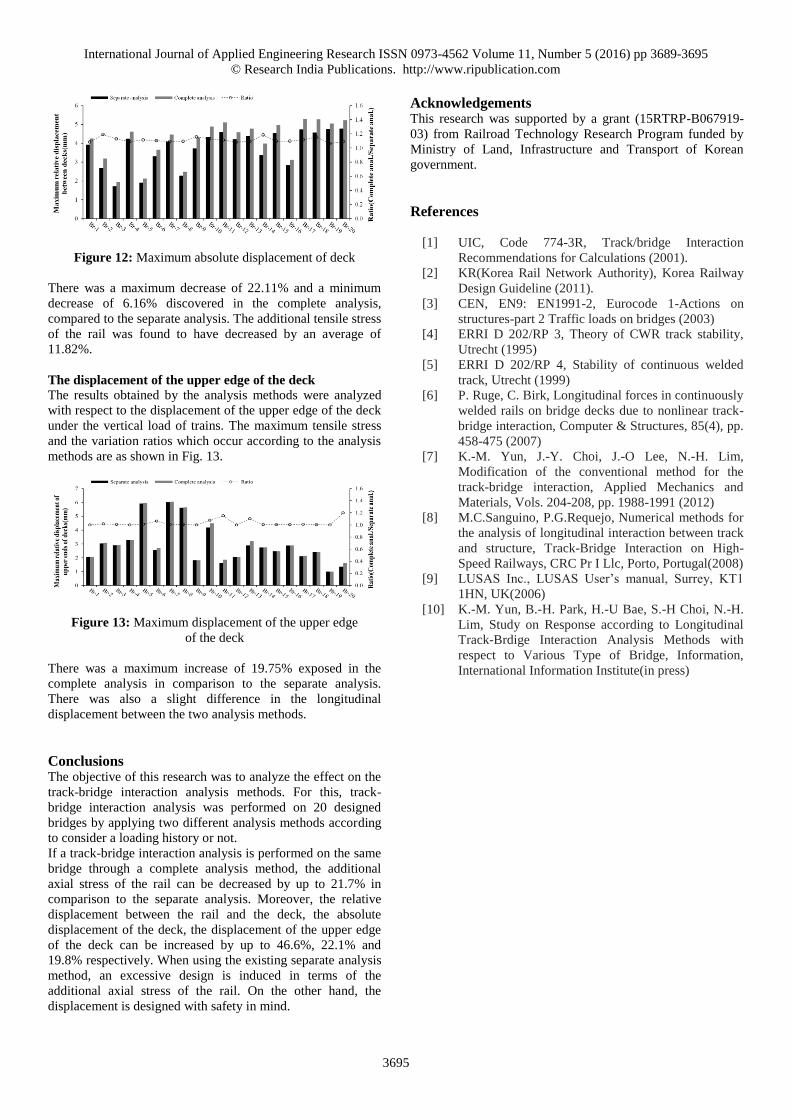
Figure 12: Maximum absolute displacement of deck
There was a maximum decrease of 22.11% and a minimum
decrease of 6.16% discovered in the complete analysis,
compared to the separate analysis. The additional tensile stress
of the rail was found to have decreased by an average of
11.82%.
The displacement of the upper edge of the deck
The results obtained by the analysis methods were analyzed
with respect to the displacement of the upper edge of the deck
under the vertical load of trains. The maximum tensile stress
and the variation ratios which occur according to the analysis
methods are as shown in Fig. 13.
Figure 13: Maximum displacement of the upper edge
of the deck
There was a maximum increase of 19.75% exposed in the
complete analysis in comparison to the separate analysis.
There was also a slight difference in the longitudinal
displacement between the two analysis methods.
Conclusions The objective of this research was to analyze the effect on the
track-bridge interaction analysis methods. For this, track-
bridge interaction analysis was performed on 20 designed
bridges by applying two different analysis methods according
to consider a loading history or not.
If a track-bridge interaction analysis is performed on the same
bridge through a complete analysis method, the additional
axial stress of the rail can be decreased by up to 21.7% in
comparison to the separate analysis. Moreover, the relative
displacement between the rail and the deck, the absolute
displacement of the deck, the displacement of the upper edge
of the deck can be increased by up to 46.6%, 22.1% and
19.8% respectively. When using the existing separate analysis
method, an excessive design is induced in terms of the
additional axial stress of the rail. On the other hand, the
displacement is designed with safety in mind.
Acknowledgements This research was supported by a grant (15RTRP-B067919-
03) from Railroad Technology Research Program funded by
Ministry of Land, Infrastructure and Transport of Korean
government.
References
[1] UIC, Code 774-3R, Track/bridge Interaction
Recommendations for Calculations (2001).
[2] KR(Korea Rail Network Authority), Korea Railway
Design Guideline (2011).
[3] CEN, EN9: EN1991-2, Eurocode 1-Actions on
structures-part 2 Traffic loads on bridges (2003)
[4] ERRI D 202/RP 3, Theory of CWR track stability,
Utrecht (1995)
[5] ERRI D 202/RP 4, Stability of continuous welded
track, Utrecht (1999)
[6] P. Ruge, C. Birk, Longitudinal forces in continuously
welded rails on bridge decks due to nonlinear track-
bridge interaction, Computer & Structures, 85(4), pp.
458-475 (2007)
[7] K.-M. Yun, J.-Y. Choi, J.-O Lee, N.-H. Lim,
Modification of the conventional method for the
track-bridge interaction, Applied Mechanics and
Materials, Vols. 204-208, pp. 1988-1991 (2012)
[8] M.C.Sanguino, P.G.Requejo, Numerical methods for
the analysis of longitudinal interaction between track
and structure, Track-Bridge Interaction on High-
Speed Railways, CRC Pr I Llc, Porto, Portugal(2008)
[9] LUSAS Inc., LUSAS User’s manual, Surrey, KT1
1HN, UK(2006)
[10] K.-M. Yun, B.-H. Park, H.-U Bae, S.-H Choi, N.-H.
Lim, Study on Response according to Longitudinal
Track-Brdige Interaction Analysis Methods with
respect to Various Type of Bridge, Information,
International Information Institute(in press)