Embed Size (px)
DESCRIPTION
IABP 18 annual meeting At CLS on June 16-18 2008. Some thoughts on sea ice retreat in 2007. Takashi Kikuchi (& Jun Inoue) Institute of Observational Research for Global Change Japan Agency for Marine Earth Science and Technology. - PowerPoint PPT Presentation
Citation preview
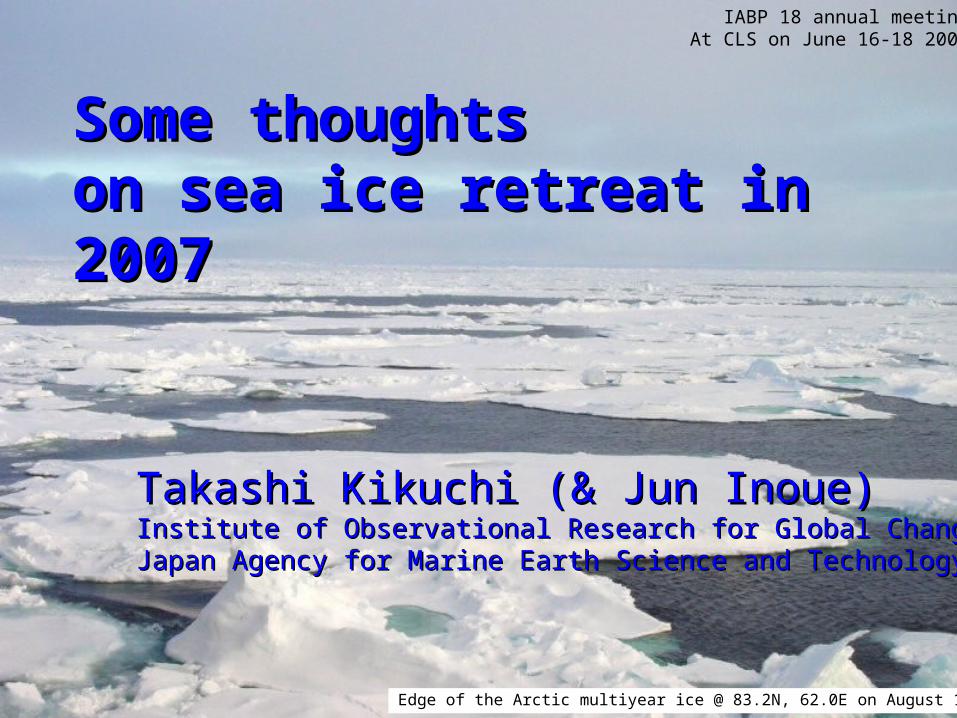
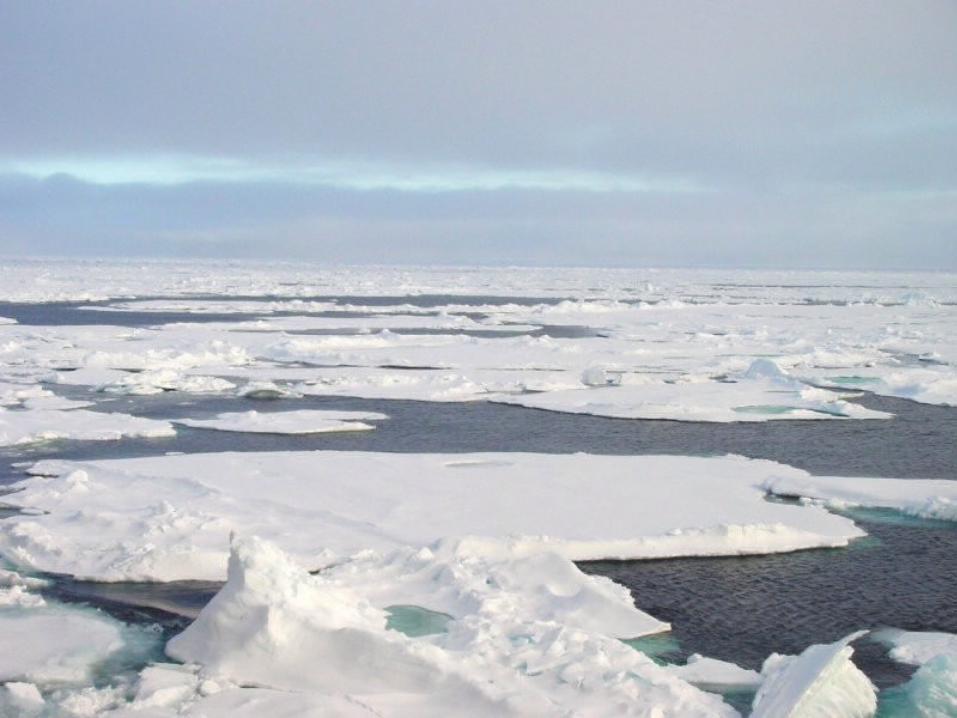
Edge of the Arctic multiyear ice @ 83.2N, 62.0E on August 14, 2007
Some thoughts Some thoughts on sea ice retreat in on sea ice retreat in 20072007
Takashi Kikuchi (& Jun Inoue)Takashi Kikuchi (& Jun Inoue)Institute of Observational Research for Global ChangeInstitute of Observational Research for Global ChangeJapan Agency for Marine Earth Science and TechnologyJapan Agency for Marine Earth Science and Technology
IABP 18 annual meetingAt CLS on June 16-18 2008
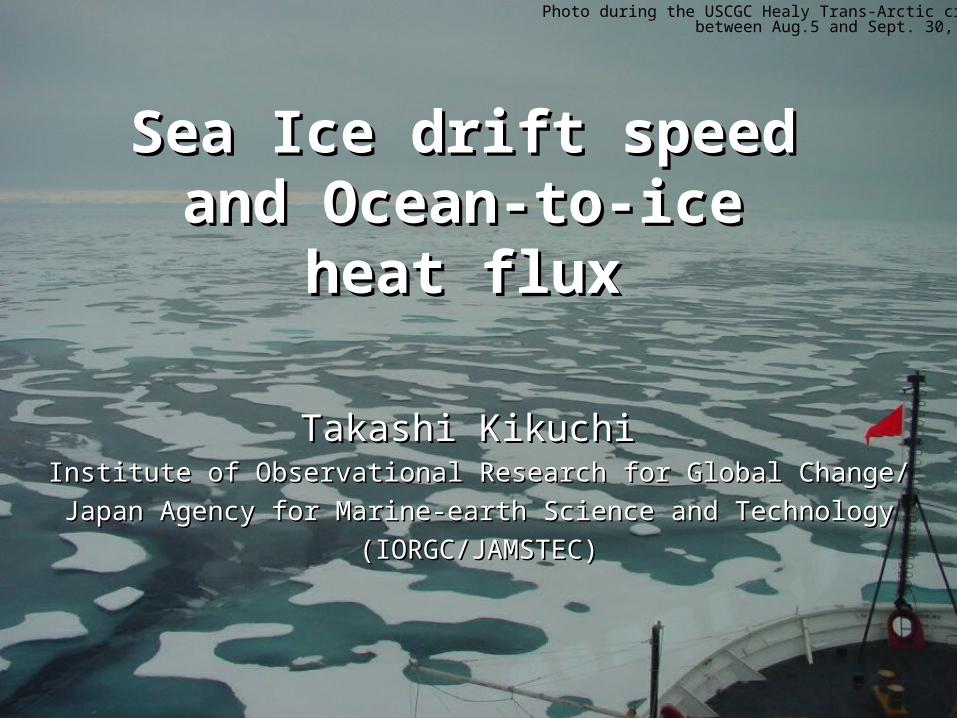
Photo during the USCGC Healy Trans-Arctic cruisebetween Aug.5 and Sept. 30, 2005
Sea Ice drift speed Sea Ice drift speed and Ocean-to-ice and Ocean-to-ice
heat fluxheat flux
Takashi Kikuchi Takashi Kikuchi Institute of Observational Research for Global Change/Institute of Observational Research for Global Change/
Japan Agency for Marine-earth Science and TechnologyJapan Agency for Marine-earth Science and Technology
(IORGC/JAMSTEC)(IORGC/JAMSTEC)
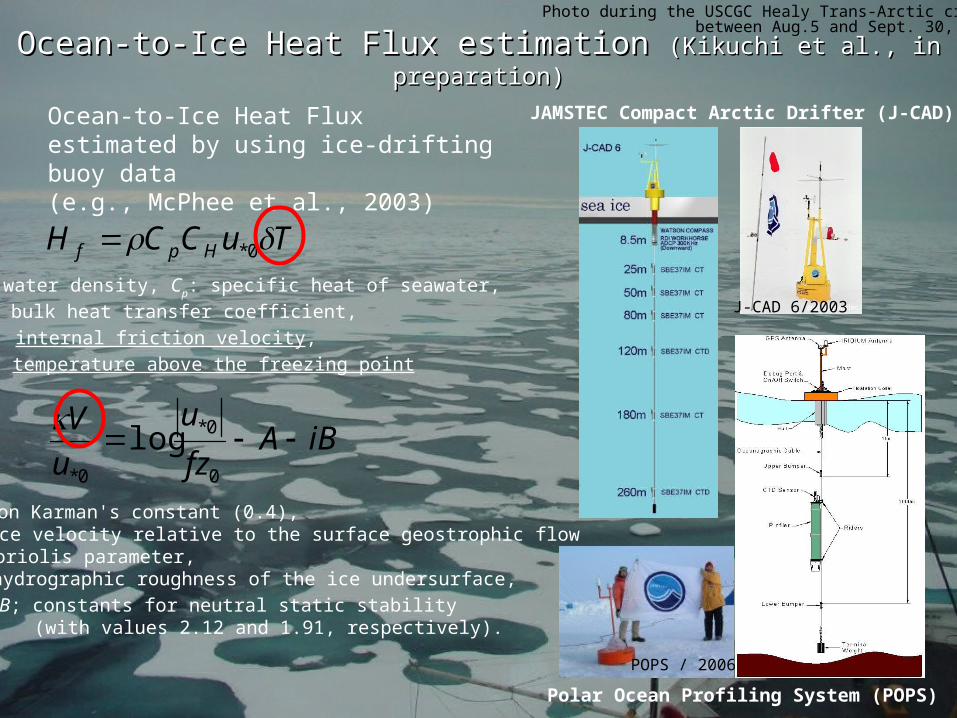
Photo during the USCGC Healy Trans-Arctic cruisebetween Aug.5 and Sept. 30, 2005
Ocean-to-Ice Heat Flux estimation Ocean-to-Ice Heat Flux estimation (Kikuchi et al., in preparation)(Kikuchi et al., in preparation)
Ocean-to-Ice Heat Flux estimated by using ice-drifting buoy data(e.g., McPhee et al., 2003)
ρ: water density, Cp: specific heat of seawater,
CH: bulk heat transfer coefficient,
u*0: internal friction velocity,
δT: temperature above the freezing point
κ: von Karman's constant (0.4), V: ice velocity relative to the surface geostrophic flowf: Coriolis parameter, z0: hydrographic roughness of the ice undersurface,
A & B; constants for neutral static stability (with values 2.12 and 1.91, respectively).
TuCCH Hpf 0*
iBAfz
u
u
V
0
0*
0*
log
Polar Ocean Profiling System (POPS)
J-CAD 6/2003
JAMSTEC Compact Arctic Drifter (J-CAD)
POPS / 2006

Photo during the USCGC Healy Trans-Arctic cruisebetween Aug.5 and Sept. 30, 2005
Drifting tracks of JAMSTEC buoys deployed near the North Pole since 2000
NB
NGR
AB
LRMB
7 days moving-averaged Ocean-to-Ice Heat Flux detected by J-CAD & POPS data
Apr. May Jun. July Aug. Sept. Oct. Nov. Dec.
Ocean-to-Ice Heat Flux estimation Ocean-to-Ice Heat Flux estimation (Kikuchi et al., in preparation)(Kikuchi et al., in preparation)
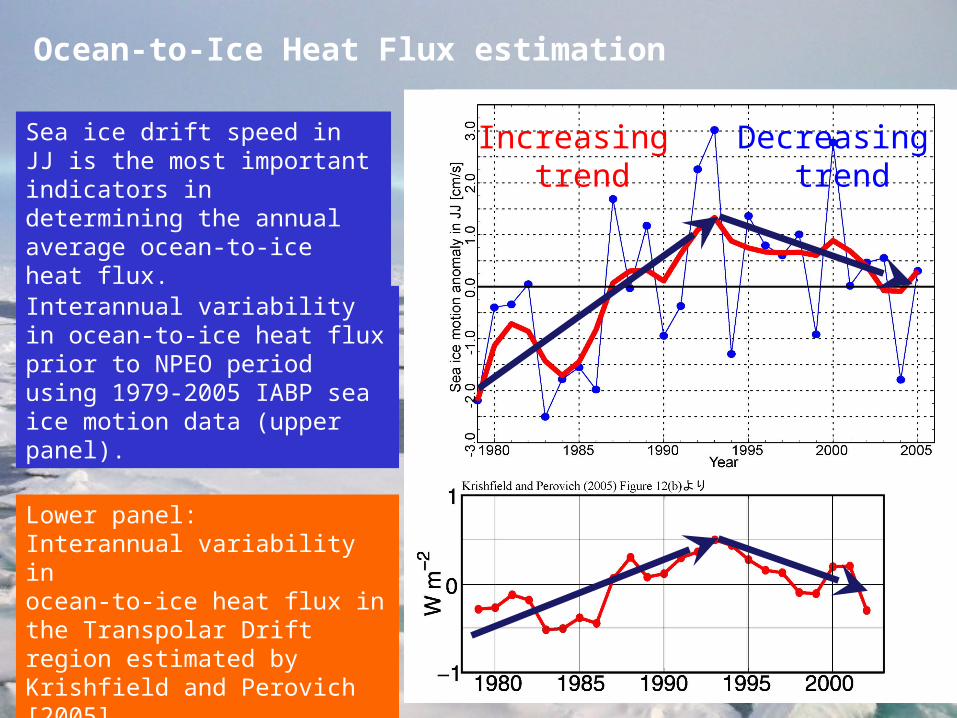
Ocean-to-Ice Heat Flux estimation
Interannual variability in ocean-to-ice heat flux prior to NPEO period using 1979-2005 IABP sea ice motion data (upper panel).
Lower panel:Interannual variability in ocean-to-ice heat flux in the Transpolar Drift region estimated by Krishfield and Perovich [2005]
Sea ice drift speed in JJ is the most important indicators in determining the annual average ocean-to-ice heat flux.
Increasing trend
Decreasing trend
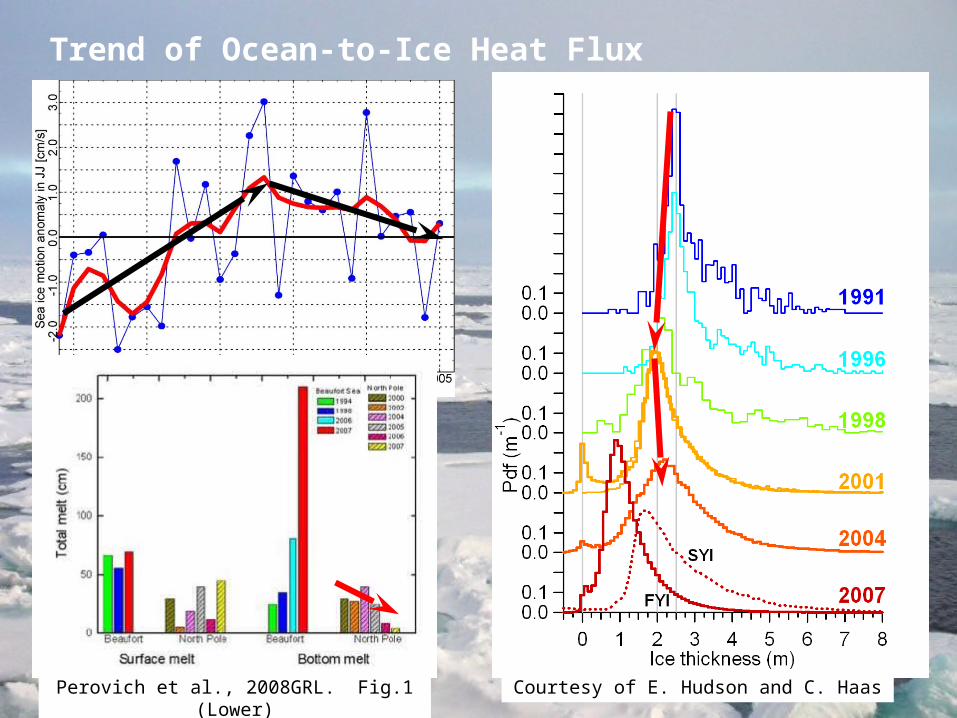
Courtesy of E. Hudson and C. Haas
Trend of Ocean-to-Ice Heat Flux
Perovich et al., 2008GRL. Fig.1 (Lower)
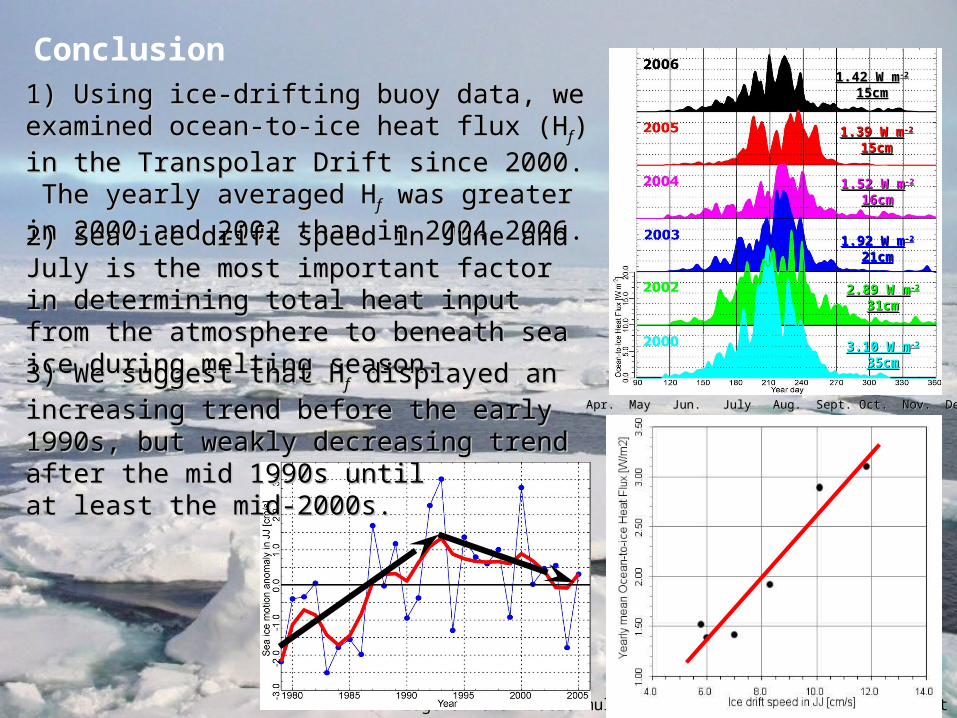
Conclusion
Edge of the Arctic multiyear ice @ 83.2N, 62.0E on August 14, 2007
Apr. May Jun. July Aug. Sept. Oct. Nov. Dec.Apr. May Jun. July Aug. Sept. Oct. Nov. Dec.
1.42 W m1.42 W m-2-2
15cm15cm
1.39 W m1.39 W m-2-2
15cm15cm
1.52 W m1.52 W m-2-2
16cm16cm
1.92 W m1.92 W m-2-2
21cm21cm
2.89 W m2.89 W m-2-2
31cm31cm
3.10 W m3.10 W m-2-2
35cm35cm
1) Using ice-drifting buoy data, we 1) Using ice-drifting buoy data, we examined ocean-to-ice heat flux (examined ocean-to-ice heat flux (HHff) in ) in the Transpolar Drift since 2000. The the Transpolar Drift since 2000. The yearly averaged yearly averaged HHff was greater in 2000 was greater in 2000 and 2002 than in 2004-2006. and 2002 than in 2004-2006. 2) Sea ice drift speed in June and July is 2) Sea ice drift speed in June and July is the most important factor in determining the most important factor in determining total heat input from the atmosphere to total heat input from the atmosphere to beneath sea ice during melting season. beneath sea ice during melting season.
3) We suggest that 3) We suggest that HHff displayed an displayed an increasing trend before the early 1990s, increasing trend before the early 1990s, but weakly decreasing trend after the but weakly decreasing trend after the mid 1990s until mid 1990s until at least the mid-2000s. at least the mid-2000s.
However, ……….
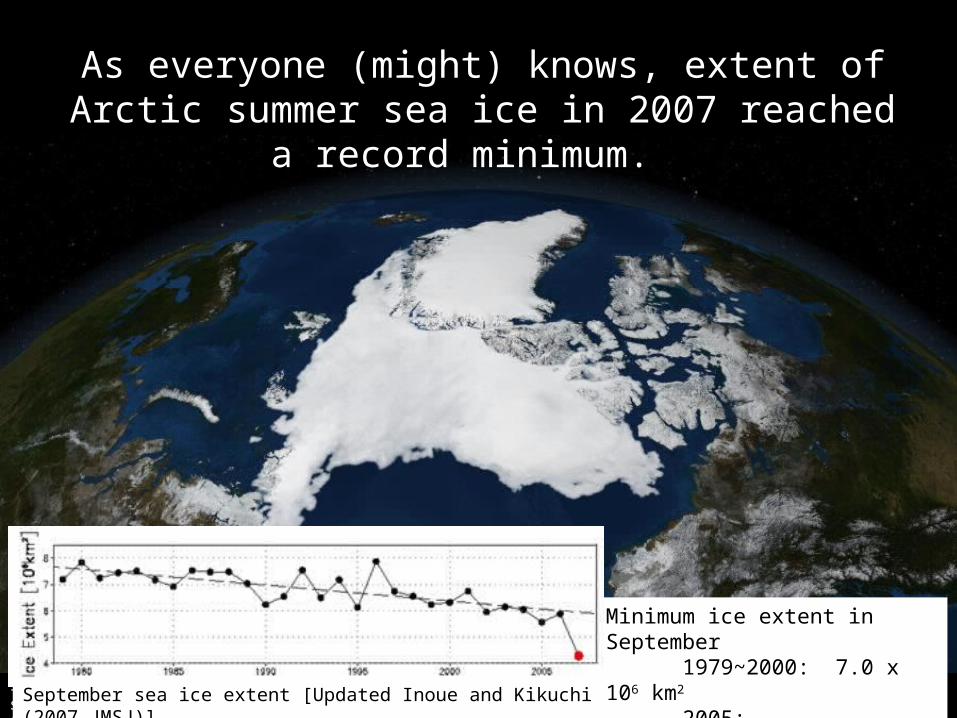
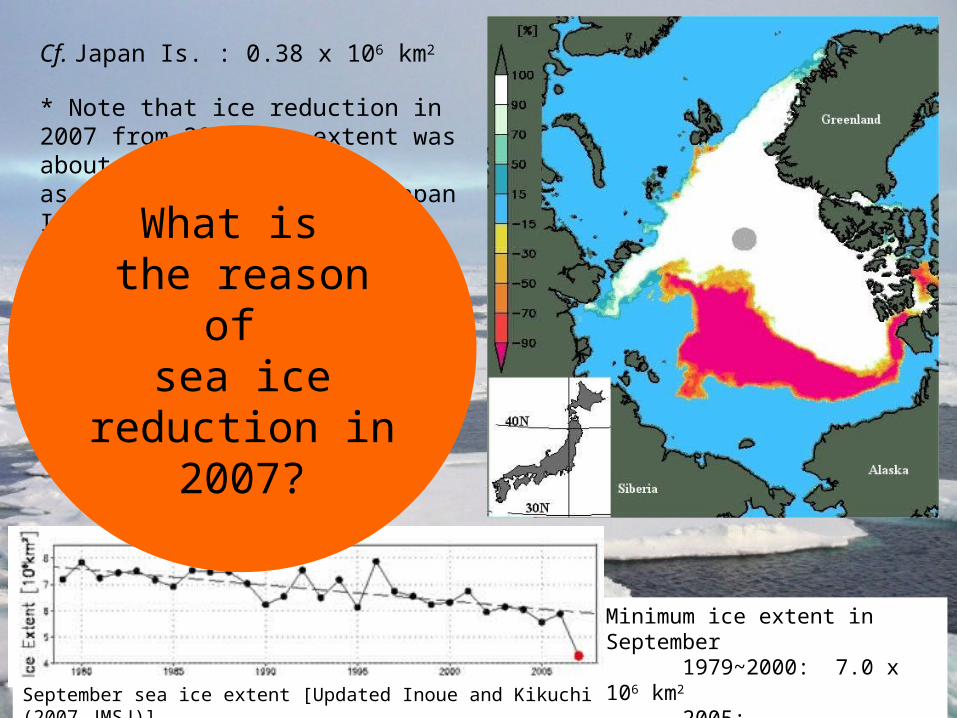
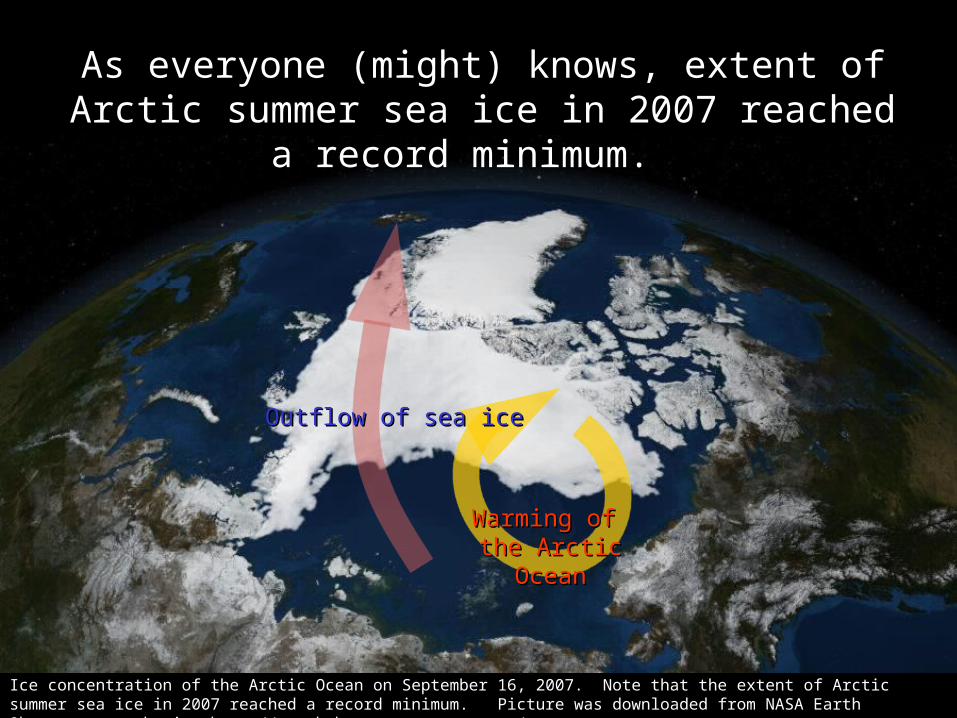
Ice concentration of the Arctic Ocean on September 16, 2007. Note that the extent of Arctic summer sea ice in 2007 reached a record minimum. Picture was downloaded from NASA Earth Observatory web site http://earthobservatory.nasa.gov/
As everyone (might) knows, extent of Arctic summer sea ice in 2007 reached a record
minimum.
Minimum ice extent in September 1979~2000: 7.0 x 10⁶ km2
2005: 5.3 x 10⁶ km2
2007: 4.1 x 10⁶ km2September sea ice extent [Updated Inoue and Kikuchi (2007,JMSJ)]
Minimum ice extent in September 1979~2000: 7.0 x 10⁶ km2
2005: 5.3 x 10⁶ km2
2007: 4.1 x 10⁶ km2September sea ice extent [Updated Inoue and Kikuchi (2007,JMSJ)]
Cf. Japan Is. : 0.38 x 10⁶ km2
* Note that ice reduction in 2007 from 2005 ice extent was about 2.8 times as large as the area of Japan Islands.
What is the reason of
sea ice reduction in 2007?
Ice concentration of the Arctic Ocean on September 16, 2007. Note that the extent of Arctic summer sea ice in 2007 reached a record minimum. Picture was downloaded from NASA Earth Observatory web site http://earthobservatory.nasa.gov/
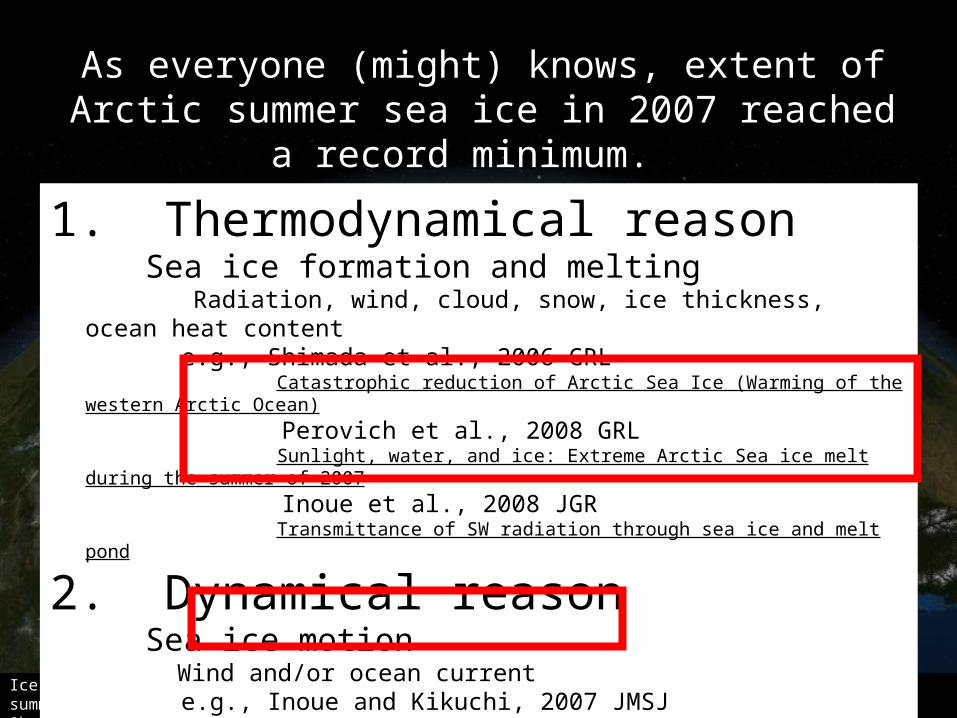
As everyone (might) knows, extent of Arctic summer sea ice in 2007 reached a record
minimum.
1. Thermodynamical reason Sea ice formation and melting Radiation, wind, cloud, snow, ice thickness, ocean heat content
e.g., Shimada et al., 2006 GRL Catastrophic reduction of Arctic Sea Ice (Warming of the western
Arctic Ocean)
Perovich et al., 2008 GRL Sunlight, water, and ice: Extreme Arctic Sea ice melt during the
summer of 2007
Inoue et al., 2008 JGRTransmittance of SW radiation through sea ice and melt pond
2. Dynamical reason Sea ice motion Wind and/or ocean current
e.g., Inoue and Kikuchi, 2007 JMSJOutflows of summertime Arctic sea ice
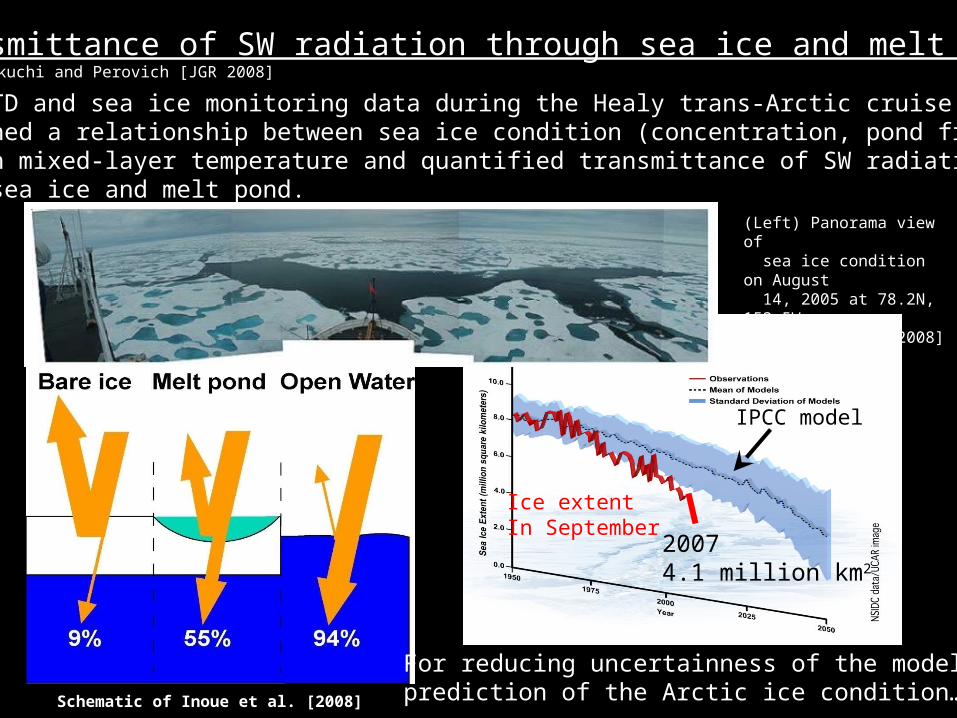
Transmittance of SW radiation through sea ice and melt pondInoue, Kikuchi and Perovich [JGR 2008]
Using XCTD and sea ice monitoring data during the Healy trans-Arctic cruise in 2005, we examined a relationship between sea ice condition (concentration, pond fraction) and ocean mixed-layer temperature and quantified transmittance of SW radiation through sea ice and melt pond.
(Left) Panorama view of sea ice condition on August 14, 2005 at 78.2N, 153.5W. Inoue et al. [2008]
Schematic of Inoue et al. [2008]
20074.1 million km2
IPCC model
Ice extent In September
For reducing uncertainness of the model prediction of the Arctic ice condition…..
Edge of the Arctic multiyear ice @ 83.2N, 62.0E on August 14, 2007
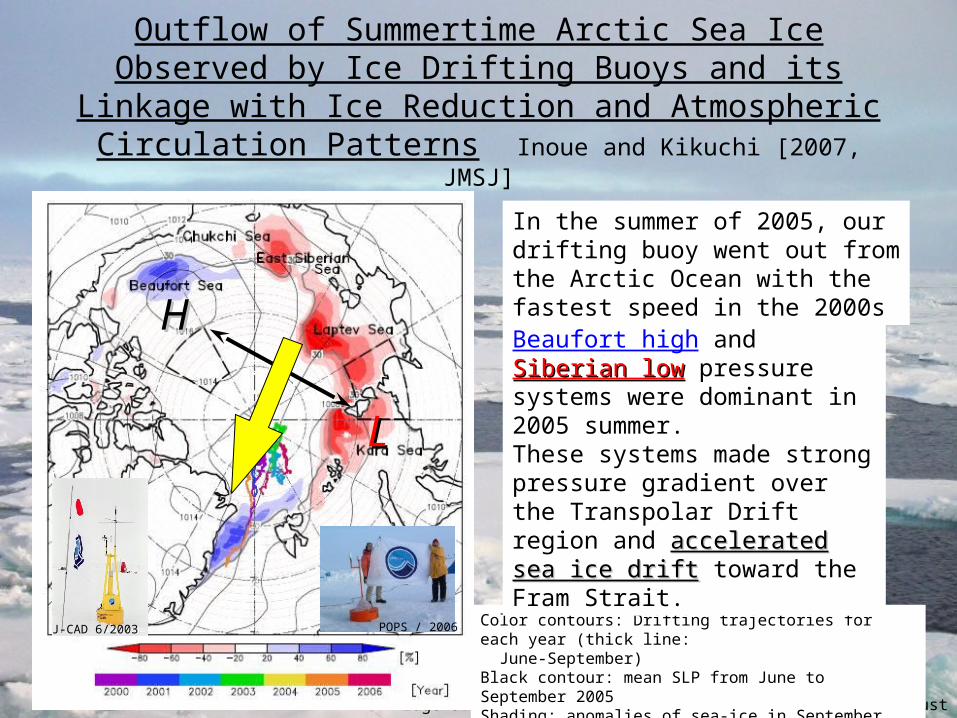
Outflow of Summertime Arctic Sea Ice Observed by Ice Drifting Buoys and its Linkage with Ice Reduction and
Atmospheric Circulation Patterns Inoue and Kikuchi [2007, JMSJ]
J-CAD 6/2003 POPS / 2006
HH
LL
Color contours: Drifting trajectories for each year (thick line: June-September)Black contour: mean SLP from June to September 2005Shading: anomalies of sea-ice in September 2005 relative to previous 5-year average
In the summer of 2005, our drifting buoy went out from the Arctic Ocean with the fastest speed in the 2000s
Beaufort high and Siberian lowSiberian low pressure systems were dominant in 2005 summer. These systems made strong pressure gradient over the Transpolar Drift region and accelerated sea ice driftaccelerated sea ice drift toward the Fram Strait.
Edge of the Arctic multiyear ice @ 83.2N, 62.0E on August 14, 2007
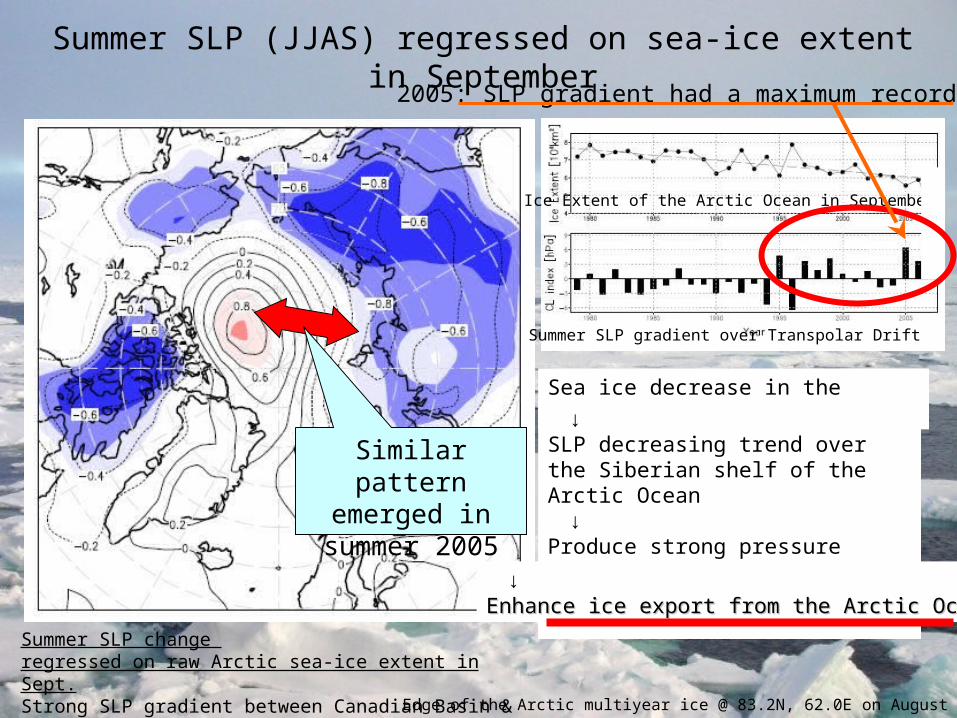
Summer SLP (JJAS) regressed on sea-ice extent in September
Similar pattern emerged in
summer 2005
Summer SLP change regressed on raw Arctic sea-ice extent in Sept. Strong SLP gradient between Canadian Basin & Siberia
Ice Extent of the Arctic Ocean in September
Summer SLP gradient over Transpolar Drift
Sea ice decrease in the Arctic Ocean
↓SLP decreasing trend over the Siberian shelf of the Arctic Ocean ↓Produce strong pressure gradient over Transpolar Drift
↓Enhance ice export from the Arctic Ocean Enhance ice export from the Arctic Ocean
2005: SLP gradient had a maximum record !!
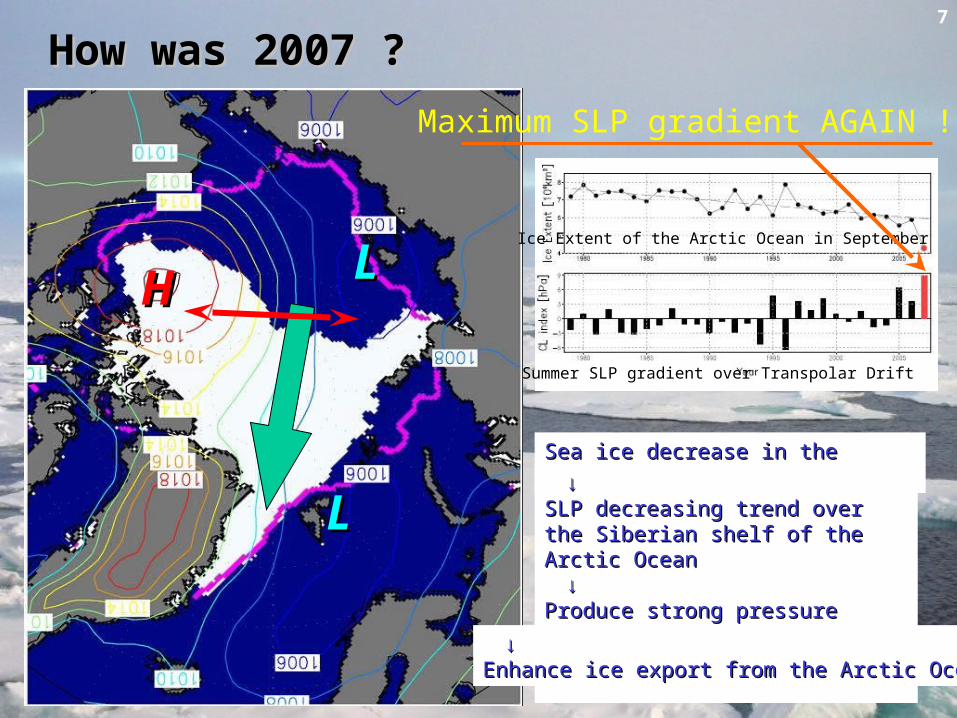
How was 2007 ?How was 2007 ?
LL
LL
HHIce Extent of the Arctic Ocean in September
Summer SLP gradient over Transpolar Drift
Maximum SLP gradient AGAIN !!
7
Sea ice decrease in the Arctic Ocean Sea ice decrease in the Arctic Ocean
↓ ↓SLP decreasing trend over the SLP decreasing trend over the Siberian shelf of the Arctic OceanSiberian shelf of the Arctic Ocean ↓ ↓Produce strong pressure gradient Produce strong pressure gradient over Transpolar Drift over Transpolar Drift
↓ ↓Enhance ice export from the Arctic Ocean Enhance ice export from the Arctic Ocean
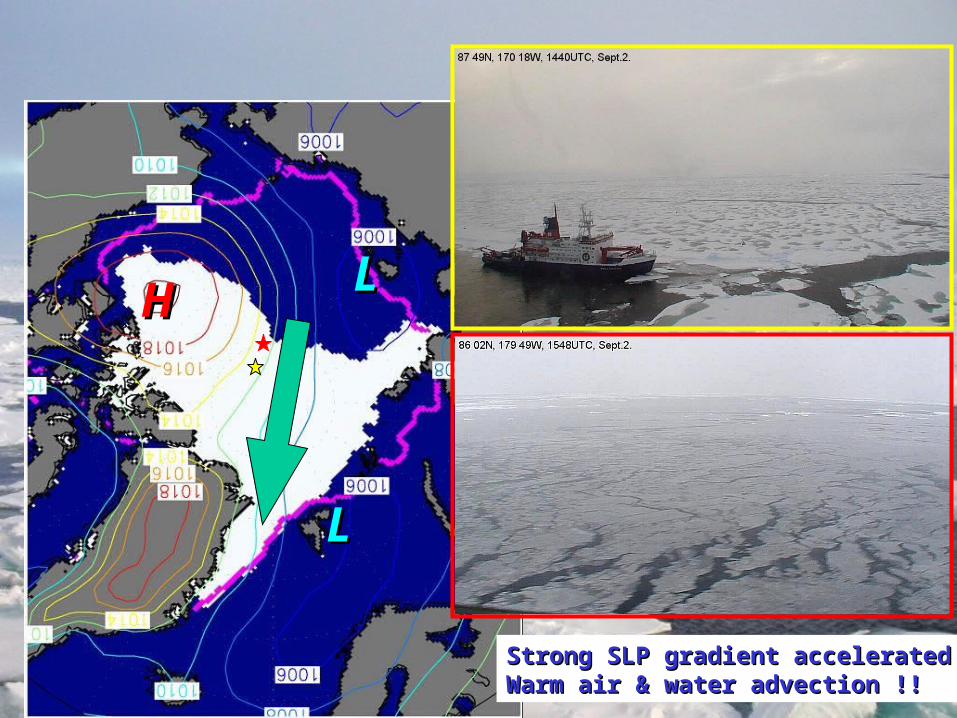
LL
LL
HH
Strong SLP gradient accelerated Strong SLP gradient accelerated Warm air & water advection !!Warm air & water advection !!
Ice concentration of the Arctic Ocean on September 16, 2007. Note that the extent of Arctic summer sea ice in 2007 reached a record minimum. Picture was downloaded from NASA Earth Observatory web site http://earthobservatory.nasa.gov/
As everyone (might) knows, extent of Arctic summer sea ice in 2007 reached a record
minimum.
Warming of Warming of the Arctic Oceanthe Arctic Ocean
Outflow of sea iceOutflow of sea ice