Embed Size (px)
DESCRIPTION
Poverty & the Agricultural Household. in Timor-Leste. Some Patterns & Puzzles Brett Inder Anna Brown Gaurav Datt. Acknowledgements. Funding: Department of Foreign Affairs & Trade, Australia Event Host: La’o Hamutuk. Overview. Poverty in Timor-Leste The Agricultural Economy - PowerPoint PPT Presentation
Citation preview
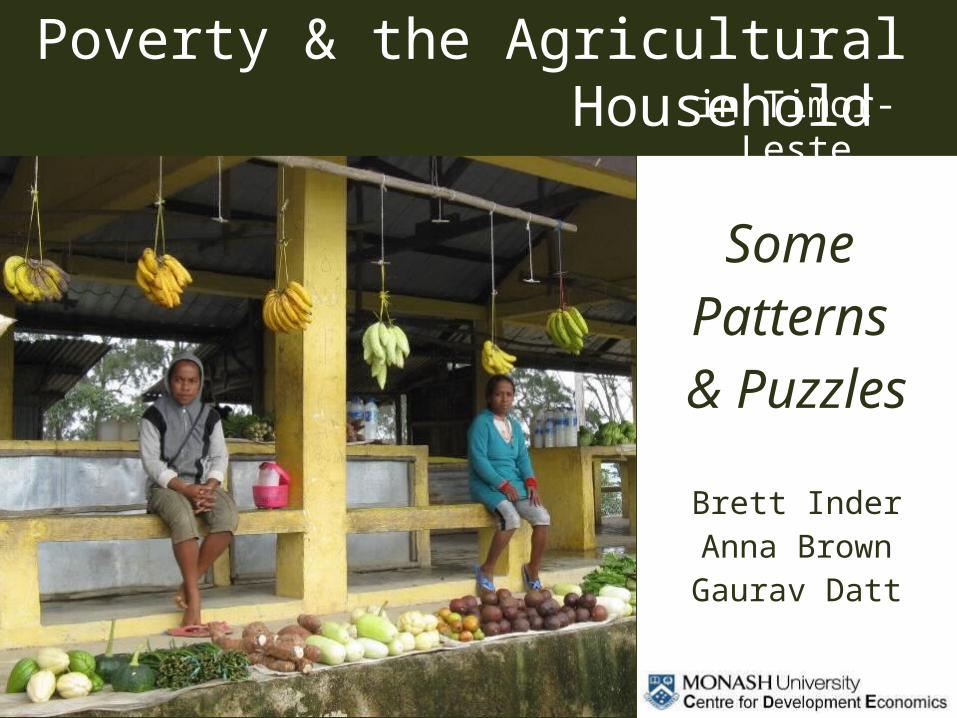
Some Patterns & Puzzles
Brett InderAnna BrownGaurav Datt
in Timor-LestePoverty & the Agricultural Household
Acknowledgements
• Funding: Department of Foreign Affairs & Trade, Australia
• Event Host: La’o Hamutuk
Overview
1. Poverty in Timor-Leste
2. The Agricultural Economy
3. Food Consumption and Income
Background: Timor-Leste
• Strong economic growth due to expansion in the oil & gas industries.
• By most development measures, the people of Timor-Leste are among the poorest in Asia.
• A very new nation, emerging out of a long period of conflict, the early stages of development pose many challenges.
Poverty in Timor-Leste
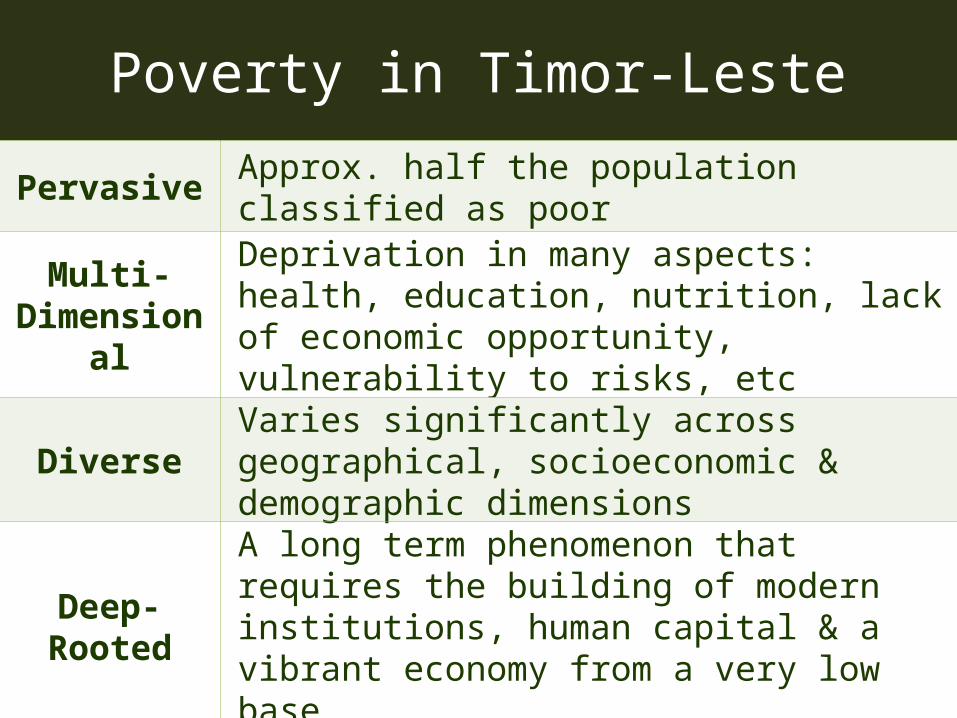
Pervasive Approx. half the population classified as poor
Multi-Dimensional
Deprivation in many aspects: health, education, nutrition, lack of economic opportunity, vulnerability to risks, etc
Diverse Varies significantly across geographical, socioeconomic & demographic dimensions
Deep-RootedA long term phenomenon that requires the building of modern institutions, human capital & a vibrant economy from a very low base
Potentially Destabilising
High risk of social unrest in a post-conflict society with rapid population growth & limited economic opportunities
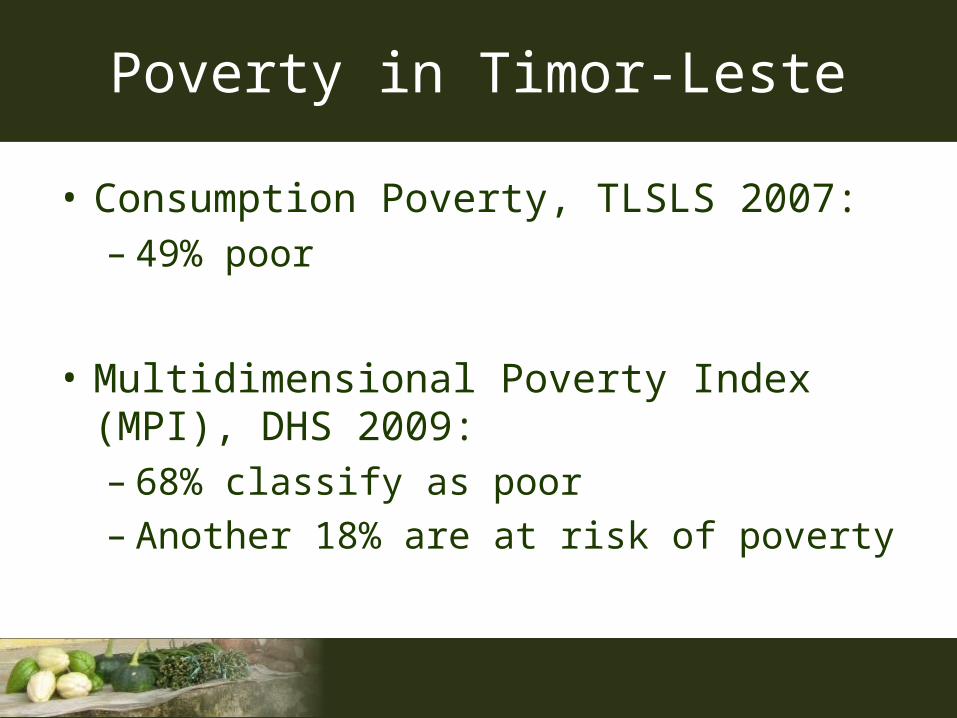
Poverty in Timor-Leste
• Consumption Poverty, TLSLS 2007:– 49% poor
• Multidimensional Poverty Index (MPI), DHS 2009:– 68% classify as poor– Another 18% are at risk of poverty
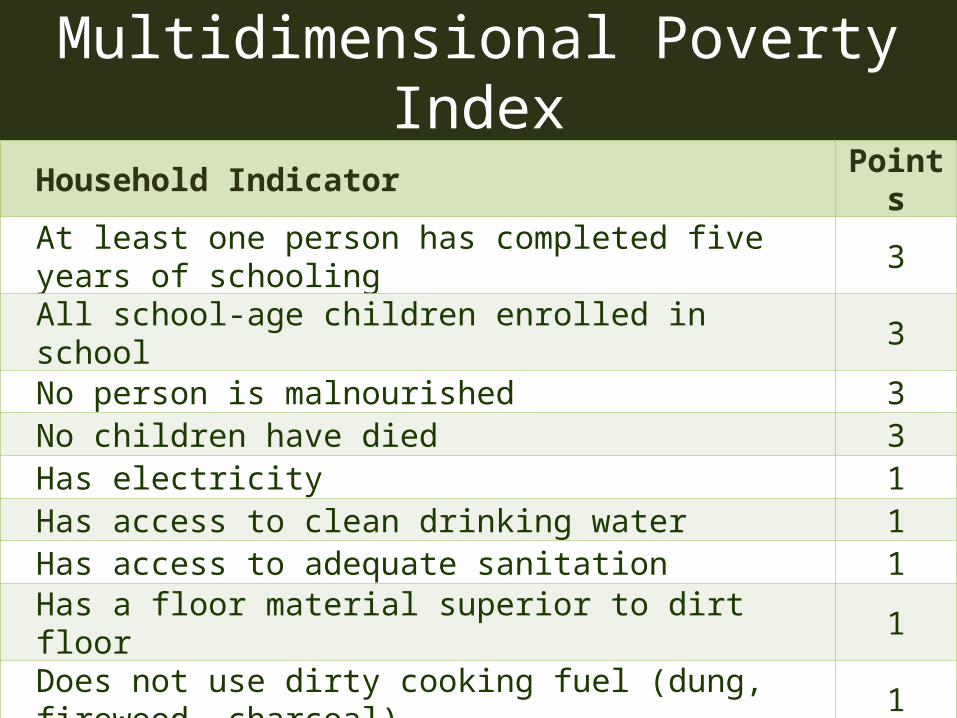
Multidimensional Poverty Index
Household Indicator Points
At least one person has completed five years of schooling 3All school-age children enrolled in school 3No person is malnourished 3No children have died 3Has electricity 1Has access to clean drinking water 1Has access to adequate sanitation 1Has a floor material superior to dirt floor 1Does not use dirty cooking fuel (dung, firewood, charcoal) 1Has two of these assets: bicycle, motorcycle, radio, refrigerator, phone, television
1
Poor: 12 points or less At Risk: 14 points or less
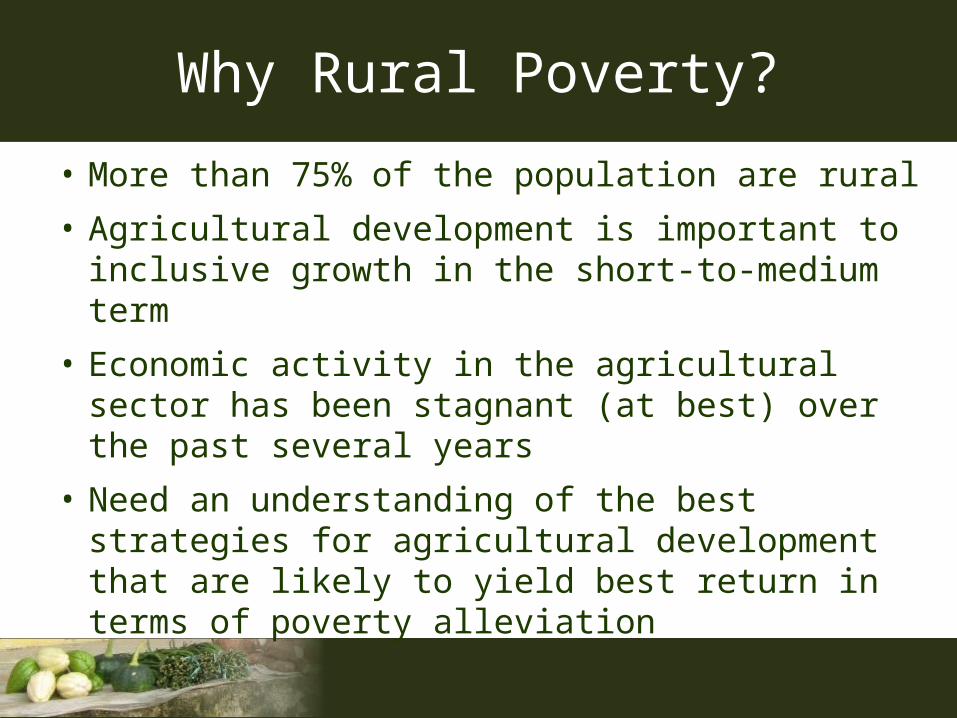
Why Rural Poverty?
• More than 75% of the population are rural
• Agricultural development is important to inclusive growth in the short-to-medium term
• Economic activity in the agricultural sector has been stagnant (at best) over the past several years
• Need an understanding of the best strategies for agricultural development that are likely to yield best return in terms of poverty alleviation
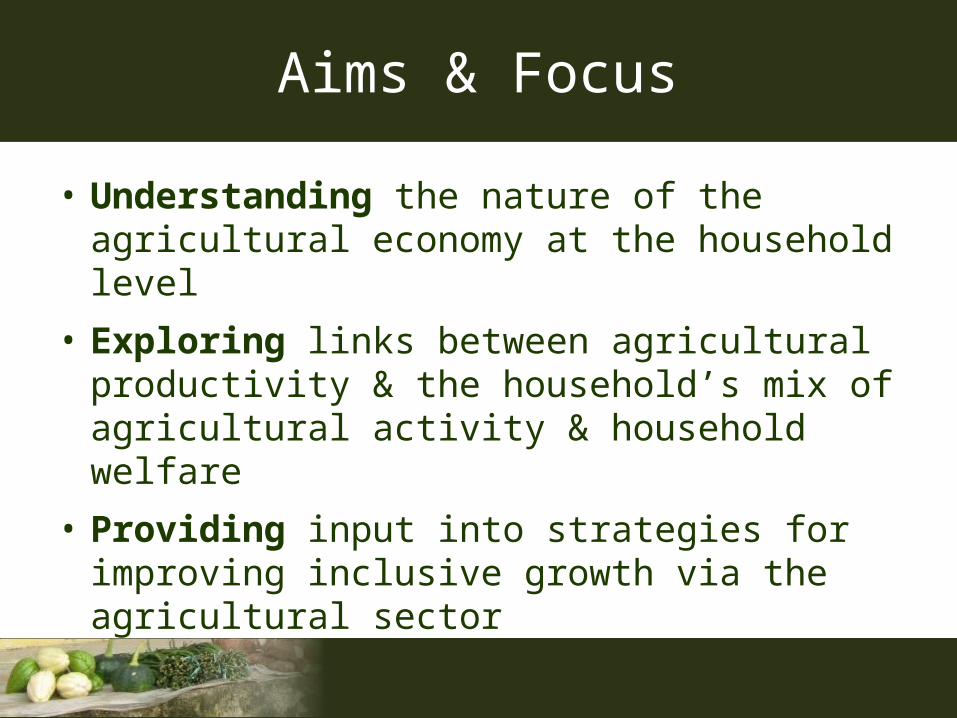
Aims & Focus
• Understanding the nature of the agricultural economy at the household level
• Exploring links between agricultural productivity & the household’s mix of agricultural activity & household welfare
• Providing input into strategies for improving inclusive growth via the agricultural sector
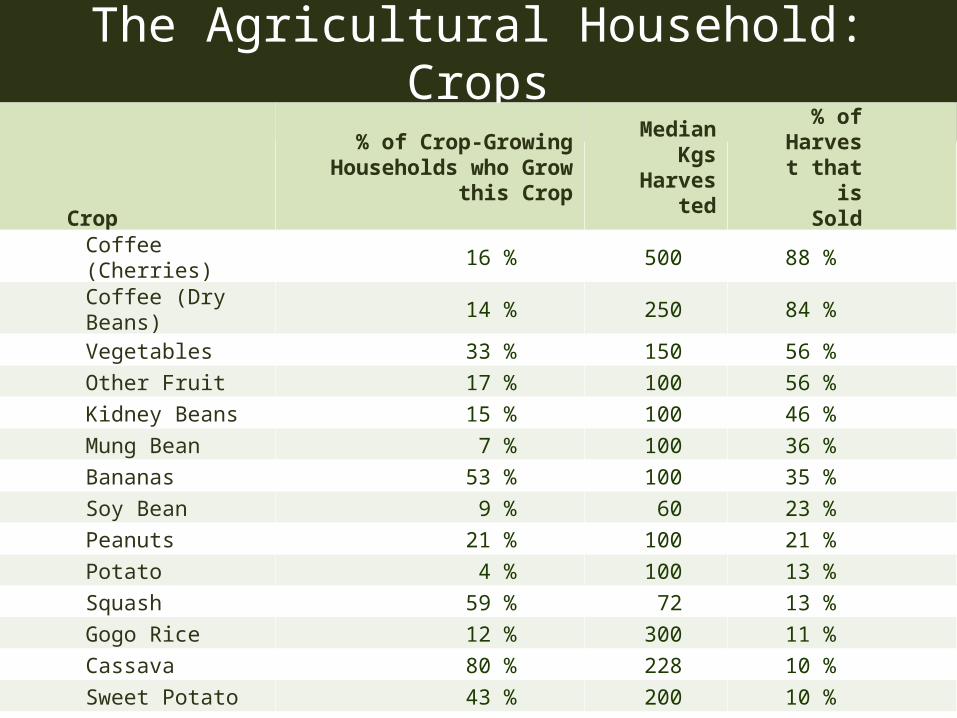
The Agricultural Household: Crops
Crop
% of Crop-Growing Households who Grow this Crop
Median Kgs Harvest
ed
% of Harvest that is
SoldCoffee (Cherries) 16 % 500 88 %Coffee (Dry Beans) 14 % 250 84 %Vegetables 33 % 150 56 %Other Fruit 17 % 100 56 %Kidney Beans 15 % 100 46 %Mung Bean 7 % 100 36 %Bananas 53 % 100 35 %Soy Bean 9 % 60 23 %Peanuts 21 % 100 21 %Potato 4 % 100 13 %Squash 59 % 72 13 %Gogo Rice 12 % 300 11 %Cassava 80 % 228 10 %Sweet Potato 43 % 200 10 %Taro (Talas/Kontas) 41 % 150 7 %Coconut 24 % 100 7 %Maize 96 % 300 6 %Rice 17 % 750 5 %
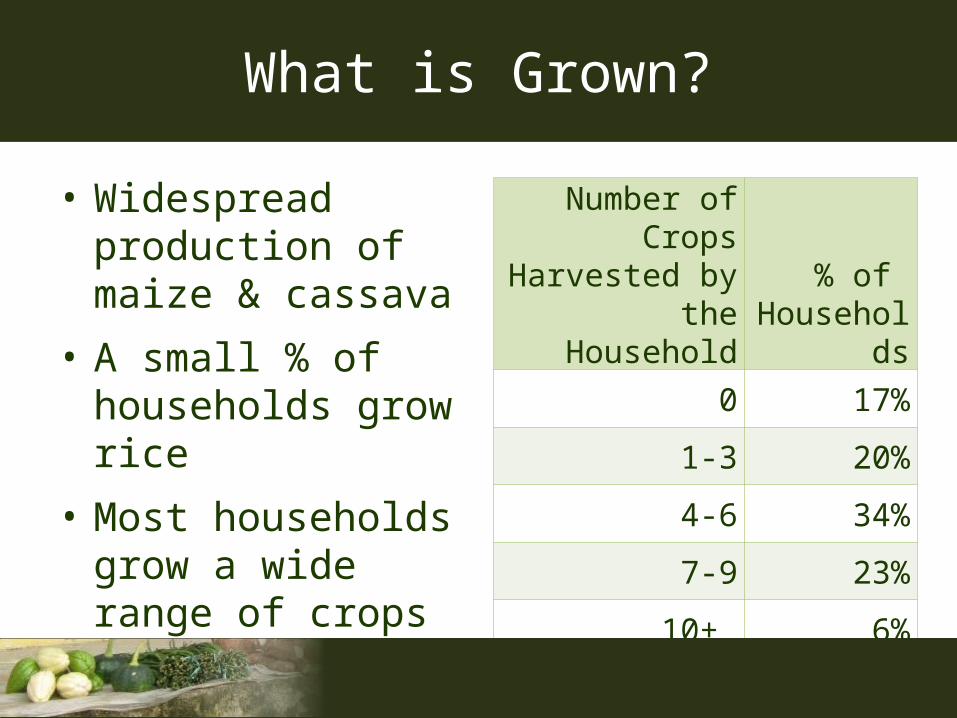
Number of Crops Harvested by the
Household% of
Households0 17%
1-3 20%
4-6 34%
7-9 23%
10+ 6%
What is Grown?
• Widespread production of maize & cassava
• A small % of households grow rice
• Most households grow a wide range of crops
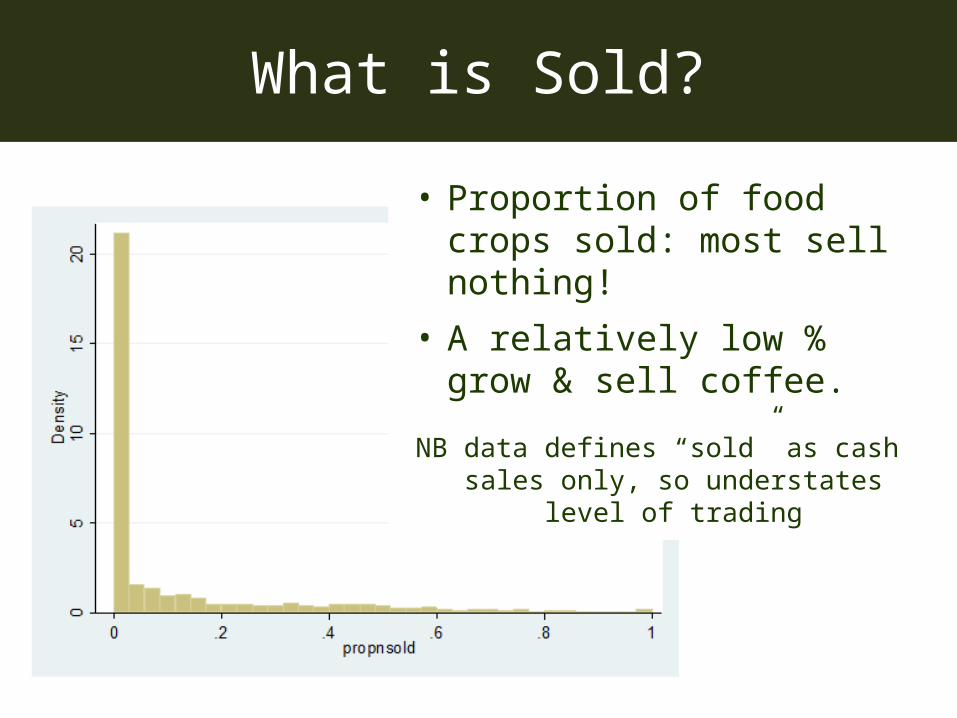
What is Sold?
• Proportion of food crops sold: most sell nothing!
• A relatively low % grow & sell coffee.
NB data defines “sold” as cash sales only, so understates level of trading
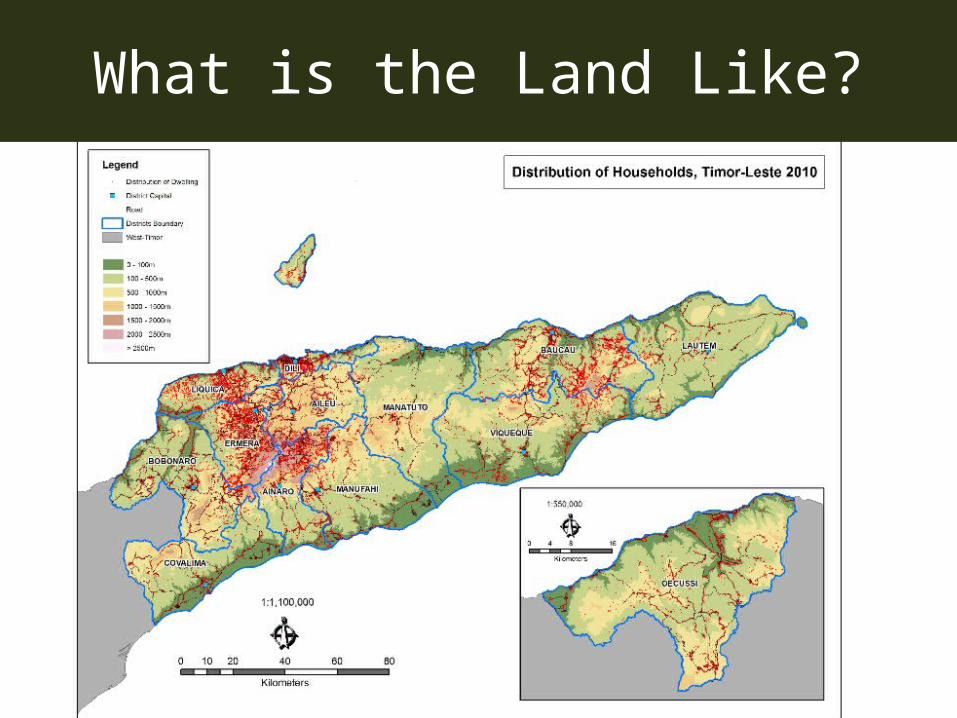
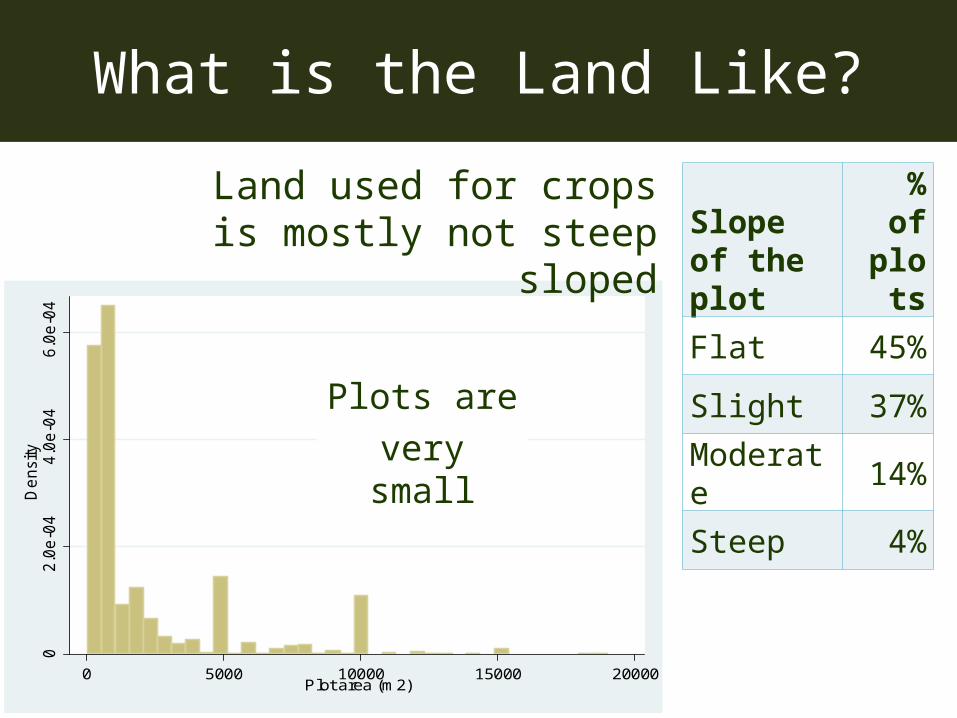
What is the Land Like?
02.0
e-0
44.0
e-0
46.0
e-0
4D
ensity
0 5000 10000 15000 20000Plot area (m2)
Slope of the plot
% of plots
Flat 45%
Slight 37%
Moderate 14%
Steep 4%
Land used for crops is mostly not steep sloped
What is the Land Like?
Plots are very small
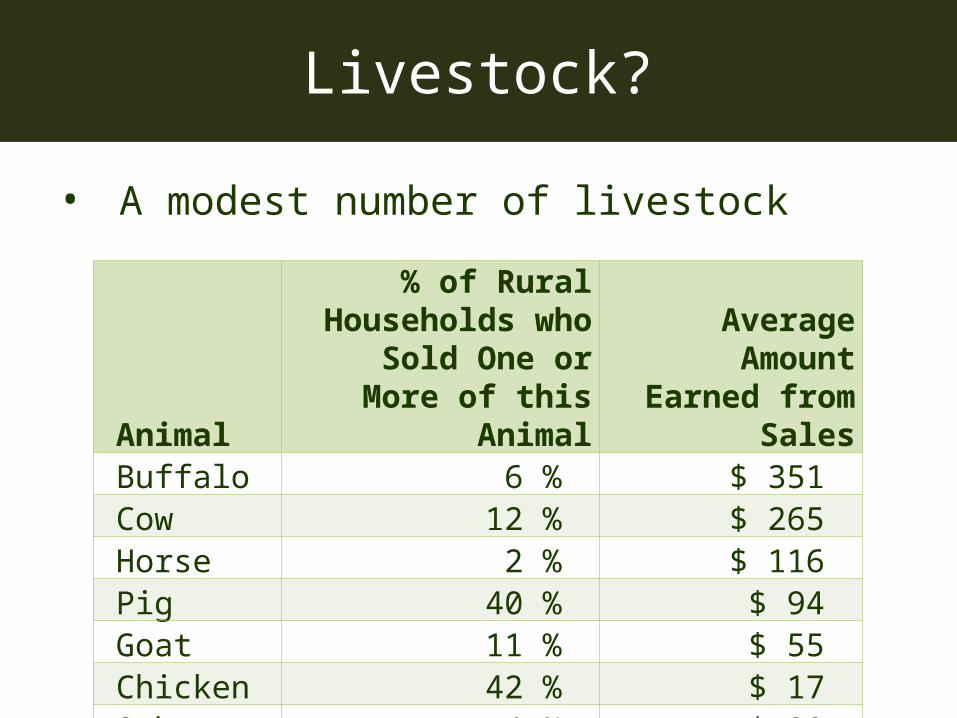
Livestock?
• A modest number of livestock
Animal
% of Rural Households who Sold One or More
of this AnimalAverage Amount
Earned from SalesBuffalo 6 % $ 351Cow 12 % $ 265Horse 2 % $ 116Pig 40 % $ 94Goat 11 % $ 55Chicken 42 % $ 17Other 4 % $ 20
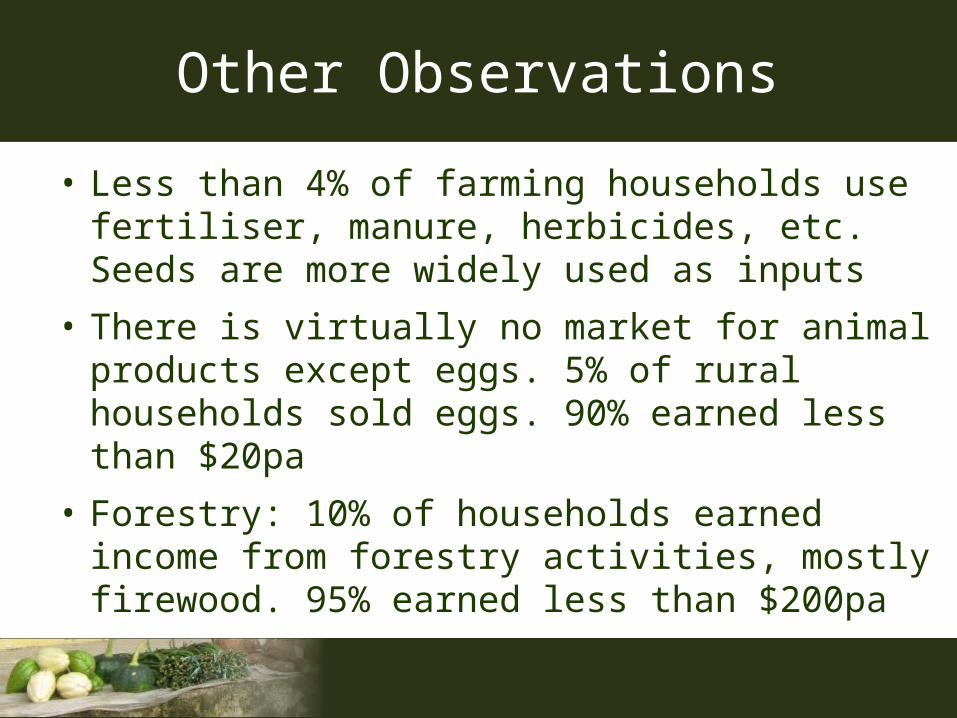
Other Observations
• Less than 4% of farming households use fertiliser, manure, herbicides, etc. Seeds are more widely used as inputs
• There is virtually no market for animal products except eggs. 5% of rural households sold eggs. 90% earned less than $20pa
• Forestry: 10% of households earned income from forestry activities, mostly firewood. 95% earned less than $200pa
Food Consumption
• Food is the most basic of human needs!
• What is the relationship between food produced & food consumed?
• How do differences in income affect food consumption?
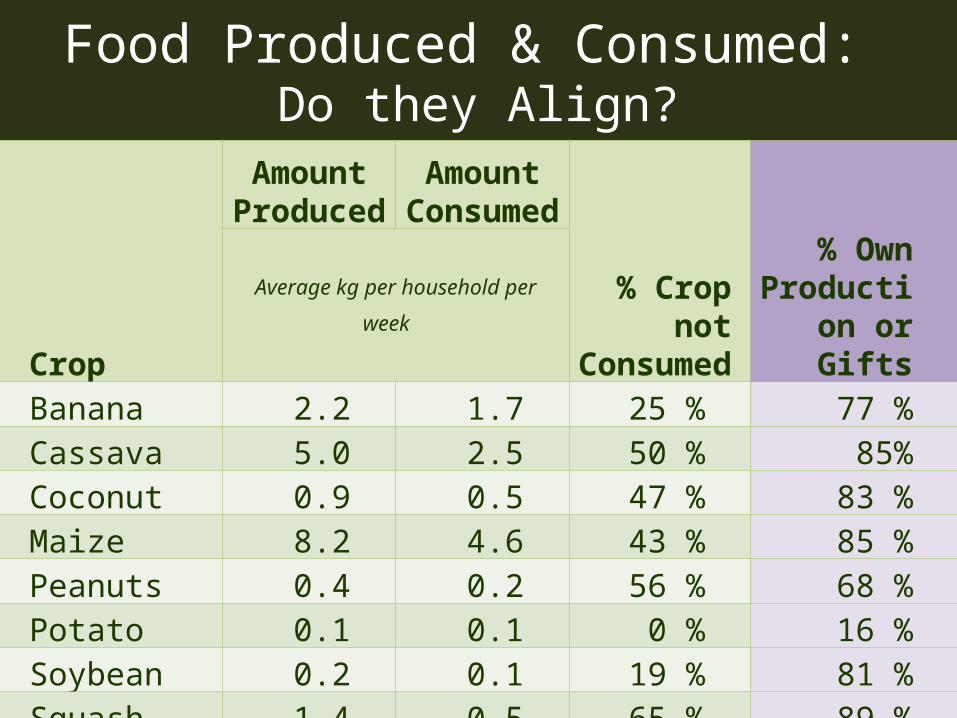
Food Produced & Consumed: Do they Align?
Crop
Amount Produced
Amount Consumed
% Crop not Consumed
% Own Production
or GiftsAverage kg per household per week
Banana 2.2 1.7 25 % 77 %Cassava 5.0 2.5 50 % 85%Coconut 0.9 0.5 47 % 83 %Maize 8.2 4.6 43 % 85 %Peanuts 0.4 0.2 56 % 68 %Potato 0.1 0.1 0 % 16 %Soybean 0.2 0.1 19 % 81 %Squash 1.4 0.5 65 % 89 %Sweet potato 2.0 0.8 59 % 83 %Taro 2.0 0.7 66 % 91 %
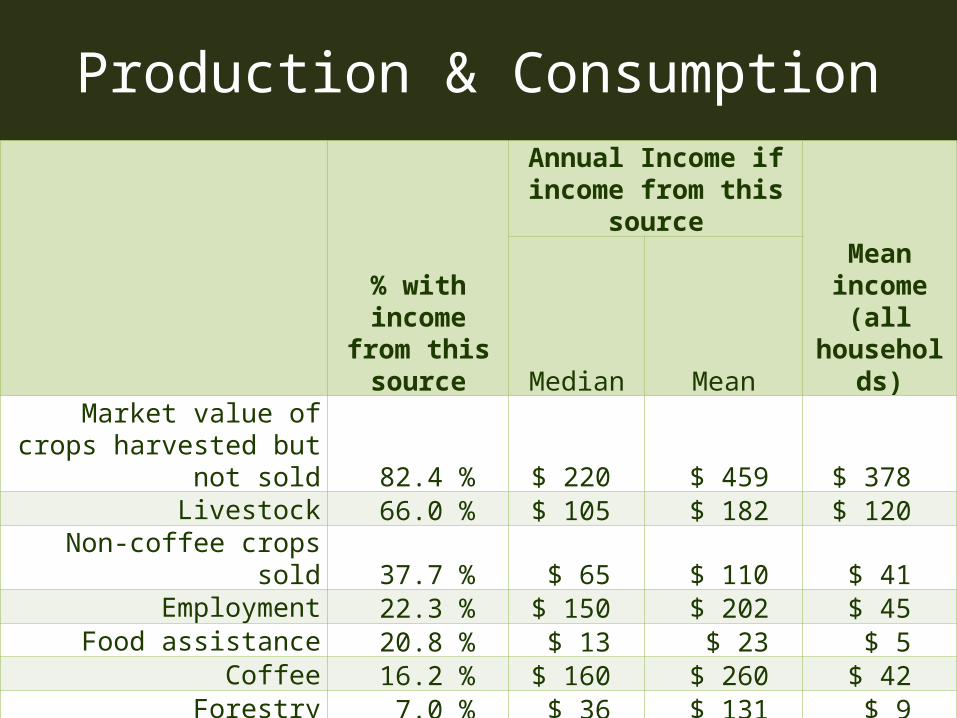
Production & Consumption
% with income from this
source
Annual Income if income from this source
Mean income (all
households)Median MeanMarket value of crops
harvested but not sold 82.4 % $ 220 $ 459 $ 378Livestock 66.0 % $ 105 $ 182 $ 120
Non-coffee crops sold 37.7 % $ 65 $ 110 $ 41Employment 22.3 % $ 150 $ 202 $ 45
Food assistance 20.8 % $ 13 $ 23 $ 5Coffee 16.2 % $ 160 $ 260 $ 42
Forestry 7.0 % $ 36 $ 131 $ 9By-product 5.3 % $ 5 $ 16 $ 1Enterprise 5.2 % $ 375 $ 1,069 $ 56
Fishing 3.0 % $ 290 $ 669 $ 20Other assistance 1.9 % $ 450 $ 1,107 $ 21
Pensions (mainly overseas) 1.4 % $ 1,440 $ 5,068 $ 69Cash assistance 0.3 % $ 700 $ 2,646 $ 9
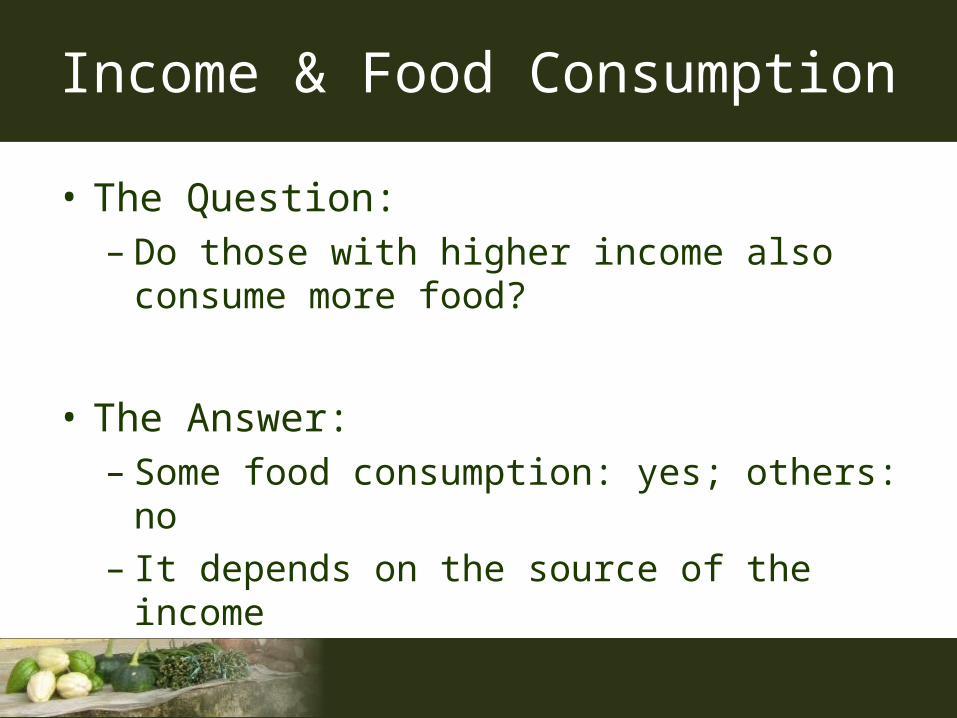
Income & Food Consumption
• The Question: – Do those with higher income also consume more
food?
• The Answer: – Some food consumption: yes; others: no– It depends on the source of the income
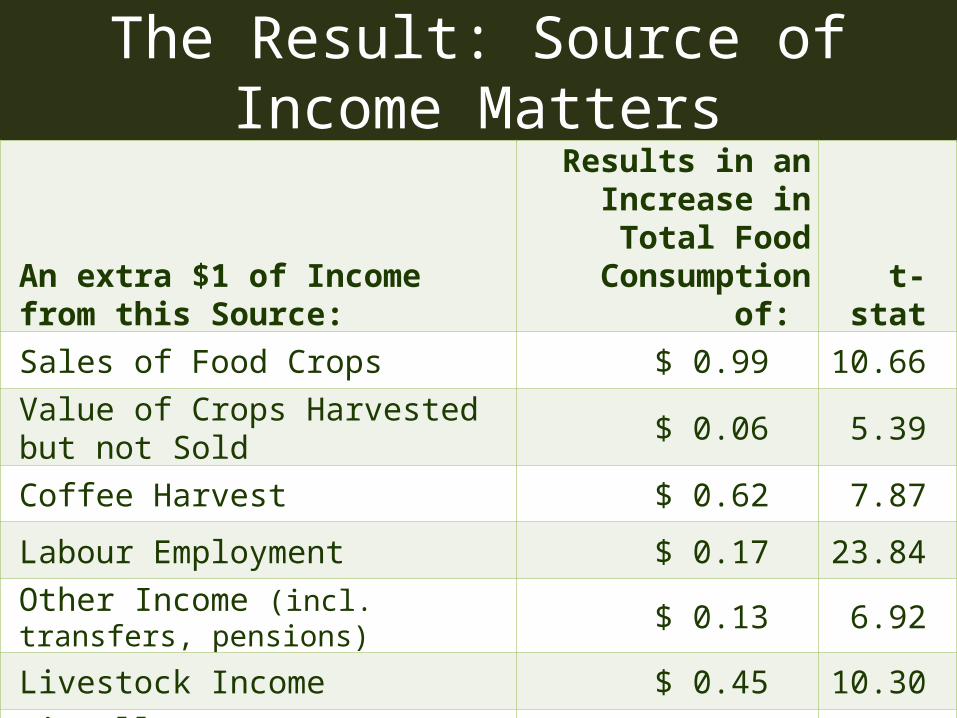
The Result: Source of Income Matters
An extra $1 of Income from this Source:
Results in an Increase in Total Food
Consumption of: t-statSales of Food Crops $ 0.99 10.66
Value of Crops Harvested but not Sold $ 0.06 5.39
Coffee Harvest $ 0.62 7.87
Labour Employment $ 0.17 23.84
Other Income (incl. transfers, pensions) $ 0.13 6.92
Livestock Income $ 0.45 10.30
Miscellaneous Agricultural Income $ 0.31 5.89
Profit from Enterprise Activity - $ 0.02 - 6.07
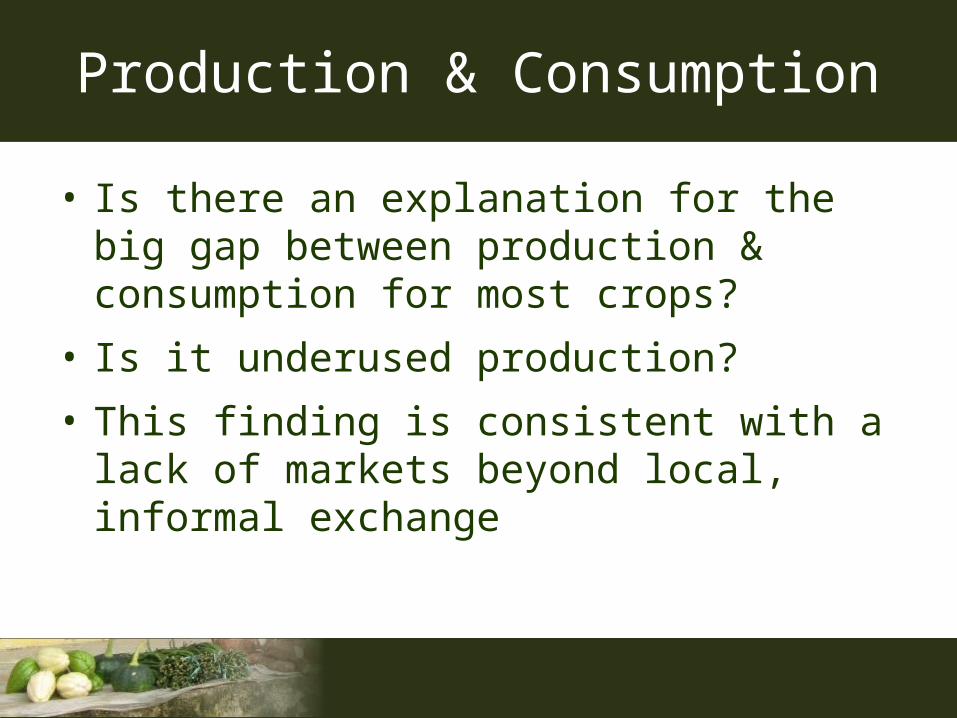
Production & Consumption
• Is there an explanation for the big gap between production & consumption for most crops?
• Is it underused production?
• This finding is consistent with a lack of markets beyond local, informal exchange
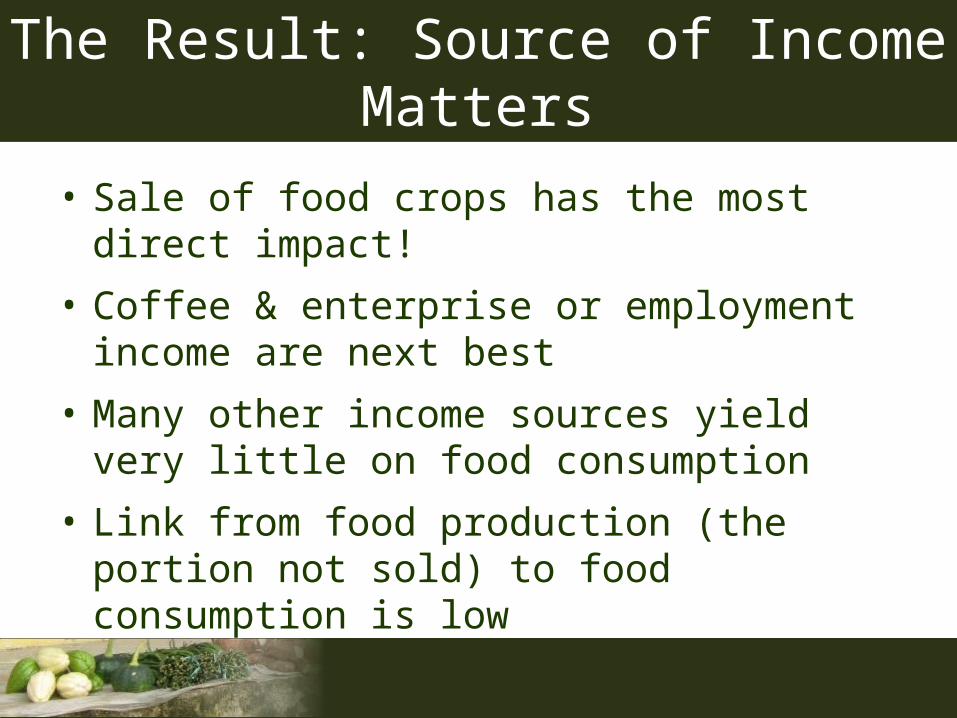
The Result: Source of Income Matters
• Sale of food crops has the most direct impact!
• Coffee & enterprise or employment income are next best
• Many other income sources yield very little on food consumption
• Link from food production (the portion not sold) to food consumption is low
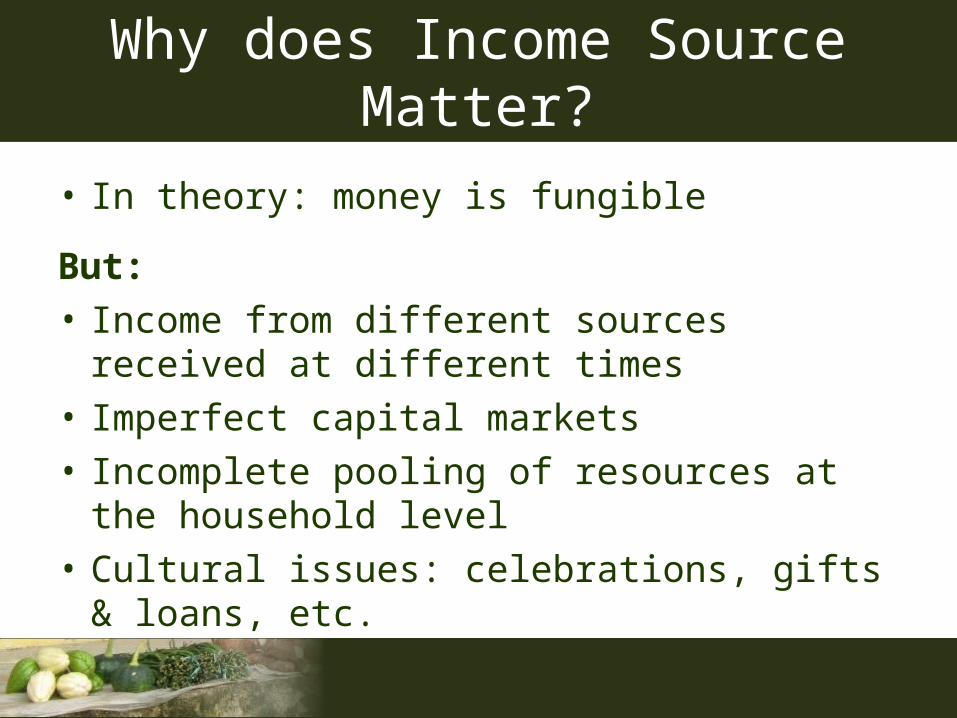
Why does Income Source Matter?
• In theory: money is fungible
But:• Income from different sources received at
different times • Imperfect capital markets• Incomplete pooling of resources at the
household level• Cultural issues: celebrations, gifts & loans, etc.
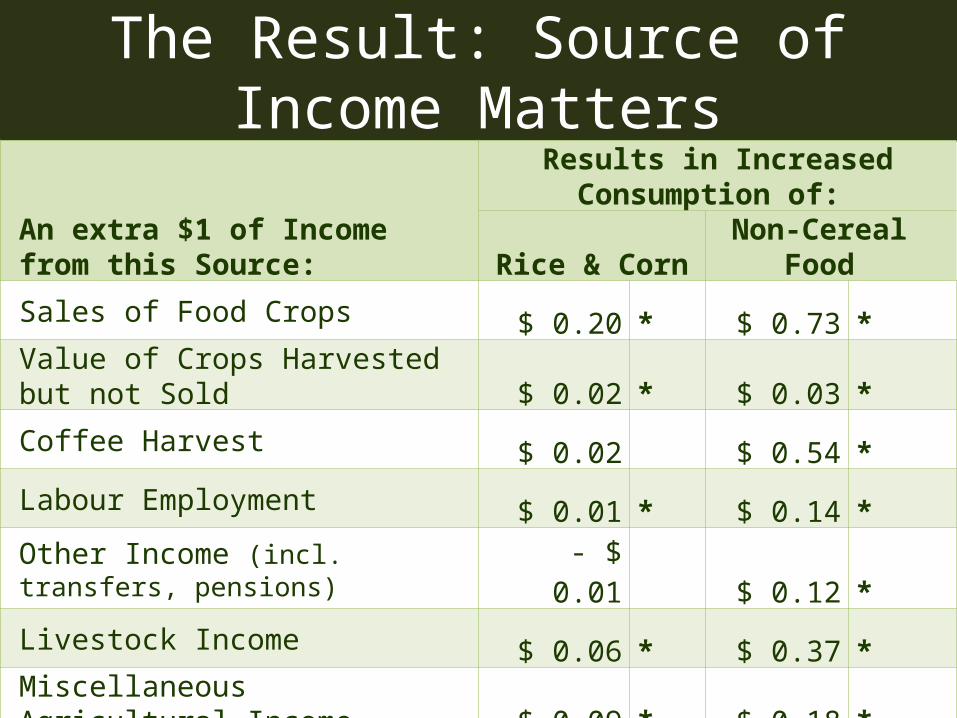
The Result: Source of Income Matters
An extra $1 of Income from this Source:
Results in Increased Consumption of:
Rice & Corn Non-Cereal Food
Sales of Food Crops $ 0.20 * $ 0.73 *
Value of Crops Harvested but not Sold $ 0.02 * $ 0.03 *
Coffee Harvest $ 0.02 $ 0.54 *
Labour Employment $ 0.01 * $ 0.14 *
Other Income (incl. transfers, pensions) - $ 0.01 $ 0.12 *
Livestock Income $ 0.06 * $ 0.37 *
Miscellaneous Agricultural Income $ 0.09 * $ 0.18 *
Profit from Enterprise Activity $ 0.00 - $ 0.01 *
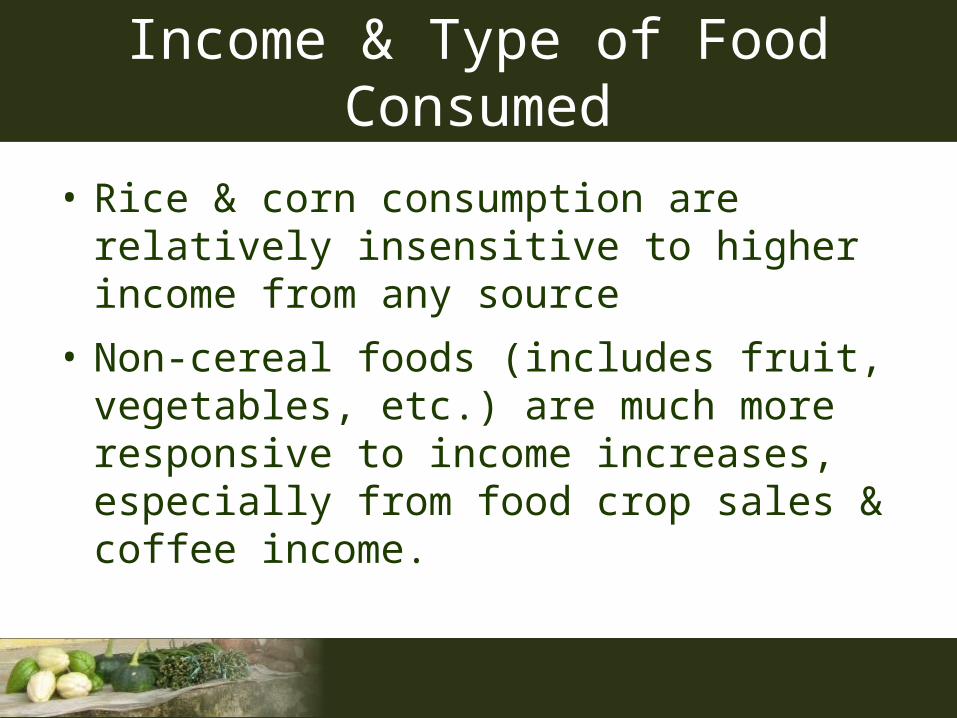
Income & Type of Food Consumed
• Rice & corn consumption are relatively insensitive to higher income from any source
• Non-cereal foods (includes fruit, vegetables, etc.) are much more responsive to income increases, especially from food crop sales & coffee income.
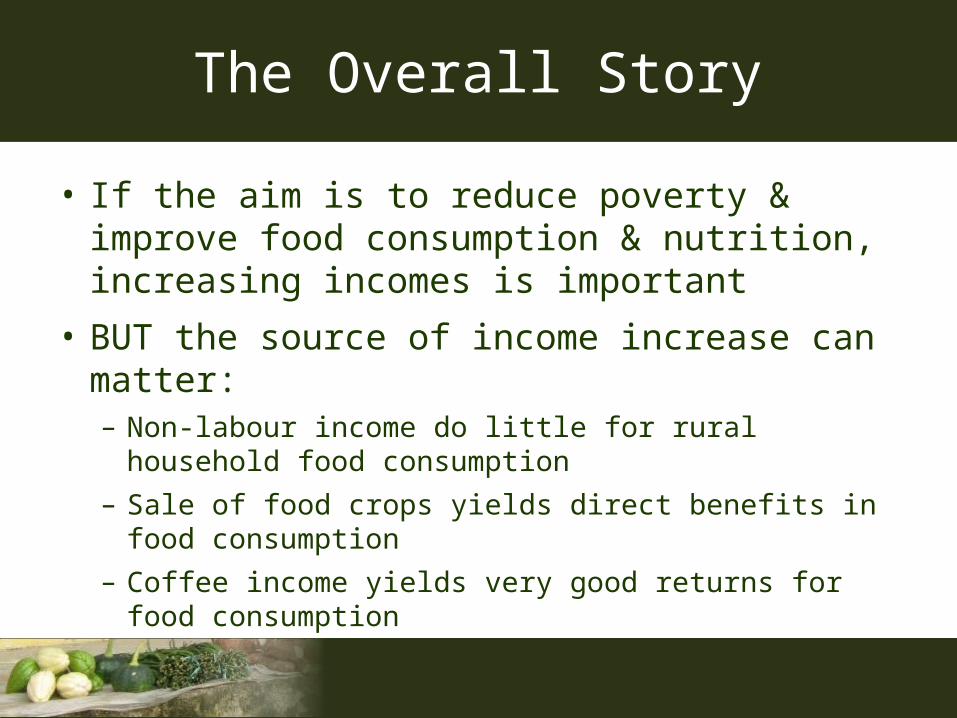
The Overall Story
• If the aim is to reduce poverty & improve food consumption & nutrition, increasing incomes is important
• BUT the source of income increase can matter:– Non-labour income do little for rural household food
consumption– Sale of food crops yields direct benefits in food consumption– Coffee income yields very good returns for food
consumption
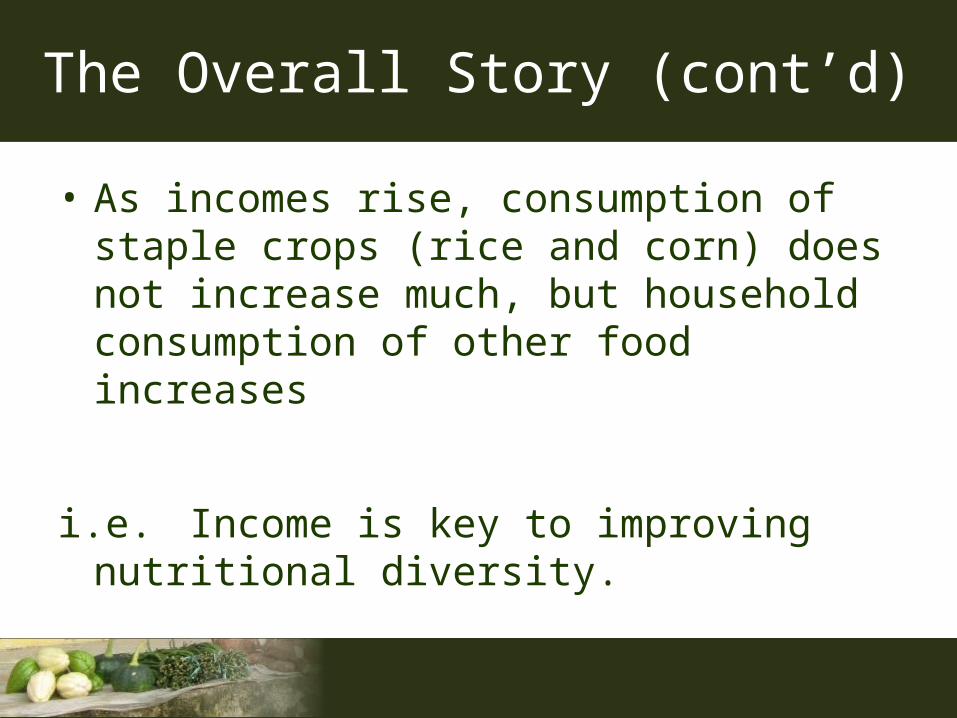
The Overall Story (cont’d)
• As incomes rise, consumption of staple crops (rice and corn) does not increase much, but household consumption of other food increases
i.e. Income is key to improving nutritional diversity.
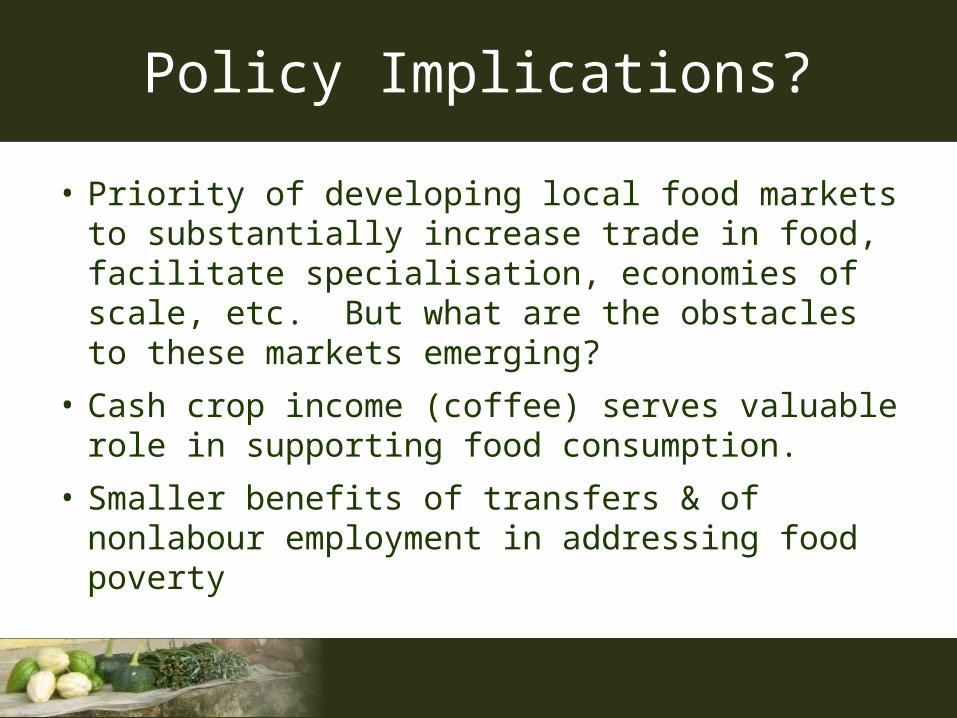
Policy Implications?
• Priority of developing local food markets to substantially increase trade in food, facilitate specialisation, economies of scale, etc. But what are the obstacles to these markets emerging?
• Cash crop income (coffee) serves valuable role in supporting food consumption.
• Smaller benefits of transfers & of nonlabour employment in addressing food poverty