Embed Size (px)
Citation preview

Some Analysis of Some Perch Catch Data
56 perch were caught in a freshwater lake in Finland
Their weights, lengths, heights and widths were recorded
It may be anticipated that thefish's weights depend on their lengths, heights and widths whose product is a proxy for volume

Some questions/goals:
summary
outliers
prediction
interpretation of coefficients
linear
gaussian errors
preparation for a comparative study
presentation of results
...

Some of the data.
Weight(g) Length(cm) Height(cm) Width(cm)
5.9 8.4 2.11 1.41
32.0 13.7 3.53 2.00
40.0 15.0 3.82 2.43
51.5 16.2 4.59 2.63
70.0 17.4 4.59 2.94
100.0 18.0 5.22 3.32
78.0 18.7 5.20 3.12
summary(weight)
Min. 1st Qu. Median Mean 3rd Qu. Max.
5.9 120.0 207.5 382.2 692.5 1100.0

stem() The decimal point is 2 digit(s) to the right of the |
0 | 134578899011222333345555789
2 | 0235567002
4 | 16
6 | 59900
8 | 224500
10 | 000200
The decimal point is 2 digit(s) to the right of the |
0 | 134578899
1 | 011222333345555789
2 | 0235567
3 | 002
4 |
5 | 16
6 | 599
7 | 00
8 | 2245
9 | 00
10 | 0002
11 | 00

ecdf()

qqnorm()

density()

boxplot()

boxplot()

library(lattice) splom
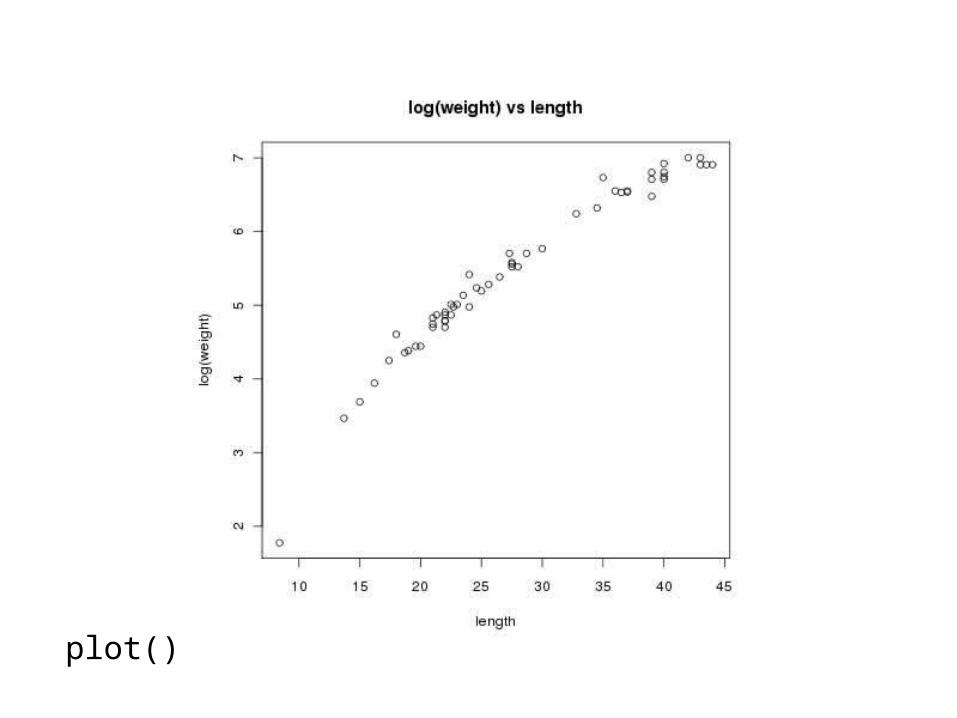
plot()
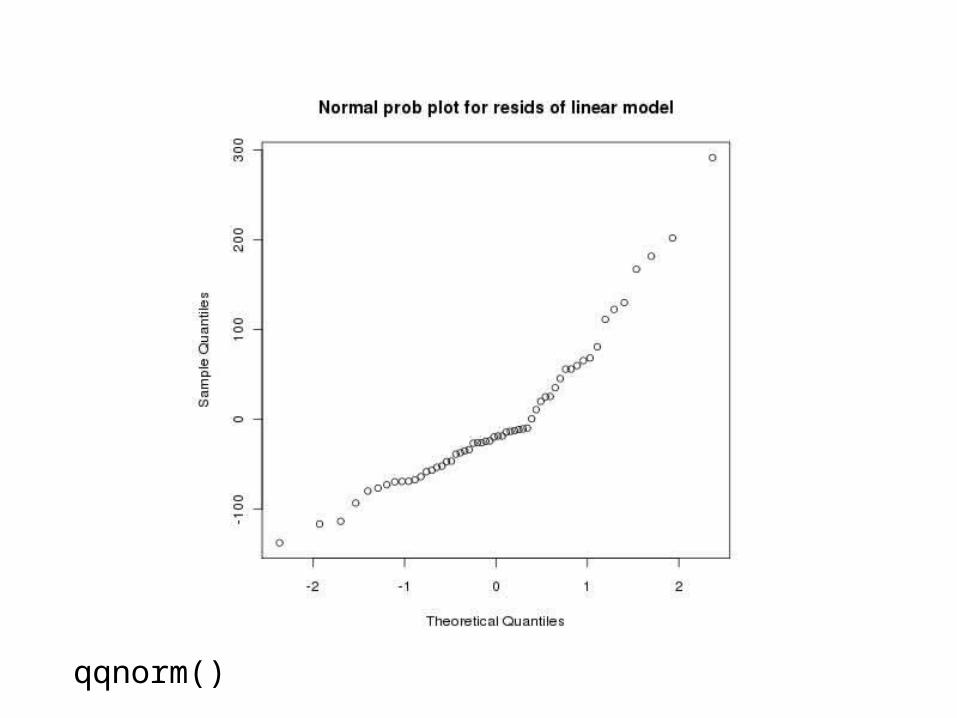
qqnorm()

summary(junk2)
Call:
lm(formula = logweight ~ loglength + logheight + logwidth)
Residuals:
Min 1Q Median 3Q Max
-0.075575 -0.022514 -0.001842 0.022046 0.091880
Coefficients:
Estimate Std. Error t value Pr(>|t|)
(Intercept) -1.0060 0.1690 -5.953 2.28e-07 ***
loglength 1.6197 0.2265 7.151 2.84e-09 ***
logheight 0.8226 0.2167 3.796 0.000386 ***
logwidth 0.5622 0.1803 3.119 0.002958 **
---
Signif. codes: 0 ‘***’ 0.001 ‘**’ 0.01 ‘*’ 0.05 ‘.’ 0.1 ‘ ’ 1
Residual standard error: 0.03767 on 52 degrees of freedom
Multiple R-squared: 0.994, Adjusted R-squared: 0.9937
F-statistic: 2890 on 3 and 52 DF, p-value: < 2.2e-16

qqnorm()

anova(junk2)
Analysis of Variance Table
Response: logweight
Df Sum Sq Mean Sq F value Pr(>F)
loglength 1 12.2353 12.2353 8623.0612 < 2.2e-16 ***
logheight 1 0.0534 0.0534 37.6351 1.179e-07 ***
logwidth 1 0.0138 0.0138 9.7278 0.002958 **
Residuals 52 0.0738 0.0014
---
Signif. codes: 0 ‘***’ 0.001 ‘**’ 0.01 ‘*’ 0.05 ‘.’ 0.1 ‘ ’ 1
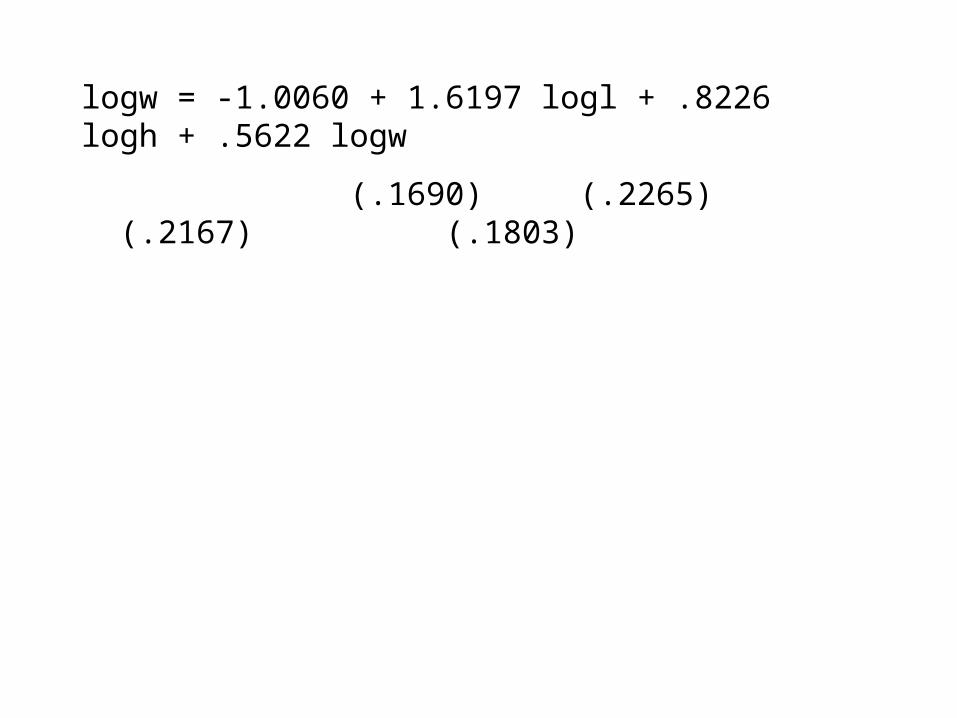
logw = -1.0060 + 1.6197 logl + .8226 logh + .5622 logw
(.1690) (.2265) (.2167) (.1803)

hi library(MASS) lm.influence()$hat
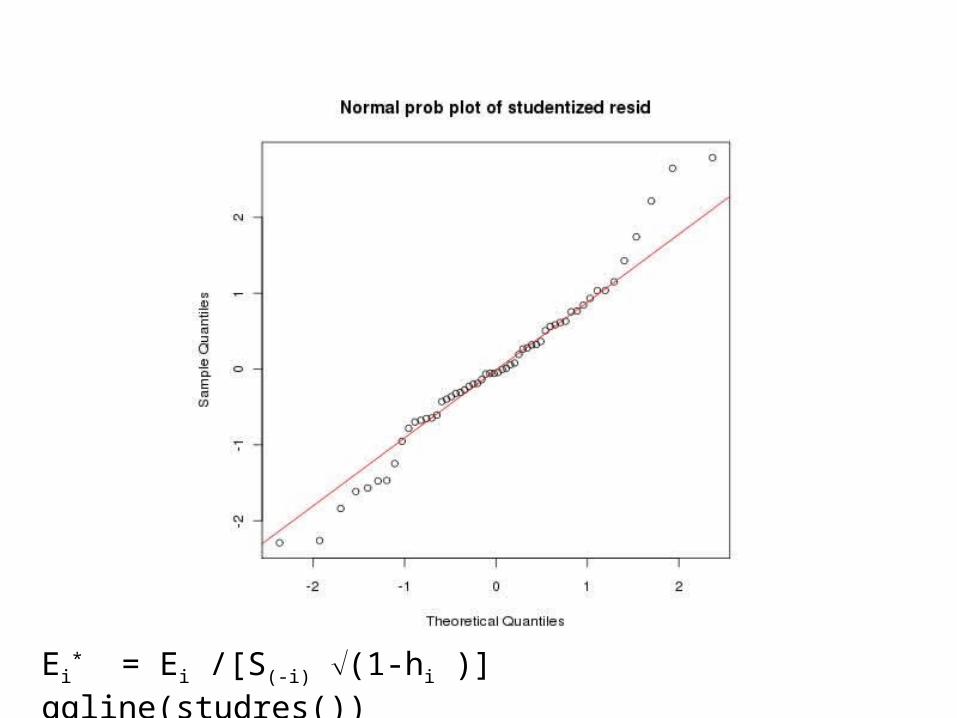
Ei* = Ei /[S(-i) (1-hi )] qqline(studres())

Ei* [hi /(1-hi )] dffits
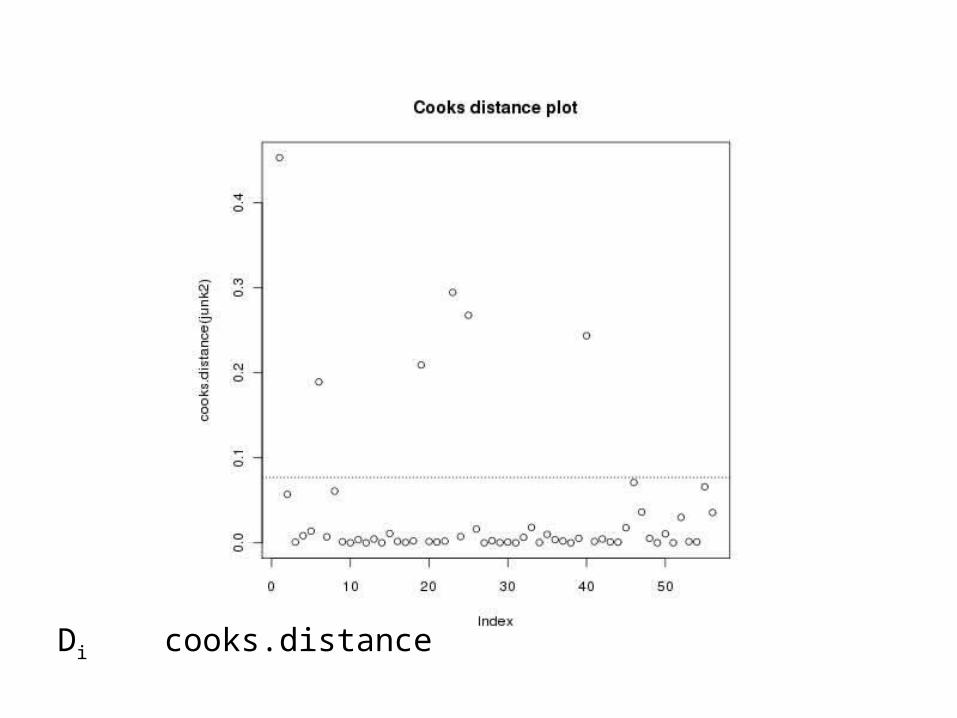
Di cooks.distance


library(car) av.plots()
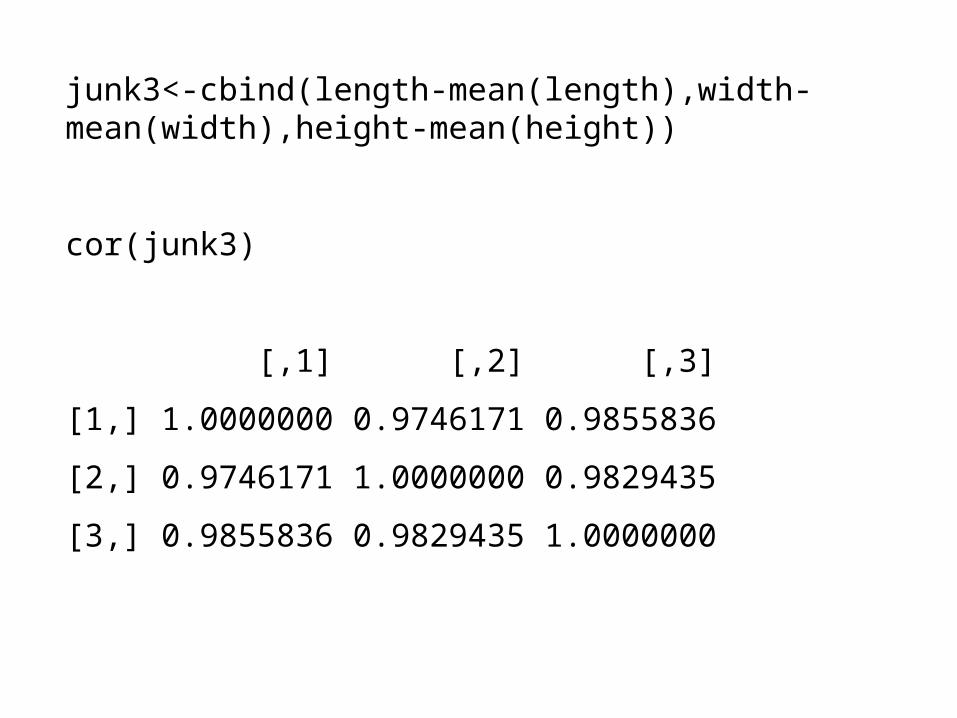
junk3<-cbind(length-mean(length),width-mean(width),height-mean(height))
cor(junk3)
[,1] [,2] [,3]
[1,] 1.0000000 0.9746171 0.9855836
[2,] 0.9746171 1.0000000 0.9829435
[3,] 0.9855836 0.9829435 1.0000000
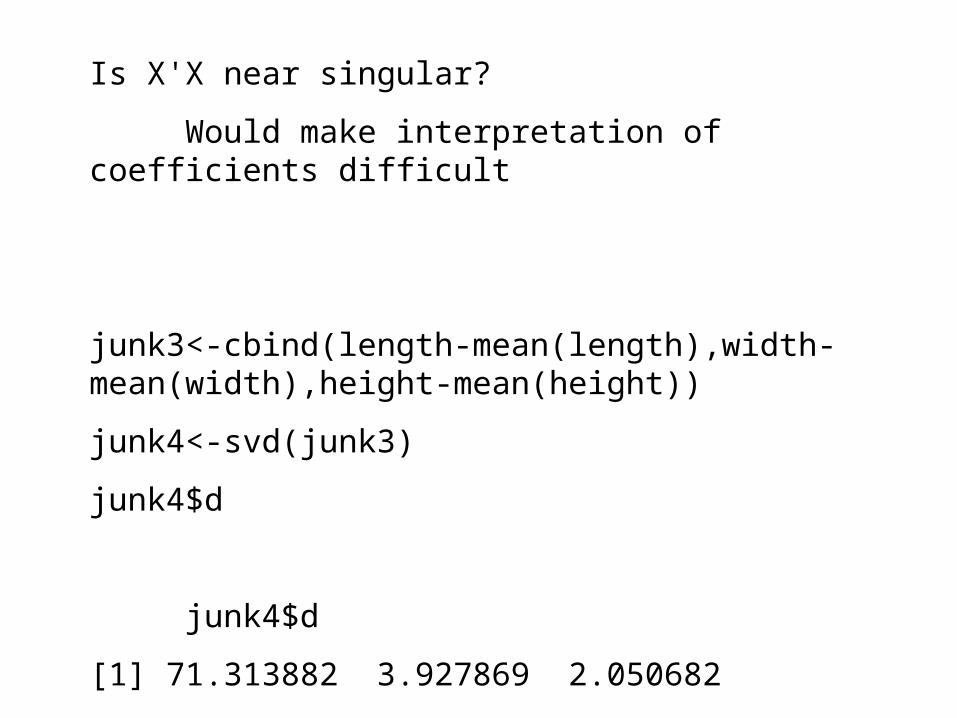
Is X'X near singular?
Would make interpretation of coefficients difficult
junk3<-cbind(length-mean(length),width-mean(width),height-mean(height))
junk4<-svd(junk3)
junk4$d
junk4$d
[1] 71.313882 3.927869 2.050682

Conclusions.
Can replace weight by product of lengths
Traditional linear model results not strongly invalidated
Began with EDA, to look for unusual "things", then moved onto linear model
...