Embed Size (px)
Citation preview
Somalia Gross Somalia Gross Domestic Product Domestic Product
ReportReport
June 2021
Somalia Gross Domestic Product
Report
NATIONAL BUREAU OF STATISTICS SOMALIA
Statistical Release
NATIONAL BUREAU OF STATISTICS SOMALIA
Somalia Gross Domestic Product Report
June 2021
Statistical Release
Website: www.nbs.gov.so
@NBS_Somalia
@nbssomalia
@nbs_somalia
+252-61-4960003
Somalia Gross Domestic Product Report
June 2021
i
Preface
This publication provides Somalia’s annual national accounts for the year 2019 and 2020 which is the main focus, showing the annual GDP estimates from the expenditure approach at current and constant 2017 prices. All estimates are calculated in accordance with the international standards contained in the System of National Accounts, 2008.
The National Accounts are a series of tables which together give a picture of the performance of the economy as a whole and some of the important sectors. The key attribute of these most recent annual national accounts estimates is that they provide a reasonable picture of the economy that helps the government to assess, analyse, and monitor economic growth on a regular basis. They are vital for policy-making, analysis and research.
The National Bureau of Statistics would like to thank all the establishments that made their data available as input to the estimates. Without their cooperation, it would have been impossible to produce this publication. The cooperation and support of the various Government agencies providing the administrative data used in compiling the GDP estimates are very much appreciated. We would also like to thank all officers of the SNBS, in particular officers of the National Accounts Unit, as well as field staff of the Macroeconomic and Financial Statistics for their dedication towards the success of this exercise. Your efforts have continued to pay off in form of these landmark results.
Furthermore, we would like to thank the IMF for having provided comprehensive Technical Assistance. We further acknowledge the Technical Assistance that we received from the Statistics Sweden, the World Bank, and the African Development Bank through the Statistical Capacity Building Program, these activities have served to improve the image of SNBS and its relationship with its users, while simultaneously providing an opportunity to highlight important statistics through a wide-reaching medium.
The National Bureau of Statistics welcomes the views and comments of users, to help us to improve the quality of Somalia’s national accounts.
Sharmarke Mohamed Farah
Director General
Somalia National Bureau of Statistics
National Bureau of Statistics-Somalia | Statistical Release
June 2021
ii
Table of Contents
1. INTRODUCTION 1
2. DATA SOURCES AND METHODS 1
3. KEY FINDINGS 2
3.1 GDP GROWTH RATE 2
3.2 INFLATION RATE AND GDP DEFLATOR 3
4. REVISIONS IN THIS RELEASE 4
5. IMPROVEMENTS IN NATIONAL ACCOUNTS COMPILATION 5
6. STATISTICAL TABLES 5
TABLE 1: GDP BY EXPENDITURE, CURRENT PRICES, MILLION US DOLLARS 5
TABLE 2: GDP BY EXPENDITURE, CURRENT PRICES, PERCENTAGE SHARES 6
TABLE 3: GDP BY EXPENDITURE, CONSTANT PRICES, MILLION US DOLLARS 6
TABLE 4: GDP BY EXPENDITURE, CONSTANT PRICES, PERCENT ANNUAL CHANGE 6
Somalia Gross Domestic Product Report
June 2021
1
Introduction
Data Sources and Methods
The annual Gross Domestic Product (GDP) statistics are key indicators of Somalia’s economy and its growth in recent years, providing estimates of expenditure levels and growth across the economy. While much effort has been made to secure new sources of data and improve the quality of data from existing sources, the estimates presented in this report were compiled as far as possible in accordance with the 2008 System of National Accounts (SNA). The 2008 SNA is the internationally agreed standard set of recommendations on how to compile measures of economic activity in accordance with strict accounting conventions based on economic principles. The accounting framework of the SNA allows economic data to be compiled and presented in a format that is designed for purposes of economic analysis, decision-making, and policy formulation.
The use of the expenditure approach in the current and constant 2017 prices dataset is one of the first steps towards transforming the data collected via the Somalia High Frequency surveys. The National Accounts estimates in this report summarize the latest economic developments of 2019 and 2020. This publication shows time series data of 2012-2020, the base year for the Somalia’s National Accounts is 2017.
Data used for compiling GDP is from surveys conducted by SNBS and other data-producing agencies. The main data source for the compilation of annual accounts for the year 2020 was the 2017 High Frequency Survey (HFS), Wave II, and administrative data received from institutions. Other data sources are listed below: -
1
2
UN Comtrade: The Comtrade database is maintained by the UN Statistical Department and contains data on foreign trade reported by most countries in the world. For future publication, the SNBS plans to use exports and imports data from the Ministry of Finance and livestock exports from Berbera port.
Consumer price index: CPI is the deflator for many items and is calculated as a weighted average of the Somaliland and Mogadishu CPI. The weights are based on the 2016 Somalia High Frequency Survey. A benchmark Integrated Household Budget Survey (IHBS) is planned for 2021. Running for a full year, the results of this national expenditure survey will be used to estimate the weights of a national CPI and to update the CPI basket.
Population Estimation Survey: The PESS provides population data for 2014. The annual population growth has been estimated at 2.8 percent.
National Bureau of Statistics-Somalia | Statistical Release
June 2021
2
Improvements have been made to incorporate contemporary source data, especially government financial statistics and exchange rates. The SNBS will continuously explore other reliable data sources that are available to make further improvements in the compilation of the GDP estimates using both the production and expenditure approaches. This includes Business income and expense data reported by Somalia’s formal enterprises and available from the Ministry of Finance as part of Business Income tax reporting. Further improvements to incorporate 2008 SNA will continue.
3.1 GDP Growth rate
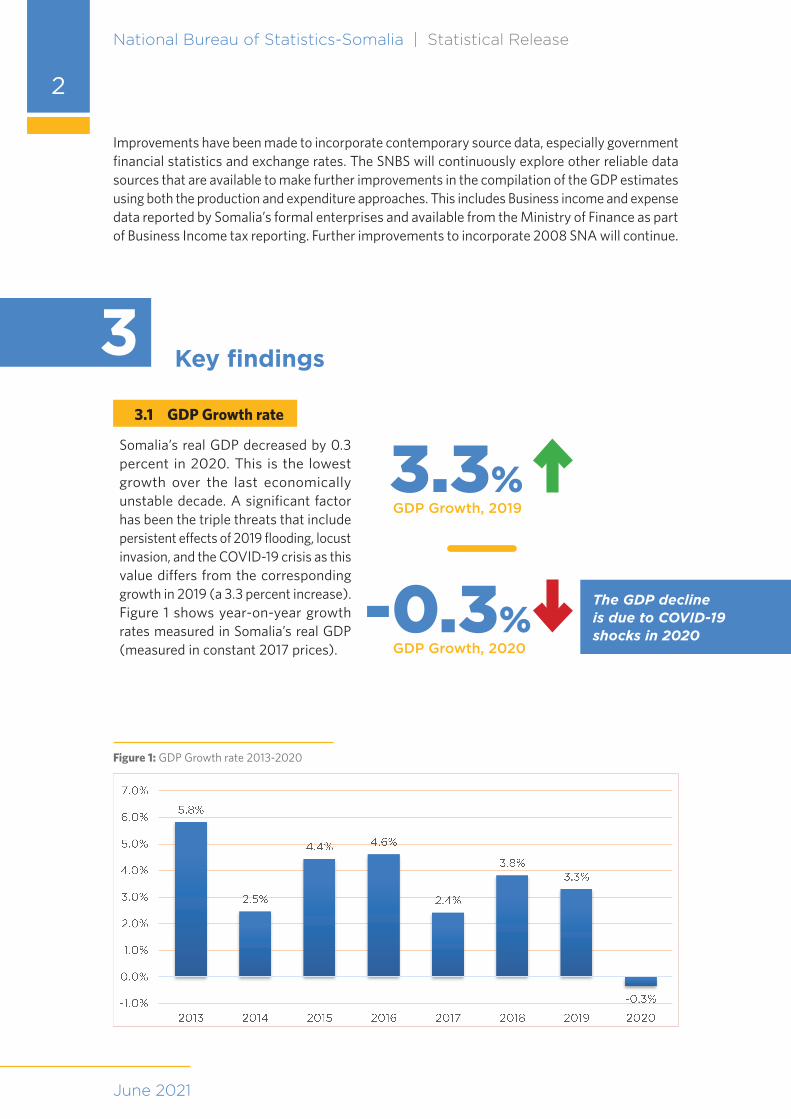
Somalia’s real GDP decreased by 0.3 percent in 2020. This is the lowest growth over the last economically unstable decade. A significant factor has been the triple threats that include persistent effects of 2019 flooding, locust invasion, and the COVID-19 crisis as this value differs from the corresponding growth in 2019 (a 3.3 percent increase). Figure 1 shows year-on-year growth rates measured in Somalia’s real GDP (measured in constant 2017 prices).
Key findings3
Figure 1: GDP Growth rate 2013-2020
-0.3%
3.3%
GDP Growth, 2020
GDP Growth, 2019
1
Figure 1: GDP Growth rate 2013-2020
Figure 2: Shares of GDP at Current prices
Figure 3: C PI and GDP-deflator in percentage
The GDP decline is due to COVID-19 shocks in 2020
Somalia Gross Domestic Product Report
June 2021
3
3.2 Inflation Rate and GDP Deflator
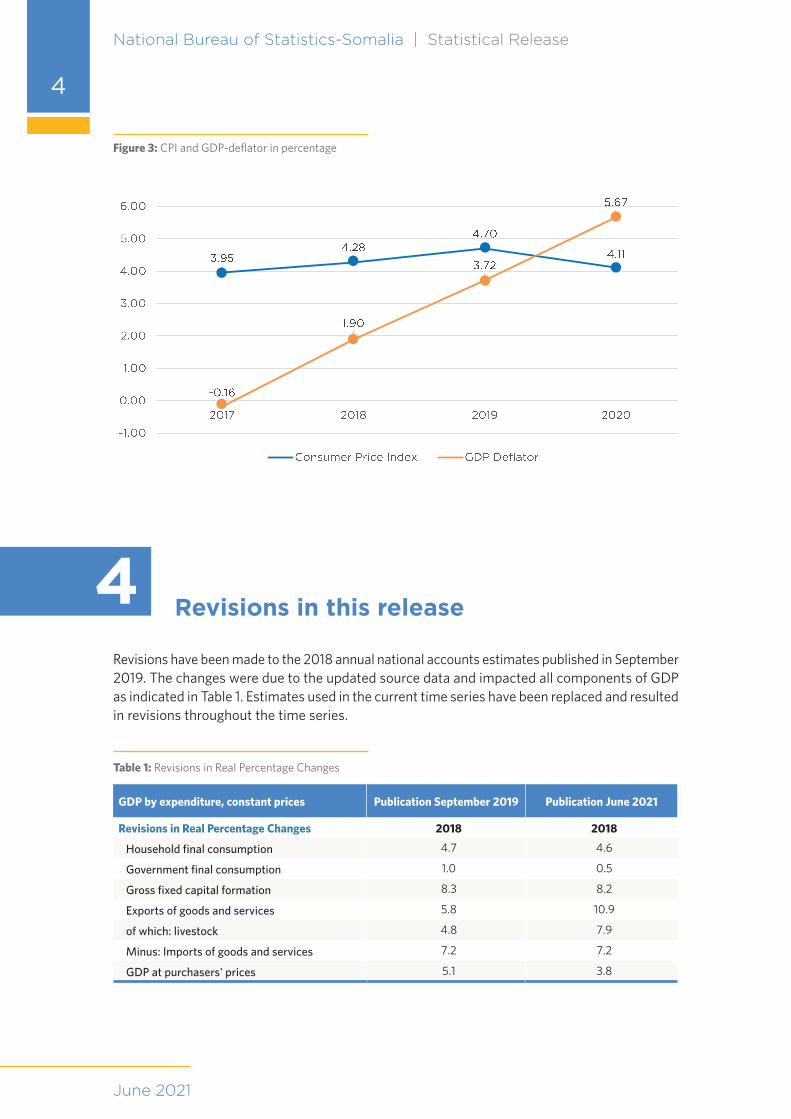
During the period 2019 to 2020, the average annual inflation rate was 4.70 per cent compared to 4.11 per cent recorded in 2020. The main contributors to inflation were the categories of Food and Non-Alcoholic Beverages and Housing, Water, Electricity, Gas. These Groups had the largest weighted influence on the All items CPI inflation rate. The GDP deflator recorded 5.67 percent in 2020. This is compared to the 3.72 percent experienced in the year 2019.
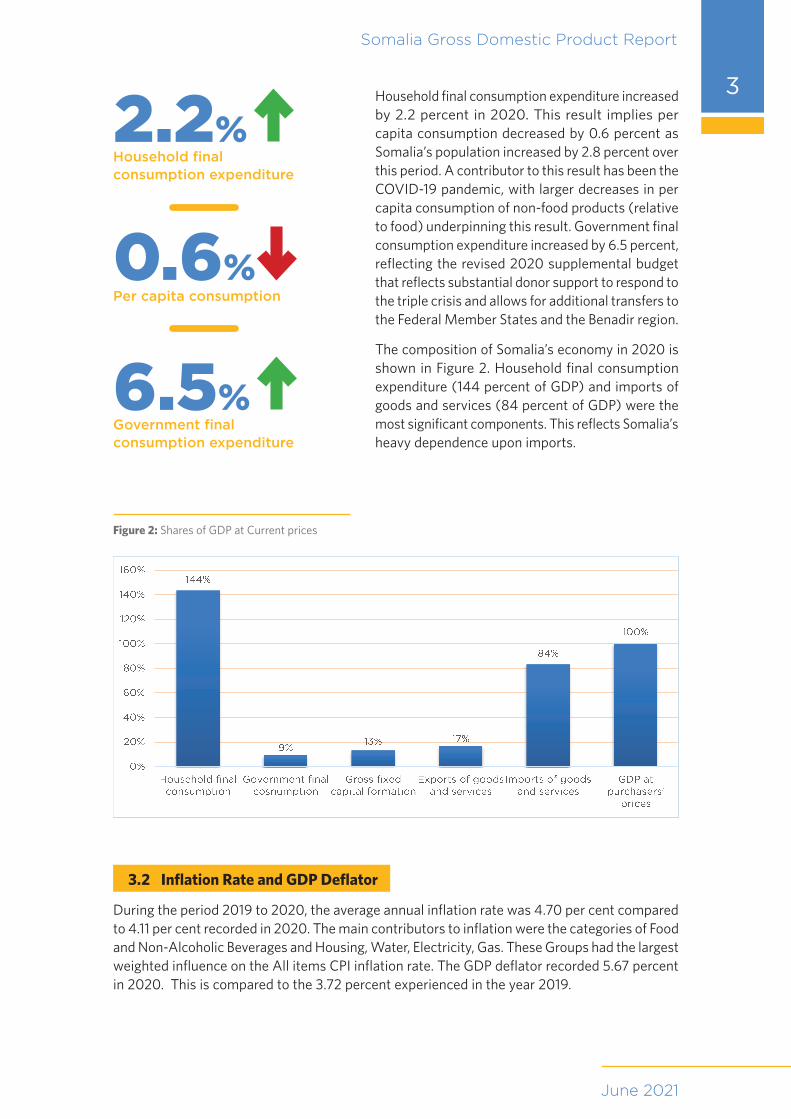
Figure 2: Shares of GDP at Current prices
Household final consumption expenditure increased by 2.2 percent in 2020. This result implies per capita consumption decreased by 0.6 percent as Somalia’s population increased by 2.8 percent over this period. A contributor to this result has been the COVID-19 pandemic, with larger decreases in per capita consumption of non-food products (relative to food) underpinning this result. Government final consumption expenditure increased by 6.5 percent, reflecting the revised 2020 supplemental budget that reflects substantial donor support to respond to the triple crisis and allows for additional transfers to the Federal Member States and the Benadir region.
The composition of Somalia’s economy in 2020 is shown in Figure 2. Household final consumption expenditure (144 percent of GDP) and imports of goods and services (84 percent of GDP) were the most significant components. This reflects Somalia’s heavy dependence upon imports.
2.2%
0.6%
6.5%
Household final consumption expenditure
Per capita consumption
Government final consumption expenditure
1
Figure 1: GDP Growth rate 2013-2020
Figure 2: Shares of GDP at Current prices
Figure 3: C PI and GDP-deflator in percentage
National Bureau of Statistics-Somalia | Statistical Release
June 2021
4
Figure 3: CPI and GDP-deflator in percentage
Table 1: Revisions in Real Percentage Changes
Revisions in this release 4Revisions have been made to the 2018 annual national accounts estimates published in September 2019. The changes were due to the updated source data and impacted all components of GDP as indicated in Table 1. Estimates used in the current time series have been replaced and resulted in revisions throughout the time series.
GDP by expenditure, constant prices Publication September 2019 Publication June 2021
Revisions in Real Percentage Changes 2018 2018
Household final consumption 4.7 4.6
Government final consumption 1.0 0.5
Gross fixed capital formation 8.3 8.2
Exports of goods and services 5.8 10.9
of which: livestock 4.8 7.9
Minus: Imports of goods and services 7.2 7.2
GDP at purchasers' prices 5.1 3.8
2
Somalia Gross Domestic Product Report
June 2021
5
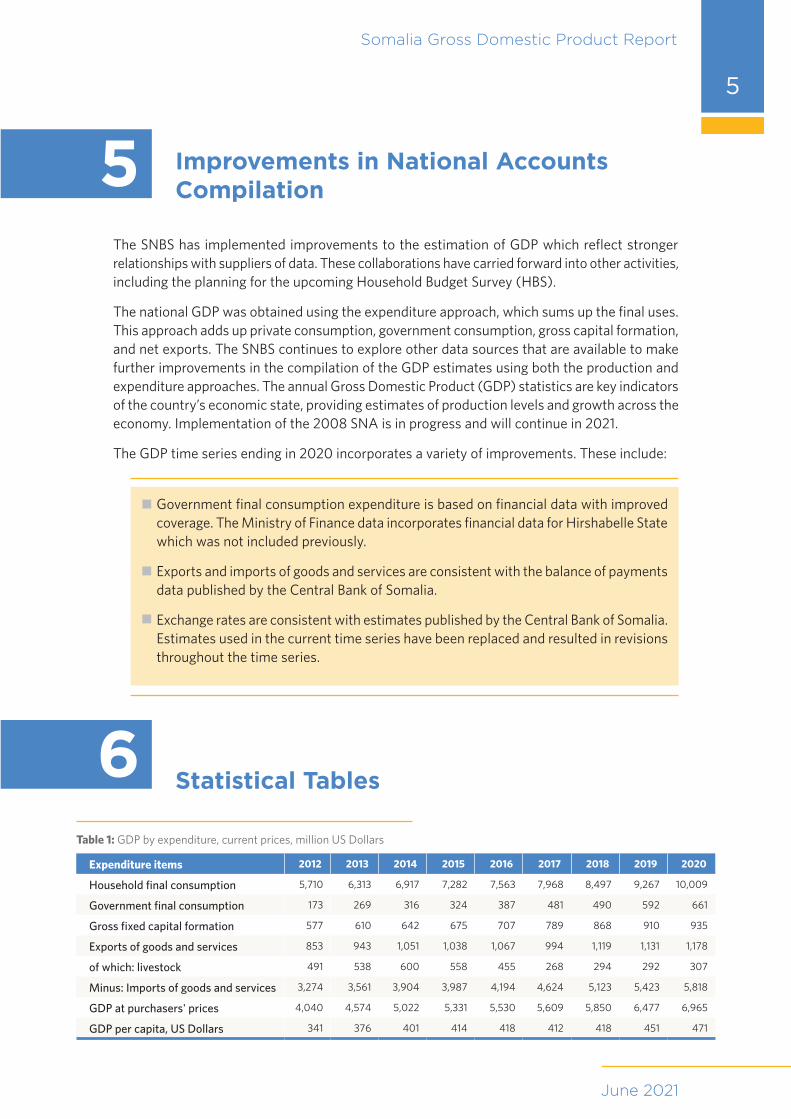
Table 1: GDP by expenditure, current prices, million US Dollars
Expenditure items 2012 2013 2014 2015 2016 2017 2018 2019 2020
Household final consumption 5,710 6,313 6,917 7,282 7,563 7,968 8,497 9,267 10,009
Government final consumption 173 269 316 324 387 481 490 592 661
Gross fixed capital formation 577 610 642 675 707 789 868 910 935
Exports of goods and services 853 943 1,051 1,038 1,067 994 1,119 1,131 1,178
of which: livestock 491 538 600 558 455 268 294 292 307
Minus: Imports of goods and services 3,274 3,561 3,904 3,987 4,194 4,624 5,123 5,423 5,818
GDP at purchasers' prices 4,040 4,574 5,022 5,331 5,530 5,609 5,850 6,477 6,965
GDP per capita, US Dollars 341 376 401 414 418 412 418 451 471
Improvements in National Accounts Compilation
Statistical Tables
5
6
The SNBS has implemented improvements to the estimation of GDP which reflect stronger relationships with suppliers of data. These collaborations have carried forward into other activities, including the planning for the upcoming Household Budget Survey (HBS).
The national GDP was obtained using the expenditure approach, which sums up the final uses. This approach adds up private consumption, government consumption, gross capital formation, and net exports. The SNBS continues to explore other data sources that are available to make further improvements in the compilation of the GDP estimates using both the production and expenditure approaches. The annual Gross Domestic Product (GDP) statistics are key indicators of the country’s economic state, providing estimates of production levels and growth across the economy. Implementation of the 2008 SNA is in progress and will continue in 2021.
The GDP time series ending in 2020 incorporates a variety of improvements. These include:
Government final consumption expenditure is based on financial data with improved coverage. The Ministry of Finance data incorporates financial data for Hirshabelle State which was not included previously.
Exports and imports of goods and services are consistent with the balance of payments data published by the Central Bank of Somalia.
Exchange rates are consistent with estimates published by the Central Bank of Somalia. Estimates used in the current time series have been replaced and resulted in revisions throughout the time series.
National Bureau of Statistics-Somalia | Statistical Release
June 2021
6
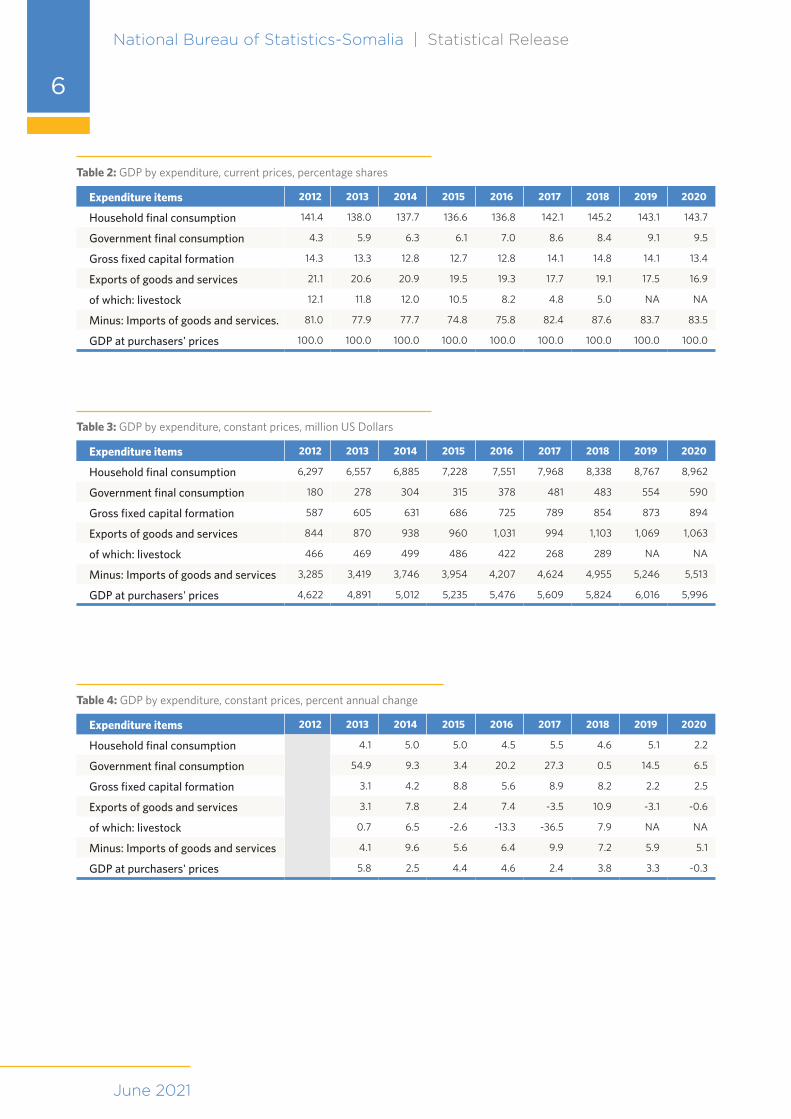
Table 2: GDP by expenditure, current prices, percentage shares
Table 3: GDP by expenditure, constant prices, million US Dollars
Table 4: GDP by expenditure, constant prices, percent annual change
Expenditure items 2012 2013 2014 2015 2016 2017 2018 2019 2020
Household final consumption 141.4 138.0 137.7 136.6 136.8 142.1 145.2 143.1 143.7
Government final consumption 4.3 5.9 6.3 6.1 7.0 8.6 8.4 9.1 9.5
Gross fixed capital formation 14.3 13.3 12.8 12.7 12.8 14.1 14.8 14.1 13.4
Exports of goods and services 21.1 20.6 20.9 19.5 19.3 17.7 19.1 17.5 16.9
of which: livestock 12.1 11.8 12.0 10.5 8.2 4.8 5.0 NA NA
Minus: Imports of goods and services. 81.0 77.9 77.7 74.8 75.8 82.4 87.6 83.7 83.5
GDP at purchasers' prices 100.0 100.0 100.0 100.0 100.0 100.0 100.0 100.0 100.0
Expenditure items 2012 2013 2014 2015 2016 2017 2018 2019 2020
Household final consumption 6,297 6,557 6,885 7,228 7,551 7,968 8,338 8,767 8,962
Government final consumption 180 278 304 315 378 481 483 554 590
Gross fixed capital formation 587 605 631 686 725 789 854 873 894
Exports of goods and services 844 870 938 960 1,031 994 1,103 1,069 1,063
of which: livestock 466 469 499 486 422 268 289 NA NA
Minus: Imports of goods and services 3,285 3,419 3,746 3,954 4,207 4,624 4,955 5,246 5,513
GDP at purchasers' prices 4,622 4,891 5,012 5,235 5,476 5,609 5,824 6,016 5,996
Expenditure items 2012 2013 2014 2015 2016 2017 2018 2019 2020
Household final consumption 4.1 5.0 5.0 4.5 5.5 4.6 5.1 2.2
Government final consumption 54.9 9.3 3.4 20.2 27.3 0.5 14.5 6.5
Gross fixed capital formation 3.1 4.2 8.8 5.6 8.9 8.2 2.2 2.5
Exports of goods and services 3.1 7.8 2.4 7.4 -3.5 10.9 -3.1 -0.6
of which: livestock 0.7 6.5 -2.6 -13.3 -36.5 7.9 NA NA
Minus: Imports of goods and services 4.1 9.6 5.6 6.4 9.9 7.2 5.9 5.1
GDP at purchasers' prices 5.8 2.5 4.4 4.6 2.4 3.8 3.3 -0.3