Embed Size (px)
Citation preview

Annual Report 2000
Solutions!
Corporate Profile
Ricoh Company, Ltd., is a leading global manufacturer of office automation equipment.Our lineup includes copiers, printers, fax machines, personal computers, CD-Recordable and
CD-ReWritable drives and media, and related supplies and services. We are also prominent in digitaland conventional cameras and advanced electronic devices.
We are rapidly building a solid presence worldwide as a provider of comprehensive documentsolutions that help customers streamline their businesses and cut operating costs.
Ricoh has 122 consolidated subsidiaries and affiliates in Japan and 205 overseas, togetheremploying around 67,300 people.
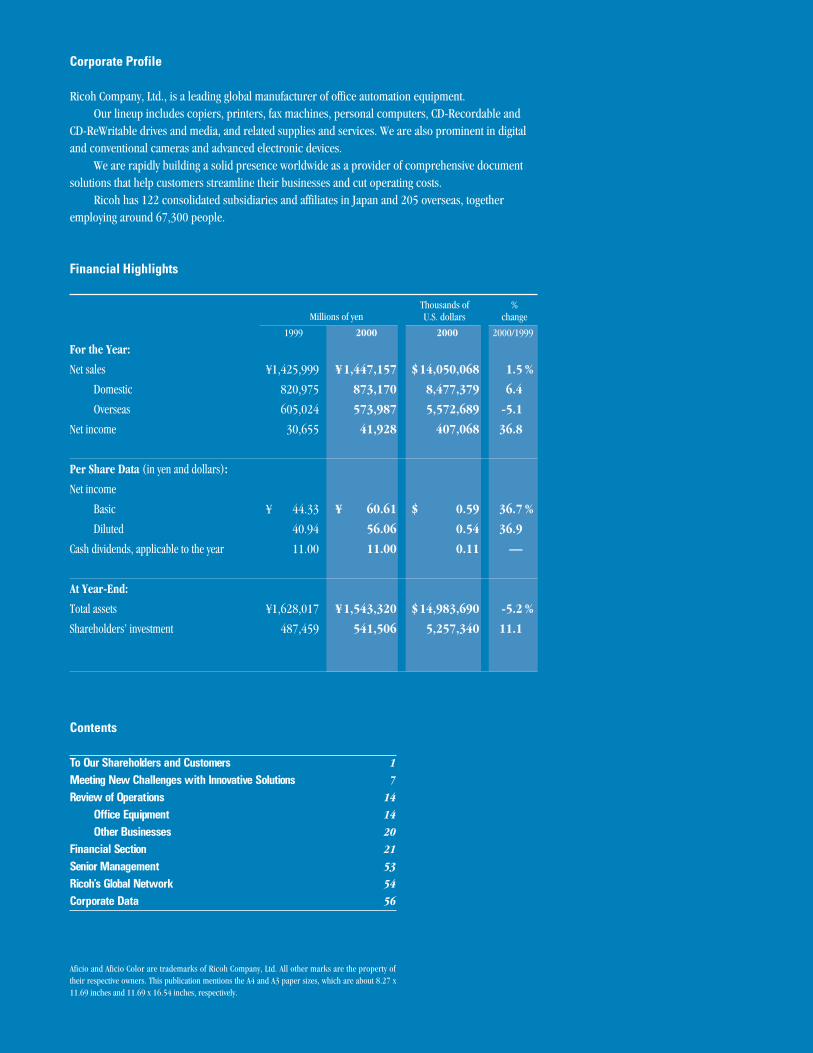
Financial Highlights
Contents
To Our Shareholders and Customers 1
Meeting New Challenges with Innovative Solutions 7
Review of Operations 14
Office Equipment 14
Other Businesses 20
Financial Section 21
Senior Management 53
Ricoh’s Global Network 54
Corporate Data 56
For the Year:
Net sales
Domestic
Overseas
Net income
Per Share Data (in yen and dollars):
Net income
Basic
Diluted
Cash dividends, applicable to the year
At Year-End:
Total assets
Shareholders’ investment
1,425,999
820,975
605,024
30,655
44.33
40.94
11.00
1,628,017
487,459
1999
Millions of yenThousands of U.S. dollars
%change
¥
¥
¥
1,447,157
873,170
573,987
41,928
60.61
56.06
11.00
1,543,320
541,506
2000
¥
¥
¥
14,050,068
8,477,379
5,572,689
407,068
0.59
0.54
0.11
14,983,690
5,257,340
2000
$
$
$
1.5
6.4
-5.1
36.8
36.7
36.9
—
-5.2
11.1
2000/1999
%
%
%
Aficio and Aficio Color are trademarks of Ricoh Company, Ltd. All other marks are the property oftheir respective owners. This publication mentions the A4 and A3 paper sizes, which are about 8.27 x11.69 inches and 11.69 x 16.54 inches, respectively.

1
Another Solid PerformanceRicoh registered another stellar performance in fiscal2000, ended March 31, 2000. We reaped the rich rewardsof our ongoing customer satisfaction drive to becomemuch more profitable in an intensely competitive inter-national marketplace. We boosted revenues and earningsfor the sixth and eighth years running, respectively, andstrengthened our cash flow.
More profitable operationsNet sales increased 1.5%, to ¥1,447.2 billion ($14,050million). This was primarily because of the very solid performance of our digital multifunctional systems andthe massive popularity of our printer range in Japan. Ouremerging printing and document solutions businessesalso made steady market inroads.
Domestic sales climbed 6.4%, to ¥873.2 billion($8,477 million). Overseas sales declined 5.1%, to ¥574.0billion ($5,573 million). But this has to be viewed in thecontext of the yen’s average 13% appreciation against theU.S. dollar during the term. Overseas growth was actuallyvery solid in local-currency terms, particularly in Europeand the United States. The Aficio brand of digital imagingsystems continued gathering steam internationally.
While generally pleasing, the revenue gains paledagainst our massive bottom-line improvements. Our multifunctional digital copiers and printers were both
very popular and delivered high margins. At the other endof the spectrum, we continued to trim overall expensesand otherwise enhance our financial position by forgingahead with our Group Cash & Cost (G-C&C) strategy. The result? Operating income surged 20.9%, to ¥88. 9 billion ($863 million), and net income rocketed 36.8%, to ¥41.9 billion ($407 million).
To Our Shareholders and Customers
Results
0
350
700
1050
1400
1750
1996
1,113.0
1997
1,316.1
1998
1,403.3
1999
1,426.0
2000
1,447.2
0
1
2
3
4
5
2.02.2 2.1 2.1
2.9
•Net Sales and Return on Sales
(Billions of Yen, %)
1996
21.9
1997
28.9
1998
30.1
1999
30.7
2000
41.9
0
9
18
27
36
45
•Net Income
(Billions of Yen)
Hiroshi Hamada (right), Chairman and Chief Executive Officer,and Masamitsu Sakurai, President and Chief Operating Officer

2
Basic net income per share was ¥60.61 ($0.59), andfully diluted net income per share was ¥56.06 ($0.54).
Return on shareholders’ investment jumped from6.4% to 8.1%.
We maintained cash dividends per share of commonstock at ¥11.00 ($0.11). At the annual general meeting ofshareholders on June 29, 2000, shareholders approved ourdecision to translate retained earnings into more solidoperational and financial fundamentals. Some of theseare described below.
A better financial positionG-C&C initiatives translated into significantly leaner bal-ance sheets. At the end of fiscal 2000, total assets were¥1,543.3 billion ($14,984 million), down 5.2% from ayear earlier. This was mainly because we slashed invento-ries and other current assets, as well as some fixed assets.As a result, return on assets soared from 1.9% to 2.7%.Total liabilities plunged 13.4%, to ¥955.5 billion ($9,276million). Reductions in short- and long-term debt and inretirement allowances contributed to this fall.
Shareholders’ investment was up 11.1%, to ¥541.5billion ($5,257 million), although this mainly stemmedfrom additions to retained earnings.
Healthier liquidityWe continued to improve our cash flow mix in fiscal2000. At year-end, net cash provided by operating activi-ties stood at ¥135.6 billion ($1,317 million), up 27.1%from the close of fiscal 1999. This reflected our higher netincome and more efficient asset management.
Net cash used in investing activities was ¥28.5 billion($277 million), a 68.1% decline stemming from a mas-sive decrease in cash deposits for the assignment of debtsecurities. We allocated most of this cash to expendituresfor plant and equipment.
The free cash flow generated by operating andinvesting activities totaled ¥107.2 billion ($1,040 mil-lion), a sixfold increase. This allowed us to reimburse cor-porate bonds and debts and maintain dividends.
Our cash flow for the year included additionaldeposits of ¥50.0 billion ($485 million) based on corpo-rate bond underwriting contracts. Financing activitiesreflected the repayment of corporate bonds for thisamount.
Consequently, cash and cash equivalents at the closeof fiscal 2000 were ¥111.8 billion ($1,086 million), down¥18.8 billion, or 14.4%. One reason for this decline was anexchange-rate fluctuation effect of ¥4.7 billion ($46 mil-lion).
To Our Shareholders and Customers
0
120
240
360
480
600
1996
401.5
1997
422.9
1998
475.0
1999
487.5
2000
541.5
0
2
4
6
8
10
5.6
7.06.7 6.4
8.1
(Billions of Yen, %)
0
400
800
1200
1600
2000
1996
1508.5
1997
1644.9
1998
1660.5
1999
1628.0
2000
1543.3
0
1
2
3
4
5
1.4
1.8 1.81.9
2.7
•Total Assets and Return on Assets
(Billions of Yen, %)
1996
33.55
1997
44.16
1998
44.97
1999
44.33
2000
60.61
44.33
60.61
0
14
28
42
56
70
31.21
38.9541.35 40.94
56.06
•Net Income per Share of Common Stock
(Yen)
Basic Diluted
•Shareholders’ Investment and Return on Shareholders’ Investment

3
A higher market capIntense interest in Internet stocks underpinned a roller-coaster year in global equity markets. Japan was noexception. By contrast, the share prices of well-establishedcompanies remained stagnant in Japan throughout theterm.
But in this regard Ricoh was certainly an exception.Our share price reached a high of ¥2,525 ($24.51) duringthe year, compared with a peak of ¥1,634 in the previousfiscal term. Our year-end market capitalization improved78.0%, to ¥1,523 billion ($14,786 million). Our shareprice has since remained near its fiscal 2000 peak despitea general downturn in Japanese equities markets. Suchprolonged stability reflects the market’s confidence in ourbroad, high-value-added lineup of products and solutionsservices for the digitally networked office.
Royal Treatment Builds Loyal CustomersAt the start of this letter, we attributed much progress toour customer satisfaction commitment. Of course, this isnot a new concept for Ricoh. Throughout the 1990s, weovercame dark times precisely because we recognized thatcustomers have become more selective and expect thevery best.
But what exactly is our customer commitment
today? What’s the focus? First and foremost, our cus-tomers want the best possible user experience with ourproducts and services. They want value. Value doesn’tnecessarily mean the initial purchase cost, althoughwe’re already very competitive in that regard. Value isconsistently delivering the most user-friendly performancein ways that cut the total cost of ownership.
Value is also pursuing new ways to enrich the cus-tomer experience while doing something for the environ-ment. That is why, for example, we have altered ourproduct lineup in the past few years to concentrate almostentirely on computer-connective, multifunctional equip-ment. Equally important, more of our products are veryenergy-efficient and recyclable.
One of our most pleasing achievements in fiscal2000 was winning the 1999 Japan Quality Award, knowncolloquially in Japan as the JQA. This award is modeledafter America’s Malcolm Baldridge National QualityAward. The JQA essentially equates “quality” with “cus-tomer satisfaction.” Entering the JQA competition wasimportant in that it encouraged us to reform manage-ment and pursue customer satisfaction even moreintensely. This, in turn, motivated us to explore areas wehadn’t considered deeply before and to provide bettersolutions.
To Our Shareholders and Customers
1996 1997 1998 1999 2000
0
600
1200
1800
2400
3000
IVIIIIIIIVIIIIIIIVIIIIIIIVIIIIIIIVIIIIII
•Common Stock Price Range
( Yen)

4
Becoming a Document Solutions ProviderOne aspect of value that you will hear more of from Ricohis the concept of “solutions.” The most obvious exampleof this in the past couple of years was our introduction ofa full line of laser printers that complement our tradition-al strengths in multifunctional systems. These machinesfilled an important gap in our output equipment range.We call these “printing solutions.” It is a pleasure to notethat all our printers swiftly became best-sellers in Japanand launched us to market leadership in some key volume segments.
But solutions are obviously much more than hard-ware. While so many companies have adopted the termtoday, becoming a “document solutions provider” is actu-ally a natural progression for Ricoh.
“Solutions” combines the related emphases we’vehad over the past decade. In the early 1990s, we recog-nized the emergence of the digital office with our ImageProcessing Systems integration strategy. We then lookedsquarely at customer satisfaction because the digital officethreatened to make life much more complex. We knewthat only companies that could deliver efficiency and sim-plicity would be winners. We also paid great attention tothe environment, helping conserve valuable resourceswithout harming product performance.
Today, we have a thriving solutions business thatdraws on all these considerations to optimize or even cus-tomize the installation, operation, and maintenance ofcustomers’ office equipment and systems. As mentionedearlier, this approach to customer satisfaction is helpingdramatically reduce the total cost of ownership. We inviteyou to read the special feature later in this report. Itdetails some ways in which we are enhancing customersatisfaction by providing document solutions.
Revamping Our Management SystemJust after the close of fiscal 2000, we announced sweepingchanges to our management structure.
You may ask why we’re doing this since we havebeen so successful in recent years. The answer is quitesimple: We are in the age of speed. We must becomemuch more responsive to change to guarantee our placeas a winner in the 21st century. And it is more importantthan ever to build a more shareholder-oriented corporategovernance setup.
We cannot provide full details yet as we still havemuch to finalize. But basically we are separating RicohGroup management into executive and operating func-tions along the lines of U.S. companies. This means we
To Our Shareholders and Customers

printers, we will bring out more color models based onhigh-value-added proprietary technologies. Particularemphases will be color and mid- and high-volume monochrome machines.
In our solutions business, we will innovate moresupport options for specific customer requirements. Wewill also harness the Internet to solidify our solutions-oriented sales structure.
At the same time, we will revamp our supply chainstructure, including relationships with business partners,as part of a drive to maximize customer satisfaction andenhance efficiency.
We will pay greater attention to higher margins andlower costs. We aim to bolster net sales 3.7%, to ¥1,500billion, while boosting net income 14.5%, to ¥48 billion.
Stay with us in the year ahead as we become a morevaluable enterprise.
June 29, 2000
Sincerely,
Hiroshi HamadaChairman and Chief Executive Officer
Masamitsu SakuraiPresident and Chief Operating Officer
5
will have a smaller board devoted to Group financials,overall vision, and corporate value. Reporting to themwill be executive officers of Ricoh’s business divisions andsubsidiaries. These officers will have far more authorityand responsibility for their actions than before.
Page 56 of this annual report shows the new man-agement system, which our shareholders approved onJune 29, 2000.
The Best Is Yet to ComeFiscal 2001 should be an exciting year. There is much todo and much to gain. Job No. 1 will be to build momen-tum for our printer and solutions businesses, which weintend to make operational cores in the years ahead. In
To Our Shareholders and Customers

105/60 Ricoh has helped the world
work better and faster over the years by delivering
on the promise of the digital revolution. Now, we
take you to warp speed with the brand-new Aficio
1050. This revolutionary PC-networkable rocket-
ship shoots out a full 105 A4 copies per minute
from trays that can store a massive 7,550 sheets.
And it features an array of sorting and finishing
functions. Yet it does all this for biplane budget-
bound administrators.

7
Not so long ago, the office was a simple place. Most peoplehad narrowly defined roles, as did their equipment. Theirony is that document creation and dissemination wereoften complex, unproductive, and expensive.
Ricoh has done much to change all that with itsdrive toward computer-networkable, multifunctionaloffice machines at reasonable prices. We have made it easierfor people to do more with their documents—in far lesstime—so they can concentrate on new challenges.
We have innovated a full line of hardware, software,and support options that simplify complexity in today’soffice. In short, we deliver document solutions with appliance-like ease.
Our dedication to simplicity, efficiency, and cost-per-formance has helped us become a leader in the world’skey digital copier markets. And we are well on our way tobecoming a winner in a broad new category called multi-functional printers (MFPs)—machines that integrateprinting with functions like faxing and copying.
In the copier segment, we have won global recogni-tion for a host of multifunctional models that match allspeed requirements without breaking budgets. Speedsrange from 15 to 105 copies per minute (cpm). Two mod-els, the networkable Aficio 850 and Aficio 1050, can beused in tandem to generate an amazing 170 and 210cpm, respectively, at a much lower operating cost thanour competitors can provide.
We now offer printing solutions—an area in whichwe were long absent—thus topping off our output offer-ings for networked offices. We focus on mid- to high-vol-ume monochrome and color laser machines. Sales haveboomed. According to BNS Co., Ltd., a Japanese marketresearch organization, we shot from nowhere to the No. 1spot in the domestic market for color laser printers in thefirst three months of calendar 2000. We aim to capture upto 30% of the Japanese market in the segments we operatein by 2001. Together, our MFPs and other printers providecustomers with complete printing solutions.
Another important aspect of our document solutionsapproach is our recognition of the need to handle bothpaper and electronic information as seamlessly as possi-ble. We have commercialized several systems incorporat-ing our advanced image processing software. Upmarketefforts include REDMS, for Ricoh Enterprise DocumentManagement System, which allows companies to manageall equipment linked to their networks and transfer docu-ments between paper and electronic environments. As itsname suggests, RIDOC Cabinet lets you file and accessoriginally photocopied or faxed information from the PCdesktop.
We also support information management with digi-tal cameras and CD-Recordable and CD-ReWritable drivesand media, for which we helped formulate global stan-dards. In these and other ways, we are providing our customers with complete solutions to connectivity needs.
Meeting New Challenges with Innovative Solutions
Complete Connectivity Solutions
MaryBeth Masturzo, SalesManager of American CopyEquipment of Cleveland, Ohio,poses proudly with John Baron,President of that company. MaryBeth sold two Aficio 850s tothe Cleveland Indians, a MajorLeague Baseball team, whoseJacobs Field ballpark is famousaround the United States.

5600 A contract to supply Poste Italiene
S.p.A. with a massive 5,600 Aficio series digital
copier/printer/fax models and 500 G4 fax machines
underscores our drive toward becoming a document
solutions provider. By supplying full-fledged software
and hardware and administrative support, we’re
helping Poste Italiene ensure that an almost classic
line remains true—the postman always delivers.

9
Excellent imaging systems are pointless if they are unaf-fordable to own or operate. In recent years, Ricoh hasaccorded top priority to lowering the total cost of owner-ship of its office systems. We have made leaps and boundsin this regard because we manage all aspects of ourequipment—from hardware and software to supplies andmaintenance.
Our products are renowned worldwide for theirexcellent value for money. We are highly price-competi-tive but not “cheap.” We pride ourselves on delivering atotal package of unequaled performance and clear sav-ings to the customer over the entire life cycle of everymachine. We meet real needs with real solutions.
These considerations underscored the March 2000decision of Poste Italiene S.p.A., Italy’s post office, to order5,600 Aficio series digital copier/printer/fax models and500 high-end G4 laser fax machines. After installation, wewill maintain all this equipment under a full suppliesand maintenance contract. All the equipment will becomputer-connective and within a uniform operatingenvironment.
One of the keys to ensuring that the equipment net-work minimizes costs and maximizes efficiency for PosteItaliene is an innovative applications package that theRicoh European Digital Solution Center (REDSC) inDüsseldorf developed with a Canadian partner to trackand administer output from equipment everywhere on the
network. We established REDSC several years ago to devel-op printer drivers, network management systems, andother software. The package provides Poste Italiene withtailored document administration systems.
Elsewhere, Ricoh Group members run a host ofonline systems and training and support programsdesigned to maximize internal communications and cus-tomer responsiveness. In the United States, for example,Ricoh Corporation maintains an online dealer system,while Ricoh University has a PC laboratory that demon-strates how Ricoh LAN-based products enhance office effi-ciency. In Europe, we train business partners from aroundthe region in digital systems and networked productsthrough Linc, which stands for Learning Incorporated. Allour support operations are constantly upgrading theircapabilities to keep abreast of our advances in officeequipment technology.
We love to compete, and a central thrust of our doc-ument solutions drive is to meet open, de facto globalstandards. We consider it crucial that our products workwith those of other companies. This obviously providescustomers with peace of mind and is an important edgeover much of our competition because commonalitymeans familiarity and ease of use. By pursuing efficiency,cost-performance, an open architecture, and appliance-like ease, Ricoh is making document solutions a reality.
Meeting New Challenges with Innovative Solutions
Solutions in Action
Corrado Passera, President and CEO ofPoste Italiene S.p.A (seated, left), MirkoBianchi, President of Ricoh subsidiary NRGItalia S.p.A. (seated, right), and AttilioGecchele, President of Ricoh Italia S.p.A.(standing, second from right), signed afull-service contract in Milan in lateFebruary 2000. Also present at the ceremo-ny was Masami Takeiri (standing, secondfrom left), General Manager of ourInternational Marketing Group and a RicohManaging Director.

10
eCabinet This user-friendly and
friendly looking information appliance was the
brainchild of Ricoh Silicon Valley, which is at the
heart of our bid for premier position in the docu-
ment solutions race. eCabinet empowers people to
focus on the destination instead of the journey.
eCabinet This user-friendly and
friendly looking information appliance was the
brainchild of Ricoh Silicon Valley, which is at the
heart of our bid for premier position in the docu-
ment solutions race. eCabinet empowers people to
focus on the destination instead of the journey.

11
An almost huggable device rolled out by Ricoh SiliconValley, Inc., in late 1999 is a stunning embodiment ofRicoh’s commitment to bring appliance beauty to docu-ment solutions. It is called eCabinet. This “Network OfficeAppliance,” or NOA, connects with all types of officeequipment to automatically capture, file, and retrieve allelectronic and paper documents. It is the first system inthe world to give workgroups access to all their docu-ments through a single, centralized machine.
One of the key attractions of eCabinet and its futureNOA brethren is its complete stability as a documentmanagement solution. Users never have to open the boxor install additional software. It is pure plug-and-play.Because it is fully connectable and based on an openarchitecture, you can access it with a standard Web browser.
The prime target for eCabinet is medium-sized busi-nesses and corporate workgroups. These people typicallysuffer from overload as they try to analyze and managean excess of information. It is almost impossible to expectsuch workers to accomplish their core tasks if they have towaste countless hours keeping their information systemsin running order.
eCabinet combines the strengths of office networks,the Internet, and advanced thin-server technology todeliver appliance efficiency. The thin-server approachused in eCabinet is similar to the technology used in allRicoh equipment—performing single or specialized serv-er functions and running on a reliable, secure operatingarchitecture.
One of the many attractions of eCabinet is that itreduces the cost of storage while eliminating the tiresomeloss of key documents so common in office equipmentand media today. It does this by routing all documentsthrough it for capture and storage on a 30-gigabyte harddisc. And filing, searching, and retrieving documentsfrom eCabinet is totally intuitive. Users do not need spe-cial training. Neither do network administrators—instal-lation and configuration can be completed in justminutes.
Since its launch, eCabinet has won industry acco-lades as a forerunner of a whole new world of documentmanagement. According to Michael Maziarka of CAPVentures, a leading market research firm in Massa-chusetts, “Simplified, dedicated information applianceslike eCabinet will help the small business and corporateworkgroup with its document management operations.”Michael is director of CAP Ventures’ Dynamic ContentSoftware Strategies Consulting Service.
In the not-too-distant future, Ricoh will bring outmore models that take the network office appliance con-cept to greater heights, reconfirming its position as a doc-ument management solutions provider.
Meeting New Challenges with Innovative Solutions
eCabinetThe World’s First Network Office Appliance
Dr. Peter Hart (right), Chairman of Ricoh Silicon Valley,Inc., and Steve Weyl, CEO, play central roles in Ricoh’s
effort to make its network office appliance concept a reality.

12
Quality and the environment have long been part ofthe Ricoh mindset in develop-ing equipment and systems thatmake office work easier andcustomers happier. In fact, wehave long been at the forefrontin making these two areasmake true business sense.
Our prominence in qualitydates to 1975, when we becamethe first office equipment man-ufacturer to capture the DemingPrize. This award was namedafter the man who introducedthe concept of quality to Japan.It encapsulated the general thinking of the times—inter-cept and eliminate defects on the factory floor. Times havechanged, and now the Japan Quality Award (JQA) is thequest among Japanese companies and organizations. Itscriteria parallel those of the Malcolm Baldridge NationalQuality Award in the United States.
The JQA measures a host of factors that together cre-ate quality. It is bestowed on companies and organiza-tions that best incorporate quality management into allbusiness processes. It recognizes that true customer satis-faction covers all aspects of the customer experience—both hardware and the “softer” areas of user-friendlinessand attentive after-sales service. Two areas in particularmerited special commendation. The first is Ricoh’s com-prehensive designand production system, which hassupported efforts to
maximize customer satisfaction,halve development lead times,and slash total costs. The secondfactor is that Ricoh has completeda global production system thatdelivers uniform quality. Winningthis award was obviously verypleasing. But the greatest rewardwas that entering the competitionencouraged us to marshal compa-nywide resources —from designand production to sales and exter-nal and internal support—todrive even further ahead in cus-tomer satisfaction.
Over the years, Ricoh has tackled environmentalprotection in three stages—implementing responses toenvironmental regulations, reducing environmentalimpact, and environmental management. Our environ-mental protection pledges go far beyond compliance. Forinstance, we do not just cut or treat waste or pollution. Weavoid generating it in the first place. Such dedication hasled to many environmental awards worldwide.
We are now seeing our efforts bear real fruit at thebottom line, which can only motivate us to pursue moreefficient and profitable environmental initiatives. Ourenvironmental accounting system aids decision-makingby clarifying the costs and returns of environmental dedi-cation to our most immediate stakeholders—customers
and investors—as well as to thegeneral public. In other words, weensure that good corporate citizen-ship makes good business sense.
Meeting New Challenges with Innovative Solutions
Making Quality and theEnvironment Count
The 1999 Japan Quality Award recognizes our commitment to customer satisfaction because it trulymeasures quality from the customer’s perspective.
Our European supplier meetings aredesigned to build win-win relationshipswith our business partners.

13
Ricoh won the inaugural international Copier of the FutureAward at COMDEX ’99. Here, Masamitsu Sakurai, President andCOO of Ricoh (left), poses with Jean-Pierre Rosiers, Head of theEnergy Efficiency Policy Analysis Division of the InternationalEnergy Agency, after the presentation ceremony.
The digital copier line at RicohElectronics, Inc., maintains exactlythe same quality standards as allRicoh production operations aroundthe world.
In identifying the true costs of our efforts in mone-tary terms, we have learned to better balance the environ-mental impact of all areas of operations with theeconomic benefits of these activities.
A welcome result of such a focus is our ability tomeasurably reduce costs while helping the environment.For example, our Numazu plant saved almost half a mil-lion dollars by adopting a zero-waste strategy targetingboth the direct and indirect costs of waste treatment ordisposal.
Combined with our quality achievements, our envi-ronmental initiatives eventually count toward a bettercustomer experience.
Environmental Accounting for Fiscal 2000
Category
Business area
Upstream and downstream
Management
R&D
Community activity
Environmental impact
Other
Total
Environmental Costs
¥1.67
¥2.41
¥1.79
¥1.66
¥0.39
¥0.13
¥0.05
¥8.10
Description
Environmental facility depreciation and maintenance
Product recovery and recommercialization
Divisions implementing environmental measures; establishing and maintainingenvironmental management system
R&D to cut environmentalimpact
Preparing environmental reportsand advertising
Detoxifying soil; environmentalreconciliation
Other conservation
Financial Impact
¥0.96
¥5.09
¥0.70
¥0.58
¥0.20
¥0.05
¥2.04
¥0.07
¥9.69
Classifi-cation
a
b
c
a
b
a
b
b
—
Billions of yen
Costs Economic Impact Conservation Impact Total Environmental Impact Eco-Ratio
Description
Energy-saving and waste processingefficiency improvements
Contributions to value-added production
Restoration- and litigation-riskavoidance
Recycled product sales
Efficiency gains through educationand environmental managementsystem
Cost reductions through eco-packaging
R&D contributions to value-addedsales
Environmental publicity
—
Reduced EnvironmentalImpact (metric tons)
Carbon 11,317dioxide
Nitrogen 2.006oxides
Sulfuric 7.404oxides
Biochemical 1.726oxygen demand
Final 3,458waste
Reductions
4.1%
2.9%
33.7%
4.5%
34.6%
EE Value (metric tons/billions of yen)
1,397
0.248
0.914
0.213
426.9
(metric tons)
Carbon 262,053dioxide
Nitrogen 67.11oxides
Sulfuric 14.53oxides
Biochemical 36.61oxygen demand
Final 6,538waste
(billions of yen/metric ton)
0.00105
4.095
18.91
7.505
0.04203
Notes: This chart covers the parent company and 12 domestic and overseas production subsidiaries Definitions: EE = Eco-Efficiency Value (environmental impact reduction divided by total environmental costs)Eco-Ratio = Gross profit divided by total environmental impact
a. Substantial benefits (contributes to environment and sales)b. Projected benefits (anticipated added value and environmental benefits)c. Indirect benefits (avoids risks of pollution recovery and litigation)
Meeting New Challenges with Innovative Solutions
14
Ricoh’s PositionRicoh pioneered digital copiers and is the world’s No. 1manufacturer of this equipment.
Networking is essential to boost productivity intoday’s office environment. Ricoh has drawn on years ofdevelopment in digital technologies to serve the digitallynetworked office with multifunctional printers that com-bine copier and printing functions. The Company domi-nates the digital copier market in Japan. Overseas, it haslaunched an array of networked models. It has remainedtop in Europe and one of the leaders in the United Statesin its core business of digital monochrome copiers for thepast four years.
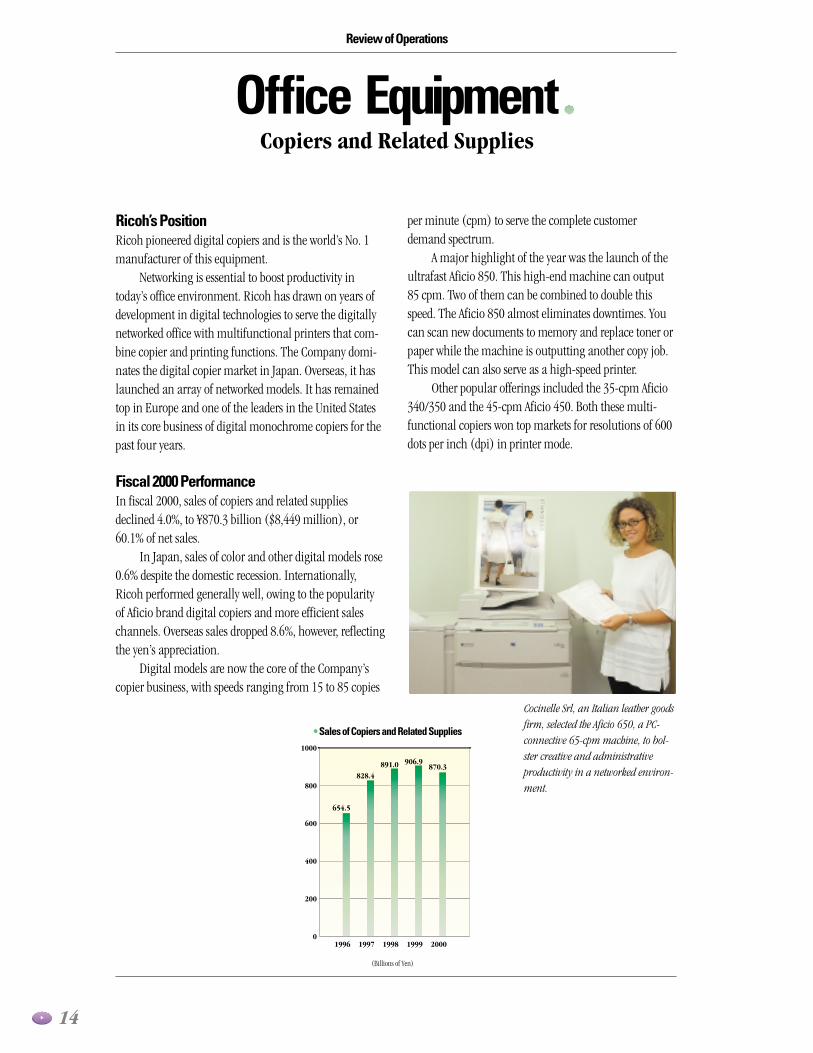
Fiscal 2000 PerformanceIn fiscal 2000, sales of copiers and related suppliesdeclined 4.0%, to ¥870.3 billion ($8,449 million), or60.1% of net sales.
In Japan, sales of color and other digital models rose0.6% despite the domestic recession. Internationally,Ricoh performed generally well, owing to the popularityof Aficio brand digital copiers and more efficient saleschannels. Overseas sales dropped 8.6%, however, reflectingthe yen’s appreciation.
Digital models are now the core of the Company’scopier business, with speeds ranging from 15 to 85 copies
per minute (cpm) to serve the complete customerdemand spectrum.
A major highlight of the year was the launch of theultrafast Aficio 850. This high-end machine can output85 cpm. Two of them can be combined to double thisspeed. The Aficio 850 almost eliminates downtimes. Youcan scan new documents to memory and replace toner orpaper while the machine is outputting another copy job.This model can also serve as a high-speed printer.
Other popular offerings included the 35-cpm Aficio340/350 and the 45-cpm Aficio 450. Both these multi-functional copiers won top markets for resolutions of 600dots per inch (dpi) in printer mode.
Review of Operations
Office EquipmentCopiers and Related Supplies
Cocinelle Srl, an Italian leather goodsfirm, selected the Aficio 650, a PC-connective 65-cpm machine, to bol-ster creative and administrativeproductivity in a networked environ-ment.
0
200
400
600
800
1000
1996
654.5
1997
828.4
1998
891.0
1999
906.9
2000
870.3
•Sales of Copiers and Related Supplies
(Billions of Yen)

15
Review of Operations
The University of Liège, Belgium,chose the flagship 85-cpm Aficio 850to process massive volumes of docu-ments quickly, efficiently, and cost-effectively.
Midland Realty International Ltd.in Hong Kong chose the highlyaffordable Aficio 180 to output prop-erty information for clerical andcustomer usage.
The City Government of Solingen,Germany, relies on the Aficio 270, a27-cpm machine that outputs at 600dpi and features a space-savingwingless design.
Hong Kong-based Satellite TelevisionRegion Asian Ltd. uses its Aficio 650,which is popular worldwide for itsmultifunctionality and printer andcopier resolutions of 600 and 400dpi, respectively.

16
Review of Operations
The 22-cpm Aficio 220 and 27-cpm Aficio 270 alsooutput at 600 dpi. Both models feature a space-savingwingless design.
In recent years, Ricoh has introduced many multi-functional color digital copiers, sales of which havesoared. Major sellers during fiscal 2000 were the compact,6-cpm Aficio Color 3000 and 4000 series and the 10-cpmAficio Color 6000 series. Our range includes network controller models that double as color printers.
In Japan, Ricoh is pursuing a document solutionsstrategy. Sales in this area are growing swiftly. For exam-ple, we combine digital copiers with software that helpsusers integrate their management of electronic andpaper-based files to enhance workflow. We are helpingstreamline the efficiency of office work with applicationsand multifunctional copiers that can scan documentsand distribute them automatically to networked personalcomputers.
We also make high-resolution wide-format copiersand stencil duplicators, many of which are digital andnetworkable.
Looking AheadRicoh has responded decisively to the emergence of thedigitally networked office by innovating ways to help userswork more efficiently and creatively. Our lineup in theyear ahead will include even faster machines—onemodel launched after the close of fiscal 2000 can outputup to 105 cpm. We will strengthen our capabilities in allproduct segments. And our range will include more high-resolution color copiers. Over the next few years, we will launch successive digital monochrome and colormachines and supporting software to provide more document solutions.
We now manufacture digital copiers in Japan, theUnited States, Europe, and China to match local demandtrends. We will further strengthen our global productioncapabilities to support our policy of producing the rightequipment in the right place and maintaining local supplies bases.
W S Atkins, a British firm that serves a global client base with anarray of consultancy, management, and technical services, takesfull advantage of the Aficio Color 4106, which can output up to sixcolor copies per minute, making it perfect for duplicating proposals.
The Gold Coast City Council in Queensland, Australia, uses 42 networked Aficio 340 machines that all draw on our powerful PC-based Aficio Manager software to track and control print runs.

17
Review of Operations
Office EquipmentCommunications and Information Systems
Ricoh’s PositionRicoh’s activities in this area encompass printers, scan-ners, CD-Recordable/CD-ReWritable (CD-R/RW) drivesand media, fax machines, personal computers, and software and services.
As in other operations, customers in this categorydemand solutions to help them use theirhardware more efficiently. Ricoh opti-mizes its equipment and systems tomatch networked office environments.We are strengthening our proprietarydocument solutions capabilities, cen-tered on networkable printers incorporat-ing our advanced digital andimage-processing technologies.
0
80
160
240
320
400
1996
287.4
1997
308.3
1998
322.4
1999
344.0
2000
382.8
•Sales of Communications and Information Systems
(Billions of Yen)
Franco Maria Ricci SpA, an international publishing compa-ny based in Milan, Italy, chose the Aficio Color AP305, whichcan output five color or 17 monochrome A4 pages per minuteat 600 dpi, for its quality and accuracy.

18
Fiscal 2000 PerformanceSales in this category climbed 11.3%, to ¥382.8 billion($3,716 million), and represented 26.5% of net sales.
Printer operations in Japan drove this growth andalso boosted sales from our solutions business.
PrintersRicoh makes color and medium- and high-speed mono-chrome laser printers for office networks. In the less thantwo years since concentrating on this business area inJapan, we have built a solid range and sales structure.This effort has been massively successful. In the first quar-ter of calendar 2000, we seized the No. 1 spot in Japan inthe color laser printer category.
One particularly popular new model in the yearunder review was the IPSiO Color 5000 series. Thismachine can output six color or 24 monochrome A4pages per minute at 600 dpi and can also print out A3-sized documents. Another strong seller was the compactand affordable IPSiO Color 2100 series. This A4 modeloutputs four color or 16 monochrome pages per minute.
During the year, we introduced the IPSiO NX900 andIPSiO NX800. These monochrome laser printers outputup to 45 and 28 pages per minute, respectively. They alsoperform several key finishing functions, such as staplingand punching.
Most of these models are also sold overseas under theAficio brand.
Review of Operations
Pelikan Hardcopy International AG, an Italian subsidiary of Europe’s leading maker of inks forinkjet printers, values the Aficio AP204 highly for itsspeed, precision, and durability. This A4 model out-puts four color or 16 monochrome pages perminute.
Modis Professional Services, a large temporary staffing agency inJacksonville, North Carolina, bought the Aficio AP4500, a mono-chrome laser printer that outputs up to 45 pages per minute andperforms key finishing functions like stapling and punching.
The Aficio AP2700, a 27-page-per-minute printer, is a favorite atFlorida Windstorm Underwriting Association, a major insurer inJacksonville, North Carolina, that uses only Ricoh-made officeequipment.

19
Review of Operations
Personal Computers and SoftwareIn Japan, sales of personal computers contributed signifi-cantly to revenues. Ricoh has reinforced marketing in thisarea as part of its document solutions approach. TheRicoh Group is now the world’s largest seller of IBM PCservers and clients. IBM Corporation named us its No. 1partner for 2000.
Ricoh enjoyed steady growth in packages of docu-ment solutions software and image processing equipmentthat allow customers to seamlessly manage electronic andpaper-based information. In software, we continued to dowell with Ricoh Solution Group Office, based on LotusNotes groupware that we originally modified anddeployed to streamline internal operations.
CD-R/RW Drives and MediaRicoh focuses heavily on CD-related technologies for stor-ing multimedia data. We helped formulate the globalstandards for CD-R and CD-RW media and are a majorplayer worldwide in both areas.
In the year under review, we scored a hit with theMP9060A drive, which can handle CD-ROM, CD-R, CD-RW, and DVD-ROM discs.
Communications SystemsNetworkable and multifunctional fax machines sold wellin fiscal 2000.
Particularly popular overseas were the FAX2000L and the Aficio FAX5000L. The former is a compact, plain-paper model that can be upgraded to perform printing, scanning, and PC faxing. The latter is a versatile,high-volume machine that can handle LAN printing, faxing, scanning, and Internet or G4 mode faxing.
In Japan, we further reinforced our line of Super G3machines, which can transmit an A4 page over regulartelephone lines in just three seconds. We also introducedmodels that can fax through the Internet to streamlineefficiency and lower communications charges.
Looking AheadIn fiscal 2001, we plan to expand our range of Aficiobrand networkable printers. We will also bolster our rangeto include 600-dpi color printers and high-speed mono-chrome models. At the same time, we will expand oursoftware and support capabilities to deliver more innova-tive document solutions.
In CD-related businesses, we will embrace DVD tech-nologies to introduce a whole new range of drives andmedia.
Baxter N.V.-S. A. of Belgium takes full advantage of the FAX2900L,a compact, plain-paper machine that allows PC workgroups to faxfrom the desktop.
Ingram Micro Inc. of Santa Ana, California, man-ages its data storage needs easily with the MP9060Adrive, which handles CD-ROM, CD-R, CD-RW, andDVD-ROM discs.

20
Review of Operations
Other Businesses
Ricoh’s PositionThis category draws on and complements Ricoh’s broadtechnological resources. Here, we make electronic devices,photographic equipment, and unit models, as well asother computer parts and components. We also provideleasing and logistics services to support customers’ opera-tions.
Fiscal 2000 PerformanceSales of other businesses jumped 10.9%, to ¥194.1 billion($1,884 million), reflecting the steady progress of elec-tronic devices operations.
Electronic DevicesRicoh develops and manufactures large-scale integratedcircuits (LSIs), which are crucial to innovating high-resolution copiers and printers.
Our semiconductor operations supply high-perfor-mance integrated circuits (ICs) and LSIs to customersaround the world. For example, we make power and bat-tery ICs for cell phones and other mobile equipment, aswell as real-time clock ICs. All these devices draw onRicoh’s acclaimed complementary metal oxide semicon-ductor technology. We boast a massive share of the globalmarket for digital LSIs for CD-R/RW drive and notebook
computer controllers. Our swift responsiveness to emerg-ing trends in information and portable communicationsdemand has helped us capture top shares in various marketniches, and thus grow faster than the industry average.
Photographic EquipmentIn this category, we concentrate on digital cameras. Wepioneered such cameras, which have tremendous poten-tial as input devices. During the year, we introduced theRICOH RDC-5000 series. These user-friendly models featurea 2.3-megapixel resolution and a 3X optical zoom lens.
Looking AheadRicoh aims to further expand sales of devices by developingmore components for core business equipment and systems,
as well as LSIs for information andmobile communications equipment.
We will position our digital camerasas “image capturing devices” to reflecttheir growing importance as inputtools within our solutions strategy.
The RICOH RDC-5300 features a 2.3-megapixel resolution and a 3X optical zoom lens and makes digital photography child's play.
We recently introduced theRICOH RDC-7, which incorpo-rates a 3.34-megapixelcharge-coupled device in anultrathin, stylish body.
The RL5E821 CD-R/RW controller chipis one of countless Ricoh-developedapplication-specific standard productsand power management ICs for deviceslike CD-R/RW drives, mobile telephones,and personal digital assistants. 0
40
80
120
160
200
1996
171.2
1997
179.4
1998
189.9
1999
175.1
2000
194.1
•Sales of Other Businesses
(Billions of Yen)

Management’s Discussion and Analysis of Fiscal 2000 Results 22
Selected Financial Data 26
Consolidated Balance Sheets 28
Consolidated Statements of Income 30
Consolidated Statements of Shareholders’ Investment 31
Consolidated Statements of Cash Flows 32
Notes to Consolidated Financial Statements 33
Report of Independent Public Accountants 52
Senior Management 53
Ricoh’s Global Network 54
Corporate Data 56
21
Financial Section
22
Management’s Discussion and Analysis of Fiscal 2000 Results
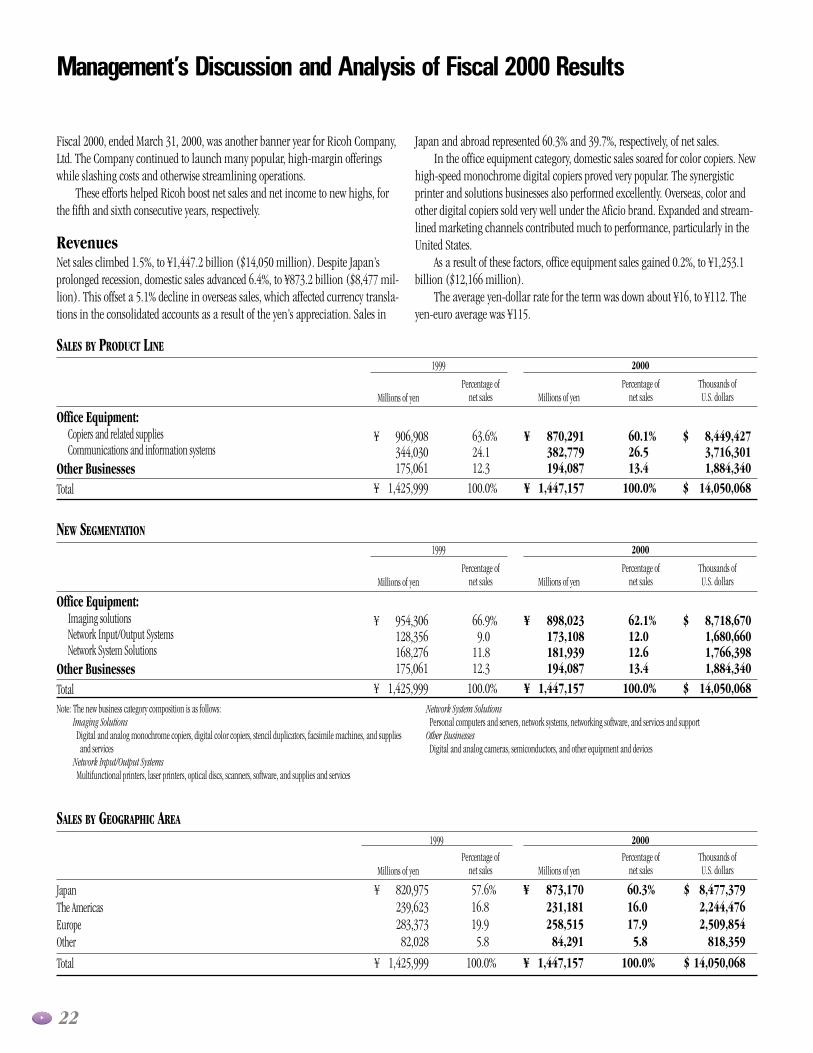
Japan and abroad represented 60.3% and 39.7%, respectively, of net sales.In the office equipment category, domestic sales soared for color copiers. New
high-speed monochrome digital copiers proved very popular. The synergisticprinter and solutions businesses also performed excellently. Overseas, color andother digital copiers sold very well under the Aficio brand. Expanded and stream-lined marketing channels contributed much to performance, particularly in theUnited States.
As a result of these factors, office equipment sales gained 0.2%, to ¥1,253.1billion ($12,166 million).
The average yen-dollar rate for the term was down about ¥16, to ¥112. Theyen-euro average was ¥115.
Fiscal 2000, ended March 31, 2000, was another banner year for Ricoh Company,Ltd. The Company continued to launch many popular, high-margin offeringswhile slashing costs and otherwise streamlining operations.
These efforts helped Ricoh boost net sales and net income to new highs, forthe fifth and sixth consecutive years, respectively.
RevenuesNet sales climbed 1.5%, to ¥1,447.2 billion ($14,050 million). Despite Japan’sprolonged recession, domestic sales advanced 6.4%, to ¥873.2 billion ($8,477 mil-lion). This offset a 5.1% decline in overseas sales, which affected currency transla-tions in the consolidated accounts as a result of the yen’s appreciation. Sales in
JapanThe AmericasEuropeOther
Total
SALES BY PRODUCT LINE
Office Equipment:Copiers and related suppliesCommunications and information systems
Other BusinessesTotal
SALES BY GEOGRAPHIC AREA
1999
Thousands ofU.S. dollars
Percentage ofnet salesMillions of yen
Percentage of net salesMillions of yen
2000
¥ 906,908344,030175,061
¥ 1,425,999
63.6%24.112.3
100.0%
¥ 870,291382,779194,087
¥ 1,447,157
60.1%26.513.4
100.0%
$ 8,449,4273,716,3011,884,340
$ 14,050,068
NEW SEGMENTATION
Office Equipment:Imaging solutionsNetwork Input/Output SystemsNetwork System Solutions
Other BusinessesTotal
1999
Thousands ofU.S. dollars
Percentage ofnet salesMillions of yen
Percentage of net salesMillions of yen
2000
¥ 954,306128,356168,276175,061
¥ 1,425,999
66.9%9.0
11.812.3
100.0%
¥ 898,023173,108181,939194,087
¥ 1,447,157
62.1%12.012.613.4
100.0%
$ 8,718,6701,680,6601,766,3981,884,340
$ 14,050,068
1999
Thousands ofU.S. dollars
Percentage ofnet salesMillions of yen
Percentage of net salesMillions of yen
2000
¥ 820,975239,623283,37382,028
¥ 1,425,999
57.6%16.819.95.8
100.0%
¥ 873,170231,181258,51584,291
¥ 1,447,157
60.3%16.017.95.8
100.0%
$ 8,477,3792,244,4762,509,854
818,359
$ 14,050,068
Note: The new business category composition is as follows:Imaging SolutionsDigital and analog monochrome copiers, digital color copiers, stencil duplicators, facsimile machines, and suppliesand services
Network Input/Output SystemsMultifunctional printers, laser printers, optical discs, scanners, software, and supplies and services
Network System SolutionsPersonal computers and servers, network systems, networking software, and services and support
Other BusinessesDigital and analog cameras, semiconductors, and other equipment and devices

23
Operating IncomeOperating income jumped 20.9%, to ¥88.9 billion ($863 million). The gross profit ratio was up 0.2 percentage point, to 40.1%. This improvement was due pri-marily to increased shipments of high-margin digital office equipment.
Selling, general and administrative expenses declined 0.8%, to ¥491.1 billion($4,768 million). This stemmed from the yen’s rise and ongoing cost-cutting programs.
Research and development costs were down 0.4%, to ¥66.5 billion ($646 mil-lion). These costs accounted for 4.6% of net sales, down 0.1 percentage point.
Income before Income TaxesIncome before income taxes, minority interests and equity in earnings of affiliatesrose 32.7%, to ¥70.4 billion ($683 million). Net interest expense and interest anddividend income declined 27.0%, to ¥4.2 billion ($41 million). Net foreign ex-change loss rocketed 71.4%, to ¥6.0 billion ($58 million). Other expenses includ-ed divestments of fixed assets.
Net IncomeNet income soared 36.8%, to ¥41.9 billion ($407 million).
Total taxes were up 15.5%, to ¥28.4 billion ($275 million). The effective taxrate for the term dropped 6.0 percentage points, to 40.0%, mainly because of a de-cline in corporate tax rates.
The basic and diluted earnings per share of common stock were ¥60.61($0.59) and ¥56.06 ($0.54), respectively. These figures were 36.7% and 36.9%higher, respectively, than in fiscal 1999.
Parent company cash dividends per share of common stock were again¥11.00 ($0.11), in keeping with an ongoing management commitment to stableshareholder returns.
Segment Information
SALES BY PRODUCT LINE
1. Office Equipment
Copiers and Related SuppliesSegment sales declined 4.0%, to ¥870.3 billion ($8,449 million). This was becauseoverseas sales dropped 8.6% in line with the appreciation of the yen, overshadow-ing a rise in domestic sales. This area accounted for 60.1% of net sales.
Communications and Information SystemsSales in this category climbed 11.3%, to ¥382.8 billion ($3,716 million). Thisstemmed from soaring sales in domestic printer operations and growth in theCompany’s solutions business. This segment accounted for 26.5% of net sales.
New Business SegmentationThe Company has summarized results under the following new business segmentsto aid understanding of its new strategic direction as a provider of document solutions.
Imaging SolutionsSegment sales declined 5.9%, to ¥898.0 billion ($8,719 million). This was despite
double-digit gains in Japan and abroad in digital color and monochrome copiers,and reflected slower sales of analog machines and the yen’s appreciation.
Network Input/Output SystemsHere, sales soared 34.9%, to ¥173.1 billion ($1,681 million), largely because ofsolid sales of multifunctional printers and laser printers.
The Company focused on marketing color printers in Japan and pushedahead with efforts to boost printer and solutions sales internationally.
Network System SolutionsSales in this segment climbed 8.1%, to ¥181.9 billion ($1,766 million). This owedto solid showings by personal computers, networking peripherals, and software.
2. Other BusinessesIn this category, sales advanced 10.9%, to ¥194.1 billion ($1,884 million), or13.4% of net sales. This rise stemmed from the Company’s move to focus its semi-conductor operations on analog devices, where it enjoys a strong competitive edge.
SALES BY GEOGRAPHIC AREAJapan accounted for 60.3% of net sales. The Americas and Europe accounted for16.0% and 17.9%, respectively, and other areas 5.8%.
1. JapanDomestic sales increased 6.4%, to ¥873.2 billion ($8,477 million). This was pri-marily because of solid sales of printers and other network peripherals, whichmore than compensated for plunging analog copier sales.
2. The AmericasHere, sales were down 3.5%, to ¥231.2 billion ($2,244 million). But U.S. dollar-based sales actually gained 10.7% on the strength of solid showings bymonochrome and color digital copiers and multifunctional printers.
3. EuropeRegional sales dropped 8.8%, to ¥258.5 billion ($2,510 million), but rose 10.4% inlocal-currency terms. As in the Americas, the growth drivers were digital copiersand multifunctional printers.
4. Other AreasSales in other areas were up 2.8%, to ¥84.3 billion ($818 million). In local cur-rencies, the improvement was 15.3%. Economic recoveries in most Asian marketscontributed to these gains.
FINANCIAL POSITIONAt the end of fiscal 2000, total assets stood at ¥1,543.3 billion ($14,984 million),down 5.2%. Interest-bearing debt plunged 21.2%, to ¥515.1 billion ($5,001 million).
CASH FLOWSAt year-end, net cash provided by operating activities stood at ¥135.6 billion($1,317 million), up 27.1% from the close of fiscal 1999, on the strength of higher

24
2006 andthereafter
¥ 6,40424,000
—
¥ —
LONG-TERM INDEBTEDNESS(Excluding Capital Lease Obligations)
Convertible Bonds Bonds Medium-Term Notes Loans
Total
Expected maturity date
Millions of yen
2006 and thereafter
¥ —50,000
72915,239
¥ 65,968
2005
¥ —10,000
—17,994
¥ 27,994
2004
¥ —15,000
—25,287
¥ 40,287
2003
¥ 36,099—
2,15911,185
¥ 49,443
2002
¥ 34,70410,0005,205
71,520
¥ 121,429
2001
¥ 2,990—
4,08648,946
¥ 56,022
Total
¥ 73,79385,00012,179
190,171
¥ 361,143
Average pay rate
0.90 %1.883.691.51
INTEREST RATE SWAPS
¥ 278,08075,5001,000
US$ 50
Expected maturity date
Millions of yen
2005
¥ 67,60023,500
—
¥ 2,123
Type of swap Notional amounts
(Millions) 2004
¥ 66,91117,000
—
¥ —
2003
¥ 110,5951,000
—
¥ 1,062
2002
¥ 6,5706,0001,000
¥ 1,062
2001
¥ 20,0004,000
—
¥ 1,062
Total
¥ 278,08075,5001,000
¥ 5,309
Average pay rate
1.00 %0.220.15
6.55
Receive floating/Pay fixedReceive fixed/Pay floatingReceive floating/Pay floating
Receive floating/Pay fixed
Average receive rate
0.22 %2.400.16
7.21
2006 and thereafter
$ 62,175233,010
—
$ —
LONG-TERM INDEBTEDNESS(Excluding Capital Lease Obligations)
Convertible Bonds Bonds Medium-Term NotesLoans
Total
Expected maturity date
Thousands of U.S. dollars
2006 and thereafter
$ —485,438
7,078147,951
$ 640,467
2005
$ —97,087
—174,699
$ 271,786
2004
$ —145,631
—245,505
$ 391,136
2003
$ 350,476—
20,961108,592
$ 480,029
2002
$ 336,93297,08750,534
694,369
$1,178,922
2001
$ 29,029—
39,670475,204
$ 543,903
Total
$ 716,437825,243118,243
1,846,320
$3,506,243
Average pay rate
0.90 %1.883.691.51
INTEREST RATE SWAPS
¥ 278,08075,5001,000
US$ 50
Expected maturity date
Thousands of U.S. dollars
2005
$ 656,311228,155
—
$ 20,612
Type of swap Notional amounts
(Millions) 2004
$ 649,621165,049
—
$ —
2003
$1,073,7389,709
—
$ 10,311
2002
$ 63,78658,2529,709
$ 10,311
2001
$ 194,17538,835
—
$ 10,311
Total
$2,699,806733,010
9,709
$ 51,545
Average pay rate
1.00 %0.220.15
6.55
Receive floating/Pay fixedReceive fixed/Pay floatingReceive floating/Pay floating
Receive floating/Pay fixed
Average receive rate
0.22 %2.400.16
7.21

25
net income and more efficient asset management.Net cash used in investing activities was ¥28.5 billion ($277 million), a 68.1%
decline. We allocated most of this cash to plant and equipment expenditures.The free cash flow generated by operating and investing activities totaled
¥107.2 billion ($1,040 million), a sixfold increase. This allowed us to reimbursecorporate bonds and debts and maintain dividends.
Our cash flow for the year included additional deposits of ¥50.0 billion ($485million) based on corporate bond underwriting contracts. Financing activities re-flected the repayment of corporate bonds for this amount.
Therefore, cash and cash equivalents at the close of fiscal 2000 were ¥111.8billion ($1,086 million), down ¥18.8 billion or 14.4%. This amount included aforeign exchange fluctuation effect of ¥4.7 billion ($46 million).
Capital ExpendituresAdditions to property, plant and equipment fell 17.2%, to ¥58.4 billion ($567 mil-lion). These investments were mainly in dies and other regular production areas.
Key Financial RatiosWe have provided the following ratios to facilitate analysis of the Company’s oper-ations for fiscal 1998, 1999, and 2000:
Fiscal 1998 Fiscal 1999 Fiscal 2000Return on sales 2.1% 2.1% 2.9%Return on shareholders’ investment 6.7% 6.4% 8.1%Current ratio 1.04 1.27 1.32Debt-to-equity ratio(interest-bearing debt to shareholders’ investment) 1.42 1.34 0.95Interest coverage 7.8 6.8 9.3
US$/¥EUR/¥
FOREIGN EXCHANGE FORWARD CONTRACTS
Contract amountsContract amounts
Thousands ofU.S. dollarsMillions of yen
Average contractualrates
105.02107.83
¥ 37,49410,621
$ 364,019103,117
Market Risk
MARKET RISK EXPOSURERicoh is exposed to market risks primarily from changes in foreign currency ex-change rates and interest rates, which affect outstanding debt and certain assets andliabilities denominated in foreign currencies. In order to manage these risks thatarise in the normal course of business, Ricoh enters into hedging transactions pur-suant to its policies and procedures covering such areas as counterparty exposureand hedging practices. Ricoh does not hold or issue derivative financial instrumentsfor trading purposes, or to generate income.
Ricoh regularly assesses these market risks based on the policies and proce-dures established to protect against adverse effects of these risks and other poten-tial exposures, primarily by reference to the market value of the financialinstruments. As a result of the latest assessment, Ricoh does not anticipate anymaterial losses in these areas.
FOREIGN CURRENCY RISK In the ordinary course of business, Ricoh uses foreign exchange forward contractsto manage the effects of foreign currency exchange risk on monetary assets and liabilities denominated in foreign currencies. The contracts with respect to the
INTEREST RATE RISKIn the ordinary course of business, Ricoh enters into interest rate swap agree-ments to reduce interest rate risk and to modify the interest rate characteristics ofits outstanding debt. These agreements primarily involve the exchange of fixedand floating rate interest payments over the life of the agreement without the ex-change of the underlying principal amounts.
The table on page 23 provides information about Ricoh’s major derivativeand other financial instruments that are sensitive to changes in interest rates, in-cluding interest rate swaps and debt obligations. For debt obligations, the tablepresents principal cash flows by expected maturity date and related weighted aver-age interest rates. For interest rate swaps, the table presents notional amounts byexpected maturity date and weighted average interest rates. Notional amounts aregenerally used to calculate the contractual payments to be exchanged under thecontract.
CREDIT RISK Credit risk arising from the nonperformance of counterparties to meet the termsof financial instrument contracts is generally limited to the amounts by whichthe counterparties’ obligations exceed the obligations of Ricoh. It is Ricoh’s policyto only enter into financial instrument contracts with diverse high credit rated fi-nancial institutions to minimize credit risk concentration. Therefore, Ricoh doesnot expect to incur material credit losses on its financial instruments.
Year 2000 The Year 2000 problem did not harm Ricoh’s operations. Related preparatorycosts did not materially affect the performances of the parent company orits consolidated subsidianes and affiliates.
Forward-Looking and Cautionary Statements Certain statements contained in this annual report may constitute forward-look-ing statements, which involve a number of risks, uncertainties and other factorsthat would cause actual results to differ materially from those projected or im-plied elsewhere in this annual report.
operating activities generally have maturities of less than six months, while thecontracts with respect to the financing activities have the same maturities as underlying assets and liabilities.
The table below provides information about Ricoh’s major derivative finan-cial instruments that are sensitive to foreign currency exchange rates, except forthe contracts with respect to the financial activities. For foreign exchange forwardcontracts, the table presents the notional amounts and weighted average ex-change rates. These notional amounts generally are used to calculate the contrac-tual payments to be exchanged under the contracts.

26
For the Year:Net salesCost of salesSelling, general and administrative expensesIncome before income taxes, minority interests and equity in earnings of affiliatesProvision for income taxesNet income
Capital expendituresDepreciation and amortization
Per Share Data (in yen and dollars):Net income:
Basic Diluted
Cash dividends, applicable to the year
At Year-End:Total assetsLong-term indebtednessShareholders’ investmentWorking capital
Return on salesReturn on shareholders’ investment
Common Stock Price Range (in yen and dollars):HighLow
19921991
¥ 1,017,417677,674328,52210,86913,0102,041
75,05756,811
¥ 3.133.13
10.00
¥ 1,235,779309,315357,79586,874
0.2 %0.6
¥ 820455
¥ 1,003,263645,875322,40238,36527,02513,557
70,77748,868
¥ 20.9020.4810.00
¥ 1,198,717246,853362,988114,809
1.4 %3.8
¥ 1,340671
Selected Financial Data
Ricoh Company, Ltd. and Consolidated SubsidiariesFor the Years Ended March 31

27
$14,050,0688,418,9134,767,844
683,427275,369407,068
566,563601,417
$ 0.590.540.11
$14,983,6902,989,9225,257,3401,820,903
——
$ 24.5110.47
200020001999199819971996199519941993
¥ 1,447,157867,148491,08870,39328,36341,928
58,35661,946
¥ 60.6156.0611.00
¥ 1,543,320307,962541,506187,553
2.9 %8.1
¥ 2,5251,078
¥ 968,318605,958326,35226,16718,2339,520
44,92849,155
¥ 14.6114.4710.00
¥ 1,238,275337,592349,945116,108
1.0 %2.7
¥ 849561
Thousands ofU.S. dollars
¥ 1,021,915657,750327,39717,78414,7165,015
46,74755,846
¥ 7.707.70
10.00
¥ 1,228,959303,599351,60277,318
0.5 %1.4
¥ 728402
¥ 1,403,348838,440475,20168,42840,21030,131
94,11761,971
¥ 44.9741.3511.00
¥ 1,660,496295,536475,00531,681
2.1 %6.7
¥ 1,9001,270
¥ 1,316,072772,238460,47166,90539,86428,922
78,66651,000
¥ 44.1638.9512.00
¥ 1,644,896386,918422,92377,527
2.2 %7.0
¥ 1,5301,050
¥ 1,113,030683,406374,24651,02028,25121,869
48,82846,430
¥ 33.5531.2110.00
¥ 1,508,519411,023401,471139,163
2.0 %5.6
¥ 1,230650
¥ 1,020,296628,071339,89141,67424,93118,593
45,43744,960
¥ 28.5426.4310.00
¥ 1,320,617386,535377,840142,021
1.8 %5.1
¥ 1,020726
¥ 1,425,999857,423495,02953,05424,55530,655
70,46967,456
¥ 44.3340.9411.00
¥ 1,628,017344,580487,459176,161
2.1 %6.4
¥ 1,634969
Millions of yen

28
Current Assets:Cash and cash equivalentsTime depositsMarketable securitiesTrade receivables—
NotesAccountsLess—Allowance for doubtful receivables
Inventories—Finished goodsWork in process and raw materials
Deferred income taxesCash deposits for assignment of debt securities
Total current assets
Plant and Equipment, at Cost:LandBuildingsMachinery and equipmentConstruction in progress
Less—Accumulated depreciation
Investments and Other Assets:Finance receivablesInvestment securitiesInvestments in and advances to affiliatesLease deposits and other
2000
Thousands ofU.S. dollars
$ 1,085,806165,786
1,250,175
846,1652,580,660(113,757)
954,485435,427365,612
—
7,570,359
420,2621,827,8545,580,039
30,942
7,859,097(5,494,883)
2,364,214
3,620,010279,466432,058717,583
5,049,117
$ 14,983,690
2000Millions of yen
¥ 130,65516,47798,246
77,784283,237(13,887)
112,50549,79330,34752,210
837,367
44,445188,408574,468
3,613
810,934(546,017)
264,917
350,38445,00246,15284,195
525,733
¥ 1,628,017
1999
Consolidated Balance Sheets
ASSETS
Ricoh Company, Ltd. and Consolidated SubsidiariesMarch 31, 1999 and 2000
The accompanying notes to consolidated financial statements are an integral part of these balance sheets.
¥ 111,83817,076
128,768
87,155265,808(11,717)
98,31244,84937,658
—
779,747
43,287188,269574,744
3,187
809,487(565,973)
243,514
372,86128,78544,50273,911
520,059
¥ 1,543,320

29
2000
Thousands ofU.S. dollars
2000Millions of yen
1999
¥ 214,29094,426
43,564205,59514,86988,462
661,206
344,58082,28314,831
441,694
37,658
102,849154,05514,271
238,592(22,308)
487,459
¥ 1,628,017
$ 1,457,097554,184
440,8352,094,117
342,864860,359
5,749,456
2,989,922367,350169,544
3,526,816
450,078
1,001,0871,498,194
147,3592,640,816
(30,116)
5,257,340
$ 14,983,690
¥ 150,08157,081
45,406215,69435,31588,617
592,194
307,96237,83717,463
363,262
46,358
103,112154,31415,178
272,004(3,102)
541,506
¥ 1,543,320
Current Liabilities:Short-term borrowingsCurrent maturities of long-term indebtednessTrade payables—
NotesAccounts
Accrued income taxesAccrued expenses and other
Total current liabilities
Long-Term Liabilities:Long-term indebtednessAccrued pension and severance costsDeferred income taxes
Minority Interests
Commitments and Contingent Liabilities (Note 15)
Shareholders’ Investment:Common stock, par value ¥50 per share:
Authorized—1,000,000,000 sharesIssued and outstanding—691,598,631 shares in 1999 and 692,082,959 shares in 2000
Additional paid-in capitalLegal reserveRetained earningsAccumulated other comprehensive income (loss)
Total shareholders’ investment
LIABILITIES AND SHAREHOLDERS’ INVESTMENT

30
Net SalesCost of Sales
Gross profit
Selling, General and Administrative ExpensesOperating income
Other (Income) Expenses:Interest and dividend incomeInterest expenseForeign currency exchange loss, netOther, net
Total
Income before Income Taxes, Minority Interests and Equity in Earnings of Affiliates
Provision for Income Taxes:CurrentDeferred
Total
Income before Minority Interests and Equity in Earnings of Affiliates
Minority InterestsEquity in Earnings of AffiliatesNet Income
Per Share of Common Stock:Net income:
Basic Diluted
Cash dividends, applicable to the year
Per American Depositary Share, EachRepresenting 5 Shares of Common Stock:
Net income: Basic Diluted
Cash dividends, applicable to the year
1998
Ricoh Company, Ltd. and Consolidated SubsidiariesFor the Years Ended March 31, 1998, 1999 and 2000
2000
Thousands ofU.S. dollars
2000Millions of yen
1999
¥ 1,447,157
867,148
580,009
491,088
88,921
(5,997)10,1816,0048,340
18,528
70,393
46,416(18,053)
28,363
42,0302,5992,497
¥ 41,928
¥ 60.6156.06
¥ 11.00
¥ 303.05280.30
¥ 55.00
$ 14,050,068
8,418,913
5,631,155
4,767,844
863,311
(58,223)98,84558,29180,971
179,884
683,427
450,641(175,272)
275,369
408,05825,23324,243
$ 407,068
$ 0.590.54
$ 0.11
$ 2.942.72
$ 0.53
Consolidated Statements of Income
¥ 1,425,999
857,423
568,576
495,029
73,547
(5,933)11,6613,503
11,262
20,493
53,054
28,052(3,497)
24,555
28,4991,9394,095
¥ 30,655
¥ 44.3340.94
¥ 11.00
¥ 221.65204.70
¥ 55.00
¥ 1,403,348
838,440
564,908
475,201
89,707
(5,931)12,2703,695
11,245
21,279
68,428
42,108(1,898)
40,210
28,2182,1544,067
¥ 30,131
¥ 44.9741.35
¥ 11.00
¥ 224.85206.75
¥ 55.00
The accompanying notes to consolidated financial statements are an integral part of these statements.
U.S. dollarsYen

31
Common Stock:Beginning balance
Conversion of convertible bonds; 34,170,930 shares in 1998, 52,209 shares in 1999, and 484,328 shares in 2000
Ending balance
Additional Paid-in Capital:Beginning balance
Conversion of convertible bonds
Ending balance
Legal Reserve:Beginning balance
Transfer from retained earnings
Ending balance
Retained Earnings:Beginning balance
Net incomeCash dividends paidTransfer to legal reserve
Ending balance
Accumulated Other Comprehensive Income (Loss):Beginning balance
Unrealized holding gains (losses) on available-for-sale securities, net of reclassification adjustment
Foreign currency translation adjustmentsMinimum pension liability adjustments
Ending balance
Comprehensive Income (Loss):Net income for the yearOther comprehensive income (loss) for the year, net of tax
Total comprehensive income for the year
2000
Thousands ofU.S. dollarsMillions of yen
$ 998,534
2,553
$ 1,001,087
$ 1,495,6802,514
$ 1,498,194
$ 138,5538,806
$ 147,359
$ 2,316,427407,068(73,873)(8,806)
$ 2,640,816
$ (216,582)
90,825(71,786)167,427
$ (30,116)
$ 407,068186,466
$ 593,534
20001999
¥ 102,820
29
¥ 102,849
¥ 154,02629
¥ 154,055
¥ 13,407864
¥ 14,271
¥ 216,41030,655(7,609)
(864)
¥ 238,592
¥ (11,658)
(3,924)(2,217)(4,509)
¥ (22,308)
¥ 30,655(10,650)
¥ 20,005
¥ 82,035
20,785
¥ 102,820
¥ 133,46320,563
¥ 154,026
¥ 12,3271,080
¥ 13,407
¥ 194,99230,131(7,633)(1,080)
¥ 216,410
¥ 106
(5,965)(53)
(5,746)
¥ (11,658)
¥ 30,131(11,764)
¥ 18,367
1998
Ricoh Company, Ltd. and Consolidated SubsidiariesFor the Years Ended March 31, 1998, 1999 and 2000
The accompanying notes to consolidated financial statements are an integral part of these statements.
Consolidated Statements of Shareholders’ Investment
¥ 102,849
263
¥ 103,112
¥ 154,055259
¥ 154,314
¥ 14,271907
¥ 15,178
¥ 238,59241,928(7,609)
(907)
¥ 272,004
¥ (22,308)
9,355(7,394)17,245
¥ (3,102)
¥ 41,92819,206
¥ 61,134

32
Cash Flows from Operating Activities:Net incomeAdjustments to reconcile net income to net cash
provided by operating activities—Depreciation and amortizationEquity in earnings of affiliates, net of dividends receivedAccrued pension and severance costs, netDeferred income taxesLoss on disposal and sales of plant and equipmentImpairment loss of goodwillChanges in assets and liabilities, net of effects from acquisition—Decrease (increase) in trade receivablesDecrease (increase) in inventoriesDecrease (increase) in finance receivables (Decrease) increase in trade payables(Decrease) increase in accrued income taxes and
accrued expenses and other Other, net
Net cash provided by operating activitiesCash Flows from Investing Activities:
Proceeds from sales of plant and equipmentExpenditures for plant and equipmentPayments for purchases of available-for-sale securitiesProceeds from sales of available-for-sale securities(Increase) decrease in investments in and advances to affiliatesDecrease (increase) in time depositsDecrease (increase) in cash deposits for assignment of debt securitiesOther, net
Net cash used in investing activitiesCash Flows from Financing Activities:
Proceeds from long-term loansRepayment of long-term loans(Decrease) increase in short-term borrowings, netProceeds from issuance of long-term debt securitiesRepayment of long-term debt securitiesCash dividends paidOther, net
Net cash used in financing activitiesEffect of Exchange Rate Changes on Cash and Cash EquivalentsNet Increase (Decrease) in Cash and Cash EquivalentsCash and Cash Equivalents at Beginning of YearCash and Cash Equivalents at End of YearSupplemental Disclosures of Cash Flow Information:
Cash Paid during the Year for—InterestIncome taxes
Ricoh Company, Ltd. and Consolidated SubsidiariesFor the Years Ended March 31, 1998, 1999 and 2000
¥ 41,928
61,946(846)
8,618(18,053)
207—
(7,794)8,502
(22,914)23,852
27,62012,574
135,640
2,989(56,930)(54,194)24,5344,254
(1,571)50,0002,428
(28,490)
8,362(36,699)(56,529)35,000
(66,620)(7,595)2,832
(121,249)(4,718)
(18,817)130,655
¥ 111,838
¥ 17,30526,546
$ 407,068
601,417(8,214)83,670
(175,272)2,010
—
(75,670)82,544
(222,466)231,573
268,155122,078
1,316,893
29,019(552,719)(526,155)238,19441,301
(15,252)485,43723,573
(276,602)
81,184(356,301)(548,825)339,806
(646,796)(73,738)27,495
(1,177,175)(45,805)
(182,689)1,268,495
$ 1,085,806
$ 168,010257,728
2000
Thousands ofU.S. dollars
2000Millions of yen
19991998
¥ 30,655
67,456(2,936)7,198
(3,497)2,285
—
5,81822,03816,921
(29,961)
(14,433)5,164
106,708
486(68,990)(60,883)54,777(2,258)3,794
(25,376)9,215
(89,235)
129,816(128,917)(58,727)40,000
—(7,609)
—(25,437)(2,715)
(10,679)141,334
¥ 130,655
¥ 17,97034,618
Consolidated Statements of Cash Flows
¥ 30,131
61,971(2,300)
278(1,898)1,4325,037
(8,168)(15,387)(14,025)10,479
(18,213)(1,944)47,393
866(93,657)(23,059)49,2403,676
52,841—
8,521(1,572)
30,110(101,062)
62,177——
(7,633)—
(16,408)1,557
30,970110,364
¥ 141,334
¥ 26,47350,631
The accompanying notes to consolidated financial statements are an integral part of these statements.

33
Ricoh Company, Ltd. and Consolidated Subsidiaries
Ricoh distributes its products primarily through domestic (Japanese) and for-eign sales subsidiaries. Overseas, Ricoh owns and distributes not only Ricoh brandproducts but also other brands, such as Gestetner and Savin.
Ricoh manufactures its products primarily in 15 plants in Japan and eightplants overseas, which are located in the United States, United Kingdom, France,and China.
1. NATURE OF OPERATIONSRicoh Company, Ltd. (the “Company”), was established in 1936, and is head-quartered in Tokyo, Japan. The Company and significant subsidiaries (“Ricoh” asa consolidated group) is a worldwide supplier of office automation equipment, in-cluding copiers, facsimile machines, data processing systems, printers and relatedsupplies. Ricoh is also well known for its state-of-the-art electronic devices, photo-graphic equipment and others.
Notes to Consolidated Financial Statements
2. SIGNIFICANT ACCOUNTING AND REPORTING POLICIES(f) Plant and EquipmentDepreciation of plant and equipment is computed principally by using the declining-balance method over the estimated useful lives. Most of the foreign subsidiaries have adopted the straight-line method for computing depreciation,which currently accounts for approximately 26% of the consolidated depreciationexpense.
Effective rates of depreciation for the three years ended March 31, 2000 aresummarized below:
The accompanying consolidated financial statements of the Company and itsconsolidated subsidiaries have been prepared in conformity with accounting principles generally accepted in the United States of America, modified for the accounting for stock splits (see 2 (m) below). Significant accounting and reporting policies are summarized below:
(a) Principles of ConsolidationThe consolidated financial statements include the accounts of Ricoh. Investmentsin generally 20% to 50% owned companies are accounted for on the equity basis.All significant intercompany balances and transactions have been eliminated inconsolidation.
(b) Translation of Foreign Currency AccountsUnder the provisions of Statement of Financial Accounting Standards (“SFAS”)No. 52, “Foreign Currency Translation,” assets and liabilities are translated at the exchange rates in effect at each fiscal year-end, and income and expenses aretranslated at the average rates of exchange prevailing during each fiscal year. The resulting translation adjustments are accumulated as part of other compre-hensive income (loss) included in shareholders’ investment.
(c) DerivativesRicoh enters into foreign currency contracts and interest rate swap agreements tomanage risk exposure. Gains and losses on hedges of existing assets or liabilitiesare included in the carrying amounts of those assets or liabilities and are ulti-mately recognized in income as part of those carrying amounts. Gains and lossesrelated to qualifying hedges of firm commitments and anticipated transactionsare deferred and recognized in income, or as adjustments of carrying amounts,when the hedged transaction occurs.
(d) SecuritiesRicoh conforms with SFAS No.115, “Accounting for Certain Investments in Debtand Equity Securities,” which requires certain investments in debt and equity securities to be classified as either held-to-maturity, trading, or available-for-salesecurities. As of March 31, 1999 and 2000, a substantial part of Ricoh’s invest-ments in debt and equity securities is classified to available-for-sale securities.Those classified as available-for-sale are reported at fair value with unrealizedgains and losses, net of related taxes, excluded from earnings and reported in accumulated other comprehensive income (loss).
The cost of the securities sold was computed based on the average cost ofeach security held at the time of sale.
(e) InventoriesInventories are stated at the lower of average cost or market. Inventory costs in-clude raw materials, labor and manufacturing overheads.
Thousands ofU.S. dollars
2000$ 64,544
32,893
Millions of yen
Aggregate costAccumulated depreciation
¥ 6,6483,388
¥ 6,9583,083
20001999
Certain leased buildings, machinery and equipment are accounted for ascapital leases in conformity with SFAS No. 13, “Accounting for Leases.” The ag-gregate cost included in plant and equipment and related accumulated depreciation as of March 31, 1999 and 2000 were as follows:
7.9%37.6
1999
8.0%38.3
1998
7.9%36.8
2000
BuildingsMachinery and equipment
The related future minimum lease payments and the present value of the net minimum lease payments as of March 31, 2000 were ¥4,355 million($42,282 thousand) and ¥3,900 million ($37,864 thousand), respectively.
Ordinary maintenance and repairs are charged to income as incurred. Majorreplacements and improvements are capitalized. When properties are retired orotherwise disposed of, the property and related accumulated depreciation ac-counts are relieved of the applicable amounts, and any differences are included inother income or expenses.
(g) GoodwillRicoh has classified as goodwill the cost in excess of fair value of the net assets ofmajor companies acquired in purchase transactions. Goodwill is being amortizedon a straight-line method over the estimated periods benefited, not to exceed 20years.
(h) Pension and Retirement Allowances PlansRicoh conforms with SFAS No. 87, “Employers’ Accounting for Pensions” in ac-counting for pension and retirement allowances plans.
In the year ended March 31, 1999, Ricoh adopted SFAS No. 132, “Employers’Disclosure about Pensions and Other Postretirement Benefits,” which revised SFASNo. 87 for disclosures about pension and retirement allowance plans.

34
(i) Income TaxesRicoh conforms with SFAS No. 109, “Accounting for Income Taxes,” which re-quires an asset and liability approach for financial accounting and reporting forincome taxes.
Income taxes are currently provided for undistributed earnings of foreignsubsidiaries and affiliates, except for those deemed to be permanent investments.
(j) AdvertisingThe costs of advertising are expensed as incurred.
(k) Impairment Loss on Long-Lived AssetsRicoh conforms with SFAS No. 121, “Accounting for the Impairment of Long-Lived Assets and for Long-Lived Assets to Be Disposed Of,” in accounting for impairment loss on long-lived assets and certain identifiable intangibles. In per-forming the review for recoverability of long-lived assets and certain identifiableintangibles, Ricoh estimates the future cash flows expected to result from the useof the asset and its eventual disposition. An impairment loss is recognized if thesum of the expected future cash flows (undiscounted and without interestcharges) is less than the carrying amount of the asset. For purposes of such com-parison, portions of unallocated excess of cost over net assets acquired were at-tributed to related long-lived assets and identifiable intangible assets, based uponthe relative fair values of such assets at acquisition. Measurement of an impair-ment loss for long-lived assets and identifiable intangibles is based on the fair val-ue of the asset.
(l) Earnings Per ShareRicoh conforms with SFAS No. 128, “Earnings Per Share,” which establishes stan-dards for computing and presenting earnings per share (EPS) and requires a dualpresentation of basic and diluted EPS.
(m) Accounting for Stock SplitsThe stock splits of common stock made at various times have been accounted forby transferring an amount equivalent to the par value of such stocks from addi-tional paid-in capital to common stock in the case of capitalization by resolutionof the Board of Directors. However, no accounting recognition is made for stocksplits when common stock already includes a portion of the proceeds from sharesissued at a price in excess of par value (see Note 11).
In the United States, distributions of shares in comparable circumstances arerequired to be accounted for by transferring from retained earnings amountsequal to the fair market value of the shares issued, and by increasing additionalpaid-in capital by the excess of the market value over par value of the shares is-sued.
(n) Consolidated Statements of Cash FlowsCash and cash equivalents include highly liquid investments with a maturity ofthree months or less at the date of purchase.
The following noncash transactions have been excluded from the consolidat-ed statements of cash flows:
Millions of yen
Conversion ofconvertible bonds
Capital lease obligations incurred
Transfer of securities to pension fund
Assets and liabilities of Ricoh Elemex Corporation
Fair value of assets acquiredLiabilities assumed
Thousands ofU.S. dollars
2000
$ 45,398
13,845
201,553
——
2000
¥ 4,676
1,426
20,760
——
¥ 58
1,446
—
55,63332,826
¥ 41,348
1,760
—
——
19991998
(o) Use of EstimatesManagement of the Company has made a number of estimates and assumptionsthat affect the reported amounts of assets, liabilities, revenues and expenses, andthe disclosure of contingent assets and liabilities, to prepare these financial state-ments in conformity with generally accepted accounting principles. Actual resultscould differ from those estimates.
(p) Comprehensive IncomeIn the year ended March 31, 1999, Ricoh adopted SFAS No. 130, “Reporting Com-prehensive Income,” which establishes standards for reporting and displayingcomprehensive income and its components. The disclosures required by SFAS No.130 are presented in the consolidated statements of shareholders’ investment andin Note 12.
(q) Segment InformationIn the year ended March 31, 2000, Ricoh adopted SFAS No. 131, “Disclosure aboutSegments of an Enterprise and Related Information,” which establishes standardsfor the reporting of information about operating segments in the financial state-ments. Prior years’ information was restated as required in SFAS No. 131. Operat-ing segments are defined as components of an enterprise for which separatefinancial information is available that is evaluated regularly by Ricoh’s manage-ment in deciding how to allocate resources and in assessing performance. SFASNo. 131 also requires disclosures about products and services, geographic areasand major customers. The adoption of SFAS No. 131 did not affect results of oper-ations or financial position but did affect the disclosure of segment information,as presented in Note 17.
(r) New Accounting StandardsIn June 1998, the Financial Accounting Standards Board issued SFAS No. 133,“Accounting for Derivative Instruments and Hedging Activities,” which establishesaccounting and reporting standards for derivative instruments. It requires an enti-ty to recognize all derivatives as either assets or liabilities in the Consolidated Bal-ance Sheets and measure those instruments at fair value. Adjustments in the fairvalue will impact shareholders’ investment through either net income or othercomprehensive income, depending on whether the derivative instruments qualifyas hedges and, if so, the nature of the hedging activity. SFAS No. 133, as amended,is effective for fiscal years beginning after June 15, 2000. Ricoh has not deter-mined the effect on the consolidated financial statements.

35
The Company’s financial statements distributed to its shareholders in Japanand filed with the Ministry of Finance in Japan are prepared in conformity withJapanese accounting principles and accounting practices and are not consolidated.Such financial statements reported the following amounts for the three years end-ed March 31, 2000:
3. BASIS OF PRESENTING FINANCIAL STATEMENTSThe accounts of the Company and its domestic subsidiaries are maintained inyen. The accompanying consolidated financial statements as of March 31, 2000and for the three years then ended have been presented in yen, and for the conve-nience of the reader the consolidated financial statements for fiscal 2000 have also been presented in U.S. dollars by arithmetically translating all yen amountsby using the exchange rate of ¥103 to US$1 in effect at March 31, 2000.
The books of the Company and its domestic subsidiaries are maintained inconformity with Japanese accounting principles and accounting practices. Foreign subsidiaries maintain their books in conformity with those of the coun-tries of their domicile.
The accompanying financial statements are presented on a consolidated ba-sis and reflect certain adjustments, not recorded in the companies’ books, to pre-sent them in conformity with accounting principles generally accepted in theUnited States of America, modified for the accounting for stock splits (see Note2(m)). The principal adjustments relate to accounting for the bonds with detach-able stock purchase warrants, translating bonds in foreign currencies at the cur-rent exchange rates, accounting for certain investments in debt and equitysecurities, accounting for the impairment of long-lived assets and for long-livedassets to be disposed of, adjusting accrued pension and severance costs and certain other accrued expenses, accounting for sales-type leases and providing forthe income tax effect of such adjustments.
Net salesNet income
Thousands ofU.S. dollars
2000
$7,548,553219,544
20001999
¥777,50122,613
¥720,50318,977
1998
¥752,63122,505
Millions of yen
4. FINANCE RECEIVABLESFinance receivables as of March 31, 1999 and 2000 are comprised of lease receiv-ables and installment loans.
The Company’s products are leased to customers primarily through RicohLeasing Company, Ltd., a major subsidiary. These leases are accounted for assales-type leases in conformity with SFAS No.13. Revenues from sales-type leasesare recognized at the inception of the lease.
Information pertaining to Ricoh’s lease receivables as of March 31, 1999 and2000 is as follows:
Minimum leasepayments receivable
Unearned incomeAllowance for doubtfulreceivables
Net lease receivables
Thousands ofU.S. dollars
2000
$3,723,184(402,689)
(121,534)
$3,198,961
Millions of yen
20001999
¥ 369,186(39,454)
(12,588)
¥ 317,144
¥ 383,488(41,477)
(12,518)
¥ 329,493
As of March 31, 2000, the minimum lease payments receivable due in each ofthe next five years and thereafter are as follows:
Thousands ofU.S. dollars
200120022003200420052006 and thereafter
Total
$1,219,039983,631757,000506,233213,10644,175
$3,723,184
Millions of yen
¥125,561101,31477,97152,14221,9504,550
¥383,488
Years ending March 31
Installment loans, net of allowance for doubtful receivables, as of March 31,1999 and 2000 are primarily comprised of housing loans and term loans aggre-gating ¥33,240 million and ¥43,368 million ($421,049 thousand), respectively.
The amount of retained earnings legally available for distribution (and forthe requisite appropriation to legal reserve) is that recorded in the Company’sbooks and amounted to ¥197,224 million ($1,914,796 thousand) as of March 31,2000 (see Note 11).
Since 1978, the Company has translated its consolidated financial statementsprepared in conformity with accounting principles generally accepted in the Unit-ed States of America for filing with the Ministry of Finance in Japan.
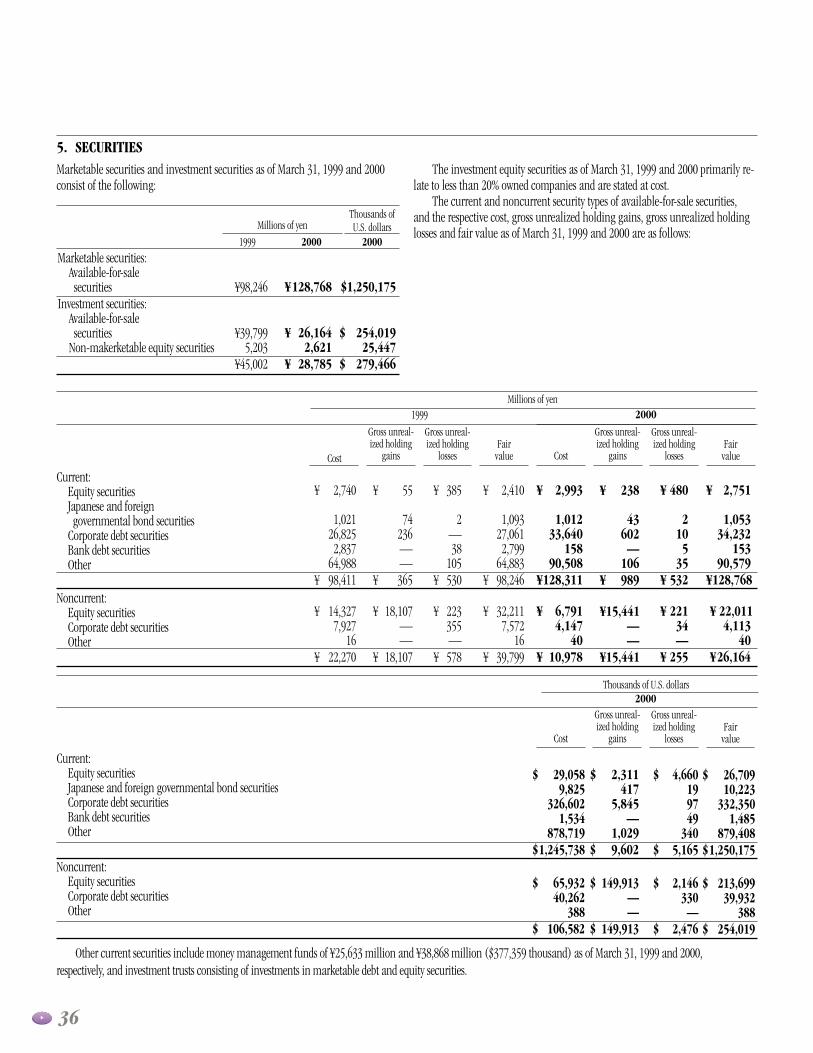
36
Millions of yen
Current:Equity securitiesJapanese and foreign governmental bond securities
Corporate debt securitiesBank debt securitiesOther
Noncurrent:Equity securitiesCorporate debt securitiesOther
1999
Fair value
Gross unreal-ized holding
losses
Gross unreal-ized holding
gainsFair
value
2000
Gross unreal-ized holding
losses
Gross unreal-ized holding
gainsCostCost
¥ 2,410
1,09327,0612,799
64,883¥ 98,246
¥ 32,2117,572
16¥ 39,799
¥ 385
2—38
105¥ 530
¥ 223355—
¥ 578
¥ 55
74236——
¥ 365
¥ 18,107——
¥ 18,107
¥ 2,740
1,02126,8252,837
64,988¥ 98,411
¥ 14,3277,927
16¥ 22,270
¥ 2,751
1,05334,232
15390,579
¥128,768
¥ 22,0114,113
40¥26,164
¥ 480
2105
35¥ 532
¥ 22134—
¥ 255
¥ 238
43602—
106¥ 989
¥15,441——
¥15,441
¥ 2,993
1,01233,640
15890,508
¥128,311
¥ 6,7914,147
40¥ 10,978
Thousands of U.S. dollars
Current:Equity securitiesJapanese and foreign governmental bond securitiesCorporate debt securitiesBank debt securitiesOther
Noncurrent:Equity securitiesCorporate debt securitiesOther
Fair value
2000Gross unreal-ized holding
losses
Gross unreal-ized holding
gainsCost
$ 26,70910,223
332,3501,485
879,408$1,250,175
$ 213,69939,932
388$ 254,019
$ 4,660199749
340$ 5,165
$ 2,146330—
$ 2,476
$ 2,311417
5,845—
1,029$ 9,602
$ 149,913——
$ 149,913
$ 29,0589,825
326,6021,534
878,719$1,245,738
$ 65,93240,262
388$ 106,582
5. SECURITIESMarketable securities and investment securities as of March 31, 1999 and 2000consist of the following:
Marketable securities:Available-for-sale securities
Investment securities:Available-for-sale securities
Non-makerketable equity securities
Thousands ofU.S. dollars
2000Millions of yen
2000
¥128,768
¥ 26,1642,621
¥ 28,785
$1,250,175
$ 254,01925,447
$ 279,466
1999
¥98,246
¥39,7995,203
¥45,002
The investment equity securities as of March 31, 1999 and 2000 primarily re-late to less than 20% owned companies and are stated at cost.
The current and noncurrent security types of available-for-sale securities,and the respective cost, gross unrealized holding gains, gross unrealized holdinglosses and fair value as of March 31, 1999 and 2000 are as follows:
Other current securities include money management funds of ¥25,633 million and ¥38,868 million ($377,359 thousand) as of March 31, 1999 and 2000, respectively, and investment trusts consisting of investments in marketable debt and equity securities.

37
Thousands ofU.S. dollars
Fair value
$ 988,621275,165
$1,263,786
Cost
$ 982,932274,417
$1,257,349
Millions of yen
Fair value
¥101,82828,342
¥130,170
Cost
¥101,24228,265
¥129,507
Due within one yearDue after one year through five years
Proceeds from the sales of available-for-sale securities were ¥49,240 million,¥54,777 million and ¥24,534 million ($238,194 thousand) for the years endedMarch 31, 1998, 1999 and 2000, respectively.
In March 2000, Ricoh contributed certain marketable equity securities, notincluding those of its subsidiaries and affiliated companies, to an employee retirement benefit trust fully administered and controlled by an independent banktrustee, with no cash proceeds thereon. The transfer of the available-for-sale securities has been accounted for as a sale in accordance with SFAS No. 125 andaccordingly the recorded pension liability has been reduced by the fair marketvalue amount of the transferred securities. The fair value of these securities at thetime of contribution was ¥20,760 million ($201,553 thousand). The net unrealized
gain of these available-for-sale securities amounting to ¥13,095 million($127,136thousand) continues to be included in “Accumulated other comprehensive income (loss)” on the consolidated balance sheets and will only be reflected in realized gains in the statements of income upon the future sale of the transferredsecurities by the trustee.
The gross realized gains on sale of available-for-sale securities were ¥2,969million, ¥1,589 million and ¥1,601 million ($15,544 thousand) for the yearsended March 31, 1998, 1999 and 2000, respectively.
There were no significant realized losses on sales of available-for-sale securitiesfor the three years ended March 31, 2000.
The contractual maturities of debt securities classified as available-for-sale as of March 31, 2000, regardless of their balance sheet classification, are as follows:
6. INVESTMENTS IN AND ADVANCES TO AFFILIATESThe investments in and advances to affiliates primarily relate to 20% to 50%owned companies. Ricoh’s proportionate share of assets, revenues and income be-fore income taxes of each of these companies is less than 20% of the correspond-ing consolidated amounts. Included in these companies is COCA-COLA WESTJAPAN COMPANY, LIMITED, a 22.4% owned major affiliate. The common stock ofthis company is publicly traded. The carrying value of the investment in thiscompany was equal to its underlying book value and amounted to ¥33,761 mil-lion ($327,777 thousand) as of March 31, 2000. The quoted market value of thiscompany was ¥44,207 million ($429,194 thousand) as of March 31, 2000.
In May 1999, KITAKYUSHU COCA-COLA BOTTLING COMPANY, LIMITEDmade a special allotment offering of new securities to a third party. Also, itmerged with SANYO COCA-COLA BOTTLING CO., LTD., as of July 1, 1999 andchanged its entity’s name to COCA-COLA WEST JAPAN COMPANY, LIMITED. As aresult of these events, the Company’s ownership interest in this company de-creased to 22.4% while the underlying equity value was not adversely affected.
Ricoh Elemex Corporation, a 44.8% owned major affiliate of which commonstock is publicly traded, became a consolidated subsidiary in fiscal 1999, as a resultof it being merged with a consolidated subsidiary and purchase of certain owner-ship interest. In the accompanying consolidated financial statements, the invest-ment in Ricoh Elemex Corporation through September 30, 1998, was accountedfor on the equity basis, while the post-acquisition period for the six months endedMarch 31, 1999 was consolidated. The effect on the consolidated results of opera-tions for the three years ended March 31, 1999, if Ricoh Elemex Corporation hadbeen consolidated at the beginning of each year, was not significant.
The underlying book value of the other 20% to 50% owned companies is ap-proximately the same as their carrying value.
Summarized unaudited financial information for all affiliates as of March31, 1999 and 2000 and for the three years ended March 31, 2000 is as follows:
Financial Position
$ 374,942
74,46661,728
1,851,087
$2,362,223
¥ 38,619
7,6706,358
190,662
¥243,309
¥ 34,045
7,5306,727
131,607
¥179,909
Liabilities and shareholders’investment—
Current liabilitiesShort-term borrowings and long-term indebtedness
Other liabilitiesShareholders’ investment
Assets—Current assetsOther assets
Thousands ofU.S. dollars
2000
Millions of yen
2000
$1,308,6891,053,534
$2,362,223
¥134,795108,514
¥243,309
¥108,15871,751
¥179,909
1999
SalesCosts andexpenses
Net income
Thousands ofU.S. dollars
2000Millions of yen
20001999$2,231,311
2,109,864
$ 121,447
¥229,825
217,316
¥ 12,509
¥ 240,422
228,547
¥ 11,875
1998¥288,816
275,058
¥ 13,758
Operations
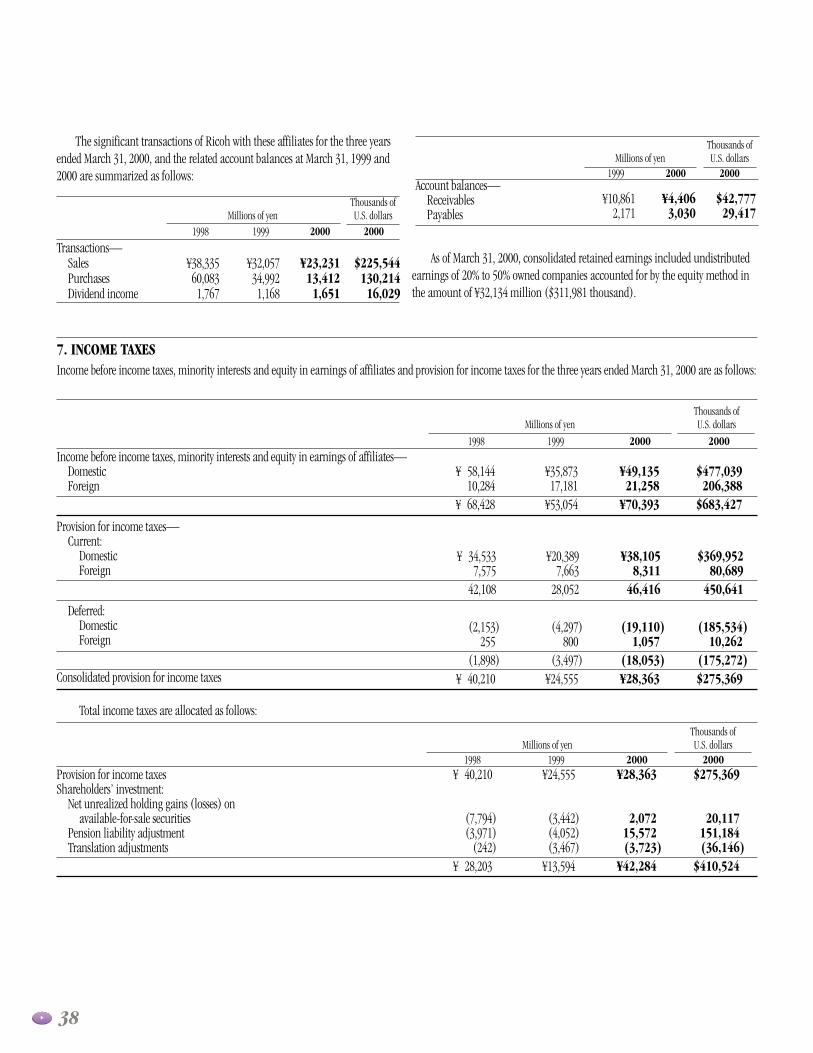
38
The significant transactions of Ricoh with these affiliates for the three yearsended March 31, 2000, and the related account balances at March 31, 1999 and2000 are summarized as follows:
Income before income taxes, minority interests and equity in earnings of affiliates—DomesticForeign
Thousands ofU.S. dollars
2000
Millions of yen
200019991998
$477,039206,388
$683,427
¥49,13521,258
¥70,393
¥35,87317,181
¥53,054
¥ 58,14410,284
¥ 68,428
Provision for income taxes—Current:
DomesticForeign
$369,95280,689
450,641
¥38,1058,311
46,416
¥ 34,5337,575
42,108
Deferred:DomesticForeign
Consolidated provision for income taxes
(2,153)255
(1,898)¥ 40,210
Provision for income taxesShareholders’ investment:
Net unrealized holding gains (losses) on available-for-sale securities
Pension liability adjustmentTranslation adjustments
2000Millions of yen
200019991998¥ 40,210
(7,794)(3,971)
(242)¥ 28,203
Thousands ofU.S. dollars
Total income taxes are allocated as follows:
As of March 31, 2000, consolidated retained earnings included undistributedearnings of 20% to 50% owned companies accounted for by the equity method inthe amount of ¥32,134 million ($311,981 thousand).
Thousands ofU.S. dollars
2000
Transactions—SalesPurchasesDividend income
2000
¥23,23113,4121,651
$225,544130,21416,029
1999
¥32,05734,9921,168
1998
¥38,33560,0831,767
Thousands ofU.S. dollars
2000Account balances—
ReceivablesPayables
Millions of yen2000
¥4,4063,030
$42,77729,417
1999
¥10,8612,171Millions of yen
Income before income taxes, minority interests and equity in earnings of affiliates and provision for income taxes for the three years ended March 31, 2000 are as follows:
7. INCOME TAXES
(19,110)1,057
(18,053)¥28,363
¥20,3897,663
28,052
(4,297)800
(3,497)¥24,555
(185,534)10,262
(175,272)$275,369
$275,369
20,117151,184(36,146)
$410,524
¥28,363
2,07215,572(3,723)
¥42,284
¥24,555
(3,442)(4,052)(3,467)
¥13,594

39
Reconciliations of the normal tax rates in Japan with the effective tax ratesfor the three years ended March 31, 2000, are as follows:
Normal tax ratePermanently nondeductible expenses,
net of nontaxable incomeDecrease in the beginning-of-the-year
balance of the valuation allowance for deferred tax assets
Nondeductible goodwill impairment lossEffect of change in enacted tax rateOther, netEffective tax rate
2000
47%
(2)
(10)—
83
46%
51%
5
(3)321
59%
1998 1999
42%
3
(2)——(3)40%
Permanently nondeductible expenses include directors’ bonuses and enter-tainment expenses. Permanently nontaxable income includes dividends receivedand exported technology fees.
The tax effects of temporary differences giving rise to the consolidated deferredincome tax assets and liabilities at March 31, 1999 and 2000 are as follows:
Deferred income taxes (Current Assets)Lease deposits and otherAccrued expenses and otherDeferred income taxes (Long-Term Liabilities)
Thousands ofU.S. dollars
2000Millions of yen
20001999
$ 365,612261,660
(2,146)(169,544)
$ 455,582
¥ 37,65826,951
(221)(17,463)
¥ 46,925
¥ 30,34724,954(1,504)
(14,831)¥ 38,966
Assets:Intercompany profits and inventory write-downsAccrued expensesDepreciationAccrued pension and severance costsNet operating losses carryforwardTranslation adjustmentOther
Less—Valuation allowance
Liabilities:Sales-type leasesUndistributed earnings of foreign subsidiaries and affiliatesNet unrealized holding gains on available-for-sale securitiesOther
Net deferred tax assets
Thousands ofU.S. dollars
2000
$ 209,427108,70952,417
141,60267,17551,650
167,796798,776(79,194)
$ 719,582
$ (77,952)(74,291)(93,039)(18,718)
$ (264,000)$ 455,582
Millions of yen20001999
¥ 17,9695,6266,500
23,88810,1301,5977,701
73,411(8,271)
¥ 65,140
¥ (10,511)(6,023)(7,511)(2,129)
¥ (26,174)¥ 38,966
¥ 21,57111,1975,399
14,5856,9195,320
17,28382,274(8,157)
¥ 74,117
¥ (8,029)(7,652)(9,583)(1,928)
¥(27,192)¥ 46,925
Net deferred tax assets as of March 31, 1999 and 2000 are included in the consolidated balance sheets as follows:
The net changes in the total valuation allowance for the three years endedMarch 31, 2000 were decreases of ¥2,297 million, ¥5,486 million and ¥114 mil-lion ($1,107 thousand), respectively.
The valuation allowance was established to reduce the deferred tax assets tothe amount that is expected to be realized. The valuation allowance principallyrelates to the tax effects of net operating losses recorded by certain subsidiaries.
At March 31, 2000, certain subsidiaries had net operating losses carried for-ward for income tax purposes of approximately ¥20,716 million ($201,126 thou-sand) which were available to reduce future income taxes, if any. Approximately¥12,036 million ($116,854 thousand) of the operating losses expire within a five-year period while the remainder principally have an indefinite carryforward period.

40
9. LONG-TERM INDEBTEDNESSLong-term indebtedness as of March 31, 1999 and 2000 consists of the following:
Thousands ofU.S. dollars
2000Millions of yen
(Per share)
Conversionprice
1999 2000Convertible bonds—
1.8%, payable in yen, due March 20021.5%, payable in yen, due March 20020.35%, payable in yen, due March 20030.4%, payable in yen, due September 2002 issued by a consolidated subsidiary0.375%, payable in yen, due March 2001 issued by a consolidated subsidiaryTotal convertible bonds
Bonds—2.075%, straight bonds, payable in yen, due April 20052.9%, straight bonds, payable in yen, due August 20011.17%, straight bonds, payable in yen, due June 20040.9%, straight bonds, payable in yen, due June 20032.1%, straight bonds, payable in yen, due October 20091.1%, straight bonds, payable in yen, due February 20047.0%, straight bonds, payable in yen, due January 20003.75%, straight bonds, payable in yen, due October 1999Medium term notes, 0.05%– 6.33 %, due through 2008Total bonds
Unsecured loans—Banks and insurance companies, 0.31%–8.50%, due through 2012
Secured loans—Banks, insurance companies, and other financial institution, 0%–18.36%, due through 2020
Capital lease obligations (see Note 2 (f))Total
Less—Current maturities included in current liabilities
¥ 824.70993.00
1,210.002,296.001,100.00
¥ 1,48533,42130,21410,0004,920
80,040
40,00010,000
————
50,07215,00019,827
134,899
209,878
10,1064,083
439,006(94,426)
¥ 344,580
¥ 1,41733,28729,8916,2082,990
73,793
40,00010,00010,0005,000
10,00010,000
——
12,17997,179
179,498
10,6733,900
365,043(57,081)
¥ 307,962
$ 13,757323,175290,20460,27229,029
716,437
388,35097,08797,08748,54497,08797,087
——
118,243943,485
1,742,699
103,62137,864
3,544,106(554,184)
$ 2,989,922
Short-term borrowings as of March 31, 1999 and 2000 consist of the following:Thousands ofU.S. dollars
2000$ 1,146,417
310,680$ 1,457,097
8. SHORT-TERM BORROWINGS AND TRADE NOTES RECEIVABLE DISCOUNTED WITH BANKS
Borrowings, principally from banksCommercial paper
Millions of yen
2000¥ 118,081
32,000¥ 150,081
¥ 178,07236,218
¥ 214,290
1999
Weighted averageinterest rate
20002.1%0.1
2.5%0.7
notes receivable discounted and/or long-term loans; however, there are no formalcompensating balance agreements with any banks. The weighted average interestrate on these time deposits was 0.1% as of March 31, 2000.
The Company and certain of its subsidiaries had unused lines of creditamounting to ¥314,348 million ($3,051,922 thousand) of which ¥209,483 mil-lion ($2,033,816 thousand) related to commercial paper and medium-term notesprograms at prevailing interest rates.
The Company and certain of its subsidiaries regularly discount trade notesreceivable on a full recourse basis with banks. These trade notes receivable dis-counted are contingent liabilities. The weighted average interest rates on thesetrade notes receivable discounted were 1.5% as of March 31, 1999 and 4.3% as ofMarch 31, 2000, respectively.
As is the customary practice in Japan, certain subsidiaries have substantialtime deposits with banks from which they have short-term borrowings, trade
1999
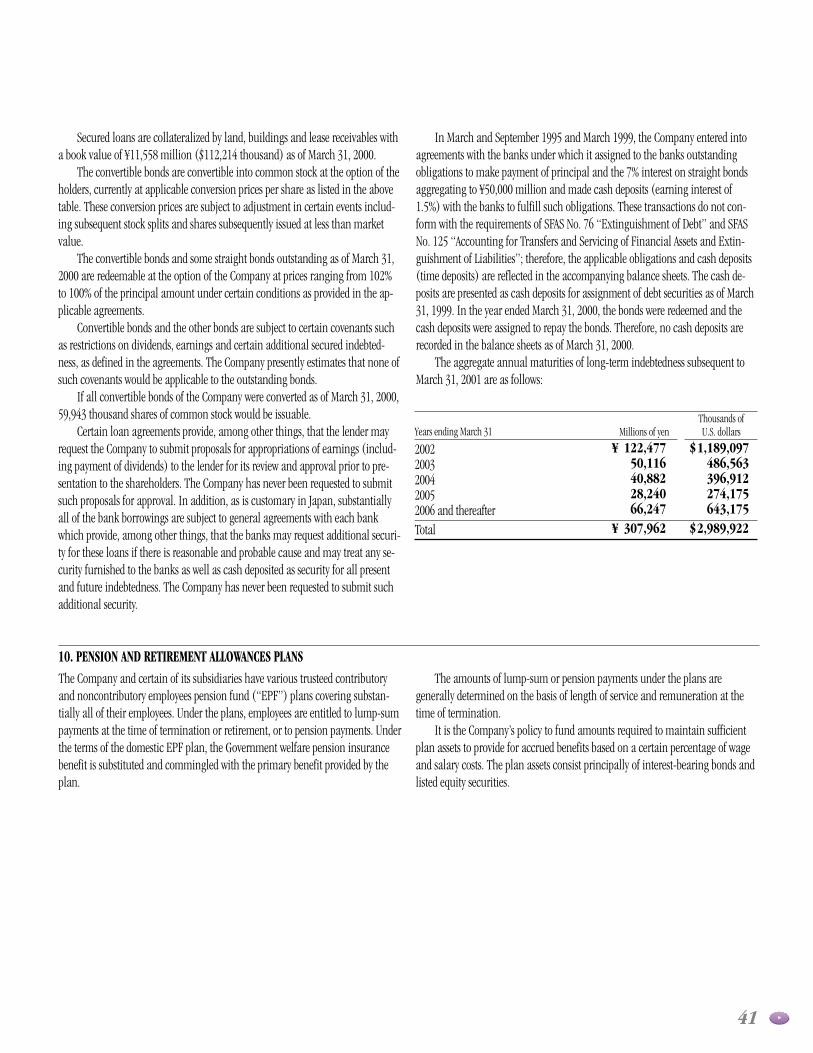
41
Secured loans are collateralized by land, buildings and lease receivables witha book value of ¥11,558 million ($112,214 thousand) as of March 31, 2000.
The convertible bonds are convertible into common stock at the option of theholders, currently at applicable conversion prices per share as listed in the abovetable. These conversion prices are subject to adjustment in certain events includ-ing subsequent stock splits and shares subsequently issued at less than marketvalue.
The convertible bonds and some straight bonds outstanding as of March 31,2000 are redeemable at the option of the Company at prices ranging from 102%to 100% of the principal amount under certain conditions as provided in the ap-plicable agreements.
Convertible bonds and the other bonds are subject to certain covenants suchas restrictions on dividends, earnings and certain additional secured indebted-ness, as defined in the agreements. The Company presently estimates that none ofsuch covenants would be applicable to the outstanding bonds.
If all convertible bonds of the Company were converted as of March 31, 2000,59,943 thousand shares of common stock would be issuable.
Certain loan agreements provide, among other things, that the lender mayrequest the Company to submit proposals for appropriations of earnings (includ-ing payment of dividends) to the lender for its review and approval prior to pre-sentation to the shareholders. The Company has never been requested to submitsuch proposals for approval. In addition, as is customary in Japan, substantiallyall of the bank borrowings are subject to general agreements with each bankwhich provide, among other things, that the banks may request additional securi-ty for these loans if there is reasonable and probable cause and may treat any se-curity furnished to the banks as well as cash deposited as security for all presentand future indebtedness. The Company has never been requested to submit suchadditional security.
In March and September 1995 and March 1999, the Company entered intoagreements with the banks under which it assigned to the banks outstandingobligations to make payment of principal and the 7% interest on straight bondsaggregating to ¥50,000 million and made cash deposits (earning interest of1.5%) with the banks to fulfill such obligations. These transactions do not con-form with the requirements of SFAS No. 76 “Extinguishment of Debt” and SFASNo. 125 “Accounting for Transfers and Servicing of Financial Assets and Extin-guishment of Liabilities”; therefore, the applicable obligations and cash deposits(time deposits) are reflected in the accompanying balance sheets. The cash de-posits are presented as cash deposits for assignment of debt securities as of March31, 1999. In the year ended March 31, 2000, the bonds were redeemed and thecash deposits were assigned to repay the bonds. Therefore, no cash deposits arerecorded in the balance sheets as of March 31, 2000.
The aggregate annual maturities of long-term indebtedness subsequent toMarch 31, 2001 are as follows:
Thousands ofU.S. dollars
20022003200420052006 and thereafterTotal
$1,189,097486,563396,912274,175643,175
$2,989,922
Millions of yen
¥ 122,47750,11640,88228,24066,247
¥ 307,962
Years ending March 31
10. PENSION AND RETIREMENT ALLOWANCES PLANSThe Company and certain of its subsidiaries have various trusteed contributoryand noncontributory employees pension fund (“EPF”) plans covering substan-tially all of their employees. Under the plans, employees are entitled to lump-sumpayments at the time of termination or retirement, or to pension payments. Underthe terms of the domestic EPF plan, the Government welfare pension insurancebenefit is substituted and commingled with the primary benefit provided by theplan.
The amounts of lump-sum or pension payments under the plans are generally determined on the basis of length of service and remuneration at thetime of termination.
It is the Company’s policy to fund amounts required to maintain sufficientplan assets to provide for accrued benefits based on a certain percentage of wageand salary costs. The plan assets consist principally of interest-bearing bonds andlisted equity securities.

42
Change in benefit obligation:Benefit obligation at beginning of yearService costInterest costPlan participants’ contributionActuarial losses (gains)Benefits paidForeign exchange impactBenefit obligation at end of year
Change in plan assets:Fair value of plan assets at beginning of yearActual return on plan assetsEmployer contributionPlan participants’ contributionBenefits paidForeign exchange impactFair value of plan assets at end of year
Funded statusUnrecognized actuarial lossUnrecognized net asset at transition, net of amortization
Net amount recognized
Amounts recognized in the balance sheets consist of:Prepaid benefit costAccrued benefit liabilityAccumulated other comprehensive income, gross of taxNet amount recognized
Thousands ofU.S. dollars
2000Millions of yen
2000
¥ 364,81416,87213,2821,496
(12,464)(11,526)(4,448)
¥ 368,026
¥ 227,90937,14734,0301,496
(10,078)(4,674)
¥ 285,830
¥ (82,196)52,495(3,783)
¥ (33,484)
¥ 1,742(38,271)
3,045¥ (33,484)
1999
¥ 331,48417,14113,3651,522
13,775(8,819)(3,654)
¥ 364,814
¥ 212,63510,63913,8741,522
(7,100)(3,661)
¥ 227,909
¥ (136,905)96,597(4,256)
¥ (44,564)
¥ 2,558(82,984)35,862
¥ (44,564)
$3,541,883163,806128,95114,524
(121,010)(111,903)(43,183)
$3,573,068
$2,212,709360,650330,38814,524
(97,845)(45,378)
$2,775,048
$ (798,020)509,660(36,727)
$ (325,087)
$ 16,913(371,563)
29,563$ (325,087)
Discount rateRate of increase in compensation levelsExpected long-term rate of return on plan assets
20001999
3.5% –7.25%3.7% –5.5%3.5% –9.0%
3.0% – 7.25%3.7% – 5.5%4.5% – 9.0%
The changes in the benefit obligation and plan assets of the defined benefit plans for the two years ended March 31, 2000 were as follows:

43
The projected benefit obligations, accumulated benefit obligations, and fairvalue of plan assets for the pension plans with accumulated benefit obligations inexcess of plan assets were ¥281,012 million, ¥226,871 million and ¥182,280 mil-lion respectively, as of March 31, 1999 and ¥23,178 million ($225,029 thousand),¥18,566 million ($180,252 thousand) and ¥8,253 million ($80,126 thousand),respectively, as of March 31, 2000.
In accordance with the provisions of SFAS No. 87, the Company was requiredto record an adjustment for minimum pension liability at March 31, 1999 and2000. This liability represents the excess of the accumulated benefit obligationsover the fair value of plan assets. This excess is primarily attributable to a sub-stantial reduction in the discount rate used in pension calculation and representsa net loss not yet recognized as net periodic pension cost. Since there is no unrec-ognized prior service cost, this excess is reported in an accumulated other com-
11. SHAREHOLDERS’ INVESTMENTThe Japanese Commercial Code provides that an amount equivalent to at least10% of cash dividends paid and other cash outlays resulting from appropriationof retained earnings with respect to each fiscal or interim six-month period beappropriated as a legal reserve until such reserve equals 25% of the stated capital.This reserve and additional paid-in capital are not available for dividends butmay be used to reduce a deficit by resolution of the shareholders or may be capi-talized by resolution of the Board of Directors.
Semiannual cash dividends are approved by the shareholders after the end ofeach fiscal period or are declared by the Board of Directors after the end of eachinterim six-month period. Such dividends are payable to shareholders of recordat the end of each such fiscal or interim six-month period. At the general meet-ing held on June 29, 2000, the shareholders approved the declaration of a cash
dividend on the common stock totaling ¥3,806 million ($36,951 thousand),which will be paid to shareholders of record as of March 31, 2000, and the relatedappropriation of retained earnings totaling ¥397 million ($3,854 thousand) by atransfer to the legal reserve. In accordance with the Japanese Commercial Code,the declaration of this dividend and the related transfer of retained earnings tothe legal reserve have not been reflected in the consolidated financial statementsas of March 31, 2000.
The Japanese Commercial Code provides that at least one-half of the proceedsfrom shares issued at a price in excess of par value be included in common stock.In conformity therewith, the Company has divided the principal amount of bondsconverted into common stock equally between common stock and additionalpaid-in capital.
prehensive income (loss), at net of tax benefits. The net changes in pension liabil-ity adjustment were an increase of ¥4,509 million for the year ended March 31,1999 and a decrease of ¥17,245 million ($167,427 thousand) for the year endedMarch 31, 2000, respectively.
As discussed in Note 5, Ricoh contributed certain marketable equity securitiesto an employee retirement benefit trust. The securities held in this trust are quali-fied as plan assets under SFAS No. 87.
Employees of certain subsidiaries not covered by the EPF plan and directors ofRicoh are primarily covered by unfunded retirement allowances plans. The pay-ments to directors are subject to shareholders’ approval.
The tables presented in the preceding paragraph were restated to reflect the funded status of those retirement benefit plans for employees of certain subsidiaries.
Service costsInterest costsExpected return on plan assetsNet amortization
Net periodic benefit cost
Thousands ofU.S. dollars
2000
Millions of yen
200019991998
¥ 16,87213,282(8,611)3,812
¥ 25,355
$ 163,806128,951(83,602)37,010
$ 246,165
¥ 13,09012,713(8,341)2,411
¥ 19,873
¥ 18,66213,365
(10,306)3,210
¥ 24,931
The discount rate, rate of increase in compensation and expected long-term rate of return on plan assets of the domestic pension plans were 3.5%, 3.7% and 3.5%, respec-tively, for the year ended March 31, 1999 and 3.0%, 3.7% and 4.5%, respectively, for the year ended March 31, 2000. The other data shown above are those of foreign pen-sion plans.
The net periodic benefit costs of the defined benefit plans for the three years ended March 31, 2000 consisted of the following components:

44
1998:Foreign currency translation adjustmentsUnrealized gain on securities:
Unrealized holding gains arising during the yearLess—Reclassification adjustment for gains realized in net income
Net unrealized gainsMinimum pension liability adjustmentOther comprehensive income (loss)
1999:Foreign currency translation adjustmentsUnrealized gain on securities:
Unrealized holding gains arising during the yearLess—Reclassification adjustment for gains realized in net income
Net unrealized gainsMinimum pension liability adjustmentOther comprehensive income (loss)
2000:Foreign currency translation adjustmentsUnrealized gain on securities:
Unrealized holding gains arising during the yearLess—Reclassification adjustment for gains realized in net income
Net unrealized gainsMinimum pension liability adjustmentOther comprehensive income (loss)
2000:Foreign currency translation adjustmentsUnrealized gain on securities:
Unrealized holding gains arising during the yearLess—Reclassification adjustment for gains realized in net income
Net unrealized gainsMinimum pension liability adjustmentOther comprehensive income (loss)
Net-of-tax amount
Millions of yen
Thousands of U.S. dollars
Taxexpense
¥ 242
6,2751,5197,7943,971
¥ 12,007
¥ 3,467
2,688754
3,4424,052
¥ 10,961
¥ 3,723
(2,742)670
(2,072)(15,572)
¥ (13,921)
$ 36,146
(26,621)6,505
(20,116)(151,185)
$ (135,155)
Before-tax amount
¥ (295)
(10,790)(2,969)
(13,759)(9,717)
¥ (23,771)
¥ (5,684)
(5,777)(1,589)(7,366)(8,561)
¥ (21,611)
¥ (11,117)
13,028(1,601)11,42732,817
¥ 33,127
$ (107,932)
126,485(15,544)110,941318,612
$ 321,621
¥ (53)
(4,515)(1,450)(5,965)(5,746)
¥ (11,764)
¥ (2,217)
(3,089)(835)
(3,924)(4,509)
¥ (10,650)
¥ (7,394)
10,286(931)
9,35517,245
¥ 19,206
$ (71,786)
99,864(9,039)90,825
167,427$ 186,466
12. OTHER COMPREHENSIVE INCOME (LOSS)Tax effects allocated to each component of other comprehensive income (loss) are as follows:

45
Changes in accumulated other comprehensive income (loss) are as follows:
1998:Beginning balanceChange during the yearEnding balance
1999:Beginning balanceChange during the yearEnding balance
2000:Beginning balanceChange during the yearEnding balance
2000:Beginning balanceChange during the yearEnding balance
Accumulated othercomprehensive income (loss)
Millions of yen
Thousands of U.S. dollars
Minimum pension liability adjustment
¥ (8,590)(5,746)
¥ (14,336)
¥ (14,336)(4,509)
¥ (18,845)
¥ (18,845)17,245
¥ (1,600)
$ (182,961)167,427
$ (15,534)
Unrealized gains onsecurities
Foreign currencytranslation
adjustments
¥ 18,833(5,965)
¥ 12,868
¥ 12,868(3,924)
¥ 8,944
¥ 8,9449,355
¥ 18,299
$ 86,83590,825
$ 177,660
¥ (10,137)(53)
¥ (10,190)
¥ (10,190)(2,217)
¥ (12,407)
¥ (12,407)(7,394)
¥ (19,801)
$ (120,457)(71,786)
$ (192,243)
¥ 106(11,764)
¥ (11,658)
¥ (11,658)(10,650)
¥ (22,308)
¥ (22,308)19,206
¥ (3,102)
$ (216,583)186,466
$ (30,117)

46
13. PER SHARE DATAThe following table sets forth the computation of basic and diluted
earnings per share showing the reconciliation of the numerators and denominators used for the computation.
Dividends per share shown in the consolidated statements of income have beenpresented on an accrual basis and include, in each fiscal year ended March 31,dividends approved or to be approved after such March 31, but applicable to theyear then ended.
Average common shares outstanding
Effect of dilutive securities:Convertible bonds—
1.8%, payable in yen, due March 20021.5%, payable in yen, due March 20020.35%, payable in yen, due March 2003
Diluted common shares outstanding
2000
Thousands of shares
691,745
1,74333,60424,934
752,026
1999
691,592
1,80233,65824,974
752,026
1998
Thousands ofU.S. dollars
20002000Millions of yen
19991998
U.S. dollars
20002000
Yen
19991998
669,959
1,92134,66227,810
734,352
Net income applicable to common shareholders
Effect of dilutive securities:Convertible bonds—
1.8%, payable in yen, due March 20021.5%, payable in yen, due March 20020.35%, payable in yen, due March 2003Other
Diluted net income
¥ 30,131
14258109
(145)¥ 30,367
¥ 30,655
15272110
(266)¥ 30,786
¥ 41,928
15300120
(204)¥ 42,159
$ 407,068
1462,9131,165
(1,981)$ 409,311
¥ 44.9741.35
¥ 44.3340.94
¥ 60.6156.06
$ 0.590.54
Earnings per share:BasicDiluted
14. DERIVATIVE FINANCIAL INSTRUMENTSthey had ¥351,893 million and ¥378,010 million ($3,670,000 thousand) of con-tractual amounts under interest rate swap agreements. Interest rate swap transac-tions generally involve the exchange of floating rate for fixed rate interestpayment obligations without an exchange of underlying principal amounts. Thedifferentials to be paid or received under the interest rate swap agreements are ac-crued.
The counterparties to the above financial instrument contracts are major fi-nancial institutions and, therefore, the Company and certain of its subsidiariesare exposed to credit risk in the event of nonperformance by counterparties. How-ever, the Company does not anticipate nonperformance by them.
The Company and certain of its subsidiaries enter into various financial instru-ment contracts in the normal course of business and in connection with themanagement of their assets and liabilities.
The Company and certain of its subsidiaries enter into foreign currency con-tracts to hedge assets and liabilities denominated in foreign currencies. The con-tracted amounts outstanding as of March 31, 1999 and 2000 were ¥105,022million and ¥91,627 million ($889,583 thousand), respectively. Gains or losseson those contracts used to hedge existing assets and liabilities are recognized inincome currently.
In connection with short-term borrowings and long-term indebtedness, theCompany and certain of its subsidiaries have used interest rate swap agreementsas a means of managing their interest exposure; at March 31, 1999 and 2000,

47
15. COMMITMENTS AND CONTINGENT LIABILITIESAt March 31, 2000, Ricoh had outstanding contractual commitments for acquisi-tion or construction of plant, equipment and other assets aggregating ¥12,174million ($118,194 thousand).
Ricoh is contingently liable for discounted trade notes receivable on a full re-course basis with banks of ¥251 million ($2,437 thousand) as of March 31, 2000.As of March 31, 2000, Ricoh is also contingently liable as guarantor for employ-ees’ housing loans of ¥1,241 million ($12,049 thousand).
Ricoh made rental payments totaling ¥37,160 million in fiscal 1998, ¥46,307
million in fiscal 1999, and ¥43,797 million ($425,214 thousand) in fiscal 2000,under operating lease agreements for office space and machinery and equipment,which are primarily cancelable and renewable.
At March 31, 2000, the Company and certain of its subsidiaries were parties tolitigation involving routine matters, such as patent rights. In the opinion of man-agement, the ultimate liability, if any, resulting from such litigation will not ma-terially affect the consolidated financial position or the results of operations ofRicoh.
16. DISCLOSURES ABOUT THE FAIR VALUE OF FINANCIAL INSTRUMENTS(a) Cash and cash equivalents, Time deposits, Trade receivables,Short-term borrowings, Current maturities of long-term indebted-ness, Trade payables and Accrued expenses The carrying amounts approximate fair values because of the short maturities ofthese instruments.
(b) Marketable securities and Investment securities The fair value of the marketable securities and investment securities is principallybased on quoted market price.
(c) Cash deposits for assignment of debt securitiesThe fair value of the long-term cash deposits is based on the present value of future cash flows using estimated interest rates and maturities, discounted usingestimated market discount rates (see Note 9).
(d) Long-term indebtednessThe fair value of each of the long-term indebtedness instruments is based on thequoted price in the most active market or the present value of future cash flowsassociated with each instrument discounted using the current borrowing rate forsimilar instruments of comparable maturity.
(e) Interest rate swap agreementsThe fair value of interest rate swap agreements is estimated by obtaining quotesfrom brokers.
(f) Foreign currency contractsThe fair value of foreign currency contracts (used for hedging purposes) is esti-mated by obtaining quotes from brokers.
The estimated fair value of the financial instruments as of March 31, 1999and 2000 is summarized as follows:
Millions of yen
Marketable securities and Investment securitiesCash deposits for assignment of debt securitiesLong-term indebtednessInterest rate swap agreements, netForeign currency contracts—net credit
2000Estimatedfair value
$ 1,529,641–
(3,686,670)26,06820,408
Carryingamount
$ 1,529,641–
(2,989,922)(456)
22,466
Estimatedfair value
¥ 157,553–
(379,727)2,6852,102
Carryingamount
¥ 157,553–
(307,962)(47)
2,314
Estimatedfair value
¥ 143,24852,763
(363,377)2,018
(2,276)
Carryingamount
¥ 143,24852,210
(344,580)12
(1,462)
1999 2000
Thousands ofU.S. dollars
LimitationsFair value estimates are made at a specific point in time, based on relevant mar-ket information and information about the financial instrument. These estimatesare subjective in nature and involve uncertainties and matters of significant judg-
ment and therefore cannot be determined with precision. Changes in assump-tions could significantly affect the estimates.

48
17. SEGMENT INFORMATIONThe operating segments presented below are the segments of Ricoh for which sep-arate financial information is available and for which income (or loss) before in-come taxes is evaluated regularly by Ricoh’s management in deciding how toallocate resources and in assessing performance. The accounting policies of thesegments are substantially the same as those described in the summary of signifi-cant accounting policies, as discussed in Note 1.
Ricoh’s operating segments are comprised of office equipment, includingcopiers and related supplies, communications and information systems, and oth-ers, including optical equipment and electronic devices.
The following tables present certain information regarding Ricoh’s operatingsegments and operations by geographic areas as of March 31, 1998, 1999 and2000 and for the periods then ended.
Sales—Office equipmentOtherIntersegment transactionConsolidated
Operating expenses—Office equipmentOtherIntersegment transactionUnallocated expenseConsolidated
Operating income—Office equipmentOtherEliminationConsolidated
Other expenses
Income before minority interests and equity in earnings of affiliates
Thousands ofU.S. dollars
2000
$ 12,165,7281,917,379
(33,039)$ 14,050,068
$ 10,919,1751,858,709
(33,107)441,980
$ 13,186,757
$ 1,246,55358,670
(441,912)$ 863,311
$ (179,884)
$ 683,427
2000Millions of yen
¥ 1,253,070197,490
(3,403)¥ 1,447,157
¥ 1,124,675191,447
(3,410)45,524
¥ 1,358,236
¥ 128,3956,043
(45,517)¥ 88,921
¥ (18,528)
¥ 70,393
1999
¥ 1,250,938179,084
(4,023)¥ 1,425,999
¥ 1,139,690175,239
(4,049)41,572
¥ 1,352,452
¥ 111,2483,845
(41,546)¥ 73,547
¥ (20,493)
¥ 53,054
1998
¥ 1,226,670180,756
(4,078)¥ 1,403,348
¥ 1,096,894179,343
(3,924)41,328
¥ 1,313,641
¥ 129,7761,413
(41,482)¥ 89,707
¥ (21,279)
¥ 68,428
(a) Operating Segment Information

Thousands ofU.S. dollars
20002000Millions of yen
19991998
49
(b) Geographic InformationSales which are attributed to countries based on location of customers and long-lived assets for the years ended March 31, 1998, 1999 and 2000 are as follows:
Sales—JapanThe AmericasEuropeOtherConsolidated
Long-lived assets—JapanThe AmericasEuropeOtherConsolidated
Thousands ofU.S. dollars
2000
$ 8,477,3792,244,4762,509,854
818,359$ 14,050,068
$ 2,213,398266,893218,049108,553
$ 2,806,893
2000Millions of yen
¥ 873,170231,181258,51584,291
¥ 1,447,157
¥ 227,98027,49022,45911,181
¥ 289,110
1999
¥ 820,975239,623283,37382,028
¥ 1,425,999
¥ 249,49433,65825,96213,256
¥ 322,370
1998
¥ 831,339230,342252,04289,625
¥ 1,403,348
¥ 263,89038,54420,43621,639
¥ 344,509
Total assets—Office equipmentOtherEliminationCorporate assetsConsolidated
Expenditure for segment assets—Office equipmentOtherCorporate assetsConsolidated
Depreciation—Office equipmentOtherCorporate assetsConsolidated
$ 9,372,0001,563,272
(72,903)4,121,321
$ 14,983,690
$ 503,07853,9909,495
$ 566,563
$ 524,71866,38810,311
$ 601,417
¥ 965,316161,017
(7,509)424,496
¥ 1,543,320
¥ 51,8175,561
978¥ 58,356
¥ 54,0466,8381,062
¥ 61,946
¥ 1,050,067161,246
(7,690)424,394
¥ 1,628,017
¥ 61,6267,3701,473
¥ 70,469
¥ 57,0338,8871,536
¥ 67,456
¥ 1,065,918181,375(10,487)423,690
¥ 1,660,496
¥ 83,8448,5641,709
¥ 94,117
¥ 51,2189,1031,650
¥ 61,971
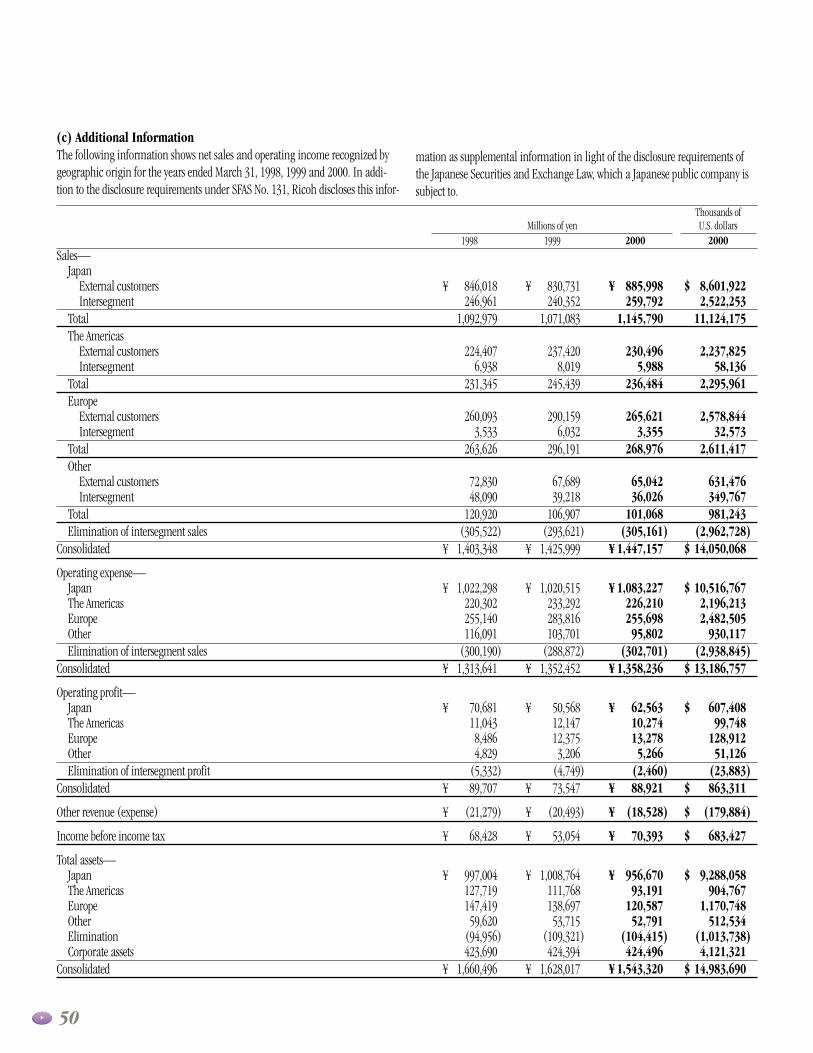
50
(c) Additional InformationThe following information shows net sales and operating income recognized bygeographic origin for the years ended March 31, 1998, 1999 and 2000. In addi-tion to the disclosure requirements under SFAS No. 131, Ricoh discloses this infor-
mation as supplemental information in light of the disclosure requirements ofthe Japanese Securities and Exchange Law, which a Japanese public company issubject to.
Sales—Japan
External customersIntersegment
TotalThe Americas
External customersIntersegment
TotalEurope
External customersIntersegment
TotalOther
External customersIntersegment
TotalElimination of intersegment sales
Consolidated
Operating expense—JapanThe AmericasEuropeOtherElimination of intersegment sales
Consolidated
Operating profit—JapanThe AmericasEuropeOtherElimination of intersegment profit
Consolidated
Other revenue (expense)
Income before income tax
Total assets—JapanThe AmericasEuropeOtherEliminationCorporate assets
Consolidated
Thousands ofU.S. dollars
2000
$ 8,601,9222,522,253
11,124,175
2,237,82558,136
2,295,961
2,578,84432,573
2,611,417
631,476349,767981,243
(2,962,728)$ 14,050,068
$ 10,516,7672,196,2132,482,505
930,117(2,938,845)
$ 13,186,757
$ 607,40899,748
128,91251,126
(23,883)$ 863,311
$ (179,884)
$ 683,427
$ 9,288,058904,767
1,170,748512,534
(1,013,738)4,121,321
$ 14,983,690
2000Millions of yen
¥ 885,998259,792
1,145,790
230,4965,988
236,484
265,6213,355
268,976
65,04236,026
101,068(305,161)
¥ 1,447,157
¥ 1,083,227226,210255,69895,802
(302,701)¥ 1,358,236
¥ 62,56310,27413,2785,266
(2,460)¥ 88,921
¥ (18,528)
¥ 70,393
¥ 956,67093,191
120,58752,791
(104,415)424,496
¥ 1,543,320
1999
¥ 830,731240,352
1,071,083
237,4208,019
245,439
290,1596,032
296,191
67,68939,218
106,907(293,621)
¥ 1,425,999
¥ 1,020,515233,292283,816103,701
(288,872)¥ 1,352,452
¥ 50,56812,14712,3753,206
(4,749)¥ 73,547
¥ (20,493)
¥ 53,054
¥ 1,008,764111,768138,69753,715
(109,321)424,394
¥ 1,628,017
1998
¥ 846,018246,961
1,092,979
224,4076,938
231,345
260,0933,533
263,626
72,83048,090
120,920(305,522)
¥ 1,403,348
¥ 1,022,298220,302255,140116,091
(300,190)¥ 1,313,641
¥ 70,68111,0438,4864,829
(5,332)¥ 89,707
¥ (21,279)
¥ 68,428
¥ 997,004127,719147,41959,620
(94,956)423,690
¥ 1,660,496

51
Research and development costsAdvertising costs
18. RESEARCH AND DEVELOPMENT EXPENSES AND ADVERTISING COSTS
The following amounts were charged to costs and expenses for the three years ended March 31, 2000:
Thousands ofU.S. dollarsMillions of yen
$ 645,864156,126
¥ 66,52416,081
¥ 66,77715,555
1999
¥ 69,98822,033
1998 20002000
Corporate assets consist primarily of cash and cash equivalents and mar-ketable securities maintained for general corporate purposes.
Intersegment sales between geographic areas are made at cost plus profit.Operating income by geographic area is sales less expense related to the
area’s operating revenue.No single customer accounted for 10% or more of the total revenues for the
periods ended March 31, 1998, 1999 and 2000.

52
To the Shareholders and the Board of Directorsof Ricoh Company, Ltd.:
We have audited the accompanying consolidated balance sheets of RICOH COMPANY, LTD. (a Japanese corpo-ration) and consolidated subsidiaries as of March 31, 1999 and 2000, and the related consolidated statementsof income, shareholders’ investment and cash flows for each of the three years in the period ended March 31,2000, expressed in yen. These financial statements are the responsibility of the Company’s management. Ourresponsibility is to express an opinion on these financial statements based on our audits.
We conducted our audits in accordance with generally accepted auditing standards in the United States ofAmerica. Those standards require that we plan and perform the audit to obtain reasonable assurance aboutwhether the financial statements are free of material misstatement. An audit includes examining, on a test ba-sis, evidence supporting the amounts and disclosures in the financial statements. An audit also includes assess-ing the accounting principles used and significant estimates made by management, as well as evaluating theoverall financial statement presentation. We believe that our audits provide a reasonable basis for our opinion.
In our opinion, the consolidated financial statements referred to above present fairly, in all material respects,the financial position of Ricoh Company, Ltd. and its consolidated subsidiaries as of March 31, 1999 and 2000,and the results of their operations and their cash flows for each of the three years in the period ended March 31,2000, in conformity with accounting principles generally accepted in the United States of America (see Note 2).
In our opinion, the amounts translated into U.S. dollars and presented in the accompanying consolidated financial statements have been computed on the basis set forth in Note 3.
Tokyo, JapanJune 29, 2000
Report of Independent Public Accountants

53
Senior ManagementAs of June 29, 2000
Board of Directors
Chairman and Chief Executive OfficerHiroshi Hamada
President and Chief Operating OfficerMasamitsu Sakurai
Executive Managing DirectorsHaruo Kamimoto*Tatsuo Hirakawa*Naoto Shibata*Koichi Endo*
Managing DirectorsMasaaki Iida*Masami Takeiri*Makoto Hashimoto*Masayuki Matsumoto*
DirectorsJosei Itoh(Chairman of Nippon Life Insurance Company)
Nobuo Mii(Managing Partner of IGNITE Group)
Corporate Auditors
Hisaaki KogaHideyuki TakamatsuMinoru TajimaKatsumi YamamotoKenji Matsuishi
Executive Officers
Executive Vice PresidentsTaisaburo HomaeHisao Yuasa
Senior Vice PresidentsTerumoto NonakaKiyoshi SakaiTadatoshi SakamakiTakashi NakamuraKenji HatanakaEtsuo KobayashiMasami YoneyamaHiroshi TategamiHideko KuniiKazunori AzumaKunio TaniguchiShiroh Kondoh
Group Executive Officers
Senior Vice PresidentsShuichiro HabaItsuo KawajiKoji InoueKeiji SugitaYoshinori SakataKatsumi YoshidaPeter E. HartYuji InoueKazuo Togashi
*Concurrently serving as Executive Vice Presidents

54
Ricoh’s Global NetworkAs of March 31, 2000
Japan
ProductionTohoku Ricoh Co., Ltd.Ricoh Elemex CorporationRicoh Unitechno Co., Ltd.Hasama Ricoh, Inc.Ricoh Microelectronics Co., Ltd.Ricoh Keiki Co., Ltd.
Sales and OtherTokyo Ricoh Co., Ltd.Osaka Ricoh Co., Ltd.Ricoh Technosystems Co., Ltd.NBS Ricoh Co., Ltd.Ricoh Logistics System Co., Ltd.Ricoh Leasing Company, Ltd.Ricoh San-ai Service Co., Ltd.
The Americas
Production
Mexico Ricoh Industrial de Mexico, S.A. de C.V.
United States Ricoh Electronics, Inc.
Sales and Other
Argentina Ricoh Argentina S.A.
Brazil Gestetner do Brazil S.A.
Canada Ricoh Canada Inc.
Colombia Gestetner Colombia S.A.
Mexico Ricoh Mexicana, S.A. de C.V.
Peru Gestetner S.A.
Puerto Rico NRG Distribution Corporation
United States Ricoh CorporationRicoh Finance Corporation Ricoh Silicon Valley, Inc.Ricoh Latin America, Inc. Savin Corporation
Uruguay Gestetner LimitadaRicoh Latin America Distribution Center S.A. Ricoh South America Distribution Center S.A.
Venezuela Gestetner S.A.

55
Asia and Oceania
Production
China Ricoh Asia Industry (Shenzhen) Ltd. Ricoh Dianzhuang (Shenzhen) Electronics Co., Ltd. Ricoh International (Shanghai) Co., Ltd.Shanghai Ricoh Facsimile Co., Ltd. Dong Guan Tailien Optical Co., Ltd.
Korea Sindo Ricoh Co., Ltd.
Taiwan Taiwan Ricoh Co., Ltd.
Sales and Other
Australia Ricoh Australia Pty, Ltd. Hanimex Pty, Limited Rabbit Photo Holdings Limited
China Ricoh Electronic Technology Ltd. (China) Ricoh Electronic Technology Ltd. (Beijing)
Hong Kong Ricoh Hong Kong Ltd.Ricoh Asia Industry Ltd.Ricoh Photo Products (Asia) Ltd. Ricoh Component (H.K.) Ltd. Guastalla Trading Co., Ltd. Gestetner China Ltd.
India Ricoh India LimitedGestetner (India) Limited
Malaysia Ricoh Malaysia Sdn. Bhd.
New Zealand Ricoh New Zealand LimitedHanimex (NZ) Limited Camera House Limited Viko New Zealand Limited
Philippines Ricoh Philippines, Inc.
Singapore Ricoh Asia Pacific Pte. Ltd.Ricoh Singapore Pte Ltd.
Thailand Ricoh Thailand Ltd.
Europe, Africa, and the Middle East
Production
France Ricoh Industrie France S.A.
United Kingdom Ricoh UK Products Ltd. Ricoh Wellingborough Products Ltd.GR Advanced Materials Ltd.
Sales and Other
Austria Ricoh Austria GmbHGestetner Buromaschinen-Verkaufsgesellschaft m.b.H
Belgium NRG Belgium S.A.
Denmark Gestetner A/S
France Ricoh France S.A. NRG France S.A. Rex-Rotary S.A.
Germany Ricoh Deutschland GmbH NRG Office System GmbH
Guernsey NRG International Limited
Hungary Ricoh Hungary Kft.
Ireland Gestetner Ireland Limited
Israel Gestetner (Israel) Limited
Italy Ricoh Italia S.p.A. NRG Italia S.p.A.
Netherlands Ricoh Europe B.V. Ricoh Nederland B.V. Ricoh Finance Nederland B.V. Kulk & Kramer Kantoorsystemen BV NRG Benelux BV
Norway Ricoh Norge A.S.
Poland Ricoh Polska Sp.zo.o.
Russia Mitsui-Ricoh CIS Ltd.
South Africa Gestetner (Proprietary) Limited
Spain Ricoh España S.A.NRG Comunicaciones S.A.
Sweden Gestetner Svenska Aktiebolag
United Kingdom Ricoh UK Ltd. Gestetner Holdings PLC Midland Copying Consultants Limited NRG Group Limited

56
Corporate Data
Ricoh Company, Ltd.
Corporate Headquarters15-5, Minami-Aoyama 1-chome,Minato-ku, Tokyo 107-8544, JapanTel: (81) 3-3479-3111Fax: (81) 3-3403-1578
Date of EstablishmentFebruary 6, 1936
Number of Shares Authorized1,000,000,000 shares
Number of Shares Issued (as of March 31, 2000)692,082,959 shares
Stock ListingsTokyo, Osaka, Nagoya, Fukuoka,Sapporo, Kyoto, Amsterdam, Frankfurt, Paris
Independent Public AccountantsArthur Andersen
Transfer Agent for Common StockThe Chuo Mitsui Trust and Banking Co., Ltd.7-1, Kyobashi 1-chome,Chuo-ku, Tokyo 104-0031, Japan
Depositary and Agent for American Depositary ReceiptsThe Bank of New York101 Barclay Street, 22 WestNew York, NY 10286, U.S.A.Tel: 212-815-2042US toll free: 1-888-269-2377Website: http://www.bankofny.com/adr
Listing in the Amsterdam Security Account System on Amsterdam Stock ExchangeNominee Amsterdam Stock Exchange
Depositaries and Agents for Global Bearer CertificatesDeutscher Kassenverein Aktiengesellschaft (DKV)Commerzbank Aktiengesellschaft
Clearing House and Sponsoring Banks for Listing on Bourse de ParisSociété Interprofessionnelle pour la Compensation des Valeurs Mobilières (SICOVAM)Crédit LyonnaisNomura France
For further information and additional copies of our annual report and otherpublications, please write to the Public Relations Department at our corporateheadquarters.


The covers and pages 1 to 20 of this publication were printed on100%-recycled paper; the paper on pages 21 to 56 is 60%-recycled.
Printed in Japan 0006
RICOH CORPORATION
5 Dedrick Place, West Caldwell, New Jersey 07006, U.S.A. Tel: (1) 973-882-2000Fax: (1) 973-882-2506
Website: http://www.ricoh-usa.com/
RICOH EUROPE B.V.
Groenelaan 3, P.O. Box 114, 1186 AA
Amstelveen, NetherlandsTel: (31) 20-5474111Fax: (31) 20-5474154
Website: http://www.ricoh-europe.com/
RICOH ASIA PACIFIC PTE. LTD.
#15-01/02 The Heeren, 260 Orchard Road, Singapore 238855Tel: (65) 830-5888Fax: (65) 830-5830
Website: http://www.ricoh.com.sg/
RICOH HONG KONG LTD.
21/F., Tai Yau Building,181 Johnston Road, Wan Chai, Hong Kong
Tel: (852) 2862-2888Fax: (852) 2866-1120
Website: http://www.ricoh.com.hk/
RICOH COMPANY, LTD.
15-5, Minami-Aoyama 1-chome, Minato-ku, Tokyo 107-8544, Japan
Tel: (81) 3-3479-3111Fax: (81) 3-3403-1578
Website: http://www.ricoh.co.jp/