Embed Size (px)
Citation preview

SOLUTION MINING RESEARCH INSTITUTE
New Address:
1745 Chris Ct. Deerfield, IL 60015-2079 - USA Phone: 847-374-0490 Fax: 847-374-0491 E-mail: [email protected]
A TENTATIVE EVALUATION OF THE MIT
MEETING PAPER
HEREST P., BERGUES 1., BROUARD B. (LMS, Ecole Polytechnique) DURUP G., GUERBER B. (Gaz de France)
Summary
In order to check the validity of the nitrogen-leak MIT, a gas-brine interface was
lowered to half-height of a cavern well in order to minimize the risk of (real) gas leak.
The cavern, which had been leached out 14 years ago, has stabilized; creep, percolation or
thermal effects can be considered negligible. Mock leaks were then provoked by injecting
or withdrawing known quantities of nitrogen or brine through the well-head. The test
gives clear evidence of the so-called barometric effect; measured and calculated values of
the gas-brine interface displacement and leaks were found to be in good agreement.
Houston SMRI Spring Meeting, 1996 April 14-17

-2-
Acknowledgements
The authors are deeply indebted to Fritz CROTOGINO and Rod 1HIEL who spared no
time in providing fruitful comments and discussions during the preparation of the test.
The test would not have been possible without dedicated help from Gaz de France Etrez
staff (MM. CHARVET, GA YDON and MAZUIR) and from Ecole Poly technique staff
(M. LE BRAS).
INTRODUCTION
The nitrogen-leak test, thereafter called the "MIT" (Mechanical Integrity Test),
basically consists of injecting some gas (nitrogen, in many cases, because it is inert and
inexpensive) in a closed and pre-pressurized cavern and then forcing the brine/gas
interface down to a level slightly lower than the last cemented casing shoe. In general, the
gas is contained in an annular space between the casing and a central brine-filled tubing.
Once the interface has equilibrated, its movements are monitored: an upward movement
indicates a loss of nitrogen through the casing or the casing shoe. The simplest
interpretation methodology consists in tracking the gas-brine interface with a wireline
logging tool (see Figure 1).
The measured interface upward rate (in ft/day, for instance) is multiplied by the
horizontal cross section of the annular space (in ft2) to obtain a nitrogen leak rate in ft3/day
[see, for example, CH2M Hill, 1995]. A more accurate analysis is provided by taking into
account the well temperature and its evolution during the test. A complete overview can be
found in Crotogino, 1995; and assessment of precision methods has been discussed by
Thiel, 1993.
In a previous paper, presented at the 1995 SMRI Fall Meeting in San Antonio,
Texas, Gaz de France and Ecole Poly technique discussed the nitrogen-leak test and
proposed the following conclusions
1. The brine/gas interface rise-rate underestimates the real leak by a factor that can be
as large as two. This phenomenon is very similar to the so-called "barometric
effect": when brine rises in the annular space and replaces leaked gas, the weight

-3-
of the fluid column in the annular space increases, resulting in a small pressure
build-up in the cavern that enlarges the cavern volume and mitigates the interface
rise.
2. Several phenomena, such as brine thermal expansion, transient and steady-state
cavern creep and brine percolation, can modify the interface rate even in the case
of no real leak (see, also, Crotogino, 1995, attachment 1).
EVALUATING THE MIT
Although the conclusions cited above seemed to be based on consistent
calcultations, in the beginning of 1996, Gaz de France and Ecole Poly technique decided to
perform an in-situ test with the following objectives:
(1) to give clear evidences of the "barometric effect"
(2) to compare theoretical predictions with actual measurements in well-controlled
conditions - more precisely, to simulate a gas leak in a nitrogen-filled annular
space by withdrawing a known quantity of gas at the well head and checking to
determine if this quantity could be back-calculated through the pressure variations
measured at the well-head.
The first tasks were to select both a cavern and operating conditions such that:
(1) the (real) gas leak would presumably be extremely small; and
(2) the external factors influencing the interface rise-rate would be negligible or well
known.
TEST PREPARATION
For various reasons, which will be noted below, the Ez 53 cavern was selected.
A relatively small cavern (7000 to 8000 cubic meters i.e. 44,000 to 50,000 bbls), Ez 53 is
seated at moderate depth (3120 ft or 950 meters). Solution-mining operations on this
cavern ceased in July 1982; since this period, the cavern has been at rest except for a 91-
week pressure build-up period in 1983-1985. Several tests have been performed on this
cavern and in this site; much information is available concerning the thermal, mechanical,
hydraulic behavior of the cavern.

-4-
The fIrst objective of the test was fulfIlled as follows: first the gas-brine interface
was set at a depth of 400 meters (1310 ft), above the 13 3/8" casing shoe in order to
minimize gas leaks through the casing. The gas was separated from the rock mass by a
double barrier consisting of two cemented casings (see Figure 2). This settlement
necessitated maintaining the gas pressure at a relatively low level in the upper part of the
casing. Second, knowing that the annular space (which was to be filled with nitrogen
during the test) was filled with fuel oil since 1982, we measured the fuel-oil pressure in
the annular space, a few days before the test began. The pressure proved to be slightly
higher than it had been 13 years before (3.5 MFa instead of 3.4 MPa i.e. 508 psi instead
of 493 psi). The fuel oil was then withdrawn. Although its volume had not been carefully
measured, it appeared to be roughly the same as measured more than 10 years before.
These two facts gave clear evidence that the annular space had remained tight during a
long period, in spite of a relatively severe excess of pressure in the upper part.
Accordingly, tubing and casing were expected to prevent any gas leak during the nitrogen
leak test (as a matter of fact, the internal 7" tubing appeared to be slightly leaky.)
MINIMIZING THE EFFECTS OF EXTERNAL FACTORS
The second objective -to minimize the effects of parasite phenomena on the
interface level- was met by the very choice of the Ez53 cavern
1. The volume of this cavern is Y = 7000 m3 to 8000 m3 (44,000 to 50,000 bbls) which
signifies that the characteristic time after which 75 % of the initial temperature gap
between rock-mass and cavern brine was resorbed is tc = y2{3/(4 k) = 1 year (Berest et
al., 1995). In other words, 14 years after leaching, the brine temperature in the cavern
stabilized, and the effects of thermal expansion became negligible (See Figure3; the
temperature measurements show a fairly homogeneous temperature in the cavern,
which gives clear evidence of effective thermal convection stirring up the brine in the
cavern.)
2. Brine flow expelled by the Ez 53 cavern has been carefully measured several times
since the end of leaching (Hugout, 1984; Berest et al., 1994). It was 200 liters per day
(1.26 bbls) under halmostatic pressure a few weeks after the leaching stopped, 50
liters per day (0.31 bbls) one year later, and 5.5 liters per day (0.035 bbls) 8.5 years
later. We measured the flow during the Fall of 1995- i.e., 13.5 years after the
leaching end; the average flow was 5.05 liters per day (0.032 bbls) under halmostatic
pressure (see Figure 4) or, when compared with the cavern volume, 2.5 10-4 per year
(approximately). This flow is believed to be generated by cavern creep; it would slow
down if the cavern pressure were increased.

-5-
3. Brine percolation was measured in a neighboring well (Ez 58) by Durup (1994). He
estimated the penneability to be K = 6 10-20 m2. If this figure is accepted, the steady
state brine flow in the Ez 53 cavern percolating from the cavern through the rock-salt
increases by 0.64 liters per day (0.004 bbls) when the brine pressure increases by I
MPa.(145 psi) When the adverse effect of pressure increase on brine outflow,
provoked by creep, is considered, it is clear that an equilibrium can be reached when
percolation flow exactly balances cavern shrinkage due to creep (see Berest and
Brouard, 1995). Calculations suggest that the equilibrium would be met if the pressure
in the cavern exceeded the brine column weight (11.4 MPa or 1653 psi) by
approximately 3.5 MPa (508 psi). This figure was selected as the test pressure.
Figure 5 shows the idealized pressure-depth curve both in the annular space and in
the central tubing. In reality, the distribution of pressure was a bit different due to the
various injection-withdrawal phases
The annular space volume is 14.7 liters per meter (003bbls/ft) except for the upper
part (the 32 first meters Le. 105 ft) in which the 9 5/8" diameter enlarges into a 13 3/8"
diameter, resulting in an additional volume of 1.2 m3 (7.5 bbls). Before the test, the
annular space and the cavern neck were filled with fuel oil; with a total fuel oil volume of
approximately 30 m3 (190 bbls).
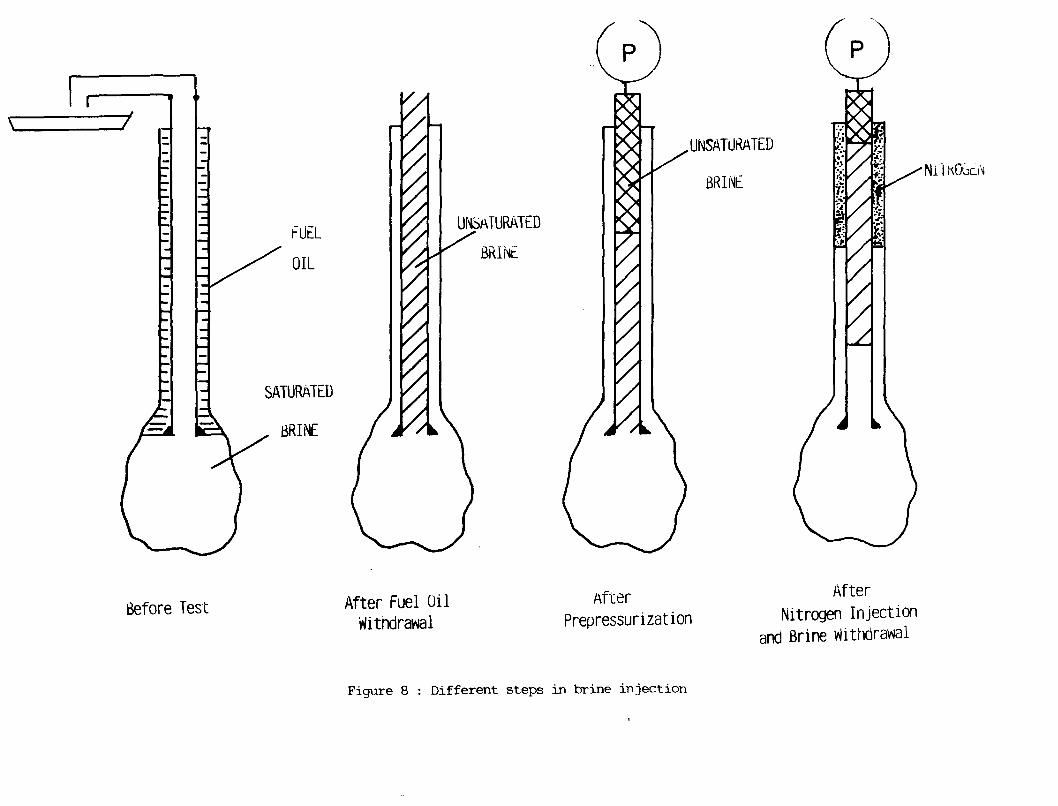
At the beginning of the test, the fuel oil was removed by injecting an equivalent
volume of not fully saturated brine into the central tubing, whose volume is 20.3 liters per
meter (0.42 bbls/ft). After removal, the central tubing and the annular space were both
filled with brine, but brine densities were suspected to be different. An additional 9752
liters volume (61.3 bbls) of unsaturated brine was then injected in the closed cavern on
February 2, in order to increase its pressure by 3.5 MPa (508 psi).
The cavern compressibility at this stage proved to be ~V = 2.77 m3/MPa = 0.12 bblslpsi
(see Figure 6), which is a bit smaller than expected (In this site, the cavern compressibility
factor has been measured several times and the value ~ = 4 10-4 MPa-1 (2.8 10-6 psi-l) is
commonly accepted. This would lead to a cavern compressibility of ~V= 410-4 MPa-1 x
8000 m3 = 3.2 m3/MPa = 0.14 bbls/psi. The discrepancy proves that the cavern volume is
probably overestimated and that the injected brine was unsaturated).

-6-
From February 26 to February 29, 633 kg (1400 lbs) of nitrogen were injected in 6
steps; brine was withdrawn from the central tubing after each step so that the pressure in
the cavern remained roughly constant. At the end of this phase, the nitrogen/brine
interface was lowered to a depth of 399.5 meters (1310 ft) and brine densities in the
central tubing were distributed as shown on Figure 8. Then the stabilization phase began.
It is imponant to notice here that
(1) since February 29, the cavern pressure remained roughly constant (the tubing
pressure at the well head is about 3.5 MPa i.e. 508 psi); and
(2) in the central tubing, the brine density is not uniform, due to various
injection/withdrawal phases. In the upper part ot the tubing the density is as low
as 1125 kg/m3 (394 lbs/bbl) instead of 1200 kg/m3 (421 lbs/bbl) in the lower
part, which is filled with saturated brine. These differences cause some concern
for test interpretation.
STABILIZATION PERIOD
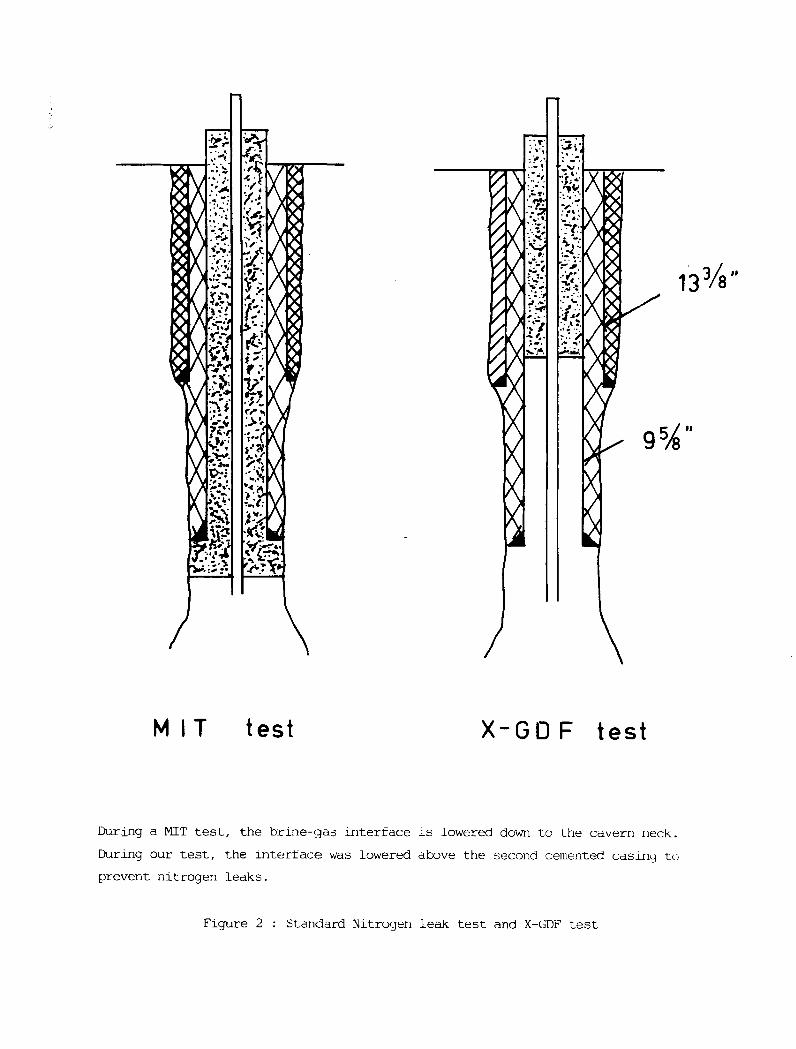
As indicated above, the stabilization phase began at the end of the prepressurization
period and ended when the tests were performed. During this phase the annular-space
pressure decreased from 7.57 MPa=1098 psi (February 29) to 7.30 MPa=1059 psi
(March 13) and the tubing pressure increased from 3.42 MPa=496 psi (February 29) to
3.57 MPa=518 psi (March 13); See Figure 7. After a few days, a leak through the 7"
tubing separating the gas annular space and the brine tubing was suspected. It was
decided to vent the nitrogen in the central tubing. This was done on March 13, resulting in
a pressure drop in both the annular space and the tubing. A second venting was performed
just before the test on March 18, and several smaller ventings were performed during the
test itself. The nitrogen leak from the annular to the tubing was estimated to be small and
to have little influence during the tests.
TEMPERATURE MEASUREMENT
Changes in the well temperature during the test must be taken into account when
interpreting the nitrogen-leak test, as emphasized by Thiel (1993) and Crotogino (1995).
These changes are especially important after a leaching phase, during which cold fluids
circulate inside the well. In the particular case of the Ez 53 cavern, the leaching phase was
long over when the test was performed; the temperature logs performed before (February
22) and after the stabilization period (March 18) proved to be merely identical, except
perhaps in the lower most part of the tubing (see Figure 9).

-7-
TESTS RESULTS
On March 20, 1996, four tests were performed :
(1) brine withdrawal,
(2) brine injection,
(3) nitrogen withdrawal,
(4) nitrogen injection
The volume of injected or withdrawn fluid was measured as carefully as possible, and the
evolutions of the brine and nitrogen pressures were recorded.
Interface ~easurernent
Before and after each test, a wireline tool was used to monitor the nitrogen/brine interface,
Figure 10. The interface depth was measured using a gamma-gamma logging tool which
provides a density log. The 1" 11/16 tool is composed of a gamma-ray source (Cs137) and
a detector (Thallium crystal, spacing 20") that records back scattered gamma rays. This
recorded radiation (Compton scattering) is a function of the electron cloud encountered by
the emitted radiation, and the electron density is practically proportionnal to the bulk or
fluid density. For each interface measurement, a portion of the well was logged at a 2
mlmin speed (6.6 ft/min). Under such conditions, a resolution of ± 0.1 meters (0.3 ft) can
be achieved.
Brine injection test
Interface depth before injection
Brine pressure before injection
Nitrogen pressure before injection
Amount of injected brine
Interface depth after injection
Brine pressure after injection
Nitrogen pressure after injection
h = 382.3 meters ± 0.1 meters
Pb = 3.065 MPa ± 0.001 MPa
Pg = 7.055 MPa ± 0.001 MPa
eV = 200 liters ± 0.5 liters
h' = 379.5 meters ± 0.1 meters
P'b= 3.132 MPa ± 0.001 MPa
p l
g= 7.090 MPa ± 0.001 MPa

Brine withdrawal test
Interface depth before withdrawal
Brine pressure before withdrawal
Nitrogen pressure before withdrawal
Amount of withdrawn brine
Interface depth after withdrawal
Brine pressure after withdrawal
Nitrogen pressure after withdrawal
-8-
Comment on the brine withdrawal test
h = 379.5 meters ± 0.1 meters
Pb = 3.133 MPa ± 0.001 MPa
Pg = 7.094 MPa ± 0.001 MPa
EV = - 200 liters ± 0.5 liters
h' = 381.9 meters ± 0.1 meters
P'b = 3.128 MPa ± 0.001 MPa
PIg = 7.090 MPa ± 0.001 MPa
During the injection test, brine was pumped into the cavern through a small pump;
the total duration of the test was two hours. Withdrawing the same amount (200 liters i.e.
1.26 bbls) of brine was much faster (700 seconds) and did not allow brine temperature in
the tubing, creep and brine saturation to equilibrate. This explains why the pressures
measured at the end of withdrawal are too high, and not consistent with the values
measured before injection, but are far more consistent one hour later when the nitrogen
injection test begins.
Nitrogen injection test
Interface depth before injection
Brine pressure before injection
Nitrogen pressure before injection
Amount of injected nitro~n
Interface depth after injection
Brine pressure after injection
Nitrogen pressure after injection
Nitrogen withdrawal test
Interface depth before withdrawal
Brine pressure before withdrawal
Nitrogen pressure before withdrawal
Amount of withdrawn nitrogen
Interface depth after withdrawal
Brine pressure after withdrawal
Nitrogen pressure after withdrawal
h = 381.9 meters ± 0.1 meters
Pb = 3.061 MPa ± 0.001 MPa
Pg = 7.060 MPa ± 0.001 MPa
~m = + 9.20 kg ± 0.01 kg
h = 385.8 meters ± 0.1 meters
P'b= 3.082 MPa ± 0.001 MPa
p l
g= 7.117 MPa ± 0.001 MPa
h = 385.8 meters ± 0.1 meters
Pb = 3.082 MPa ± 0.001 MPa
Pg = 7.115 MPa ± 0.001 MPa
~m = - 8.09 kg ± 0.01 kg
h' = 382.1 meters ± 0.1 meters
P'b= 3.065 MPa ± 0.001 MPa
p l
g= 7.065 MPa ± 0.001 MPa

-9-
INTERPRETATION
1. The barometric effect
* Nitrogen withdrawal is considered a "leak". The following describes the effect of this
"leak" on the nitrogen-brine interface
Nitrogen withdrawn Mass
Nitrogen density
Volume of withdrawn nitrogen
Annular cross-section
"Naive" interface rise
Measured interface rise
Measured corrective ratio
M = - 8.09 kg = - 17.84lbs
Pg = 86.8 kg/m3 = 30.43 lbs/bbl
M/Pg = - 9.3 10-2 m3 = -.0.59 bbl
L = 14.7 liters/m = .03 bbls/ft
M/(LPg) = -6.3 meters = - 20.8 ft
- 3.7 m ± 0.1 m = - 12.1 ft ± 0.3 ft
C = 6.3/3.7 = 20.8/12.1 = 1.7
* Nitrogen injection can be considered a "negative leak", which allows for a similar
calculation
Nitrogen injected mass
Nitrogen density
Nitrogen injected volume
Annular cross section
"NaIve" interface descent :
Measured interface descent:
Measured corrective ratio
+ 9.20kg = + 20.28 lbs
86.1 kg/m3 = 30.18 lbs/bbl
+ 1.07 10-1 m3 = 107 liters = 0.67 bbl
14.7 liters/m = .03 bbls/ft
107/14.7 = + 7.3 meters = + 23.8 ft
+ 3.8 m ± 0.1 meter = 12.5 ft ± 0.3 ft
C = 7.3/3.8 = 23.8/12.5 = 1.9
These results give clear evidence of the so-called "barometric effect" (see Berest et al.,
1995) : the interface rise underestimates the leak by a factor which, in the case of this
cavern, is
with Ph = 1181 kg/m3 = 4141bs/bbl
P = Ph + Ph gh = 7.5 MPa = 1088 psi,
L = 1.47 10-2 m2 = 0.3 bbl/ft,
h = 386 m = 1266 ft,
pV = 2.77 10-6 m3.Pa-1 = 0.12 bbl/psi,
C = 1.8
Pg = 86.5 kg/m3 = 30.3 lbs/bbl,
This theoretical prediction of the corrective factor fits the calculated ratios between "nai've"
and "measured" interface rise.

-10-
2. Prediction of interface movements
The interface movements can be deduced theoretically from the pressure variations
measured at ground level. The theoretical calculations are expanded in Berest et al., 1995.
For each of the four tests, we input the interface depth before the test and brine pressure
and nitrogen pressure (before and after the test). These five values allow for back
calculating the amount of brine (or nitrogen) injected (or withdrawn) and the interface
displacement, which can be compared to the measured data.
Note that during a brine injection, for instance, the "measured" displaced nitrogen weight
is nil, because no nitrogen is injected (or withdrawn) during this phase.
Brine injection
calculated measured
interface displacement (m) - 2.83 - 2.8
displaced brine (liters) +227 +200
displaced nitrogen (kg) - 0.70 0
Brine withdrawal
calculated measured
interface displacement (m) +3.19 + 2.4
displaced brine (liters) -249 - 200
displaced nitrogen (kg) +1.04 0
* see: discussion of the brine withdrawal test
Nitrogen injection
calculated measured
interface displacement (m) + 3.49 + 3.8
displaced brine (liters) + 9.5 0
displaced nitrogen (kg) + 9.12 + 9.20

11-
Nitrogen withdrawal
calculated measured
interface displacement (m) - 3.28 -3.7
displaced brine (liters) + 1.2 0
displaced nitrogen (kg) - 8.33 - 8.09
CONCLUSIONS
1. The barometric effect has been clearly proved: when a certain amount of nitrogen is
withdrawn (or injected) the brine-nitrogen interface moves but sweeps a much smaller
volume than the withdrawn (or injected) gas volume.
2. The pressure variations at the well-head, which follow a nitrogen injection/withdrawal,
allow for back-calculating interface displacement and gas injected/withdrawn volume.
3. Based on the results of our investigation, the nitrogen-leak test can be expected to
produce precise and confident results.

-12-
REFERENCES
BEREST P., BLUM P.A., DURUP J.G., NGUYEN MINH D. QUINTANILHA E.M.,
(1994) Long tenn creep in a salt cavern, SMRI, Spring meeting, Houston, Texas.
BEREST P., BROUARD B., (1995), Behavior of sealed solution-mined cavern SMRI
Spring Meeting, New Orleans, Louisiana.
BEREST P., BROUARD B., DURUP G., (1995), Some comments on the MIT test
SMRI Fall Meeting, San Antonio, Texas.
CH2M HILL, Inc. (1995), Technical Manual for external well mechanical integrity testing
class III salt solution mining wells - SMRI.
CROTOGINO F. (1995), SMRI reference for external well mechanical integrity
testing/perfonnance, data evaluation and assessment - SMRI research project report 95-
00015.
DURUP J.G. (1994), Long term test for tightness evaluating with brine and gas in salt,
SMRI Fall Meeting, Hannover, Gennany.
HUGOUT B., Mechanical behavior of salt cavities - In situ tests - Model for calculating
the cavity volume evolution. Second conference the Mechanical Behavior of Salt, R.H.
Hardy and M. Langer ed., Hannover, September 1984.
THIEL W.R. (1993), Precision methods for testing the integrity of solution-mined
underground storages caverns, Seventh Symp. on Salt, VolI,pp.377-383, Elsevier
Amsterdam.

February 22
February 22 to 23
February 23 to 26
February 26 to 27
February 28 to 29
March 1 to 12
March 13
March 13 to 17
March 18
March 19
March 20
March 20 and on
-13-
X GDF test
ftrst temperature log
cavity pressurization to 3.5 MPa (508 psi)
stabilization
three nitrogen injections, two brine withdrawals
three nitrogen injections, four brine withdrawals
stabilization
gas venting from the tubing
second temperature log
stabilization
third temperature log
gas venting brine withdrawal
gas venting brine injection test brine withdrawal test gas injection test gas withdrawal test
stabilization

PROBE
BRINE
Figure 1 Nitrogen leak te~t
9 5~"
MIT test X-GO F test
During a MIT test, the brine-gas interface is lowered down to the cavern fleck.
During our test, the interface was lowered above the :second cemented casin'::l tu
prevent nitrogen leaks.
Figure 2 Standard Nitrogen leak test and X-Got' test

Figure 3 : Brine temperature in the cavern
Temperature (C)
Depth (m) . r-r-r-ro-r.,..--,-r4.--4,.,.. 2--,--,...,-.---.-rr4--.-4".4--.-r-r---,-r-,,.,.4.,..,4rr• 6--r-r-r--.-r-r---r4,.,4,.,.. 8-.-.-r--.-r-r--.4,.,5,.,.. 0....,...-,--, Depth (ft)
910 1
2983
3013 920
3043
930
3073
940
3103
950
3133
960
3163
970 111.6 111.9 112.3 112.6 113
Temperature (F)
Ez53 Sonar: July 2, 1982 Temperature log: Feb 22,1996

.-en l-
a> ;=: -~ 0
'+= "'C a> ....... co ::::l E ::::l ()
Figure 4 - Evolution of the cumulated flow Ez53 from October 13 to November 7, 1995
120 5.05 liters/day = 0.032 bbls/day
100
80 6
-6;:. •
60
40
20
o ~~~~~~~~~~~~~~~~~~~~~~~ o 2 4 6 8 10 12 14 16 18 20 22 24 26
Time (days)

200m
800m
1000m
500psi
I 3.5MPa.
lOOOpsi
I 7.6 MPa.
1500psi
I 2000psi
I
NITROGEN 7 II x 9"518
15 MPa.
2500psi I
Figure 5 - Idealized Pres~ DutributioN in the 7" tQbq and 7 "x9 "518 ~ sp~

1.0
0.9
0.8
-co a.. ~ 0.7 -~ ::::s ~ 0.6 ~ a..
0.5
0.4
0.3
Figure 6 - MIT on Ez53 - PRESSURIZATION Evolution of the pressure at the well head
~v = 2.77 m3/MPa = 0.12 bbls.lpsi.
o . 2 '----'--'--"---'-----'--~-'---'--_'___'__.l...--J'-----'-----'------'-______"_____'____L______'_____~__'___'__'_________1_______'__
62720 63020 63320 63620 63920 64220 Time since midnight (seconds)
Figure 7 - MIT on Ez53 - Pressure evolution
\ ... ____ ---JI
Before Test
FUEL
OIL
SATURATED
BRINE
UNSATURATED
After Fuel Oil Withdrawal
BlUNt:
After Prepressurization
Figure 8 : Different steps in brine injection
BRIN!::
After Nitrogen Injection
and Brine Withdrawal

0 5 Depth (m)
100 l
200
300
400
500
600
700 1 1"1 .....,
1"1 1 7 "1
800 7 1 l 1 I ., 7 I 1
900 "1 1
1 .,
l "1 ...,
1000 5 10
Temperature (C)
10 15 20 25 30 35 40 45
February 22 March 18
., "1 ·1
1 1 1 1
...,
11 I "I 1
II "1 1.
1 .. , 1 "I -, "7 "I .,
I., -1 ,
1 -I
15 20 25 30 35 40 45
Temperature (C)
Figure 9 : Two thermographies on Ez 53
(Not the same temperature origin !)
50
50 Depth (tt)
300
600
900
1200
1500
1800
2100
2400
2700
3000
55

.-~ Q)
:::c -
220
210
200
190
180
170
160
150
140
130
120 370 372
Figure 10 - Nitrogen/Brine Interface as measured before and after nitrogen injection
before after
, I" .,' " , ,
, I
I " ~ \ ,,', " ,~ " " \,
:" "
" , ' "
" , ' " , \ I
/~
" " ", ,\ , ,
. " " , "
" III
" "1 I '"l. : 1/ In
, " " " H,
1,'/\ r I,'l, ~, ' , , ,,, I
I I~' " I II "
" " " ,', After " n'l
374
, 1 ,
376
, , , '" 'I, ',\ \1 I
, " 'I' I" ", " " "
I" , , "
" \I
" "
Before
378 380 382
1111/11/ " tI ", , )' II " : : : I "
I I Y I " 1.1 \I I ,II I,
". I It' /1
384 386
,I , ,
Depth below ground level (meters) 388 390