Embed Size (px)
Citation preview
pubs.acs.org/JAFC Published on Web 03/31/2010 © 2010 American Chemical Society
4660 J. Agric. Food Chem. 2010, 58, 4660–4665
DOI:10.1021/jf903495h
Soluble Polysaccharide Composition and myo-InositolContent Help Differentiate the Antioxidative andHypolipidemic
Capacity of Peeled Apples
YAW-BEE KER,† CHIUNG-HUEI PENG,‡ CHARNG-CHERNG CHYAU,*,‡ AND
ROBERT Y. PENG*,‡,§
†Department of Food and Nutrition, and ‡Research Institute of Biotechnology, Hungkuang University,34, Chung-Chie Road, Shalu County, Taichung Hsien, Taiwan 43302, and §Research Institute ofMedical Sciences, Taipei Medical University, 250, Wu-Xing Street, Sin-Yi District, Taipei 106
Many people prefer to eat peeled apples. The present study investigated the composition of soluble
polysaccharides (SP) in peeled apples and its antioxidative and hypolipidemic activity. The yield of
SP ranged 0.43-0.88%, having MW ranging 223-848 kDa. All belonged to peptidoglycans. Among
the fourteen amino acids found, seven were essential amino acids. In addition, sugar analysis
indicated that 50% of apple samples consisted of glucoarabinan, 37.5% comprising taloarabinan
and the remaining 12.5% containing alloglucan. Moreover, SP consisted of a huge amount of myo-
inositol (>5.61%) and uronic acid (>11.7%), which may play a synergistic role in the hypolipidemic
effect. Worth noting, we are the first who reported the presence of talose, allose and fucose in the
apple SP. Conclusively, the biological value of SP is attributable to the differential effect of SP and
the synergistic effect exerted by its unique SP pattern, high myo-inositol and uronic acid contents.
KEYWORDS: Soluble polysaccharide; peptidoglycan; myo-inositol; hypolipidemic; antioxidative
INTRODUCTION
Total dietary fiber of apple, carrot, cauliflower, cabbage, pea,plum, and guava is reported to range 14.68-78.21% on the drybasis (1). Upon enzymatic hydrolysis, apple pomace undergoessaccharification and releases mono- and oligosacccharides andsome polysaccharides (SP) in its water-soluble fraction (2).
Dietary fibers provide greater inhibition of starch digestion,glucose absorption, and glycemic response following starch load-ing.Most fiber sources are able to decrease the fasting serum levelof cholesterol and triglycerides. Simultaneously, the fecal transittime is shortened, the fecal values are raised, and the β-glucur-onidase activity in intestinal segment contents and feces islowered (3). High-fiber diets are beneficial for prevention ofconstipation and the lowering the risk of digestive conditions,reducing blood cholesterol levels, controlling blood sugar levels,aiding in weight loss, and minimizing the risk of colorectalcancer (4). Certain beneficial effects of dietary fibers may bemediated by short-chain fatty acids produced during anaerobicfermentation in the colon (5). Consumption of viscous indiges-tible SP may change the exocrine pancreatic biliary function anddepress the process of digestion and absorption, and as compen-sation, a hyperplasia/hypertrophy of digestive organs and in-creased secretion of digestive juice could be assessed (6). More-over, SP can readily be fermented and degraded by the intestinal
microflora to produce smaller oligosaccharides acting as immuneenhancers (7), thus underlying the postdigestion effect of dietaryfibers on physiological and biochemical changes. In Westernsociety, apples are usually considered to be the best nutraceuticfruits in the prevention of chronic diseases. This study examinedthe composition of SP of commonly consumed apple cultivars inthe market and compared their antioxidative and hypolipidemicbioactivities.
MATERIALS AND METHODS
Origin and Species of Apples. Eight species of apples were collectedfrom the local market, thirty for each. These cultivars involved Malusdomestica “Fuji” (Japan origin, designated sample A1), weighing within100.7( 5.8 g;Malus domestica “Jonagold” (Korea origin, designatedA2),with weight range 100.1 ( 6.2 g; Malus domestica “Golden Delicious”(Japan origin, designated A3), weighing within 104.0 ( 6.8 g; Malusdomestica “Gala” (Japan origin, designated A4), weight ranging within100.0 ( 4.7 g; Malus domestica “Arkansas Black” (Japan origin, desig-nated A5), having weight range 101.2 ( 5.6 g; Malus domestica “Fuji”(USA origin, designated A6), weighing within 103.4 ( 6.4 g; Malusdomestica “Granny Smith” (USA origin, designated A7), weight rangingwithin 100.0 ( 6.6 g; andMalus domestica “Red Delicious” (USA origin,designated A8), having weight range 101.0 ( 6.2 g, respectively.
Preparation of SP.According to themethod ofAOAC (1995) (8) andfollowing the instruction given by the manufacturer, the determination ofdietary fibers was carried out using the Fiber Assay Kit (Sigma-Aldrich,St. Louis, MO). Briefly, apples were peeled with a stainless peeling knife.One gram of peeled sample was ground and passed through a mesh #60stainless sieve. To the pulp 40 mL of 0.05MMes-Tris buffer (pH 8.2) and50 μL of thermostable R-amylase (EC 3.2.1.1, A3306, Sigma-Aldrich,St. Louis,MO)were added.The reactionmixturewas heated at 95-100 �C
*To whom correspondence should be addressed. C.-C.C.: e-mail,[email protected]; tel, þ886-4-26318652 ext 5602. R.Y.P.:e-mail, [email protected]; tel, þ886-953-002-092 (mobile), þ886-2-27585767.
Article J. Agric. Food Chem., Vol. 58, No. 8, 2010 4661
in a water bath for 30 min. When cooled to 60 �C, 100 μL of threonineendopeptidases (Protease EC3.4.25, Sigma-Aldrich, St. Louis, MO) and5 mL of 0.561 N HCl were added. The heating was continued with gentleshaking at 60 �C for 30 min. The pH value was adjusted to 4.0 with either1 N HCl or 1 N NaOH. To the mixture 300 μL of amyloglucosidase(EC3.2.1.3.Aspergillus niger, TypeA3513, Sigma-Aldrich, St. Louis,MO)was added, and the mixture was heated at 60 �C in a water bath for 30minto facilitate the hydrolysis. The hydrolyzed solution was filtered (HS).To HS a 4-fold volume of ethanol (95%) was added and left to stand at24 �C for 1 h to initiate precipitation. The precipitate was collected on aWhatman No. 2 filter paper and successively rinsed once with 40 mL ofethanol (95%) and twice with 40 mL of acetone, respectively. The residuewas oven-dried at 105 �C overnight. The weight of the desiccated precipi-tate was taken. The percent yield of SP was calculated with correction forits crude protein and ash contents. The SP obtained was incorporated intothe experimental diet formulation (Table 1). Similarly, a blank test wasperformed with similar procedures using all reagents exclusive of the testsample.
Carbohydrate Content in SP. The carbohydrate content was deter-mined by the Dubois phenol-H2SO4 colorimetric method (9), which isapplicable only for the determination of neutral sugars like glucose,galactose, mannose, etc. Briefly, the SP was accurately weighed anddissolved in double distilled water (ddw) to obtain the stock solution ofSP (10 mg/mL). The stock solution was diluted with ddw to makeconcentrations of 0.1, 0.2. 0.3, 0.4, 0.5, and 0.6 mg/mL, respectively. Toeach 0.5 mL of SP soluion, 0.5 mL of phenol color reagent (5%) wasadded. The mixture was vigorously agitated to facilitate a homogeneoussolution. To the solution 2.5 mL of sulfuric acid was rapidly dropped in,and the mixture was agitated thoroughly to facilitate the color reaction(orange color). The optical density was measured at 490 nm. Thecarbohydrate content was calculated and expressed in % w/w. A corre-sponding concentration of authentic glucose solutionwas similarly treatedand used as the reference standard.
Molecular Weight Determination by Gel Permeation Chromatography(GPC). Sample SP (10 mg) was accurately weighed and transferred intothe reaction vessel, to which 1 mL of 1 N NaOH was added. The mixturewas heated at 60 �C in awater bath until dissolved. To the solution 2mLofdeionized water was added, and the solution was agitated for 10 min andthen filtered through a 0.45 μmmicropore to obtain the alkali dissolvable
polysaccharides (ADP). For determination of the molecular weight, GPCwas conducted according to Ker et al. (8). Briefly, to each 0.5 mL of ADP1mLofNaOHand sufficient double distilledwater were added to obtain afinal volume of 5 mL. The mixture was thoroughly agitated to facilitatethe dissolution. The solution was centrifuged at 2500 rpm for 10 min toprecipitate the insoluble suspensions. The supernatant was decanted.Three milliliters of each was eluted on the Sephadex G-100 column(2.5 � 100 cm) with 0.05 N NaOH solution containing 0.02% of NaN3
at a flow rate 0.5 mL/min. The eluent was collected by a fraction collector(ISCO Retriever 500, Isco., Lincoln, NE), 6 mL in each. A total of fiftytubes were collected. The optical density was simultaneously scannedat 490 and 280 nm, respectively. The molecular mass distribution andmean molecular mass were calibrated by the standard curve establishedby authentic dextrans (Sigma, St. Louis, MO) having known molecularmasses (8.8, 40, 500, 2000, and 5000-40000 kDa, respectively). Theaverage molecular mass was calculated by linear correlation between thelogarithm of the molecular mass of the standards and the ratio of theirelution volumes to the void volume of the column (9).
The Monosaccharide Composition in SP: Hydrolysis, Reduction, andDerivatization of Monosaccharides. The method of Blakeney et al. (1983)with slightmodificationbyKer et al. (8) was used. In principle, the purifiedSP was subjected to complete acid hydrolysis. The hydrolyzed mixtureof monosaccharides was acetylated to form acetylated monosaccharidesand analyzed with GC/MS. The quantity in mol % of each individualmonosaccharide was calculated from the corresponding percent peakarea by comparing with the blank. Practically, Ker et al. (9) was followed.Two milligrams of SP was accurately weighed and transferred into theCole-Parmer reactor, to which 2mLof 2M trifluoroacetic acidwas added.The mixture was heated at 120 �C with the Cole-Parmer heater for 24 hwhile shaken vigorously every 30 min during heating until completelyhydrolyzed. The hydrolyzed mixture was subjected to nitrogen blow untildried. The residue was dissolved twice with NH4OH solution. Each time100 μL of 1 M NH4OH containing 1 mg/mL of deoxyribose was used asthe internal standard. (Should there be anymono- or disaccharide initiallyexisting in the sample, 5 mg of this should be accurately weighed anddissolved with 200 μL of 1 M NH4OH.) The reduction was conducted inthe Cole-Parmer reactor with 0.2 g of NaBH4/10 mL of DMSO. Theremaining procedures were conducted following Ker et al. (9). The finaldeduced product was transferred into a 1 mL reaction vessel, lyophilizedand analyzed with GC/MS as described (9).
GC/MS Analysis. GC/MS was conducted in the Restek Rtx 225column (l � i.d. = 30 m � 0.32 mm). The temperature was programmed,initially at 60 �C for 1min, raised at an elevation rate 8 �C/min until 220 �C,and held this temperature for 10 min. The temperatures at the injectionport and the detector were set equally at 230 �C.Hydrogenwas used as thecarrier gas and operated at a flow rate of 2.0mL/min. The reference valuesof retention time of the standard monosaccharides are shown in Table 2.
Table 1. Diet Formula for Animal Experiment (g/100g)a
ingredients C H A1 A2 A3 A4 A5 A6 A7 A8
casein 20 20 20 20 20 20 20 20 20 20
sucrose 15 15 15 15 15 15 15 15 15 15
corn starch 50 45 45 45 45 45 45 45 45 45
corn oil 2.5 4.9 4.9 4.9 4.9 4.9 4.9 4.9 4.9 4.9
lard 2.5 5 5 5 5 5 5 5 5 5
cholesterol 0.1 0.1 0.1 0.1 0.1 0.1 0.1 0.1 0.1
MPb 3.5 3.5 3.5 3.5 3.5 3.5 3.5 3.5 3.5 3.5
VPc 1 1 1 1 1 1 1 1 1 1
choline 0.2 0.2 0.2 0.2 0.2 0.2 0.2 0.2 0.2 0.2
methionine 0.3 0.3 0.3 0.3 0.3 0.3 0.3 0.3 0.3 0.3
R-cellulose 5 5.0 4.5 4.5 4.5 4.5 4.5 4.5 4.5 4.5
A1SP 0.5
A2SP 0.5
A3SP 0.5
A4SP 0.5
A5SP 0.5
A6SP 0.5
A7SP 0.5
A8SP 0.5
aData of ingredients formulated were in absolute weight, g. C: control diet. H:high fat high cholesterol diet. The following diets (A1-A8) contained 0.5 g ofrelevant sample soluble polysaccharides (SP) formulated with diet H. A1: Malusdomestica “Fuji” (Japan origin). A2:Malus domestica “Jonagold” (Korea origin). A3:Malus domestica “Golden Delicious” (Japan origin). A4: Malus domestica “Gala”(Japan origin). A5: Malus domestica “Arkansas Black” (Japan origin). A6: Malusdomestica “Fuji” (USA origin). A7: Malus domestica “Granny Smith” (USA origin).and A8: Malus domestica “Red Delicious” (USA origin). bMineral premix. c Vitaminpremix.
Table 2. Retention Time of Different Monosaccharides
standard/sample retention time (min) (rangea)
D-deoxyribose 19.669 (19.06-19.916)
L-rhamnose 20.459
fucose 20.822 (20.32-21.159)
D-(-)-ribose 21.109
D-lyxose 21.134 (20.682-21.307)
D-(-)-arabinose 21.332
D-(þ)-xylose 22.138 (21.76-22.98)
allose 24.196 (23.669-24.377)
talose 24.821 (24.484-25.052)
D-mannose 25.471 (24.838-25.521)
D-fructose(mannose) 25.471
D-galactose 25.932 (25.46-25.998)
D-fructose(glucose) 26.623
D-(þ)-glucose 26.623 (25.998-26.887)
glucosamine 27.257
myo-inositol 27.373, 27.529; (27.003-27.685)
lactose 35.108-36.971
sucrose 35.487-37.263
a The range is shown in parentheses.

4662 J. Agric. Food Chem., Vol. 58, No. 8, 2010 Ker et al.
Analysis For Proteins. The method of Bradford was followed todetermine the protein content (10). Briefly, 5.1 mg of SP was accuratelyweighed, to which a tiny amount of NaOH (1 N) was added. The mixturewas agitated to facilitate the dissolution. The solution was made to avolume of 5 mLwith 1 NNaOH. Ten microliters of each standard and/orsample solution was transferred into a 96-well microplate. To each well200 μL of diluted dye reagent was added. The mixture was gently agitatedand incubated at ambient temperature for 5 min. The optical density wasmeasured at 595 nm with an ELISA reader. A calibration curve wasestablished using authentic bovine serum albumin (BSA), from which theamount of protein present was calculated and expressed in percent w/w.
Acid Hydrolysis. Sample SP (3 g) was accurately weighed and trans-ferred into a 2 mL reaction vessel, to which 2 mL of 6 M HCl was added.The mixture was subjected to nitrogen blowing for 10 min to drive off thedissolved oxygen. The reaction vessel was sealed and heated at 110 �C for24 h until completely hydrolyzed. The product amino acid mixture waslyophilized. The desiccated product was dissolved in 0.3mLof 0.01MHClto obtain the sample of hydrolyzed amino acid mixture (AAM).
Derivatization of Amino Acid and Extraction. 0.3 mL of authenticsample solution and 0.6 mL of AAMwere respectively placed into a 3 mLreaction vessel, to which 0.01 mL of internal standard norleucine solution(10 mg/mL) was added. The mixture was vigorously agitated, and 0.1 mLof ethyl chloroformate was added. After the mixture was well shaken,1 mL of alcohol-pyridine was added. On addition of 2mL of chloroform,the mixture was vigorously agitated for 1 min to facilitate derivatization.To the reaction mixture 0.7 mL of water was added. The mixture wasshaken well and left to stand for 5 min to facilitate phase separation. Thesupernatant was discarded. The lower layer (i.e., the chloroform layer) wastransferred into another tube. A sufficient amount of anhydrous sodiumsulfate was added to enable the dehydration to proceed. The dehydratedchloroform extract was transferred into the sample vessel for GC/MSanalysis.
GC/MS Analysis. The GC/MS gas chromatography (Agilent 6890,Wilmington, DE) installed with an FID detector and a column HP-5MS(l=30m, i.d.=0.25mm, film thickness=0.25μm)was used forGC/MSanalysis. Nitrogen was used as the mobile phase and operated at a flowrate 0.8 mL/min. The temperature at FID and the injection port wasoperated at 305 and 300 �C, respectively. The elution process wastemperature programmed, initially at 50 �C for 1 min, then at an elevationrate 10 �C/min to 300 �C and held at this temperature for 6.5 min (9).
Determination of Uronic Acid. The content of uronic acid wasdetermined with the carbazole-H2SO4 method of Cesaretti et al. (11).The content of uronic acid was expressed in % w/w.
Hamsters. Eighty-eight male Syrian hamsters, aged 4-5 weeks, werepurchased from the National Laboratory Animal Centre. All studiesperformed with the hamster model were approved by the HungkuangUniversity Supervising Ethic Committee in accordance with HelsinkiDeclaration of 1975. The animal room was conditioned at 24( 1 �C witha relative humidity maintained at 40-60%. The light cycle was changedevery 12 h.Water andmealswere taken ad libitum. For the first twoweeks,hamsters were acclimated by supplying only regular diets for experimentalhamsters (Fu-Sow brand; meaning Long-Live brand in Chinese). Thehamsters were then randomly grouped into eleven groups, 8 in eachstainless cage. Based on the formula of AIN-76 (1977) (12), the experi-mental diets were prepared (Table 1). Each diet was thoroughly mixed toensure a homogeneous compositional distribution and stored at 4 �C.These hamster groups were fed respectively with diets shown in Table 1.
The experimental period extended for 8 weeks, during which the bodyweight and the amount of diet consumed were recorded every 2 days untilthe end of the experiment. After 8 weeks, the hamsters were fasted for 12 hand CO2-anesthetized to collect the blood from the abdominal aorta.Blood was immediately centrifuged at 3200 rpm for 15 min using aKUBOTA-3740 centrifuge to separate and collect the sera, which wereused for the determination of total triglyceride (TG), total cholesterol(TC), low density lipoprotein cholesterol (LDL-C) and high densitylipoprotein cholesterol (HDL-C). When euthanized, livers were dissectedand rinsed twice with saline. The excess adhered water was sucked off theliver surface with tissues, and the net weight of liver was taken.
Analysis of Serum Lipid and Lipoproteins. Serum lipoproteinsincluding TG, TC, LDL-C and HDL-C were determined by the samemethod previously described by Lin et al. (13).
Assay for Glutathione Peroxidase (GPX) and Superoxide Dis-
mutase (SOD).
Glutathione Peroxidase (GPX). The method of Mantha was fol-lowed (14). Briefly, hepatic extract (10 μL) was added with0.75 mL of reaction solution (2.5 mM GSH, 0.5 mM NaN3, 0.3 mMEDTA, 0.1 mM NADPH, 0.5 U of glutathione reductase, 0.4 mM tert-butyl hydroperoxidase in 50 mM phosphate buffer, pH 7.2). The reactionmixture was left to stand in ambient temperature for 5 min and thencombined with 50 μL of 3.125 mM H2O2. The mixture was thoroughlymixed. The absorbance was taken at 340 nm against a blank of deionizedwater. For calibration of enzyme activity, a molar extinction coefficientε340=6220M-1 cm-1 was used.One unit ofGPXwill cause the formationof 1 μmol of NADPþ from NADPH per min at pH 8.0 at 25 �C .
Superoxide Dismutase (SOD). According to Marklund (15), 10 μL ofthe hepatic extract was combined with 965 μL of TrisHCl (100 mM)(containing 2 mM of diethylenetriaminepentaacetic acid, pH 8.2) and25 μL of pryogallol (8 mM in 3 mM HCl). The absorbance was red at412 nm using deionized water as the blank. The absorbance was redsuccessively within the first 3 min. One unit of SOD is defined as thecapacity of 50% inhibition on the auto-oxidation rate of pyrogallol.
Statistics.Data obtained in the same groupwere analyzed byANOVAStudent’s t test with computer statistical software SPSS 10.0 (SPSS,Chicago, IL). Statistical Analysis System (2000) software was used toanalyze the variances, and Duncan’s multiple range tests were used to testtheir significances of difference between paired means. Significance ofdifference was judged by a confidence level of p < 0.05.
RESULTS AND DISCUSSION
The total SP obtained from different apple cultivars rangedwithin 0.43-0.88%. Their molecular weight ranged within223-848 kDa, among which the cultivars A3, A4, A5, A6, andA7 (5 out of the 8 species, 63%) exhibited smaller MW rangingwithin 223-343 (Table 3). Literature elsewhere cited that thebiological activity of SP depends on their molecular size andweight. Lower molecular weight entities can be more effectivein sight of immunoenhancer, as evidenced by the preparation“Biobran” manufactured by Dai-Wa Pharmaceutics (Japan) (16).Accordingly, one of the strategies for improving the immuno-bioactivity of polysaccharides is to fabricate polysaccharides hav-ing lower molecular weight analogues. Until present, there havebeen only few studies on the relationship between the antioxidantactivity and the molecular weight (17).
Proximate analysis indicated that the content of carbohydrate,protein, and uronic acid in SP reached 47.8-68.3, 7.5-17.5, and11.7-24.6%, respectively. The order (with decrease in order) wasA4 (68.3%) > A2 (67.2%) > A6 (58.3%) for carbohydratecontent.While for protein the order changed asA1 (17.5%)>A7(14.0%) > A3 (12.2%); and for uronic acid, the order was A1
Table 3. The Yield Percent, Mean Molecular Weight, and Contents of UronicAcid, Carbohydrate, and Protein in the Soluble Polysaccharide FractionObtained from Different Species of Applesa
sample yield (%) MWb (kDa) carbohydratec (%) proteind (%) uronic acide (%)
A1 0.69 848( 88 57.3( 1.8 17.5( 0.8 24.6( 0.6
A2 0.43 631( 73 67.2( 1.5 9.4( 0.4 23.0( 0.4
A3 0.77 280( 63 47.8( 1.6 12.2( 0.7 11.7( 0.3
A4 0.53 223( 53 68.3( 1.3 9.8 ( 0.4 22.3( 0.4
A5 0.74 244( 55 52.4 ( 1.4 10.3( 0.5 12.6( 0.4
A6 0.71 265 ( 47 58.3( 1.7 7.5( 0.4 19.2( 0.3
A7 0.88 343( 56 55.5( 1.8 14.0 ( 0.8 15.7( 0.3
A8 0.61 652( 76 56.2 ( 1.5 10.4( 0.6 19.1( 0.5
aData expressed as mean ( SD from triplicate determinations. bMeanmolecular weight (kDa) of soluble polysaccharides obtained from different applespecies when determined by GPC. cCarbohydrate (%, w/w) was determined by thephenol-H2SO4 method.
dProtein (%, w/w) was determined by BCA protein assay(Bradford, 1976). eUronic acid (%, w/w) was measured by the carbazole-H2SO4
method (Cesaretti et al., 2003).
Article J. Agric. Food Chem., Vol. 58, No. 8, 2010 4663
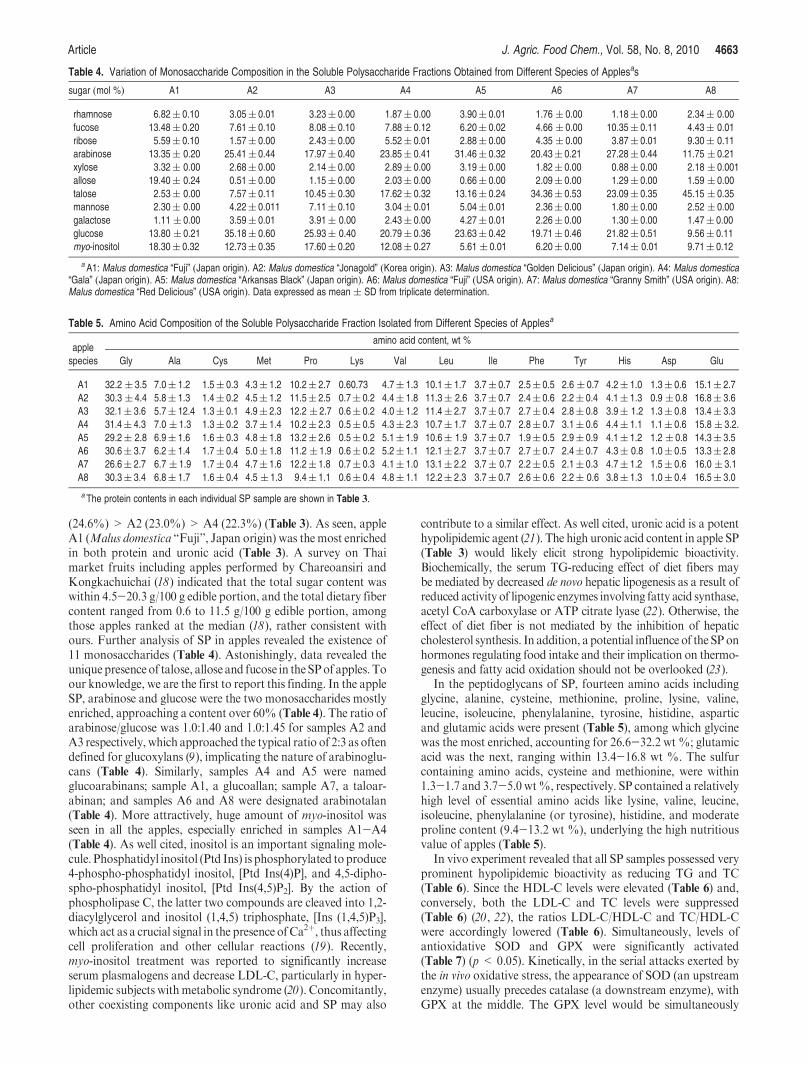
(24.6%) > A2 (23.0%) > A4 (22.3%) (Table 3). As seen, appleA1 (Malus domestica “Fuji”, Japan origin) was the most enrichedin both protein and uronic acid (Table 3). A survey on Thaimarket fruits including apples performed by Chareoansiri andKongkachuichai (18) indicated that the total sugar content waswithin 4.5-20.3 g/100 g edible portion, and the total dietary fibercontent ranged from 0.6 to 11.5 g/100 g edible portion, amongthose apples ranked at the median (18), rather consistent withours. Further analysis of SP in apples revealed the existence of11 monosaccharides (Table 4). Astonishingly, data revealed theunique presence of talose, allose and fucose in the SPof apples. Toour knowledge, we are the first to report this finding. In the appleSP, arabinose and glucose were the two monosaccharides mostlyenriched, approaching a content over 60% (Table 4). The ratio ofarabinose/glucose was 1.0:1.40 and 1.0:1.45 for samples A2 andA3 respectively, which approached the typical ratio of 2:3 as oftendefined for glucoxylans (9), implicating the nature of arabinoglu-cans (Table 4). Similarly, samples A4 and A5 were namedglucoarabinans; sample A1, a glucoallan; sample A7, a taloar-abinan; and samples A6 and A8 were designated arabinotalan(Table 4). More attractively, huge amount of myo-inositol wasseen in all the apples, especially enriched in samples A1-A4(Table 4). As well cited, inositol is an important signaling mole-cule. Phosphatidyl inositol (Ptd Ins) is phosphorylated to produce4-phospho-phosphatidyl inositol, [Ptd Ins(4)P], and 4,5-dipho-spho-phosphatidyl inositol, [Ptd Ins(4,5)P2]. By the action ofphospholipase C, the latter two compounds are cleaved into 1,2-diacylglycerol and inositol (1,4,5) triphosphate, [Ins (1,4,5)P3],which act as a crucial signal in the presence ofCa2þ, thus affectingcell proliferation and other cellular reactions (19). Recently,myo-inositol treatment was reported to significantly increaseserum plasmalogens and decrease LDL-C, particularly in hyper-lipidemic subjects withmetabolic syndrome (20). Concomitantly,other coexisting components like uronic acid and SP may also
contribute to a similar effect. As well cited, uronic acid is a potenthypolipidemic agent (21). The high uronic acid content in apple SP(Table 3) would likely elicit strong hypolipidemic bioactivity.Biochemically, the serum TG-reducing effect of diet fibers maybe mediated by decreased de novo hepatic lipogenesis as a result ofreduced activity of lipogenic enzymes involving fatty acid synthase,acetyl CoA carboxylase or ATP citrate lyase (22). Otherwise, theeffect of diet fiber is not mediated by the inhibition of hepaticcholesterol synthesis. In addition, a potential influence of the SPonhormones regulating food intake and their implication on thermo-genesis and fatty acid oxidation should not be overlooked (23).
In the peptidoglycans of SP, fourteen amino acids includingglycine, alanine, cysteine, methionine, proline, lysine, valine,leucine, isoleucine, phenylalanine, tyrosine, histidine, asparticand glutamic acids were present (Table 5), among which glycinewas the most enriched, accounting for 26.6-32.2 wt %; glutamicacid was the next, ranging within 13.4-16.8 wt %. The sulfurcontaining amino acids, cysteine and methionine, were within1.3-1.7 and 3.7-5.0 wt%, respectively. SP contained a relativelyhigh level of essential amino acids like lysine, valine, leucine,isoleucine, phenylalanine (or tyrosine), histidine, and moderateproline content (9.4-13.2 wt %), underlying the high nutritiousvalue of apples (Table 5).
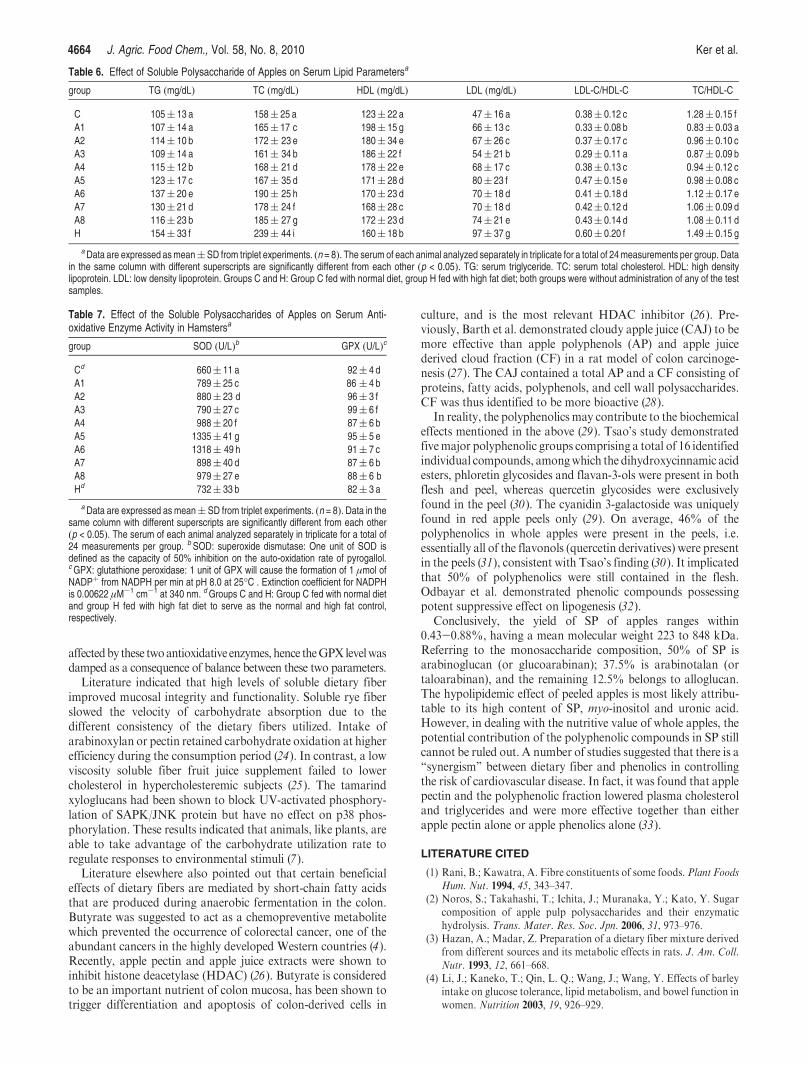
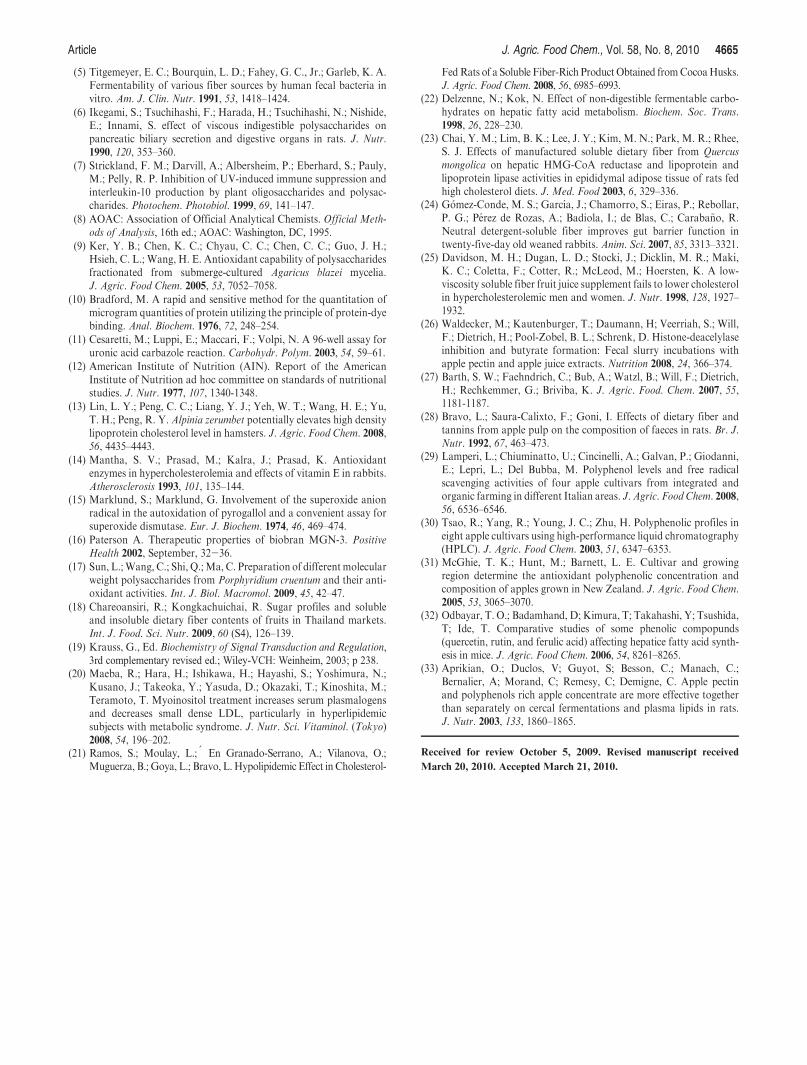
In vivo experiment revealed that all SP samples possessed veryprominent hypolipidemic bioactivity as reducing TG and TC(Table 6). Since the HDL-C levels were elevated (Table 6) and,conversely, both the LDL-C and TC levels were suppressed(Table 6) (20, 22), the ratios LDL-C/HDL-C and TC/HDL-Cwere accordingly lowered (Table 6). Simultaneously, levels ofantioxidative SOD and GPX were significantly activated(Table 7) (p < 0.05). Kinetically, in the serial attacks exerted bythe in vivo oxidative stress, the appearance of SOD (an upstreamenzyme) usually precedes catalase (a downstream enzyme), withGPX at the middle. The GPX level would be simultaneously
Table 4. Variation of Monosaccharide Composition in the Soluble Polysaccharide Fractions Obtained from Different Species of Applesas
sugar (mol %) A1 A2 A3 A4 A5 A6 A7 A8
rhamnose 6.82( 0.10 3.05( 0.01 3.23( 0.00 1.87( 0.00 3.90( 0.01 1.76 ( 0.00 1.18( 0.00 2.34( 0.00
fucose 13.48( 0.20 7.61( 0.10 8.08( 0.10 7.88( 0.12 6.20( 0.02 4.66 ( 0.00 10.35( 0.11 4.43( 0.01
ribose 5.59( 0.10 1.57( 0.00 2.43( 0.00 5.52( 0.01 2.88( 0.00 4.35 ( 0.00 3.87( 0.01 9.30( 0.11
arabinose 13.35( 0.20 25.41( 0.44 17.97( 0.40 23.85( 0.41 31.46( 0.32 20.43( 0.21 27.28( 0.44 11.75 ( 0.21
xylose 3.32( 0.00 2.68( 0.00 2.14( 0.00 2.89( 0.00 3.19( 0.00 1.82( 0.00 0.88( 0.00 2.18 ( 0.001
allose 19.40( 0.24 0.51( 0.00 1.15( 0.00 2.03( 0.00 0.66( 0.00 2.09( 0.00 1.29( 0.00 1.59 ( 0.00
talose 2.53( 0.00 7.57( 0.11 10.45( 0.30 17.62( 0.32 13.16( 0.24 34.36( 0.53 23.09( 0.35 45.15 ( 0.35
mannose 2.30( 0.00 4.22( 0.011 7.11( 0.10 3.04( 0.01 5.04( 0.01 2.36( 0.00 1.80( 0.00 2.52 ( 0.00
galactose 1.11 ( 0.00 3.59( 0.01 3.91( 0.00 2.43( 0.00 4.27( 0.01 2.26( 0.00 1.30( 0.00 1.47( 0.00
glucose 13.80 ( 0.21 35.18( 0.60 25.93( 0.40 20.79( 0.36 23.63( 0.42 19.71( 0.46 21.82( 0.51 9.56( 0.11
myo-inositol 18.30( 0.32 12.73( 0.35 17.60( 0.20 12.08( 0.27 5.61 ( 0.01 6.20( 0.00 7.14( 0.01 9.71( 0.12
aA1: Malus domestica “Fuji” (Japan origin). A2: Malus domestica “Jonagold” (Korea origin). A3: Malus domestica “Golden Delicious” (Japan origin). A4: Malus domestica“Gala” (Japan origin). A5: Malus domestica “Arkansas Black” (Japan origin). A6: Malus domestica “Fuji” (USA origin). A7: Malus domestica “Granny Smith” (USA origin). A8:Malus domestica “Red Delicious” (USA origin). Data expressed as mean ( SD from triplicate determination.
Table 5. Amino Acid Composition of the Soluble Polysaccharide Fraction Isolated from Different Species of Applesa
amino acid content, wt %apple
species Gly Ala Cys Met Pro Lys Val Leu Ile Phe Tyr His Asp Glu
A1 32.2 ( 3.5 7.0( 1.2 1.5( 0.3 4.3( 1.2 10.2( 2.7 0.60.73 4.7( 1.3 10.1( 1.7 3.7( 0.7 2.5( 0.5 2.6 ( 0.7 4.2( 1.0 1.3( 0.6 15.1( 2.7
A2 30.3 ( 4.4 5.8( 1.3 1.4( 0.2 4.5( 1.2 11.5( 2.5 0.7( 0.2 4.4( 1.8 11.3( 2.6 3.7( 0.7 2.4( 0.6 2.2( 0.4 4.1( 1.3 0.9 ( 0.8 16.8( 3.6
A3 32.1( 3.6 5.7( 12.4 1.3( 0.1 4.9( 2.3 12.2 ( 2.7 0.6( 0.2 4.0( 1.2 11.4( 2.7 3.7( 0.7 2.7( 0.4 2.8( 0.8 3.9( 1.2 1.3( 0.8 13.4( 3.3
A4 31.4( 4.3 7.0 ( 1.3 1.3( 0.2 3.7( 1.4 10.2( 2.3 0.5( 0.5 4.3( 2.3 10.7( 1.7 3.7( 0.7 2.8( 0.7 3.1( 0.6 4.4( 1.1 1.1( 0.6 15.8 ( 3.2.
A5 29.2( 2.8 6.9( 1.6 1.6( 0.3 4.8( 1.8 13.2( 2.6 0.5( 0.2 5.1( 1.9 10.6( 1.9 3.7( 0.7 1.9( 0.5 2.9( 0.9 4.1( 1.2 1.2 ( 0.8 14.3( 3.5
A6 30.6( 3.7 6.2( 1.4 1.7( 0.4 5.0( 1.8 11.2 ( 1.9 0.6( 0.2 5.2( 1.1 12.1( 2.7 3.7( 0.7 2.7( 0.7 2.4( 0.7 4.3( 0.8 1.0( 0.5 13.3( 2.8
A7 26.6( 2.7 6.7 ( 1.9 1.7( 0.4 4.7( 1.6 12.2( 1.8 0.7( 0.3 4.1( 1.0 13.1( 2.2 3.7( 0.7 2.2( 0.5 2.1( 0.3 4.7( 1.2 1.5( 0.6 16.0 ( 3.1
A8 30.3( 3.4 6.8( 1.7 1.6( 0.4 4.5 ( 1.3 9.4( 1.1 0.6( 0.4 4.8( 1.1 12.2( 2.3 3.7( 0.7 2.6( 0.6 2.2( 0.6 3.8( 1.3 1.0( 0.4 16.5( 3.0
a The protein contents in each individual SP sample are shown in Table 3.
4664 J. Agric. Food Chem., Vol. 58, No. 8, 2010 Ker et al.
affectedby these twoantioxidative enzymes,hence theGPXlevelwasdamped as a consequence of balance between these two parameters.
Literature indicated that high levels of soluble dietary fiberimproved mucosal integrity and functionality. Soluble rye fiberslowed the velocity of carbohydrate absorption due to thedifferent consistency of the dietary fibers utilized. Intake ofarabinoxylan or pectin retained carbohydrate oxidation at higherefficiency during the consumption period (24). In contrast, a lowviscosity soluble fiber fruit juice supplement failed to lowercholesterol in hypercholesteremic subjects (25). The tamarindxyloglucans had been shown to block UV-activated phosphory-lation of SAPK/JNK protein but have no effect on p38 phos-phorylation. These results indicated that animals, like plants, areable to take advantage of the carbohydrate utilization rate toregulate responses to environmental stimuli (7).
Literature elsewhere also pointed out that certain beneficialeffects of dietary fibers are mediated by short-chain fatty acidsthat are produced during anaerobic fermentation in the colon.Butyrate was suggested to act as a chemopreventive metabolitewhich prevented the occurrence of colorectal cancer, one of theabundant cancers in the highly developed Western countries (4).Recently, apple pectin and apple juice extracts were shown toinhibit histone deacetylase (HDAC) (26). Butyrate is consideredto be an important nutrient of colon mucosa, has been shown totrigger differentiation and apoptosis of colon-derived cells in
culture, and is the most relevant HDAC inhibitor (26). Pre-viously, Barth et al. demonstrated cloudy apple juice (CAJ) to bemore effective than apple polyphenols (AP) and apple juicederived cloud fraction (CF) in a rat model of colon carcinoge-nesis (27). The CAJ contained a total AP and a CF consisting ofproteins, fatty acids, polyphenols, and cell wall polysaccharides.CF was thus identified to be more bioactive (28).
In reality, the polyphenolics may contribute to the biochemicaleffects mentioned in the above (29). Tsao’s study demonstratedfivemajor polyphenolic groups comprising a total of 16 identifiedindividual compounds, amongwhich the dihydroxycinnamic acidesters, phloretin glycosides and flavan-3-ols were present in bothflesh and peel, whereas quercetin glycosides were exclusivelyfound in the peel (30). The cyanidin 3-galactoside was uniquelyfound in red apple peels only (29). On average, 46% of thepolyphenolics in whole apples were present in the peels, i.e.essentially all of the flavonols (quercetin derivatives) were presentin the peels (31), consistent with Tsao’s finding (30). It implicatedthat 50% of polyphenolics were still contained in the flesh.Odbayar et al. demonstrated phenolic compounds possessingpotent suppressive effect on lipogenesis (32).
Conclusively, the yield of SP of apples ranges within0.43-0.88%, having a mean molecular weight 223 to 848 kDa.Referring to the monosaccharide composition, 50% of SP isarabinoglucan (or glucoarabinan); 37.5% is arabinotalan (ortaloarabinan), and the remaining 12.5% belongs to alloglucan.The hypolipidemic effect of peeled apples is most likely attribu-table to its high content of SP, myo-inositol and uronic acid.However, in dealing with the nutritive value of whole apples, thepotential contribution of the polyphenolic compounds in SP stillcannot be ruled out. A number of studies suggested that there is a“synergism” between dietary fiber and phenolics in controllingthe risk of cardiovascular disease. In fact, it was found that applepectin and the polyphenolic fraction lowered plasma cholesteroland triglycerides and were more effective together than eitherapple pectin alone or apple phenolics alone (33).
LITERATURE CITED
(1) Rani, B.; Kawatra, A. Fibre constituents of some foods. Plant FoodsHum. Nut. 1994, 45, 343–347.
(2) Noros, S.; Takahashi, T.; Ichita, J.; Muranaka, Y.; Kato, Y. Sugarcomposition of apple pulp polysaccharides and their enzymatichydrolysis. Trans. Mater. Res. Soc. Jpn. 2006, 31, 973–976.
(3) Hazan, A.; Madar, Z. Preparation of a dietary fiber mixture derivedfrom different sources and its metabolic effects in rats. J. Am. Coll.Nutr. 1993, 12, 661–668.
(4) Li, J.; Kaneko, T.; Qin, L. Q.; Wang, J.; Wang, Y. Effects of barleyintake on glucose tolerance, lipid metabolism, and bowel function inwomen. Nutrition 2003, 19, 926–929.
Table 6. Effect of Soluble Polysaccharide of Apples on Serum Lipid Parametersa
group TG (mg/dL) TC (mg/dL) HDL (mg/dL) LDL (mg/dL) LDL-C/HDL-C TC/HDL-C
C 105( 13 a 158( 25 a 123( 22 a 47( 16 a 0.38( 0.12 c 1.28( 0.15 f
A1 107( 14 a 165( 17 c 198( 15 g 66( 13 c 0.33( 0.08 b 0.83( 0.03 a
A2 114( 10 b 172( 23 e 180( 34 e 67( 26 c 0.37( 0.17 c 0.96( 0.10 c
A3 109( 14 a 161( 34 b 186( 22 f 54( 21 b 0.29( 0.11 a 0.87( 0.09 b
A4 115( 12 b 168( 21 d 178( 22 e 68( 17 c 0.38( 0.13 c 0.94( 0.12 c
A5 123( 17 c 167( 35 d 171( 28 d 80( 23 f 0.47( 0.15 e 0.98( 0.08 c
A6 137( 20 e 190( 25 h 170( 23 d 70( 18 d 0.41( 0.18 d 1.12( 0.17 e
A7 130( 21 d 178( 24 f 168( 28 c 70( 18 d 0.42( 0.12 d 1.06( 0.09 d
A8 116( 23 b 185( 27 g 172( 23 d 74( 21 e 0.43( 0.14 d 1.08( 0.11 d
H 154( 33 f 239( 44 i 160( 18 b 97( 37 g 0.60( 0.20 f 1.49( 0.15 g
aData are expressed asmean(SD from triplet experiments. (n = 8). The serum of each animal analyzed separately in triplicate for a total of 24measurements per group. Datain the same column with different superscripts are significantly different from each other (p < 0.05). TG: serum triglyceride. TC: serum total cholesterol. HDL: high densitylipoprotein. LDL: low density lipoprotein. Groups C and H: Group C fed with normal diet, group H fed with high fat diet; both groups were without administration of any of the testsamples.
Table 7. Effect of the Soluble Polysaccharides of Apples on Serum Anti-oxidative Enzyme Activity in Hamstersa
group SOD (U/L)b GPX (U/L)c
Cd 660( 11 a 92( 4 d
A1 789( 25 c 86 ( 4 b
A2 880( 23 d 96( 3 f
A3 790( 27 c 99( 6 f
A4 988( 20 f 87( 6 b
A5 1335( 41 g 95( 5 e
A6 1318( 49 h 91( 7 c
A7 898( 40 d 87( 6 b
A8 979( 27 e 88( 6 b
Hd 732( 33 b 82( 3 a
aData are expressed as mean( SD from triplet experiments. (n = 8). Data in thesame column with different superscripts are significantly different from each other(p < 0.05). The serum of each animal analyzed separately in triplicate for a total of24 measurements per group. b SOD: superoxide dismutase: One unit of SOD isdefined as the capacity of 50% inhibition on the auto-oxidation rate of pyrogallol.cGPX: glutathione peroxidase: 1 unit of GPX will cause the formation of 1 μmol ofNADPþ from NADPH per min at pH 8.0 at 25�C . Extinction coefficient for NADPHis 0.00622 μM-1 cm-1 at 340 nm. dGroups C and H: Group C fed with normal dietand group H fed with high fat diet to serve as the normal and high fat control,respectively.
Article J. Agric. Food Chem., Vol. 58, No. 8, 2010 4665
(5) Titgemeyer, E. C.; Bourquin, L. D.; Fahey, G. C., Jr.; Garleb, K. A.Fermentability of various fiber sources by human fecal bacteria invitro. Am. J. Clin. Nutr. 1991, 53, 1418–1424.
(6) Ikegami, S.; Tsuchihashi, F.; Harada, H.; Tsuchihashi, N.; Nishide,E.; Innami, S. effect of viscous indigestible polysaccharides onpancreatic biliary secretion and digestive organs in rats. J. Nutr.1990, 120, 353–360.
(7) Strickland, F. M.; Darvill, A.; Albersheim, P.; Eberhard, S.; Pauly,M.; Pelly, R. P. Inhibition of UV-induced immune suppression andinterleukin-10 production by plant oligosaccharides and polysac-charides. Photochem. Photobiol. 1999, 69, 141–147.
(8) AOAC: Association of Official Analytical Chemists. Official Meth-ods of Analysis, 16th ed.; AOAC: Washington, DC, 1995.
(9) Ker, Y. B.; Chen, K. C.; Chyau, C. C.; Chen, C. C.; Guo, J. H.;Hsieh, C. L.; Wang, H. E. Antioxidant capability of polysaccharidesfractionated from submerge-cultured Agaricus blazei mycelia.J. Agric. Food Chem. 2005, 53, 7052–7058.
(10) Bradford, M. A rapid and sensitive method for the quantitation ofmicrogram quantities of protein utilizing the principle of protein-dyebinding. Anal. Biochem. 1976, 72, 248–254.
(11) Cesaretti, M.; Luppi, E.; Maccari, F.; Volpi, N. A 96-well assay foruronic acid carbazole reaction. Carbohydr. Polym. 2003, 54, 59–61.
(12) American Institute of Nutrition (AIN). Report of the AmericanInstitute of Nutrition ad hoc committee on standards of nutritionalstudies. J. Nutr. 1977, 107, 1340-1348.
(13) Lin, L. Y.; Peng, C. C.; Liang, Y. J.; Yeh, W. T.; Wang, H. E.; Yu,T. H.; Peng, R. Y. Alpinia zerumbet potentially elevates high densitylipoprotein cholesterol level in hamsters. J. Agric. Food Chem. 2008,56, 4435–4443.
(14) Mantha, S. V.; Prasad, M.; Kalra, J.; Prasad, K. Antioxidantenzymes in hypercholesterolemia and effects of vitamin E in rabbits.Atherosclerosis 1993, 101, 135–144.
(15) Marklund, S.; Marklund, G. Involvement of the superoxide anionradical in the autoxidation of pyrogallol and a convenient assay forsuperoxide dismutase. Eur. J. Biochem. 1974, 46, 469–474.
(16) Paterson A. Therapeutic properties of biobran MGN-3. PositiveHealth 2002, September, 32-36.
(17) Sun, L.;Wang, C.; Shi, Q.;Ma, C. Preparation of differentmolecularweight polysaccharides from Porphyridium cruentum and their anti-oxidant activities. Int. J. Biol. Macromol. 2009, 45, 42–47.
(18) Chareoansiri, R.; Kongkachuichai, R. Sugar profiles and solubleand insoluble dietary fiber contents of fruits in Thailand markets.Int. J. Food. Sci. Nutr. 2009, 60 (S4), 126–139.
(19) Krauss, G., Ed. Biochemistry of Signal Transduction and Regulation,3rd complementary revised ed.; Wiley-VCH: Weinheim, 2003; p 238.
(20) Maeba, R.; Hara, H.; Ishikawa, H.; Hayashi, S.; Yoshimura, N.;Kusano, J.; Takeoka, Y.; Yasuda, D.; Okazaki, T.; Kinoshita, M.;Teramoto, T. Myoinositol treatment increases serum plasmalogensand decreases small dense LDL, particularly in hyperlipidemicsubjects with metabolic syndrome. J. Nutr. Sci. Vitaminol. (Tokyo)2008, 54, 196–202.
(21) Ramos, S.; Moulay, L.;� En Granado-Serrano, A.; Vilanova, O.;Muguerza, B.; Goya, L.; Bravo, L.Hypolipidemic Effect in Cholesterol-
FedRats of a Soluble Fiber-Rich Product Obtained fromCocoaHusks.J. Agric. Food Chem. 2008, 56, 6985–6993.
(22) Delzenne, N.; Kok, N. Effect of non-digestible fermentable carbo-hydrates on hepatic fatty acid metabolism. Biochem. Soc. Trans.1998, 26, 228–230.
(23) Chai, Y. M.; Lim, B. K.; Lee, J. Y.; Kim, M. N.; Park, M. R.; Rhee,S. J. Effects of manufactured soluble dietary fiber from Quercusmongolica on hepatic HMG-CoA reductase and lipoprotein andlipoprotein lipase activities in epididymal adipose tissue of rats fedhigh cholesterol diets. J. Med. Food 2003, 6, 329–336.
(24) G�omez-Conde, M. S.; Garcıa, J.; Chamorro, S.; Eiras, P.; Rebollar,P. G.; Perez de Rozas, A.; Badiola, I.; de Blas, C.; Caraba~no, R.Neutral detergent-soluble fiber improves gut barrier function intwenty-five-day old weaned rabbits. Anim. Sci. 2007, 85, 3313–3321.
(25) Davidson, M. H.; Dugan, L. D.; Stocki, J.; Dicklin, M. R.; Maki,K. C.; Coletta, F.; Cotter, R.; McLeod, M.; Hoersten, K. A low-viscosity soluble fiber fruit juice supplement fails to lower cholesterolin hypercholesterolemic men and women. J. Nutr. 1998, 128, 1927–1932.
(26) Waldecker, M.; Kautenburger, T.; Daumann, H; Veerriah, S.; Will,F.; Dietrich, H.; Pool-Zobel, B. L.; Schrenk, D. Histone-deacelylaseinhibition and butyrate formation: Fecal slurry incubations withapple pectin and apple juice extracts. Nutrition 2008, 24, 366–374.
(27) Barth, S. W.; Faehndrich, C.; Bub, A.; Watzl, B.; Will, F.; Dietrich,H.; Rechkemmer, G.; Briviba, K. J. Agric. Food. Chem. 2007, 55,1181-1187.
(28) Bravo, L.; Saura-Calixto, F.; Goni, I. Effects of dietary fiber andtannins from apple pulp on the composition of faeces in rats. Br. J.Nutr. 1992, 67, 463–473.
(29) Lamperi, L.; Chiuminatto, U.; Cincinelli, A.; Galvan, P.; Giodanni,E.; Lepri, L.; Del Bubba, M. Polyphenol levels and free radicalscavenging activities of four apple cultivars from integrated andorganic farming in different Italian areas. J. Agric. Food Chem. 2008,56, 6536–6546.
(30) Tsao, R.; Yang, R.; Young, J. C.; Zhu, H. Polyphenolic profiles ineight apple cultivars using high-performance liquid chromatography(HPLC). J. Agric. Food Chem. 2003, 51, 6347–6353.
(31) McGhie, T. K.; Hunt, M.; Barnett, L. E. Cultivar and growingregion determine the antioxidant polyphenolic concentration andcomposition of apples grown in New Zealand. J. Agric. Food Chem.2005, 53, 3065–3070.
(32) Odbayar, T. O.; Badamhand, D; Kimura, T; Takahashi, Y; Tsushida,T; Ide, T. Comparative studies of some phenolic compopunds(quercetin, rutin, and ferulic acid) affecting hepatice fatty acid synth-esis in mice. J. Agric. Food Chem. 2006, 54, 8261–8265.
(33) Aprikian, O.; Duclos, V; Guyot, S; Besson, C.; Manach, C.;Bernalier, A; Morand, C; Remesy, C; Demigne, C. Apple pectinand polyphenols rich apple concentrate are more effective togetherthan separately on cercal fermentations and plasma lipids in rats.J. Nutr. 2003, 133, 1860–1865.
Received for review October 5, 2009. Revised manuscript received
March 20, 2010. Accepted March 21, 2010.