Embed Size (px)
Citation preview

Solubility of the Assemblage Pt-PtAs in Basalt with Implications
for Pt-As Complexing and As Speciation
HBSc Undergraduate Thesis
By
Andrew C. Canali
Supervised by
Dr. James M. Brenan
Submitted April 11, 2014
Contents
1. Introduction..........................................................................................................................1-3
1.1 PGE Behaviour in Silicate Melts...............................................................................2-3
2. Experimental Methods.........................................................................................................3-7
2.1 Overview and Starting Materials...............................................................................3-5
2.2 Experimental Procedure...........................................................................................6-7
3. Analysis of Run-Products.................................................................................................7-10
4. Results..............................................................................................................................11-26
4.1 Run-Product Textures..........................................................................................11-12
4.2 Run-Product Homogeneity...................................................................................12-14
4.3 Time and fO2 Dependence of Pt and As Content in Run-Product Glasses.........15-19
4.3.1 Method 2 Experiments: Limiting As Loss with Time..........................................19-21
4.3.1.1 Partitioning of V from Spinel to Melt as a Function of fO2...............................21-23
4.4 Determination of Pt Solubility as a Function of fO2...............................................23-24
4.4.1 Corrections for Pt Activity: Effect of Fe in Pt...........................................................25
4.5 Solubility of Pt in As-Bearing and As-Free Experiments......................................25-26
5. Discussion........................................................................................................................26-34
5.1 Estimation of Arsenic Speciation as a Function of fO2.........................................26-30
5.2 Modeling Pt-O and Pt-As Complexing in Silicate Melts........................................30-32
5.3 Effect of Natural As Levels on Pt Solubility..........................................................33-34
6. Conclusion........................................................................................................................34-35
7. References Cited..............................................................................................................36-38

1
1. Introduction
Investigation into the behaviour of platinum group elements (PGE- Os, Ir, Ru, Rh, Pt, and Pd) in
magmatic systems allows for a deeper understanding of why exactly these elements behave the way
they do when subjected to distinct parameters. Previous studies have noticed that the solubility of
platinum (Pt), and other highly siderophile elements (HSE: Ni, Pd, Pt, Rh, Ir, Os) in silicate melts is
affected when changing the temperature (T), pressure (P), oxygen fugacity (fO2), and melt composition
(Mx) (Borisov and Palme, 1995, 1997; Borisov et al, 1994; Capobianco et al, 1993; O’Neill et al., 2009;
Ertel et al., 1999). That being said, there are limitations to understanding the mechanisms responsible
for these relationships, for instance, under reducing conditions metallic contamination makes it difficult
to viably quantify HSE content in melts due to widespread variation in analytical results. Since oxygen
has been proven as a major complexing anion with Pt (e.g. Borisov and Palme, 1997), researchers
have begun to question the affect of other complexing ligands. Recent research reveals the potential
influence of sulfide bearing phases on the dissolution of PGE in silicate melts-for instance, attempting
to define a relationship between sulfur fugacity (fS2) influencing PGE solubility by complexing with S
(Mungall and Brenan 2014; Fonsenca et al., 2009).
It may be reasonable to consider arsenic (As) as another complexing ligand with Pt, due to
anomalous high grade PGE arsenide horizons in some magmatic ore deposits, which preferentially
form as clusters in S-poor environments (e.g. Bushveld Complex-Maier, 1999). This phenomenon was
investigated in more detail by Piña et al. (2013) and Hanley (2007); where the partitioning of siderophile
and chalcophile (Sulfur loving) elements between arsenide phases, along with As-rich melts associated
with high grade PGE ores are discussed respectively. The two localities from Hanley and Piña et al.,
exemplify the environments in which these deposits commonly occur – usually as mafic-ultramafic
bodies hosting sulfide-arsenide PGE and polymetallic ore systems. Some of the main magmatic deposit
types include: Kambalda type, which is a komatiite hosted deposit (e.g. Abitibi Greenstone Belt,
Superior Province, Canada), and intrusive PGE mineralization (e.g. Voisey’s Bay, Canada).

Solubility of the Assemblage Pt-PtAs in Basalt Andrew Canali
2
Since past research has yet to propose a direct relationship between arsenic (As) content in
igneous systems and PGE solubility, it has sparked one’s interest in attempting to develop a framework
to help solve this geochemical problem. This study sets out to define the effects on the solubility of Pt,
with the addition of As into mafic composition silicate melts (e.g. basalt) by means of high temperature
experimentation (~1200°C) at an oxygen fugacity (fO2) range of the fayalite-magnetite-quartz
buffer(FMQ)+4 to ~FMQ – 3 (logfO2= -4.10 and -11.65). Through characterization of trace and major
elements, using laser ablation-inductively coupled plasma-mass spectrometry (LA-ICP-MS) and
electron microprobe analysis (EMPA) respectively, of As-bearing and As-free silicate glasses, one was
able to note any significant changes in Pt solubility between the contrasting run-products. Very rarely is
a pure arsenide phase suggested as a pathway for As-Pt complexing, since its interactions are usually
studied symbiotically with sulfide in magmatic systems (e.g. Helmy et al., 2013; Piña et al., 2013).
Hence, this study will provide further insight into PGE geochemistry, and the potential for Pt-As
interactions in natural igneous systems.
1.1 PGE Behaviour in Silicate Melts
There are many previous studies that investigate the solubility of PGE in silicate melts, as well
as the partitioning coefficients of these elements in variable magmatic systems to determine the
dependence of PGE distribution with changes to T, P, fO2 and Mx (e.g. Borisov et al., 1994; Borisov and
Palme, 1993, 1997, 2000; Capobianco et al., 1993; Mungall and Brenan, 2014). Preliminary studies
completed at the University of Toronto reveal a high partition coefficient for PGE to silicate melt, when
considering partitioning from a sulfide melt, with values range from 2-3 X 10⁶ (Mungall and
Brenan, 2014) for Ir and Pt. Another significant finding was a notable increase in PGE solubility in S-
bearing experiments. This increase in Pt solubility implies complexing of Pt with S in the melt.
Nevertheless, the degree to which this group of elements is soluble in a given melt composition varies
respectively. An example of this phenomenon is the comparison between the solubility’s of palladium

Solubility of the Assemblage Pt-PtAs in Basalt Andrew Canali
3
(Pd) and Pt in the same diopside-anorthite (DA) eutectic at a log(fO2) of -0.68, where up to 258 ppm of
Pd (Borisov et al., 1994) and only 7.70 ppm of Pt is soluble at 1400°C (Borisov and Palme, 1997);
therefore, indicating contrasting refractory properties. Since, in this study, temperature and pressure
remain constant throughout experimentation the system is in turn mainly dependent on changes in fO2.
In comparison to other parameters, fO2 seems to have the largest influence on enhancing PGE
solubility through dissolution of a metal (Me) by reaction with O to form a metal oxide (MeO) in the
silicate melt (Figure 1).
Figure 1: Summary of several investigations into HSE solubility in Fe-free silicate melts as function of fO2 at 1300°C. The reaction in the bottom right is proposed as the main reaction controlling Pt solubility in silicate melts (see section 4.4 for details). Modified from Laurenz, 2012.
2. Experimental Methods
2.1 Overview and Starting Materials
The basis of my research consisted of a suite of high temperature experiments, which were all
run at 1200°C in a bottom loading furnace at 1atm (See Figure 3 for materials). To avoid exposure to As
in vapor phase, evacuated silica tubes were used to house the experiments. Within the silica ampoules
was a solid oxide buffer mixture to fix the fO2, along with a chromitite capsule made from a natural

Solubility of the Assemblage Pt-PtAs in Basalt Andrew Canali
4
cumulate in North Carolina, USA (Royal Ontario Museum reference #: M4557) which was used to
contain the synthetic basaltic analogue combined with other desired constituents (e.g. Pt powder) (See
Figure 4-method 1A for setup). High purity fused silica was used to construct the spacers necessary for
separating the constituents in the experiment setup. The basaltic analogue (glass composition C-see
Table 1) acted as the “silicate melt” basis for all experiments, and was synthesized by mixing high-
purity oxides in a mortar and pestle under ethanol, then calcining overnight at 900°C, followed by fusion
in an alumina crucible in air at 1 atm at 1400°C for 30 min.
Oxide SiO2 TiO3 Al2O3 FeO MgO CaO* Na2O* MnO2 K2O* NiO Total
wt% Oxide
46.90 5.41 8.80 15.41 9.18 12.04 1.54 0.21 0.51 0.20 100.20
Table 1: Oxide percents for glass composition C. Note, the asterisk indicates addition as carbonate.
The three buffers used to fix the fO2 were: MnO-Mn3O4— logfO2= -4.1, ΔFMQ= +4.3 (O’Neill
and Pownceby, 1993); Ni-NiO— logfO2= -7.72, ΔFMQ= +0.68 (O’Neill and Pownceby, 1993); Mo-
MoO2— logfO2= -11.65, ΔFMQ= -3.3 (O’Neill,1986). Both the Mo-MoO2 and Ni-NiO buffers were made
by homogenizing 50:50 portions of the respective high purity metals and metal-oxides in a mortar and
pestle under ethanol. On the other hand, MnO and Mn3O4 were both synthesized by sintering a portion
of MnO2 powder in a silica cup at specific conditions in a gas-mixing tube furnace according to O’Neill
and Pownceby (1993). MnO was prepared by reducing MnO2 at 1273K overnight (CO:CO2=95:5), and
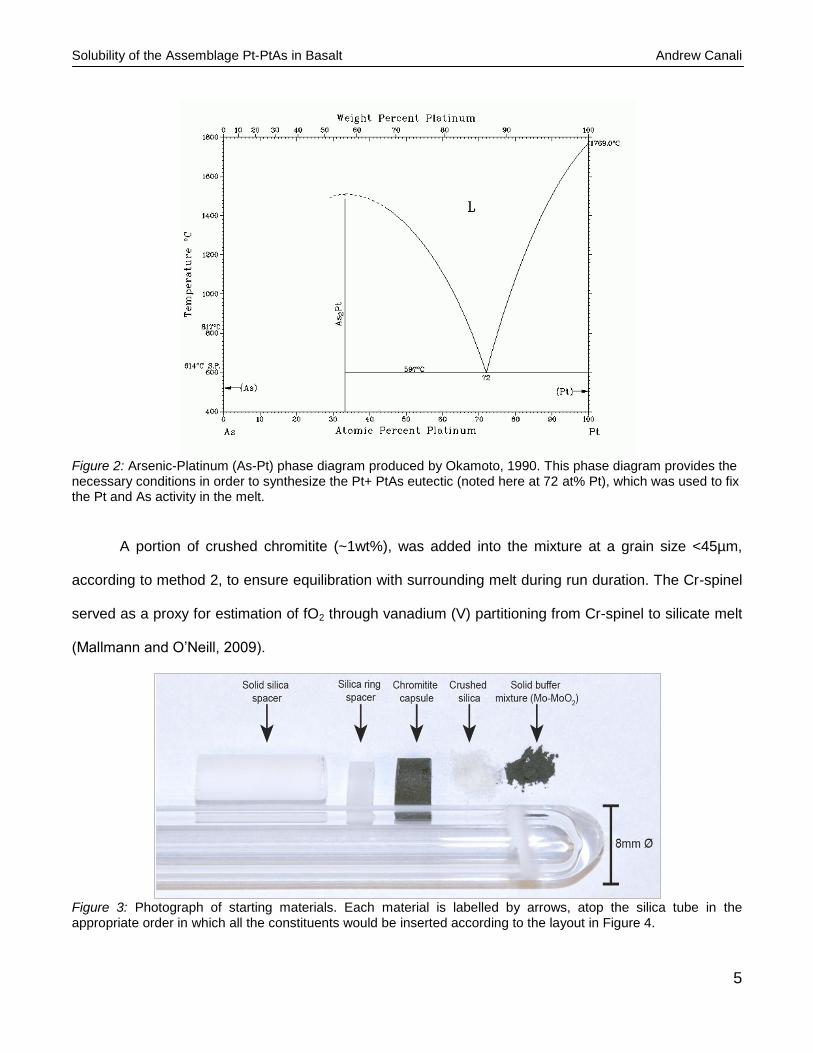
Mn3O4 was formed by oxidizing MnO2 at 1373K in pure CO2 for 1 day. The metallic phases added to the
capsule were: high purity Pt metal; and synthetic Pt+ PtAs eutectic formed according to the 1atm phase
diagram (Figure 2). The synthesis of the Pt+PtAs melt was completed by combining the appropriate
stoichiometric proportions of Pt and As in a silica tube, which was annealed at 500°C for 4 hours, then
heated to 900°C for 1 day.
Solubility of the Assemblage Pt-PtAs in Basalt Andrew Canali
5
Figure 2: Arsenic-Platinum (As-Pt) phase diagram produced by Okamoto, 1990. This phase diagram provides the necessary conditions in order to synthesize the Pt+ PtAs eutectic (noted here at 72 at% Pt), which was used to fix the Pt and As activity in the melt.
A portion of crushed chromitite (~1wt%), was added into the mixture at a grain size <45µm,
according to method 2, to ensure equilibration with surrounding melt during run duration. The Cr-spinel
served as a proxy for estimation of fO2 through vanadium (V) partitioning from Cr-spinel to silicate melt
(Mallmann and O’Neill, 2009).
Figure 3: Photograph of starting materials. Each material is labelled by arrows, atop the silica tube in the appropriate order in which all the constituents would be inserted according to the layout in Figure 4.

Solubility of the Assemblage Pt-PtAs in Basalt Andrew Canali
6
2.2 Experimental Procedure
The procedure throughout one’s research did not remain constant, since method 2 was
proposed as an alternative after noticeable issues arose concerning loss of Pt and As during run
duration using method 1. That being said, the general concept of experimentation did remain the same
— where a silica tube (5mm I.D. X 8mm O.D.) sealed at one end was loaded with excess solid buffer at
the bottom, followed by ground silica, on which the chromitite capsule filled with the specific
components was placed, and then finally topped with a silica ring spacer and a solid silica spacer. This
whole assembly was evacuated for ~1hr, then sealed using an oxy-acetylene torch and placed into an
alumina cup, which served as the container during heating of the assembly in the bottom loader
furnace. After the run duration had elapsed the experiments were placed into a salt+ice water solution,
which was used in order to depress the freezing point of liquid water ensuring a more sudden quench.
Experiments bearing an As component were all removed under a fume hood using appropriate
personal protective equipment, and the oxide buffers were inspected using powder X-ray diffraction to
ensure both phases were present after the run duration.
The three main setups (A, B and C) were split into two methods, noted in figure 4. The first of
which shows the initial approach, where Pt+PtAs was added as the only means of Pt in the melt and
then heated for a desired duration. The procedure for method 2 acted as a correction for the Pt and As
stability issues, where the melt was first equilibrated with Pt powder (usually 4 days at 1200°C) at a
given fO2 to ensure Pt saturation, and then re-melted with the buffer removed for another 4 days with
the Pt-PtAs melt to fix the As activity. Heterogeneity in the time resolved spectra produced by analysis
with LA-ICP-MS of the most reducing run product glasses, suggests slow equilibration when subjecting
the silicate glass fused in air to reducing conditions imposed by the buffers (Bennett and Brenan, 2013).
One overcame this issue by re-fusing a new batch of starting material at FMQ-1 in a CO-CO2 gas-
mixing tube furnace at 1400°C, followed by thorough homogenizing in a mortar and pestle under

Solubility of the Assemblage Pt-PtAs in Basalt Andrew Canali
7
ethanol. Unfortunately, this was not done until much later in experimentation and the resulting run-
products were unsuccessful.
Figure 4: Schematic cross-section of experimental setup, distinguishing the two main methods used during experimentation. The above examples are fully sealed silica tube assemblies, following ~1 hour of vacuum evacuation, and are prepared for heating in the bottom loading furnace. In method 1, from bottom to top, sample A contains: a solid oxide buffer, crushed silica, a chromitite capsule filled with powdered basaltic glass, and a piece of the arsenide melt; topped with a silica ring spacer and a solid silica spacer to prevent heating of sample when sealing with the torch. For method 2, sample B differs from A in that, Pt powder was added excluding the As phase, and after an initial run it was then resealed and melted with the Pt-PtAs with no buffer, yielding sample C. For the purpose of convenience method 2-B and C, shows the presence of fine chromitite.
3. Analysis of Run-Products
All run-products were mounted in an epoxy puck and grinded into using silicon carbide paper
until the experiments were adequately exposed, and a final polishing was completed using 1 and 0.3µm
alumina. A Cameca SX50 electron microprobe at the University of Toronto was used for major element
analysis. Resulting silicate glasses were analyzed using a 15kV accelerating voltage and a 10nA beam
Solubility of the Assemblage Pt-PtAs in Basalt Andrew Canali
8
current at a defocused beam width of 10µm. Alloy phases were analyzed using a 10µm beam as well,
at an accelerating voltage of 20kV with a 30na beam current. Standards used for silicate glass analysis
included: natural basalt glass-Si, Fe, Al, Mg, Ca; bustamite-Ca; albite-Na; barite-Ba. High purity metals
were used as standards during alloy analysis.
LA-ICP-MS at the University of Toronto was used to determine the trace element composition of
the silicate glasses. Samples were ablated using a frequency quintupled Nd-doped Yttrium aluminum-
garnet (YAG) laser, which was paired with a VG PQExcell quadrupole mass spectrometer. The detector
consisted of a photomultiplier tube, which was able to switch between pulse counting and analog
depending on count rate (counts per second-cps); during analysis of one’s experiments counts never
exceeded 2,000,000cps, so the detector remained in analog mode. Ablation of the glass was done at a
frequency of 10Hz, with spot analysis ranging from 50-100 µm. The spot size was reduced when
analyzing the Cr-spinel (fine chromitite) grains present in the glass, where an 8-12 µm spot was
unitized at a frequency of 4Hz. During the 80 s data acquisition period for each analysis, 20 s of
“background” was obtained, prior to the 60s acquisition of ablated material. There was a 60 s washout
period in between each analysis. Pre-ablation of the area of interest and flushing with He allowed for
the removal of any surface impurities, providing a more reliable result during data acquisition. NIST610
was used as the standard glass during analyses, which was analyzed prior to, and after a block of no
more than 15 analyses. Data reduction was completed using the GLITTER software package, version
4.4. The trace element concentration of the NIST610 standard glass was used during data reduction,
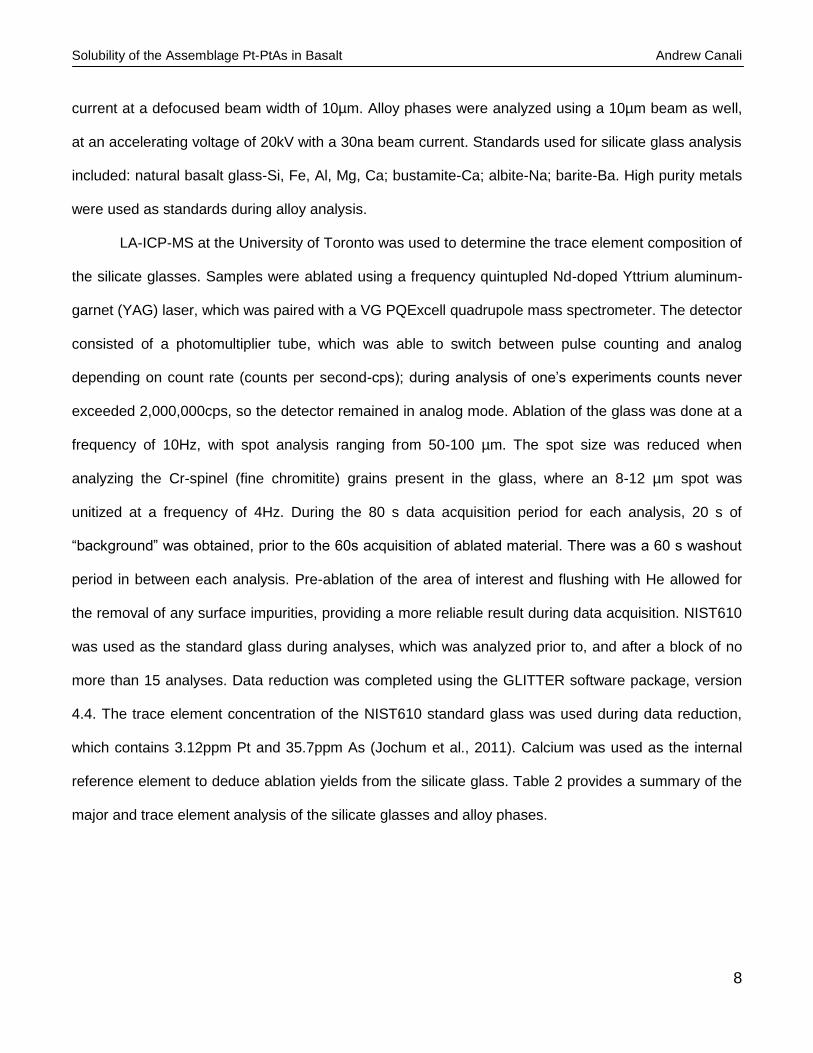
which contains 3.12ppm Pt and 35.7ppm As (Jochum et al., 2011). Calcium was used as the internal
reference element to deduce ablation yields from the silicate glass. Table 2 provides a summary of the
major and trace element analysis of the silicate glasses and alloy phases.
Solubility of the Assemblage Pt-PtAs in Basalt Andrew Canali
9

Solubility of the Assemblage Pt-PtAs in Basalt Andrew Canali
10

Solubility of the Assemblage Pt-PtAs in Basalt Andrew Canali
11
4. Results
4.1 Run Product Textures
The resulting run products all displayed similar textural relationships; where the quenched
basaltic glass exhibited a wetting meniscus clinging to each side of the chromitite capsule, with a
metallic phase (e.g. Pt-Fe alloy) present as a bead either at the bottom or top of the glass (See Figure
5). Blebs of the Pt-arsenide melt were usually suspended at the top of the meniscus, due to its
tendency to pool at the melt-air interface. For the most part the silicate glasses lacked any crystal
phase, aside from the crystallization of Ca-rich plagioclase, as determined by the energy dispersive
spectrometer (EDS) equipped to the scanning electron microscope (SEM) at the University of Toronto.
Along with the plagioclase, chromium-spinel (Cr-spinel) sometimes crystallized out of the melt, which is
most likely due to the high concentrations of dissolved Cr; however, both the plagioclase and spinel
were easily avoided during analysis. Pore spaces (20-100µm) were often preserved in the glass, which
indicates the entrapment of a gaseous phase upon quenching.
Figure 5: Backscattered electron image (BSEI) of the typical run product (SP2) textures, produced using the JEOL JSM-6610LV SEM. Contained in the chromitite capsule is a bright immiscible metallic phase (Pt+PtAs melt) atop quenched basaltic glass with laths of Ca-rich plagioclase radiating from the base of the capsule and the glass meniscus. Small pores are seen along chromitite-glass interface.
The Pt+PtAs eutectic used in the experiments consisted of a two-phase assemblage, where
solid Pt metal nuggets were suspended within a dendritic PtAs melt (See Figure 6).

Solubility of the Assemblage Pt-PtAs in Basalt Andrew Canali
12
Figure 6: BSEI of Pt+PtAs melt starting material. The two phases seen in this image are Pt suspended in a PtAs melt.
4.2 Run-Product Homogeneity
In order to assess the homogeneity of the run product glasses, the method proposed by Bennett
and Breanan (2013) was used, where the ratio of the respective time resolved spectra (TRS) provided
from LA-ICPMS analyses of the siderophile element in question and a stable lithophile element in the
melt was plotted against time; in this case it was 195Pt/43Ca vs. Time (s) (Figure 7-1 and 2). This
method revealed the samples containing Pt micro-inclusions by highlighting anomalous changes in the
signal aside from the inherent fluctuations, such as those produced by ablation and plasma instability,
which should be ubiquitous to both the Pt and Ca assuming the glass is homogenous. The main
inference from the plots suggests the glasses became progressively more heterogeneous with respect
to Pt solubility as fO2 decreased, implying that the formation of Pt micronuggets was not fully avoided.
The box plots in Figure 7 are both chosen from a section of TRS ~20sec into ablation and clearly
display the differences between the degree of scatter for the low (Mo-MoO2 buffered) and high fO2
(MnO-Mn3O4) runs- SP4 and SP7 respectively. It is also important to note that an average of 4 spots
were analyzed on each glass from top (near the meniscus) to bottom (near the capsule-melt boundary),
so the runs plotted in Figure 7 represent the TRS produced from top and bottom of the experiments,
and should help identify any gradient present in the glass. Although the highest fO2 run at the MnO-
Solubility of the Assemblage Pt-PtAs in Basalt Andrew Canali
13
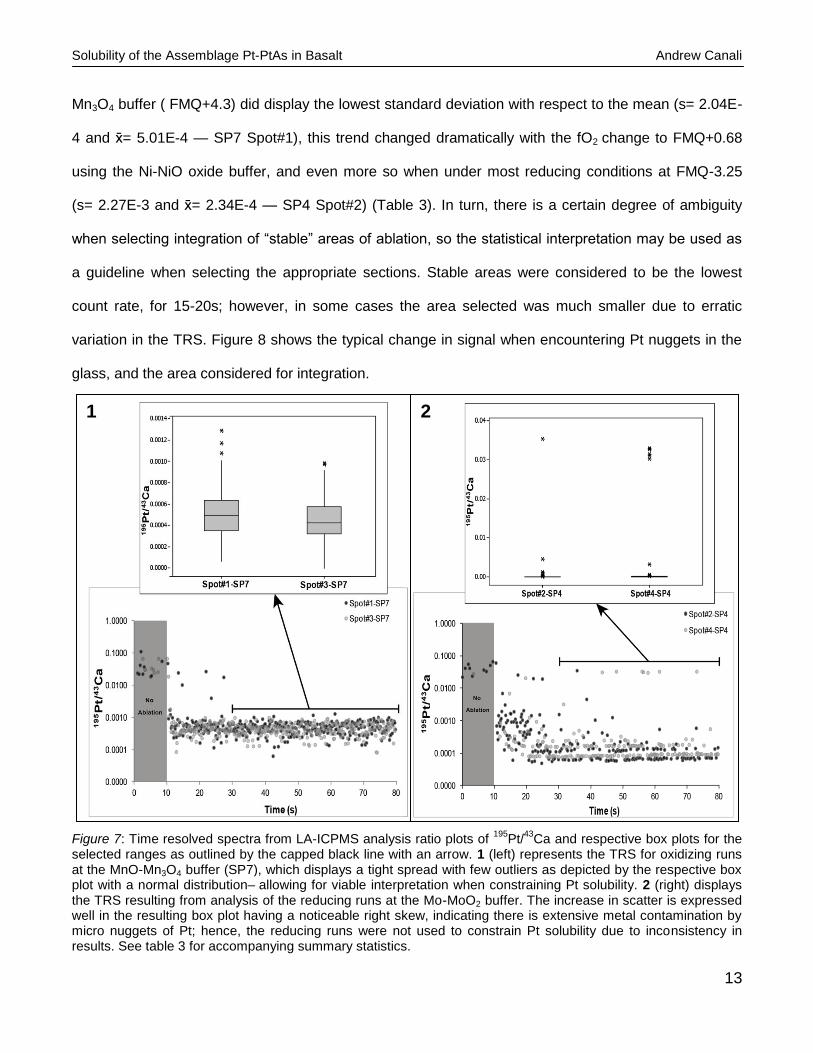
Mn3O4 buffer ( FMQ+4.3) did display the lowest standard deviation with respect to the mean (s= 2.04E-
4 and = 5.01E-4 — SP7 Spot#1), this trend changed dramatically with the fO2 change to FMQ+0.68
using the Ni-NiO oxide buffer, and even more so when under most reducing conditions at FMQ-3.25
(s= 2.27E-3 and = 2.34E-4 — SP4 Spot#2) (Table 3). In turn, there is a certain degree of ambiguity
when selecting integration of “stable” areas of ablation, so the statistical interpretation may be used as
a guideline when selecting the appropriate sections. Stable areas were considered to be the lowest
count rate, for 15-20s; however, in some cases the area selected was much smaller due to erratic
variation in the TRS. Figure 8 shows the typical change in signal when encountering Pt nuggets in the
glass, and the area considered for integration.
Figure 7: Time resolved spectra from LA-ICPMS analysis ratio plots of
195Pt/
43Ca and respective box plots for the
selected ranges as outlined by the capped black line with an arrow. 1 (left) represents the TRS for oxidizing runs at the MnO-Mn3O4 buffer (SP7), which displays a tight spread with few outliers as depicted by the respective box plot with a normal distribution– allowing for viable interpretation when constraining Pt solubility. 2 (right) displays the TRS resulting from analysis of the reducing runs at the Mo-MoO2 buffer. The increase in scatter is expressed well in the resulting box plot having a noticeable right skew, indicating there is extensive metal contamination by micro nuggets of Pt; hence, the reducing runs were not used to constrain Pt solubility due to inconsistency in results. See table 3 for accompanying summary statistics.
1 2

Solubility of the Assemblage Pt-PtAs in Basalt Andrew Canali
14
(195Pt/ 43Ca) Spot- SP7
(195Pt/ 43Ca) Spot 3-SP7
(195Pt/ 43Ca) Spot 2- SP4
(195Pt/ 43Ca) Spot 4- SP4
Mean ( ) 5.01E-04 Mean ( ) 4.51E-04 Mean ( ) 2.34E-04 Mean ( ) 9.99E-04
Standard Deviation (s) 2.04E-04
Standard Deviation (s) 1.87E-04
Standard Deviation (s) 2.27E-03
Standard Deviation (s) 5.33E-03
Standard Error (SE ) 1.30E-05
Standard Error (SE ) 1.19E-05
Standard Error (SE ) 1.45E-04
Standard Error (SE ) 3.40E-04
Median 4.96E-04 Median 4.25E-04 Median 6.19E-05 Median 8.27E-05
Mode 3.22E-04 Mode 5.17E-04 Mode 0 Mode 0
Skewness 0.551 Skewness 0.411 Skewness 15.25 Skewness 5.70
Range 1.23E-03 Range 9.83E-04 Range 0.035 Range 0.033
Minimum 6.316E-05 Minimum 0 Minimum 0 Minimum 0
Maximum 1.29E-03 Maximum 9.83E-04 Maximum 0.035 Maximum 0.033
Sum 0.124 Sum 0.111 Sum 0.058 Sum 0.246
Count 247 Count 247 Count 246 Count 246
Table 3: Summary statistics for the range outlined by the capped black lines above the TRS in Figure 7.
Figure 8: Typical TRS for
195Pt yielded from MnO-Mn3O4 buffered run product glasses. Note the spikes in counts
between 50 to 80sec, and the blue shaded area considered for integration during data reduction. The calculated sample standard deviation (s) is 1.6 E-4 cps and sample mean ( ) is 3.3E-4 cps for the area selected for integration.

Solubility of the Assemblage Pt-PtAs in Basalt Andrew Canali
15
4.3 Time and fO2 Dependence Of Pt and As Content in Run-Product Glasses
In order to assess equilibration of the run-product glasses, a time series was completed, where
each experiments at a fixed fO2 was run for different durations within a 4 day period. Results of the time
series indicate that the solubility of both Pt and As in the glasses is time dependent. This was indicated
by a distinct incremental loss of As with time in the Ni-NiO buffered runs, varying from 437.87±48.13
ppm to 238.82±48.79 ppm As at 24 and 87 hours respectively (Figure 9). In fact, the runs at Ni-NiO
displayed many of the trends best regarding time and fO2 dependence of both Pt and As content in the
melts, therefore, they were used for most of the interpretation.
Figure 9: Plot of As solubility and run duration; exhibiting a clear negative correlation between the two variables, indicating a decrease in As content with increasing run duration. Error bars express one standard deviation.
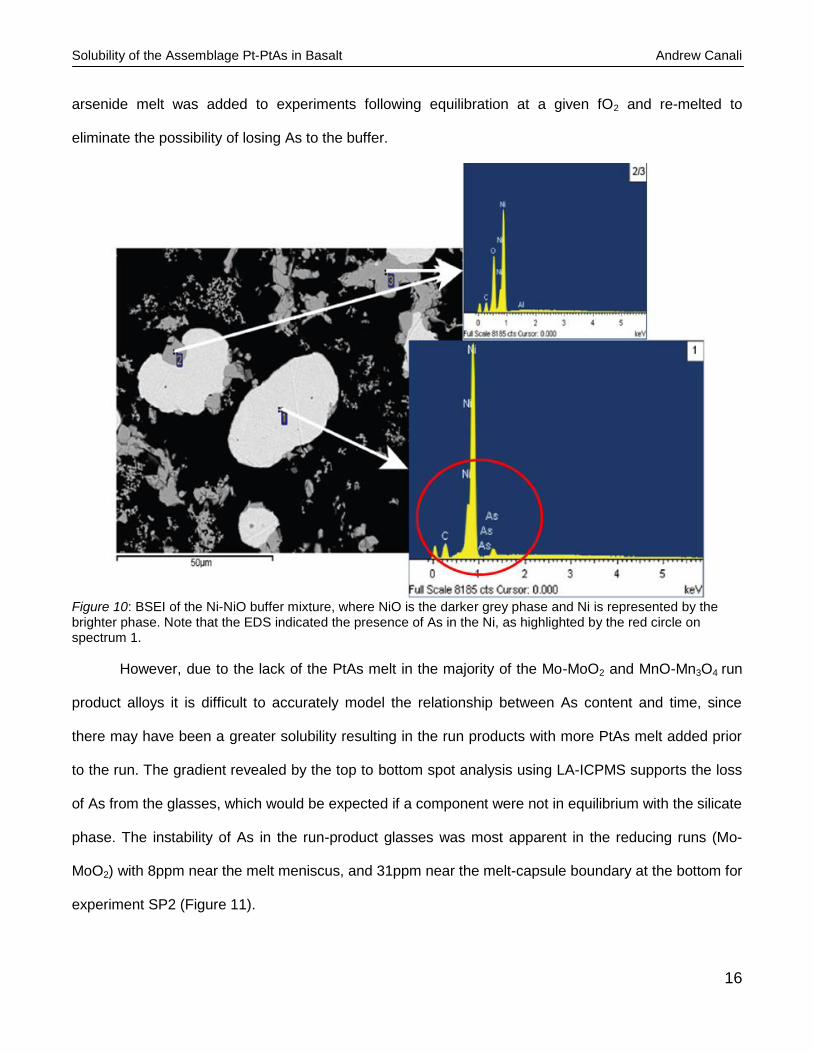
The loss of As may be explained by a reaction between As in vapor phase (As2(g)) with the buffer at the
bottom of the silica ampoule (Ni(s-buffer)):
(1)
The proposed interaction was confirmed by EDS of the buffer to contain both NiO and NiAs (Figure 10).
This phenomenon was the main reason for implementing the method 2, as mentioned above, where the
100
200
300
400
500
20 30 40 50 60 70 80 90 100
pp
m A
s
Run duration (hrs)
Ni-NiO Runs
Solubility of the Assemblage Pt-PtAs in Basalt Andrew Canali
16
arsenide melt was added to experiments following equilibration at a given fO2 and re-melted to
eliminate the possibility of losing As to the buffer.
Figure 10: BSEI of the Ni-NiO buffer mixture, where NiO is the darker grey phase and Ni is represented by the brighter phase. Note that the EDS indicated the presence of As in the Ni, as highlighted by the red circle on spectrum 1.
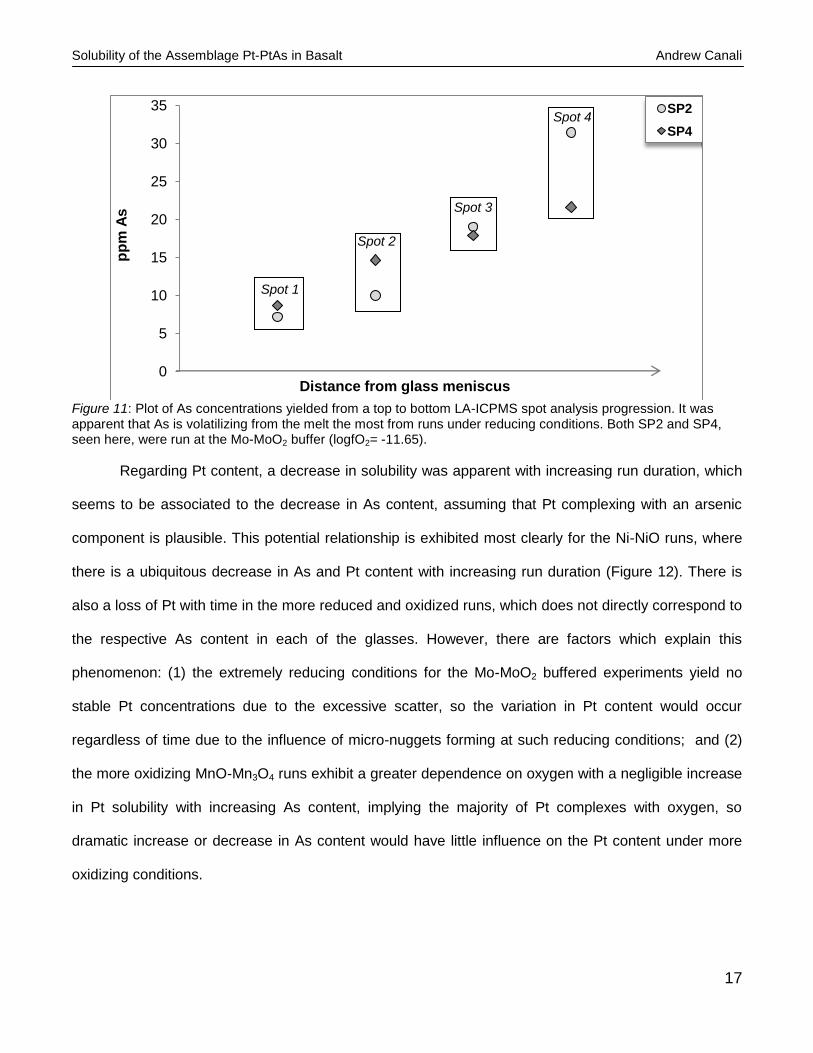
However, due to the lack of the PtAs melt in the majority of the Mo-MoO2 and MnO-Mn3O4 run
product alloys it is difficult to accurately model the relationship between As content and time, since
there may have been a greater solubility resulting in the run products with more PtAs melt added prior
to the run. The gradient revealed by the top to bottom spot analysis using LA-ICPMS supports the loss
of As from the glasses, which would be expected if a component were not in equilibrium with the silicate
phase. The instability of As in the run-product glasses was most apparent in the reducing runs (Mo-
MoO2) with 8ppm near the melt meniscus, and 31ppm near the melt-capsule boundary at the bottom for
experiment SP2 (Figure 11).
Solubility of the Assemblage Pt-PtAs in Basalt Andrew Canali
17
Figure 11: Plot of As concentrations yielded from a top to bottom LA-ICPMS spot analysis progression. It was apparent that As is volatilizing from the melt the most from runs under reducing conditions. Both SP2 and SP4, seen here, were run at the Mo-MoO2 buffer (logfO2= -11.65).
Regarding Pt content, a decrease in solubility was apparent with increasing run duration, which
seems to be associated to the decrease in As content, assuming that Pt complexing with an arsenic
component is plausible. This potential relationship is exhibited most clearly for the Ni-NiO runs, where
there is a ubiquitous decrease in As and Pt content with increasing run duration (Figure 12). There is
also a loss of Pt with time in the more reduced and oxidized runs, which does not directly correspond to
the respective As content in each of the glasses. However, there are factors which explain this
phenomenon: (1) the extremely reducing conditions for the Mo-MoO2 buffered experiments yield no
stable Pt concentrations due to the excessive scatter, so the variation in Pt content would occur
regardless of time due to the influence of micro-nuggets forming at such reducing conditions; and (2)
the more oxidizing MnO-Mn3O4 runs exhibit a greater dependence on oxygen with a negligible increase
in Pt solubility with increasing As content, implying the majority of Pt complexes with oxygen, so
dramatic increase or decrease in As content would have little influence on the Pt content under more
oxidizing conditions.
Spot 1
Spot 2
Spot 3
Spot 4
0
5
10
15
20
25
30
35 p
pm
As
Distance from glass meniscus
SP2
SP4

Solubility of the Assemblage Pt-PtAs in Basalt Andrew Canali
18
Figure 12: Plot of As solubility and Pt solubility at different run durations for experiments run with the Ni-NiO buffer. There is a noticeable loss of both Pt and As with increasing run duration, which implies a dependence of both components on one-another in the melt.
Changes in fO2 yielded the most significant influence on Pt content, which was expected
considering the extensive research already completed regarding the affect of fO2 on PGE solubility.
Generally there was a direct positive correlation between Pt content and fO2, where an increase in fO2
resulted in a greater Pt solubility. This relationship indicates the tendency for platinum to exist as an
oxide species in the melt.
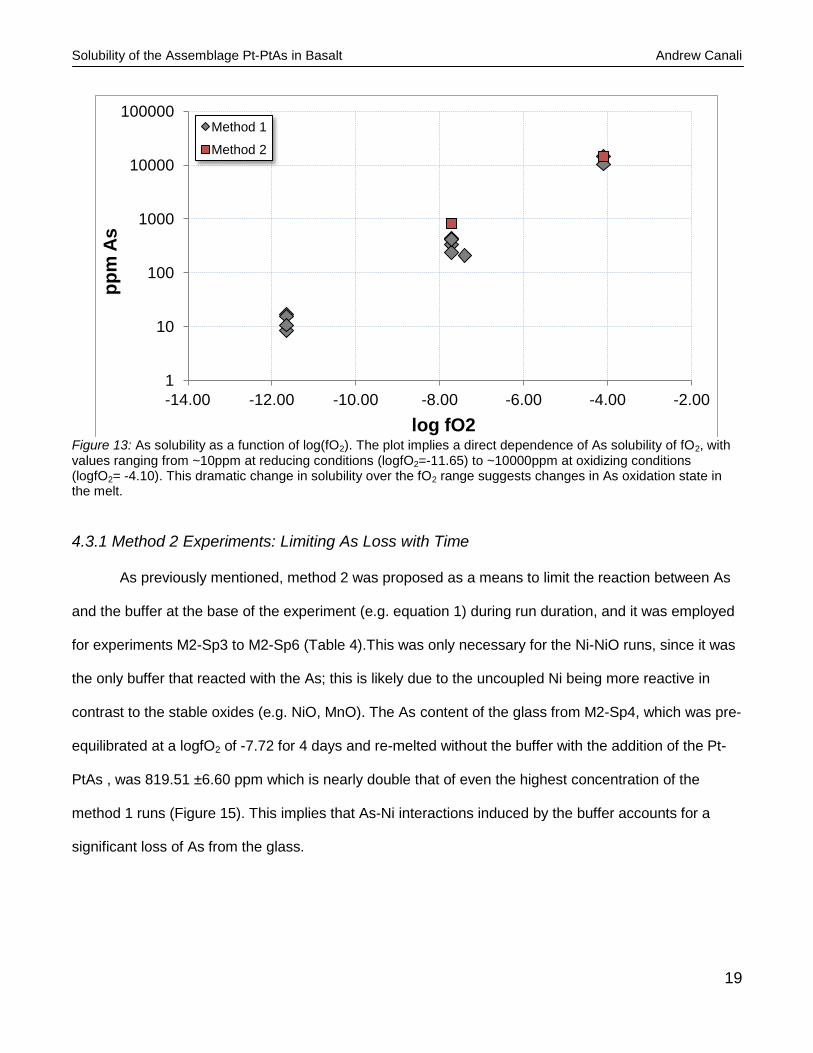
The same trend was noticed for As, where an increase in solubility was directly associated with
an increase in fO2 (Figure 13), which indicates the presence of As-oxide species in the melt. At the
lowest fO2 (logfO2= -11.65) ~10 ppm of As was soluble, where at the highest fO2 (logfO2= -4.10) the
solubility increased dramatically to up to nearly 1.5 wt%. Since no PtAs was detected in the MnO-
Mn3O4 buffered run product alloys, it implies the runs were not saturated in the PtAs melt; however,
method 2 run products maintained arsenide saturation and yielded a similar As solubility.
70 hrs
87 hrs
24 hrs 48 hrs
0
100
200
300
400
500
600
0.00 0.05 0.10 0.15 0.20
pp
m A
s
ppm Pt
Ni-NiO runs
Solubility of the Assemblage Pt-PtAs in Basalt Andrew Canali
19
Figure 13: As solubility as a function of log(fO2). The plot implies a direct dependence of As solubility of fO2, with values ranging from ~10ppm at reducing conditions (logfO2=-11.65) to ~10000ppm at oxidizing conditions (logfO2= -4.10). This dramatic change in solubility over the fO2 range suggests changes in As oxidation state in the melt.
4.3.1 Method 2 Experiments: Limiting As Loss with Time
As previously mentioned, method 2 was proposed as a means to limit the reaction between As
and the buffer at the base of the experiment (e.g. equation 1) during run duration, and it was employed
for experiments M2-Sp3 to M2-Sp6 (Table 4).This was only necessary for the Ni-NiO runs, since it was
the only buffer that reacted with the As; this is likely due to the uncoupled Ni being more reactive in
contrast to the stable oxides (e.g. NiO, MnO). The As content of the glass from M2-Sp4, which was pre-
equilibrated at a logfO2 of -7.72 for 4 days and re-melted without the buffer with the addition of the Pt-
PtAs , was 819.51 ±6.60 ppm which is nearly double that of even the highest concentration of the
method 1 runs (Figure 15). This implies that As-Ni interactions induced by the buffer accounts for a
significant loss of As from the glass.
1
10
100
1000
10000
100000
-14.00 -12.00 -10.00 -8.00 -6.00 -4.00 -2.00
pp
m A
s
log fO2
Method 1
Method 2

Solubility of the Assemblage Pt-PtAs in Basalt Andrew Canali
20
1M2-Sp3 1σ
2M2-Sp4 1σ
1M2-Sp5 1σ
2M2-Sp6 1σ
T(oC) 1200
1200
1200
1200
Buffer Ni-NiO
Ni-NiO
MnO-Mn3O4
MnO-Mn3O4
log fO2 -7.72
-7.72
-4.10
-4.10
FMQ 0.68
0.68
4.30
4.30
duration (hrs)
96
192
96
192
glass comp C C C C
silicate (wt%)
SiO2 47.71 0.12 47.52 0.21 50.69 0.40 49.58 0.40
TiO2 5.28 0.17 5.00 0.19 6.04 0.18 5.74 0.23
Al2O3 15.27 0.06 15.02 0.11 14.38 0.09 14.64 0.13
FeO 10.88 0.11 11.58 0.19 9.37 0.19 9.19 0.15
MgO 8.82 0.10 8.79 0.09 5.88 0.07 6.03 0.07
CaO 12.06 0.17 11.86 0.15 11.90 0.16 12.03 0.05
Na2O 0.48 0.03 0.44 0.06 0.44 0.04 0.91 0.06
MnO 0.19 0.03 0.19 0.04 0.11 0.03 0.12 0.03
K2O 0.12 0.02 0.08 0.02 0.16 0.03 0.14 0.04
Oxide Totals
100.82 0.33 100.47 0.41 98.96 0.64 98.38 0.75
ppm As nd 819.51 6.60 nd 14376.92 804.45
alloy at% Fe 7.44
-
1.24
-
Pt 91.02 - 97.09 -
aPt alloy 0.506
0.942
3[Pt] = 1 ppm Pt 0.036 0.004 0.064 0.021
Table 4: Summary of phase compositions from method 2 run product glasses. Note: 1= As-free experiments, 2= As bearing experiments and 3= Value corrected to unit activity of Pt calculated from the Pt content of the metal phase.
Unfortunately, the Pt content of the glasses bearing an arsenide phase, such as M2-Sp4, was
not accurate with relation to initial experiments. This is due to the extremely low [Pt] in the melt,
reflected by the once Pt-Fe saturated precursor run product for M2-Sp4 which contained only Pt-As
alloy after the re-melt in the presence of the arsenide phase; usually both alloy phases are present, and
the lack of Pt-Fe indicates undersaturation of Pt. The Pt-PtAs starting material was re-synthesized prior
to completion of the method 2 experiments and compositional issues may be to blame for the lack of
Pt-Fe in the run products. An attempt at method 2 was also made for MnO-Mn3O4 buffered runs (logfO-
2= -4.10), with the main reason of these experiment being to determine As content while maintaining
arsenide saturation. Since no loss of As was noticed with time for these experiments, suggesting no
Solubility of the Assemblage Pt-PtAs in Basalt Andrew Canali
21
reaction with the buffer, the removal of the buffer was just a test of the reproducibility of method 2. The
As content for M2-SP6 was found to be 14,376.92 ± 804.45 ppm or ~1.4wt%, which is nearly the same
as the runs completed with the buffer (e.g. SP7- 14684.32 ± 1681.41 ppm As), which suggests that the
run may very well have been saturated in Pt-As, just not visibly in the polished mount.
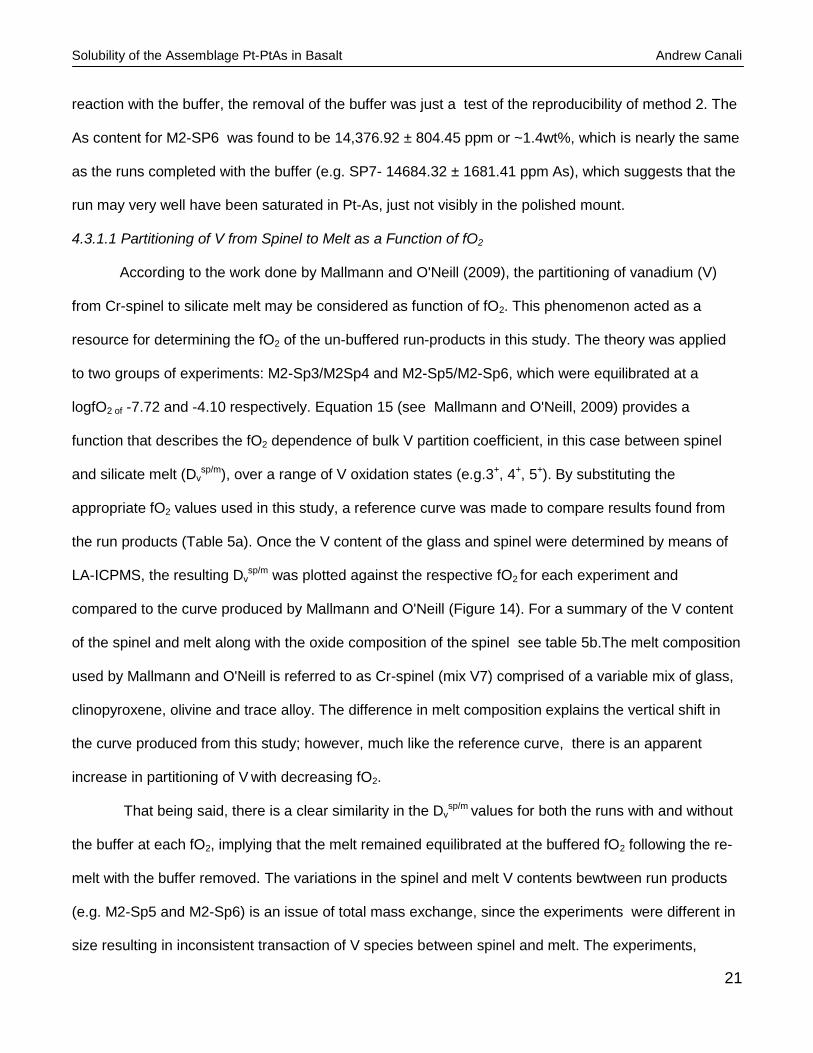
4.3.1.1 Partitioning of V from Spinel to Melt as a Function of fO2
According to the work done by Mallmann and O'Neill (2009), the partitioning of vanadium (V)
from Cr-spinel to silicate melt may be considered as function of fO2. This phenomenon acted as a
resource for determining the fO2 of the un-buffered run-products in this study. The theory was applied
to two groups of experiments: M2-Sp3/M2Sp4 and M2-Sp5/M2-Sp6, which were equilibrated at a
logfO2 of -7.72 and -4.10 respectively. Equation 15 (see Mallmann and O'Neill, 2009) provides a
function that describes the fO2 dependence of bulk V partition coefficient, in this case between spinel
and silicate melt (Dvsp/m), over a range of V oxidation states (e.g.3+, 4+, 5+). By substituting the
appropriate fO2 values used in this study, a reference curve was made to compare results found from
the run products (Table 5a). Once the V content of the glass and spinel were determined by means of
LA-ICPMS, the resulting Dvsp/m was plotted against the respective fO2 for each experiment and
compared to the curve produced by Mallmann and O'Neill (Figure 14). For a summary of the V content
of the spinel and melt along with the oxide composition of the spinel see table 5b.The melt composition
used by Mallmann and O'Neill is referred to as Cr-spinel (mix V7) comprised of a variable mix of glass,
clinopyroxene, olivine and trace alloy. The difference in melt composition explains the vertical shift in
the curve produced from this study; however, much like the reference curve, there is an apparent
increase in partitioning of V with decreasing fO2.
That being said, there is a clear similarity in the Dvsp/m
values for both the runs with and without
the buffer at each fO2, implying that the melt remained equilibrated at the buffered fO2 following the re-
melt with the buffer removed. The variations in the spinel and melt V contents bewtween run products
(e.g. M2-Sp5 and M2-Sp6) is an issue of total mass exchange, since the experiments were different in
size resulting in inconsistent transaction of V species between spinel and melt. The experiments,
Solubility of the Assemblage Pt-PtAs in Basalt Andrew Canali
22
however, do plot within two distinct partitioning regimes, with DVsp/m values of 1.27 and 2.89 at a logfO2=
-4.10, and 13.64 and 16.16 at a logfO2= -7.72, which suggest the fO2 was consistent between the run
product groups with and without the buffer.
Figure 14: Plot of DV
sp/m for M2-Sp3 to M2-Sp6 (diamonds) with respect to ΔFMQ. The grey circles represent
values plotted using equation 15 from Mallmann and O'Neill, 2009. A clear increase in V partitioning from spinel to melt with decreasing fO2; the run products from method two plot in two distinct regions.
DV3+ DV4+ DV5+ (Klhom(6a))
-1 (K
lhom(6b))
-1 (K
lhom(6c))
-1 logfO2 fO2 DV
sp/m ΔFMQ
3.9E+01 3.9 3.0E-03 2.5E-09 3.0E-05 3.1E-03 -8.4 4.0E-09 10.7 0.0
3.9E+01 3.9 3.0E-03 2.5E-09 3.0E-05 3.1E-03 -7.7 1.9E-08 6.4 0.7
3.9E+01 3.9 3.0E-03 2.5E-09 3.0E-05 3.1E-03 -7.4 4.0E-08 4.9 1.0
3.9E+01 3.9 3.0E-03 2.5E-09 3.0E-05 3.1E-03 -6.4 4.0E-07 2.0 2.0
3.9E+01 3.9 3.0E-03 2.5E-09 3.0E-05 3.1E-03 -5.4 4.0E-06 0.8 3.0
3.9E+01 3.9 3.0E-03 2.5E-09 3.0E-05 3.1E-03 -4.1 7.9E-05 0.3 4.3
Table 5a: DVsp/m
values calculated from equation 15 (Mallmann and O'Neill, 2009).Constants were taken from table 6 from the same paper.
M2-Sp3
M2-Sp4
M2-Sp5
M2-Sp6
0.00
2.00
4.00
6.00
8.00
10.00
12.00
14.00
16.00
18.00
0.00 1.00 2.00 3.00 4.00 5.00
DV
(sp
/m)
∆FMQ
This Study
eq'n15-Mallmann/O'Neill, 2009

Solubility of the Assemblage Pt-PtAs in Basalt Andrew Canali
23
M2-SP3 1σ M2-SP4 1σ M2-SP5 1σ M2-SP6 1σ
Vspinel (ppm) 475.53
563.75
998.08
256.03
Vmelt (ppm) 34.86
34.88
345.70
202.21 DV
sp/m 13.64
16.16
2.89
1.27
ΔFMQ 0.68
0.68
4.30
4.30
Spinel (wt%)
SiO2 0.12 0.05 0.03 0.01 0.06 0.05 0.11 0.10
TiO2 0.58 0.16 0.87 0.49 2.93 0.12 4.61 0.49
V2O3 0.09 0.02 0.09 0.02 0.03 0.01 0.17 0.02
Al2O3 17.22 1.23 17.77 0.91 11.52 0.23 20.74 1.41
Cr2O3 46.26 1.43 46.02 1.41 27.09 0.86 30.13 1.73
FeO 15.70
16.94
17.40
19.39
Fe2O3 5.57
3.34
25.79
9.53
MnO 0.21 0.01 0.20 0.02 0.22 0.02 0.19 0.01
MgO 12.01 0.31 11.32 0.58 10.95 0.12 12.20 0.55
NiO 0.25 0.02 0.03 0.01 0.69 0.03 0.12 0.01
Total 98.01 0.60 96.61 1.29 96.67 0.52 97.18 1.87
Table 5b: Summary of V content of spinel and melt determined by LA-ICPMS, and oxide composition of spinels from the respective run-products detrermined by EPMA.
4.4 Determination of Pt Solubility as a Function of fO2
It is assumed that Pt dissolves in silicate melts as an oxide under oxidizing conditions; taking
the valence state of Pt (x+) into account, this may be expressed as:
(2)
where the subscripts (met), (g), and (sil) represent components in metal, gas and silicate phase
respectively.
The equilibrium constant for equation 1 (Ke1) may be represented as:
(3)

Solubility of the Assemblage Pt-PtAs in Basalt Andrew Canali
24
where square brackets denote activities; the over scripts (sil and met) imply the respective phase in
which the component is present; and oxygen fugacity is represented by fO2.
An expression for logKe1 is then:
(3a)
Equation 2a may be rearranged when the system is saturated in Pt metal, where the product of
the mole fraction and activity coefficient of species i is equal to activity of species i (e.g. [ i ] = Xi ·γi),
yielding the expression:
(4)
where A represents a constant. Assuming Pt concentrations dissolved in the melt are very low at
saturation in Pt metal, implying Henry’s Law applies, equation 3 shows that solubility of Pt should
increase with respect to increasing oxygen fugacity, proportional to
.The common oxidation
state of Pt under oxidizing conditions is 2+, as determined by Borisov and Palme (1997), at a logfO2
range of 0 to -5 at ~1400°C. However, the development of metal inclusions as micro particles at
reducing conditions results in excessive scatter yielded from analytical techniques. The inability to
make precise measurements at reducing conditions may be due to a potential change in oxidation state
of PGEs at low fO2.
4.4.1 Corrections for Pt Activity: Effect of Fe in Pt
Since an Fe-bearing melt was used throughout experimentation (~10wt% FeO), the formation of
an immiscible Fe-Pt alloy was unavoidable. This characteristic reflects the siderophile tendency for Pt
when in the presence of Fe in magmatic systems, which is shared by all other PGEs. In order to
properly quantify Pt solubility in the run-products, the Fe portion of the alloys were taken into account.

Solubility of the Assemblage Pt-PtAs in Basalt Andrew Canali
25
The relationships derived by Borisov and Palme (2000) provided the definitions to correct for an activity
of Pt equal to 1 ([Pt]=1) in the melt using the following expressions:
(5)
(6)
(7)
where γPt is the activity coefficient of Pt in the silicate; XFe and XPt are the mole fractions of Fe and Pt
respectively; the two constants B = –3.326564, and C = 0.221051 are from Heald (1967) and are
considered valid estimates over the temperature range of 1130-1550°C. The final activity of Pt ([Ptfinal]) is
represented by the initial activity as reported from data reduction ([Pto]) over the activity found in
equation 5 ([Pt]). A regular increase in Pt activities was noticed when corrected for activity equal to 1.
4.5 Solubility of Pt in As-Bearing and As-Free Experiments
After investigating the measured Pt solubilities for both As-bearing and As-free experiments,
there was a noticeable contrast between the respective quantities for each (See figure 15 and Table
2/Table 4). As a side note, plotting of the solubilities determined from the reducing conditions was done
just to display the scatter associated with these values, and no viable results were inferred. On the
other hand, there is a distinct difference between Pt concentrations in the Ni-NiO runs, which implies
potential for As complexing. The average Pt solubility for the As-bearing Ni-NiO runs was found to be
0.133±0.011 ppm Pt determined from the 24 hr to 70 hr run durations, since the 87 hr run is far too
depleted in As due to reaction with buffer to be a representative quantity. In contrast to the
measurements of the As-free experiment, a Pt solubility of 0.021±0.009 ppm was found, which
indicates that at the same fO2 the complexing of Pt with only O results in a lower solubility than if an As
Solubility of the Assemblage Pt-PtAs in Basalt Andrew Canali
26
component is present. A similar trend was noticed in the MnO-Mn3O4 buffered runs, but to a lesser
extent. The solubility of the As-bearing experiments was on average 0.191±0.020 ppm Pt; where the
As-free experiment resulted in dissolution of 0.141±-0.030 ppm Pt. As mentioned above, all of the
MnO-Mn3O4 buffered runs were not saturated in the arsenide melt, implying that there is the potential
for more As to be dissolved in the melt, which may yield higher Pt solubility if a direct dependence of Pt
solubility is assumed to be related to the presence of As. In any case, the variations in the Pt content of
the product glasses bearing arsenic, and those not, indicate the possibility of an As component in the
melt behaving as a complexing ligand; in turn influencing Pt solubility.
5. Discussion
5.1 Estimation of Arsenic Speciation as a Function of fO2
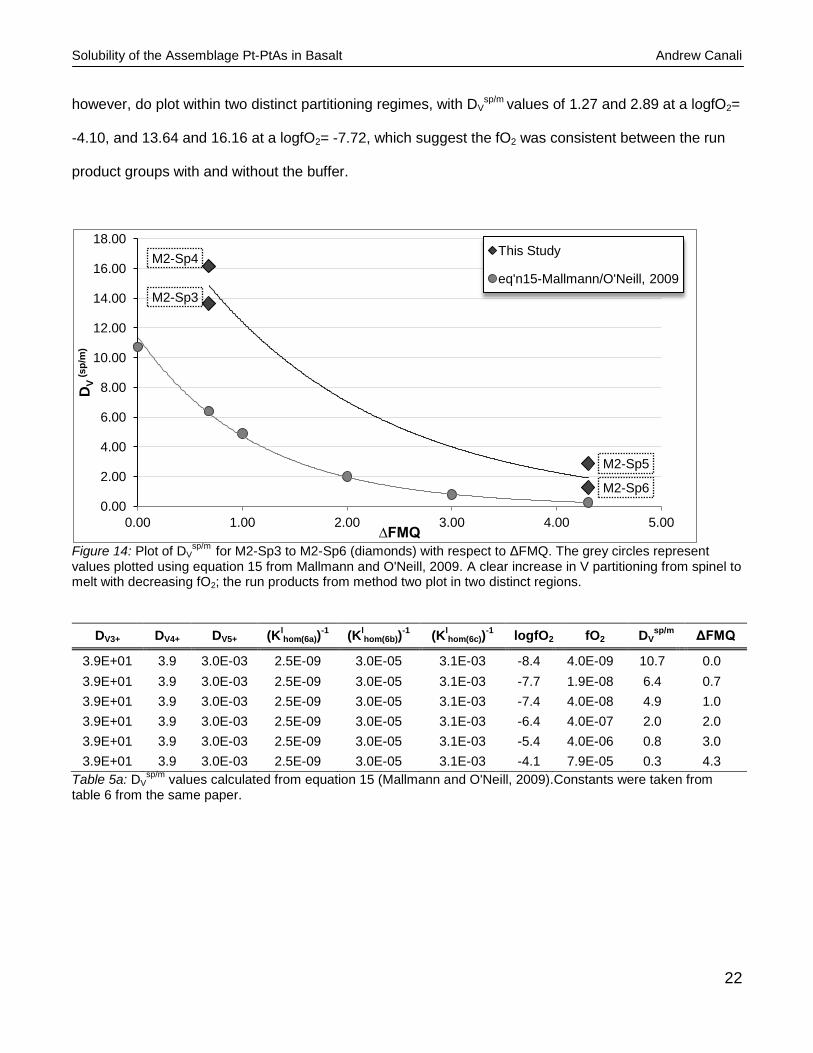
Due to the lack of the arsenide melt phase in many of the run-product alloys produced under
oxidizing conditions, it is difficult to constrain the average activity of As in the alloys; however, the bulk
of the analyses on the runs at ΔFMQ of +0.68 yielded a stable As content at ~15at%, whereas the one
analysis of the alloy formed at ΔFMQ of -3.3 was found to contain 22.50at% As (See table 6).
Arsenide melt at%
Expt. ID
T(oC) Buffer log fO2 FMQDuration
(hrs) Glass comp
Fe Pt As
Sp1 1200 Ni-NiO -7.72 0.68 69.50 C nd nd nd
Sp2 1200 Mo-MoO2 -11.65 -3.25 65 C nd nd nd
Sp4 1202 Mo-MoO2 -11.65 -3.25 87.33 C 4.60 71.90 22.50
Sp5 1202 Ni-NiO -7.72 0.68 87.33 C 0.02 83.90 14.76
Sp7 1202 MnO-Mn3O4 -4.10 4.30 87.33 C nd nd nd
Sp8 1203 Ni-NiO -7.72 0.68 23.50 C 0.04 84.40 14.95
Sp9 1203 Ni-NiO -7.72 0.68 47.66 C 0.03 83.37 15.73 1Sp10 1203 Ni-NiO/Mo-MoO2 -11.65 -3.25 178.33 C nd nd nd
Sp14 1202 MnO-Mn3O4 -4.10 4.30 48 C nd nd nd
Sp15 1202 Mo-MoO2 -11.65 -3.25 45.50 C nd nd nd
Table 6: Arsenide melt compositions as determined using EMPA. Note that nd= not determined, and 1= a two-step
equilibration initially at Ni-NiO and then at Mo-MoO2.
Solubility of the Assemblage Pt-PtAs in Basalt Andrew Canali
27
This variation implies that As activity does change with respect to fO2, but until further analysis of the
arsenide alloy of run products at ΔFMQ= 4.30 no decisive conclusion may be made. Despite the minor
variation in the activity of As in the alloys, the arsenic content of the silicate melt varies considerably
with fO2, with values of 8-17 ppm at ΔFMQ of -3.3, to as high as ~1-1.5 wt% at ΔFMQ of +4.3, with
intermediate solubility of 240-440 ppm at ΔFMQ of +0.68. The changes in As solubility with fO2 may be
expressed by the following dissolution reaction:
(8)
where (PtAs) represents the As dissolved in the metallic PtAs melt, and (sil) implies AsOn/2 in the
silicate melt. Since As exists in nature over a range of valence states (-3 to +5) it is important to
comprehend the common oxidation states in which it exists in silicate melts in order to properly model
the solubility as a function of fO2. There is no direct research regarding speciation of As in basaltic
composition melts, however, the work completed by Chen and Jahanshahi (2010) on FeOx-CaO-SiO2
slags may be used as one of the few analogues suggested. Their measurements of the distribution of
As at 1300°C over a given fO2 range for both calcium ferrite and silicate slags indicate that As exists
mainly in a +3 oxidation state, or an As2O3 (AsO1.5) species. Further investigation by Yoshida et al
(2010) into the effect of silicate melt composition on redox behaviour of As using differential pulse
voltammetry on a soda-lime-silicate glass suggests that [As3+]/ [As5+] ratios and [As0]/ [As3+] may be
determined based on melt basicity and the stability of a complex containing As. With the incorporation
of alkaline earth metals into the structure of the silicate glasses at different temperatures, they were
able to deduce changes to the aforementioned As oxidation state ratios through replacements that take
place within the glasses following addition. Around the same time Borisova et al (2010) took interest in
the oxidation state of As in peraluminous melts (e.g. macusanite) using an array of analytical
techniques, including X-ray absorption spectroscopy (XANES), which resulted in the identification of
As3+ and As5+. Since the past research bares a slight resemblance in some cases to the experiments
completed in this study, it reasonable to assume that As may exist mainly in a 0, 3+, and 5+ state within

Solubility of the Assemblage Pt-PtAs in Basalt Andrew Canali
28
the resulting glasses. Although, a vital issue proposed by Chunlin (2010), which pertains to one’s
experiments, is the suggestion that γAsO1.5 (activity coefficient of AsO1.5) in the slags may change with
fO2 given that the Fe3+/Fe2+ ratio is not constant . Applying this concept to the run-products from this
study suggests that over the fO2 range the Fe3+/Fe2+ ratio is varying in each resulting glass, and as
noted Yoshida et al (2010), since As speciation may in fact be affected by changes in melt basicity,
then quantifying the species based strictly on fO2 may does not account for these inherent variations.
For the purpose of modeling, however, it is assumed that the variations in melt basicity is negligible,
and all other components remain constant resulting in a purely fO2 dependent As speciation. In this
case, the total As content may then be modeled by summing the contributions of As0, As3+, As5+
species, and their respective concentrations, for each [AsOn/2] species, which may be represented by
the solubility product:
(9)
Which, summing over all species present yields the relation:
(10)
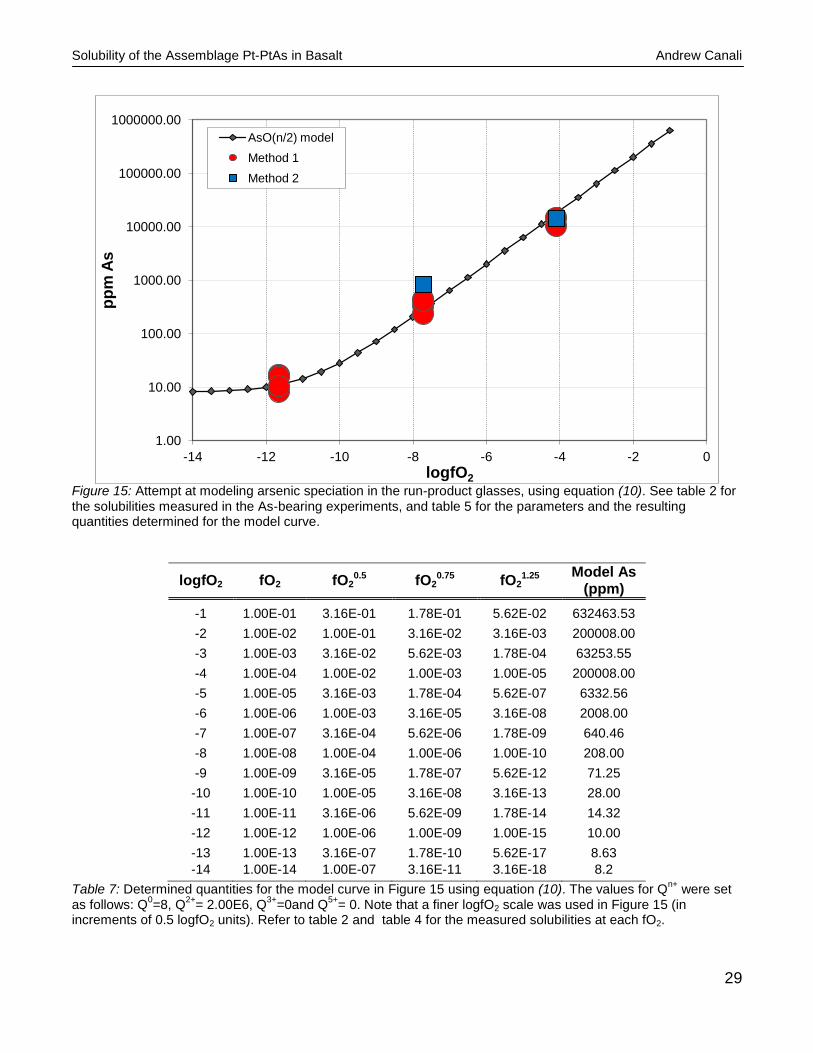
Informed by previous work on arsenic speciation, the arsenic solubility as a function of fO2 measured in
this study is modeled by iteratively changing values of Qn+ until a best fit is obtained for the data. Note
that for the neutral As species, the model value for Q0 is the limiting solubility at low fO2. The model
curve produced in Figure 15 was found to be the closest fit to the solubilities measured from the run-
products, where only Q0 and Q3+ were considered to significantly contribute to the model (See table 7
for accompanying data). If this assumption is correct, then As0 and As2+are the predominant oxidation
states in the glasses over the given fO2 range.
Solubility of the Assemblage Pt-PtAs in Basalt Andrew Canali
29
Figure 15: Attempt at modeling arsenic speciation in the run-product glasses, using equation (10). See table 2 for the solubilities measured in the As-bearing experiments, and table 5 for the parameters and the resulting quantities determined for the model curve.
logfO2 fO2 fO20.5 fO2
0.75 fO21.25
Model As (ppm)
-1 1.00E-01 3.16E-01 1.78E-01 5.62E-02 632463.53
-2 1.00E-02 1.00E-01 3.16E-02 3.16E-03 200008.00
-3 1.00E-03 3.16E-02 5.62E-03 1.78E-04 63253.55
-4 1.00E-04 1.00E-02 1.00E-03 1.00E-05 200008.00
-5 1.00E-05 3.16E-03 1.78E-04 5.62E-07 6332.56
-6 1.00E-06 1.00E-03 3.16E-05 3.16E-08 2008.00
-7 1.00E-07 3.16E-04 5.62E-06 1.78E-09 640.46
-8 1.00E-08 1.00E-04 1.00E-06 1.00E-10 208.00
-9 1.00E-09 3.16E-05 1.78E-07 5.62E-12 71.25
-10 1.00E-10 1.00E-05 3.16E-08 3.16E-13 28.00
-11 1.00E-11 3.16E-06 5.62E-09 1.78E-14 14.32
-12 1.00E-12 1.00E-06 1.00E-09 1.00E-15 10.00
-13 1.00E-13 3.16E-07 1.78E-10 5.62E-17 8.63
-14 1.00E-14 1.00E-07 3.16E-11 3.16E-18 8.2
Table 7: Determined quantities for the model curve in Figure 15 using equation (10). The values for Qn+
were set as follows: Q
0=8, Q
2+= 2.00E6, Q
3+=0and Q
5+= 0. Note that a finer logfO2 scale was used in Figure 15 (in
increments of 0.5 logfO2 units). Refer to table 2 and table 4 for the measured solubilities at each fO2.
1.00
10.00
100.00
1000.00
10000.00
100000.00
1000000.00
-14 -12 -10 -8 -6 -4 -2 0
pp
m A
s
logfO2
AsO(n/2) model
Method 1
Method 2

Solubility of the Assemblage Pt-PtAs in Basalt Andrew Canali
30
5.2 Modeling Pt-O and Pt-As Complexing in Silicate Melts
The variation in Pt solubility in the melt may arise through interactions with both oxygen and
arsenic. Obviously those experiments containing no As are considered to be strictly complexing with O,
forming a PtO species dissolved in the silicate melt (equation 2). Whereas, the experiments bearing As
may be dissolving Pt as result of Pt-O, Pt-As or Pt-As-O interactions. First off, the attempt at modelling
the PtO component was completed using the same method noted earlier for determining As speciation
as a function of fO2, since Pt speciation also has a distinct dependence on fO2. For the purpose of
displaying solubilities over a larger fO2 range, Dr. James Brenan at the University of Toronto provided
supplemental data for experiments depicting Pt solubility in the same melt composition at the same
temperature over a wider fO2 range (see Figure 16). By substituting a PtOn/2 species into equation (10)
according to the dissolution reaction noted in equation (2), the resulting expression for total Pt (Pttotal) in
the melt may be represented as:
(11)
By once again adjusting the values for Qn+ for each Pt oxidation state, one was able to fit a suitable
curve to the measured solubilities. Note that the Q0 species determined the solubility at low fO2. The
resulting curve as seen in Figure 16 is assumed to be the best fit according to the measured solubilities
at each fO2, when considering only Pt-O complexing.
Due to the inability to determine As fugacity (fAs2) in the experiments, it is not reasonable to
model the Pt-As or Pt-As-O complexing strictly as a function of fO2. For this reason, a hypothetical ideal
curve was fit to the data, and it is suggested that the line is constrained by the main reaction:

Solubility of the Assemblage Pt-PtAs in Basalt Andrew Canali
31
(12)
However, since O may actually be complexing with Pt simultaneously with As, a Pt-As-O interaction is a
more likely dissolution mechanism. Due to the prior modeling of As speciation in the melt revealing As2+
as a major constituent, it may be possible for Ptx+ to be reacting with an AsO33- ligand in a gaseous
phase to produce Pt(AsO3)x species dissolved in the melt; which may be expressed as:
(13)
It is important to note that until further research is completed this stands as a hypothetical relationship
and is strictly presented as a thought experiment.

Solubility of the Assemblage Pt-PtAs in Basalt Andrew Canali
32
Figure 16: Summary plot of Pt solubility, including experiments completed by Brenan (2014). The reaction stated above each model curve represents the reaction controlling the dissolution of Pt in the silicate melt. Note that the Blue dashed line indicates a hypothetical ideal curve fit to represent both As and As-O complexing with Pt in the melt. According the line fit to the As-bearing solubilities it is apparent at a logfO2>-4, equation (2) is the controlling reaction and Pt is dissolved mainly as an oxide. However, when logfO2<-4 there is an indication of Pt-As and Pt-As-O complexing according to equations (12) and (13). See table 8 for model solubilities.
logfO2 fO2 fO20.5 fO2
0.75 Model [Pt]
-1 1.00E-01 3.16E-01 1.78E-01 3.682
-2 1.00E-02 1.00E-01 3.16E-02 1.070
-3 1.00E-03 3.16E-02 5.62E-03 0.341
-4 1.00E-04 1.00E-02 1.00E-03 0.121
-5 1.00E-05 3.16E-03 1.78E-04 0.052
-6 1.00E-06 1.00E-03 3.16E-05 0.030
-7 1.00E-07 3.16E-04 5.62E-06 0.023
-8 1.00E-08 1.00E-04 1.00E-06 0.021
0.0
0.1
1.0
10.0
-8 -7 -6 -5 -4 -3 -2 -1 0
pp
m P
t
log fO2
As-free
As-Bearing
S-free (Brenan,2014)
model PtO
Table 8: Accompanying data for the modeling of PtO complexing in the silicate melt as a function of fO2. The respective values for Q
n+ were assumed to be: Q
0= 0.02, Q
2+=5.00, Q
3+= 10.00, and
Q4+
=0. Note this is determined from As and S free solubilities, so only O is considered as the complexing ligand.

Solubility of the Assemblage Pt-PtAs in Basalt Andrew Canali
33
5.3 Effect of Natural As Levels on Pt Solubility
The abundant analyses of basalts from several different localities compiled by Jenner and
O’Neill (2012) serve an e cellent source for determining natural As content in primitive basalts. In order
to determine the appropriate As concentration in relationship to one’s melt composition, the MgO wt%
as determined by EPMA was plotted against the respective 75As content reported from LA-ICPMS
analyses for each sample (Figure 17). Since primitive basalts are considered to contain greater than 8
wt% Mgo, the average As concentrations for all those samples above this content were considered a
representative measurement of natural levels of As. After calculating the average As concentration for
the suitable samples, it was found that ~0.125ppm As is the natural concentration for a primitive basalt.
Since the run-products in this study at ~FMQ+1 (Ni-NiO buffer), which is near the approximate fO2 for a
primitive basalt, yielded ~400ppm As it is clear that the affect of As would be much less at natural
levels. Assuming a one to one relationship between As content and Pt solubility, the Pt dissolution as
result of As complexing in a primitive basalt at 0.125ppm As would be 4.16E-5 ppm (See figure 18).
This implies that unless there is direct contact with an As source (e.g. arsenide melt), As complexing is
not a significant complexing ligand in a primitive basalt.
Figure 17: Plot of analyses completed by Jenner and O’Neill (2012). The green bo indicates the area used to determine an average As content of 0.125ppm for a primitive basalt.
0.01
0.1
1
10
2 4 6 8 10
pp
m A
s
wt% MgO
=0.125 ppm As

Solubility of the Assemblage Pt-PtAs in Basalt Andrew Canali
34
Figure 18: Relative Pt solubility for a primitive basalt (4.16E-5ppm Pt- green star) in comparison to those measured in the Ni-NiO runs (0.133ppm Pt-open blue square) at ∆FMQ=0.68. It is clear that As plays a minor role in enhancing solubility of Pt at natural levels.
6. Conclusion
After review of the results yielded from the suite of experiments, it is clear the Pt solubility is
affected when in the presence of As at a specific fO2 range. In some cases (e.g. at the Ni-NiO buffer)
complexing with As seems to enhance the solubility of Pt to even greater concentrations than when
complexing with O alone. The solubility of Pt in these experiments was increased from 0.010ppm Pt in
the As-free experiment to as high as 0.165ppm Pt at the shortest run duration when As was present.
The attempt at modeling Pt solubility reveals that in As-free experiments a strictly Pt-O interaction is at
hand as explained by equation (2), and those containing As dissolve Pt into the melt by way of reaction
(12) and (13) through simultaneous interaction between Pt, As, and O. Also, the proper precautions
must be taken in order to remove metallic contamination in the glasses at reducing conditions, such
that constraints may be imposed on Pt solubilities. Significance of the mechanisms for As complexing in
natural primitive basalts is low, due to the much lower natural As levels relative to the amount dissolved
0.000
0.000
0.001
0.010
0.100
1.000
10.000
-2.00 0.00 2.00 4.00 6.00 8.00 10.00
pp
m A
s
∆FMQ
As-free
As-bearing
S-free
Primitive Basalt
[Pt] at ~400ppm As
[Pt] at ~0.1ppm As

Solubility of the Assemblage Pt-PtAs in Basalt Andrew Canali
35
in the glasses of this study (natural basalt= ~0.1ppm As, SP8=437.9±48.1 ppm As). There are,
however, reasons to believe that the As speciation as determined from this study may be applicable to
conditions similar to those in nature- such as if a large As source were to contact a silicate melt during
formation. The dramatic change in As solubility from 8-17 ppm at ΔFMQ= -3.3 to ~1-1.5 wt% at ΔFMQ=
+4.3, suggests that there is a direct dependence of As solubility on fO2, and the main oxidations states
of As in these experiments is As0 and As2+. Based on the results of these experiments, it is clear that
relationship between As in igneous systems and Pt solubility is a multifaceted and still misunderstood
area of research. Hopefully this study acts as a basis for future investigations, and sparks the interest of
others to examine this exciting area of geochemistry.
Solubility of the Assemblage Pt-PtAs in Basalt Andrew Canali
36
7. References Cited
Bennett, N. R., & Brenan, J. M. (2013). Controls on the solubility of rhenium in silicate melt:
Implications for the osmium isotopic composition of Earth's mantle. Earth and Planetary Science
Letters, 361, 320-332.
Borisov, A., & Palme, H. (1995). The solubility of iridium in silicate melts: New data from
experiments with Ir< sub> 10</sub> Pt< sub> 90</sub> alloys.Geochimica et Cosmochimica
Acta, 59(3), 481-485.
Borisov, A., & Palme, H. (1997). Experimental determination of the solubility of platinum in
silicate melts. Geochimica et Cosmochimica Acta, 61(20), 4349-4357.
Borisov, A., & Palme, H. (2000). Solubilities of noble metals in Fe-containing silicate melts as
derived from experiments in Fe-free systems. American Mineralogist, 85(11-12), 1665-1673.
Borisov, A., Palme, H., & Spettel, B. (1994). Solubility of palladium in silicate melts: implications
for core formation in the Earth. Geochimica et Cosmochimica Acta, 58(2), 705-716.
Borisova, A. Y., Pokrovski, G. S., Pichavant, M. I. C. H. E. L., Freydier, R. É. M. I., &
Candaudap, F. (2010). Arsenic enrichment in hydrous peraluminous melts: Insights from femtosecond
laser ablation-inductively coupled plasma-quadrupole mass spectrometry, and in situ X-ray absorption
fine structure spectroscopy. American Mineralogist, 95(7), 1095-1104.
Capobianco, C. J., Jones, J. H., & Drake, M. J. (1993). Metal‐silicate thermochemistry at high
temperature: Magma oceans and the “e cess siderophile element” problem of the Earth's upper
mantle. Journal of Geophysical Research: Planets (1991–2012), 98(E3), 5433-5443.
Chen, C., & Jahanshahi, S. (2010). Thermodynamics of Arsenic in FeOx-CaO-SiO2
Slags. Metallurgical and Materials Transactions B, 41(6), 1166-1174.
Ertel, W., O’Neill, H. S. C., Sylvester, P. J., & Dingwell, D. B. (1999). Solubilities of Pt and Rh in
a haplobasaltic silicate melt at 1300 C. Geochimica et Cosmochimica Acta, 63(16), 2439-2449.

Solubility of the Assemblage Pt-PtAs in Basalt Andrew Canali
37
Fonseca R. O. C., Campbell I. H., O'Neill H. St. C. and Allen C. (2009) Solubility of Pt in
sulphide mattes: Implications for the genesis of PGE-rich horizons in layered intrusions. Geochimica et
Cosmochimica Acta 73, 5764-5777.
Hanley, J. J. (2007). The role of arsenic-rich melts and mineral phases in the development of
high-grade Pt-Pd mineralization within komatiite-associated magmatic Ni-Cu sulfide horizons at
Dundonald Beach South, Abitibi Subprovince, Ontario, Canada. Economic Geology, 102(2), 305-317.
Heald, E.F. (1967) Thermodynamics of iron-platinum alloys. Transactions of Metallurgical
Society AIME, 239, 1337–1340.
Jenner, F. E., & O'Neill, H. S. C. (2012). Analysis of 60 elements in 616 ocean floor basaltic
glasses. Geochemistry, Geophysics, Geosystems, 13(2).
Laurenz, V. (2012). Effect of iron and sulfur on the solubility of highly siderophile elements in
silicate melts (Doctoral dissertation, Universitäts-und Landesbibliothek Bonn).
Maier, W. D., & Barnes, S. J. (1999). Platinum-group elements in silicate rocks of the lower,
critical and main zones at union section, Western Bushveld Complex. Journal of Petrology, 40(11),
1647-1671.
Mallmann, G., & O’Neill, H. S. C. (2009). The crystal/melt partitioning of V during mantle melting
as a function of oxygen fugacity compared with some other elements (Al, P, Ca, Sc, Ti, Cr, Fe, Ga, Y,
Zr and Nb). Journal of Petrology, 50(9), 1765-1794.
Mungall, J., & Brenan, J. (2014). Partitioning of platinum-group elements and Au between
sulfide liquid and basalt and the origins of mantle-crust fractionation of the chalcophile
elements. Geochimica et Cosmochimica Acta, 125, 265-289.
O'Neil, H. S. C. (1986). Mo-MoO2 (MOM) oxygen buffer and the free energy of formation of
MoO2. American Mineralogist, 71, 1007-1010.

Solubility of the Assemblage Pt-PtAs in Basalt Andrew Canali
38
O'Neill, H. S. C., & Pownceby, M. I. (1993). Thermodynamic data from redox reactions at high
temperatures. II. The MnO-0Mn3O4 oxygen buffer, and implications for the thermodynamic properties
of MnO and Mn3O4.Contributions to Mineralogy and Petrology, 114(3), 315-320.
Piña, R., Gervilla, F., Barnes, S. J., Ortega, L., & Lunar, R. (2013). Partition Coefficients of
Platinum Group and Chalcophile Elements Between Arsenide and Sulfide Phases as Determined in the
Beni Bousera Cr-Ni Mineralization (North Morocco). Economic Geology, 108(5), 935-951.
Yoshida, S., Sudo, T., Kato, M., Sugawara, T., Matsuoka, J., Miura, Y., & Kii, Y. (2010). Effects
of composition on redox behaviors of antimony or arsenic ion in silicate melts by differential pulse
voltammetry. Journal of Non-Crystalline Solids, 356(50), 2842-2849.


![Flexural Behaviour of Basalt Fiber Reinforced Concrete ... · Basalt rock can also make basalt rock, chopped basalt fiber, basalt fabrics and continuous filament wire [9]. Basalt](https://img.pdfslide.us/doc/110x75/5e8d373fa059ea2b69053027/flexural-behaviour-of-basalt-fiber-reinforced-concrete-basalt-rock-can-also.jpg)